the social and physical environment of · web viewthe social and physical environment of...
TRANSCRIPT

THE SOCIAL AND PHYSICAL ENVIRONMENT OF
RESIDENTIAL BLOCKS, CRIME AND
CITIZENS' PARTICIPATION IN BLOCK ASSOCIATIONS
by Douglas D. Perkins
August, 1990
A dissertation in the Department of Psychology submitted to the faculty of the Graduate
School of Arts and Science in partial fulfillment of the requirements for the degree of
Doctor of Philosophy in Community Psychology at New York University.
Defended August, 1989; Revisions completed May, 1990
Winner of 1991 Award for Best Dissertation in Community Psychology from the Society
for Community Research and Action (Division 27 of the American Psychological
Association)
Dissertation Committee:
Marybeth Shinn, Ph.D., Research Advisor
Edward Seidman, Ph.D.
David Chavis, Ph.D.
Bruce Rapkin, Ph.D.
James Uleman, Ph.D.

ACKNOWLEDGEMENTS
I thank both New York University and Temple University for making this work
possible through financial and other means of support. Completion of this dissertation
was also supported by the Graduate Research Fellowship Program of the National
Institute of Justice and the Dissertation Research Grant-In-Aid Program of the Society for
the Psychological Study of Social Issues. NYU legally sponsored the crime data
collection at the New York City Police Department. The support of former Police
Commissioner Benjamin Ward and NYPD Records and Data Analysis Departments is
also greatly appreciated.
The scope of social support (instrumental, informational, and emotional) that I
have received in conducting this study has been immense. Barbara J. Felton and
Marybeth Shinn were unofficial Cochairpersons of the dissertation committee. Their
patience during the time when I should have sought their advice, and their immensely
valuable contributions when I finally did, were heroic. The other members of the
committee (David M. Chavis and Edward Seidman and the readers, Bruce Rapkin and
James Uleman) were extremely responsive under a difficult time constraint and gave very
constructive feedback, which, I hope, is reflected in this final draft. I owe a considerable
intellectual debt to the late Stanley Lehmann, former Director of the Community
Psychology Program at NYU.
All of the data were collected as part of the Block Booster Project, which was
funded by a grant from the Ford Foundation. The Project was administered by Citizens
Committee for New York City, a nonprofit organization which promotes neighborhood
self-help projects through grants, awards and a variety of technical assistance strategies

for grass-roots organizations. I thank each of the block associations and respondents in
the study for their participation and Judy Flynn and Michael Clark of the Citizens
Committee for employing me as the Research Associate of the Block Booster Project.
The research team was led by David M. Chavis, Paul Florin, Richard C. Rich, and
Abraham Wandersman, each of whom contributed in countless ways to this dissertation.
I also thank the many CCNYC staff members and research assistants who advised the
Project and facilitated the data collection process. The environmental data were collected
by Suzanne Gabriele and Eric Jones. David Givens, Gillian Kaye and Felice Jergens
were especially helpful to the Project in sharing their knowledge of the organizing
process.
Ralph B. Taylor gave invaluable conceptual and methodological guidance,
especially in the development of the Environmental Inventory. He also patiently allowed
me the frequent distractions from our own research collaboration posed by this
dissertation.
Others who gave helpful comments on pieces of this work include Kenneth
Heller, Eamonn Maguire, David V. Perkins, Kenneth A. Perkins, Richard H. Price, and
Marc A. Zimmerman.
I thank my wife, Nicky, and the rest of my family and friends who provided the
emotional support which sustained me through this work. Finally, this dissertation is
dedicated to my parents, Cynthia Demaree Perkins and the late Hugh V. Perkins, both of
whom influenced the values which drove this work: social justice and the appreciation of
cultural diversity and learning.
iii

[PAGE NUMBERS MAY BE OFF DUE TO DIGITAL FORMATTING]TABLE OF CONTENTS
LIST OF TABLES.................................................... viLIST OF FIGURES...................................................viiABSTRACT.......................................................... 1
I. INTRODUCTION Objectives of the Study....................................... 4 Structure of the Introduction................................. 5 Citizen Participation: Vintage Wine in a New Bottle?.......... 6
A FRAMEWORK OF COMMUNITY FACTORS RELATED TO PARTICIPATION 10 THE PHYSICAL, SOCIAL AND CRIME-RELATED CONTEXT OF PARTICIPATION Demographic Influences........................................ 14 The Built Environment......................................... 16 The Transient Physical Environment............................ 18 The Social Climate............................................ 22 Participation as a Response to Crime.......................... 27
BLOCKS AND BLOCK ASSOCIATIONS................................... 34
CRIME PREVENTION AND SOCIAL CONTROL AS VIGILANTISM AND AS MORAL ENTERPRISE.............................................. 37
PROBLEMS IN MEASURING CONTEXT The Physical Environment...................................... 41 Problems in Measuring Social Climates......................... 43 Problems in Measuring Crime................................... 45
II. RATIONALE, HYPOTHESES AND APPROACH Demographics, the Environment and Participation............. 46 The Built Environment, Crime and the Transient Environment.. 47 The Transient Physical Environment and the Social Climate... 48 Crime and the Transient Environment......................... 49 The Transient Environment and Participation................. 50 The Social Climate and Participation........................ 50 Participation in Crime Prevention........................... 51Summary of Hypotheses........................................ 53 Relationships Among Predictors.............................. 53 Tests of the Regression Model............................... 54
iv

[PAGE NUMBERS MAY BE OFF DUE TO DIGITAL FORMATTING]III. PROCEDURES Summary of Methods............................................ 54 Site Selection................................................ 55 Telephone Survey.............................................. 59 Survey Variables: Overview.................................... 61 Environmental Inventory....................................... 74 Official Police Crime Data.................................... 79
IV. RESULTS Approach to Data Analysis..................................... 81 Individual-level Analyses..................................... 84 Secondary Factor Analyses..................................... 89 Tests of Nonindependence...................................... 92 Block-level Analyses Comparison of Organized and Nonorganized Blocks.............. 96 Correlates of Participation in Block Associations and Crime Prevention.......................................... 99 Relationships Among Social and Physical Predictors...........105 Multiple Regressions Predicting Participation................110 Summary of Results............................................118
V. DISCUSSION.....................................................119 Constraints on Generalizability...............................120 Understanding the Possible Effects of Participation in
Block Associations......................................122 Implications for "Boosting" Participation in Community
Organizations...........................................124 Implications for Understanding Vigilantism and Moral Enterprise..128 Future Research..................................................129
REFERENCES...........................................................135
APPENDIX 1: NEW YORK CITY BLOCK SURVEY TELEPHONE INTERVIEW...........150
APPENDIX 1A: FACTOR ANALYSES OF INDIVIDUAL-LEVEL SOCIAL CLIMATE SURVEY ITEMS......................................................168
APPENDIX 2: BLOCK BOOSTER ENVIRONMENTAL INVENTORY....................172
APPENDIX 3: CRIME DATA CODE SHEET AND NYPD COMPLAINT INDEX FORM......175
v

[PAGE NUMBERS MAY BE OFF DUE TO DIGITAL FORMATTING]
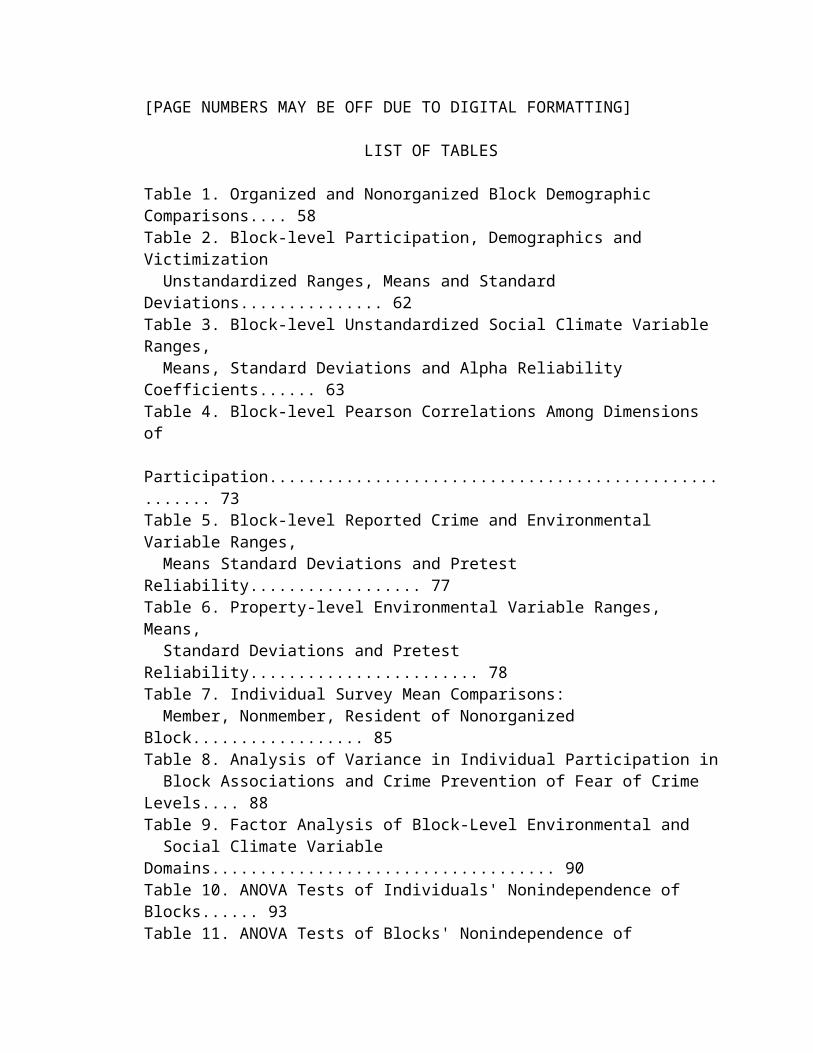
LIST OF TABLES
Table 1. Organized and Nonorganized Block Demographic Comparisons.... 58Table 2. Block-level Participation, Demographics and Victimization Unstandardized Ranges, Means and Standard Deviations............... 62Table 3. Block-level Unstandardized Social Climate Variable Ranges, Means, Standard Deviations and Alpha Reliability Coefficients...... 63Table 4. Block-level Pearson Correlations Among Dimensions of Participation...................................................... 73Table 5. Block-level Reported Crime and Environmental Variable Ranges, Means Standard Deviations and Pretest Reliability.................. 77Table 6. Property-level Environmental Variable Ranges, Means, Standard Deviations and Pretest Reliability........................ 78Table 7. Individual Survey Mean Comparisons: Member, Nonmember, Resident of Nonorganized Block.................. 85Table 8. Analysis of Variance in Individual Participation in Block Associations and Crime Prevention of Fear of Crime Levels.... 88Table 9. Factor Analysis of Block-Level Environmental and Social Climate Variable Domains.................................... 90Table 10. ANOVA Tests of Individuals' Nonindependence of Blocks...... 93Table 11. ANOVA Tests of Blocks' Nonindependence of Neighborhoods.... 95Table 12. Organized and Nonorganized Block Mean Comparisons.......... 97Table 13. Block-level Pearson Correlations of Permanent Environment with Participation in Block Associations, Collective Crime Prevention and Individual Protections..............................100Table 14. Block-level Pearson Correlations of Transient Environment with Participation in Block Associations, Collective Crime Prevention and Individual Protections..............................101Table 15. Block-level Pearson Correlations Among Block Association Participation, Built Environment, Territorial Functioning, Physical Incivilities, and Social Climate and Partial Correlations Controlling for Proportion Nonwhite Residents.....................106Table 16. Multiple Regressions Predicting Block Association Participation.................................................111-113
vi

LIST OF FIGURES
Figure I. Contextual Determinants of Participation in Block Associations and Crime Prevention................................. 12
vii
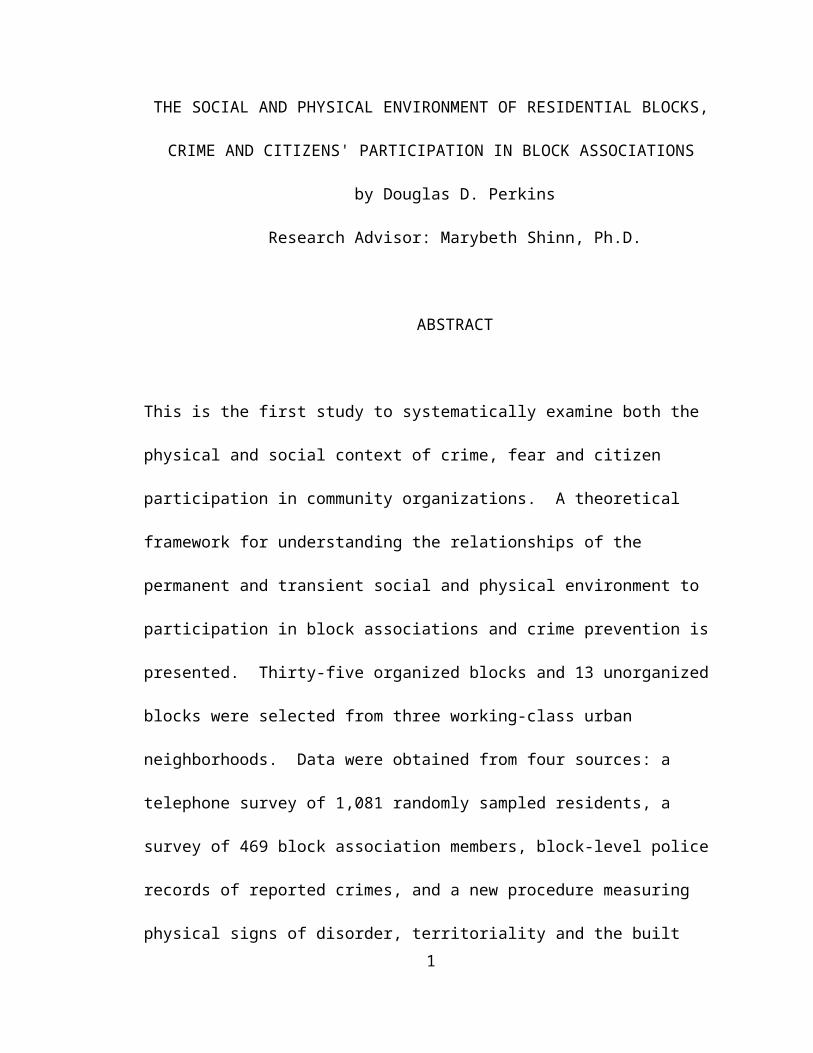
THE SOCIAL AND PHYSICAL ENVIRONMENT OF RESIDENTIAL BLOCKS,
CRIME AND CITIZENS' PARTICIPATION IN BLOCK ASSOCIATIONS
by Douglas D. Perkins
Research Advisor: Marybeth Shinn, Ph.D.
ABSTRACT
This is the first study to systematically examine both the physical and social context of
crime, fear and citizen participation in community organizations. A theoretical
framework for understanding the relationships of the permanent and transient social and
physical environment to participation in block associations and crime prevention is
presented. Thirty-five organized blocks and 13 unorganized blocks were selected from
three working-class urban neighborhoods. Data were obtained from four sources: a
telephone survey of 1,081 randomly sampled residents, a survey of 469 block association
members, block-level police records of reported crimes, and a new procedure measuring
physical signs of disorder, territoriality and the built environment. The Block
Environmental Inventory correlated significantly with demographics, crime, the social
climate, and participation. Block association members had stronger community ties and
engaged in more crime prevention activities and positive block social behaviors than
nonmembers and had more positive affective attitudes toward their block. Members were
more critical of disorder problems on their block than nonmembers. Comparing
organized and nonorganized blocks, there were no significant differences in
demographics or crime but there were differences in the built and transient environment
1

and social climate. Although the crime and demographic portions of the proposed
framework were unsupported, many block physical and social environmental factors
correlated significantly with participation in block associations and with collective and
individual crime prevention activities. The built environment, territorial functioning, and
the social climate contributed significant variance to a series of regression equations
explaining up to 54% of the variance in block association participation. The results
suggest that perceived and actual problems, or lacks, in the transient physical
environment may serve as "catalysts" for participation, but that block social cohesion
may be an even more effective "enabler" of participation. The relationship between
community organization, crime, and fear remains unclear. But, unlike victimization
prevention programs, block associations appear to induce greater social cohesion and
awareness of problems without greater fear. Implications for participation and
empowerment theory, for community organizing practice, for understanding destructive
community reactions to deviance, and for future research are discussed.
2

"In some countries, the inhabitants seem unwilling to avail
themselves of the political priveleges which the law gives them;
it would seem that they set too high a value upon their time to
spend it on the interests of the community... But if an American
were condemned to confine his activities to his own affairs, he
would be robbed of one half of his existence; he would feel an
immense void in the life which he is accustomed to lead, and his
wretchedness would be unbearable...
...Americans of all ages, all stations in life, and all types of
disposition are forever forming associations... In every case,
at the head of any new undertaking, where in France you would find
the government or in England some territorial magnate, in the
United States you are sure to find an association."
-- Alexis de Tocqueville
"Man, you ain't got no standing in this community! Who do you think
you think you are -- President of the block association?"
-- narcotics officer to Juan "the Bullet," an East Greenwich Village
drug gang leader (from the motion picture "Mixed Blood")
3
I. INTRODUCTION
Objectives of the Study
In spite of its promise as an area of both study and intervention, research on
community organization, crime, and the social and physical environment has not kept
pace with theoretical speculation. Without an empirical test and more specific
understanding of the contextual reasons why residents get involved (or do not get
involved) in their community and what the various individual and community impacts of
that involvement are, it is difficult to design programs or policies to encourage the
development and maintenance of voluntary organizations that can help deter crime,
reduce fear or improve the quality of community life.
The main objective of this study is to present and test a new framework for
understanding how community factors are related to collective participation in residential
block associations. Hence, the dissertation will identify variables that are associated with
community organizations that can remain viable even in high-crime, lower-income
neighborhoods. It is in such communities, where collective action to address social
problems is most needed, that reported rates of participation are typically the lowest. The
present study also introduces and tests the reliability and predictive validity of a new
method of objectively measuring the physical environment of residential blocks. Other
independent variable sets in the block-level analysis of participation are demographics,
crime rate, and social climate.
In sum, this dissertation aims to provide both practical and theoretical knowledge
regarding the following questions: (1) Why do some communities react to the threat of
crime through collective participation in community development, while others engage in
4

vigilantism or individual protections, or withdraw, or do not react at all? (2) What are the
differences between members and nonmembers of block associations in
community-focused attitudes, perceptions and behaviors? (3) What are the differences
between organized and nonorganized blocks in the social climates represented by those
same variables, in reported crime and victimization rates, in attributes of the built and
transient physical environment associated with crime and social disorder, and in those
associated with territorial control? (4) How are the various physical and social
environmental characteristics of blocks interrelated? (5) Can the physical environment of
residential blocks be measured using a more objective (independent, reliable and valid)
method than past reliance upon resident surveys?
The answers to these questions should be of interest to three principal audiences:
(1) criminal justice officials and other urban policy administrators (especially those
dealing with community cooperation or citizen voluntarism); (2) community leaders and
organizers concerned with mobilizing and maintaining citizen participation in crime
prevention and other activities; (3) scholars, across a range of disciplines, who are
interested in citizen participation and empowerment, neighborhood self-help, crime
prevention, or social and psychological reactions to deviance and to the physical
environment of communities.
Structure of the Introduction
The following review of the literature begins with a broad examination of why
citizen participation has been of interest historically and why the ecological context of
participation should be of interest, particularly to community-oriented psychologists. The
next section presents an overview of the proposed community-level theory of
5

participation, followed by a more detailed explanation of the theoretical and empirical
basis for each set of variables in the study: First, I will examine the theoretical relevance
to participation of such physical environmental domains as the built environment and
more transient symbols of disorder and territoriality. Second, several block social climate
concepts will be presented. Third, I will discuss how participation may be related to local
crime and to fear of crime. Fourth, the ecological validity of the streetblock level of
conceptualization and the impact of block associations are explained. After that, I will
consider how the present study also represents a needed empirical test of two theories of
destructive social reactions to deviance, or perceived community "threat": vigilantism and
"moral enterprise." The Introduction concludes with a review of some of the major
problems in measuring each type of contextual variable.
Citizen Participation: Vintage Wine in a New Bottle?
Although Americans have long been characterized by a rugged, but lonely
individualism (Riesman, 1961), that identity masks an even longer tradition of
communitarian commitment, assistance and participation. Indeed, more than 150 years
ago, Tocqueville untangled this apparent paradox by recognizing our moral and practical
interdependence (what we would now call the social ecology of the community) and that
it is precisely Americans' unique sense of personal efficacy and self-interest which
continues to make us participate, more than most countries, in civic associations engaged
in solving community problems (Verba, Nie, & Kim, 1978). Furthermore, Tocqueville
argued, it is that voluntary act of local civic participation which transforms selfish
motives into a true sense of public responsibility and commitment. The American, he
wrote, "invests his ambition and his future" in his community. "[I]n the restricted sphere
6
within his scope, he learns to rule society; he gets to know those formalities without
which freedom can advance only through revolutions, and becoming imbued with their
spirit, develops a taste for order, understands the harmony of powers, and in the end
accumulates clear, practical ideas about the nature of his duties and the extent of his
rights" (Tocqueville, 1835/1969, p.70).
Compared to the industrialized nations of today or even the Europe of his day,
however, Tocqueville was observing an America made up of relatively small, scattered,
independent and autonomous communities. He presaged two dangers in the new local
participatory democracy (Sennett, 1979): (1) It could lead to mob rule and vigilantism
against deviants, dissidents or "outsiders." (2) If the scope of this civic-mindedness were
to become centralized much beyond what could be achieved in one's own local
community, the resulting egalitarian society would make people complacent or else its
failure would dash their hopes. In either case, they would eventually become apathetic
and uncommitted.
Since Tocqueville, other cultural theorists (Bellah, Madsen, Sullivan, Swindler &
Tipton, 1986; Gans, 1967; Riesman, 1961; Unger, 1975) have, from different
perspectives and with different voices, also described the essential Western (and, in
particular, American) character as torn between a strong sense of autonomy and
self-reliance and the inevitable need for social interaction, support and sharing - our
ultimate interdependence in the most modern of societies. Participation in community
civic organizations may provide one with a ready method of simultaneously expressing
those competing needs for individuality and "communitas." It allows one to take some
measure of real control over one's own life while working collectively to solve immediate
7

problems of the community. Furthermore, unlike the countless "top-down" government
and corporate programs with similar aims, participation serves this purpose through
citizens' own initiatives and at a small and proximate enough level to the individual so as
not to be overly daunting.
From this historical and comparative perspective, it is not so surprising that
interest in participation in grass-roots community organizations and other "mediating
structures" has increased in recent years in tandem with the centralization of political,
economic, and human service authority in our mass society. As Tocqueville feared, even
democratically centralized authority has left some of us with a debilitating sense of
powerlessness (Seligman, 1975) and others with such a narrow sense of individualism
that it threatens the essential communitarian spirit upon which the society as a whole
depends (Bellah, et al., 1985). Participation is thus being rediscovered as an antidote to
the great psychological menaces of our time and culture: the authoritarian personality,
learned helplessness, and the egocentric "me generation" (Riessman, 1986). Much of the
recent reformation of the human services has revolved around participatory strategies for
organization development and restructuring (Toch & Grant, 1982). Furthermore, there is
currently a plethora of legislative interest in promoting citizen participation in community
service (Vincent & Wiecking, 1989).
Like the more ambiguous concept of "empowerment," citizen participation has
gained particular interest among community psychologists for several reasons. First, its
mandate by liberals (Moynihan, 1969) and its subsequent confusion with
anti-government "voluntarism" by conservatives has given research and interventions
with an explicitly participatory focus uncommon bipartisan political support. Second,
8

participation and empowerment are seen as having great heuristic potential as guiding
principles for theory, research and practice across the many settings and levels of analysis
encompassed by the field (Heller, Price, Reinharz, Riger & Wandersman, 1984;
Rappaport, 1981). The interest of some community researchers (e.g., Florin &
Wandersman, 1984; Wandersman, Florin, Chavis, Rich & Prestby, 1985) in participation
has been inspired by findings that there are important individual and community benefits
from participation (including individual and community empowerment by giving
residents a measure of control over their immediate environment), but that relatively few
people actively participate when given the opportunity. Unfortunately, much of the
research on participation has been limited by a scarcity of the same sort of integrative
contextual or "ecological" approach widely advocated by community psychologists
(Heller, 1989; Heller, Price, Reinharz, Riger & Wandersman, 1984; Levine & Perkins,
1987; Rappapport, 1977; Tricket, Kelly & Vincent, 1985). Research has uncovered
interesting information on individual psychological dimensions of participation (cf.
Florin & Wandersman, 1984). The fact that participation is distributed within urban
areas in fairly uneven cultural and geographic patterns (Heller et al., 1984; Podolefsky,
1983), however, suggests that many of the factors related to participation may reside at
the community level. (It seems unlikely that such patterns may be explained entirely by
self-selection.) A community perspective on participation thus demands careful
consideration of their social and environmental context.
For no domain of behavior are the social and physical environment more
significant and a community-level analysis more pertinent than for citizen participation.
In addition, no issue is more often a focus of community concern than crime, especially
9

in urban areas (Clark, Chavis, & Glunt, 1988; Flanagan & Jamieson, 1988; Miller,
Tsemberis, Malia, & Grega, 1980). Therefore, the present study explores the
crime-related physical and social environment of urban neighborhoods as an ecological
context of collective mechanisms for resident participation, namely the formation and
functioning of block associations. In essence, instead of asking only the question, "What
is it about certain individuals that makes them try to change their environment?," this
dissertation asks, "What characteristics of community environments are related to
people's participation in collective community change?" These questions imply, not only
different levels of analysis, but the possibility of cyclical or bidirectional causality
between collective participation and community context. Although the latter is clearly
affected by the former, most of the present analyses treat contextual factors as predictors
of participation in voluntary block associations and, secondarily, in crime prevention
activities.
A FRAMEWORK OF COMMUNITY FACTORS RELATED TO PARTICIPATION
The study of citizen participation is clearly a complicated enterprise. In the
present study, crime is seen as the outgrowth of particular built environmental and
demographic characteristics; crime, in turn, is seen as an important shaper of residents'
perceptions of their block and of the more transient social and physical environment;
these block-level contextual characteristics are, in turn, seen as key predictors of the
evolution or nondevelopment of block organizations. Figure 1 outlines the proposed
theoretical framework in more detail and the five broad clusters of predictor variables are
described below.
First, the demographic characteristics and built environment of the block describe
10

the more permanent attributes of the setting and provide the most distal correlates of
participation in the theory. In general, having greater resources and investment in the
community (e.g., home ownership, socioeconomic status) may make it easier to
participate and minority status may make it more necessary. In addition, architectural
and urban planning features of the built environment that facilitate social interaction and
a proprietary sense among residents may increase participation. These features have been
labelled "defensible space" and include smaller blocks and buildings and real and
symbolic barriers that define shared private space.
The next stage in the theory is the level of officially reported "street" crime and
surveyed victimization on the block. Crime may be influenced by the first two clusters.
It is also thought to be a major reason why many people participate in block associations
(most of which are involved in one or more crime control activities). Although crime is
expected to act as a catalyst for greater participation, it was placed in a more distal and
permanent position in the theory than the transient environment, however, because crime
has proved such a difficult problem for police and communities to solve and its impact on
behavior is mediated through residents' often inaccurate perceptions (Taylor & Hale,
1986).
11
Figure I. Contextual Determinants of Participation in Block Associations and Crime Prevention
Distal/Permanent Proximal/Transient Outcome _______________ ___________________
Physical |Built | | Transient Environment:| Environment |Environment | | Symbols of Incivility |
| Defensible Space | | & Territoriality |
______________ ______ ___________________ ____________Social |Demographic | | Crime | |Social Climate | |Participation |Environment |Characteristics: | | (Perceptions): | | in Block |
| Residence Years | | Fear of Crime | | Associations | | Race | | Community Problems |
| Income | | Sense of Community || Home Ownership| | Communitarianism |
| Community Satisfaction| | Organization Efficacy || Neighboring | | Informal Social Control|
12

The more transient physical environment and transient social environment (social
climate) of the block make up the last and most proximate contextual correlates of
participation. The social climate of a community consists of collective perceptions,
attitudes and behaviors. If residents perceive problems, they may participate to solve
them. Social cohesion, which promotes greater social interaction, information sharing,
and feelings of solidarity, may make residents even more likely to solve their problems
collectively. Just as the social climate contains both negative and positive features, the
transient physical environment includes both signs of disorder, or "incivilities" (e.g.,
litter, graffitti) and symbols of residential territorial behavior (e.g., plantings,
decorations). Many residents join neighborhood improvement associations in order to
reduce physical incivilities on the block. Territorial markers are thought to enhance, as
well as symbolize, social cohesion and may therefore increase participation.
Finally, the bidirectional arrows in Figure 1 reflect an understanding that the sets of
variables may influence each other in multiple and reciprocal ways. For example,
participation may also influence the transient physical and social environment (which
influence each other), and either directly or through them, crime. It must be stressed that
the present analysis does not attempt to test this theory in its entirety, however. The
primary purpose of this study is not to focus on the complex, systemic relationships
among the contextual factors but to treat them as independent variables and examine their
comparative relationships to collective participation. Nor will the results of this study
necessarily imply causal relationships, except where the independent variable can be
construed as more "permanent" than the predicted variable. A more detailed review of
the literature underpinning the variables in the study follows.
13

THE PHYSICAL, SOCIAL AND CRIME-RELATED CONTEXT OF
PARTICIPATION
Demographic Influences
According to a review of the literature (Heller et al., 1984), certain demographic
variables have been found to be related to higher levels of civic participation. For
example, blacks have been found to participate more than whites at the same income
level (Williams, Babchuk & Johnson, 1973). This may be due to the relative
unavailabilility of less formal avenues for redress of grievances. Otherwise, the general
effect of demographics on participation is that greater resources and material interest in
the community (in the form of household income, education, home ownership and length
of residence) tend to both motivate and allow residents (in terms of skills, time and cost)
to enhance their built and transient environment and, thus, to participate (Hyman &
Wright, 1971).
The tendency for social and environmental (and thus participatory) needs to be
lower in higher income areas represents a countervailing influence, however. For
example, although findings on urban crime patterns by income is inconsistent (Georges-
Abeyie & Harries, 1980), greater resources may reduce crime directly by decreasing local
financial needs and frustrations and increasing local job opportunities. Resources may
also reduce crime indirectly by enhancing the social and physical environment and
increasing participation. Although these forces may generally outweigh the countereffect
of greater resources as targets for greater crime, neighborhoods that are subject to rapid
economic change (even upgrading, or gentrification) are susceptible to high crime rates
14

(Taylor & Covington, 1988). A similar case could be made for other social effects of
differential demography. Thus, the indirect effects of race and resources on participation
remain unclear.
Other demographic variables that could influence collective participation are
estimated block population and nonresidential land uses, such as stores, vacant lots, and
institutional property (churches, schools, etc.). Ecological "manning" and grass-roots
organizing theories might also suggest that fewer residents in smaller buildings should
increase the average level of participation in the group. According to Barker and his
colleagues (see, e.g., Barker & Gump, 1964) settings that are underpopulated, given the
number of tasks or roles required to operate the setting, elicit deeper involvement (more
responsibility, even more behavior) on the part of the average setting occupant.
Similarly, Kahn (1982) noted that it is easier to organize a community and to delegate
responsibilities and develop leadership if one starts with a smaller group of interested
residents. Because nonresidential property can be a source of block problems (e.g.,
youths loitering in front of stores, trash collecting in vacant lots, church-goers using up
parking spaces) that must be dealt with, and may also provide a place for formal or
informal congregation of adult residents, it may be positively related to participation in
block associations.
The Built Environment
The influence of the neighborhood physical environment on crime, fear, and
related social behaviors is well established (Taylor, 1987, 1988). Except for community
responses to environmental hazards (Cook, 1983; Edelstein & Wandersman, 1987;
Erikson, 1976; Gibbs, 1983), there is little literature on the physical context of citizen
15

participation, however. Therefore, it will be useful to review some principles of
neighborhood environmental criminology and their possible relevance to participation.
There are permanent characteristics of the physical environment that are directly
related to residents' feelings of vulnerability and a criminal's ability to strike. These may
be divided into two types: "macro" design (arrangement of buildings and street layout)
and "micro" design (smaller features which may be added to the macro design). On the
macro side, Jacobs (1961) first proposed the idea that certain urban planning principles
might reduce crime in residential areas. For example, in studying residential streets in
Greenwich Village, New York, she observed that the safest areas appeared to be
buildings that were physically oriented for natural surveillance by residents (including
streets that are visible from first-floor windows and not so wide that neighbors across the
street would not notice a prowler), public and private spaces that were delimited into
clearly differentiated domains and public spaces placed in proximity to high-traffic areas.
Newman (1972, 1975) took the architectural approach to environmental criminology
further and coined the phrase, "defensible space." He suggested that certain physical
features in the environment, such as barriers to discourage entry and divide public space
into manageable zones, would encourage residents to exercise territorial control. This, in
turn, would reduce crime and fear. The anti-crime design feature most associated with
Newman is keeping the size of residential buildings (especially public housing) small and
low-rise (Newman & Frank, 1982). The possible effect of block size on collective
participation is discussed above under demographics.
Defensible space theory may have focused originally on large and permanent
features of the architectural environment, but smaller and more or less malleable features
16

are just as relevant. "Micro" defensible space consists of surveillance aids and barriers to
entry. "Real" barriers include physical objects, such as walls, fences, gates, or security
bars, that impede either entry into or egress from the criminal's target. "Symbolic"
barriers, on the other hand, such as low walls or railings, do not so much impede access
as symbolize where public space ends and private space begins. Surveillance
opportunities are enhanced by such environmental features as outside lighting, sight lines,
and places to sit outdoors. Although one study found defensible space to have a limited
influence on the residential social climate (Merry, 1981) and another study found
different forms of defensible space to have different (both positive and negative) effects
on perceived crime and disorder (Perkins, Meeks & Taylor, 1989), other research has
found certain defensible space features to be related to lower fear, higher informal social
control and, at least temporarily, a lower crime rate (Fowler & Mangione, 1986; Taylor,
Gottfredson & Brower, 1984). Many of the features of defensible space are explicitly
designed to encourage greater social contact among neighbors and a proprietary interest
in the community. It is in this way that architecture can encourage participation. The
community of interest to Newman and other macro defensible space researchers (e.g.,
Merry, 1981) has been public housing projects. The present study is one of the first to
examine how applicable both micro and macro principles are to private communities.
The permanent context is not the prime focus of this study, however. Of greater
interest is the extent to which the more transient and malleable social and physical
environment may be related to citizen participation over and above any demographic,
built environment and crime effects. I will now consider these key, proximal variables in
more detail before returning to crime as a possible catalyst for participation.
17

The Transient Physical Environment
Territoriality. Brown and Altman (1981) applied the social psychological concept
of privacy regulation, or the boundary maintenance process of selectively including or
excluding certain people and behavior depending upon the situation (Altman, 1975), to
neighborhood crime and crime prevention. A key aspect of their formulation was the
distinction between shared "public" and "secondary" territories, on the one hand, and
"primary" territories, on the other. Primary territories are mainly in or very near one's
home and so constitute the main settings of the present study. Most people spend the
greatest amount of time in their primary territory. It is functionally and symbolically
central to one's everyday life and so one is more likely to defend one's primary territory.
In more public territories, most of us would simply move to avoid a threat. Since there
may be greater costs to escape from one's primary territory, territorial behaviors and
symbolic and real barriers and markers are used to stake one's claim and fend off
intruders.
Thus, the concept of "territorial functioning" (Taylor, 1988) represents a broad
class of transactions between the environment, on the one hand, and group or individual
cognitions, behaviors and sentiments, on the other, for the primary purpose of controlling
behavior in a particular place. A key component in theories of territorial functioning
involve physical markers which convey nonverbal cues, or messages, of ownership,
investment protection, and a separation between one's self or family and "outsiders"
(Altman, 1975; Brown & Altman, 1983; Shumaker & Taylor, 1983; Taylor, 1988; Taylor
& Stough, 1978). Such markers, which I will refer to as "territoriality," may be manifest
18

in a variety of ways, such as cleaning up, maintaining or beautifying the block (e.g.,
gardens, trees, shrubs, yard decorations), "personalizing" the physical environment of
one's home (e.g., placing the family name on the front door), or inadvertantly leaving
such "traces" (Brown & Altman, 1981) as a toy on the lawn or the sound of a dog.
Territorial markers tell the intruder that the space is closely monitored.
According to Taylor (1988), there is considerable variation in human territorial
functioning across and within neighborhoods. For example, a breakdown in informal
social control is expected near the territorial boundaries of an area and where there are
"gaps" in the residential topography, such as parks, playgrounds, and public buildings.
This may be due to the prevalence of strangers along boundaries and gaps (which reduces
the likelihood of bystander intervention and increases the chances that one of the
strangers is a malefactor). This is supported by Merry's (1981) finding that residents of a
housing project perceived the most dangerous areas to be youth "hang outs" located in
public areas often near the edge of the community.
Territorial markers have been shown to be associated with residents' perceptions
of fewer social and physical incivilities and crime-related problems (Craik & Appleyard,
1980). This relationship is significant even after controlling for socioeconomic status and
home ownership (Perkins, Meeks & Taylor, 1989). Territoriality has also been
empirically related to greater social interaction, sense of community (Becker, 1977),
general social cohesiveness (Brown & Werner, 1985), perceptions of less crime (Brower,
Dockett & Taylor, 1983), less fear of crime (Taylor, Gottfredson & Brower, 1984) and
even with fewer property violations, especially burglary (Becker, 1977; Brown &
Altman, 1983).
19

Similar to defensible space, territoriality may encourage participation in block
associations through improvements in social cohesion. This is expected to be
self-reinforcing as one of the common purposes of neighborhood improvement
associations is to assist efforts to beautify the community (Cunningham & Kotler, 1983).
Thus, theoretically, participation in block associations should be related to greater signs
of territoriality (Unger & Wandersman, 1985) but until now this hypothesis has not been
tested.
Incivilities. Community organizations often try to prevent or correct
"incivilities," which are symbols of social disorder. Physical incivilities can be either
passive (such as litter or unkempt housing) or deliberate (such as graffiti and vandalism).
Social incivilities include such visible signs of disorder as prostitutes, drug dealers, or
youth gangs loitering on the street. (As will be explained in the methods section, the
present focus is on physical rather than social incivilities.) Specific incivilities have been
empirically linked to residents' fear of crime (Ahlbrandt & Cunningham, 1979; Reppetto,
1974; Skogan & Maxfield, 1981; Taylor, Gottfredson & Brower, 1984). The broader
theoretical links between incivilities, resident behavior, and ultimately street crime
(Wilson & Kelling, 1982) have not been empirically tested, however. Furthermore,
police efforts to reduce fear and crime through incivility reduction have met with mixed
results (Greene & Taylor, 1988).
Results from the only studies that used independently observed (non-survey)
measures (see below) of physical incivilities were mixed. Consistent with survey data
from other cities (Taylor & Hale, 1986), Taylor, Shumaker and Gottfredson (1985) found
that the relationship between objectively measured incivilities and fear depended largely
20

on two community-level factors: socio-economic status and confidence in the future
direction of the neighborhood. The fact that incivilities were only significantly related to
fear in poor and deteriorating neighborhoods may be due to greater incidence of
incivilities in such neighborhoods. Furthermore, the size of the correlations in that study
may have been limited by the procedure, in which raters remained in their cars
throughout observation.
In a recent study of 50 blocks in Baltimore using an on-foot block environmental
inventory, Perkins, Meeks, and Taylor (1989) found significant block-level links between
perceptions of crime and disorder and such objective physical incivilities as litter,
vandalism and graffitti and the observed social incivility, young males "hanging out."
Thus, there is some evidence of the importance of incivilities to crime-related
perceptions, but further research is required to understand the relationship of incivilities
to participation in community organizations.
To summarize the hypothesized relationships of the physical environment to
participation in community organizations, defensible space may increase natural
surveillance opportunities and encourage social contacts which, in turn may boost
participation. The transient physical environment is hypothesized to operate differently,
however. Incivilities may lead residents to participate in local voluntary associations in
two ways. First, many such organizations engage directly in a variety of clean up efforts.
Second, the threat of incivilities makes residents more concerned about the territorial
functioning of the community. As they begin to beautify and personalize their properties,
organized participation becomes a more efficient means of enhancing the physical
territoriality, especially of public property. Success at improving the physical
21

environment may, in turn, "empower" residents with the confidence to address other,
more complex, problems which should elicit even greater participation.
The Social Climate
Physical environmental influences on participation in community organizations
may operate only under amenable local social conditions. This study focuses on several
dimensions of the community social environment, or "climate," which may be related to
participation in block associations in different ways. A primarily individual-level,
longitudinal study of block association participation on 17 blocks in Nashville, TN,
provides much of the theoretical and empirical background for several of the social
climate variables considered here.
Among behavioral dimensions, for example, social contact, particularly in public
areas, and informal mutual assistance, or neighboring behavior (Unger & Wandersman,
1982, 1985; Warren, 1986) allow residents to become better acquainted and discuss
shared problems. In a stress and coping framework which has recently been applied to
the effects of fear of crime on mental health, neighboring is considered a form of local
"instrumental social support" (Taylor, Perkins, Shumaker & Meeks, 1989). Unger and
Wandersman (1983), focusing on 11 of the blocks in the Nashville study and using a
similar survey measure of neighboring as used in the present study, found that greater
neighboring behavior prior to organizing a block may facilitate efforts toward forming a
block association. In turn, they found that once a block organized, association members
engaged in more social interaction, which may lead to more neighboring. In such a
mutually supportive relationship, it stands to reason that blocks with greater neighboring
22

may have higher levels of participation.
The other key behavioral dimension of the social environment is informal social
control, which is the degree to which residents spontaneously regulate everyday public
behaviors and physical conditions within the bounds of their community. Informal social
control is similar to collective participation in attempting to maintain community order
but it is, by definition, unorganized and generally undemocratic and represents a narrower
agenda. Low informal social control has been linked to increased resident turnover, loss
of local commerce, crime and deterioration of the physical environment (Greenberg &
Rohe, 1986; Hunter, 1987; Rich, 1980; Shotland & Goodstein, 1984; Skogan &
Maxfield, 1981; Wilson & Kelling, 1982). In a descriptive, urban sociological study of
community crime prevention in eight neighborhoods in Philadelphia, Chicago and San
Francisco, Podolefsky (1983) found that informal social control appeared to be strongest
and most important in neighborhoods without much organized crime prevention activity,
as if the latter serves to compensate for a lack of the former. Although it is an intriguing
and somewhat unexpected finding, it remains to be seen whether it is generalizable to
broader-based community organizations.
The remaining dimensions of community social climate are nonbehavioral. For
example, it may be argued that a group of residents must have at least some
psychological sense of community to be interested in organizing an association and
working together (Ahlbrandt & Cunningham, 1979; McMillan & Chavis, 1986). Chavis
and Wandersman (1990) have clarified this process at the individual level (in the
Nashville data) by showing that, over time, a sense of community can lead, through
greater self efficacy, to collective participation. Their results also suggest that
23
participation itself further enhances an individual's sense of community. But it is not
clear whether the process operates, or operates in the same way, at the community level.
Other person-community characteristics have been related to citizen participation
at the individual level of analysis by Florin and Wandersman (1984), who derived
variables based on cognitive social learning concepts (Mischel, 1973). In order not to
confuse the individual-level, person-situation variables with the corresponding,
block-level social climate variables, the underscored terms will be used to refer to the
latter. In the framework developed by Florin and Wandersman (which they adjusted on
the basis of factor analysis), "subjective stimulus values" (communitarianism) encompass
the importance residents place on the community and on working to improve it. If
residents participate more in communities they value, a communitarian climate should
encourage greater collective participation. Indeed, in the Nashville study, Florin and
Wandersman (1984) found subjective stimulus values to predict individual participation
in block associations far better than any other variable they considered. According to
Mischel (1973), "expectancies" involve the way people interpret the consequences of
possible actions. Florin and Wandersman's (1984) related variable includes both
expectancies regarding an individual's own action and, more relevant to the present foci
on social climate and collective participation, perceived efficacy of collective action.
Although expectancies did not enter Florin and Wandersman's stepwise discriminant
analysis, perceived collective efficacy should be related to greater collective
participation. Among the social climate variables, communitarianism and perceived
efficacy of collective action are the closest ones to the concept of "empowerment"
(Rappaport, 1981; Zimmerman and Rappaport, 1988). Collective psychological
24

empowerment is thought to, not only lead to participation in community organizations,
but result from it (Heller et al., 1984).
Florin and Wandersman's (1984) version of the variable "encoding strategies" was
made up of perception of community crime and other quality - of - life problems and
satisfaction with one's community as a place to live. They found individual block
association participation to be modestly associated with less satisfaction with community
conditions. Although they found satisfaction and (fewer) perceived problems to load
together as a factor, the two variables may be related to participation in different ways.
For example, that study found low community satisfaction together with perceived
community problems to be related to participation that is geared toward solving those
problems, suggesting that the former acts as a catalyst for the latter. One might expect
community satisfaction alone, however, to encourage participation by enhancing all of
the other variables in the social climate. Being satisfied with one's community may give
residents a greater sense of community, communitarianism and collective efficacy and
may result in more neighboring behavior, all of which are predicted to lead to greater
collective participation. The "encoding" variables are therefore used separately in the
present study. One other social climate variable in the theory, fear of crime, is discussed
below in the section on reactions to crime.
Florin and Wandersman (1984) conclude that future research should address the
the question of "whether individuals who participate are responding to a particular
(environmental) influence on their block brought about by strong social or physical
characteristics. Here the unit of analysis becomes the block and aggregates of individual
data and/or objective ratings of physical characteristics would be examined" (p. 705).
25

Participation as a Response to Crime
This study's purpose of identifying contextual factors related to collective
participation in block associations is supported by several recent themes in the literature
on individual and collective responses to crime. According to reviews of the literature
(Dubow, McCabe & Kaplan, 1979; Lewis, 1981), past research on reactions to crime and
social disorder tended to focus either on individual behavioral and psychological
variables or on institutional or community sociology. Although the relevant sociological,
political science and criminal justice literatures have helped shed light on broad
contextual factors, such as community social, environmental and economic conditions
(Reiss & Tonry, 1986), they have tended to ignore certain key psychological variables.
Meanwhile, psychological research on reactions to crime and victimization has
concentrated primarily on the passive and debilitating personal reactions of individuals
(e.g., avoidance behavior; see, for example, Journal of Social Issues, 39 (2), 40 (1)) rather
than on active, organized, and efficacious reactions. The focus of research on individual
reactions has included: (1) neighborhood conditions, such as crime rate and
crime-associated physical cues (Balkin, 1979; Lewis & Maxfield, 1980), (2)
psychological factors, such as differential perceptions, interpretations, or fear of crime
(Garofalo & Laub, 1978; Shotland & Goodstein, 1984), and (3) demographic or
circumstantial constraints, such as the vulnerability of the poor, women or the elderly
(Hindelang et al, 1978; Riger et al, 1982). Consideration of contextual and psychological
variables in isolation from each other, however, makes it difficult to compare their
relative explanatory power. That is why studies which generalize about the impact of
26

crime solely on the basis of individual reactions to fear and victimization can be
misleading.
Furthermore, until recently, "private-minded" reactions to crime (i.e., individual
protections, such as installing more locks) had been examined far more thoroughly than
"public-minded" responses (Schneider & Schneider, 1977). It is the latter, potentially
empowering, type of response to which Durkheim (1933) referred in suggesting that
crime unites some communities against the violation of accepted norms. Other
communities are atomized by crime because their residents react with fear and isolation
(Conklin, 1975). Insight into these divergent responses has begun to emerge from more
recent studies, particularly those by Skogan and Maxfield (1981) and Taylor (Perkins &
Taylor, 1987; Taylor & Hale, 1986), which focus simultaneously on both individual and
community reactions to crime and disorder.
Fear and Participation. The effect of crime on participation in community
organizations is complicated by the different ways crime and a host of related
environmental factors may be perceived, interpreted, and reacted to on an emotional
level. On average, young males are least fearful yet victimized by crime the most, while
women and the elderly are victimized less yet perceive higher crime rates and higher
personal risk, and are more afraid of street crime. Furthermore, fear levels among most
groups are higher than one would predict given relatively low crime and victimization
rates (Taylor & Hale, 1986). The failure of fear levels to covary closely with crime and
victimization rates begs the question, is "fear of crime" more than fear of crime
(Garofalo & Laub, 1978)? There is consistent evidence that crime is perceived as
27

"nested" within a network of community problems (Taylor et al, 1980; Skogan &
Maxfield, 1981; Podolefsky & DuBow, 1981). Fear of crime may have less to do with a
rational and objective assessment of victimization risk than with residents' subjective
perceptions of, and emotional reactions to, certain "danger cues" in the social and
physical environment of their community (Perkins & Taylor, 1987).
Whether fear and other psychological reactions to crime increase or decrease
collective participation may depend on whether these concerns can be channeled into
healthy community and psychological processes. Recent research suggests that increased
fear is associated with a decline in both mental health (Taylor & Perkins, 1988) and the
quality and vitality of the residential, commercial and organizational life of the
community (Skogan, 1986). Some have suggested that it is the degree of fear that
determines the collective response. Fear may be positively and linearly related to
individual, defensive behaviors but curvilinearly related to organized action, with the
greatest collective participation stimulated by moderate amounts of fear (Cohn, Kidder &
Harvey, 1978; Pennell, 1978; Skogan & Maxfield, 1981).
Even among collective responses, the relationship to fear may depend on the way
in which the collective response is organized. It is impossible to avoid consideration of
bidirectional causality at this point. Hence, the availability of different forms of
collective participation (see next section) may serve as a feedback mechanism which
helps to regulate both fear of crime and the extent of future participation. For example,
Skogan and Maxfield (1981) found fear and exaggeration of the crime problem to be
related to neighbors talking about crime and participating in community victimization
prevention groups (see also Rosenbaum, 1988). Unger and Wandersman (1985) have
28

suggested, therefore, that it is "informational support" provided by some community
groups which is associated with greater fear. Multi-issue, community development
organizations, unlike most victimization prevention groups, tend to focus on emotional
and instrumental support as well as providing information about crime and other
community problems. Thus, fear may be positively related to participation in collective
crime prevention but unrelated, or perhaps even negatively related, to participation in
general-issue, community development organizations, such as block associations.
Community Crime Prevention. Similar to community psychology's internal
debate between prevention advocates and empowerment advocates (Rappaport, 1981) the
field of criminal justice is engaged in a parallel debate. Podolefsky (1983) has identified
two general approaches to community crime prevention: "victimization prevention" and
"social problems." Victimization prevention, the more traditional and narrow approach,
has until recently dominated criminal justice policy on community-level responses to
crime. As a result, research has generally focused on the effects of groups organized
exclusively around crime (Lavrakas, 1985; Lewis, 1981; Rosenbaum, 1986) rather than
on strategies to reduce crime through either community development organizations or
environmental change efforts. (An exception to the former is Curtis (1987) and to the
latter is Fowler and Mangione (1986).)
Victimization prevention strategies include property engraving, home security
surveys, and other "target hardening" tactics, crime information newsletters and meetings,
block or neighborhood "watch" and civilian patrol and escort programs, and such
innovative "community-oriented policing" efforts as foot patrol, community substations
29

and police organizing of, or support for civilian programs. Such programs have not been
built on a solid foundation of empirical evidence, however. There have also been
widespread methodological problems in identifying clear and lasting positive impacts of
victimization prevention programs (Rosenbaum, 1986). As recent reviews of the major
community crime prevention evaluations amply demonstrated, groups exclusively
oriented toward crime prevention, at best, tend to displace rather than deter crime, and the
duration even of those successes is unknown (Rosenbaum, 1988; Yin, 1986). Leaders
often have difficulty eliciting and maintaining broad participation in such groups, and the
success of such efforts is closely related to the socioeconomic conditions of the
community. Poor communities usually require more than the short-term, crime-specific
solutions offered by community crime prevention activities. Finally, community crime
prevention's success seems to depend in large measure on the program employing
sufficient outreach strategies and addressing the social and environmental factors that are
related to organizational mobilization and maintenance (Yin, 1986; Rosenbaum, 1988).
These factors are at the core of the second general approach to community crime
prevention: community development.
Given the limited success of the victimization prevention strategies, a broader and
more fundamental perspective on crime prevention has emerged from the kind of
contextual analysis advocated in the present study. The "community development"
approach (this more positive label is preferred to Podolefsky's term "social problems")
addresses the root causes of urban residential crime and fear which are inextricably
entangled with the community's social, economic and environmental problems.
Community development organizations, which actively involve larger numbers of
30

residents than victimization prevention organizations (Yates, 1973), combat crime and
fear through a wide-ranging agenda (Civic Education Foundation, 1985; Curtis, 1987).
First, many such organizations, especially at the block and building level, engage directly
in one or more of the above formal victimization prevention activities, including the
collective promotion of individual protections (Podolefsky, 1983). But they all go
beyond that in their implicit or explicit efforts to reduce crime and fear. Second, they
enhance the social environment of the neighborhood through meetings, organizing social
events and positive programs for youth (Wandersman, Florin, Chavis, Rich & Prestby,
1985). The greater contact and a sense of shared purpose among neighbors can lead to
more effective enforcement of local norms and more active "use" of the community by
residents. Third, community development organizations often work to improve the area's
physical environment (through clean-up and beautification campaigns, lobbying for better
city services, and promoting a sense of community pride; Cunningham & Kotler, 1983).
Fourth, some are geared toward improving the local economic environment through the
promotion of local commerce or job training and employment programs (Cunningham &
Kotler, 1983).
This last element of community development strategies, economic development,
is probably the most difficult to control at the grass-roots level, yet may be the most
important for reducing crime. Recent evidence suggests that it is people with a sense of
self efficacy but few alternatives who most often turn to crime, rather than those who are
alienated and powerless (Ross & Mirowsky, 1987). Hence, lawful employment
opportunities may be a necessary, but not sufficient,
condition for reducing crime and community disorder. Most jobs, by themselves, do not
31

satisfy or foster a sense of empowerment and a sense of community. Meaningful
neighborhood democratic processes and structures provide both hope and action for
improved economic and social conditions, on the one hand, and a constructive and
collective outlet for all residents' self efficacy, on the other.
The social cohesion and sense of collective efficacy that come with both social
and physical manifestations of community organization, order and control may elicit a
willingness to "get involved," or, if already involved, to participate even more in the fight
against crime and other community problems. A contextual approach, characterized by a
self-perpetuating cycle of neighbors vigilantly watching out for community interests,
encouraging greater social contact, cohesion, and collective participation, which results in
an even greater sense of personal and collective efficacy and so on may therefore be a
more promising guide for community development, empowerment and crime control than
perspectives which focus solely on individual behavior or attitudes.
32

BLOCKS AND BLOCK ASSOCIATIONS
In 1950, the Human Dynamics Laboratory at the University of Chicago helped the
Hyde Park-Kenwood Community Conference organize 46 street block-level, general
issue voluntary organizations (or "block associations") and train block leaders. Four
years later, the Lab studied the blocks that had been organized and found an array of
positive community effects for active organizations over less active ones (Sarchet, 1955).
In the 40 years since that Chicago project began, block associations have become one of
the most common vehicles for both community development and crime prevention
(Perkins, 1985; Podolefsky & Dubow, 1981; Washnis, 1976; Yates, 1973). Although the
literature on reactions to crime, described in the last section, has recently begun to focus
more on the community, as opposed to the individual, level and on community
development organizations, it has generally ignored the block level of analysis.
There are several reasons why the block (operationally defined here as the
dwellings fronting on a single street between two cross streets or other delimiters) is an
important focus for both research and organizing. First, its boundaries are less
ambiguous to local inhabitants and more easily defined for research purposes than are
neighborhood boundaries (Taylor, 1988). Second, blocks are more culturally
homogeneous than larger units, such as neighborhoods and police precincts, and residents
are more likely to know and share the same concerns with people from their own block
(Gans, 1967). Third, participation rates in block-level organizations have been found to
be significantly higher than at any other level of community or political organization
(McKenzie, 1923/1970, as cited in Taylor, 1988; Yates, 1973). Fourth, the processes of
33

informal social control and territoriality (Taylor, Gottfredson & Brower, 1984) and
formally organized community crime prevention (Taylor & Gottfredson, 1986) should
operate more successfully in the face-to-face setting of the block than in larger social
units. All four reasons suggest that blocks may hold greater meaning than cities or even
neighborhoods as an ecologically valid unit of analysis.
Ecological validity is the degree to which the research definition of a social area
accurately reflects natural boundaries. Ecological validity is critically important when
studying community-based attitudes (e.g., sense of community, communitarianism) and
behaviors (e.g., neighboring). It is also important when studying residents' reactions to a
problem such as street crime which strikes so "close to home." As far as residents (as
opposed to researchers) are concerned, crime and fear-related environmental cues are felt
more on the block than on the neighborhood level (Taylor, 1987).
In explicating the ecological validity of blocks for research in environmental
criminology, Taylor (1987) has suggested that blocks function as ongoing, ecological
"behavior settings", in which homeostatic "forces" and environmental features on a
particular block facilitate certain kinds of "standing," or normative, behaviors for
residents and outsiders alike. Ecological psychologists had not previously considered the
ongoing patterns of behavior in blocks and other residential areas as behavior settings.
Yet, a recent critique of behavior setting theory (Perkins, Burns, Perry & Nielsen, 1988)
supports an expansion of the theory to include more than just regular, but temporary,
events and settings. According to Taylor (1987), behavioral territoriality, or informal
social control, is a function of these behavior setting "presses," the extent to which
subcultural norms are shared and enforced (Fischer, 1975), and the degree to which the
34

locale is socially and culturally homogeneous. If this is true of informal social control
and perhaps other unorganized behavior (e.g., neighboring) and attitudes (e.g., sense of
community), ecological validity is just as vital for understanding participation in self-help
and other organized voluntary groups, which have more commonly been the focus of
behavior setting research (Levine & Perkins, 1987). Coupled with the above evidence
that, compared to neighborhoods, blocks are more behaviorally and culturally
homogeneous and familiar to their inhabitants, this suggests that it is at the block level of
analysis that contextual theories of community participation are most appropriately
tested.
It is thus not surprising that, compared to more centralized political or service
organizations, block-level organizations seem to have a greater influence on the quality
of everyday residential life (Wandersman, Florin, Chavis, Rich & Prestby, 1985; Yates,
1973). Block associations may be thought of as "self help" groups (see Social Policy,
volumes 15 (3) (1985), and 18 (2) (1987)) for residents without a singular "special
interest." They tend to be task-oriented yet flexible enough to take on uncomplicated
activities for which skills and resources are readily available (e.g., street clean-ups, block
watch, block parties, youth activities, instrumental support for the elderly and the infirm).
Again, the small scale of block associations and the "immediacy" of their problems often
provide greater consensus and make changes at the block level more noticeable to
residents which may result in greater participation. Although victimization prevention
programs often contribute to fear and thus to community disintegration, general purpose
block associations have been found to increase both the neighboring behavior of residents
(Unger & Wandersman, 1982, 1983) and their psychological "sense of community"
35

(Chavis, Hogge, McMillan & Wandersman, 1986; Wandersman, Jakubs, & Giamartino,
1981). Block associations can simultaneously promote the "instrumental support" of
gesselschaft and the "emotional support" of gemeinschaft. For these reasons, block
associations would seem to provide one of the most promising strategies to overcoming
the various obstacles to collective action against urban crime and other community
problems. Despite this potential, the ecological context of participation in block
associations has, until now, not been systematically examined.
CRIME PREVENTION & SOCIAL CONTROL AS VIGILANTISM & AS MORAL
ENTERPRISE
There is, at least potentially, a dark and destructive side of informal social control
and formal community crime prevention. In both the recent and distant past, groups of
citizens banding together to fight a perceived external threat - whether in the person of
criminals or merely "undesirables" - have taken the law into their own hands often with
unjust consequences (Erikson, 1966; Johnson, 1981; Reider, 1985; Rosenbaum &
Sederberg, 1976). The present study may provide clues as to the possible antecedents
and effects of modern-day vigilantism (community crime prevention) and the social
construction (informal social control) of deviance.
To many observers, the resurgence of vigilantism, in the generally more
law-abiding form of civilian patrols and "watch" programs, is no surprise. They point out
that the crime problem in the frontier pioneer culture of the old West - where community
36

vigilantism played a key role in preserving law and order - was, in many ways, more
similar to the modern urban crime wave than to crime at any other time or place (Brown,
1976; Johnson, 1981). In reconstructing Victorian era communities in the frontier, the
upstanding settlers had to establish "behavioral boundaries" for the community by
purging its undesirable elements (Erikson, 1966). This was the express purpose of
vigilante groups, whose leadership, then as now, generally consisted of indigenous
neighborhood mercantile, civic, and religious leaders, all of whom had a personal stake in
repressing criminal and moral deviance (Brown, 1976).
Rosenbaum and Sederberg (1976) define vigilantism as "establishment violence"
consisting "of acts or threats of coercion in violation of the formal boundaries of an
established sociopolitical order which, however, are intended by the violators to defend
that order from some form of subversion" (p.4). The only problem with such a definition
is that it excludes the original and likely the most prevalent form of modern vigilance--
ordinary citizens keeping an alert, yet peaceful, watch against nightly danger and
malefaction. In fact, the two oldest etymological derivations of vigilance refer to a
nocturnal "devotional watching" and "the four watches into which the Romans divided
the night" (The Oxford English Dictionary). The O.E.D. definition of "vigilance
committee" is thus more pertinent to the present discussion: "a self-appointed committee
for the maintenance of justice and order in an imperfectly organized community." Of
interest in this study is whether modern vigilantism (i.e., collective crime prevention
activities) is associated with more or less organized communities.
The history of American vigilantism provides a dramatic illustration of the
reactionary social construction of crime and deviance (Schur, 1980; Taylor, Walton &
37

Young, 1973). It is from this perspective that the modern day counterpart to vigilante
justice, informal social control and formal community crime prevention, may be viewed
as widespread forms of "moral enterprise" (Becker, 1963) in reaction to "social conflict"
(Brown, 1976). By most accounts, moral enterprise is thought to be mainly in the hands
of either single-issue "moral crusaders" (Becker, 1963; Schur, 1980) or the capitalist,
ruling-class elite (Quinney, 1974; Taylor, 1982) or both (Hawkins and Tiedeman, 1975).
There is rarely any mention of the far more prevalent informal rule enforcement (and, to
the extent that enforcement is discretionary, rule creation) among ordinary citizens in
their own neighborhoods. In line with the various formulations of moral enterprise,
however, collective responses to crime and disorder in the community are usually
organized for and supported by the vested interests of vulnerable property owners. A
"perceived threat" to the community is identified, often magnified, and collectively
defined. It is this local and informal definition of unacceptable behavior, along with the
local enforcement of that definition, which determine much of the form and extent of
deviance outcomes.
This rule enforcement component of the deviance "labelling" process is half of
what Becker (1963) meant in conceptualizing "moral enterprise," the other half being rule
creation. What Becker actually had in mind for the former was professional
law-enforcement agents. It can be argued, however, that in reality the two functions are
rarely separate. Furthermore, conceptualizing moral enterprise in terms of the collective
actions of local residents enables one to relate it to perceived efficacy of collective action,
perceptions of crime and disorder (or "perceived threat"), and actual crime and
victimization data, all on the same, relatively small, geographic scale. As a highly
38

centralized institution, urban police departments provide little variance across blocks or
even neighborhoods and thus, for the present purposes, cannot be used to represent moral
enterprise (fortunately, the police should not represent a confounding variable for the
same reason).
Until now, the relationship between community-based, collective moral enterprise
and such factors as victimization, perceived risk (or "threat"), and the social and physical
environment has not been empirically explored. In critiquing the "labelling" approach to
deviance sociology, Taylor (1982; Taylor et al, 1973) points out that, while considerable
lip-service is paid to "social reactions" to and control of rule-breaking behavior, the
immediate and wider origins of such "reactions" and their specific influence on deviance
have largely been ignored. In particular, Rosenberg, Stebbins and Turowitz (1982) have
assailed labelling theorists for paying little systematic attention to the contextual
circumstances under which rule-breaking behavior will be understood as such and
provoke reaction.
Lauderdale (1976) summarized Hirschi's (1973) objections to the labelling
perspective as follows:
...the approach has not developed a theory of the reaction process
to deviance (Gibbs,1966; Kitsuse, 1972), has not integrated the
notion of deviance into a theory of social change (Lemert, 1967;
Schervish, 1973), has not developed conceptual precision or
constructed detailed analyses of the conditions under which a given
principle might hold (Manning, 1973), or articulated theoretically
the process by which "insiders" assign and maintain the deviant's
39

low social and moral status (which could provide a theoretical and
empirical link for studies of secondary deviation and organized
social control activities) (p.660).
The present research may shed some light on each of these theoretical problems.
Furthermore, unlike Lauderdale's study, it avoids the contrivances of the laboratory
situation. Laboratory experiments, for all their elegance and control, do not provide
sufficient external validity to tap the "real-life" contextual antecedents and effects of
"real-life" moral enterprise.
40

PROBLEMS IN MEASURING CONTEXT
The Physical Environment
Despite the considerable theoretical and empirical attention paid to features of the
physical environment thought to be associated with neighborhood crime and fear, few
researchers have measured the physical environment directly. Instead, they have
generally relied solely on subjective measures. This approach typically involves
measuring residents' perceptions of the quality of different aspects of the social and
physical setting. Objective (independent and systematic) measures of the environment
are important for several reasons. First, the validity and reliability of asking residents
"how much of a problem" certain local conditions are remain unclear (Perkins, Taylor &
Meeks, 1989). Second, even if these measurement issues are resolved in one study, other
groups in other settings may respond differently. Third, objective measurement of the
physical environment is methodologically important because it does not share method
variance with survey-based measures of other key variables like perceptions of the
physical or social environment or fear of crime.
Finally, objective measurement of the physical environment is important because
of the role it can play in informing efforts to reduce fear or crime through modifications
of environmental design. For example, recent research has found residents' subjective
perceptions of physical incivilities to be generally accurate (Perkins, Meeks & Taylor,
1989). If residents' perceptions turn out to be sensitive to environmental change as well,
it would suggest that more programs and policies should strive to change environmental
conditions. If not, however, research must continue the search for the true loci of both
fear and proactive responses to crime.
41
Unfortunately, there have been only a few different methods developed for the
objective assessment of community physical environments. Craik and Appleyard (1980)
may have been the first to conduct such systematic objective environmental assessments.
They used two separate methods: "environmental professionals" judging photographic
slides of street scenes and an assessment inventory completed by trained raters on foot.
Brown and Altman (1983) used a procedure that was similar to the latter of the above
methods, but added considerable detail in assessing five different classes of territorial
displays (Brown & Altman, 1981). Taylor and his colleagues began by testing the
schema of environmental raters using drawings of yards (Brower, Dockett & Taylor,
1983). Their next procedure relied on raters' judgments of color slides of actual
properties (Taylor, Gottfredson & Brower, 1984). Taylor then developed a "windshield
survey" protocol in which raters directly observed residential blocks from their
automobiles (Taylor, Shumaker & Gottfredson, 1985). The latest procedure is focused
on both block and property-level assessments of defensible space, territoriality, and
incivilities on both residential and nonresidential properties. It is conducted on foot,
includes a field listing of all occupied housing units on the block and has been found to
exhibit strong interrater reliability and predictive validity (Perkins, Meeks & Taylor,
1989). The method used in the present study is closest in procedure and content to the
last one described.
Problems in Measuring Social Climates
The practice of aggregating individual perceptions of oneself or one's group to the
group level for the purpose of deriving contextual or
42

social climate variables has been a controversial issue of late (Florin, Giamartino, Kenny
& Wandersman, 1990; Shinn, in press). Joyce and Slocum (1984, as cited in Shinn, in
press) have identified three criteria for validating aggregate individual perceptions as
social climate variables. First, climate variables should exhibit sufficient inter-rater
agreement among members within each group. Second, climates should show reliable
"differentiation," or variance, between groups on measures collected at the individual
level. Third, there should be predictable relationships between climate and other
variables at the group or individual level.
All three of these criteria were met in a study of group influence and
organizational climate in block associations (Florin, Giamartino, Kenny & Wandersman,
1989). Most of the climate variables used in that study were different from those in the
present study, however. The validity of the social climate portion of the present analyses
therefore hinges on the degrees to which individuals within blocks agree, blocks vary,
and climate variables correlate with other variables. If social climate variables show
nonindepence (by block) at the individual level and are strongly related to other parts of
the theory, especially to other sources of data, it would lend support to them as valid
measures at the block level of conceptualization.
Another problem in the measurement of some social climate variables, even at the
individual level of analysis, is a lack of consensus in the literature over what questions to
use and how to word them. For example, those studying fear of crime cannot even agree
on what constitutes fear (Perkins & Taylor, 1987; Taylor & Hale, 1986). Some studies
have included more cognitive reactions to crime, such as risk assessment, or more
chronic reactions, such as worry about victimization, in their operationalization of fear.
43

In the present study, fear refers only to the component around which the most consensus
has built: the transient emotional reaction to crime (i.e., feeling unsafe). Greenberg and
Rohe (1986) note that informal social control has also been measured many different
ways, including as a perception of neighbor behavior (Bennett & Lavrakas, 1988; Fowler
& Mangione, 1986; Gans, 1962) and as a self-reported behavior (Greenberg, Rohe &
Williams, 1982; Taylor, Gottfredson & Brower, 1984). The former approach was
adopted in this study and so informal social control is perhaps best viewed as an attitude
at the individual level and a group behavior or climate at the contextual (block) level in
the present discussion.
Problems in Measuring Crime
Crime rates based on police records of complaints or calls for service and those
based on victimization surveys are both prone to measurement problems (O'Brien, 1985).
Although the crime reporting and analysis capabilities of police departments have
improved considerably over the years, there are still several reasons that official police
data tend to be both unreliable and of questionable validity (Harries, 1974). Certain
crimes, such as rape, tend to be significantly underreported, often in unpredictable ways.
Changes or differences in reported crime may be due to differential reporting practices,
political exigencies, or demographic trends. A temporary "increase" in rates may even
result from more effective crime control as reporting goes up. Furthermore, crime
statistics typically reflect only "serious" (or FBI Part 1 "index") offenses while ignoring a
host of minor offenses as well as fear of crime and community disintegration. Finally,
crime rates are usually available only on the total of reported index crimes in an entire
44
city or precinct which can obscure crime patterns at the block level. This is not a
problem in the present study.
Surveyed victimization rates are generally considered more accurate than official
crime rates, but even the best of these, the federally sponsored, annual National Crime
Survey, suffers from validity and reliability problems (Levine, 1976; O'Brien, 1985).
Again, personal crime victimizations, such as rape and domestic assault are perhaps not
much more likely to be reported to civilian interviewers than to police. On the other hand,
victims may be motivated to report (even exaggerate) property crimes to the police for
insurance purposes. But there is no monetary motivation in reporting such losses in a
victimization survey. Given problems of recall (especially forward "telescoping," or
remembering particularly salient events as more recent than they actually occurred),
however, some surveyed victimization rates may be overestimated. Thus, triangulation
of data (convergence of different sources), provides an important, albeit imperfect, degree
of cross-validation of area crime rate (O'Brien, 1985).
45

II. RATIONALE, HYPOTHESES AND APPROACH
Demographics, the Environment and Participation
Following the framework depicted in Figure 1, demographic variables are mainly
being treated as control variables in the present study. Blocks with greater household
income, home ownership and length of residence have a greater material stake in the
community and are thus expected to have more positive social and environmental
features and higher levels of participation in block associations and in crime prevention
(especially individual, "target hardening" protections). With regard to racial composition,
the literatures on urban crime patterns and on citizen participation suggests that minority
blocks should have more crime, more fear and, given that wealthy and middle-class
neighborhoods have been excluded, more organized participation. These effects will be
tested via group means comparisons at both the individual (members vs. nonmembers vs.
residents of nonorganized blocks) and block (organized vs. unorganized) levels of
analysis and correlations at the block level.
Other block-level demographic variables can be derived from the environmental
assessment. These include estimated block population, which "manning" theory predicts
should be negatively related to participation, and commercial, vacant and other
nonresidential property uses. Because nonresidential property can be a source of block
problems and also may provide a place for formal or informal gathering, it is predicted to
be positively related to participation in block associations.
The Built Environment, Crime and the Transient Environment
46
Defensible space features, such as lighting and barriers, are expected to help
decrease crime and incivilities directly by acting as a deterrent to criminals, vandals and
the like. The built environment may have an even greater influence through its effects on
the community social climate, however. Defensible space features are predicted to
encourage greater use of, and a sense of control over, public areas of the community.
This, in turn, should decrease perceived crime and incivilities and fear of crime and
increase the display of territorial markers, social cohesion (neighboring, informal social
control, block satisfaction, sense of community, communitarianism, perceived block
association efficacy), and in that way increase participation in block associations and
crime prevention. This last effect should be self-reinforcing insofar as block associations
are hypothesized to add to certain "micro" defensible space features, such as lighting,
outdoor seating and perhaps bars on windows. Because of this potential confound,
however, these particular built environment variables will be excluded from the
regression models predicting participation in block associations.
The relationships among predictors will be examined in the full, block-level
correlation matrix. The associations between block association participation and the
permanent and transient (below) environment will be tested at the individual and block
level through means comparisons and at the block level through correlation and multiple
regression analyses. Although causal direction cannot be inferred in these cross-sectional
data, the group comparisons of the transient social and physical variables at least allow a
"post-test" of pre-existing organization and membership conditions. Although
inferentially weak, the demographic variables at least provide a pretest check for
selection bias.
47

The Transient Physical Environment and the Social Climate
The transient physical environment and social climate of blocks are intertwined in
complex ways. Territorial markers symbolize, are encouraged by, and may, in turn,
cause greater social cohesion, particularly informal social control, neighboring, and sense
of community. These same social climate variables may also help to prevent (are
negatively correlated with) physical incivilities. Where incivilities do occur, the
incivilities are of course perceived. But there may be worse social consequences. Such
an environment may also lead residents to perceive more crime problems, make them
more fearful, and destroy the social cohesion. Again, these relationships will be
examined in the block-level correlation matrix.
Crime and the Transient Environment
Thus, perceived crime problems are thought to be based only partly on actual
local crime (reported crime and criminal victimization rates). It is only through these
imperfect perceptions of crime problems that actual crime may help to motivate
participation in block associations and crime prevention. The rationale is that crime
serves as a catalyst, or cue, for participation. Crime is also predicted to have a negative
impact on territorial functioning, including both physical markers and social cohesion.
Although this may inhibit participation somewhat (see below), crime is considered such
an important organizing issue that the net correlation between crime and collective
participation is still predicted to be positive.
The analyses comparing organized and nonorganized blocks and those comparing
48

members, nonmembers, and residents of nonorganized blocks predict the opposite result,
however. Again, these comparisons are being treated as evaluations of the effects of pre-
existing block organization and membership (see the section, "Approach to Data
Analysis"). Thus, from the perspective of the community development approach to crime
prevention, organized blocks and block association members should experience lower
rates of (i.e., be negatively related to) crime and criminal victimization. It is possible that
these two opposing forces may offset each other and result in nonsignificant effects in the
present, cross-sectional analyses. If not, the results may help to resolve these conflicting
hypotheses.
The Transient Environment and Participation
Physical territoriality is expected to encourage (be positively related to) collective
participation in much the same way defensible space does. Territorial markers promote
social cohesion which encourages participation. This is reinforced as block associations,
in turn, are hypothesized to encourage more territorial markers (particularly such items as
public trees or gardens, planters, and possibly even decorations or "personalizations"
which may be promoted or distributed by the association).
Similar to crime, incivilities are related to collective participation in more
conflicting ways. Physical incivilities may be one of the biggest reasons blocks organize
and residents participate (i.e., in order to clean them up). Thus actual incivilities are
expected to act as a catalyst (positively correlated) to participation. In analyzing the
effects of organization, however, block associations should have even greater success at
reducing incivilities than reducing crime and so are hypothesized to have lower rates of
49

incivilities. Again, it is possible that these two opposing forces may offset each other and
result in nonsignificant effects.
The Social Climate and Participation
Social cohesion (i.e., block satisfaction, sense of community, communitarianism,
perceived block association efficacy, informal social control and neighboring behavior) is
expected to encourage (be positively related to) participation in block associations by
increasing social interaction and familiarity, by giving residents a sense of shared purpose
and by reducing (negative correlation with) obstacles to participation, such as fear of
crime. These hypotheses should be reinforced as organized blocks and individual
members of block associations are predicted to have lower rates of fear and higher rates
of social cohesion as effects of participation.
There are once again conflicting hypotheses for perceived problems, however.
Perceived crime and incivilities are suspected motivating conditions for (positive
correlations with) participation. In the group comparisons, on the other hand,
participation is expected to result in organized blocks and individual members of block
associations having a more favorable perception of (i.e., negatively related to) block
problems. These forces may either offset each other or else the results will suggest which
one is stronger.
Note that fear of crime, which can be behaviorally debilitating, is predicted to
have the opposite effect (negative) on participation as actual crime or perception of
crime, which are seen as motivating influences. The hypothesis that fear and
participation in block associations and in collective and individual crime prevention are
50

curvilinearly related, with the greatest participation associated with moderate fear, will
also be tested.
Participation in Crime Prevention
Participation in community crime prevention activities and individual protective
behavior will be examined as dependent variables of secondary interest. Since many
block associations organize anti-crime activities, collective crime prevention and
participation in block associations are expected to be positively related to each other and
to be similarly related to the other variables in the theory. There is historical precedent to
doubt the strength of this relationship, however. The experience of anti-crime vigilantism
in pioneer society suggests that collective crime prevention (and informal social control)
may be associated with less organized, general-issue participation as civilians try to
compensate for a lack of formal community organization.
Theories of vigilantism and social reactions to deviance both support the
hypothesis that perceived crime problems lead to collective crime prevention (and
informal social control). Vigilantism and social reactions theories diverge, however,
when it comes to the expected effect on crime and deviance. Vigilantism is expected to
act as a deterrent and thus reduce crime. From the perspective of social reactions theory,
however, collective crime prevention and informal social control are forms of "moral
enterprise" (Becker, 1963) which result in even greater perceived crime and delinquency
problems and, through a process of labelling, greater actual deviance (crime and
victimization rates).
Individual crime prevention behaviors are expected to be motivated by (positively
51

associated with) higher crime, victimization and fear of crime. This should not be offset
much by a crime reduction effect because individual crime prevention is not considered
to be very effective at the block level. Group mean crime prevention behaviors will be
compared at both the individual level and correlated at the block level with the other
variables in the model.
Summary of Hypotheses
With regard to the analyses of variance, compared with nonorganized blocks and
nonmembers, respectively, block associations and members are hypothesized to have
lower rates of perceived and actual criminal victimization, lower levels of perceived
incivilities and fear, higher levels of social cohesion, broadly defined (block satisfaction,
sense of community and communitarianism, perceived block association efficacy and
informal social control, neighboring behavior and social interaction), and more collective
crime prevention activity. Examining the physical environment at the block level, block
associations are also hypothesized to exhibit fewer incivilities and more defensible space
and territorial markers.
Next, bivariate correlations between these same variables and participation (in
block associations and in crime prevention) are presented. Participation is expected to be
positively associated with block social cohesion, defensible space and territorial markers.
Participation is also expected to act as a catalyst for (and thus be positively associated
with) perceived and actual physical incivilities, perceived and actual block crime, and
fear of crime (either linearly or curvilinearly).
Relationships Among Predictors
52

Block social cohesion, territorial markers, defensible space and low perceived and
objective incivilities and low perceived crime are expected to be positively
intercorrelated. Block social cohesion, physical territoriality and defensible space are
expected to be negatively associated with fear of crime. Criminal victimization and
reported crime rates, perceived crime and incivilities and objective incivilities are
expected to be positively associated with fear of crime. Fear of crime is predicted to be
positively associated with individual protective behavior.
Social cohesion, territorial markers, and defensible space are expected to be
positively associated with reported crime and victimization. Perceived crime and
quality-of-life problems and objective physical incivilities are expected to be positively
associated with reported crime and victimization.
Tests of the Regression Model
The built environment, crime, the social environment and the transient physical
environment are each predicted to contribute significant additional variance to the
relationship with participation in block associations, over and above the influence of
preceding variables in the framework.
53

III. PROCEDURES
Summary of Methods
The present data were collected in collaboration with the Block Booster Project, a
two-year, multimethod action study of the social effects, organizational dynamics and
viability of urban residential block associations. The dual purpose of the Block Booster
Project were (1) to examine the role of block associations in community development and
crime control and (2) to develop an intervention process and set of training materials to
help voluntary associations maintain and strengthen themselves.
This study employs a multi-method research design in order to tap block
residents' block-focused social behavior and their subjective appraisal of the block, its
problems and its strengths, as well as more objective indicators of crime and the physical
environment. Data have been obtained from four sources: (1) a telephone survey of
random block residents; (2) an observer-conducted assessment of the physical
environment of each block (focusing primarily on crime and fear-related stimuli); (3)
police records on reported crime, analyzed at the block level; and (4) a self-administered
block association membership survey to provide additional data on the type and extent of
organizational characteristics and activities. In addition, a brief, self-administered survey
on current organizational characteristics and a series of more detailed, semi-structured
interviews were used as cross-validation that block associations were active and
enganged in specific anti-crime and environmental maintenance activities. Both of these
measures were completed by a leader from each block association.
54

Site Selection
City and neighborhoods. New York City was selected, from among several large
U.S. metropolitan areas, for its large number and long history of block-level resident
associations and for the interest of a well-suited, city-wide civic technical assistance
organization to facilitate the project. Twenty-one potential sample neighborhoods
throughout New York City were selected on the basis of (1) having increasing robbery
and burglary rates (to ensure that crime would be a potentially relevant issue), according
to the latest available police reports (1984), and (2) having a sufficient number of active
block associations, according to the civic organization's mailing list. Letters with return
cards were sent to 1,521 leaders of block associations in these 21 neighborhoods
inquiring about their interest in the organization development intervention component of
the project (see Discussion) and in their willingness to participate in the research
component. Ten percent (n = 151) of the interest cards were returned. In order to ensure
that a sufficient number of active block associations would be available, the final
selection of study neighborhoods was based on the geographic pattern of the response.
(There is a potential and not altogether understood bias in this neighborhood
selection procedure: the high degree of community leader interest in the study among the
neighborhoods chosen suggests either that they (both the leaders and the neighborhoods)
were becoming less active and therefore in need of the organizational intervention
component or, more likely, that they were already much more actively organized than
most neighborhoods in the city. Within the neighborhoods that were chosen, however, a
great variety was found in the activity and participation levels of different blocks.)
55

Three culturally disparate neighborhoods were selected: Bay Ridge, in Brooklyn,
is a predominantly white, lower-middle-class neighborhood with the fewest children per
surveyed household of the three neighborhoods (.46). East Flatbush, also in Brooklyn, is
a working-class neighborhood containing a mixture of Caribbean-born blacks and native
American blacks and whites (and having the most children per household: 1.08). The
third neighborhood selected is a somewhat more dispersed section of Southeast Queens
(including South Jamaica, Springfield Gardens, Hollis, and St. Albans), which is a
predominantly black area, ranging from low-income to working class and having .76
children per household, according to the survey. Neighborhoods in Manhattan were
avoided since its dense settlement patterns may make it atypical of other U.S. cities.
Block Selection. A total of 48 blocks were selected from these three
neighborhoods. Criteria for selection included that blocks be predominantly residential in
land use (i.e., more than 50% of listed phone numbers had to be residential and ultimately
all blocks selected had nonresidential properties on the corners only) and of moderate
population of household units on the block (between 15 and 150), according to the most
recent "criss-cross" telephone directory (listed by street address). Site visits were made
to each potential study block to verify that they met these criteria and one other: both the
physical layout and land use pattern on the blocks and their adjacent blocks had to be
typical of the neighborhood as a whole (for example, if the neighborhood street pattern
was a grid with the commercial concentration at the boundary, selected blocks fit that
pattern - i.e., with small stores on the corners only - and were not adjacent to the central
business district). Dwellings were typically small, single-family houses, duplexes, or
very small (four-to-ten-unit) apartment buildings.
56

Because the overall project included two quasi-experimental design components
(a comparison of organized and unorganized blocks and a longitudinal comparison of
intervention and nonintervention organized blocks), organized and unorganized blocks
were selected in a roughly two-to-one ratio, respectively. The survey results shown in
Table 1 confirm that the residents of organized and unorganized blocks did not differ
significantly in length of residence, race, income, home ownership, estimated block
population, or the presence of commercial or other nonresidential property. (See the
"Respondent Sample" section below for further details on sample characteristics and the
"Results" section for a comparison of other variables on organized vs. nonorganized
blocks and correlational tests of the hypothesized demographic effects on participation in
block associations).
Block associations had to be at least one year old, at least minimally active (i.e.,
holding regular meetings) and committed to participating in the larger action research
project. Within each neighborhood, potential organized and unorganized blocks were
selected from the same or demographically similar census tracts, but were not so close as
to risk "spillover" effects, which have hampered other community crime prevention studies
(Bennett & Lavrakas, 1988). In selecting unorganized blocks, a minimum of five adult
residents dispersed throughout the length of each candidate block were interviewed to
determine the existence of a block association. If any of the residents claimed that the
block had a block association, that block was dropped.
Despite these precautions, responses on the resident and block association member
surveys and informal follow-up interviews of some residents suggested that a few of the
block organizations were beginning to decline and two "unorganized" blocks were actually
57

in the incipient stages of organizing. Although this situation may be undesirable from an
experimental design perspective, it is simply a "fact of life" (and death, or to be more
precise, "dormancy") with block associations and is part and parcel of studying or working
with them. In an effort to reflect these "real-life" vicissitudes of small-scale voluntary
associations, an aggregated and continuous, as opposed to dichotomous, measure of
block-level organizational participation was developed for the present analysis (see
below).
Table 1. Organized and Nonorganized Block Demographic Comparisons
Organized (n=31) Nonorganized (n=13) (2-tailed
Mean (SD) Mean (SD) T a p<)
Demographics
Length of Residence 3.09 (.34) 3.01 (.40) -.66 (ns)
Proportion Nonwhite .61 (.41) .43 (.42) -1.33 (ns)
Income Level 2.96 (.49) 3.02 (.49) .39 (ns)
Home Ownership .66 (.20) .63 (.25) -.37 (ns)
Estimated Block Populationb .00 (.77) -.03 (.55) -.15 (ns)
Commercial Property .88 (1.07) 1.15 (.99) .84 (ns)
Other Nonresidential Property .25 (.57) .15 (.38) -.66 (ns)
_____________________________________________________________________
a T-test uses separate variance estimate and adjusted df (alpha =.20).
b Estimated Block Population = n of buildings X approximate n of units/building.
Means based on standardized (z-scored) component variables.
58

Telephone Survey
Respondent Sample. For the telephone survey of residents that was conducted on
every block, a minimum of 15 and maximum of 90 sample phone numbers were selected
in random order on each block from the "criss-cross" directory. Although there was once a
considerable class bias involved in many telephone surveys (by missing households that
have no phone or are unlisted), that bias is now considered minimal (Babbie, 1986). The
survey was conducted over a five week period in the spring of 1985. One selected
organized block was accidentally excluded from the survey. The initial sample frame for
all 47 blocks was 2,794 potential respondents, 909 of whom were never contacted (due to
either being unreachable or not needed) and three of whom were excluded as duplicates of
surveyed households. Of the remaining 1,882, 1,081 (57%) completed the survey. Of this
final sample, 327 (30%) were active members of 31 different, active block associations,
422 (39%) were nonmembers or inactive members living on those same organized blocks,
and 265 (25%) lived on 13 blocks without organizations. Sixty-seven (6%) lived on 3
blocks with either dormant or incipient block associations as explained above. The
number of respondents per block ranged from 10 to 41 with a mean of 23. Sixty-five
percent of all respondents were female; 47% were black, 47% were white and the rest were
Hispanic, Asian or "other." (Approximately two thirds of the blocks (which tend to be
smaller) are predominantly black and the rest (larger blocks) are predominantly white.)
Sixty-two percent owned their home. Of the renters, approximately 60% lived in
apartment buildings and the rest lived in private homes. Twenty-nine percent were college
graduates while 42% had a high school education or less. Sixty percent of the households
reported having no children at home. Other demographics can only be interpolated since
59

broad response categories were used: The sample was spread fairly evenly over all adult
age categories, with the mean being approximately 42 years old; the median estimated
annual family income was approximately $19,000; the median length of residence was
approximately 9-1/2 years.
Survey Variables: Overview
The telephone survey protocol can be found in Appendix 1. The survey took
approximately 20 minutes to complete and contained 126 items assessing residents'
perceptions of block conditions, behavioral and attitudinal aspects of the block social
climate, their participation in block association activities (with each of the above divided
between general and crime-related factors), recent criminal victimization experiences,
demographic variables, and other variables not analyzed for this study. Varimax-rotated
factor analyses were first performed by domains of social climate items. The results
appear in Appendix 1A and are explained for each variable below. (Secondary factor
analyses of the resulting scales and discrete items appear in the Results section.) A
minimum loading of .50 was used as a general criterion for including an item in a scale.
With the exception of a few items that had to be left on their own, the a priori scales were
generally confirmed as coherent constructs.
All scales were computed using standardized (Z-scored) items to make all item
response ranges comparable. Block-level descriptive statistics for all survey variables can
be found in Tables 2 and 3. Of particular interest are the range and standard deviation
columns, which demonstrate that the social perceptions, behaviors, demographics and
criminal victimization used in the present analyses do vary when aggregated to the block
60

level. Table 3 also includes individual-level Cronbach's alpha reliability coefficients for
each social climate scale. The mean reliability for the social climate scales was alpha=.70.
The behavioral outcome variables (participation in block associations and in crime
prevention activities), which are functional in nature, and criminal victimization were not
factor analyzed or reliability tested. The reason for this is that they are explicitly
"cumulative," as opposed to "integrated," scales. In other words, one is only interested in
how much participation or criminal victimization a person has experienced. People need
not perform several different participation or crime prevention behaviors for those
behaviors to belong functionally in one of those scales. In fact, it could be argued that if
one has fulfilled a given function one way (e.g., installed new locks), that person may be
less likely to perform one of the other behaviors in that scale. Even if that were the case,
at the block level especially, the behaviors still all "add up" to high or low participation or
crime prevention. Similarly, people need not be victimized by crime in different ways for
it to "count." The internal consistency of the component items of each of these scales is
thus not important in the present analyses.
Missing values on any of the four dimensions of participation (see below) were
treated as a valid 0 value (i.e., reporting no block association on the block in the phone
survey resulted in 0 participation for a given individual). Missing values on all other
variables were excluded at the individual level. If an individual had more than one third of
the component items in a scale missing, the individual was considered missing on that
scale. Most of the present analyses use aggregated block-level means on each variable.
The accidentally excluded block is the only missing value in the survey data. It was
included for the environmental analyses due to the small n at the block level.
61

Demographic variables (Q1, 139-147). Categorical (nominal and ordinal-level)
data was collected on such demographic variables as sex, age, income level, education,
race, length of residence, home ownership, type of dwelling (rent vs. own and private
home vs. multi-unit building), and number of children in household. At the block level,
variables were selected to represent broad demographic domains: socioeconomic
status/vested interest in the community (aggregated as (a) mean income level across all
block residents and (b) proportion of home owners), race (proportion of black respondents
on block), and community stability (mean length of residence). Also at the block level,
several items from the environmental inventory (below) are used as demographic
variables: estimated block population (i.e., the number of buildings on the block multiplied
by the approximate number of units per building) and the amount of commercial, vacant,
and other nonresidential property on the block.
Victimization (Q59-65). Household criminal victimization was computed as follows: a
household was considered victimized if any household member had been the victim of a
crime on the block in the preceding three years (i.e., Q63: 1=1, else=0). On the average
block, 17% of the respondent households had been victimized by crime on their block in
the previous three years. Indirect, or "vicarious," victimization is the mean of two items
(Q64, 65): knowing of a house break and knowing of an assault on the block in the
preceding year. On the average block, 43% of the respondents knew of someone on the
block whose home had been broken into and 18% knew of someone who had been
assaulted on the block.
At the block-level, the mean of this variable was averaged with the mean of
household victimization to form total block victimization. Along with reported crime rate
62
(see below), this variable represents crime in the proposed model and also actual (as
opposed to perceived) deviance in the test of the social reactions theory of deviance. In
order to keep the duration of the survey manageable, this scale differed from other brief
neighborhood crime victimization surveys that are based on the serious victimization
section of the National Crime Survey, (see, for example, Perkins & Taylor, 1987;
Rosenbaum, Lewis & Grant, 1986; Bennett & Lavrakas, 1988). Of greatest concern is the
present survey's open-ended format (as opposed to type-of-crime prompting) and disregard
of multiple victimizations.
63

Table 2. Block-level Participation, Demographics and Victimization Unstandardized Ranges, Means and Standard Deviations a
Variable Range Mean SD
Participation Block Association Dimensions: Perceived Activity (0=largely inactive, 2=very active) .00 to 1.48 .68 .46 Mean Hours Worked per Month .00 to 3.00 1.03 .84 Level of Responsibilityb .00 to .68 .33 .24
Crime Prevention:c
Collective .00 to .62 .25 .16 Individual Protections .42 to .84 .63 .10
DemographicsAverage Length of Residence(1=<2 yrs, 2=2-5, 3=5-10, 4=10+) 2.17 to 3.86 3.08 .36 Proportion Nonwhite .00 to 1.00 .58 .41HH Income (1=<$10k, 2=$10-20k, 3=$20-30k, 4=$30-40k, 5=>$40k) 2.22 to 4.25 2.96 .47Proportion Home Owners .17 to 1.00 .66 .21
Victimization on blockProportion Victimized Households .00 to .40 .17 .09Indirect Victims (0=none, 1=all) .04 to .54 .30 .12
a The n for each variable is 47 blocks (aggregated from 1,081 adult heads of household). These block-level descriptive statistics are slightly different from their individual-level counterpart due to the different block sizes. b Level of responsibility is derived half from the resident telephone survey and half from the organizational assessment membership survey, the relevant items of which are listed in the section describing the variable, "Participation in Block Associations." The value 0 signifies no block association membership. The maximum value 1 would signify that all respondents on the block have engaged in all levels of responsibility.c 0 = no anti-crime behaviors on block, 1=all respondents engaged in all behaviors.
64

Table 3. Block-level Unstandardized Social Climate Variable Ranges, Means, Standard Deviations and Alpha Reliability Coefficients a
Variable Range Mean SD Alpha (n) b
AttitudesBlock Satisfaction (0-2) .72 to 1.35 1.08 .15 .59 (818) Fear of Crime (0-2) .20 to 1.08 .58 .20 .62 (1056)Sense of Community (0-1) .59 to .89 .75 .07 .80 (720) Communitarianism (0-2) 1.30 to 1.88 1.65 .13 .68 (1009)Perceived B.A. Efficacy (0-2) 1.12 to 1.80 1.49 .15 .82 (901) Block resident recognition (0-1) .60 to 1.00 .87 .09 N/A
BehaviorsInformal Social Control (0-1) .76 to .98 .90 .05 .59 (720) Neighboring for Others (0-8) .63 to 2.64 1.72 .46 Neighboring Received (0-1) .31 to .81 .57 .09 (Total Neighboring) .76 (999)Neighbors Watch After Nbrs. (1-3) 1.79 to 2.91 2.40 .28 N/ASocialize with Neighbors (0-8) .44 to 2.07 1.12 .34 N/A
Perceived Problem ConditionsPerceived Crime Problems (0-2) .19 to 1.03 .60 .18 .78 (813) Perceived Incivilities (0-2) .24 to 1.07 .58 .16 .65 (1052)Perceived Increased Risk (1-3) 1.59 to 2.28 1.98 .13 N/A Mean = .70
a The n for each variable is 47 blocks (aggregated from 1,081 adult heads of household). These block-level descriptive statistics are slightly different from their individual-level counterpart due to the different block sizes. The range of possible responses per item from
least to most appears in parentheses.b Cronbach's alpha reliability coefficients were computed at the individual level of
analysis for all scales (see Appendix 1A for the results of the primary factor analysis). N/A indicates a single-item construct.
65

Social Climate:
General Attitudes and Perceptions Toward the Community
Sense of community (Q7-Q18; coefficient alpha = .80, n = 720). This 12-item
scale is based on the measure used by Chavis, Hogge, McMillan and Wandersman (1986)
and on McMillan and Chavis' (1986) four-component definition of the construct:
membership, influence, need fulfillment and integration, and shared emotional connection.
Two separate factor analyses with the present data included sense of community (Table
1A1 and 1A2). Although these analyses confirmed sense of community as distinct from
neighboring behavior, informal social control, block satisfaction, and communitarianism,
the present sense of community factors did not clearly match Chavis' subscales.
Therefore, only the total scale was used here. Three additional items, people recognize
block residents (Q19 in Table 1A1) and neighbors watch after each other (Q6) and a
general sense of community item (Q20, both in Table 1A2) loaded sufficiently on one of
the sense of community factors. But since they were not part of the original scale, the first
two were used as separate variables. The third was seen as redundant to the sense of
community scale.
The following five scales (communitarianism, perceived block association efficacy,
block satisfaction, perceived incivilities, and perceived crime problems) were determined
in a factor analysis (Table 1A3) among participation-focused cognitive social learning
variables. The present scales were adapted from ones previously found to predict
participation cross-culturally, using samples in the United States (Florin & Wandersman,
1984) and Israel (Florin, Friedmann, Wandersman & Meier, 1987).
Communitarianism (Q21, 66-68; alpha = .68, n = 1,009) is the importance placed
66

on the block, on working to improve it and on sharing a sense of community. It is based
on the cognitive social learning variable, "subjective stimulus values." Communitarianism
was found to be distinct, not only from the other block-focused cognitive social learning
variables (Table 1A3), but also from sense of community and block satisfaction (Table
1A2). One item, "commitment to action" (Q37), is similar to the concept of
communitarianism or, perhaps, "empowerment." But due to its potential overlap with the
dependent variable participation and to the overabundance of indepependent variables at
the DF-restricted block level, it will only be used in the individual-level comparison of
block association members, nonmembers, and residents of other blocks. It may be viewed
as a "least noticeable difference" test, or minimum effect, of membership.
Perceived block association efficacy (Q73-79; alpha = .82, n = 901) is a measure of
how likely it is that the block association, or a hypothetical association on unorganized
blocks, could accomplish certain goals. In cognitive social learning terms, this is called
"expectancies" or, alternatively, "behavioral consequences."
Block satisfaction (Q2-5; alpha = .59, n = 818) consists of evaluations of residents'
overall satisfaction with the block as a place to live and their geographic and temporal
comparisons of block conditions and direction (i.e., relative to surrounding blocks and to
past conditions and future expectations). Both this and the last variable were confirmed as
clear and separate from each other and from other factors in Table 1A3. Block satisfaction
was also found to be distinct from sense of community and communitarianism (Table
1A2).
Perceived incivilities (Q38, 39, 42; alpha = .65, n = 1,052) is a measure of the
respondents' estimates of the seriousness of the following, non-criminal physical,
67

quality-of-life problems on the block: unkempt property, poor sanitation services, and
litter. Two items (Q43, 47) had insufficient loadings in the factor analysis of perceived
problem items (Table 1A5) and so were not used in the present study.
Crime - related Attitudes and Perceptions
Perceived crime problems (Q40, 41, 44, 45, 46; alpha = .78, n = 813) is a measure
of the respondents' estimates of the seriousness of specific crime and delinquency
problems on the block. This construct is thought to be a more objective assessment of
criminal risk than is fear of crime. The specific problems addressed were vandalism, drug
dealing, loitering youths, street robbery or assault, and burglary. The two perceived
community problems scales could serve as proxies for (objective) physical incivilities and
crime, respectively. Instead, they are being treated as part of the social climate because
they are based on subjective perceptions or attitudes and because more objective measures
of incivilities and crime were available (see below).
Although the last three variables were all part of Florin and Wandersman's (1984)
construct "encoding strategies" (or block satisfaction and problem perception), the decision
to treat them as separate variables in this study was supported by a factor analysis
performed on the present data (Table 1A3) which found the problems component to load
weakly but negatively with the satisfaction factor, which makes some intuitive sense.
Perceived incivilities and crime problems were found to be distinct from each other and
from fear of crime (Table 1A4). One additional item, the perception that street crime (and,
thus, the risk of victimization) has increased (Q48), loaded adequately on the perceived
crime problems factor. But that item was used separately because the temporal estimation
68

of criminal risk has been found to be an important factor related to fear of crime (Perkins
& Taylor, 1987).
Fear of crime (Q49-50; alpha = .65, n = 1,056). Fear is considered an emotional
reaction to crime, as opposed to the more cognitive reaction to crime (above). Fear was
measured with a 2-item scale which asks how safe the respondent would feel being out
alone on the block during the day and at night. Again, it was found to be distinct from
perceived crime, incivilities and risk (Table 1A4).
Informal Block-focused Social Behaviors
Neighboring behavior (Q23-32; alpha=.76, n=999) was based on Unger and
Wandersman's (1982) scale and included both giving and receiving various kinds of
assistance: watching a neighbor's house, lending food or a tool, helping in an emergency,
offering advice on a problem, and discussing a block problem. Because of the potential
for confusion between neighboring, informal social control, and sense of community, the
relevant items were factor analyzed and confirmed as separate constructs (Table 1A1).
Two single behavioral items were seen as distinct from the "instumental" variables
neighboring and informal social control and so were left as separate constructs: neighbors
watch after each other (Q6) and the total number of neighbors with whom the respondent
socializes regularly (Q22).
Informal social control (Q34-36; alpha = .59, n = 720) assesses the likelihood of a
neighbor doing something about three different types of hypothetical "threats" or
"incivilities": trash, vandals, and a suspicious stranger. (Since this is not self-reported
behavior, at the individual level, this should be interpreted as an attitude or perception.)
69

Along with collective crime prevention (see below), informal social control will represent
both vigilantism and "moral enterprise" from the sociology of deviance literature.
Dependent Variables:
Individual protective behaviors (Q52-54, 56). These "private-minded" defenses
include such "target-hardening" measures as "putting extra locks on doors or windows,"
"leaving lights on when not at home," "installing outside lighting for security," and
"having neighbors watch your house while you were out." Q55 ("putting identification
numbers on property") was excluded from both individual and collective crime prevention
variables because it can be done in either manner. Q51 (avoidance behavior) does not
belong with the more active and efficacious behaviors. Because of statistical power
limitations at the block level, it will only be examined at the individual level.
Participation in block association activities is the main dependent variable in this
study. For the correlational analyses, an interval-level participation scale was constructed
from two different sources of data: the telephone survey and a self-administered survey of
all available block association members (n=469) on the 31 actively organized blocks. The
participation scale consists of four equally-weighted dimensions each aggregated as the
mean across all respondents on each block. The dimensions include: from the telephone
survey (including both members and nonmembers), (a) how active the association is
perceived to be (Q71), (b) the mean time (hours per month) spent working for the
association outside of meetings (Q107), (c) the mean level of responsibility in the
preceding year in terms of participating in an activity, attending meetings, talking at a
meeting, working for the organization outside of meetings, or serving on a committee or as
70
an officer or committee chair (Q80, 102-105), and (d) the mean of the following ten, more
detailed level of responsibility items from the block association member survey: In the
past 12 months, have you..
Attended a meeting?
Spoken up during a meeting?
Done work for the organization outside of meetings?
Served as a member of a committee?
Helped organize activities (other than meetings) for the association?
Participated in activities other than meetings (block party, clean-up)?
Tried to recruit new members?
Tried to get people out for meetings and activities?
Served as a representative of the association to other community groups? Worked on other
block association activities?
Despite the fact that most of the member survey administrations were supervised,
some respondents apparently left all negative responses blank. Missing values were thus
treated as a valid 0 value for those items. The resident and member scales were
aggregated separately by block and then averaged to compute a given block's participation
score. For comparative purposes, an individual-level participation scale, which consists of
the second and third dimensions above was also created. Most of the nonorganized blocks
had at least one or two residents believing that there was a block association on the block
or even claiming to have been involved in a block association activity at one time. This
prompted a careful follow-up procedure to verify the presence or absence of an association
on these blocks. Three were found to have some degree of organization (one past, one
71

active and ongoing, and one just getting started). Only the telephone survey dimensions
were used for these three blocks, since no member surveys were available.
Although some specificity regarding the various different aspects of participation
has been lost in the present study, the use of a multi-item, multi-dimensional activity scale
based on two different sources of data provides a more valid, reliable and robust measure
of block association participation than a simple dichotomy of "organized/nonorganized"
would be. In essence, this variable tells us not only what proportion of residents have
participated at different levels of responsibility but also estimates the amount of time
residents worked for the block association and uses the widest possible cross-section of
information by including nonmembers' opinions of block association activity. (It was felt
that the inclusion of nonmembers' might reduce the possible social desirability bias
members might have in reporting their own level of participation. It is noteworthy that the
resulting block participation scale appears to bear little relation to leader estimates of block
association activity and success from the leader interview. This may be due to the upward
skew of those variables in the leader interview.). The four-dimension correlation matrix
appears in Table 4, below. The high degree of intercorrelation validates this scale as
measuring a coherent and insular construct. Note, especially, the high cross-method
correlation indicated in the first column.
72

Table 4.
Block-level Pearson Correlations Among Dimensions of Participationa
Variables: 1 2 3 4
1. Responsibility Level (Member Survey) 1.00
2. Responsibility Level (Resident Survey) .78 1.00
3. Perceived B.A. Activity Level (RS) .80 .84 1.00
4. Time spent working for B.A. (RS) .73 .90 .70 1.00
a n of blocks = 47. All correlations significant at p < .001.
Block Association Membership (Q81, 102). This nominal variable forms three
categories: member (must have attended at least one meeting during the past 12 months),
nonmember, resident of nonorganized block. It will be used for individual-level group
comparisons only.
Crime - focused Formally Organized Social Behavior
Collective crime prevention (Q57-58). These "public-minded" anti-crime
behaviors include joining a neighborhood block watch program or participating in a
civilian patrol on the block or in the neighborhood.
73

Environmental Inventory
A measure was developed for the purpose of assessing the crime and fear-related
physical environment of urban residential areas (see Appendix 2). The instrument
represents a significant departure from the more common practice of relying solely upon
the subjective reports of residents, which may be questionable given the potential method
bias (Perkins et al., 1989). Thus, in order to make the assessment as objective as possible,
the Block Booster Environmental Inventory uses detailed, in-person observations by
trained raters. The procedure was conducted in August of 1985 on all the study blocks in
order to examine three types of cues in the physical environment that have been
theoretically or empirically related to crime and fear of victimization: (a) physical signs of
social disorder or "incivilities" (such as the presence of vandalism, litter, graffiti, or
dilapidated exteriors due to lack of property maintenance), (b) territorial symbols (e.g.,
evidence of dogs, such home "personalization" signs as family names on doors or
lampposts, and beautification efforts, such as plantings and yard decorations), and (c) the
built environment (including such "defensible space" features as opportunities for passive
street surveillance and barriers on and around the property). Barriers (fences, gates, walls,
hedges, etc.) are considered particularly important for encouraging a sense of spatial
"ownership" and social cohesion among residents allowed within the barriers. Certain
items were not used to predict participation in block associations or collective crime
prevention for obvious redundancy with one of the dependent variables (e.g., block watch
signs and alarm stickers). The possible redundancy of other items to the dependent
variables, such as street and private lamps, benches, and window bars, may be less
74

obvious. Since these items were known to be joint "projects" in some block associations,
they were only used in the present analyses as dependent variables in the comparison of
organized and nonorganized blocks.
The instrument concentrates entirely on the inanimate physical environment.
Social, as opposed to physical, incivilities were left out of the environmental inventory
because obvious signs of serious social disorder (such as overt drug dealing and
prostitution) are generally so sporadic or time-of-day specific that they could easily be
missed or overstated by a single visit to a block. Although less obvious or serious social
incivilities (such as loitering youths) no doubt concern residents, it would be invalid,
unreliable and not in keeping with the emphasis on objectivity, to expect outside raters to
happen to be present at just the right time and to try to judge whether observed behaviors
did or did not qualify as "incivil."
The procedure took 45 to 60 minutes to complete for a given block, depending on
the block`s size, and involved a single rater walking around the block once filling out the
block-level assessment (Part 1) indicating street width in lanes and taking a count of
building attachment and size category. Meanwhile, raters also kept a tally of all public
lighting, damage or graffiti on public property and any abandoned buildings and cars, type
of nonresidential building, public gardens, playgrounds, and block identifiers or
"blockwatch" signs. In order to evaluate incivilities, territoriality, and defensible space
with sufficient precision, the raters then walked the block a second time to fill out Part 2, a
20-item checklist on every third property until they reach a total of 12 properties assessed.
Thus, the property checklist items are block-level aggregates based on an individual-level
sample of 564 properties. To avoid bias, raters were uninformed as to whether or not a
75

block had a block association.
After a brief training session with the author, two graduate research assistants and
the author conducted a pilot test on 10 non-study blocks in 2 of the 3 study neighborhoods.
Discussion of judgement rules was allowed between pilot blocks but not during the rating
of a block and no ratings were allowed to be changed based on post hoc discussions.
Block-level (Part I) descriptive statistics from the study blocks and interrater reliability
coefficients (based on pilot blocks) can be found in Table 5. Descriptive statistics from the
study blocks and pilot block interrater reliability coefficients for the assessment of 12
properties per block (Part II) can be found in Table 6. According to Scott and Wertheimer
(1962, p. 190), "if one simply requires a measure that is to be linearly related to some other
variable," the product-moment correlation is a sufficient test of interrater reliability.
Interrater agreement was thus computed as a proportion of exact agreement among all
raters and as a mean Pearson correlation among three combinations of rater pairs.
Agreement for block-level items was computed at the block level (N=10) and agreement
for property-level items was computed at the property level (n=48). Because percentage
agreement can be spuriously high for variables with low variance, all block-level total
count items with any variance on the pretest were further tested using the mean of the three
block-level interrater product moment correlations, all of which were above the mean r
(.90). The mean interrater correlation for the property-level items was .68. Other research
(Perkins, Meeks & Taylor, 1989) suggests that this represents a considerable
underestimate of block-aggregated interrater reliability. Because the property-level
interrater correlations are so conservative, the criterion for exclusion due to low interrater
reliability was set at the relatively modest level of r=.40. Two items (vandalism and
76

decorations) were excluded on that basis. Thus, despite the fact that raters were still just
learning the instrument and how to apply it during the pilot tests, interrater agreement was
found to be quite strong for most of the property checklist items used in the present
analyses and was acceptable for the overall measure.
77

Table 5. Block-level Reported Crime and Environmental Variable Ranges, Means Standard Deviations and Pretest Reliability a
---------------------------------------------------------------------- % Exact Mean
3-way Inter-Variable Range Mean SD Agreement rater r Reported Crimes on Block (for 3 months before and during survey) 0-18 5.60 4.14 N/A NA Block-level environment Built EnvironmentStreet width (in lanes) 3-5 3.42 .54 100 1.00Total buildings 22-108 57.33 22.76 70 .99Total attached buildings 0-97 26.52 29.55 63 .99Total detached buildings 1-97 30.81 24.29 57 .99Proportion attached bldgs 0-.99 .40 .39 Total one-family houses 0-88 35.33 21.48 60 .99Total 2 or 3 unit buildings 0-75 18.52 18.14 77 .98Total multi-unit (4+) bldgs 0-16 3.10 4.38 93 .97Vacant lots 0-8 .27 1.26 100 1.00Stores 0-4 .98 1.04 (not pretested)Other nonresidential Bldgs. 0-8 1.27 1.80 (not pretested) IncivilitiesGraffiti on public property 0-47 14.15 9.02 27 .90Proportion public graffiti (b) 0-.81 .26 .15Abandoned cars on street 0-1 .02 .14 93 .99Boarded Abandoned Bldgs 0-2 .25 .53 100 1.00 TerritorialityPublic gardens 0-1 .06 .25 100 (c)Public playgrounds 0-1 .02 .14 100 1.00Block or "block watch" signs 0-12 .94 2.59 100 (c)Block markers (eg, st.lamps) 0-63 .31 1.45 100 1.00 Mean 84 .98-----------------------------------------------------------------------a The N of blocks for the range, mean and standard deviation is 48. Interrater reliability was computed on 10 separate pretest blocks. The coefficients represent the percent exact agreement among 3 raters and the mean of the 3 interrater (intraclass) correlations. The latter was only computed for block-level items for which exact three- way agreement was below 95 percent. Exact wording and instructions for the Environmental Inventory can be found in Appendix 2.
b Total incidence of public graffitti divided by the number of buildings on the block (to control for block size).
78

Table 6. Property-level Environmental Variable Ranges, Means Standard Deviations and Pretest Reliability a
Mean Per 12 properties: % Exact 3-Way Inter-
Variable Range Mean SD Agreement rater r Built EnvironmentVisibility of 1st fl. Windows 9-12 11.29 1.30 88 .50Barrier on property 2-12 8.92 2.65 (not pretested)Barriers around Property 0-12 3.96 3.13 96 .91Public (Street) Lighting 2-12 5.98 2.52 88 .83Outdoor Private Lighting 2-12 8.69 2.45 85 .79Front Gates 0-11 4.83 2.96 96 .93Bars or Gates on Windows 0- 9 2.63 2.13 94 .73Bench, Stoop (Outdoor Seating) 7-12 11.08 1.24 92 .68 Transient Environment Incivilities:Litter on/near property 0- 3 .71 .97 92 .70Vandalism on property 0- 1 .04 .20 92 .17b
Graffitti on property 0- 7 .69 1.31 90 .67Exterior Dilapidation 0- 3 .62 .73 85 .40 Territoriality:Occupied Building 10-12 11.71 .50 98 .80Dogs (dog house, beware sign) 0- 5 .71 1.05 92 .81Personalization signs 0- 8 1.98 1.83 77 .53House or yard decorations 1-12 7.23 2.43 54 .36b
Private trees, shrubs, garden 1-12 9.98 2.85 96 .86Public plantings 2-10 5.88 2.18 90 .86Security/alarm signs on property 0- 4 .79 .94 94 .72Block or block watch signs 0- 5 .52 1.07 100 (c)
Mean = 90 .68
a The N of blocks for the range, mean and standard deviation is 48. Interrater reliability was computed on 48 properties on 4 pretest blocks. The coefficients represent the percent exact agreement among 3 raters and the mean of the 3 interrater (intraclass) correlations. Exact wording and instructions for the Environmental Inventory can be found in Appendix 2.b Vandalism and decorations are not included in the remaining tables due to low interrater reliability.c Correlation cannot be computed due to lack of variance in the pretest.
79

Official Police Crime Data
As explained in the introduction, due to problems of reliability and validity with
most indicators of area crime rate, triangulation of data is particularly important. In an
agreement worked out, on behalf of this dissertation project, between the New York City
Police Department (NYPD), New York University and Citizens Committee for New York
City, the author was allowed the relatively rare opportunity to collect data on officially
reported crime at the Central Records Division of NYPD headquarters. Commensurate
with the rest of the data, rates of reported crime were collected and analyzed at the block
level. This differs from most previous studies which must typically rely on aggregated
precinct or city-level data (if police data are available at all).
During the summer and fall of 1986, police records from five precincts (one of the
study neighborhoods overlapped three different precincts) were systematically examined
and manually coded for crimes occurring on any of the 48 blocks in the study. Selected
crimes included all types of major and minor "street" felonies and misdemeanors occurring
during or just prior to the telephone survey (February, March, and April, 1985).
The source of the crime data was the NYPD Crime Complaint Index Form (see
Appendix 3), which summarizes every detailed NYPD Crime Complaint Form that is filed.
If the location or nature of the complaint was unclear from the Index, coders consulted the
corresponding Crime Complaint Form. The Index is filled out at each precinct as
complaints are filed and is submitted to Central Records at the end of every month. It
includes both citizen-initiated complaints as well as those filed by an officer (i.e., on
behalf of "the people of the state of New York") without a citizen complaint. Six trained
80

coders recorded the following information on each complaint occurring on one of the
study blocks: the date and approximate time of the incident, victim age, whether the
complainant was a resident of the block where the crime occurred or a nonresident or a
police officer, and the type of offense (e.g., burglary, robbery, assault, etc.). The offense
types were later categorized two ways: (1) violent versus nonviolent and (2) personal
versus property versus "quality of life" crimes. The degree (e.g., "third degree assault")
and place (e.g., outdoor public property, outdoor private property, indoor residence, indoor
business or public property) of the crime were also available for some complaints, though
not on a systematic basis. Descriptive statistics for block total crimes during the above
3-month period can be found in Table 5.
81

IV. RESULTS
Approach to Data Analysis
The general approach to data analysis examines the relevant contextual variables in
the permanent and transient social and physical environment and evaluates their relative
importance in explaining participation in block associations. Although "participating" and
"nonparticipating" individuals and blocks are compared, participation was more often
treated as a continuous variable based on the mean level of block association work (time),
activity, and individual responsibility of residents on each block (as explained in the
Procedures).
Bivariate relationships with block association participation will first be explored
through a series of means comparisons. The rationale for comparing members,
nonmembers and residents of blocks without block associations on the transient variables,
at the individual level of analysis, and for comparing organized and nonorganized blocks,
at the block level, is that each comparison serves as a post-test-only quasi-experiment with
nonequivalent groups. Although such a test is less desirable than a true experiment, its
inferential power hinges on the prior random distribution within (or equivalence of) the
groups. By using demographic variables to test this prior equivalence or else suggest some
selection bias, the interpretability of results from this design, although still suspect, may be
enhanced (Cook & Campbell, 1979). Also at the individual-level, the hypothesis that fear
of crime is curvilinearly related to participation in block associations and individual and
collective crime prevention is tested using analysis of variance.
Under the assumption that blocks do represent an ecologically valid and
82

theoretically important geo-social unit of analysis (see above sections on "Blocks and
Block Associations" and "Problems in Measuring Social Climates"), most of the analyses
were done at the aggregated block level. To verify that the social climate variables
represent legitimate block-level constructs, an individual-level analysis of variance was
conducted on each survey variable in the study comparing the blocks as a group effect. A
block-level analysis of variance by neighborhood was also conducted to determine
whether there are any significant differences on any variables among the three
neighborhoods. In both cases, a significant F-ratio would indicate nonindependence. For
each variable, individuals are predicted to be nonindependent of their block (justifying
aggregated block-level analysis of the data). Although blocks (like individuals) are
expected to be neighborhood "dependent," demographic variables will be entered as
coviariates in this analysis so that any neighborhood effect is exclusive of those.
With a sample size of 47 blocks for most analyses, statistical power was quite
limited, especially in the (multivariate) multiple regression equations. For all block-level
bivariate analyses, the criterion effect size (for two-tailed significance at p < .05) was r
= .285. The power (or probability of correctly rejecting a false null hypothesis) at p < .05
(2-tailed) and r = .20 is only .28. At r = .30, power ratio is .55 and only reaches the more
desirable power level of .82 at r = .40 (Cohen, 1969). To compensate for this limitation,
two methods of raising the power of the remaining analyses were adopted. One was to
raise the block-level alpha (significance) criterion to p < .20. Although this procedure may
seem highly unconventional to some, it actually represents a slight compromise to the p
< .25 criterion recommended by Kenny and LaVoie (1985) when analyzing group-level
data. (It may help to remember that the block-level means are based on a total 1,081
83

survey respondents and 576 property ratings.) The other method used to increase
statistical power at the block level was through reduction of the number of predictor
variables (and the creation of composite "factor" variables) via secondary factor analyses
within each cluster of the theoretical framework (results outlined below).
Block-level Pearson correlations will be used to examine the relationship of the
predictor variables to collective participation in block associations, to community crime
prevention efforts and to levels of individual protection on the block. If a given composite
factor correlates significantly, its component variable correlations are also shown. Next, a
matrix of Pearson and partial correlations (controlling for any demographic variables that
are significantly related to block association participation) among the predictor factors is
presented.
Finally, a series of multiple regression analyses will test the proposed general
framework's ability to predict block-level participation. Each set will be entered
hierarchically consistent with the model as correlates of participation in block associations.
In addition to a full-model regression, other equations separately test the predictive power
of the physical environmental and social climate component variables. A more stringent,
cross-method regression is also presented, in which the social climate variables, from the
resident survey, are regressed on the level of organizational responsibility dimension of
participation, from the member survey. The introduction to each analysis provides more
detail on the rationale.
84

Individual-level Analyses
Comparisons of Members, Nonmembers, and Residents of Unorganized Blocks.
The first inferential analyses were individual-level means comparisons of members of
block associations, nonmembers living on organized blocks, and residents of blocks
without block associations (No-BA residents) were computed two ways. First, Table 7
presents an analysis of variance using unadjusted, inividual-level means. (Again,
composite scale items were z-scored first to make each item comparable.) One-way
analyses of variance provided an overall test of significant between-group differences. For
each significant F ratio, the Student-Newman-Keuls procedure was used to determine
which pairs of groups differed significantly on that variable.
Next, because of the within-block nonindependence of individuals (i.e., the
influence of others on the same block), a series of ANOVAs on the same groups as above
and t-tests (for members and nonmembers on organized blocks only) were performed
which controlled for block-level variance. In these analyses, all the individual-level
variables were computed by subtracting, from each individual's score, the mean for that
individual's entire block. These "block-centered" variables are explicitly relative to other
individuals on the block. This procedure to separate group and individual-level effects
would be particularly important for any individual-level correlational analyses (Kenny &
LaVoie, 1985). But the present study only examines block-dependent effects which are
not affected in any meaningful way by block-centering. For example, if members engaged
in more individual protections than nonmembers across the entire sample, they still would
do so after extracting block-level variance because they live on the same blocks. The
ANOVA reanalyses (using block-centered data) included residents of unorganized blocks,
85

which changed some of the Student-Newman-Keuls comparisons. But those changes may
be seen as an artifact of the block-centered "No B.A." group means necessarily falling
between the means of the other two groups. Thus the block-centered results will not be
presented.
The top two sections of Table 7 contain demographic variables and victimization
over the last three years, which are stable and so will be treated as independent variables
related to the dependent variable individual-level block association membership. As
predicted, members showed the greatest residential stability and home ownership followed
by No-BA residents. The same pattern was true of age category. The hypothesis that
members would have a higher average family income than nonmembers was also verified.
Both members and nonmembers were more likely to be a racial minority than were no-BA
residents, which only partially supports the hypothesized racial effect. There were no
significant group differences in education or sex. Nor were there any differences in direct
(household) or indirect (vicarious) criminal victimization.
The bottom two sections (block-focused perceptions, attitudes and behaviors and
participation in crime prevention, which at the block level form the social climate
variables) are sufficiently transient in nature that they will be treated as post-tests of
membership, as explained above. There were significant group differences on all but one
variable. Members were highest on every variable, in the hypothesized direction, except
for perception of crime (in which they did not differ significantly from nonmembers), fear
of crime and avoidance behavior (in which they did not differ significantly from either of
the other groups), and the perception that the local criminal risk is increasing (in which
members were lowest). In the "minimum effect of membership" test, their higher
86
commitment to action to improve the block was particularly pronounced. Nonmembers
were lowest in sense of community and had greater fear, and perceived crime and
incivilities than No-BA residents. But nonmembers felt more commitment to action and
that their neighbors watched out for each other more than No-BA residents.
As expected, members, on average, participated in block associations (not shown)
and collective crime prevention activities more than nonmembers, who participated more
than No-BA residents. Although members also participated in the most individual
protections - i.e., such as installing extra locks or lights, or, when going out, leaving lights
on or having neighbors watch the house - No-BA residents engaged in more such "target
hardening" behavior than nonmembers.
The Curvilinearity Hypothesis of Fear and Participation. The hypothesis that
participation in block associations and collective and individual anti-crime activity is
greatest among those individuals with moderate levels of fear of crime (who are neither
paralyzed by fear nor too complacent) was tested using an ANOVA design at the
individual level (Table 8). In the first ANOVA on participation in block associations, an
examination of the group means reveals an apparent linear, rather than curvilinear, trend.
Participation decreases as fear increases. If there is any trend for participation in collective
crime prevention activities, it is that participation is lowest among those with moderate
fear. The F ratios in ANOVAs A and B are both nonsignificant, however. And the
Student-Newman-Keuls procedure verified that none of the five groups with different
levels of fear differed significantly in either general or anti-crime collective participation
from any others.
87
In ANOVA C, testing for mean differences in individual, "target hardening"
protections, the F-test was significant. As predicted, on average, those with the least fear
of crime engaged in the least individual protections. The relationship appears to be mostly
linear and opposite to the trend for participation in block associations. The
Student-Newman-Keuls comparison verified that those who feel "very safe" alone on their
blocks both in the daytime and at night had engaged in significantly fewer protections than
three of the other four groups. (It would have been all four groups except that the small n
of those reporting the greatest fear produced a much larger confidence interval for that
group.)
Secondary Factor Analyses
Due to the limited degrees of freedom at the block level, the number of variables in
the remaining analyses needed to be reduced. The social and physical environmental
variables were thus divided into sets on a conceptual basis and then combined within sets
using a series of six secondary factor analyses (Table 9): three on the different domains of
the physical environment (the built environment, territorial markers and physical
incivilities) and the three domains of the social climate (behaviors, attitudes, and perceived
conditions or "cognitions").
The first analysis was of the built environment items from the environmental
inventory, excluding certain features that were possible objects of block association action
and therefore confounded with the key dependent variable. These were public street
lights, private outdoor lighting, bars on windows and places to sit outdoors. (Block
associations were known to sometimes organize projects to provide these features.) Two
88

factors were extracted from the remaining built environmental items. One was the
presence of a gate on the property and barriers around the property. This makes sense in
that "perimeter" fences often include a gate. The other factor included four items that may
appear, at first, to be a motley combination. It was clear that this factor was conceptually
two different variables and so was divided accordingly into (a) the proportion of attached
buildings on the block and barriers on the property (both are "near-home" barriers) and (b)
narrow street and visible windows (these relate to visibility to and accross the street).
The second analysis included all five physical incivilities and two factors were
extracted: (a) graffitti on public and private property and (b) "unintentional" incivilities:
exterior dilapidation, empty building(s) on the block and litter on the street and sidewalk.
Because empty buildings loaded on both factors, it was kept separate in later analyses.
The third analysis included all territorial markers. (Evidence of dogs, although a
sign of territorial functioning, was not included in this analysis because, unlike the others,
it is considered neither "purposive" nor, especially, beautifying.) One factor was produced
among personalization signs and public and private plantings (trees, shrubs, garden). But
the loading was negative for personalizations and nonsignificant for public plantings.
Given the need for data reduction, the three territorial marker items were still combined as
a single factor for later analyses.
The behavioral social climate factor analysis extracted one factor: neighboring
behavior, neighbors "watching out" for each other, the level of socializing among block
residents, and informal social control. The fifth analysis produced two attitudinal social
climate factors. One was made up of sense of community, block satisfaction, and
perceived block safety (i.e., the reverse of fear of crime). This factor was labeled "sense of
89

community well-being." The other attitudinal factor included communitarianism, block
resident recognition, and perceived block association efficacy and was labeled
"communitarian efficacy." The final factor analysis extracted a single cognitive, or
perceived problem conditions, factor. It included perceived incivilities, crime problems,
and increased risk of criminal victimization. Perceived increased risk did not load
significantly, however, and so was used separately.
Tests of Nonindependence
A series of analysis of variance tests of individuals' nonindependence of the blocks
they live on is presented in Table 10. Dependent variables include participation in block
associations and crime prevention, demographics, direct and indirect victimization and the
general social climate factors identified above. The R2 column represents the proportion
of variance in each variable explained by the respondents' block. The significant F ratios
and large R2 values mean that individual-level analyses include significant hidden block-
level effects. Thus, the rationale for mainly block-level analyses in this study appears
justified by the general nonindependence of individuals within blocks. The only exception
was the variable perceived increased risk, which did not exhibit significant block-level
variance at the p < .05 level. Since the block-level standard deviation in Table 3 for this
variable was not out of line compared with the other social climate variables, it was not
excluded from block-level analyses.
Table 11 presents a series of tests of blocks' nonindependence of their
neighborhood on each demographic and physical and social general factor variable in the
study. Deviation values from the grand mean of each variable for the three neighborhoods
90

are unadjusted for demographic influences. The R2 column represents the proportion of
variance in each variable explained by neighborhood, also including demographic effects.
The large deviation and R2 values mean that block-level analyses include significant
hidden neighborhood-level effects. Note the large F ratios at the top of Table 11 for the
demographic variables, however. The remainder of that column presents F ratios that have
been adjusted for demographic covariates. Not shown in Table 9 are the pre-covariate F's
for the nondemographic variables. The only variables for which inclusion of these
covariates did not substantially reduce the neighborhood effect (F) were perceived block
problems and perceived Increased Risk. For most variables, the effect became
nonsignificant. This indicates that most of the differences between neighborhoods are due
to demographic influences.
One way of handling the neighborhood effect would be to pull the neighborhood
variance out of each block by computing each block-level variable as a deviation from the
neighborhood mean. This would be ideal (a) if there were a large enough sample of
neighborhoods to run additional analyses at the neighborhood level or (b) if the source of
neighborhood variance could not be determined. Since there are only three neighborhoods
in the study and since the source of most of the neighborhood variance clearly resides in
the demographic variables, however, analysis across neighborhoods may be justified.
Still, it will be important to examine demographic effects in the remaining, block-level
analyses, to control for those effects as their significance warrants, and to consider the
impact of neighborhood-level variance when drawing conclusions from the data.
91

Block - level Analyses
Comparison of Organized and Nonorganized Blocks
A comparison of means on all study variables between blocks with block
associations (combining members and nonmembers) and those without block associations
appears in Table 12. The three blocks of ambiguous status (see "Procedures") were
excluded. Due to low statistical power at the block level, multivariate analysis of variance
was not possible. Instead a series of bivariate, two-tailed t-tests were used with separate
variance estimates (and adjusted degrees of freedom) because of insufficient homogeneity
of variance between the two groups on many variables. Again, due to the low n of blocks,
mean differences that would be highly significant at the individual level of analysis (cf.
Table 7) were nonsignificant at the block level. Although several were significant, they
must be interpreted with caution. At p < .20, one would expect approximately four or five
of the 24 t-tests to be significant by chance alone.
As in every analysis, the built environment is treated as an independent variable.
Contrary to expectations that block associations would develop on blocks with more
defensible space, blocks with block associations were on somewhat wider, less "visible"
(from inside one's home) streets. Organized blocks also had fewer barriers on, as opposed
to around, residential property and had less private outdoor lighting but significantly more
public street lighting.
The remaining comparisons serve as post-tests of block organization. Contrary to
expectations that block associations would deter crime, there were no significant
differences in reported crime or victimization rates. Organized blocks also had
92

significantly more unoccupied and poorly maintained buildings, which is opposite to what
was hypothesized. On the other hand, blocks with block associations exhibited more of
two territorial items: block identification signs and evidence of dogs. Some block-level
features of the physical environment were too rarely found to be used in the correlational
analyses that follow. But on a more anecdotal level, the only abandoned car that was
found was on an unorganized block and the only playground and all three gardens were on
organized blocks.
With regard to the social climate, as predicted, people living on organized blocks
engaged in more of the positive block social behaviors (neighboring behavior, informal
social control, socializing with neighbors and residents watching after each other) and
were less likely to perceive an increase in block crime. Contrary to expectations, however,
residents of organized blocks were also more critical of block problems. Separate t-tests
determined that this was due to their higher perceptions of incivilities, such as unkempt
property, litter, and poor sanitation services (t = -2.59, p < .05). There were no significant
differences in sense of community well-being or communitarian efficacy.
As expected, in comparison to those who live on blocks without block associations,
on average, people who live on organized blocks participated more in collective crime
prevention efforts (e.g., a citizen patrol or block watch, many of which were sponsored by
block associations). There were no significant aggregate differences in individual
protections.
Correlates of Participation in Block Associations and Crime Prevention
Tables 13 and 14 present the block-level permanent and transient (respectively)
93

social and physical environmental correlates of each of the dependendent variables:
participation in block associations (on all blocks and on organized, or "B.A." blocks only)
and in collective (civilian patrol or "block watch" program) and individual crime
prevention activities. For each composite, or general factor, variable that was significantly
correlated with one of the dependent variables, the component variable correlations with
the three dependent variables are presented.
Contrary to the hypotheses that greater resources (income), investment (home
ownership), residential stability, lower block population, and nonresidential land use
would lead to greater block association participation, that dependent variable was
unrelated to almost the entire set of demographic variables. The only exception when
analyzing across all blocks was its expected, but modest, association with the proportion of
racial minorities. But even that correlation was zero using organized blocks only, which
suggests that the effect is due to the slightly disproportionate selection of predominantly
minority organized vs. nonorganized blocks (compared with the same ratio among the
predominantly white blocks). Using organized blocks only, the expected negative
correlation between participation and the estimated block population was found.
Unpacking that predictor, however, shows that this association is mainly due, not to a
"manning" effect, but to the number of buildings (or physical size) of the block rather than
its population density. The larger the block, the lower the degree of general participation.
(It is worth noting that, although length of residence, home ownership and income were
not significantly related to participation in block associations at the block level of analysis,
they were all positively related to individual-level participation, based on the three resident
survey dimensions of the scale (r=.21, n=1,059, p<.001; r=.22, n=1,031, p<.001; and
94

r=.10, n=833, p<.005, respectively)).
In the crime prevention columns, both collective and individual anti-crime activity
were positively related to many demographic variables: length of residence, proportion
nonwhite, home ownership, and nonresidential property other than stores (e.g., churches,
public gardens, playgrounds). The first three of those were especially strongly associated
with individual protections (although it should be noted that this and all other comparisons
between individual and collective crime prevention could be due to greater variance in the
former). Both forms of crime prevention were inversely related to commercial property on
the block and to housing density (i.e., more multi-unit buildings). Again, these were larger
effects for individual protections. Not shown in the table is a significant association
between housing density and reported crime (r=.34, p<.01). The only income effect was
that collective crime prevention efforts were modestly associated with lower income
blocks. There were somewhat more individual protections on blocks with a vacant lot.
In the built environment, most of the correlations with block association
participation were made nonsignificant by restricting the sample to organized blocks only.
Across all blocks, all three dependent variables, particularly individual protections, were
related to wider streets and even more strongly related to fewer barriers on (as opposed to
around) people's property. These results are opposite to the hypothesized relationships
with collective participation. Participation in block associations and in collective crime
prevention was also related, as predicted, to more gates. The level of individual
protections was related to window visibility and building detachment.
Participation in block associations and in crime prevention was correlated with a
wide variety of social climate constructs and transient physical environmental items (Table
95
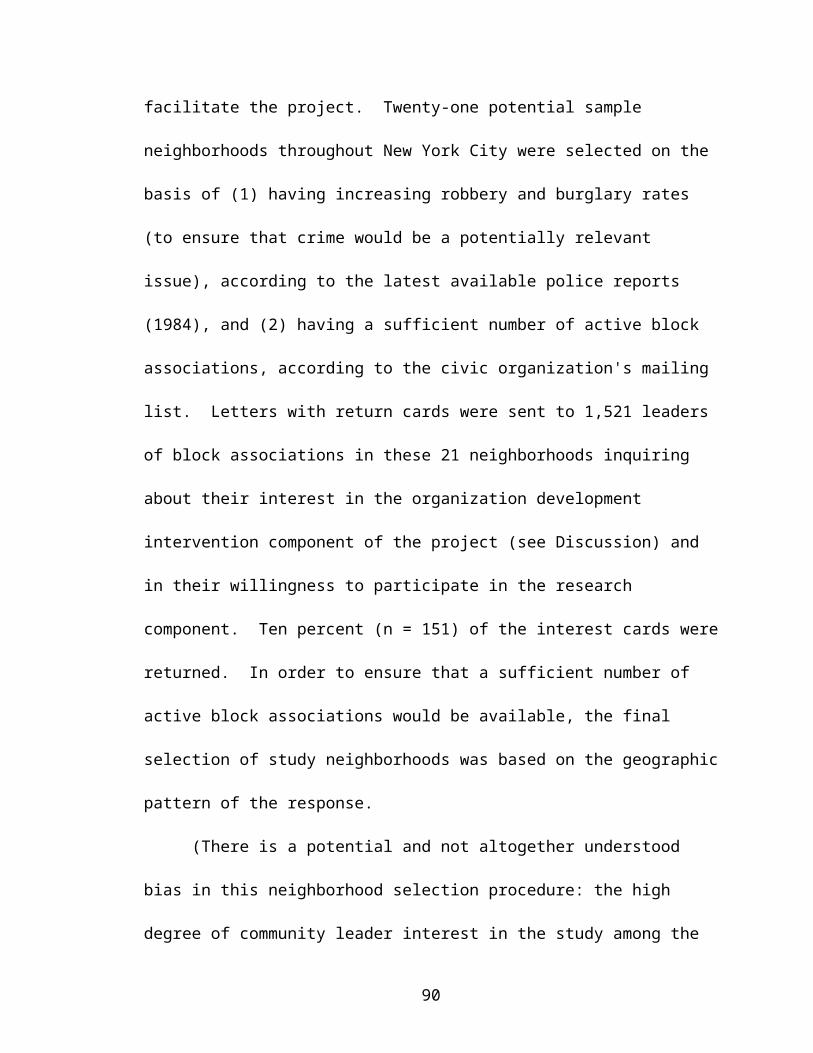
14). Contrary to expectations, however, reported crime and surveyed victimization rates
were not consistently related to any of the dependent variables. The level of individual
protections was related to lower reported crime, but not criminal victimization. And there
was a slight correlation between participation in block associations and lower
victimization rates on organized blocks, but not across all blocks. Collective crime
prevention was not significantly related to either crime indicator.
In the transient environment, evidence of dogs was positively associated and public
and private trees, shrubbery and gardens were (unexpectedly) negatively associated with
participation in block associations. Although collective crime prevention was unrelated to
territorial functioning, individual protections were associated with more plantings, fewer
personalizations, and more dogs. The only form of actual (as opposed to perceived)
physical incivility that was related to any of the dependent variables was presence of an
empty building on the block, which, as expected, was positively related to block
association participation.
Among the social climate variables, all of the positive behaviors (neighboring,
neighbors watching after each other, socializing with neighbors, and - on organized blocks
only - informal social control) were related to participation in block associations, as
predicted. Individual and collective crime prevention were strongly related to neighboring
and, to a lesser extent, socializing. Collective crime prevention was also strongly
associated with neighbors watching after each other. Ironically, the only behavior not
significantly related to one or both of the crime-related dependent variables was the crime-
related predictor, informal social control.
Each component of the general factor "sense of community well-being" was
96

significantly related to participation in block associations on organized blocks. This was
predicted for block satisfaction and sense of community but not for perceived safety (i.e.,
the reverse of fear of crime). Across all blocks, however, only the relationship with block
satisfaction was significant. This effect is contrary to Florin and Wandersman's (1984)
findings. Collective crime prevention was also modestly associated with block satisfaction
while individual protections was negatively related. Sense of community was positively
related to collective crime prevention and perceived block safety (or the reverse of fear of
crime) was associated with both forms of crime prevention, especially individual.
As expected, the communitarian efficacy factor was positively related to all three
dependent variables. Perceived block association efficacy and the perception that
neighbors would recognize who was a stranger and who was a block resident appear to be
mainly responsible for this factor's correlation with block association participation.
Surprisingly, communitarianism was significantly related to collective and individual
crime prevention but not to participation in block associations. Both forms of crime
prevention were even more strongly related to the perception that neighbors could
distinguish residents from strangers. Collective crime prevention was also related to block
association efficacy.
Perception of block problems was associated with block association participation
and with individual protections, both in the hypothesized direction. In both cases, the
relationship seems to be due more to the variable perceived incivilities (which is also
related to collective crime prevention) than to perceived crime problems. This last
comparison is an especially noteworthy and ironic effect. Contrary to what was predicted,
perceived increased risk of criminal victimization on the block was associated fairly
97

strongly and negatively with both types of collective participation, but not significantly
with individual protections.
Among dependent variables, as expected, the level of collective crime prevention
on the block was strongly related to block association participation. Block-aggregated
individual protections were not significantly related to block association participation, but
were related to collective crime prevention.
Relationships Among Social and Physical Predictors
The full Pearson correlation matrix among the general factor variables to be
entered in the regression model predicting participation in block associations appears in
Table 15. This is where data reduction became most critical. Since neither measure of
street crime (surveyed or officially reported) was significantly related to participation in
block associations, that set was excluded from the matrix, and thus from the regression
analysis (below). The demographic set was under consideration as potential control
variables in the model. Race (proportion nonwhite) was the only demographic variable
that was related to general participation across the whole sample of blocks and so it was
partialled from each correlation in the matrix (top-right half of Table 15). Partialling racial
composition made little difference to either the size or the number of significant
correlations (there were 42 significant zero-order correlations compared with 38
significant partial correlations). It was decided, therefore, that the demographic set could
also be safely excluded from the regression model.
As shown in Table 15, there were many significant intercorrelations among the
predictors in the model. The strong correlations between the social climate variables and
98

other social and physical variables adds further support for their validity as block-level
constructs. There were many significant correlations within sets of variables in the model,
even after the secondary factor analysis which worked to reduce such multi-collinearity.
For example, not only were building attachment and barriers on property interrelated, but
together they were associated with more narrow and "visible" streets. Consistent with
Wilson and Kelling's (1982) thesis that incivilities are "contagious," blocks with empty
buildings were significantly related to both of the other physical incivility factors.
Among social climate predictors, as expected, the factor of neighboring, social
control and other block social behaviors was related to the "sense of community well-
being" factor and the "communitarian/block association efficacy" factor. Sense of
community well-being was, not surprisingly, also related to the perception of fewer block
problems and of less increased criminal risk. Perceived increased risk was also related to
less communitarian efficacy and less positive social behaviors.
Looking across sets of the physical environment, as expected, territorial markers
were inversely related to all of the physical incivilities: the more markers on a block, the
less graffiti, empty buildings and other incivilities. And empty buildings were also
associated with wider, less visible streets and houses with fewer near-home barriers
(attached buildings and barriers on, as opposed to around, the property).
Many of the correlations between the observed physical environment and the
unseen social fabric of the blocks are even more noteworthy. For example, consistent with
the environmental criminology literature, sense of community well-being was related to
both near-home and perimeter (around the property and gates) barriers and to fewer
"unintentional" physical incivilities (litter and dilapidation) and fewer empty buildings.
99

This deserves to be unpacked a little: as component variables, block-level feelings of
safety (low fear of crime) correlated with attached buildings (r = .60), barriers on the
property (r = .56), and less litter (r = -.25); and litter was negatively correlated with sense
of community (r = -.50). (Feelings of safety were also related, as expected, to street
visibility (r = .41), street narrowness (r = .27), and, unexpectedly, less public street lighting
(r = -.39) and plantings (r = -20).)
Perceived increased risk of street crime was strongly and strangely associated with
several physical factors: more territorial markers, fewer empty buildings and perimeter
barriers and less graffitti. The communitarian efficacy and perceived block problems
factors were both related, unexpectedly, to fewer near-home barriers and to wider, less
visible streets. Block problem awareness was also related to more dogs and unintentional
incivilities whereas positive block social behaviors were related to more dogs and fewer
unintentional incivilities (evidence of dogs was not included among the physical
incivilities, intentional or otherwise). Finally, as expected, positive social behaviors was
associated with more perimeter barriers. Again, almost all of the above relationships hold
up even when controlling for block racial composition.
Unlike the results of Perkins, Meeks and Taylor (1989), the only relationship
between resident perceptions of incivilities and other block problems and actual
(objective) incivilities is a correlation between perceived problems and the unintentional
incivilities (mainly dilapidation of house exteriors). Although not shown in Table 15,
correlations focusing just on the incivilities component of perceived problems does not
help any.
With crime and demographics out of the matrix there were some correlations that
100

are not shown in Table 15 but worth mentioning. The reported crime and victimization
rates were only inconsistently related to demographics and the social and physical
environment. As predicted by incivilities theory, reported crime was related to graffiti on
public property (r = .37). Crime was also related to less residential stability (r = -.32), less
home ownership (r = -.32), and to fewer minority residents (r = -.32). Victimization was
understandably related to lower satisfaction with the block (r = -.37) and more litter (r
= .30), perceived crime (r = .41) and fear of crime (r = .33). But crime and victimization
did not correlate alike with any variable.
Multiple Regressions Predicting Participation
A full-model, block-level multiple regression, using all of the pre-secondary factor
analysis variables, predicted over 90% of the variance in block association participation.
Due to the large number of independent variables and relatively small n of blocks,
however, the size of the model was reduced substantially in order to keep the multiple
regression analysis as parsimonious as possible. The physical environment and social
climate predictors underwent secondary factor analysis (see above). And the crime and
demographic sets were dropped out of the model altogether based on their lack of
correlation with participation in block associations. Again, the block-level alpha
(significance) criterion of .20 is in effect. The results of a series of reduced-model, block-
level, hierarchical regressions predicting level of block association participation appear in
Table 16. In each equation, sets are entered in a rationally predetermined order (consistent
with the theoretical framework (Figure 1). Entry of variables within sets was step-wise.
101
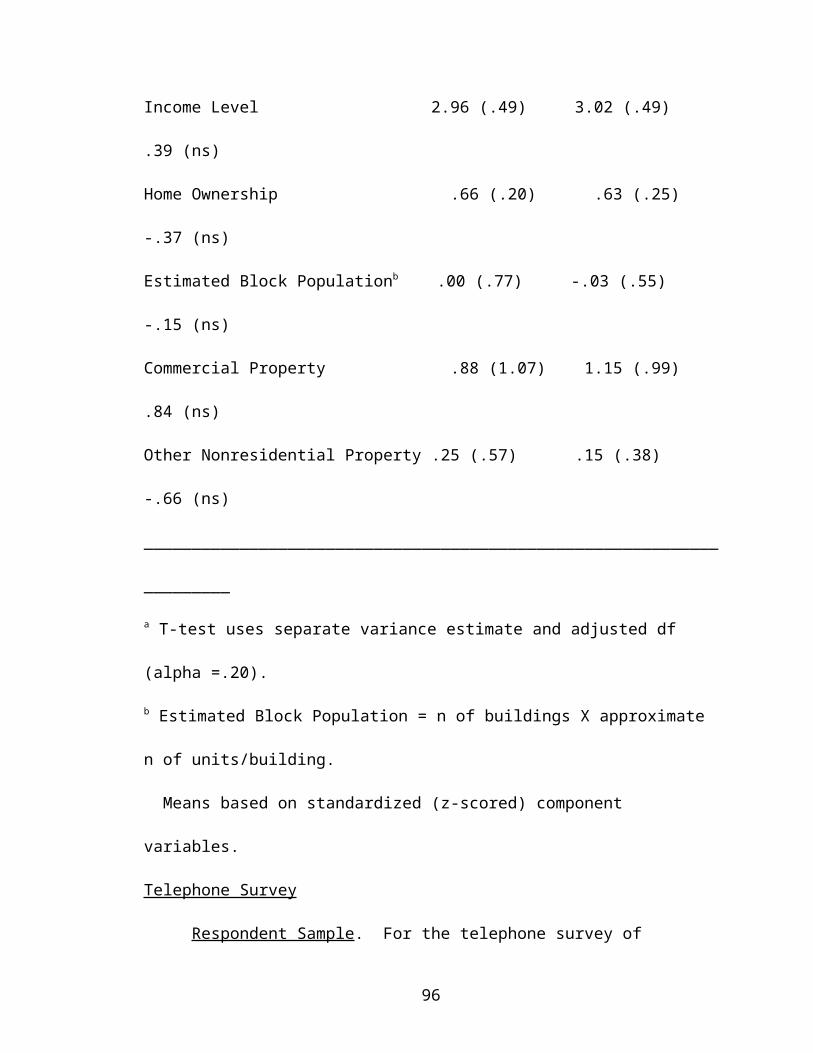
Equation 1: the condensed total model on all blocks. In the first stage of regression
equation 1, the three built environment factors (narrow, visible streets, near-home barriers,
and perimeter barriers) shared 12% of the variance with participation (p < .15).
There was little theoretical basis upon which to decide the relative hierarchical
priority of the social climate and transient environment. According to the model, the
social climate and transient physical environment are equally "transient" and proximate to
participation. The social climate variables and the dependent variable were both measured
by the resident survey and so may share method variance that could overwhelm any later
effects. The transient physical environmental variables were therefore entered into the
regression next. And since the territorial functioning variables, such as plantings and
personalizations, were considered more temporally stable than physical incivilities, such as
litter and graffitti, the territorial set was entered before incivilities.
The two territorial factors, markers and dogs, added seven percent to the variance
explaining participation in block associations (p < .20). The third stage of the regression,
the three physical incivilities factors, added only three percent (ns) to the explained
variance. The social climate factors were then entered and together contributed
significantly (R2 change = .33, p < .005) to the regression, beyond the influence of the
physical environment. The entire model explained 36% (unadjusted R2 = .54) of the
variance in block association participation (p < .01).
Table 16 presents the final beta weights for each factor in each equation. But even
with the reduction of predictor variables, the high degree of multicollinearity (see Table
15) and high variable to n ratio makes individual beta values fairly unstable. Conclusions
should only be drawn from them with great caution. Four betas in the total model/total
102

sample equation (1) were significant: participation in block associations was predicted by a
greater number of positive social behaviors on the block, fewer near-home barriers, more
empty buildings on the block, and a greater sense of community well-being.
Equation 2: the condensed total model on organized blocks only. The second
equation tests the same social and environmental framework on just the 34 organized
blocks to see whether a more normally shaped distribution would make a difference. In
the first stage, the built environment explained five percent of the variance in block
association participation (ns). Territorial functioning added 15% (p < .10) and physical
incivilities seven percent (ns) explained variance. In the final stage, the social climate
factors contributed 30% (p < .05) additional variance, over and above the prior stages of
the model. All of the predictors combined to explain 29% (unadjusted R2 = .57) of the
variance in block association participation (p < .10). The only significant betas in the full
equation were sense of community well-being, (fewer) near-home barriers, and (fewer)
territorial markers.
Equation 3: Physical Environmental Predictors Only. This equation, which uses all
47 blocks, excludes the social climate variables for a dual purpose: (1) to allow the pre-
secondary factor analysis component variables to be tested for their relative contribution to
the model and (2) to provide a greater chance for physical environmental final betas to be
significant. In the first stage of this regression, the six built environment component items
explained 20% of the variance in block association participation (p < .15). In the next
stage, the four individual territorial functioning variables added significantly to the
103

prediction (R2 increment = .14, p < .15). Finally, the five physical incivility items
contributed an additional 10% (ns) to the overall shared variance between the physical
environment and block association participation (R2 = .44, adjusted R2 = .18, p < .15).
Examination of the final beta weights suggests that participation in block
associations is associated with fewer barriers, fewer plantings, more dilapidated houses,
and less litter. A comparison of the betas with the zero-order correlations in Tables 13 and
14, however, shows that the "relationships" with barriers around the property and with
litter are due to suppression. (Although the unintentional incivilities together are not
significantly related to block association participation, dilapidated exteriors alone was
related (r = .28, p < .05).)
Equation 4: Social Climate Predictors Only. This equation serves the same
function as the last one, but for the social climate set instead. It excludes the physical
environment in testing the (pre-secondary factor analysis) social climate component
variables in a regression model using all blocks. The social climate variables were divided
into three sets consistent with the rationale of the secondary factor analysis (above). The
rationale for the order of set entry was a basic psychological model: (1) cognition, or
awareness, followed by (2) attitude formation, followed by (3) behavior. (It may be
doubly appropriate for behaviors to enter last since the dependent variable is also a
behavior.)
In the first stage of the regression, the awareness, or perception, of problems set
shared 25% (p < .01) of the variance in block association participation. The attitude-based
climate set contributed an additional 19% (p < .10) of the variance explaining
104

participation. And behaviors added significantly greater explanatory power to the equation
(R2 increment = .23, p < .005). The entire social climate portion of the framework
explained 54% (p = .0001) of the variance in block association participation (unadjusted
R2 = .67).
Examining significant final betas, participation in block associations was
associated with greater block satisfaction, neighbors watching out for each other,
perceived incivilities, more socializing among neighbors, greater perceived block
association efficacy, fewer perceived crime problems, and less sense of community. The
beta values for these last two variables should be ignored given that a comparison with the
corresponding zero-order correlations in Table 14 clearly reveals suppression effects. Two
of the variables that explanatory variance was probably "suppressed from" in this equation
are (less) perceived increased risk of victimization and (greater) neighboring behavior.
Equation 5: Cross-method Prediction of Participation by Social Climate: This
equation tests the same social climate component variables from the last equation (based
on the resident survey) for their ability to predict the member survey component of
participation in block associations. This component may be more accurately described as
the mean level of activity and responsibility among block association members. This
provides a more conservative test of the last regression model since variance shared
between the independent and dependent variables cannot be due to their being derived
from the same survey and the same individual-level sample. (Although some respondents
may have completed both surveys, it should be noted: (a) that a minority of block
association members completed the resident survey (which also included many
105

nonmembers and inactive members) and (b) that the member survey data (i.e., the
dependent variable in this equation) was collected several months after the resident survey,
which makes this equation the only longitudinal analysis in the study.) Since the member
survey was only conducted in block associations, the sample was restricted to organized
blocks.
In the first stage of the regression, block-level perceived problem conditions
explained 15% of the variance in "member" participation (p < .20). The attitude-based set
was then entered and it explained an additional 28% of the variance in the dependent
variable (p < .15). The behavioral set added 14% (ns) more explained variance to the
equation, over and above the first two stages. As a whole, Equation 5 explained 28% (p
< .10) of the variance in member-survey-based participation (unadjusted R2 = .56).
Significant final betas included neighbors watching out for each other, perceived
incivilities, perceived block association efficacy, block satisfaction and three likely
suppression effects (less sense of community, fewer perceived crime problems, and less
block resident recognition).
Summary of Results
At the individual level of analysis, members of block associations had greater
demographic "resources" and community ties and scored consistently more favorably than
nonmembers and residents of unorganized blocks on block-focused attitudes and
behaviors. Although there were no significant differences in victimization, members
enganged in more individual and collective crime prevention activities than the other two
groups. The curvilinear hypothesis of fear and participation was not supported.
106

Individuals were found to be nonindependent of blocks and blocks nonindependent of
neighborhoods, although the latter effect was due mainly to neighborhood demographic
differences.
At the aggregated block level of analysis, there were no significant differences in
demographics or crime between organized and nonorganized blocks. There were,
however, several differences in the built and transient environment and social climate of
organized and nonorganized blocks. These block-level effects emerge even more strongly
in the correlational analyses. Factors within the various domains of the block physical and
social environment correlated significantly within and across domains and methods (even
after partialling the influence of block racial makeup). They also correlated significantly
with participation in block associations and with collective and individual crime
prevention activities. Finally, except for physical incivilities, each of those domains - the
built environment, territorial functioning, and the social climate - contributed significant
variance to the series of hierarchical regression equations predicting participation in block
associations.
107
V. DISCUSSION
The purposes of this study were: (a) to present a block-level theoretical framework
of crime-related social and physical environmental correlates of participation in block
associations and collective and individual crime prevention; (b) to introduce a new method
for objectively measuring the physical environment of residential blocks; (c) to determine
the differences between members and nonmembers of block associations on both general
and crime-focused attitudes, perceptions and behaviors; (d) to determine the differences
between between organized and nonorganized blocks on these same variables and on
crime and physical signs of social disorder, territoriality, and "defensibility;" (e) to explore
how the various physical and social environmental characteristics of blocks are
interrelated; and, perhaps most important, (f) to test both the framework and the
environmental method for their ability to explain a significant portion of block-level
variance in block association participation.
The most important finding of this study is that the built and transient physical
environment and social climate are indeed significantly and independently related to
collective participation in block associations. Furthermore, the Block Environmental
Inventory proved to be a reliable instrument for describing community settings in a way
that can be usefully related to indicators of social climate, crime and demographics as well
as participation in community organizations.
Parts of the framework were unsupported, however. Almost all of the demographic
and explicitly crime-related factors in the proposed framework were not significantly
related to participation in block associations. The only demographic exception was the
108

hypothesized racial effect, but even that may have been due to a planned bias in the sample
selection procedures that favored organized minority blocks. The only crime-related
exception was that blocks in which residents perceived a greater increase in risk of
victimization had lower levels of participation in block associations. Since we know that
crime rates actually were increasing in these neighborhoods and that collective
participation does not seem to be related to actual or perceived crime, the different results
for perceived conditions and a perceived change in conditions may reflect a social
desirability effect: block association participants may be willing to admit that there are
problems (which, after all, justifies the raison d'etre of the organization), but they are less
willing to admit that the problems have gotten worse, which might reflect badly on the
effectiveness of the organization and the future of the block. This interpretation is
consistent with the individual-level comparisons in Table 7.
Constraints on Generalizability
The above questions do point to certain limitations in generalizing from the present
study. The differences in block association participation correlations in Tables 13 and 14
between the total sample of blocks and organized blocks only suggests that there may be
unique social processes occurring on the two types of blocks. The differences between
these processes were explored in only a preliminary way in those tables and in the
comparisons between organized and unorganized blocks (Tables 1 and 12) and in the
regression models using organized vs. all blocks (Table 16). It may be particularly
questionable to generalize from these data about how unorganized blocks might become
organized.
109
Furthermore, the results in Table 11 make it clear that there are some important
(mainly demographic) differences between the neighborhoods selected for this study. It
may be questionable, therefore, to draw conclusions about the entire sample (across all
three neighborhoods) based on block and individual-level data. It would be even more
questionable to infer anything about communities unlike those represented here. Some of
the exceptional features of the sample include: (a) two out of three neighborhoods which
were low-income or working-class and minority yet with a large proportion of
homeowners, (b) all neighborhoods had been experiencing increasing rates of reported
crime while city-wide rates were holding steady or declining, and (c) a housing density
and architectural style that is more crowded and "urban" than most suburban areas but less
so than most of the rest of New York City or other large inner-city residential areas.
The sample is not unique, however. Each of these characteristics describes the
growing "inner ring" of poor and working-class neighborhoods that are now surrounding
the refurbished and gentrified center cities of America. The inhabitants of these
neighborhoods have either moved up and out of poorer inner-city areas or have been
forced out of neighborhoods with rapidly increasing housing costs. With regard to the
rising crime rate, this has been generally true of urban areas over most of the past 30 years.
The brief and slight downward trend in the early to mid-1980s just prior to the collection
of these data was thus more of an anomoly than the upward pattern in the present sample.
Besides, if crime-related factors are largely unrelated to collective participation in high and
rising crime areas, it seems unlikely that they would be more related in areas of low or
decreasing crime, where crime is presumably less of an issue. Again, these neighborhoods
were selected in part to give crime its "best shot" at being a viable catalyst for community
110

organizing.
The sampling issue which poses the most serious constraint to generalizability is
the possible confounding of certain demographic and environmental variables with each
other and with participation rates. For example, with limited variance in the variable
street width, the fact that the widest single block (somewhat of an "outlier" in that it was
the only street with a median strip) happened to have a large number of active participants
may have boosted any correlation between those variables. It is difficult to predict what
other demographic or environmental variables may be confounded in these data. But the
only way to have avoided such problems would have been to use even more selection
criteria (e.g., to exclude blocks with a median). By being somewhat more, rather than less,
inclusive, however, the sample as a whole should be that much more representative.
Understanding the Possible Effects of Participation in Block Associations
According to Table 12, there may be some benefits of block associations, including
collective crime prevention activity and more positive and cohesive social behaviors on the
block (although it is possible that these factors were preexisting and that they encouraged
the development of an organization). The finding that organized blocks had more public
street lighting verifies that that may be the focus of organizational activity on some blocks,
which is why it and a few other environmental items were excluded from the analyses
predicting participation in block associations. Not all of the comparisons between
organized and unorganized blocks were positive, however. For example, organized blocks
had somewhat greater objective physical incivilities than nonorganized blocks.
The many individual-level differences between members of block associations,
111

nonmembers living on organized blocks, and residents of nonorganized blocks (Table 7)
have even greater implications for understanding the social benefits of participation in
block associations. In particular, there was apparently little "free rider" effect (or,
alternatively, little systems-level change): It seems you must individually participate to
reap most of the social benefits of organization. In fact, non-members on organized blocks
scored worse on some variables - including fear of crime, individual protections, and sense
of community - than residents of nonorganized blocks (although the sense of community
and protections effects may be due to nonmembers' lower residential stability and lower
home ownership, which are both associated with those two variables). In any case, the
pattern for those variables in which the means for nonorganized blocks falls between those
of members and nonmembers supports a kind of "polarization" theory of participation: that
organized and nonorganized blocks are made up of the same distribution of people but
when a block organizes (for whatever reason), it separates the "participants" from the
"nonparticipants." The pattern for most of the social benefits of block association
participation fits a qualified, free-rider effect better than a polarization effect, however:
just living on an organized block helps a little on certain variables, but participating helps
significantly on almost every variable.
Implications for "Boosting" Participation in Community Organizations
This dissertation was part of the Block Booster Project, an action study with two
major goals: (a) evaluate the role of block associations in fighting crime, reducing the fear
of crime, and encouraging community social and environmental development and (b)
assess the organizational characteristics of block associations and develop training
112

materials to help block association leaders maintain and strengthen their organizations. In
the larger project, block associations were analyzed longitudinally for characteristics that
distinguished viable groups from those that eventually declined in inactivity. The action
part of the project developed and field tested a survey-guided technical assistance strategy
to help community organizations remain vital and maximize their capacity. This grass-
roots organizational development approach, which is tailored to the specific strengths and
weaknesses of the organization and conditions on each block, was labeled the "Block
Booster Process," and refined through scientist-citizen-practitioner collaboration by two of
the senior members of the research team.
The results of the present study bear on this applied purpose in a variety of ways.
The fact that length of residence, home ownership and income were all positively related
to individual-level, but not block-level, participation suggests that (a) poor and
residentially unstable communities can develop a level of citizen involvement equal to
other communities, but (b) within a given community, those individuals with more
resources and a greater vested interest in property are still more likely to participate. More
important, the correlational results suggests that the social and physical environment of the
community is more important for block - level participation than are demographic
characteristics or crime - related problems, perceptions and fears .
The encouraging implication of this finding is that it gives community organizers
and leaders something to work with in the inevitable challenge to increase and maintain
participation. There is little one can do to manipulate the demographic characteristics of
one's community, aside from moving. Nor is it easy to reduce an entrenched crime or drug
problem at the grass-roots level. As suggested by the positive correlation found between
113

perceived problems and fear, simply informing residents about crime and other problems,
as single-issue and less instrumental community organizations often do, may only make
them afraid and/or pessimistic about solving them. But, with the help of even a fledgling
community development organization, the social climate, transient physical environment
and even the "micro" built environment are somewhat easier to change. For example, a
block clean-up activity can be used to elicit participation directly and indirectly, by
enhancing residents' block satisfaction and encouraging neighboring behavior.
The lack of significant cross-sectional correlation, or mean difference, for
block-level participation in block associations with crime, victimization, fear of crime,
perceptions of crime, and informal social control is noteworthy. It is consistent with recent
reports that peoples' reactions to crime are often more emotionally and behaviorally
debilitating than constructive (Taylor & Perkins, 1987). If one's aim is to increase crime
prevention activities, these data support block associations as an effective conduit. But if
one's aim is to organize and develop communities more generally, the data suggest that
crime may not be the most effective issue around which to organize even urban
communities, like those in this study, that are understandably concerned about crime.
It is possible that the cross-sectional data masks a process in which residents
initially organize in part because of a higher block crime rate, which is then reduced to the
level of the rest of the neighborhood. Whether or not crime is much affected by collective
participation, however, block associations are clearly related to other environmental and,
particularly, individual-level benefits, such as block satisfaction and sense of community,
which may buffer the emotional impact of participants' heightened perception of
incivilities.
114

Indeed, the fact that there was no significant zero-order correlation between fear
and block association participation actually represents an improvement over the results of
traditional victimization prevention programs which have been shown to increase
members' fear (Rosenbaum, 1986). Longitudinal, quasi-experimental research is needed,
however, to determine whether multi-issue organizations can, over time, reduce urban
crime, fear and disorder. Because substantial crime reduction has been such an elusive
finding - one that may depend on more centralized, large-scale political and economic
intervention - and because of the difficulties inherent in measuring crime, many
researchers may wish to focus on issues other than crime to assess the impact of collective
participation. However, the mere fact that high concentrations of community organization
were found in high-crime, lower-income areas (where community development is most
needed but mobilization has proved most difficult) and the fact that those organizations
were associated with greater crime prevention efforts and greater social cohesion and
community satisfaction, at least for its active members, are important findings.
Several of the environmental items expected to be positively related to
participation in block associations turned out to be negatively related. Defensible space
theory recommends the erection of barriers, not only to physically exclude outsiders, but to
promote a sense of ownership and use of the enclosed space and thus greater social
contact. The exact placement of barriers is critical, however. These data suggest that
barriers on private property, as opposed to around the property, may discourage social
contact and cohesion and thus collective participation. Other studies (e.g., Podolefsky,
1983) have found a negative relationship between the informal social cohesion of a
community and the extent of formal participation in the community, as if the latter is an
115
attempt to lend order to the community "artificially." In this study, participation in block
associations was positively associated with social cohesion, as evidenced by block
satisfaction and neighboring, for example.
But the idea of a compensatory effect of participation suggests another possible
interpretation of the contrary environmental results, including the negative relationship of
collective participation to two signs of territoriality (exterior maintenance - i.e., the
opposite of dilapidation - and trees, shrubbery and gardens). Perhaps participation in a
community organization can be viewed, in part, as compensation for certain weaknesses in
the physical environment. Communities with no environmental problems may not need to
organize. But where residents find their block lacking in physical barriers (e.g., fences or
walls) or territorial symbols (e.g., well-maintained property) or in subjectively perceived
quality of life (as evidenced by perceived incivilities), if they also have sufficient social
cohesion they may organize and participate to fulfill these needs in other ways. Whether
or not they are successful at alleviating the original problem, once organized and active,
participants in block associations often work to improve other aspects of the community.
The finding that block satisfaction and fewer perceived problems were related to block
association participation in opposite ways suggests that they should not be combined as
one variable even if they are related to each other (cf. Florin & Wandersman, 1984).
Implications for Understanding Vigilantism and Moral Enterprise
The fact that participation in block associations appears to be less closely
associated with crime and related concerns than expected may be a blessing in disguise.
As explained in the introduction, vigilantism and "moral enterprise" are always a danger
116

when the community acts primarily out of concern over crime, "deviance" and disorder.
The present results support the historical observation that, within high crime
neighborhoods, the most active participants (at the individual, but not the block, level of
analysis) are those with the greatest personal resources, such as owning their home, and
therefore the most vested interest in the security of property (Brown, 1976; Johnson, 1981;
Erikson, 1966). The same is generally true of block-level participation in both collective
and individual victimization prevention. Unlike descriptions of pioneer vigilantism,
however, what Rosenbaum and Sederberg (1976) and others have called "modern
vigilantism" (i.e., law-abiding, collective crime prevention activities) appears to be a
trademark of more organized communities.
The present results also offer a test of Becker's (1963) theory of "moral enterprise"
as applied to organized and informal enforcement of community rules by ordinary citizens.
Contrary to the social reactions theory of deviance, "informal" moral enterprise (social
control) was not significantly related to actual deviance (crime and victimization rates) and
was related to less fear of crime, perceived crime problems, and actual (independently
observed), but not perceived, physical incivilities (disorder). "Formal" moral enterprise
(collective crime prevention) was not significantly related to actual or perceived deviance,
but was related to perceived incivilities. The fact that formal and informal moral
enterprise were both associated with home ownership is consistent with the political
interpretation that reactions to deviance flow from vested interest in protecting one's
property (Schur, 1980). The social climate variables were even more consistently related
to formal moral enterprise, however.
117

Future Research
Additional constructs and measures are needed to enhance our understanding of the
context of citizen participation. The finding that perceived and actual physical incivilities
were generally unrelated is contrary to results by Perkins, Meeks, and Taylor (1989), who
found them to be closely related using similar, but not identical, methods. It underscores
the importance of objectively and independently measuring the physical environment and
suggests that future research should continue to measure both the subjective and objective
community environment and invesitigate the locus of the different results: Are they due to
different survey measures? Different environmental measures? Different populations?
Different cities?
In-person observation of community research sites was found to be important for
another reason. Many researchers are content to have their data collected "in absentia,"
without ever setting foot inside the study area or talking to any of the population. It is
clear from the present study that those who do so risk misinterpretating their data and
losing a rich source of additional, "hands-on" data (Perkins & Wandersman, 1990). Future
research on participation in community organizations would thus do well to combine
quantitative survey, environmental and archival data with more qualitative field
observations and interviews with professional organizers and community leaders.
Analysis of the determinants of participation in other kinds of grassroots
organizations (e.g., tenants' associations, unions, or self-help groups) is also needed to
develop confidence in interpretations. The present results suggest that additional, "real
world" cross-validation would be particularly beneficial for the further development of
theories of vigilantism and "moral enterprise."
118

The vast majority of psychological research, even in community psychology, is
based on individual-level analyses that often confuse individual and various group-level
effects. This study focused on individual and then block-level effects, but did not do so
simultaneosly. It did not provide a direct comparison of effects at the two different levels.
This study also found that there may be important neighborhood-level effects that were
treated here as individual and block-level demographic effects. Future community-based
research should therefore allow for simultaneously teasing out relative effects at all the
relevant levels of analysis.
The interactive nature of the relationship between the more transient social and
physical environment, on the one hand, and citizen participation, on the other, often makes
it difficult to determine which causal direction predominates at any given time or place or
with any given variable. Although the nature of some variables as stable and others as
more transient helped in the interpretation of the present results, the potential confusion
was compounded by the use of a cross-sectional design. Thus, future research should also
be conducted longitudinally to help sort out the problem of causal direction between
collective participation and ecological context.
Implications for Empowerment Theory and Research. The strong, bidirectional
relationship between citizen participation and its psychological correlates has also fueled
confusion over the exact meaning of "empowerment." The term empowerment has
become so overused and ambiguous as to render it practically meaningless. The present
model and block level of analysis suggest one possible clarification which might make this
concept a more useful represention of a key element in individual and community
119

well-being. Zimmerman and Rappaport (1988), in an effort to distinguish psychological
empowerment from other, aggregated levels of empowerment, define the former as "the
connection between a sense of personal competence, a desire for, and a willingness to take
action in the public domain" (p.725). Although their measure of psychological
empowerment does include political efficacy and civic duty as well as cognitive and
personality dimensions, both their measure and the above definition seem to be dominated
by an individualistic psychological orientation, as opposed to a community psychological
or ecological orientation. Just as the environment and social climate may act as catalysts
for collective participation and just as organizations may set the conditions that allow
social support to emerge, empowerment occurs in a context. It is perhaps not so surprising
that, controlling for more permanent social and physical environmental characteristics, the
community-oriented aggregated psychological variables in the present study, such as
neighboring, and satisfaction with community, correlated with the present measure of
citizen participation, which was itself explicitly community-oriented. On theoretical
grounds alone, however, empowerment, even at the psychological level, should have a
clear communitarian, or collectivist, orientation. An alternative definition of
empowerment might thus be: the belief in the potential collective, democratic control over
an institution among the community of participants (clients and workers) in the institution.
This would have the conceptual benefit of distinguishing empowerment from self efficacy
and internal locus of control, which focus on individual behavior, and from informal social
control, which is rarely democratic and can also operate on a purely individual basis.
Furthermore, it might have the practical benefit of steering people toward collective action,
which is likely to be more effective than individual action in solving collective problems.
120

Conclusion. Meanwhile, grassroots leaders are not waiting for the empirical
solution to the issues of causal direction; they will continue to engage the social and
physical environment in order to elicit greater participation and to use participation to
enhance the social and physical context of their communities. Through collaboration with
community organizations, researchers can play an important role by helping community
leaders and public officials plan effective organizing strategies. Investigators should
identify, as precisely as possible, both the environmental and the psychological correlates
of citizen participation so that practitioners and community leaders can know which
realistic strategies are most likely to induce resident involvement in grassroots
organizations. A crucial, but often forgotten, follow up step is to then develop effective
means of dissemination for feeding back to leaders and residents both general information
(e.g., on organizational methods and structure; or on dealing with police and other
agencies) and site-specific data (e.g., local environmental conditions, crime rates, attitudes
and perceived needs) that may be useful in organizing. Finally, researchers should help
grass-roots organizations to evaluate their organizing, organization development and other
participation and leadership enhancement strategies and the effects of participation on
community conditions so that (a) the organizations receive data-based feedback that is
useful and (b) the public policy debate over the use of community organizations to combat
social problems can be empirically well informed. Strong evidence that general-purpose
voluntary associations can play a role in stabilizing neighborhoods and promoting
community development could arm participation advocates with persuasive arguments for
investing social resources in the encouragement of community organizations which
contribute to individual and group empowerment.
121

In 1962, Greer argued that knowledge of the dynamics between neighborhood
conditions and individual characteristics is required to adequately understand social
behavior in its myriad ecological and issue contexts. It is time that communty researchers
and other social scientists take that dictum as axiomatic. One consequence of this
inattention to context is that, despite its promise of relevance and utility, such research has
rarely overcome traditional problems of communication among scientists, practitioners and
citizens. Clear and meaningful communication among these groups is the lifeblood of
healthy and productive collaboration in community research (Chavis, Stucky &
Wandersman, 1983; Perkins & Wandersman, 1990). Not only do researchers usually
speak an unnecessarily "foreign" theoretical and methodological language, but we also
tend to ignore the immediate social and, especially, physical environmental context of
social phenomena in an effort to examine the presumed essence of the behavior, as if it
could be isolated from its setting or the issues which motivate people. Far from helping us
derive universal laws of community behavior, however, a "context-free" focus obscures
the very meaning of the behavior we wish to understand and hinders the communication
that is necessary for effective community intervention.
122

REFERENCES
Ahlbrandt, R., & Cunningham, J. (1979). A new policy for neighborhood
preservation. New York: Praeger.
Altman, I. (1975). The environment and social behavior. New York:
Columbia University Press.
Babbie, E. (1986). The practice of social research. (4th ed.) Belmont,
CA: Wadsworth.
Balkin, S. (1979). Victimization rates, safety, and fear of crime. Social Problems, 26,
343-35.
Barker, R.G. & Gump, P.V. (1964). Big school, small school: High school size and
student behavior. Palo Alto: Stanford Univ. Press.
Becker, F.D. (1977). Housing messages. Stroudsburg, PA: Dowden.
Becker, H. (1963). Outsiders: Studies in the sociology of deviance. New
York: Free Press.
Bellah, R.N., Madsen, R., Sullivan, W.M., Swindler, A. & Tipton, S.M. (1985).
Habits of the heart: Individualism and commitment in American Life. Berkeley,
CA: University of California Press.
Bennett, S.F., & Lavrakas, P.J. (1988). A process evaluation of the Eisenhower
Neighborhood Anti - crime Self - help Program: Summary Report . Evanston,IL:
Center for Urban Affairs and Policy Research.
Brower, S., Dockett, K., & Taylor, R.B. (1983). Residents' perceptions of site-level
features. Environment and Behavior, 15, 419-437.
Brown, B.B., & Altman, I. (1981). Territoriality and residential crime. In P.J.
123

Brantingham & P.L. Brantingham (Eds.), Environmental Criminology (pp. 55-76).
Beverly Hills, CA: Sage.
Brown, B.B., & Altman, I. (1983). Territoriality, defensible space and residential
burglary: An environmental analysis. Journal of Environmental Psychology, 3,
203-220.
Brown, B.B., & Werner, C.M. (1985). Social cohesiveness, territoriality and holiday
decorations: The influence of cul-de-sacs. Environment and Behavior, 17,
539-565.
Brown, R.M. (1976). The history of vigilantism in America. In H.J.
Rosenbaum & & P.C. Sederberg (Eds.), Vigilante Politics (pp.79-109).
Philadelphia, PA: University of Pennsylvania Press.
Chavis, D.M., Hogge, J., McMillan, D., & Wandersman, A. (1986). Sense of
community through Brunswick's Lens. Journal of Community Psychology, 14,
24-40.
Chavis, D.M., Stucky, P.E., & Wandersman, A. (1983). Returning basic
research to the community: A relationship between scientist and
citizen. American Psychologist, 38, 424-434.
Chavis, D.M., & Wandersman, A. (1990). Sense of community in the
urban environment: A catalyst for participation and community
development. American Journal of Community Psychology, 18, 55-82.
Civic Education Foundation, (1985). Citizen Participation, 6 (3).
Clark, M., Chavis, D.M., & Glunt, E. (1988). The 1988 state of the neighborhoods
report. New York: Citizens Committee for New York City.
124

Cohen, J. (1969). Statistical power analysis for the behavioral sciences. New York:
Academic Press.
Cohn, E., Kidder, L., & Harvey, J. (1978). Crime prevention vs. victimization: The
psychology of two different reactions. Victimology: An International Journal, 3,
285-296.
Conklin, J. (1975). The impact of crime. New York: MacMillan.
Cook, J. (1983). Citizen response in a neighborhood under threat.
American Journal of Community Psychology, 11, 459-471.
Craik, K.H., & Appleyard, D. (1980). Streets of San Francisco:
Brunswick's lens model applied to urban inference and assessment.
Journal of Social Issues, 36, 72-85.
Cunningham, J.V., & Kotler, M. (1983). Building neighborhood organizations. Notre
Dame, IN: University of Notre Dame Press.
Curtis, L.A. (Ed.)(1987). Policies to prevent crime: Neighborhood, family, and
employment strategies. Special issue of The Annals of the American Academy of
Political and Social Science, 494.
DuBow, F., McCabe, E., & Kaplan, G. (1979). Reactions to crime: A critical review
of the literature. Washington, D.C.: U.S. Dept. of Justice.
Durkheim, E. (1933). The division of labor in society. (Simpson transl.) Glencoe, IL:
Free Press.
Edelstein, M.R., & Wandersman, A. (1987). Community dynamics in coping with
toxic contaminants. In I. Altman & A. Wandersman (Eds.), Neighborhood and
community environments (pp.69-112). New York: Plenum.
125

Erikson, K. (1966). Wayward puritans: A study in the sociology of deviance. New
York: Wiley.
Erikson, K. (1976). Everything in its path: Destruction of community in the Buffalo
Creek flood. New York: Simon and Schuster.
Fischer, C.S. (1975). Toward a subcultural theory of urbanism. American Journal of
Sociology, 80, 1319-1341.
Flanagan, T.J. & Jamieson, K.M. (1988). Sourcebook of criminal justice statistics -
1987. Washington: U.S. Govt. Printing Office.
Florin, P., Giamartino, G.A., Kenny, D.A., & Wandersman, A. (1990). Clarifying
group influence and climate by separating individual and group effects. Journal of
Applied Social Psychology, 20, 881-900.
Florin, P.R., & Wandersman, A. (1984). Cognitive social learning and participation in
community development. American Journal of Community Psychology, 12,
689-708.
Fowler, F.J., & Mangione, T.W. (1986). A three-pronged effort to reduce
crime and fear of crime: The Hartford Experiment. In D.P. Rosenbaum
(Ed.), Community crime prevention: Does it work? Beverly Hills: Sage.
Gans, H.J. (1962). The urban villagers: Group and class in the life of
Italian - Americans . New York: Free Press.
Gans, H.J. (1967). The Levittowners: Ways of life and politics in a new suburban
community. New York: Random House.
Garofalo, J., & Laub, J. (1978). The fear of crime: Broadening our
perspective. Victimology, 3, 242-253.
126

Gibbs, J. (1966). Conceptions of deviant behavior: The old and the new.
Pacific Sociological Review, 9, 9-14.
Gibbs, L.M. (1983). Community response to an emergency situation: Psychological
destruction and the love canal. American Journal of Community Psychology, 11,
115-126.
Greenberg, S.W., & Rohe, W.M. (1986). Informal social control and crime
prevention in modern urban neighborhoods. In R.B. Taylor (Ed.), Urban
Neighborhoods: Research and Policy. New York: Praeger.
Greenberg, S.W., Rohe, W.M., & Williams, J. (1982). Safe and secure
neighborhoods: Physical characteristics and informal territorial control in high
and low crime neighborhoods. Washington, DC: U.S. Department of Justice.
Greene, J.R., & Taylor, R.B. (1988). Community-based policing and foot
patrol: Issues of theory and evaluation. In J.R. Greene and S.D.
Mastrofski (Eds.), Community policing: Rhetoric or reality? New
York: Praeger.
Greer, S. (1962). The emerging city. New York: Free Press.
Harries, K.D. (1974). The Geography of Crime and Justice. New York:
McGraw-Hill.
Hawkins, R., & Tiedeman, G. (1975). The creation of deviance: Interpersonal and
organizational determinants. Columbus, OH: Merrill.
Heller, K. (1989). The return to community. American Journal of Community
Psychology, 17, 1-15.
Heller, K., Price, R., Reinharz, S., Riger, S., & Wandersman, A. (1984).
127

Psychology and community change: Challenges of the future (2nd Ed.).
Homewood, IL: Dorsey Press.
Hindelang, M., Gottfredson, M., & Garofalo, J. (1978). Victims of personal crime:
An empirical foundation for a theory of personal victimization. Cambridge, MA:
Ballinger.
Hirschi, T. (1973). Procedural rules and the study of deviant behavior.
Social Problems, 21, 159-173.
Hunter, A. (1987). Symbolic communities. Chicago: University of Chicago
Press.
Hyman, H., & Wright, C. (1971). Trends in voluntary association memberships of
American adults: Replication based on secondary analysis of national sample
surveys. American Sociological Review, 36, 191-206.
Jacobs, J. (1961). The death and life of great American cities. New
York: Random House.
Johnson, D. (1981). Vigilance and the law: The moral authority of popular justice in
the far West. American Quarterly, 33, 558-586.
Kahn, S. (1982). Organizing: A guide for grass - roots leaders . New York:
McGraw-Hill.
Kitsuse, J. (1972). Deviance, deviant behavior and deviants: Some conceptual
problems. In W. Filstead (Ed.), An introduction to deviance. Chicago, IL:
Markham.
Lauderdale, P. (1976). Deviance and moral boundaries. American Sociological
Review, 41, 660-676.
128

Lavrakas, P.J. (1985) Citizen self-help and neighborhood crime prevention policy. In
L. Curtis (Ed.), American violence and public policy. New Haven: Yale
University Press, 87-116.
Lemert, E. (1967). Human deviance, social problems and social control.
Englewood Cliffs, NJ: Prentice-Hall.
Levine, J. (1976). The potential for crime over-reporting in crime
victimization surveys. Criminology, 14, 307-330.
Levine, M., & Perkins, D.V. (1987). Principles of community psychology:
Perspectives and applications. New York: Oxford University Press.
Lewis, D. (Ed.)(1981). Reactions to crime. Beverly Hills, CA: Sage.
Lewis, D. & Maxfield, M. (1980). Fear in neighborhoods: An investigation of the
impact of crime. Journal of Research on Crime and Delinquency, 17, 160-179.
Manning, P. (1973). On deviance. Contemporary Sociology, 2, 123-128.
McKenzie, R. (1923/1970). The neighborhood: A study of local life in the city of
Columbus, Ohio. New York: Arno Press.
McMillan, D.W., & Chavis, D.M. (1986). Sense of community: A definition
and theory. Journal of Community Psychology, 14, 6-23.
Merry, S.E. (1981). Urban danger: Life in a neighborhood of strangers.
Philadelphia: Temple University Press.
Miller, F., Tsemberis, S., Malia, G., & Grega, D. (1980). Neighborhood
satisfaction among urban dwellers. Journal of Social Issues, 36, 101-
117.
129

Mischel, W. (1973). Toward a cognitive social learning
reconceptualization of personality. Psychological Review, 80,
252-283.
Moynihan, D.P. (1969). Maximum feasible misunderstanding: Community action in
the war on poverty. New York: Free Press.
Newman, O. (1972). Defensible space: Crime prevention through urban design. New
York: MacMillan.
Newman, O. (1975). Community of interest. New York: Doubleday.
Newman, O. & Franck, K. (1982). The effects of building size on personal
crime and fear of crime. Population and Environment, 5, 203-220.
O'Brien, R.M. (1985). Crime and victimization data. (Vol. 4, Law and
Criminal Justice series). Beverly Hills: Sage.
Pennell, F. (1978). Collective vs. private strategies for coping with crime. Journal of
Voluntary Action Research, 7, 59-74.
Perkins, D.D. (1985). Blocking crime with block associations. Citizen Participation, 6
(3), 18-19.
Perkins, D.D., Meeks, J.W., & Taylor, R.B. (1989). Objectively measuring the crime
and fear-related physical environment of residential areas: The Block
Environmental Inventory. In R.B. Taylor (Ed.), Mental health: Coping with urban
crime and fear. Final Report to the National Institute of Mental Health.
Philadelphia: Temple University Department of Criminal Justice.
Perkins, D.D., & Taylor, R.B. (1987). Validating fear of crime: Community
perceptions and on mental health impacts. Paper presented to the Annual
130

Convention of the American Society of Criminology, Montreal.
Perkins, D.D., & Wandersman, A. (1990). "You'll have to work to overcome our
suspicions:" Benefits and pitfalls of research with community
organizations. Social Policy, 21 (1), 32-41.
Perkins, D.V., Burns, T.F., Perry, J.C., & Nielsen, K.P. (1988).
Ecological psychology and community psychology: An analysis and
critique. Journal of Community Psychology, 16, 355-372.
Podolefsky, A. (1983). Case Studies in community crime prevention.
Springfield, IL: Thomas.
Podolefsky, A., & DuBow, F. (1981). Collective responses to crime in urban
America. Springfield, IL: Charles C. Thomas.
Quinney, R. (1974). Critique of legal order. Boston: Little-Brown.
Rappaport, J. (1977). Community psychology: Values, research and action.
New York: Holt, Rinehart & Winston.
Rappaport, J. (1981). In praise of paradox: A social policy of empowerment over
prevention. American Journal of Community Psychology, 9, 1-25.
Reiss, A.J., & Tonry, M. (Eds.) (1986). Communities and Crime. Chicago,
IL: University of Chicago Press.
Reppetto, T. (1974). Residential crime. Cambridge, MA: Ballinger.
Rich, R. (1980). Dynamics of leadership in neighborhood organizations.
Social Science Quarterly, 60, 570-587.
Rieder, J. (1985). Canarsie: The Jews and Italians of Brooklyn against Liberalism.
131

Cambridge, MA: Harvard University Press.
Riesman, D. (1961). The lonely crowd. New Haven, CT: Yale University
Press.
Riessman, F. (1986). The new populism and the empowerment ethos. In H.C.Boyte &
F. Riessman (Eds.), The new populism: The politics of empowerment (pp.53-63).
Philadelphia: Temple University Press.
Riger, S., Gordon, M., & LeBailly, R. (1982). Coping with urban crime: Women's use
of precautionary behaviors. American Journal of Community Psychology, 10,
369-386.
Rosenbaum, D.P. (1986). Communities Crime Prevention: Does it work?
Beverly Hills, CA: Sage.
Rosenbaum, D.P. (1988). Community Crime Prevention: A review and
synthesis of the literature. Justice Quarterly, 5, 323-395.
Rosenbaum, D.P., Lewis, D.A., & Grant, J.A. (1986). Neighborhood-based crime
prevention: Assessing the Efficacy of community organizing in Chicago. In D.P.
Rosenbaum (Ed.), Communities Crime Prevention: Does it work? (pp. 109-133).
Beverly Hills, CA: Sage.
Rosenbaum, H.J., & Sederberg, P.C. (Eds.) (1976). Vigilante Politics.
Philadelphia, PA: University of Pennsylvania Press.
Rosenberg, M., Stebbins, R., & Turowetz, A. (Eds.)(1982). The sociology of
deviance. New York: St. Martin's Press.
Ross, C.E., & Mirowsky, J. (1987). Normlessness, powerlessness, and
trouble with the law. Criminology, 25, 257-278.
132

Sarchet, B.B. (1955). Block groups and community change: An evaluation of the
block program of the Hyde Park-Kenwood Community Conference. Chicago:
Human Dynamics Laboratory, University of Chicago.
Schervish, P. (1973). The labelling perspective. The American Sociologist, 8, 47-56.
Schneider, A. & Schneider, P. (1977). Private and public - minded citizen responses to
a neighborhood - based crime prevention strategy . Eugene, OR: Institute for Policy
Analysis.
Schur, E. (1980). The politics of deviance: Stigma contests and the uses of power.
Englewood Cliffs, NJ: Prentice-Hall.
Scott, W.A., & Wertheimer, M. (1962). Introduction to psychological research. New
York: Wiley.
Seligman, M.E.P. (1975). Helplessness: On depression, development and death. San
Francisco: Freeman.
Sennett, R. (1979). What Tocqueville feared. In H.J.Gans, N.Glazer, J.R.Gusfield &
C.Jencks (Eds.), On the making of Americans: Essays in honor of David Riesman
(pp. 105-126). Philadelphia: University of Pennsylvania Press.
Shinn, M. (in press). Mixing and matching: Levels of conceptualization,
measurement, and statistical analysis in community research. In P. Tolan, C. Keys,
F. Chertok & L. Jason (Eds.), Researching community psychology: Integrating
theories and methods. Washington, DC: American Psychological Association.
Shotland, R.L., & Goodstein, L. (1984). The role of bystanders in crime
control. Journal of Social Issues, 40, 9-26.
Shumaker, S.A., & Taylor, R.B. (1983). Toward a clarification of people-place
133

relationships: A model of attachment to place. In N.R.Feimer & E.S.Geller (Eds.),
Environmental psychology: New directions and perspectives. New York: Praeger.
Skogan, W. (1986). Fear of crime and neighborhood change. In A.J. Reiss & M.
Tonry (Eds.), Communities and crime (pp.203-230). Chicago: University of
Chicago Press.
Skogan, W., & Maxfield, M. (1981). Coping with crime: Individual and
neighborhood reactions. Beverly Hills, CA: Sage.
Taylor, I. (1982). Moral enterprise, moral panic and law and order campaigns. In
M.M. Rosenberg, R.A. Stebbins, & A. Turowitz (Eds.), The sociology of
deviance. New York: St. Martin's Press.
Taylor, I., Walton, P., & Young, J. (1973). The new criminology: For a social theory
of deviance. New York: Harper & Row.
Taylor, R.B. (1987). Toward an environmental psychology of disorder: Delinquency,
crime, and fear of crime. In D. Stokols & I. Altman (Eds.), Handbook of
environmental psychology: Volume 2 (pp. 951-986). New York: Wiley.
Taylor, R.B. (1988). Human territorial functioning: An empirical, evolutionary
perspective on individual and small group territorial cognitions, behaviors and
consequences. Cambridge, England: Cambridge University Press.
Taylor, R.B., & Covington, J. (1988). Neighborhood changes in ecology and
violence. Criminology, 26, 553-589.
Taylor, R.B., & Gottfredson, S.D. (1986). Environmental design, crime, and
prevention: An examination of community dynamics. In A. Reiss & M. Tonry
(Eds.), Communities and Crime (163-202). Chicago: University of Chicago Press.
134

Taylor, R.B., Gottfredson, S.D., & Brower, S. (1980). The defensibility of defensible
space: A critical review and a synthetic framework for future research. In T.
Hirschi & M. Gottfredson (Eds.), Understanding crime (pp. 53-71). Beverly Hills:
Sage.
Taylor, R.B., Gottfredson, S.D., & Brower, S. (1984). Block crime and
fear: Defensible space, local social ties, and territorial
functioning. Journal of Crime and Delinquency, 21, 303-331.
Taylor, R.B., & Hale, M. (1986). Testing alternative models of fear of
crime. Journal of Criminal Law and Criminology, 77, 151-189.
Taylor, R.B., & Perkins, D.D. (1988). Fear of crime, stress and coping, and changes
in street block mental health. Paper presented to the Annual Convention of the
American Psychological Association, Atlanta.
Taylor, R.B., Perkins, D.D., Shumaker, S.A., & Meeks, J. (1989). Impacts over time
of fear of crime and support on mental health: A stress and coping framework. In
R.B. Taylor (Ed.), Mental health: Coping with urban crime and fear. Final Report
to National Institute of Mental Health. Philadelphia: Temple University Dept. of
Criminal Justice.
Taylor, R.B., Shumaker, S. & Gottfredson, S. (1985). Neighborhood-level links
between physical features and local sentiments. Journal of Architectural Planning
and Research, 2, 261-275.
Taylor, R.B., & Stough, R.R. (1978). Territorial cognition: Assessing Altman's
typology. Journal of Personality and Social Psychology, 36, 418-422.
Toch, H., & Grant, J.D. (1982). Reforming human services: Change through
135
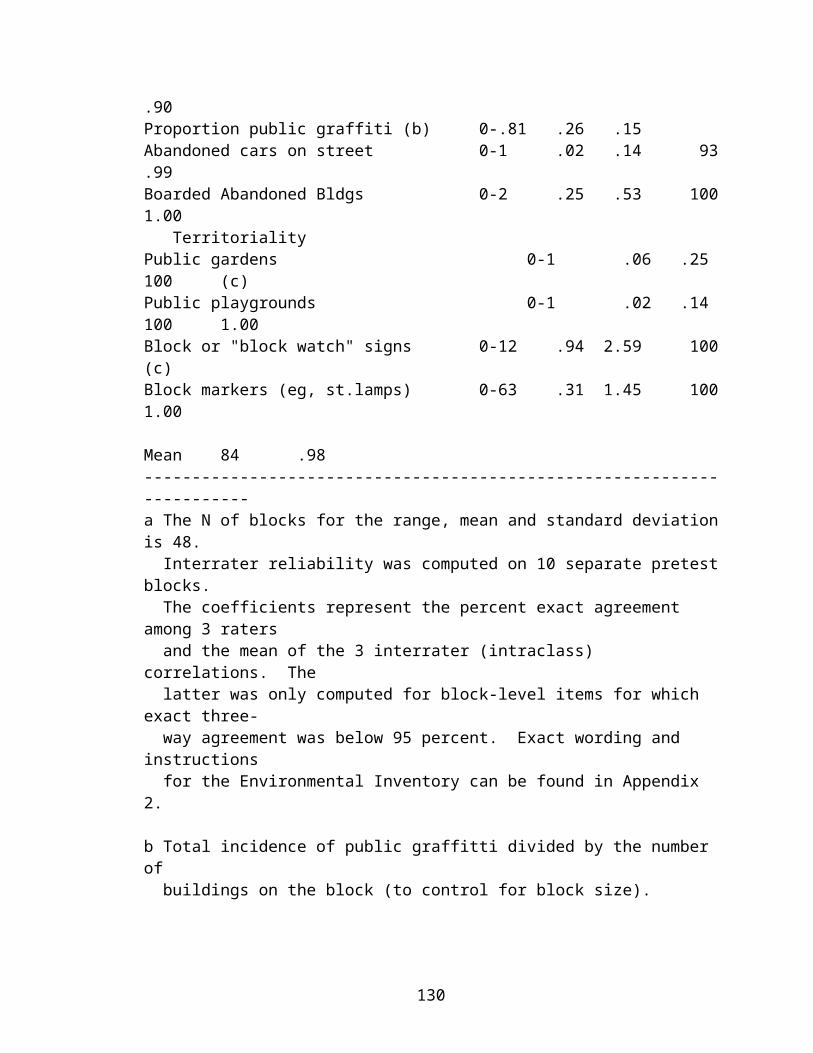
participation. Beverly Hills: Sage.
Tocqueville, A. de (1935/1969). Democracy in America. (G. Lawrence,
Trans.; J.P. Mayer, Ed.). New York: Doubleday.
Trickett, E.J., Kelly, J.G., & Vincent, T.A. (1985). The spirit of ecological inquiry in
community research. In E.C. Susskind & D.C. Klein (Eds.), Community research:
Methods, paradigms, and applications (pp. 283-333). New York: Praeger.
Unger, D.G. & Wandersman, A. (1982). Neighboring in an urban
environment. American Journal of Community Psychology, 10, 493-510.
Unger, D.G. & Wandersman, A. (1983). Neighboring and its role in block
organizations. American Journal of Community Psychology, 11, 291-300.
Unger, D.G. & Wandersman, A. (1985). The importance of neighbors: The social,
cognitive, and affective components of neighboring. American Journal of
Community Psychology, 13, 139-170.
Unger, R.M. (1975). Knowledge and politics. New York: Free Press.
Verba, S., Nie, N.H., & Kim, J. (1978). Participation and equality: A seven nation
comparison. New York: Cambridge University Press.
Vincent, T., & Wiecking, F. (1989). National service: Legislating a sense of
community service. The Community Psychologist, 22 (3), 8-9.
Wandersman, A., Florin, P., Chavis, D.M., Rich, R.C., & Prestby, J. (1985). Getting
together and getting things done. Psychology Today, 65-71.
Wandersman, A., Florin, P., Friedman, R., & Meier, R. (1987). Who participates,
who does not, and why? An analysis of voluntary neighborhood organizations in
the United States and Israel. Sociological Forum, 2, 534-555.
136

Wandersman, A., Jakubs, J., & Giamartino, G. (1981, Sept./Oct.).
Participation in block organizations. Community Action, 40-47.
Warren, D.I. (1986). The helping roles of neighbors: Some empirical patterns. In
R.B. Taylor (Ed.), Urban neighborhoods: Research and policy. New York:
Praeger.
Washnis, G. (1976). Citizen involvement in crime prevention. Lexington,
MA: Heath.
Williams, J.A., Babchuk, N., & Johnson, D.R. (1973). Voluntary associations and
minority status: a comparative analysis of anglo, black and Mexican-Americans.
American Sociological Review, 38, 637-646.
Wilson, J.Q., & Kelling, C. (1982, March). The police and neighborhood safety:
Broken windows. Atlantic, 127, 29-38.
Yates, D. (1973). Neighborhood democracy. Lexington, MA: Heath.
Yin, R.K. (1986). Community crime prevention: A synthesis of 11 evaluations. In
Rosenbaum (Ed.), Community crime prevention: Does it work? Beverly Hills,
CA: Sage.
Zimmerman, M.A., & Rappaport, J. (1988). Citizen participation, perceived control,
and psychological empowerment. American Journal of Community Psyc hology, 16 ,
725-750.
137

APPENDIX 1: NEW YORK CITY BLOCK SURVEY TELEPHONE INTERVIEW 1985-86 BLOCK BOOSTER (NEW YORK CITY) TELEPHONE SURVEY:
SELECTED ITEMS & SCALES
Scales published in appendices of: Perkins, D.D., Florin, P., Rich, R.C., Wandersman, A. & Chavis, D.M. (1990). Participation and the social and physical environment of residential blocks: Crime and community context. American Journal of Community Psychology, 18, 83-115. AND Long, D.A., & Perkins, D.D. (2003). Confirmatory Factor Analysis of the Sense of Community Index and Development of a Brief SCI. Journal of Community Psychology, 31 , 279-296.
SENSE OF COMMUNITY INDEX (SCI)1 (alpha) = .80, n=720) (True/False): I am going to read some things that people might say about their block. Each time I read one of these statements, please tell me if it is mostly true or mostly false about your block simply by saying "true" (2=MORE SOC) or "false" (1=LESS SOC).SOC1T1 [V7]. I think my block is a good place for me to live. SOC2T1 [V8]. People on this block do not share the same values. (reverse)SOC3T1 [V9]. My neighbors and I want the same things from the block. SOC4T1 [V10]. I can recognize most of the people who live on my block.SOC5T1 [V11]. I feel at home on this block.SOC6T1 [V12]. Very few of my neighbors know me. (reverse)SOC7T1 [V13]. I care about what my neighbors think of my actions. SOC8T1 [V14]. I have almost no influence over what this block is like. (reverse)SOC9T1 [V15]. If there is a problem on this block people who
18-item Brief Sense of Community Index (BSCI): Coefficient α = .65 (Time-1; N = 713), .73 (Time-2; N = 422): Factors/Subscales: MC = Mutual Concerns: SOC3T1 (v9), SOC9T1 (v15), NBRWTCT1 (v6) [coefficient α = .50 (Time-1; N = 820), .64 (Time-2; N = 485)]; SC = Social Connections: SOC4T1 (v10), SOC6T1 (v12), SOC8T1 (v14) [coefficient α = .55 (Time-1; N = 917), .50 (Time-2; N = 544)]; CV = Community Values: GENSOCT1 (v20), IMPSOCT1 (v21) [coefficient α = .51 (Time-1; N = 1040), .61 (Time-2; N = 621)].
Place Attachment Scale based on SCI items (in the order they appear in the data set): Std item scale Alpha = .65)ZSOC1T1 (std version of v7)ZSOC5T1 (std version of v11)ZSOC10T1 (std version of v16)ZSOC12T1 (std version of v18)
138

live here can get it solved. SOC10T1 [V16]. It is very important to me to live on this particular block. SOC11T1 [V17]. People on this block generally don't get along with each other. (reverse)SOC12T1 [V18]. I expect to live on this block for a long time.
SEPARATE ITEMS:NBRWTCT1 [V6]. In general, would you say that people on your block watch after each other and help out when they can (3), or do they pretty much go their own way (1)? (“a little of both”=2)GENSOCT1 [V20]. Some people say they feel like they have a sense of community with the people on their block; others don’t feel that way. How about you: would you say that you feel a strong sense of community with others on your block (3), very little sense of community (1), or something in between (2)?IMPSOCT1 [V21]. Would you say that it is very important (3), somewhat important (2) or not important (1) to you to feel a sense of community with the people on your block? V19. Most people who live on this block would be able to tell if someone was a stranger or a block resident. (1=false, 2=true)
Recommendation for future use of BSCI: reword the 3 face-valid items [NBRWTCT1 (v6), GENSOCT1 (v20), IMPSOCT1 (v21)] as follows:"In general, people on my block watch after each other and help out when they can." "I feel a strong sense of community with others on my block." "It is very important to me to feel a sense of community with the people on my block."And put all 8 BSCI items on a 4 or 5-point scale [from "strongly agree" to "strongly disagree"].
COMMUNITARIANISM (alpha = .68, n=1009): IMPSOCT1 [V21]. Would you say that it is very important (3), somewhat important (2) or not important (1) to you to feel a sense of community with the people on your block? V66. Some people care a lot about the block they live on; for others the block is not important. How important is what your block is like to you? (1=not, 2= somewhat, 3=very) V67. How important is it to you that people on your block work together to improve block conditions? (1=not, 2= somewhat, 3=very)V68. How important is it to you that you be actively involved in any efforts that residents might make to improve your block? (1=not, 2= somewhat, 3=very)
PERCEIVED BLOCK ASSOCIATION EFFICACY (alpha = .82, n=901):
139

(If a block association was formed here) how likely is it that the association could accomplish each goal: (1=not likely, 2=somewhat likely, 3=very likely) Improve physical conditions on the block like cleanliness or housing upkeep? Persuade the city to provide better services to people on the block? Get people on the block to help each other more? Reduce crime on the block? Get people who live on the block to know each other better? Get information to residents about where to go for the services they need? Provide programs for young people on the block?
BLOCK SATISFACTION (alpha = .59, n=818): All things considered, how satisfied are you with this block as a place to live? (1=dissatisfied, 2=satisfied)
Comparing your block to other blocks in the area, is your block a better place to live (3), a worse place to live (1) or about the same (2)?
In the past two years, have the general conditions on your block gotten worse (1), stayed about the same (2) or improved (3)?
In the next two years, do you feel that general conditions on your block will get worse (1), stay about the same (2) or improve (3)?
PERCEPTION OF BLOCK PROBLEMS: Please tell me if (each of the following) is a serious problem (3), a minor problem (2) or no problem at all (1) on your block:Perceived Crime/delinquency Problems (alpha = .78, n=813) Vandalism (eg: breaking windows, painting on cars or walls)? Drug dealing? Groups of young people hanging around? Robbery or assault of people on the street? Burglary of homes when people are away? Perceived Incivilities (alpha = .65, n=1052) People who don't keep up their property? Poor sanitation services (eg: trash collection, sewers)? Litter?
FEAR OF CRIME (1=very safe, 2=fairly safe, 3=unsafe; alpha = .62, n=1056): How safe would feel being out alone on the block during the day? How safe would feel being out alone on the block at night?
140
INFORMAL SOCIAL CONTROL (alpha = .59, n=720): If someone on the block was letting trash pile up in their yard or on their steps, how likely is it that a neighbor would go to that person and ask that they clean up? (1=unlikely, 2=likely)
If some 10 to 12_year_old kids were spray painting the sidewalk on the block, how likely is it that some of the neighbors would tell them to stop? (1=unlikely, 2=likely)
If a suspicious stranger was hanging around the block, how likely is it that some of the neighbors would notice this and warn others to be on guard? (1=unlikely, 2=likely)
NEIGHBORING BEHAVIOR (total scale (given + received) alpha = .76, n=999) Neighboring given: I am going to read a short list of things neighbors might do for each other. Each time I read one, please tell me if, in the past year, you have been asked to do that for any of your neighbors on this block. If yes, how many? (exact #: 0-7, 8=8 or more) Watch a neighbor's house while they are away? Loan a neighbor some food or a tool? Help a neighbor in an emergency? Offer a neighbor advice on a personal problem? Discuss a problem on the block with a neighbor? Neighboring received:Which, if any, of the things on (the above) list has at least one of your neighbors on this block done for you in the past year? (1=no (not mentioned), 2=yes (mentioned))
PARTICIPATION IN BLOCK ASSOCIATION ACTIVITIESWould you say that this block association is very active (3), moderately active (2), or largely inactive? (1)
Have you ever taken part in an activity sponsored by the block association? (1=no, 2=yes)
Thinking about work you might do for the block association outside of meetings, how many hours would you say you give to the association each month, if any? (0-7=exact hours, 8=8 or more)
We would like to know what kinds of things people have done in the association. In the past year, have you (1=no, 2=yes): Attended a meeting?Spoken up during a meeting?Done work for the organization outside of meetings?Served as a member of a committee?
141

Served as an officer or as a committee chair? [The block-level participation measure also includes several items from the block association member survey: the last four items above and six others (1=no, 2=yes):]In the past 12 months, have you... Helped organize activities (other than meetings) for the association?Participated in activities other than meetings (block party, clean-up)?Tried to recruit new members?Tried to get people out for meetings and activities?Served as a representative of the association to other community groups?Worked on other block association activities?
DEMOGRAPHICS Thinking about your total family income in [LAST CALENDAR YEAR], which of the following categories did it fall into? (1=under $10K, 2=$10-20K, 3=$20-30K, 4=$30-40K, 5=over $40K)
What was the highest level of education you completed? (1=8th grade or less, 2=some high school, 3=high school graduate, 4=vocational school beyond high school, 5=some college, 6=college graduate, 7=post graduate education)
Which of the following categories describes your race? (1=Black, 2=Hispanic, 3=White, 4=Asian/Oriental, 8=other)
How long have you lived at this address? (1= <2 yrs., 2=2 to 5 yrs, 3=5 to 10 yrs, 4=10+ years)
Do you own your home or are you renting? (1=own, 2=rent)
CRIMINAL VICTIMIZATION Have you or any member of your household been the victim of a crime in the past three years? (1=no, 2=yes) What was the crime? (1=theft, 2=burglary, 3=robbery, 4=rape, assault or murder, 5=”bunko”, confidence theft, forgery, 6=vandalism, 8=other)
How long ago did this happen? (1=< 1 yr., 2=1-2 yrs., 3=2-3 yrs., 4=>3 yrs.)
Did this crime happen on this block (1), elsewhere in this neighborhood (3), or at some other place altogether (4)?
Do you know of anyone living on this block who has had their home broken into in the past year? (1=no, 2=yes)
Do you know of anyone who has been assaulted while on the street on this block in the past year? (1=no, 2=yes)
Block Booster Telephone Survey (Time 1):Perkins, D.D., Brown, B.B., & Taylor, R.B. (1996). The
142

ecology of empowerment: Predictingparticipation in community organizations. Journal of Social Issues, 52, 85-110. Perkins, D.D., Wandersman, A., Rich, R., & Taylor, R. (1993). The physical environment of street
crime: Defensible space, territoriality & incivilities. Journal of Environmental Psychology, 13, 29-
49.Perkins, D.D., Florin, P., Rich, R.C., Wandersman, A. & Chavis, D.M. (1990). Participation and the social and physical environment of residential blocks: Crime and community context. American Journal of Community Psychology, 17, 83-115. . ^,vl_ ^
Q1 Let me begin by asking how long have you lived at this address? VI LENGTH OF RESDEflCE_______
1 LESSTHAN 2 YRS2 2 TO 5 YRS3 5 to 10 YRS4 10 OR MORE YRS79DK NAQ2 All things considered, how satisfied are you with this block as a place to live -- would you say that you are satisfied, dissatisfied or neither?
V2 SATISFACTION WITH BLOCK1 DISSATISFIED2:6c SATISFIED7 DK 9 NAQ3 Comparing your block to other blocks right around it, would you say that your block is a better place to live, a worse place to live or about the same as other blocks in the area?
V3 COMPARING WITH OTHER BLOCKS . . •1 WORSEPLACE2 3£ ABOUT THE SAME3 22 BETTER PLACE7 DK 9 NAQ4 In the past two years, have the general conditions on your block
gotten worse, stayed about the same or improved? V4 BLOCK CONDITIONS PAST TWO YEARS
1 GOTTEN WORSE2X3tABOUT THE SAME3XS IMPROVED79
143

DK NAQ5 In the next two years, do you feel that general conditions on
your block will get worse, stay about the same or improve? V5 BLOCK CONDITIONS NEXT TWO YEARS
1 GET WORSE22 ABOUT THE SAME33 IMPROVE7 DK 9 NA
PAGE 4Q6 In general, would you say that people on your block watch after each
other and help out when they can, or do they pretty much go their own way
V6 NEIGHBORS WATCH AFTER EACH OTHER1 GO OWN WAY2 2 A LITTLE OF BOTH3 £ WATCH AFTER7 DK 9 NAI am going to read some things that people might say about their block. Each time I read one of these statements, please tell me if it is mostly true or mostly false about your block simply by saying "true" or "false". MORE SOC LESS SOC
* 2 frJmm 1*=J«WB 7=DK 9=NA -SENSE OF COlJlUNITYV7 Q7 I think my block is a good place for me to live.V8 Q8 People on this block do not share the same values.V9 Q9 My neighbors and I want the same things from the block.
V10 Q10 I can recognize most of the people-who live on my block.
Vll Q11 I,feel at home on this block.V12 Q12 Very few of my neighbors know me.V13 Q13 I care about what my neighbors think of my actions.
V14 Q14 I have almost no influence over what this block is like.
V15 Q15 If there is a problem on this block people who live here can get it solved.
V16 Q16 It is very important to me to live on this particular block.
VI7 Q17 People on this block generally don't get along with each other.
V18 Q18 I expect to live on this block for a long time.VI9 Q19 Most people who live on this btock would be able to tell if someone was a stranger or a block resident.
144

TOTSOC = V7+V8+V9+V10+Vll+V12+V13+Vl4-fV15+V16+V17+V18 SOCNEED= V7+V8+V9 SOCMEM = V10+V11+V12 SOCINF = V13+V14+V15 SOCEMOT = V16+V17+V18
*Note: Appropriate reversals of V7-V19 were done to result in this coding format being correct for each item (eg. V8, V12, V14, V17 were reversed)
PAGE 5Q20 Some people say they fee! like they have a sense of community with the people on their block; others don't feel that way. How about you; would you say that you feel a strong sense of community with others on your block, very little sense of community or something
in between?V20 GENERAL SENSE OF COMMUNITY1 VERY LITTLE SENSE OF COMMUNITY 22 SOMETHING IN BETWEEN 3S STRONG SENSE OF COMMUNITY
7 DK9 NAQ21 Would you say that it is very important, somewhat important or not important to you to feel a- sense of community with the people
on your block?V21 IMPORTANCE OF SENSE OF COMMUNITY1 NOT IMPORTANT 23 SOMEWHAT IMPORTANT 3S VERY IMPORTANT7 DK9 NAI SOCINC = V20 x V21 |Q22 How many, if any, of the people who live on your block do you
get together with socially at least three or four times a year? V22 NUMBER NEIGHBORS SOCIALIZED WITH
ON ONE1-7 EXACT NUMBER8 8 OR MORE ____9 DK/NAI am going to read a short list of things neighbors might do for each other. Each time I read one, please tell me if, in the past year, you have been asked to do that for no one, for one or two, or for several of your neighbors on this block. PAUSE
V23-V27 NEIGHBORING GIVEN7=DK ' 9=NAV23Q23 Watch a neighbor's home while they were away.V2AQ24 Loan a neighbor some food or a tool.V25Q25 Help a neighbor in an emergencey.V26Q26 Offer a neighbor advise on a personal problem.
145

V27Q27 Discuss a problem on the block with a neighbor.0 NONE 1-7 EXACT NUMBER8 8 OR MORE9 DK/NANEIBGIVE = V23+V24+V25+V26+V27
PAGE 6Which, if any, of the things on that list has at least one of your neighbors on this block done for you in the past year?
2 JyYES (MENTIONED) 1 S=NO (NOT MENTIONED) 7=DK 9=NA
r28 Q28 WATCH THE HOUSEr29 Q29 LOAN FOOD OR A TOOL'30 Q30 HELP IN AN EMERGENCY31 Q31 OFFER ADVISE ON A PERSONAL PROBLEM32 Q32 DISCUSS A PROBLEM ON THE BLOCKQ33 OTHERNEIBGET = V28+V29+V30+V31+V32 TOTNEIB = NEIBGIVE + NEIBGETNow lets go to some questions about how people on your block might react to different situations.
Q34 If someone on the block was letting trash pile up in their yard or on their steps, how likely is it that a neighbor would go to that person and ask that they clean up -- likely, unlikely or neither?
V34 INFORMAL SOCIAL CONTROL 1LIKELY (HIISC)UNLIKELY (LOISC:7 DK/DEPENDS 9 NAQ35 If some 10 to 12 year old kids were spray painting the sidewalk on the block, how likely is it that some of the neighbors would tell them to stop -- likely, unlikely or neither?
V35 INFORMAL SOCIAL CONTROL 22 fc LIKELY (HIISC)UNLIKELY (LOISC)7 DK/DEPENDS 9 NAQ36 If a suspicious stranger was hanging around the block, how likely is it that some of the neighbors would notice this and warn others to
be on guard? V36 INFORMAL SOCIAL CONTROL 32 fc LIKELY (HIISC)1 3c WSPPffiK UNLIKELY (LOISC)7 DK/DEPENDS 9 NA.-V34+V35+V36
PAGE 7
146

Q37 Next I would like to know how you fee! about conditions on your block and the need for action on them. Tell me which one of these three statements best describes your view at this time:
V37 READINESS FOR CHANGE__________________________1 Idon't feel any need to take action to change the block. PRECONTEMPLATION
2 3 I am thinking seriously about doing something to change the block. CONTEM
3 $I am actively doipg something to r.hange thp. hlnrk ——ACTION__________
7 DK 9 NAThe next part of the survey is about problems you may have on your block First, here is a list of problems that some people tell us they have on their blocks. Each time I name one, please tell me if it is a serious problem, a minor problem or no problem at all on your block at this timeI 3*=SERIOUS PROBLEM ^3=MINOR PRQBI.PM l9c=NO PRnmnTI 7=DK 9=NA
38 Q38 People who don't keep up their property.39 Q39 Poor sanitation services. (EG: TRASH COLLECTION, SEWERS)
40 Q40 Vandalism. (EG: BREAKING WINDOWS, PAINTING ON CARS OR WALLS)
41 Q41 Drug dealing.42 Q42 Litter.43 Q43 Problems with parking and traffic control.i4 Q44 Groups of young people hanging around.t5 Q45 Robbery or assault of people on the street.t6 Q46 Burglary of homes when people are away.(7 Q47 Poor street maintenance. (EG: POTHOLES)BPROB= V38+V39+V40+V41+V42+V43+V44+V45+V46+V47 PROBCRIM = V40+V41+V44+V45+V46 PROBOTHR = V38+V39+V42
ENCOD= W2+V3+V4+V5+LOPROB
PAGE 8Q48 Now let me ask some questions about security on your block. First, in the past year, would you say that the amount of street crime on your block has increased, de^Trea^ed orx stayed about the same?,
V48 PERCEPTION OF BLOCK SE?3 Ic INCREASED2 ft STAYED THE SAME1S DECREASEDT 9DK NA
147

- f 0T>Q49 How safe would you feel being out alone on your block during the day -- would you feel very safe, fairly safe or unsafe?
V49 FEELINGS OF SAFETY DURING DAY1 VERY SAFE 23: FAIRLY SAFE 3 5 UNSAFE79DK NAQ50 How safe would you feel being out alone on your block at night --would you feel very safe, fairly safe or unsafe?
V50 FEELING OF SAFETY DURING NIGHT' \ VERY SAFE2 3: FAIRLY SAFE3 5c UNSAFE79DKNAFEARCRIM = V49+V50I am going to name s5me things that people might do to protect themselves from crime. Each time I name one, please tell me if you have taken that action to protect yourself or your property from crime by saying "yes" or "no".|2 3t=YES 138FNO 7=DK 9=NA
11 Q51 Started going out less at night.12 Q52 Put extra locks on doors or windows.3 Q53 Started leaving lights on when not at home.4 Q54 Installed outside lighting for security.5 Q55 Put identification numbers on your property or had the police do it for you.
6 Q56 Had neighbors watch your house while you were out.7 Q57 Joined a neighborhood or block watch program.8 Q58 Taken part in a civilian patrol on your block or neighborhood.
GRPACT = V57+V58INDACT = V52+V53+V54+V56PAGE 9Q59 Have you or any member of your household been the victim of a crime
in the past three years? 'V59 CRIME TICTIM[(SKIP TO Q64) 7=DK 9=NAQ60 What was the crime?BKbAKING AND LNFbRING (EG: STOLEN CAR)————2 BUGLARY OR HOUSEBREAKING3 ROBBERY (INCLUDING PURSE SNATCHING, POCKET PICKING,
148

ETC.)4 RAPE OR ASSAULT (INCLUDING MURDER)5 "BUNKO" (INCLUDING CONFIDENCE GAMES, FORGERY, ETC.)6 VANDALISM8 OTHER ___________________________________7 DK 9 NAQ61 Were you the victim or was it some other member of your household?
V61 WHO VICTIM2 k RESPONDENT1 S OTHER HOUSEHOLD MEMBER fAT THE TIME OF THE CRIME!5 SOMEONE OTHER THAN A HOUSEHOLD MEMBER 7 DK 9 NAQ62 How long ago did this happen?V62 WHEN CRIME HAPPENED(SKIP TO Q64)1 2 3 4 LESS THAN ONE YEAR ONE TO TWO YEARS TWO TO THREE YEARS MORE THAN THREE YEARS7 9 DK NA
Q63 Did this crime happen on this block, elsewhere in this neighborhood, or at some other place altogether?
V63 WHERE CRIME HAPPENED1 ON BLOCK3 IN NEIGHBORHOOD4 SOMEWHERE ELSE7 DK————————————8 NAQ64 Do you know of anyone living on this block who has had their home broken into in the past year?
V64 KNOW OF HOUSE BEAK 12 iiFYES 13=NO |7=DK 9=NAQ65 Do you know of anyone who has been assaulted while on the
street on this block in the past year? V65 KNOW OF ASSAULT ON BLOCK 1'2 IfYES l3fNO 7=DK 9=NA
SSV = V66+V67+V68+V21PAGE 10Q66 Now some questions about other subjects. Some people care a lot about the block they live on; for others the block is not important. How important is what your block is like to you -- would you say that it is not important, somewhat important or very important?
V66 IMPORTANCE OF BLOCK________—1 NOT IMPORTANT———————2 2 SOMEWHAT IMPORTANT3 5 VERY IMPORTANT_______7 DK 9 NAQ67 How important is it to you that people on your block
149

work together rather than alone to improve block conditions -- not important, somewhat important, or very important?
V67 IMPORTANCE OF WORKING TOGETHER1 NOTIMPORTANT2 3 SOMEWHAT IMPORTANT3 £ VERY IMPORTANT7 DK 9 NAQ68 How important is it to you that you be actively involved in any
efforts that residents might make to to improve your block? V68 IMPORTANCE OF ACTIVE INVOLVEMENT
1 NOT IMPORTANT2 2 SOMEWHAT IMPORTANT3 -£> VERY IMPORTANT7 DK 9 NAQ69 Now I have some questions about community organizations.
Is there currently a block association on your block? V69 CURRENT BLOCK ASSOCIAT iDN
2 33 YES 1 2 NO (SKIP TO YELLOW SHEETS)7 DK 9 NAQ70 Do you think the work of the block association has made the block a
better place to live, made things worse or had no effect? V70 BLOCK ASSOCIATION IMPROVED'BLOCK?
3 BETTER 25 NO EFFECT 1 WORSETDK 9 NA
PAGE 11Q71 Would you say that this block association is very active, moderately active or largely inactive?
V71 ACTIVITY LEVEL OF BLOCK ASSOCIATION1 LARGELY INACTIVE2 « MODERATELY ACTIVE3 3<VERY ACTIVE7 DK 9 NAQ72 Do you feel that this is an open organization where anyone can
take part or is it run by a small group of people? V72 OPENNESS OF BLOCK ASSOCIATION
3 OPEN23 DEPENDS/EQUIVOCAL.1 SMALL GROUP_____7 DK 9 NAI am going to read a short list of things a block association might try to do. Each time I read one,
150

please tell me if you think it is very likely, somewhat likely or not likely that the association on your block can accomplish that goal. PAUSE
3*eVERY LIKELY2 S=SOMEWHAT LIKELY 1S=NOT LIKELY 7=DK 9=NA
73 Q73 Improve physical conditions on the block like cleanliness or housing upkeep.
74 Q74 Persuade the City to provide better services to people on the block
75 Q75 Get people on the block to help each other more.76 Q76 Reduce crime on the block.11 Q77 Get people who live on the block to know each other better.
1Q Q78 Get information to residents about where to go for the services they need
y9 Q79 Provide programs for young people on the block.I EXPEC = V73+V74+V75+V76+V77+V78+V79 |*Q80 Have you ever taken part in an activity sponsored by the block
association? (EXPLANATION: Like a clean-up effort, a block party or a meeting to talk about block problems.)
10 PARTICIPATION IN BLOCK ASSOCIATION ACTIVITY2* YES18 NO7 DK9 NA*Note: V115-V121, were transferred to V73-V79 respectively so that we could
compare residents on blocks with BA's against residents on blocks without B^'s. Separation for other purposes easily accomplished with select if,
statement
PAGE 12Q81 Are you currently a member of the block association? V81 BLOCK ASSOCIAtlDN MEMBER- CURRENTLY
2 1 * 3 YES NO (SKIP TO Q101ON NEXT PAGE)7 9 DK NA
Q82 Have you ever been a member of the block association? V82 BLOCK ASSOCIATION MEMBER - PAST
I 2 teYES 1»NO I 7=DK 9=NAQ83 What is the main reason that you stopped being a member of the
block association? V8i3 REASON NO LONGER MEMBER __1 NOT ENOUGH TIME2 PERSONAL SITUATION (JOB, HANDICAP, CHILDREN, ETC.)3 ASSOCIATION NOT EFFECTIVE
151

4 CONFLICT WITH OTHER MEMBERS/LEADERS5 SAW NO NEED FOR ACTION6 DIDN'T FEEL PART OF GROUP/NOT WELCOME7 DISAGREED WITH POLICIES8 OTHER ____ ________________9 DK/NAQ84 Is any other member of your household a member of the block association? V84 OTHER HOUSEHOLD BA MEMBER
2 teYES 1£=NO | 7=DK 9=NAI am going to read a list of things that might keep people from being members of a block organization. Each time I read one, please tell me if it is one of the things that has kept you from being a member of the association on your block or not. PAUSE
2 fc=YES7=DK 9=NA5 Q85 Having children or others to care for so that it is difficult to attend meeting:
5 Q86 Not having the free time it takes to be a member.7 Q87 Not wanting to go to meetings and activities at night.
} Q88 Having to give up activities with friends or family to be a member.
) Q89 Disliking other members of the organization.) Q90 Not feeling welcome or like part of the group in the organization.
Q91 Disagreeing with the goals or activities of the association. ; Q92 Feeling that the organization never gets anything accomplished.
Q93 Seeing no rfeed for an organization on this block.TOTOBST = V85+V86+V87+V88+V89+V90+V91+V92+V93 COSFAC1 = V89+V90+V91+V92+V93 COSFAC2 = V85+V86+V87+V88
PAGE 13People join organizations for different reasons. Please tell me if each
of the following rewards would be a good enough reason for you to join a
block association and volunteer at least two hours a month to its work.
7=DK 9=NA/94 Q94 Saving money on the cost of such things as food or home improvement supplies. '
J95 Q95 Getting information about community events or services.
^96 Q96 Making new friends or meeting new people.'S7 Q97 Gaining personal recognition and respect from
152

others.'98 Q98 Helping others who are in need.'99 Q99 Making the block a better place to live.100Q100 Increased contact with people who may be helpful to you personally._______
Note: V129-V135 were tram to V94-V100 respectively ! we could compare incentivi
(SKIP TO Q136 ON PAGE 17)TOTINCTA = V94+V95+V96+V97+V98+V99non-members cm blocks wii __ versus incentives for re;Q101 How long have you been a member of the association? on blocks w/or BA's. VIOL HOW LONG MEMBER
1 LESS THAN SIX MONTHS2 SIX MONTHS TO ONE YEAR3 BETWEEN ONE AND TWO YEARS4 BETWEEN TWO AND THREE YR5 OVER THREE YR7 DK9 NAWe would like to know what kinds of things people have done in the association. In the past year have you:
2 d-FYES 1 £f=4=DK 5=NA32 Q102 attended a meeting,)3 Q103 spoken up during a meeting,)4 Q104 done work for the organization outside of meetings,)5 Q105 served as a member of a committee,)6 Q106 served as an officer or as a committee chair?MEMBER - YES TO V81 AND YES TO V102 (MINIMUM ATTENDED MEETING) NONMEMBER = EITHER NO TO V8J gg yg§ TO y§jL ^D JTO TO V102_______
PAGE 14Q107 Thinking about work you might do for the block association outside
of meetings, how many hours would you say you give to the association each month, if any?
Vl*07 TIME WORKING FOR BA MONTHLYU NONE1-7 EXACT HOURS GIVEN8 8 OR MORE_________9 DK/NANow let me ask you to tell me if each of a set of statements describe you or not. Each time I read one of the statements, please tell me if
it describes vou verv well, fairlv well, or nnt at all
153

_VQ_ ILLLOW SKILL MOD SKILL WTr-w CVTTT1='PAUSE7=DK 9=NA108 Q108 I do not feel any responsibility to take part in efforts to improve the block.
109 Q109 I would find it hard to talk in front of a meeting of the block association.
.10 QUO I could get other people in the block association to follow my ideas.
11 Q111 I would have difficulty organizing other people to get things done in the block association.
12 Q112 I could be an officer or a committee chair in the block association.
13 Q113 I know of other organizations that I could get to help the block . association get things done.
14 Q114 I would need to see quick results from my .work in the block association to stay involved.
(SKIP TO Q136)*Note: Appropriate reversals of V108-V114 were done to result in this coding form; being correct for each item (e.g. V110, V112 and V113 were reversed)
SKILL =V109+V11CH-V111+V112+V113 SELFREG =V108+V114 _______
Note: V122=V128 were transferred to V108-V114 respectively so that we could
compare skills for residents on blocks with BA's against those on blocks without BA's. _______
PAGE 15Let me ask you to think about what a block association could and could not do for your block if one was formed here. I am going to read a short list of things a block association might try to do. Each time I read one, please tell me if you think it is very likely, somewhat likely or not likely that a block association could accomplish that goal for your block. PAUSE
LI-KELY 23=SQMEWHAT LIKELYl Sc=NOT LIKELY7=DK 9=NAQ115 Improve physical conditions on the block like cleanliness or housing upkeep.
Qll6 Persuade the City to provide better services to people on the block
Q117 Get people on the block to help each other more.Q118 Reduce crime on the block.Q119 Get people who live on the block to know each other
154

better.Q120 Get information to residents about where to go for the services they need.
Q121 Provide programs for young people on the block.Note; V115-V121 transferred to V73-V79 respectively.Now let me ask you to think about what it would be like if there was a block association on this block and tell me if each of a set of statements jescribes you very well, fairly well, or not at all. PAUSE
7=DK 9=NAQ122 I do not feel any responsibility to take part in efforts to improve the block.
Q123 I would find it hard to talk in front of a block association meeting. Q124 I could get other people in a block association to follow my ideas.
Q125 I would have difficulty organizing other people to get things done in a block association.
Q126 I could be an officer or committee chair in a block association.
Q127 I know of other organizations that I could get to help a block association get things done.
Q128 I would need to see quick results from my work in a block association to stay involved.
Note: Appropriate reversals of V122-V128 were done to result in this coding forma being correct for each item (eg., V124, V126, V127 were reversed).
[~Note: V121-V128 were transferred to V108-V114)
PAGE 16People join organizations for different reasons. Please tell me if each
of the following rewards would be a good enough reason for you to join a
block association and volunteer at least two hours a month to its work.
2 3=7=DK 9=NAL29 Q129 Saving money on the cost of such things as food or home improvement supplies.
L30 Q130 Getting information about community events or services.
L31 Q131 Making new friends or meeting new people.L32 Q132 Gaining personal recognition and respect from others.
.33 Q133 Helping others who are in need.
.34 Q134 Making the block a better place to live.
.35 Q135 Increased contact with people who may be helpful
155

to you personally.Note; V129-V135 were transferred to V94-V100 respectively.
TOTINCTB = V129+V130+V131+V132+V133+V134 PERINCTB = V129+V130 SOCINCTB = V131+V132 BLKINCTB = V133+V134
PAGE 17Q136 Are you a member of any organizations other than a block
association that are concerned with solving community problems,
like a neighborhood association, civic club or tenants group?
V136 MEMBER OTHER COMMUNITY ORGANIZATIONS2 ;3=1 8=NO (SKIP TO Q139)9=NAQ137 To'how many of these organizations do you belong? V137 NUMBER OF COMM ORGS MEMBER
1-7 EXACT NUMBER GIVEN 8 8 OR MORE9 DK/NAQ138 Overall, would you say that you were very active, only
occasionally active or seldom active in these organizations? V138 ACTIVITY LEVEL IN OTHER COMM ORGS
1 SELDOM ACTIVE2 S OCCCASIONALLY ACTIVE3 £ VERY ACTIVETDK 9 NA| OTHORPAR - V137xV138 |Q139 For the last part of the survey I need to ask a few background
questions. Do you own your home or are you renting? V139 HOME OWNERSHIP
1 OWN RENT7 DK9 NA>-Q140 Is your home in a private house or an appartment building? V140 TYPE OF RENTAL UNIT
I 23=PRIVATE HOME 1:2=APPARTMENT BUILDING7=DK 9=NA•Q141 Is your home a private house, a coop or a condominium?
V141 TYPE OF OWNED UNIT _____________________| 1 = PRIVATE HOME 3=COOP 5=CONDO 8=OTHER l7=DK 9=NA
Q142 How many children between the ages of 5 and 18
156

currently live in your V142 °NUMBER OF CHILDREN1-7 EXACT NUMBER GIVEN8 8 OR MORE__________9 DK/NA
PAGE 18Q143 Which of the following categories includes your age? V143 AGE CATEGORY
1 under thirty years old2 thirty to thirty nine years old3 forty to forty nine years old4 fifty to sixty five years old5 over sixty fivp ysars nIH_____9 NAQ144 What was the highest level of education you completed? V144 EDUCATIONAL LEVEL
1 EIGHTH GRADE OR LESS2 SOME HIGH SCHOOL3 HIGH SCHOOL GRADUATE4 VOCATIONAL SCHO6L BEYOND HIGH SCHOOL5 SOME COLLEGE6 COLLEGE GRADUATE7 POST GRADUATE EDUCATION_____________ 9 NAQ145 Which of the following categories describes your race? V145 RACE
1 Black2 Hispanic3 White4 Oriental 8 Other9 NAQ146 Thinking about your total family income in 1984, which of the following
categories did it fall into? V146 FAMILY INCOME1 under $10,0002 from $10,000 to $20,0003 from $20,000 to $30,0004 $30,000 or more. 5 . B£ OVER $40,000___DK9 NAThis concludes the interview. Do you have any questions?Thank you very much for your cooperation.Q147 RECORD RESPONDENT'S SEXV147 SEXTMALE2 S FEMALE 9 NA
157

158

APPENDIX 1A:FACTOR ANALYSES OF INDIVIDUAL-LEVEL SOCIAL CLIMATE SURVEY ITEMS a
Table 1A1: Sense of Community, Informal Social Control, and Neighboring Varimax Rotated Factors: 1 2 3 4 5 6 7
NEIGHBORING (alpha = .76) Did you...Q25. Help a neighbor in emergency .72Q27. Discuss problem w/ a neighbor .69Q24. Loan a neighbor food or tool .69Q23. Watch a neighbor's house .67Q26. Offer a neighbor advice .64
Did a neighbor...Q30. Help you in an emergency .70Q29. Loan you food or a tool .69Q31. Offer you advice .68Q32. Discuss a block problem .59Q28. Watch your house .49 .33
SENSE OF COMMUNITY (alpha = .80)Q12. few of my neighbors know me .67Q10. I can recognize most people .59 .31Q14. I have almost no influence .52Q15. people can get problems solved .46 .39
Q16. important to live on this block .74Q18. I expect to live here a long time .71Q9. neighbors want the same things .38
Q7. block is a good place to live .31 .69Q8. people do not share values .69Q11. I feel at home on this block .59
Q13. I care what my neighbors think .64Q17. people don't get along .64
INFORMAL SOCIAL CONTROL (alpha = .59)Q34. would a neighbor ask for clean up .66Q35. would a neighbor ask kids to stop .69Q36. would a neighbor warn others .32 .63
ADDITIONAL ITEM:Q19. People recognize block residents .57 .32________________________________________________________________________a Loadings less than .30 left blank by convention.
159
Table 1A2: Sense of Community, Block Satisfaction and Communitarianisma
Varimax Rotated Factors: 1 2 3SENSE OF COMMUNITY (alpha = .80)Q12. few of my neighbors know me .62Q10. I can recognize most people .54Q15. people can get problems solved .45 .33Q14. I have almost no influence .43Q11. I feel at home on this block .40 .38Q16. important to live on this block .36 .31Q8. residents do not share values .36Q17. residents don't get along
Q7. block is a good place to live .63Q18. I expect to live here a long time .34 .37Q9. neighbors want the same things
Q13. I care what my neighbors think .30 .32
BLOCK SATISFACTION (alpha = .59)Q2. satisfied with block as place to live .67Q4. block conditions have improved .64Q5. block conditions will improve .61Q3. block better place to live than others .43
COMMUNITARIANISM (alpha = .68)Q68. How important to be involved .80Q67. How important people work together .78Q66. How important what block is like .65Q21. How important sense of community .54
ADDITIONAL ITEMS:Q6. Neighbors watch after each other .59Q19. People recognize block residents .43Q20. Sense of community w/ block residents .52 .31_________________________________________________________________________a 3 factors were forced for confirmatory purposes.
160

APPENDIX 2:
BLOCK BOOSTER ENVIRONMENTAL INVENTORY
by Douglas D. Perkins, New York University and Citizens Committee for N.Y.C.
INSTRUCTIONS
Before going to a block to do an environmental assessment, be sure that someone from the research team (who is not to be kept blind to experimental-control block assignments) has notified the local police precinct and, where appropriate, the block leader. Check the designated boundaries of the block (some "blocks" will be a string of two or more adjacent physical blocks). The block includes both sides of the street and the properties on all adjacent corners. First, start at the corner with the lowest address and walk one side of the block at a time keeping a tally of the items in section I that are visible from the sidewalk. Use the dotted area for the tally and the right-hand lines for the exact total. At the bottom of this section, make a note of every nonresidential land use on the block and classify them-- e.g., industrial, commercial, educational, religious, etc. It is especially important to note "eyesores," such as vacant lots with abandoned cars. Use the back of the page for any comments or questions you might have and note the category number, letter and, where appropriate, address it refers to.
I.A.1. An unpaved shoulder or a side lane with parked cars is not considered "drivable" and thus is not counted in terms of street width. 2. A "divider" is any raised median separating traffic. C. Check for "no parking" signs.
I.B.1. "Attached" buildings are any that are so close that it is impossible to walk between them. The end buildings in an attached row should be counted as attached. 2. "Detached" buildings may be architecturally adjoined (e.g., by an arch) as long there is at least a pedestrian alley between them. Count any duplexes (i.e., attached on only one side) as "detached." 3-5. For every different style of building on every block, the number of units (1, 2-3, or 4+) should be verified by counting door bells or mail boxes. This need not be done for identical buildings on the same block.
I.C.1. Count a car as abandoned if it has broken windows, dismantled parts, has been in a wreck, or has one or more flat tires. 2. Damaged or graffiti painted public property would include signs, lights, trees, etc. Count each separate piece of affected public property only once (i.e., do not count a sign separately from its post). Count graffiti only if it is clearly a name, design, or a mark at least 1 foot across. 3. An "unboarded abandoned building" is not only vacant, but is dilapidated, has overgrown grass, weeds or shrubbery, or several broken windows. 4. "Boarded abandoned buildings" need not look dilapidated. 5. Count all vacant lots as "unused" that do not contain a (6) garden, (7) playground, or parking lot, etc. 8. Do not count corner street signs as block or block watch "identifiers" (rather, they will typically read "Welcome to.....block" or "This block protected by.....").
I.D.1. If you see that 4 or more properties have the same style sidewalk lamps, benches, address signs, or planters, etc., circle the appropriate word and (2) count them.
161

BBEI Instructions (continued):
II.Start over at the beginning of the block, walk down one side of the street at a time and check yes or no for whether each item in this section is visible at every third property (e.g., address #00, #06, #12...). Stop when you have completed part II on 12 properties. If you finish the block and have not assessed at least 12 properties (and have made sure that the "block" has not been designated as a multiple block), start over and do the second (#02), fifth (#08), and eighth (#14) properties, etc., until you have completed 12. On "multiple blocks," divide the 12 properties to be assessed proportionately among the component physical blocks according to the relative size of those blocks (e.g., if the multiple block consists of one long block and one that is approximately half as long, do 8 properties on the long block and 4 on the short one.
II.1.Imagine if all street, sidewalk, and yard litter (including overflow from trash cans) were swept up; would the pile be substantially more than 1 foot?
2. "Vandalism" includes broken windows, exterior lights, etc. 4. Check "no" if most of sidewalk is obstructed from view from 1st floor. 5-6. A "barrier" is a wall, fence, or hedge of any sort. 8. Include lights on either side of the street or on property line. 10. A badly overgrown lawn, untrimmed hedge, peeling paint, etc. should be considered "lack of
exterior maintenance." 14. A "stoop" should be included if the steps or low wall are at a comfortable height for sitting (2-3
feet). 15. "Personalization signs" include family or commercial names, initials, emblems, fancy address signs, etc. Look for these on doors, lampposts, windows, and gates. 16."Inividualized" decorations include any statuettes, planters, window boxes, awnings, etc., that
were not counted in part I-D. Do not include plants inside windows.19-20. Look at doors and windows for security or alarm and "Operation I.D.," patrol, or "block watch" signs or stickers. If "yes," circle the appropriate word.
162

BLOCK BOOSTER ENVIRONMENTAL INVENTORY Block #____________
I. A. Street width: 1. How many lanes are drivable?.................____________ 2. Is there a divider?.......................................____________ 3. On how many sides of the street is parking allowed?.......____________
I. B. Housing style (write exact #): 1. How many buildings are attached? ____________ 2. How many are detached?....................................____________ 3. How many one-family houses?...............................____________ 4. How many two or three unit buildings?.....................____________ 5. How many multi-unit (4+) buildings?.......................____________
I. C. How many of the following can you identify on the whole block? 1. Abandoned cars on street....................................____________ 2. Damage or graffiti on public property.......................____________ 3. Unboarded abandoned buildings...............................____________ 4. Boarded abandoned buildings.................................____________ 5. Unused vacant lots..........................................____________ 6. Public gardens..............................................____________ 7. Public playgrounds..........................................____________ 8. Signs identifying the block or "block watch"................____________ I. D. 1. Any identical lamps, signs, planters, benches, other (circle)? 2. How many (at least 4)?._________
I. E. Nonresidential land uses:_______________________________________________
II. Property checklist: Evaluate every 3rd building or vacant lot (stopping at a total of 12 properties assessed).Address:___________ Yes No 1. More than 1 sq. ft. of litter on or in front of property? ____ ____ 2. Vandalism on property?................................... ____ ____ 3. Graffiti on property (do not include posted materials)?.. ____ ____ 4. Are street and sidewalk clearly visible from inside the building (or, if vacant lot, is whole lot visible from street)?... ____ ____ 5. Does the property have a barrier on it?.................. ____ ____ 6. Does the property have a barrier around it?.............. ____ ____ 7. Is there a gate?......................................... ____ ____ 8. Is there a street light in front of the property?........ ____ ____ 9. Do any windows have security bars or gates on them?...... ____ ____ 10. Any visible lack of exterior maintenance?................ ____ ____ 11. Does the building appear to be occupied?................. ____ ____ 12. Any sign of a dog (include dog house, "beware" sign,...)? ____ ____ 13. Does the property have its own outdoor lighting?......... ____ ____ 14. Anyplace to sit outside (bench, porch swing, stoop)?..... ____ ____ 15. Any personalization signs?............................... ____ ____ 16. Individualized house, yard or window decorations?........ ____ ____ 17. Trees, shrubs, or garden on private lot?................. ____ ____ 18. Trees, shrubs, or garden on the "right of way?".......... ____ ____ 19. Any security or alarm identifiers on the property?....... ____ ____
163

20. Any "operation I.D., block watch," or patrol identifiers? ____ ____
BBEI Block #:__________
Address:___________ Yes No
1. More than 1 sq. ft. of litter on or in front of property? ____ ____ 2. Vandalism on property?................................... ____ ____ 3. Graffiti on property (do not include posted materials)?.. ____ ____ 4. Are street and sidewalk clearly visible from inside the building (or, if vacant lot, is whole lot visible from street)?... ____ ____ 5. Does the property have a barrier on it?.................. ____ ____ 6. Does the property have a barrier around it?.............. ____ ____ 7. Is there a gate?......................................... ____ ____ 8. Is there a street light in front of the property?........ ____ ____ 9. Do any windows have security bars or gates on them?...... ____ ____ 10. Any visible lack of exterior maintenance?................ ____ ____ 11. Does the building appear to be occupied?................. ____ ____ 12. Any sign of a dog (include dog house, "beware" sign,...)? ____ ____ 13. Does the property have its own outdoor lighting?......... ____ ____ 14. Anyplace to sit outside (bench, porch swing, stoop)?..... ____ ____ 15. Any personalization signs?............................... ____ ____ 16. Individualized house, yard or window decorations?........ ____ ____ 17. Trees, shrubs, or garden on private lot?................. ____ ____ 18. Trees, shrubs, or garden on the "right of way?".......... ____ ____ 19. Any security or alarm identifiers on the property?....... ____ ____ 20. Any "operation I.D., block watch," or patrol identifiers? ____ ____
Address:___________ Yes No
1. More than 1 sq. ft. of litter on or in front of property? ____ ____ 2. Vandalism on property?................................... ____ ____ 3. Graffiti on property (do not include posted materials)?.. ____ ____ 4. Are street and sidewalk clearly visible from inside the building (or, if vacant lot, is whole lot visible from street)?... ____ ____ 5. Does the property have a barrier on it?.................. ____ ____ 6. Does the property have a barrier around it?.............. ____ ____ 7. Is there a gate?......................................... ____ ____ 8. Is there a street light in front of the property?........ ____ ____ 9. Do any windows have security bars or gates on them?...... ____ ____ 10. Any visible lack of exterior maintenance?................ ____ ____ 11. Does the building appear to be occupied?................. ____ ____ 12. Any sign of a dog (include dog house, "beware" sign,...)? ____ ____ 13. Does the property have its own outdoor lighting?......... ____ ____ 14. Anyplace to sit outside (bench, porch swing, stoop)?..... ____ ____ 15. Any personalization signs?............................... ____ ____ 16. Individualized house, yard or window decorations?........ ____ ____ 17. Trees, shrubs, or garden on private lot?................. ____ ____
164

18. Trees, shrubs, or garden on the "right of way?".......... ____ ____ 19. Any security or alarm identifiers on the property?....... ____ ____ 20. Any "operation I.D., block watch," or patrol identifiers? ____ ____
165
APPENDIX 3:
CRIME DATA CODE SHEET AND NYPD COMPLAINT INDEX FORM
166