the social sciences & humanities in the light of google scholar: tapping the bibliometric...
TRANSCRIPT

The Social Sciences & Humanities in the
light of Google Scholar: tapping the bibliometric potential of an
academic search engine
Alberto Martín-Martín & Emilio Delgado López-Cózar Facultad de Comunicación y Documentación
Universidad de Granada (Spain)
COST TD1210 workshop:
Alternative metrics or tailored metrics? Science dynamics
for science policy Warsaw 9-10 November 2016

The team

What have we analyzed?


Indicators
Extracted
directly from
Google Scholar
Metrics
Computed using the article and
citation data available in Google
Scholar Metrics
H Index of
documents
published in the
last 5 years
Median of
citation counts
for articles
published in last
5 years
Sum of
citations for
articles above
h5-index
threshold

Classification
Core Related

Coverage
IMPORTANT: Google Scholar Metrics
only covers journals that are indexed in
Google Scholar, have published at
least 100 articles in the last 5-year
period, and have received at least 1
citation
Polish journals: JSM: 152 / 9196 (1.6%); SJR: 69 / 8180 (0.8%); WoS: 13 / 4166 (0.3%)

Future plans for JSM
• Update indicators annually: a more current version of
Google Scholar Metrics (GSM) is already available
• Update journal detail page to show evolution of impact
through time
• Switch to data from Google Scholar (search engine) to
get data for journals not in GSM: even better coverage
• Replace current journal classification scheme with
article-level classification (maybe using reference
and/or citing articles)
• Computing author self-citations (better metadata is
needed), distribution of citations by journal (to detect
closely related journals, or potential citation cartels)…


• Aims to measure impact of scientific book publishers
based on citations
• Sample of highly cited books (top 3%) published by
~41k A&H and SS professors working in public Spanish
universities. Data collected from Google Scholar in
2012 (n ~ 7200)
• 68 discipline rankings (49 in Social Sciences and Law,
39 in Arts and Humanities)

Indicators: Nº of books, and
sum of citations (relative to
highest element in the ranking)


• Publication data about 4,993 A&H and SS professors
working in public Spanish universities was extracted
from Google Scholar in 2012
• Only authors in the first tercile are displayed
• 68 discipline rankings (49 in Social Sciences and Law,
39 in Arts and Humanities)

Indicators
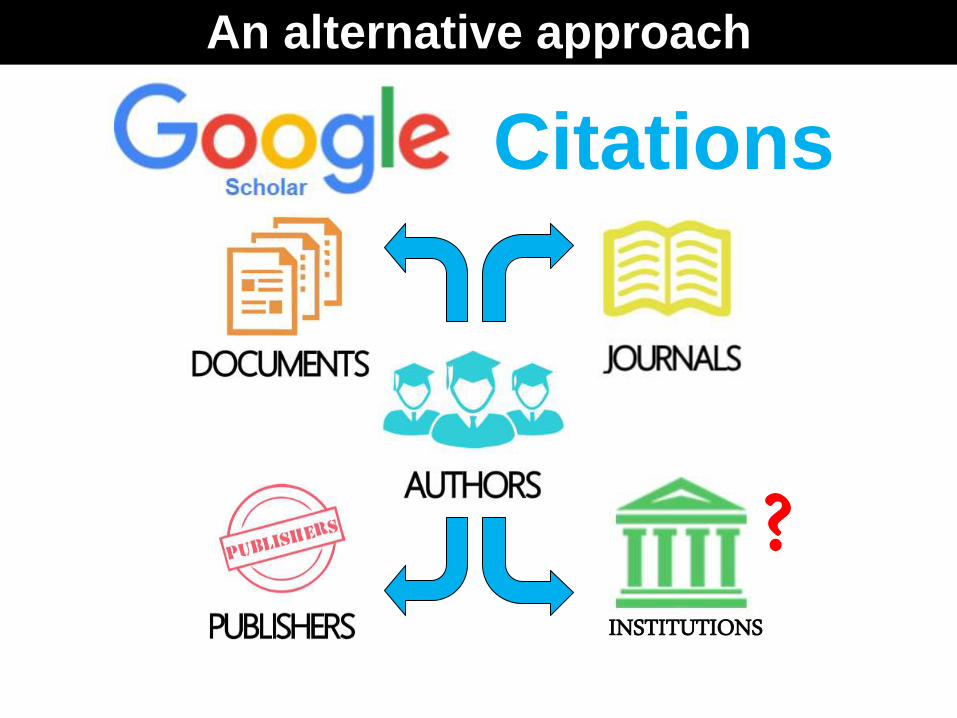
An alternative approach
Citations
INSTITUTIONS
?

Fuentes de datos
Citations

LIS researchers
in Spain 336 authors in GSC
68 not in GSC
Other sources ResearcherID (WoS)
ResearchGate
Indicators Sum of citations
H Index
Nº of documents
RG Score
Impact Points
Aggregating data Highly cited docs (HCD),
% of HCD by journal,
book publisher, and
institution

The «Mirrors» approach
There are many platforms that reflect (mirror) scientific
activity on the Web. An inclusive study of the impact of
scientific activity must contemplate as many of them as
possible.


Why Google Scholar?
• Best overall coverage: no country, language, or
document type restrictions, which is necessary for
good coverage of A&H and SS
• Most densely populated citation graph in
existence
• If we only consider documents covered by
WoS, Google Scholar data for those
documents tell the same story
• Free (as in free beer)

Why Google Scholar?
• Sample of 64,000 highly cited documents in
Google Scholar: half are covered by WoS,
half aren’t (among which we can find many
books)
• PRELIMINARY RESULTS: Analysis of most
articles and reviews published in 2009
covered by Web of Science (~1 million
documents):
Citation Index N spearman.cor p.value prop.cited.gs prop.cited.wos ratio of gs_cit to wos_cit (avg)
Sciences 863801 0,94 0,00 0,97 0,95 1,68
Social Sciences 109232 0,90 0,00 0,97 0,94 2,58
Art & Humanities 13487 0,83 0,00 0,84 0,69 2,52

Drawbacks
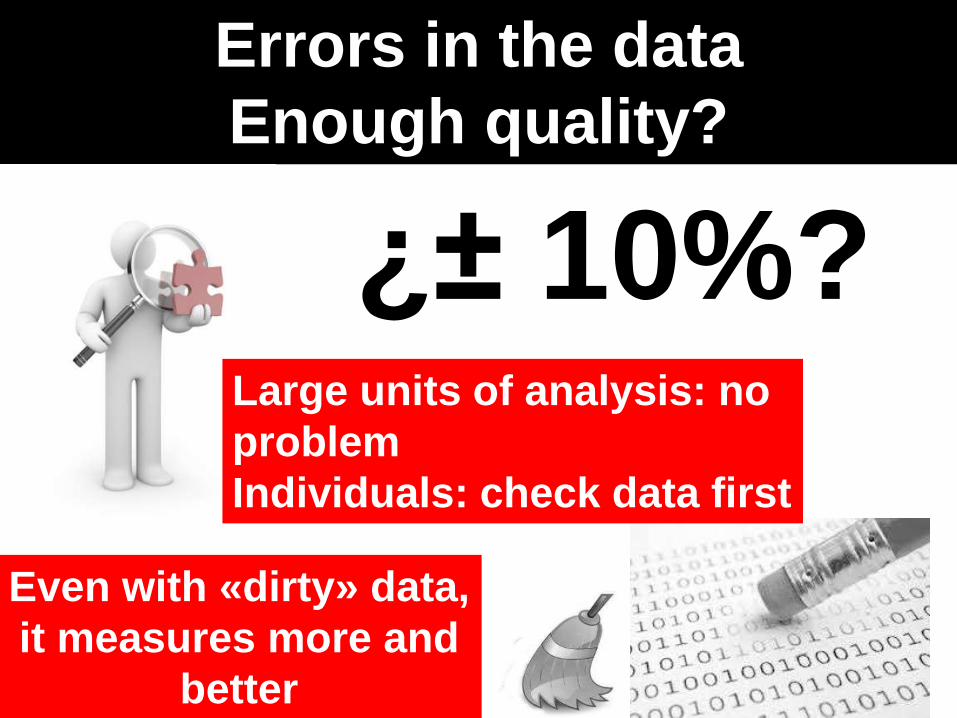
¿± 10%?
Errors in the data
Enough quality?
Even with «dirty» data,
it measures more and
better
Large units of analysis: no
problem
Individuals: check data first

Biggest dange: manipulation

The
Googledependency

Lack of transparency

It sheds light where there was darkness
