the sources of house price change: identifying liquidity shocks to the housing market
DESCRIPTION
The sources of house price change: Identifying liquidity shocks to the housing market. Michael White Paloma Taltavull de La Paz 20th ERES Conference Vienna , July , 2013 . Work in progress. Agenda. Introduction : Housing and the channels of transmission Defining the channels - PowerPoint PPT PresentationTRANSCRIPT

The sources of house price change: Identifying liquidity shocks to the housing market
Michael WhitePaloma Taltavull de La Paz
20th ERES ConferenceVienna, July, 2013
Work in progress

Agenda• Introduction: Housing and the channels of
transmission• Defining the channels• Analysis and Model• Data• Results• Conclusions

Introduction• Liquidity increase was global since late 90’s
– Addressing towards growing economics– Activities in strong expansion
• first industry goods –exports, • second real estate –construction-housing
• Increasing activity through financial system and capital markets– Interbanking flows did increase– Feeding economies through bank system: liquidity acceleration– Credit multiplier … finance accelerator
• Housing market role?

Introduction• Analysis from fundamentals:
– General economic growth lead to• D employment• D immigration….. D housing demand• D non residencial real estate.
– Whealth promotes ownership (social policy, habits..)
– Credit needs … households and small enterprises• Maximun level of credits?, • no credit constrains?

Introduction• Credit use ….. Macro economic effects
• credit channel..• Credit multiplier …
• Promoting homeownership instead of rent• Income and wealth effect
• Stronger housing markets ---- demand more mortgages ---- more transaction --- stronger HM
• Increasing prices?

Introduction• Mid 2000’s ECB’s analysis dept on the fact that
most liquidity went into the housing market (and real estate)
• Discover a strong channel between monetary indicators and house prices
• Multiple ways through transmit monetary impulses into house prices and reverse
• … House Price Channel

Aim of the paper• Identify the channels for monetary policy to affect
housing prices• An the role of housing supply elasticities
– 3 channels:• Asset inflation channel• Credit channel• Transaction channel
• Find evidence in two countries: Spain and UK, using a regional basis

Preview of results

Fundamentals• Strong macroeconomics impacts from housing boom
– the house price bubble – Construction cycle.
4 effects associated to the stress of housing market:
• (1) the aggregate effect on the output from the strong housing construction process in some countries (supply side effect), – Barker, 2004, Glaesser, Gyourko & Saiz, 2008, DiPasquale, 1999, Meen, 2002, Saiz, 2008
• (2) the wealth effect…..increase of general consumption, • (3) the increase on household leverage resulting from the ownership entrance in
the market, • (4) the increase on systemic risk of the economies experiencing the housing
boom due to the rise in mortgage concessions– (these three are effects from the demand side view). – Case, Quigley and Shiller, 2001, 2005, 2011, Goodman, 2005, Muelbauer, 2008.. Among
other
Fundamentals• Mortgage credit allows ownership demand to become
effective … demand impulse• It was thought that was exogenously determined
through the credit channel (main) and Asset inflation channel
• (Mishkin (2007) and Muellbauer (2007))• Its marginal effect on house price is captured by the interest rates
price elasticities.
• But there are also other channels influencing house prices and liquidity simultaneously (endogeneity)– Transaction Channel

Fundamentals• Macroeconomic effect of mortgage generation is explained
through the credit channel theory (Mishkin, 1995)• Two different transmission way + housing collateral effect
(Muelbauer, 2007)(1) 𝑀↑⇒𝑏𝑎𝑛𝑘 𝑑𝑒𝑝𝑜𝑠𝑖𝑡𝑠↑⇒𝑏𝑎𝑛𝑘 𝑙𝑜𝑎𝑛𝑠↑⇒𝐼↑⇒𝑌↑ (2) 𝑀↑⟹𝑃𝑟↑⇒𝐴𝑆 𝑎𝑛𝑑 𝑀𝐴↓⇒𝑙𝑒𝑛𝑑𝑖𝑛𝑔 ↑⇒𝐼↑⇒𝑌↑, regarding P as equity prices
from the household perspective: (3) 𝑀↑⇒𝑃𝑟𝑒↑⇒𝑓𝑖𝑛𝑎𝑛𝑐𝑖𝑎𝑙 𝑎𝑠𝑠𝑒𝑡𝑠↑⇒𝑙𝑖𝑘𝑒𝑙𝑖ℎ𝑜𝑜𝑑 𝑜𝑓 𝑓𝑖𝑛𝑎𝑙 𝑑𝑖𝑠𝑡𝑟𝑒𝑠𝑠↓⇒𝑐𝑜𝑛𝑠 𝐷𝑢𝑟𝑎𝑏𝑙𝑒 𝑎𝑛𝑑 𝐻𝑜𝑢𝑠𝑖𝑛𝑔 ↑⇒𝑌↑
ሺ4ሻ Δ𝑃ℎ ⟹Δ𝑐𝑜𝑙𝑙𝑎𝑡𝑒𝑟𝑎𝑙 𝑣𝑎𝑙𝑢𝑒⟹Δ𝐷𝑒𝑏𝑡 ⟹Δ𝑙𝑖𝑞𝑢𝑖𝑑𝑖𝑡𝑦 𝑜𝑓 ℎ𝑜𝑢𝑠𝑖𝑛𝑔 𝑤𝑒𝑎𝑙𝑡ℎ ⟹Δ𝐶𝑜𝑛𝑠𝑢𝑚𝑝𝑡𝑖𝑜𝑛
Fundamentals• Recent analysis identify more preciselly the transmission channels where
house prices could play relevant role:
• Credit channel is the most analysed (Aron et al, 2010, Muelbauer, 2007, Otsuka, 2006, Mishkin, 2007, Lastrapes..)
• Collateral effect of housing wealth is the base of the lending channel (Weber et al, 2011, Setzer et al, 2010)
• Global liquidity spillover exists to asset price inflation (Belke et al, 2008,• And housing amplify its effects ( Greiber and Setzer, 2007).. Housing
price channel • But depending on how housing supply reacts to the impulses… supply
elasticity

Fundamentals• There are three channels (Greiber and Setzer,
2007)– 1 Friedman – Money demand channel (classical)
– 2 Asset inflation channel
– 3 Credit channel

Fundamentals1 Friedman – Money demand channel (classical)– Wealth Effect
– Substitution effect
– Transaction effect
Δ𝑃ℎ ⟹ΔHWealth⟹Δሺportfolio compositionሻ⟹Δ𝑝𝑟𝑜𝑝𝑒𝑟𝑡𝑦 𝑑𝑒𝑚𝑎𝑛𝑑
⟹Δ𝐶𝑜𝑛𝑠𝑢𝑚𝑝𝑡𝑖𝑜𝑛
Δ𝑃ℎ ⟹change in the attractiveness of different assets ⟹Δ housing demand+ money demand ⟹Δ%𝑝𝑟𝑜𝑝𝑒𝑟𝑡𝑦 𝑖𝑛 𝑝𝑜𝑟𝑡𝑓𝑜𝑙𝑖𝑜
Δ𝑡𝑟𝑎𝑛𝑠𝑎𝑐𝑡ℎ ⟹ΔሺPh∗numbTሻ⟹ΔM3ሺdem for paymentsሻ ..Higher in boom periods ⟹𝑛𝑒𝑒𝑑 𝑑𝑒𝑝𝑜𝑠𝑖𝑡𝑠+ 𝑙𝑖𝑞𝑢𝑖𝑑𝑖𝑡𝑦 (𝑀3+ 𝑀1)

Fundamentals2 Asset inflation channel
ΔM3 ⟹ΔCPI or ΔAsset Price ⟹𝑤ℎ𝑒𝑛 𝑆𝑢𝑝𝑝𝑙𝑦 𝑒𝑙𝑎𝑠𝑡𝑖𝑐 𝑜𝑓 𝐶 𝑔𝑜𝑜𝑑𝑠> 1 ⟹ΔPcpi→0 (goods competition) ⟹𝑤ℎ𝑒𝑛 𝑠𝑢𝑝𝑝𝑙𝑦 𝑒𝑙𝑎𝑠𝑡 𝑜𝑓 𝐴𝑠𝑠𝑒𝑡𝑠< 1 ⟹ΔP𝑎𝑠𝑠𝑒𝑡→1 𝑎𝑠 ℎ𝑜𝑢𝑠𝑖𝑛𝑔 𝑚𝑘𝑡 ℎ𝑎𝑠 𝑟𝑒𝑠𝑡𝑟𝑖𝑐𝑡𝑒𝑑 𝑠𝑢𝑝𝑝𝑙𝑦 Then ΔM3 ⟹ΔCPI∗Esupply or ΔAsset Price∗Esupply = inflation*Esupply or Ph*E supply⟹ΔPh
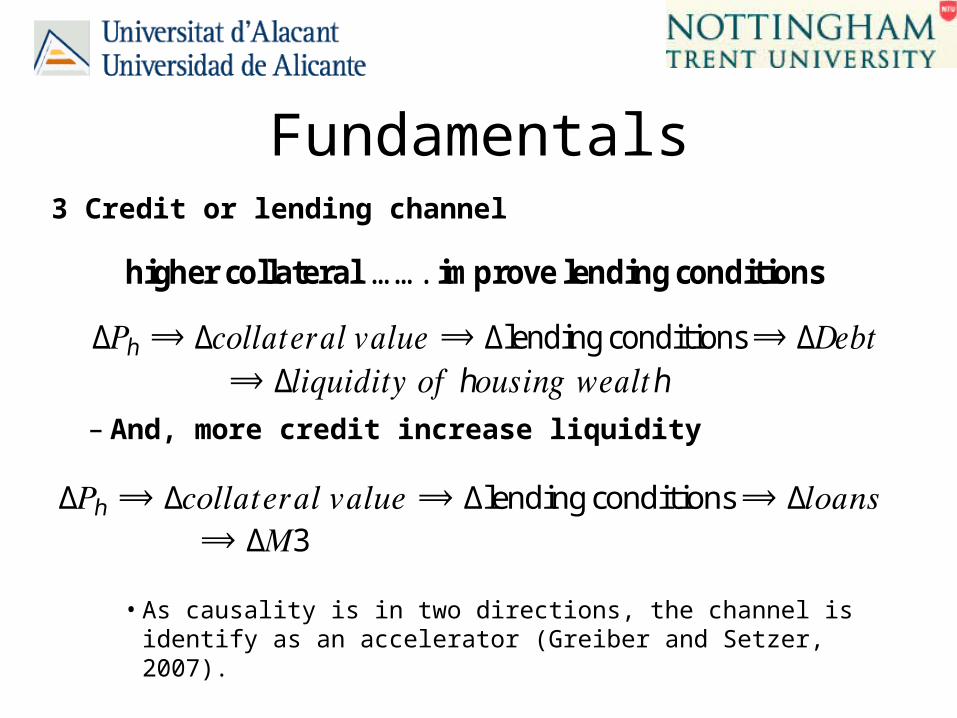
Fundamentals3 Credit or lending channel
– And, more credit increase liquidity
• As causality is in two directions, the channel is identify as an accelerator (Greiber and Setzer, 2007).
higher collateral ……. improve lending conditions Δ𝑃ℎ ⟹Δ𝑐𝑜𝑙𝑙𝑎𝑡𝑒𝑟𝑎𝑙 𝑣𝑎𝑙𝑢𝑒⟹Δlending conditions⟹Δ𝐷𝑒𝑏𝑡⟹Δ𝑙𝑖𝑞𝑢𝑖𝑑𝑖𝑡𝑦 𝑜𝑓 ℎ𝑜𝑢𝑠𝑖𝑛𝑔 𝑤𝑒𝑎𝑙𝑡ℎ
Δ𝑃ℎ ⟹Δ𝑐𝑜𝑙𝑙𝑎𝑡𝑒𝑟𝑎𝑙 𝑣𝑎𝑙𝑢𝑒⟹Δlending conditions⟹Δ𝑙𝑜𝑎𝑛𝑠⟹Δ𝑀3

Aim of this paper• Approach the credit channel theory with some empirical evidence,
testing:– Asset inflation channel– Subject to supply responses
• Test the causal-channel relationship
• With elasticities being calculated as:
• Apply to two countries and their regions (R):– Spain and UK
ttttr controlsMPh ],Ε,inf,3[ sup
ttttt RrirPhE ],,[sup
Data• National and regional data, quarterly• Pool with regions and time series (1995-2011)• Secundary sources: official databases
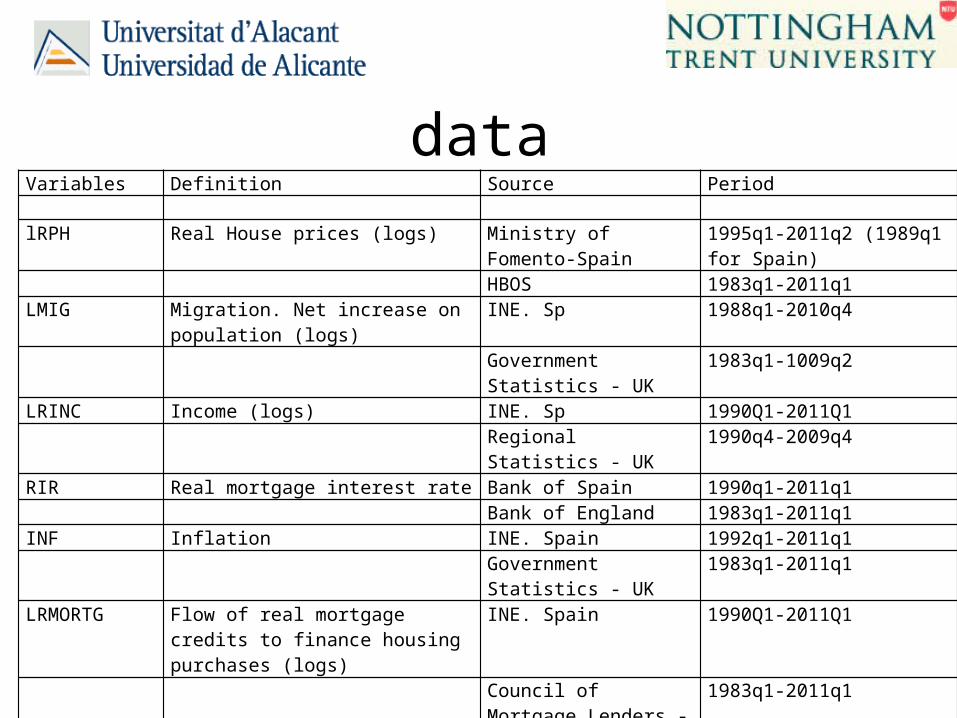
dataVariables Definition Source Period
lRPH Real House prices (logs) Ministry of Fomento-Spain 1995q1-2011q2 (1989q1 for Spain)
HBOS 1983q1-2011q1LMIG Migration. Net increase on population
(logs)INE. Sp 1988q1-2010q4
Government Statistics - UK 1983q1-1009q2
LRINC Income (logs) INE. Sp 1990Q1-2011Q1Regional Statistics - UK 1990q4-2009q4
RIR Real mortgage interest rate Bank of Spain 1990q1-2011q1Bank of England 1983q1-2011q1
INF Inflation INE. Spain 1992q1-2011q1Government Statistics - UK 1983q1-2011q1
LRMORTG Flow of real mortgage credits to finance housing purchases (logs)
INE. Spain 1990Q1-2011Q1
Council of Mortgage Lenders - UK
1983q1-2011q1
LM3 Liquidity in the economy-M3 (logs) Bank of Spain 1990q1-2011q1Bank of England 1983q1-2010q4

Regional dataDefinition in the pool Countries UK United Kingdom Spanish regions included Sp Spain AND Andalucía ARA Aragón UK Regions included AST Asturias ea East Anglia BAL Balearic Islands em East Midlands CAN Canary Islands gl Greater London CANTA Cantabria ni Northern Ireland CAT Cataluña no North CLE Castilla León nw North West CMA Castilla La Mancha sc Scotland CVA Valencia Community se South East EXT Extremadura sw South West GAL Galicia wa Wales MAD Madrid wm West Midlands MUR Murcia yh Yorkshire & Humberside NAV Navarra PVA Basque Country RIO La Rioja

data

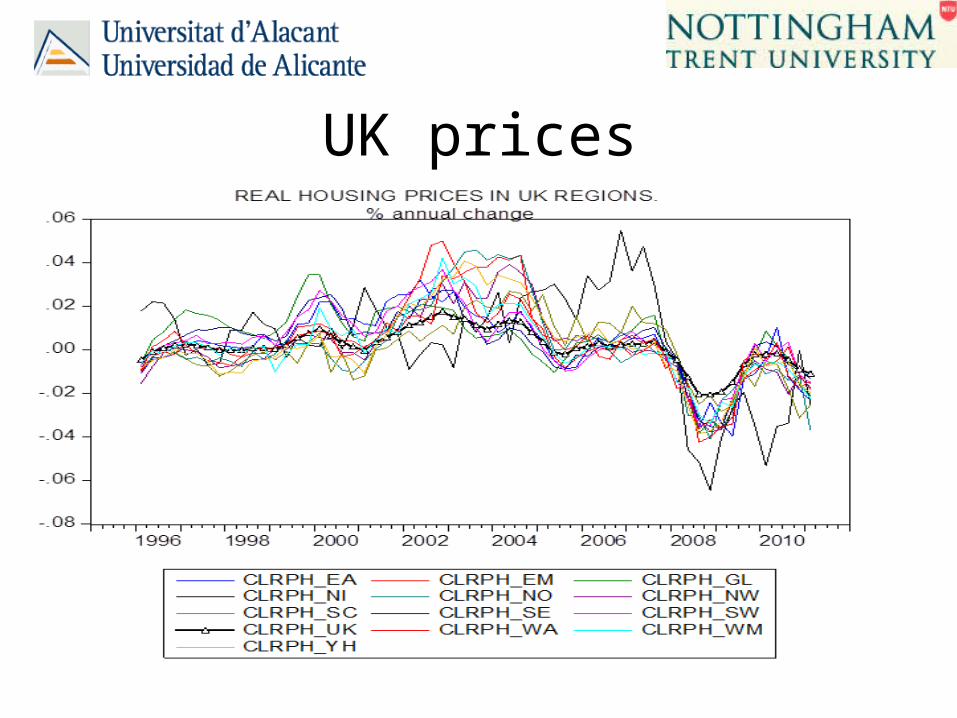
UK prices

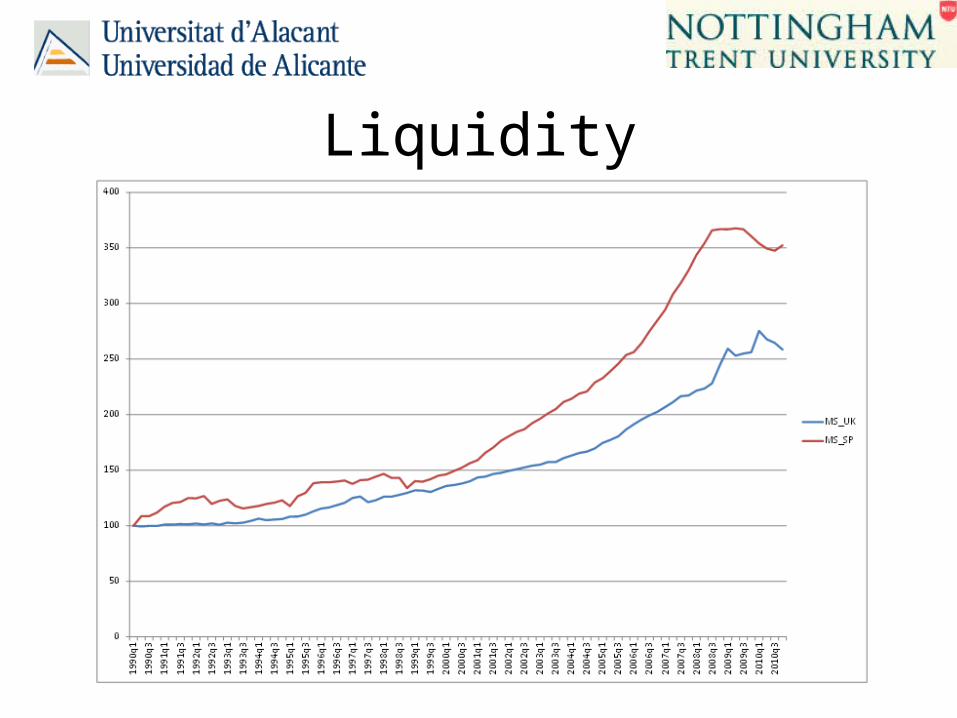
Liquidity

Empirical evidence• Asset inflation channel
– Panel techniques• 2 separate pools (UK and Spain)• Pooled least square
– UK: 1996-2011, 12 regions, 660 obs– Spain: 1995-2011, 17 regions, 969 obs.
• With elasticities ‘bi’ being estimated as:
• D
ttttr controlsMPh ],Ε,inf,3[ sup
titititiit RgrirbPhbaHs 21

Empirical evidence• Elasticities. The supply model:
• For Spain and UK• Let the elasticities to vary among regions, so, estimating
b1i
• Test for breaking points.. Chow test show 2008 (UK) and 2007 (spain) as structural changes with permanent effects
• Logs, regional (fixed) effects
titititiit RgrirbPhbaHs 21

Empirical evidenceElasticityp-value Elasticityp-value
AN--LRHPAN 1,62 *** _EA--LRPH_EA 0,33 **AR--LRHPAR 1,43 *** _EM--LRPH_EM 0,55 **AS--LRHPAS 1,44 *** _GL--LRPH_GL 0,06BA--LRHPBA 0,92 *** _NI--LRPH_NI 0,05CA--LRHPCA 1,80 *** _NO--LRPH_NO 0,38 ***CANT--LRHPCANT 1,46 *** _NW--LRPH_NW 0,48 ***CLM--LRHPCLM 2,70 *** _SC--LRPH_SC 1,01 ***CLE--LRHPCLE 1,52 *** _SE--LRPH_SE 0,09CAT--LRHPCAT 0,73 _SW--LRPH_SW 0,29CV--LRHPCV 1,13 *** _WA--LRPH_WA -0,05EX--LRHPEX 2,01 *** _WM--LRPH_WM 0,23GA--LRHPGA 1,82 *** _YH--LRPH_YH 0,50 ***MA--LRHPMA 1,13 **MU--LRHPMU 0,81 **NA--LRHPNA 1,22PV--LRHPPV -0,06RI--LRHPRI 1,21CYM--LRHPCYM 3,17
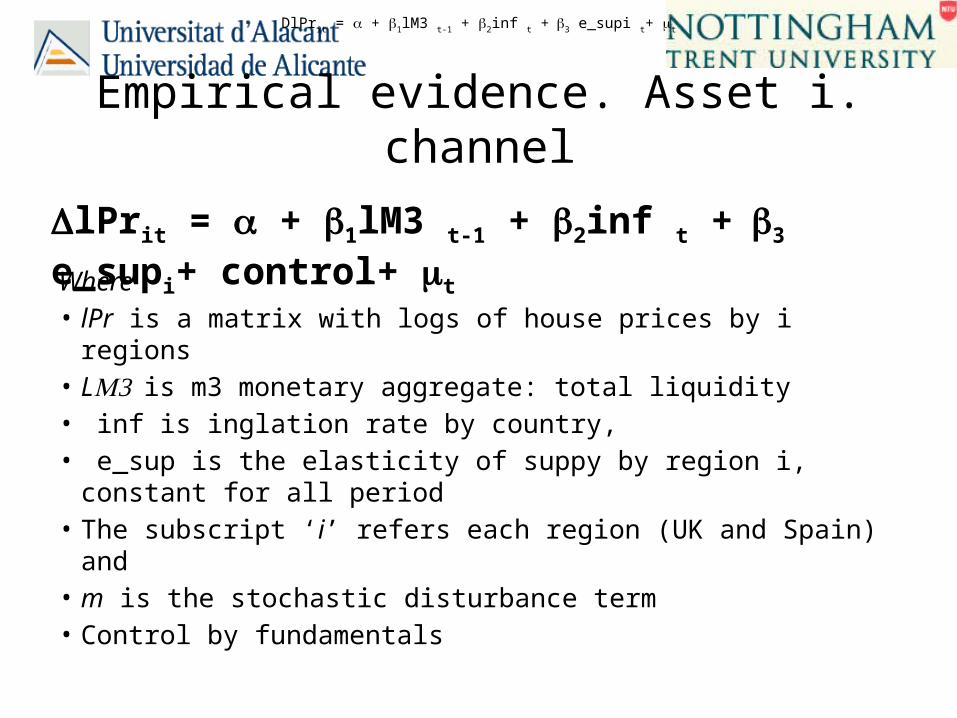
Empirical evidence. Asset i. channel
Where• lPr is a matrix with logs of house prices by i regions • LM3 is m3 monetary aggregate: total liquidity• inf is inglation rate by country,• e_sup is the elasticity of suppy by region i, constant for all period • The subscript ‘i’ refers each region (UK and Spain) and • m is the stochastic disturbance term• Control by fundamentals
DlPrit = a + b1lM3 t-1 + b2inf t + b3 e_supi t+ t
DlPrit = a + b1lM3 t-1 + b2inf t + b3 e_supi+ control+ t

Discussion• Money supply inflation results:
– M3 significant in Spain and inflation in UK but not in Spain (consistent in all estimated models)
• The channel captures direct relationship between liquidity and house prices
– Regional elasticities are significant in most regions but not in others
• Significant in less expensive and less volatile regions other than East of England
• Significant in most Spanish regions

Discussion• Money supply inflation results:
– M3 results• 1% increase in M3 (-1) causes 9,2% reduction on the
rate of increase of house prices in Uk and 5,8% in Spain• The impacts on prices from M3 changes comes through
regions captured by the significance of supply elasticities and regional characteristics (fixed effects)

All comments are welcome