the south african investor behaviour tax and helping ... · investors count what counts paul nixon,...
TRANSCRIPT

The South African investor behaviour tax and helping investors count what counts
Paul Nixon, Martiens Barnard, Ronnie Bornman and Dirk Louw
September 2019

This paper begins by using popular balanced fund flows to show how investors migrate between these funds in the pursuit of recent performance, ultimately to their detriment. We then examine how this be-haviour affects individual South African investors in respect of imposing a “behaviour tax” on their invest-ment portfolios that tends to vary according to the dominant market cycle. The conclusion is that investors should consider four main factors when constructing an investment portfolio to reach a specific investment outcome. We show how these factors should be considered to give the right balance between reaching the desired outcome and a palatable investment journey, thereby minimising the negative effect of irrational behaviour on the investment.
Paul Nixon, Martiens Barnard, Ronnie Bornman and Dirk Louw
Executive summary

RORSCHACH TESTPopularly known as the “Inkblot” test, the Rorschach
technique, or Rorschach Psychodiagnostic Test is the most widely used projective psychological test. The Rorschach is used to help assess personality structure and identify
emotional problems. Similarly personality traits and emotion can contribute to the defined behavioural tax in
investment performance.

Index
The South African investor behaviour tax and helping investors count what counts | Nixon, Barnard, Bornman & Louw | September 2019
About the authors . . . . . . . . . . . . . . . . . . . . . . . . . . . . . . . . . . . . . . . . . . . . . . . . . . . . . . . . . . . . . . . . . . . . . . . . . . . . . . . . . . . . . . . . . . . . . . . . . . . . . . . . . . . . . . . . . . . . . . . . 1
Foreword . . . . . . . . . . . . . . . . . . . . . . . . . . . . . . . . . . . . . . . . . . . . . . . . . . . . . . . . . . . . . . . . . . . . . . . . . . . . . . . . . . . . . . . . . . . . . . . . . . . . . . . . . . . . . . . . . . . . . . . . . . . . . . . 2
Introduction . . . . . . . . . . . . . . . . . . . . . . . . . . . . . . . . . . . . . . . . . . . . . . . . . . . . . . . . . . . . . . . . . . . . . . . . . . . . . . . . . . . . . . . . . . . . . . . . . . . . . . . . . . . . . . . . . . . . . . . . . . . . . 4
1. The origin of investor biases . . . . . . . . . . . . . . . . . . . . . . . . . . . . . . . . . . . . . . . . . . . . . . . . . . . . . . . . . . . . . . . . . . . . . . . . . . . . . . . . . . . . . . . . . . . . . . . . . . . . . . . . . . 7
1.1 Spock versus Homer Simpson . . . . . . . . . . . . . . . . . . . . . . . . . . . . . . . . . . . . . . . . . . . . . . . . . . . . . . . . . . . . . . . . . . . . . . . . . . . . . . . . . . . . . . . . . . . . . . . . . . . 8
1.2 Information processing . . . . . . . . . . . . . . . . . . . . . . . . . . . . . . . . . . . . . . . . . . . . . . . . . . . . . . . . . . . . . . . . . . . . . . . . . . . . . . . . . . . . . . . . . . . . . . . . . . . . . . . . . 9
1.3 Dual-process theory of thought . . . . . . . . . . . . . . . . . . . . . . . . . . . . . . . . . . . . . . . . . . . . . . . . . . . . . . . . . . . . . . . . . . . . . . . . . . . . . . . . . . . . . . . . . . . . . . . . . . 9
1.4 The mental template . . . . . . . . . . . . . . . . . . . . . . . . . . . . . . . . . . . . . . . . . . . . . . . . . . . . . . . . . . . . . . . . . . . . . . . . . . . . . . . . . . . . . . . . . . . . . . . . . . . . . . . . . . . 11
1.5 Heuristics and biases . . . . . . . . . . . . . . . . . . . . . . . . . . . . . . . . . . . . . . . . . . . . . . . . . . . . . . . . . . . . . . . . . . . . . . . . . . . . . . . . . . . . . . . . . . . . . . . . . . . . . . . . . . 12
1.6 Should we be channelling our inner Vulcan? . . . . . . . . . . . . . . . . . . . . . . . . . . . . . . . . . . . . . . . . . . . . . . . . . . . . . . . . . . . . . . . . . . . . . . . . . . . . . . . . . . . . . . . 13
2. Aggregate investor behaviour using discretionary balanced fund flows . . . . . . . . . . . . . . . . . . . . . . . . . . . . . . . . . . . . . . . . . . . . . . . . . . . . . . . . . . . . . . . . . . . . . . 15
2.1 Introduction . . . . . . . . . . . . . . . . . . . . . . . . . . . . . . . . . . . . . . . . . . . . . . . . . . . . . . . . . . . . . . . . . . . . . . . . . . . . . . . . . . . . . . . . . . . . . . . . . . . . . . . . . . . . . . . . 15
2.2 Initial findings: Cross sector allocation and trends in flows abroad . . . . . . . . . . . . . . . . . . . . . . . . . . . . . . . . . . . . . . . . . . . . . . . . . . . . . . . . . . . . . . . . . . . . . . 15
2.3 Overall results . . . . . . . . . . . . . . . . . . . . . . . . . . . . . . . . . . . . . . . . . . . . . . . . . . . . . . . . . . . . . . . . . . . . . . . . . . . . . . . . . . . . . . . . . . . . . . . . . . . . . . . . . . . . . . . 16
2.4 The study on the effect of past performance on fund selection . . . . . . . . . . . . . . . . . . . . . . . . . . . . . . . . . . . . . . . . . . . . . . . . . . . . . . . . . . . . . . . . . . . . . . . . . 16
2.5 How the behaviour tax is created when past performance informs fund selection . . . . . . . . . . . . . . . . . . . . . . . . . . . . . . . . . . . . . . . . . . . . . . . . . . . . . . . . . . 18
3. The South African investor behaviour tax . . . . . . . . . . . . . . . . . . . . . . . . . . . . . . . . . . . . . . . . . . . . . . . . . . . . . . . . . . . . . . . . . . . . . . . . . . . . . . . . . . . . . . . . . . . . . . . 21
3.1 Introduction . . . . . . . . . . . . . . . . . . . . . . . . . . . . . . . . . . . . . . . . . . . . . . . . . . . . . . . . . . . . . . . . . . . . . . . . . . . . . . . . . . . . . . . . . . . . . . . . . . . . . . . . . . . . . . . . . 21
Index
The South African investor behaviour tax and helping investors count what counts | Nixon, Barnard, Bornman & Louw | September 2019
3.2 Study parameters . . . . . . . . . . . . . . . . . . . . . . . . . . . . . . . . . . . . . . . . . . . . . . . . . . . . . . . . . . . . . . . . . . . . . . . . . . . . . . . . . . . . . . . . . . . . . . . . . . . . . . . . . . . . . . . . . . . . . 22
3.3 Calculation methodology . . . . . . . . . . . . . . . . . . . . . . . . . . . . . . . . . . . . . . . . . . . . . . . . . . . . . . . . . . . . . . . . . . . . . . . . . . . . . . . . . . . . . . . . . . . . . . . . . . . . . . . . . . . . . . . 22
3.4 Overall study results . . . . . . . . . . . . . . . . . . . . . . . . . . . . . . . . . . . . . . . . . . . . . . . . . . . . . . . . . . . . . . . . . . . . . . . . . . . . . . . . . . . . . . . . . . . . . . . . . . . . . . . . . . . . . . . . . . 22
3.5 The behaviour tax under varying market conditions . . . . . . . . . . . . . . . . . . . . . . . . . . . . . . . . . . . . . . . . . . . . . . . . . . . . . . . . . . . . . . . . . . . . . . . . . . . . . . . . . . . . . . . . . 23
3.5.1 The crisis and post-crisis period (2008 to 2010) . . . . . . . . . . . . . . . . . . . . . . . . . . . . . . . . . . . . . . . . . . . . . . . . . . . . . . . . . . . . . . . . . . . . . . . . . . . . . . . . . . . . . . . 25
3.5.2 The bull trend (2010 – midway 2014) . . . . . . . . . . . . . . . . . . . . . . . . . . . . . . . . . . . . . . . . . . . . . . . . . . . . . . . . . . . . . . . . . . . . . . . . . . . . . . . . . . . . . . . . . . . . . . . . 25
3.5.3 Flat and fluctuating markets (midway 2014 to end of 2017) . . . . . . . . . . . . . . . . . . . . . . . . . . . . . . . . . . . . . . . . . . . . . . . . . . . . . . . . . . . . . . . . . . . . . . . . . . . . . . 25
3.6 The behaviour tax explained by prospect theory . . . . . . . . . . . . . . . . . . . . . . . . . . . . . . . . . . . . . . . . . . . . . . . . . . . . . . . . . . . . . . . . . . . . . . . . . . . . . . . . . . . . . . . . . . . . 26
3.7 Diversification to minimise the behaviour tax . . . . . . . . . . . . . . . . . . . . . . . . . . . . . . . . . . . . . . . . . . . . . . . . . . . . . . . . . . . . . . . . . . . . . . . . . . . . . . . . . . . . . . . . . . . . . . . 28
4. Helping investors count what counts . . . . . . . . . . . . . . . . . . . . . . . . . . . . . . . . . . . . . . . . . . . . . . . . . . . . . . . . . . . . . . . . . . . . . . . . . . . . . . . . . . . . . . . . . . . . . . . . . . . . . . . . . . 30
4.1 Outcome-based investing perspective . . . . . . . . . . . . . . . . . . . . . . . . . . . . . . . . . . . . . . . . . . . . . . . . . . . . . . . . . . . . . . . . . . . . . . . . . . . . . . . . . . . . . . . . . . . . . . . . . . . 30
4.2 Measuring the suitability of a successful investment strategy . . . . . . . . . . . . . . . . . . . . . . . . . . . . . . . . . . . . . . . . . . . . . . . . . . . . . . . . . . . . . . . . . . . . . . . . . . . . . . . . . . 31
4.3 The OBI Score™ . . . . . . . . . . . . . . . . . . . . . . . . . . . . . . . . . . . . . . . . . . . . . . . . . . . . . . . . . . . . . . . . . . . . . . . . . . . . . . . . . . . . . . . . . . . . . . . . . . . . . . . . . . . . . . . . . . . . . . 31
4.4 Does an outcome-based fund achieve better investor outcomes more often? . . . . . . . . . . . . . . . . . . . . . . . . . . . . . . . . . . . . . . . . . . . . . . . . . . . . . . . . . . . . . . . . . . . . . 34
Conclusion . . . . . . . . . . . . . . . . . . . . . . . . . . . . . . . . . . . . . . . . . . . . . . . . . . . . . . . . . . . . . . . . . . . . . . . . . . . . . . . . . . . . . . . . . . . . . . . . . . . . . . . . . . . . . . . . . . . . . . . . . . . . . . . . . . . . . 36
References . . . . . . . . . . . . . . . . . . . . . . . . . . . . . . . . . . . . . . . . . . . . . . . . . . . . . . . . . . . . . . . . . . . . . . . . . . . . . . . . . . . . . . . . . . . . . . . . . . . . . . . . . . . . . . . . . . . . . . . . . . . . . . . . . . . . . 37

About the authors
The South African investor behaviour tax and helping investors count what counts | Nixon, Barnard, Bornman & Louw | September 2019
Page 1
Dirk Louw Actuarial Analyst, Transaction Capital
Dirk Louw completed his Actuarial Science degrees (BCom and Honours), after which he did a Master’s Degree in Business Mathematics and Informatics (BMI) at the North-West University. As part of his Master’s degree he completed an industry-directed research project at Momentum Investments entitled: “Investigating and quantifying the retail investor behaviour gap in South Africa (2018)”. Continued interest in behavioural finance inspired him to keep investigating investor behaviour. Dirk is currently working as an actuarial analyst at Transaction Capital Recoveries.
Ronnie Bornman, CFA® Portfolio Manager, Momentum Investments
Ronnie Bornman is a portfolio manager with Momentum Investments, responsible for various multi-asset funds in the retail environment, including co-management of the flagship Momentum Focus Fund of Fund range. Prior to joining Momentum Investments he was an integral part of the Momentum Advice & Wealth Management team, overseeing house view investment strategies, risk profile design as well as research and quantitative modelling, predominantly for the retail and franchise segments under license. He holds a BSc in Mathematical Statistics & Operations Research as well as the CFA designation.
Paul Nixon, CFP® MBA Head of Technical Marketing and Behavioural Finance
Paul was partly responsible for institutionalising the client advisory framework from Barclays in the UK as part of the Absa relationship from 2011 to 2016. Barclays were pioneers in applied behavioural finance and demonstrated the value of gauging and managing investor behaviour. Paul set out to understand South African investor behaviour when he joined Momentum Investments in 2017. He established and now chairs a South African first – a behavioural finance research group – with leading universities and institutions locally and abroad. Paul is an Investment Management examiner for the University of the Freestate and completed his MBA with distinction at Edinburgh Business School in 2017.
Martiens Barnard Marketing Actuary, Momentum Investments
Martiens started his career in investments as a business development manager for Absa Financial Services in 2005. He then joined Discovery Invest when it was launched in November 2007, as part of the Invest technical marketing team. He headed up the Invest technical marketing team for the last part of his stint at Discovery Invest before joining Momentum. Martiens was part of the team that pioneered the Momentum OBI Score. The Momentum OBI Score provides an innovative way to compare how well funds were able to achieve a set outcome.

Foreword
The South African investor behaviour tax and helping investors count what counts | Nixon, Barnard, Bornman & Louw | September 2019
Page 2
Greg B Davies, Phd Head of Behavioural Science, Oxford Risk
Greg is a globally recognised expert in applied decision science, behavioural
finance, and financial wellbeing, as well as a specialist in both the theory
and practice of risk profiling. He started the banking world’s first behavioural
finance team as Head of Behavioural-Quant Finance at Barclays, which
he built and led for a decade from 2006. During this time, Greg was the
architect of Barclays’ industry leading behavioural profiling and suitability
tools, a holistic wealth philosophy, and a novel approach to impact investing
and philanthropy.
Past performance is not a reliable guide to the future. Every investor, potential
investor, and casual passer-by of an investment advert has seen this message
innumerable times, and ignored it on every one of them. Every regulator, adviser,
and investment institution knows that such disclosures serve only to tick boxes,
not to change investor behaviour. Yet just as past performance remains the
primary factor in deciding to start a new investment, or make a change to an
existing one, the warnings that this may not be wise remain the same. Chasing
past performance represents the sacrifice of future performance in exchange for
current comfort.
The reason investors make decisions that harm their long-term investment returns
is rarely a lack of knowledge. Investors do not seek the poor outcomes they often
end up with when they deviate from their ‘optimal’ plans. What they are seeking is
comfort and confidence with their finances. However, in the clouds of emotional
turbulence, the best course is often harder to see, and even harder to stick to. It’s
not the reward that needs changing: we just need a more effective (and far less
costly) means of sticking with the discomfort we’ll need to ensure to achieve it.
By viewing investing in a more holistic way – acknowledging that investments are
not inherently good, but instead good for a particular investor for their particular
goals and aspirations – we move beyond a narrow view of what it means to own a
good investment portfolio, to a wider view of what it means to be a good investor.
Investments that stand alone are harder to engage with than ones with a more
obvious personal relevance, with the resultant emotional comfort with investing
that comes with that. Changing investor behaviour is hard. While the underlying
psychological drives may be relatively few, the circumstances in which those
drives express themselves are anything but. And while investors are wired the
same way worldwide, subtle cultural nuances can mean what works in one place

Foreword
The South African investor behaviour tax and helping investors count what counts | Nixon, Barnard, Bornman & Louw | September 2019
Page 3
doesn’t work in another. It’s not always obvious where the cultural fault lines lie.
The key to unlocking these puzzles is data. Well-designed digital collection of data
(of which this report is a valuable example) from the advisers and institutions that
are the guardians, shapers, and trackers of investor behaviour can lead to a deeper
understanding of behaviours in the face of changing circumstances. This does not
happen without effort; however, with the right tools that work with advisers’ and
institutions’ broad base of existing skills and knowledge to help refine and interpret
this data, the task becomes achievable.
Innovative advances in technology, data analytics, and behavioural design can
allow advisers and institutions to turn every interaction with their investors
– across every type of market conditions in every country – into a source of
data enriching investor profiles, and ultimately providing better behavioural
prescriptions for everyone, both at the start of an investment journey, and along its
course.
Contrary to fund performance, when it comes to improving investor behaviour,
poor past performance is all-too-often a reliable guide to poor future performance.
Initiatives and research like this conducted by Momentum Investments that
encourage a more holistic, personal, approach and that move beyond ticked
boxes and crossed fingers are an important change of direction: better financial
outcomes from better investor behaviour and decisions.

The two sides of human economic behaviour“So, behavioural economics is messy. Traditional economics is precisely wrong.”– Richard Thaler
01

Introduction
Many studies have been conducted globally on the behaviour of investors. Most of
them have found that there exists some form of gap between the actual return on
investment (ROI) investors achieved and the ROI investors would have achieved
by following a simple buy-and-hold strategy (Clare and Motson, 2010) (Davies,
2013) (Dalbar, 2016)(Morningstar, 2019). In essence this is a quantification of the
underperformance that tends to follow when investors change the plan (or switch
or change funds) as a result of fear or wanting more. Since this performance gap
results in lower investment returns over time, it is referred to as a “behaviour
tax” in this paper. The investor behaviour tax is the result of two main investor
behaviour phenomena, namely the reluctance to invest, and suboptimal behaviour
when invested. For all investors the first obstacle to overcome is the reluctance to
invest, but after an investor has finally overcome this reluctance, the second cause
of the behaviour gap, suboptimal behaviour, comes into play almost immediately.
The default position for many investors is to sit on the sidelines while waiting for
the “right time” to invest their money. In the interim stale cash balances build up
in low-risk bank accounts instead of gaining growth by investing it in more risky
assets (Davies, 2013). People are generally risk averse, which means that they
tend to fear taking on even the slightest amount of risk. Their fear of making wrong
decisions is greater than their fear of missing out on additional returns. The easiest
time to overcome reluctance is when the economy is booming and investments
perform well. In this case reluctant investors might be influenced by the high
investment returns and their fear of missing out on these returns might surpass
their fear of losses (Jefferies, 2015). Unfortunately this leads to most investors
jumping in when the market is close to its peak, and when the market starts to fall
these investors’ optimism may change into pessimism.
One of the most natural emotions that humans experience when assets fall in
value is anxiousness. In a study conducted by Davies (2013), significant economic
events such as the period of stagflation during the 1970s, the internet bubble in
the early 2000s and the financial crisis of 2008 seem to have caused periods
of high anxiety. Such events cause investors to panic and shift their investment
choices away from risky assets into lower-risk, more stable assets (Rizzi, 2014).
Momentum Investments replicated this element of the Davies’ paper for the South
African equity market from 2006 until 2019 (see figure 2 to follow). The results
and message are very similar, even though the timeframe is much shorter. The
evidence is conclusive – stay invested in the general equity market for six years
and odds are that you will not experience a nominal loss. Change the plan (sell
The South African investor behaviour tax and helping investors count what counts | Nixon, Barnard, Bornman & Louw | September 2019
Page 4
Investor behaviour tax
Gap Gap
Reluctance to invest
Suboptimal behaviour once
invested
Cost of being human
Figure 1: Components of the behaviour tax
Source: Momentum Investments, 2019.

Introduction
or switch to other funds) especially during a time of market crisis or even during a
flat or fluctuating market like South Africa has experienced since 2014, and you are
going to incur losses or a behaviour tax that could be significant. Figure 2 shows
buy times (from the year 1996 to end of 2018) on the diagonal and what the return
was at corresponding sell times on the horizontal axis. The “hotspots” coincide
exactly with major market events. Once again, the Asian crisis of the late 1990’s,
the emerging market spillover in the early 2000s when interest rates hit 17%, the
global financial crisis and South Africa’s recent stagnation. Despite all the
evidence, however, our DNA predisposes us to take mental shortcuts and this
exposes us to flawed thinking when we evaluate our investments. For example,
the representativeness bias suggests that people tend to believe that past and
current experience will continue into the future (Fisher, 2014). The occurrence of
past events may therefore still cause anxiety, especially when the market seems
to behave in similar ways, or if rumours are suggesting that similar events may
happen. Additionally, some investors believe that good past performance will
continue into the future and as a result they switch to funds or portfolios that
performed in the past. Various studies have shown that chasing past performance
does not guarantee future results (Kennon, 2018) (Lamprecht, 2016) (Maymin
and Fisher, 2011).
Carl Richards (2012) suggests that investors should rather focus on their own
behaviour, and not on the market’s behaviour, because investors and financial
advisers only know what the markets have already done, and not what they are
currently doing or going to do next. So by looking at what had already happened,
they try to predict what will happen next. According to Kinsley (2000) this is
like trying to drive a car by looking only in the rear-view mirror. So rather than
looking at the past, he suggests focusing on long-term goals or outcomes while
acknowledging the risk of short-term losses so that these do not come as the
surprise that leads to making irrational decisions.
This white paper sets out with a literature review that supports the root causes of
our instinctual and often suboptimal behaviour. The remainder of the paper is
The South African investor behaviour tax and helping investors count what counts | Nixon, Barnard, Bornman & Louw | September 2019
Page 5
No negative returns on any holding period greater than
6 years
Sell date (monthly)
<-5%
-5% to 0%
0% to 5%
5% to 10%
10% to 15%
>15%
96 0400 08 1598 06 1302 10 1797 0501 1209 1699 07 1403 11 1896
04
12
00
08
16
98
06
14
02
10
18
97
05
13
01
09
17
99
07
15
03
11
Buy date (monthly)
Figure 2: Investor anxiety hotspots (1996 - 2018)
Original Paper: Davies, G.B. 2013. Barclays White Paper: Overcoming the cost of being human

Introduction
practical and begins with clear evidence that the financial services industry is far
from letting the old habit of chasing past performance die. The result of this is that
investors impose a behaviour tax on their investments. This is quantified at a client
level by discussing the investment behaviour of 17 994 South African investors
on the Momentum Wealth platform that deviated from their original investment
strategies from 2008 to 2018. This period offers sufficient data to examine
one complete market cycle from bottom to top. The paper also compares an
equivalent multi-asset investment strategy to ascertain if a well-diversified fund or
investment portfolio of funds would have provided a better investment experience
and outcome for the clients in question. In conclusion it presents the proprietary
Momentum Investments Outcome-based Investing ScoreTM as a practical
framework consisting of the four factors that we believe will help investors to keep
on track to achieve their investment goals. In our view this framework presents the
optimal balance between pursuing an investment outcome (required return) and
due consideration to the investment journey in reaching this investment outcome.
This white paper offers the following insights:
1. Evidence that aggregate industry investment flows are predictable when
looking at 12-month performance statistics. Investors are bargaining on the
wrong thing, past performance, when they make investment decisions.
2. Evidence that this investor behaviour (chasing past performance or the “hot
dot”) results in a behaviour tax, and how this fluctuates with market cycles
when chasing past performance.
The South African investor behaviour tax and helping investors count what counts | Nixon, Barnard, Bornman & Louw | September 2019
Page 6
3. A framework for evaluating investment funds or a portfolio of funds that gives
due consideration to the outcome of the investment as well as the journey in
reaching that outcome. This is demonstrated by the Momentum Investments
Outcome-based Investing ScoreTM.

The origin of investor biases
1.1 Spock versus Homer SimpsonHumans, being emotional beings, tend to get emotionally attached to their
investments. This attachment results in some behavioural patterns that are
inherently part of the human condition. According to Davies (2013) principles
of good investing are based on the assumption that humans as investors are
perfectly calm, unemotional beings and that they are only concerned with long-
term financial objectives. Thaler and Sunstein (2009) refer to investors under this
assumption as Homo economicus or “econs”. According to them Homo sapiens
or humans cannot fully adhere to these principles, and Davies (2014) indirectly
refers to this as the “cost of being human”. He explains that these so-called econs
are purely focused on risk-adjusted returns, simply defined as the return that
shows how an asset’s performance compared to a benchmark asset with the
same level of risk. This risk is usually based on volatility, calculated as the standard
deviation in returns. Davies (2014) feels that humans, on the other hand, would
rather be focused on “anxiety-adjusted” returns due to their emotional nature.
This means that they want the best possible return relative to the amount of
stress and discomfort that they have to endure during their investment journey
(Davies, 2013). As a result these investors are more likely to make decisions that
will provide emotional comfort rather than focusing on achieving their investment
goal, resulting in a behavioural tax. In a humorous interview with Barry Ritholtz
to contrast logic and emotion, Richard Thaler famously related “econs” to the
character Mr. Spock from the popular television series Star Trek and contrasted
him with the more human Homer Simpson (the protagonist of the American
animation series The Simpsons).
01
The South African investor behaviour tax and helping investors count what counts | Nixon, Barnard, Bornman & Louw | September 2019
Page 7
Ritholtz: Or at least tries to be.
Thaler: Pretty much succeeds.
Thaler: No, no, no, I don’t want to go there. But he’s close – closer than you or me – versus, say, Homer Simpson. If you were building a model of economic agents, what would be better – a model of Spock or a model of Homer Simpson?
Ritholtz: Pon farr? If you really want to get wonky …
Ritholtz: Spock would be desirable, but Homer Simpson is the reality.
Thaler: Yes. So, economics is supposed to be about reality. Economics is not a theory of experts. That’s a mistake that lots of people make – that it’s built as if everyone knew as much about a subject as the economists studying it.
Barry Ritholtz: Let’s start with an idea of yours from one of your more recent books that I found fascinating. It’s what you call “econs versus people”. Conventional economics assumes that people are highly rational and unemotional. They can calculate like a computer and have no self-control problems. That leads to two obvious questions. The first is how does this manifest itself in everyday economic choices?
Richard Thaler: Well, the main point is that we’re not econs. We have a theory based on fictional characters. Think of Spock in the old Star Trek series. He’s an econ.
Below is an extract from an interview between Nobel laureate, Richard Thaler and Barry Ritholtz in his “Masters of Business” series from 2015.
continued on the following page ...
Ritholtz: Or at least tries to be.
Thaler: Pretty much succeeds.

The origin of investor biases
1.2 Information processing This contrast between logic and emotion is rooted in the way human beings
perceive and process information. The human brain is exposed to around 18 million
bits of information every second. Our processing power is limited to around 120
bits of information per second. To put that in perspective, the high-speed modems
from the 1980s processed 1 200 bits per second and conversation processes
around 60 bits per second: When two people are talking simultaneously most of
us need to ask one to stop so that we can understand what is being said. This does
not mean that the human brain is suboptimal – the fact that we can read this paper
after hundreds of thousands of years of evolution is proof that our processing
capability has been phenomenal. While the amount of stimuli we are exposed
to has undoubtedly increased, we have been extremely efficient in filtering out
unnecessary information and stimuli so that we can focus on what is important. In
fact a feature of our daily information processing activity is processing information
that is not even there. “We infer that the instances so categorised or identified
have the other properties characteristic of membership in a category” (Bruner,
1973). Recognising cues and features of an object and assigning it to a category
class is one form of going beyond the information given (Wright et al., 2011).
When reading a financial publication and presented with the following word with
a letter missing, “ST_CKS”, the reader would read the missing letter as an “O”
because of the context, even though the word could be “STICKS”. The reason for
this is simple, the shortcut saves time.
01
The South African investor behaviour tax and helping investors count what counts | Nixon, Barnard, Bornman & Louw | September 2019
Page 8
Ritholtz: So, the second question: How is a social science, such as economics, built on such a fundamentally flawed assumption?
Thaler: It didn’t used to be. I would say economics through World War II was behavioural economics. Starting with Adam Smith – especially The Theory of Moral Sentiments, the book before The Wealth of Nations – through Keynes, economics was behavioural.
Then, there was a period of the great mathematisation of economics that started with people like Paul Samuelson. If you’re going to write down mathematical models, the easiest models to write are the ones where people are rational, because you just write “max” and solve, and if you can take a derivative and set it equal to zero, then you’re an economic theorist. If people are doing something more complicated than that, like buying a stock or a fund because of its ticker symbol, good luck writing that down in a mathematical model.

The origin of investor biases
The effects of priming also show how providing information in certain contexts
can influence the way we process this information that transcends to our actual
behaviour. One definition of priming is that exposure to a stimulus influences
the response. After being exposed to a scrambled sentence test where students
were asked to place words like “old” “grey” “Florida” and “retired” in the correct
sequence in various sentences (Bargh, Chen, and Burrows, 1996), participants
were evaluated on how they behaved when they left the test. Surprisingly they
walked slower when leaving the location in comparison to the group that were
presented with the neutral scrambled sentence test that did not refer to old age.
These tests show how we rely on both situational information as well as that
stored in our memory from past experience to make sense of our surroundings
when interpreting the stimuli around us.
1.3 Dual-process theory of thoughtWe probably believe that we are being rational most of the time but the majority
of our thinking happens automatically without our being aware of it, or by instinct.
A quick glance at figure 3 will also reveal that our centre for instinct (the limbic
system in the orange section) in the brain developed as part human evolution,
after the more primitive reptilian brain (blue section). Our default setting using
instinct has assisted us greatly in survival. The brain is able to save valuable
time and resources when making decisions by substituting difficult questions
with easier ones without us being aware of it. In fact it has been shown that the
outcome of a decision can be encoded in brain activity of the prefrontal and
01
The South African investor behaviour tax and helping investors count what counts | Nixon, Barnard, Bornman & Louw | September 2019
Page 9
parietal cortex as much as 10 seconds before it enters awareness (Haynes,
2008). So, by the time we think we are making a decision, much of the time it
has actually already been made. Over roughly the last two decades, psychologists
have distinguished between two systems of thought with different capacities and
processes (Evans 2003, 2008; Kahneman 2011; Kahneman and Frederick 2002;
Metcalfe and Mischel 1999; Sloman 1996; Smith and DeCoster 2000; Strack and
Deutsch 2004). They are referred to as System 1 and System 2 (Stanovich and
West 2000).
System 1: first reactionsFast, automatic, impulsive, associative, emotional and unconscious processing = limbic
System 2: thinkingslower, conscious, reflective, deliberative, analytical, rational, logical processing = neocortex
Figure 3: System 1 and 2
Source: Adapted from Sentient Decision Science, October 2014
The origin of investor biases
While the exact proportion of how much each system is used daily is virtually
impossible to determine, there are many factoids online claiming that system
1 accounts for as much as 95% of our daily processing activity. The closest
academic literature to support any precise proportion would be that 47% of daily
activities were found to be habitual (Neal et al., 2006).
Kahneman (2011) defined these two systems as follows:
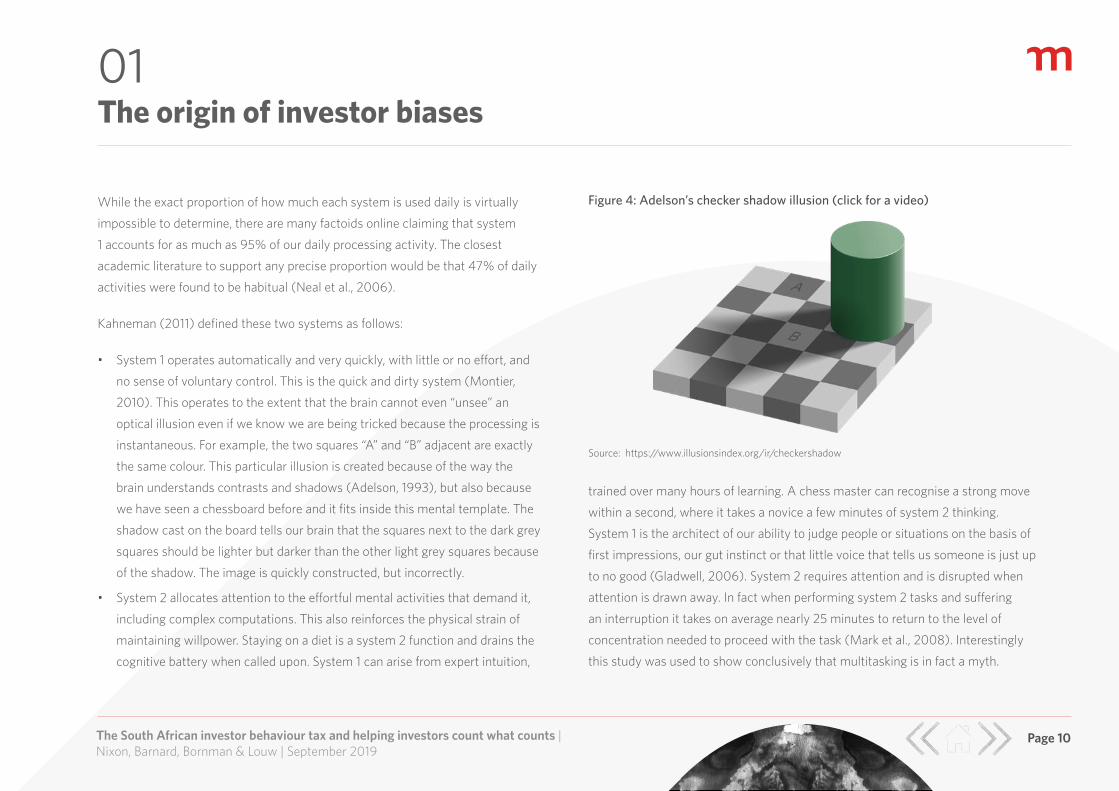
• System 1 operates automatically and very quickly, with little or no effort, and
no sense of voluntary control. This is the quick and dirty system (Montier,
2010). This operates to the extent that the brain cannot even “unsee” an
optical illusion even if we know we are being tricked because the processing is
instantaneous. For example, the two squares “A” and “B” adjacent are exactly
the same colour. This particular illusion is created because of the way the
brain understands contrasts and shadows (Adelson, 1993), but also because
we have seen a chessboard before and it fits inside this mental template. The
shadow cast on the board tells our brain that the squares next to the dark grey
squares should be lighter but darker than the other light grey squares because
of the shadow. The image is quickly constructed, but incorrectly.
• System 2 allocates attention to the effortful mental activities that demand it,
including complex computations. This also reinforces the physical strain of
maintaining willpower. Staying on a diet is a system 2 function and drains the
cognitive battery when called upon. System 1 can arise from expert intuition,
01
The South African investor behaviour tax and helping investors count what counts | Nixon, Barnard, Bornman & Louw | September 2019
Page 10
trained over many hours of learning. A chess master can recognise a strong move
within a second, where it takes a novice a few minutes of system 2 thinking.
System 1 is the architect of our ability to judge people or situations on the basis of
first impressions, our gut instinct or that little voice that tells us someone is just up
to no good (Gladwell, 2006). System 2 requires attention and is disrupted when
attention is drawn away. In fact when performing system 2 tasks and suffering
an interruption it takes on average nearly 25 minutes to return to the level of
concentration needed to proceed with the task (Mark et al., 2008). Interestingly
this study was used to show conclusively that multitasking is in fact a myth.
Source: https://www.illusionsindex.org/ir/checkershadow
Figure 4: Adelson’s checker shadow illusion (click for a video)

The origin of investor biases
A great example of what can be a visibly tenuous conflict between these two
systems was shown by Walter Mischel of Stanford University who conducted
the famous marshmallow experiments in the 1960s and 1970s. The experiment
offered children the option to consume a treat immediately, or wait a few minutes
for double the number of treats. Some made no attempt at self-control (ringing the
bell quickly and eating the reward), others stared at the object of desire until they
gave in a minute or so later, and a few writhed in growing discomfort until they
succeeded in waiting for the bigger reward.
1.4 The mental template System 1 is able to make such rapid decisions because it is very efficient at creating
structures to store and retrieve information, a cognitive structure that represents
knowledge about a concept or type of stimulus and the relations among those
attributes (Fiske and Taylor, 1991). These mental templates or schemas (Piaget
and Cook, 1952) are an important part of cognitive development and formulate our
understanding of the world over time (the variables change as our understanding
changes). Like any template the basic variables and parameters are prepopulated
to speed up the process. Furthermore, we store a multitude of these templates
for easy retrieval and application to any given situation. For example, our “person
schemas” are an archive of preconceptions about people that we have built up
over time. In essence these are stereotypes (Hamilton, 1979). When introduced to
an accountant, your person schema will prepopulate the characteristics of this
01
The South African investor behaviour tax and helping investors count what counts | Nixon, Barnard, Bornman & Louw | September 2019
Page 11
person based on your experience. Thaler and Sunstein (2008) remind us in their
acclaimed book, Nudge, that we would assume a 6-foot-8-inch African-American
man is more likely to be a professional basketball player than a 5-foot-6-inch
Jewish guy because there are lots of tall black basketball players and not many
short Jewish ones. When faced with a given event, the stimuli of the situation are
compared with a schema (Wright et al., 2011). If the schema fits, it will be used
in further processing. These are mental shortcuts (heuristics) to save us time
and help us deal with the all the stimuli we are faced with constantly, a cognitive
screen saver of sorts. While these heuristics have served us extremely well over
the course of our evolution, they are not particularly effective in our investment
decision-making.

The origin of investor biases
1.5 Heuristics and biasesThese shortcuts can be thought of as rules of thumb that inform us immediately
whether a given cue is present, and this allows us to jump straight to an inference
(Wright et al., 2011). They are snap judgements. Kahneman and Tversky (1973)
originally identified and investigated three primary mental shortcuts that we will
place in the context of investment decisions:
1. The availability heuristic: People tend to estimate the frequency of an event
or the likelihood of its occurrence by the ease with which it comes to mind
(Kahneman and Tversky, 1973). Investors will become more risk averse after
a market crash because there are plenty of recent examples available that will
establish and reinforce the belief that markets crash. The same goes for top
performing shares or unit trusts; investors are more comfortable investing
in things that provide recent examples of success because they mistakenly
assume it is more likely than other investments to repeat this success. In a
fairly recent study subjects were given a list of 51 quoted companies, 25 of
which were well known and 26 were relatively unknown (Stephan, 1999).
Adjacent to the company name the share price movement (% gain or loss)
for the day was reported. When the well-known companies were composed
mainly of “losers” for the day, participants reported that there were more
losers overall, even though the opposite was the case.
2. The representativeness heuristic: Investors judge whether an instance (such
as investment outperformance) belongs to a category (such as superior
01
The South African investor behaviour tax and helping investors count what counts | Nixon, Barnard, Bornman & Louw | September 2019
Page 12
2. fund management) based on the similarity of the instance to the category
(Wright et al., 2011). We will shortly see how investors are lured by relative
performance of balanced funds and are drawn like the proverbial moth to
a flame by these instances. People have the tendency to overestimate the
representativeness of a given sample on the basis of the similarity between
the criterion and some information about the properties of the population
(Tversky and Kahneman, 1974). Investors are often caught buying a stock
not because it is a good investment but because it is a good company. This
represents to them what a good share is when in fact paying too much for
something is always a bad investment decision.
3. Anchoring and adjustment: When asked to make estimates, people will
usually begin with an anchor value and make adjustments accordingly. This
trapped a number of unsuspecting investors during the dot-com bubble
when estimates of how far the Dow could go went well past ludicrous. Even
though investors may have realised the unrealistic nature of the estimates,
the fact is that we would likely anchor on that unrealistic estimate and adjust
it downwards according to our own estimate, which in all likelihood would
still result in an overly optimistic estimate in totality (Kahneman and Tversky,
1973).
The origin of investor biases
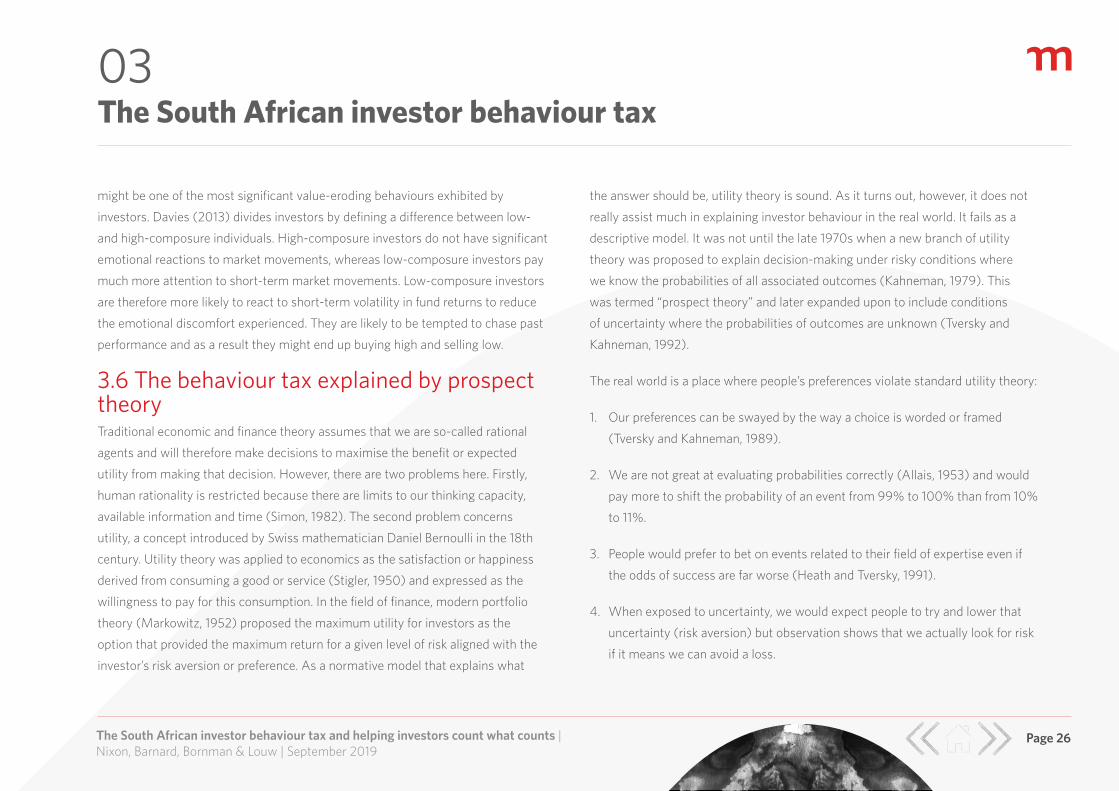
In respect of investor biases, some sources provide a list of more than 120
behavioural biases that we will not address. Three of the major identified biases
relevant to the world of investing are the following:
1. Loss aversion and the disposition effect: The disposition effect refers to
investors’ reluctance to sell assets that have lost value, and a greater likelihood
of selling assets that have made gains (Shefrin and Statman, 1985). These
two effects are linked and will be highlighted in our prospect theory section of
the research results. In effect, because losses hurt more than the equivalent
gain, investors tend to avoid losses by hanging onto losers (hoping to recover
the losses and ratify the original investment decision) and selling winners too
early.
2. Overconfidence: This effect is observed when people’s subjective confidence
in their own ability is greater than their objective (actual) performance. From
an investment perspective this overconfidence has been associated with
higher risk-taking (Hirshleifer & Luo, 2001) and overtrading (Grinblatt &
Keloharju, 2009).
3. The endowment effect: This bias is also quite closely linked with loss
aversion simply because giving up ownership makes us feel like we are losing
something (Wright et al., 2011). Kahneman, Knetsch and Thaler (1991)
01
The South African investor behaviour tax and helping investors count what counts | Nixon, Barnard, Bornman & Louw | September 2019
Page 13
termed this the endowment effect that results in people demanding a sale price for
something usually significantly higher than what it is worth. This effect could come
into play when trying to value our investments.
1.6 Should we be channelling our inner Vulcan?We will end this brief exploration into behavioural finance where we began, with
the ever-logical protagonist, Mr. Spock. The popular culture exploration of reason
over emotion is one with roots in Greek philosophy. Plato described emotion and
reason as two horses pulling in opposite directions. This theme continued into
modern day philosophy where in the 17th century René Descartes proposed a
dualist or distinctly separate “thinking part” of our mind juxtaposed with the purely
mechanical sources of drives and emotion. Immanuel Kant’s world view followed
in the 18th century, proposing that our decisions are informed, contextualised and
therefore very much depend on this tension between emotion and reason. Fast
forward to the early 1920s where Sigmund Freud contributed with his seminal
work on personality theory where the instinctual “id” is suppressed by a higher
cognitive function, the “superego”.
We could therefore be forgiven for thinking that the aim of superior decision-
making would be to lock away emotion and throw away the key. This could not be
further from the truth. Enter neuroscientist Antonio Damasio who published “The
Descartes Error” in 1994 and who developed deep insights through a long clinical

The origin of investor biases
history of treating patients who sustained damage to their ventromedial prefrontal
cortex (vmPFC). This region provides the connecting point to secondary emotions
(those learned from experience) and when that connection is not functioning
correctly, people struggle to function in society. Without delving into too much detail,
Damasio’s famous patient “Elliot,” a real-life Mr. Spock, was left devoid of emotion
when he lost part of his vmPFC while having surgery to remove a tumor. While his IQ
remained intact, he was incapable of making decisions and was totally disconnected
with the world. “I never saw a tinge of emotion in my many hours of conversation
with him: no sadness, no impatience, no frustration,” Damasio writes in Descartes’
Error. Elliot’s brain could no longer connect reason and emotion, something that left
his marriage and professional life in ruins.
As much as emotion and reason appear to be on polar opposites of a spectrum,
neuroscience and neurobiology do not corroborate this at all. In reality they are
inseparably linked in a way that reflects our complexity as human beings. Emotion
is in fact a key component of our decision-making ability, even though in the
world of finance it can often lead us astray. What we need is some healthy middle
ground, some guardrails in the bowling alley of investing.
01
The South African investor behaviour tax and helping investors count what counts | Nixon, Barnard, Bornman & Louw | September 2019
Page 14
As Greg Davies, who heads up behavioural finance for Oxford Risk, puts it, “It is
about moving behavioural finance from the fringe to the core of decision-making
systems. About blending the best of both worlds. It’s about using ‘decision
prosthetics’: tools that help guide humans towards a better, engaged, decision, not
make it for them.”

“The design of this experiment reveals thatinstitutional investors, just as individual investors, have their attention ultimately attracted by past price increases.” Robert Shiller
02 The cause: Chasing the “hot dot”

Aggregate investor behaviour using discretionary balanced flows
2.1 IntroductionIn 2019 Momentum Investments set out to establish how big an influence past
performance was in the investor decision-making process and if this effect
was evident based on industry investment flows. The study was conducted to
understand the decision-making process and/or any relevant biases, but also to
ascertain if decisions taken lead to the behaviour tax as we suspected, and if so,
whether it could be quantified.
The study looked at all new business cases submitted between the start of 2010
and the end of 2018 – the value of these 200 000 investments added up to in
excess of R100 billion. This is different from many other studies, as the norm is
to investigate how investors behave subsequent to investing. Here the focus was
on behaviour already present at the outset of the investment. Even though the
study considered trends in new business flows that would be affected by macro-
economic factors and investor sentiment (such as changes in trends across
sectors and flows into offshore funds), this was not the main focus. The focus
was on the subtle choices made in terms of choosing one fund above another
when they appear to be similar. Emphasis was placed on the changing behaviour
as reflected by the new business allocation to four well-known single manager
balanced funds in the ASISA Multi-asset High Equity sector. While these funds
may have underlying differences, many clients and financial advisers see them as
substitutes for each other.
02
The South African investor behaviour tax and helping investors count what counts | Nixon, Barnard, Bornman & Louw | September 2019
Page 15
2.2 Initial findings: Cross sector allocation/offshore flowsIn the aftermath of the financial crisis in 2008, a large portion of new business
flows was invested into conservative funds. Compared to a proxy of popular
conservative balanced and equity funds, more than 60% of the flows to these
sectors went into conservative funds in 2009. This trend played out again as
balanced funds received more than 70% of the inflows in the latter years. Our
results showed that being overly conservative after the financial crisis did not lead
to optimal results for investors. Clients should have invested in line with what they
really needed, instead of letting their fear of another financial crisis cloud their
better judgement.
While most investors followed the trend to invest in conservative funds in 2009 to
minimise their risk, some did invest against this trend. Their choice for more risk is
reflected by the 10% allocation to an equity fund (compared to the long-term trend
of investing 5% or 6% in equities). In retrospect, this was an appropriate decision,
not just based on the result, but also because asset values where severely depressed
at the time.
The initial over-allocation to conservative funds led to a significant behaviour gap. Over the course of 2010, 2011 and 2012, there was a difference of more than 4,5% in yearly returns between the conservative fund and balanced fund in question (and many investors should have been invested in the balanced fund, had they been investing according to
their needs).

Aggregate investor behaviour using discretionary balanced flows
Flows into the most used offshore funds on the Momentum Wealth platform also
displayed significant changes with yearly flows increasing by more than 400% in
less than two years. This increase followed a sustained period of rand depreciation.
2.3 Overall results The main analysis, of the allocation of new business into four balanced funds,
showed that the proportionate allocation to these funds varied significantly over
time. It showed that the allocation to even the most popular fund halved at times.
The fund that received the lowest inflows initially paints the opposite picture. Its
initial allocations of 5% to 6% of all allocations improved to more than 25% of the
total allocation in later years, just to reduce to levels close to its initial allocation
again. The aim of the study was to understand what drove this change in allocations.
The key findings were as follows:
1. New business allocation is driven by a combination of factors, which includes
the current allocation; a function of relative past returns; and secondary
factors. These include how long the outperformance persisted and if any
outperformance was shared.
2. A behaviour tax was identified as investors generally missed the
outperformance cycle when chasing past performance.
02
The South African investor behaviour tax and helping investors count what counts | Nixon, Barnard, Bornman & Louw | September 2019
Page 16
2.4 The effect of past performance on fund selectionTo understand the changing allocation between the funds better, one first needs
to understand what happened to the overall flows in the sector. In the analysis
period, there was a general upward trend up to about the end of 2014. Thereafter,
the allocation to balanced funds reduced significantly for about a year, after
which it slowly lost traction for the remainder of the study. Had the funds each
just followed the overall trend, the new business flows into each fund would have
maintained the same pattern. This was not the case.
The assumption:
Recent relative past performance between these four funds led to the
change in allocation

Aggregate investor behaviour using discretionary balanced flows
To understand if the assumption was accurate, we compared each fund’s inflow
to the average inflows seen on these funds. (This is illustrated by the grey area
on figure 5.) This area was added to see if the relative flows to the average was
increasing or decreasing. We then highlighted periods of increased support
for each fund (in blue). We then checked if relative outperformance coincided
with these periods. To do this, we added the relative 12-month performance (the
performance was offset to align to the yearly flows, which occurred six months later).
The relative fund performance shows how much the respective fund outperformed
the worst performing of the four funds over a 12-month period. Thus, a 10% relative
outperformance (displayed on the left-hand axis), implies that the fund did 10%
better than the worst of the four funds over the preceding 12-month period.
02
The South African investor behaviour tax and helping investors count what counts | Nixon, Barnard, Bornman & Louw | September 2019
Page 17
From figure 5, the high correlation between the relative performance of a fund’s
return (red area) and increased new business flow (blue overlays) can clearly
be seen. When looking at Fund A, one can clearly see two periods in the first
half of the analysis in which it lost support. (These changes coincided with the
gaps between the blue areas.) Over the period when balanced funds lost overall
support, Fund A lost a larger share of its support (which again coincides with a
period of relative underperformance).
The most interesting insight is the fourth blue area, which overlapped with the
longest relative outperformance and the highest positive change in inflows – the
grey area. The same pattern followed when analysing the other three funds, but
it was clear that outperformance, when shared, did not have the same impact as
individual relative outperformance.
Figure 5: The analysis of Fund A
In a nutshell: Recent past performance bias has a significant impact on
fund selection behaviour.
Source: Momentum Investments, Morningstar
Average new business flowsBalanced fund A new business flows

Aggregate investor behaviour using discretionary balanced flows
2.5 How the behaviour tax is created when past performance informs fund selectionBy chasing past performance to try and outperform, investors achieved the
opposite. Table A adjacent shows the historic order of the relative 12-month
performance of the four well-known balanced funds. The top row shows the
best-performing funds during the time period of the analysis, and the fourth row
the worst performing funds over the period.
Based on the colouring, it’s easy to see that the position of their performance
changes frequently (even though there are stints of consistent outperformance
or underperformance by some of the funds). For instance, Fund B was the best
performer for long stretches of time, but was also the worst performer of the
four at times. How did flows into these funds react to this performance? We
calculated the change in yearly inflows over time, and ordered it according
to the performance a few months earlier. We then coloured each block in the
table according to its flow trend, where green indicates a positive trend and
red a negative trend. It is clear to see that the top rows in table B (the better
performers a few months ago) are more green and the bottom performers (the
bottom rows) are more red. This is a clear indicator that past performance plays a
significant role in future new business inflows.
02
The South African investor behaviour tax and helping investors count what counts | Nixon, Barnard, Bornman & Louw | September 2019
Page 18
Table A: Ordered performance of four well-known balanced funds
Fund A
B
Fund B Fund C Fund D
Source: Momentum Investments
Table B: Investment flows follow performance
Downward trend Upward trend
Downward trend Upward trend
Table C: Performance does not follow flows
Source: Momentum Investments
Source: Momentum Investments

Aggregate investor behaviour using discretionary balanced flows
We then examined what the effect of this selection methodology was on the
relative performance of these new investments to see if chasing past performance
increased the future performance of these investments. Using the same colouring
scheme as before we put the current trends in new business flows in order and
in terms of future performance (table C). Thus, if the funds that are experiencing
significant inflows perform better in the future, it would pull more green to the top
of the table and push more red lower down on the table. But we saw the opposite.
The fund selection methodology turns the top half of the table more red (which
means the better future performers got less inflows) and the bottom half more
green, even though it is not with the same magnitude as the results in table B. Thus
– positive trends in fund flows (which are driven by superior past performance) do
not correlate to the future performance and actually shows a negative correlation.
When combining these findings from all three tables, the following results were
evident. Balanced funds go through performance cycles and superior long-term
outperformance is difficult to achieve. Yet, as a fund shows superior 12-month
relative performance, it has a significant impact on the new business flows that
the fund receives. New investors, who make their fund selection decisions based
on past performance, do not experience a repetition of this past performance; they
only experience the future performance that must still transpire. Unfortunately,
the average experience shows that the selection methodology used to place
their money into these funds misses the outperformance cycle, leading to them
experiencing relative underperformance. This cycle of how these four funds
performed according to flows and returns are demonstrated in figure 6.
02
The South African investor behaviour tax and helping investors count what counts | Nixon, Barnard, Bornman & Louw | September 2019
Page 19
B
Source: Momentum Investments
Figure 6: The trend of inflows to outperformance turning to underperformance

Aggregate investor behaviour using discretionary balanced flows
*The past performance is based on 12-month performance and even though it
was never experienced by the investor, it takes a few months to phase out of the
analysis. As such, the graph takes much longer to turn red than the time it takes
for the investor to experience relative underperformance.
02
The South African investor behaviour tax and helping investors count what counts | Nixon, Barnard, Bornman & Louw | September 2019
Page 20
More information about the graph
Point B (corresponds to the timing of Table B)
Balanced funds that had higher relative past performance, received higher
relative inflows.
Point C (corresponds to the timing of Table C)
Balanced funds that had higher relative inflows on average achieved a lower
relative future performance.
At points further into the future, the past inflows do not display a significant
correlation to performance.
(For the more technically inclined readers: The height at each point on the graph was created
by converting each time period (and therefore each potential table similar to Table B and C)
into a single index value that is higher when trending funds correspond to better performance
and vice versa.)
In essence, past performance affects future flows, which on average detracts
from a client’s future performance. This trend of chasing past performance
when allocating new investments to outperforming balanced funds is a form of
behaviour tax. Even though it was quantified in the study, the remainder of the
paper will focus on and quantify a similar behaviour tax, but one created by a
different event. The remainder of the paper looks at the South African behaviour
tax created by switching between funds.

“The investor’s chief problem – and even his worst enemy – is likely to be himself.” - Benjamin Graham
03 The symptom: A behaviour tax

The South African investor behaviour tax
3.1 IntroductionThe journey to uncover the behaviour tax at a client level began in 2018 as
Momentum Investments initiated a project as part of the North West University’s
Business Mathematics and Informatics (BMI) initiative. The project was part of a
Masters dissertation and demonstrated traction in respect of the Department of
Science and Technology’s industry-university engagement. To reiterate, we define
a “behaviour tax” for the purposes of this study as a cost to the investor that is
calculated as the difference between what an investor should have earned if he or
she kept to his or her investment strategy (the theoretical buy-and-hold strategy)
and what he or she actually earned (measured by calculating the internal rate of
return or IRR) on the investment.
3.2 Study parametersThe approach to the study was to gather transactional data from the Momentum
Wealth platform from January 2008 to December 2017 (10 years). The dataset
provided detailed information about the timing, amount and any switching
transactions (ie switching money from one or more funds to another fund or
combination of funds) made over the course of the investment.
In summary, an initial group of 79 322 investors was identified and classified as:
• natural persons (excluding companies and trusts);
• those who started investing between 2008 and 2015 (minimum two-year
investment period); and
• those using the flexible investment option (FIO) product on the Momentum
Wealth platform (typically used for discretionary investing).
Subject to further data refinement, this narrowed the investors examined to 17 994
individuals who may be classified as “switchers” for the purposes of this
white paper.
03
The South African investor behaviour tax and helping investors count what counts | Nixon, Barnard, Bornman & Louw | September 2019
Page 21
Switch 2
Switch 1
Theoretical buy-and-hold return (original strategy)Investor actual return (IRR) Behaviour
tax of 1%
Calendar year
9%
10%
Figure 7: Hypothetical switch behaviuour to illustrate the behaviour tax
Source: Momentum Investments

The South African investor behaviour tax
3.3 Calculation methodologyTo quantify the behaviour tax various measures of return have to be calculated.
In the studies provided by Clare and Motson (2010) and Dalbar (2016) the
investor behaviour gap was calculated as the difference between investors’
money-weighted rate of return (MWRR) and their time-weighted rate of return
(TWRR), with the difference being attributed to poor market timing by investors.
The MWRR reflects the timing and amount of money inflows and outflows and is
consistent with the observed profit or loss realised on a fund (Illmer and Wolfgang,
2003). According to Illmer and Wolfgang (2003), the MWRR is affected by
three main factors, namely the benchmark effect, the management effect, and
the timing effect. The benchmark effect is the return contribution made by the
benchmark return of the initial investment while the management effect is the
return contribution made by the decision to change the asset allocation relative
to the benchmark over the investment period. The timing effect is the return
contribution made by the decision to change the amount of money invested in the
benchmark and/or asset allocation strategies. The MWRR is therefore a measure
of the internal rate of return (IRR), which is a true representation of an investor’s
return while the TWRR by contrast is not affected by changes in the amount of and
timing of money invested. It does allow for fund comparisons across peer groups
and against a benchmark or an index (Illmer and Wolfgang, 2003), but is not really
suitable for an investor behaviour tax study as the MWRR is the only relevant
indicator of the investor experience. This criticism is supported by Edesess et al.
(2014) who conclude that calculating a gap using these two different measures
would not produce very accurate results. Only MWRR comparisons were therefore
conducted.
3.4 Overall resultsOf the 17 994 investors analysed between 2008 and 2018, the results can be
separated into the two distinct gaps studied.
The first gap relates to the behaviour tax, the extent thereof and its origins:
• Approximately one-third of the 79 322 investors analysed switched at least once
from 2008 to 2018.
• Over 60% of investors were chasing past performance when they switched
funds.
• A return of 3% lower on the investor’s current fund was enough to trigger a
switch.
• 22,7% of investors imposed a behaviour tax in excess of 1% per year on their
investment returns when compared to the equivalent buy-and-hold strategy.
• During a market crisis the number of investors affected doubles and the
behaviour tax escalates to 1,1% per year.
• 10% of investors imposed a behaviour tax in excess of 2,6% per year on their
investment returns when compared to the equivalent buy-and-hold strategy.
03
The South African investor behaviour tax and helping investors count what counts | Nixon, Barnard, Bornman & Louw | September 2019
Page 22

Behaviour tax and helping investors count what counts 33%
of the 79 322 investors analysed switched at least
once
60%of investors were
chasing past performance when
they switched funds
3%A return of 3% lower on
the investor’s current fund was enough to
trigger a switch
10%of investors imposed a behaviour tax in excess
of 2,6% per year on their investment returns*
*when compared to the equivalent buy-and-hold strategy
22,7%of investors imposed a behaviour tax in excess of 1% per year on their
investment returns*
60%of the time, the equivalent
OBI fund would have outperformed the
investors’ initial choice
33%of investors had an OBI gap larger than
1% per year
10%of investors had an OBI gap larger than
3% per year
2xDuring a market crisis
the number of investors affected doubles and the behaviour tax escalates
to 1,1% per year
GAP 1 = BEHAVIOUR TAX
Of the 17 994 investors analysed between
2008 and 2018, the results can be separated into the two distinct gaps
GAP 2 = OBI GAPThe potential gap between
the investor’s initial choice &an outcome-based solution
(OBI solution)
A lower return investor’s re-alise from changing the plan
or switching

The South African investor behaviour tax
3.4 Overall results (continued)The second gap relates to the potential gap between the investors’ initial choice and
the equivalent diversified fund (an outcome-based solution or OBI fund). Once again
a gap was clear to the following extent:
• More than 60% of the time, the equivalent OBI fund would have outperformed
the investors’ initial choice.
• OBI funds outperformed the investors’ initial selection by 0,70% per year on
average.
• 33% of investors had an OBI gap larger than 1% per year.
• 10% of investors had an OBI gap larger than 3% per year.
The message here is clear. Investors chase past performance when they decide
to change the plan or switch funds. We will see shortly that this is more related
to loss aversion and fear than greed, while both remain strong motivators of
investor decisions. When switching, investors may impose a behaviour tax on their
investments. A 1% per year behaviour tax would cost investors 22% in investment
value over 10 years, assuming a growth rate of 10% per year, so this could be
a substantial cost. If investors had chosen a diversified fund at the outset, they
would have outperformed their own choice on 60% of occasions and by 0,70% on
average per year. There is little more to be said about the benefits of focusing
03
The South African investor behaviour tax and helping investors count what counts | Nixon, Barnard, Bornman & Louw | September 2019
Page 23
on an investment goal, linking this to a well-diversified investment strategy, and
sticking to the plan over time.
3.5 The behaviour tax under varying market conditionsAs it turns out, the behaviour tax is not constant. To examine its extent a return
erosion index was constructed to indicate the severity of the behaviour tax
generated between the investors’ actual return and the buy-and-hold strategy over
time as market conditions vary. The red zones indicate the two severe market cycles,
the gradient showing how the behaviour tax is increasing to its maximum point. In
both cases it is clear that volatile markets cause panic switching and investors are
simply in the wrong place at the right time.
The research timeline was matched to three distinct market periods as follows:
1. The crisis and post-crisis period from the start of 2008 until the start of 2010.
2. A bull trend from the start of 2010 until midway through 2014.
3. A flat and fluctuating market from midway through 2014 until the end of 2017.

The South African investor behaviour tax03
The South African investor behaviour tax and helping investors count what counts | Nixon, Barnard, Bornman & Louw | September 2019
Page 24
Figure 8: Value erosion hotspots 2008 - 2018
Source: Momentum Investments
Behaviour tax increasing
55 000
50 000
45 000
40 000
35 000
30 000
25 000
Behaviour tax increasing
Bull trendCrisis and post-crisis
2016201520142013201220112010 2017
Flat & fluctuating
Crisis period Bull trend Flat/fluctuating market
Number of investors 729 8 587 8 676
Average behaviour tax 1,11% p/y -0,07% p/y 0,42% p/y
% population with behaviour tax > 1%
45% 20% 24%
% population with behaviour tax 62% 42% 53%
20092008

The South African investor behaviour tax
3.5.1 The crisis and post crisis period (2008 - 2010)
During and shortly after the financial crisis of 2008, the economy was shocked
by asset class correlations approaching one, and therefore dramatic price declines
(Barberis, 2013). The result of this decline was arguably that many investors
became anxious and loss-averse. The effect of such emotions can be confirmed
by the flow of assets from balanced asset allocation funds into lower-risk bond
and money market funds (Louw, 2018) over this period. Interestingly, the results
for this period gave no clear indication that investors were actively switching to
funds with better past performance. The average investor behaviour gap was large
regardless of whether investors chased past performance or not. The conclusion
may be drawn that the behaviour was more based on fear (loss aversion) than
greed.
3.5.2 The bull trend (2010 - midway 2014)
The first clear observation is that during the bull market, on average the
behaviour tax was very slightly negative (near zero at 7bps). Effectively investor
switching behaviour added no value on average even though markets were rising.
Furthermore, multiple studies have shown that accurate market timing cannot
be done consistently (Clare and Motson, 2010) (Clare et al., 2009) (Friesen and
Sapp, 2007). Unsurprisingly our results confirmed this. A greater proportion of
investors (63%) were switching to funds with better past performance during this
period and this group of investors (subset of the population) were able to
03
The South African investor behaviour tax and helping investors count what counts | Nixon, Barnard, Bornman & Louw | September 2019
Page 25
generate a negative behaviour tax of 0,07% per year. In essence they were able
to generate some value from the activity, initially at least. Such gains are likely to
induce overconfidence, optimism and greed (Goldberg et al., 2004). This might
have led these investors into believing in their ability to time the market instead of
simply being lucky. At some point overconfident investors are bound to run out of
luck and this is exactly what happened when the bull trend came to an end while
switching behaviour was still increasing significantly. During the first half of 2014
the proportion of switchers that were chasing past performance had increased
from 63% to 79% and all investors that switched during the first half of 2014
imposed a subsequent behaviour tax of 0,81% per year, effectively eliminating
previous gains and placing these investors in the red overall once more.
3.5.3 Flat/fluctuating markets (midway 2014 - 2018)
After July 2014, the momentum from the bull period began to subside with more
fluctuation in equity markets. The number of investors imposing a 1% behaviour
tax or more on their investments is evident with an increase from 20% to 24%.
Once again the emotional discomfort resulting from such volatility in returns
is evident and leads to an increase in the proportion of investors chasing past
performance (66%) with a larger behaviour gap for this subset of the population
at 0,60% per year. Of those investors who lost more than 1% per year from the
behaviour tax, 75% were chasing past performance, proving that this behaviour
The South African investor behaviour tax
might be one of the most significant value-eroding behaviours exhibited by
investors. Davies (2013) divides investors by defining a difference between low-
and high-composure individuals. High-composure investors do not have significant
emotional reactions to market movements, whereas low-composure investors pay
much more attention to short-term market movements. Low-composure investors
are therefore more likely to react to short-term volatility in fund returns to reduce
the emotional discomfort experienced. They are likely to be tempted to chase past
performance and as a result they might end up buying high and selling low.
3.6 The behaviour tax explained by prospect theoryTraditional economic and finance theory assumes that we are so-called rational
agents and will therefore make decisions to maximise the benefit or expected
utility from making that decision. However, there are two problems here. Firstly,
human rationality is restricted because there are limits to our thinking capacity,
available information and time (Simon, 1982). The second problem concerns
utility, a concept introduced by Swiss mathematician Daniel Bernoulli in the 18th
century. Utility theory was applied to economics as the satisfaction or happiness
derived from consuming a good or service (Stigler, 1950) and expressed as the
willingness to pay for this consumption. In the field of finance, modern portfolio
theory (Markowitz, 1952) proposed the maximum utility for investors as the
option that provided the maximum return for a given level of risk aligned with the
investor’s risk aversion or preference. As a normative model that explains what
03
The South African investor behaviour tax and helping investors count what counts | Nixon, Barnard, Bornman & Louw | September 2019
Page 26
the answer should be, utility theory is sound. As it turns out, however, it does not
really assist much in explaining investor behaviour in the real world. It fails as a
descriptive model. It was not until the late 1970s when a new branch of utility
theory was proposed to explain decision-making under risky conditions where
we know the probabilities of all associated outcomes (Kahneman, 1979). This
was termed “prospect theory” and later expanded upon to include conditions
of uncertainty where the probabilities of outcomes are unknown (Tversky and
Kahneman, 1992).
The real world is a place where people’s preferences violate standard utility theory:
1. Our preferences can be swayed by the way a choice is worded or framed
(Tversky and Kahneman, 1989).
2. We are not great at evaluating probabilities correctly (Allais, 1953) and would
pay more to shift the probability of an event from 99% to 100% than from 10%
to 11%.
3. People would prefer to bet on events related to their field of expertise even if
the odds of success are far worse (Heath and Tversky, 1991).
4. When exposed to uncertainty, we would expect people to try and lower that
uncertainty (risk aversion) but observation shows that we actually look for risk
if it means we can avoid a loss.
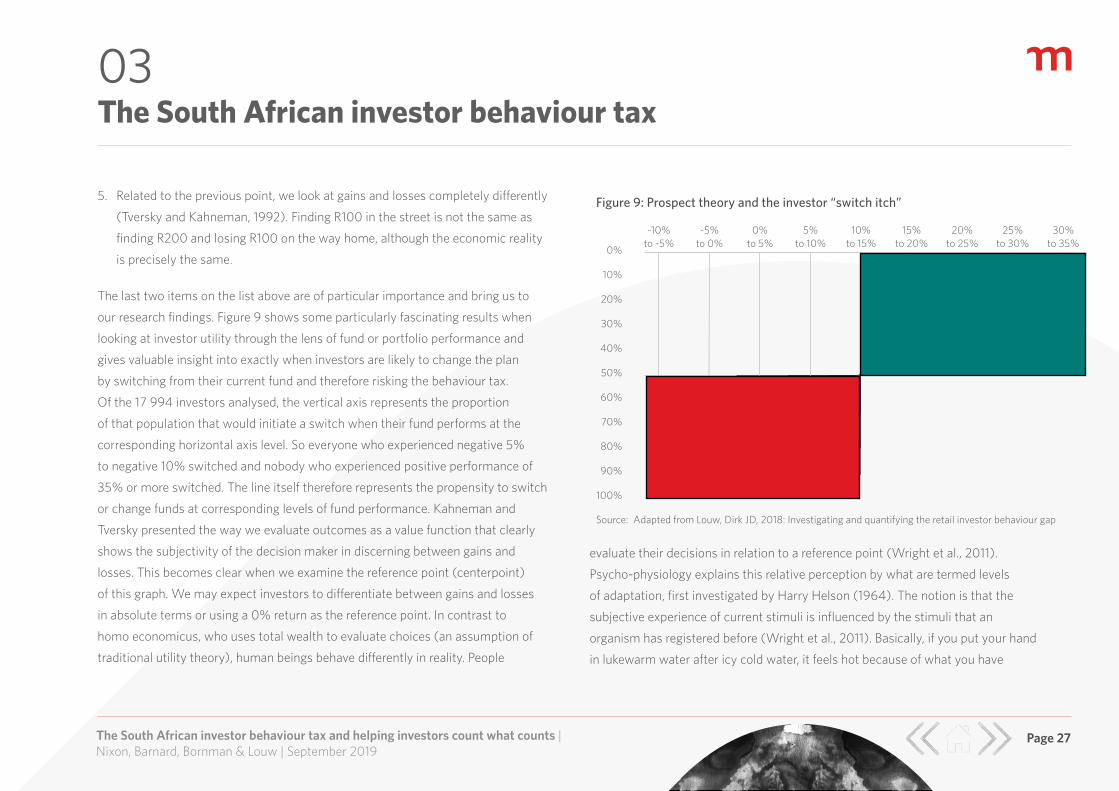
The South African investor behaviour tax
5. Related to the previous point, we look at gains and losses completely differently
(Tversky and Kahneman, 1992). Finding R100 in the street is not the same as
finding R200 and losing R100 on the way home, although the economic reality
is precisely the same.
The last two items on the list above are of particular importance and bring us to
our research findings. Figure 9 shows some particularly fascinating results when
looking at investor utility through the lens of fund or portfolio performance and
gives valuable insight into exactly when investors are likely to change the plan
by switching from their current fund and therefore risking the behaviour tax.
Of the 17 994 investors analysed, the vertical axis represents the proportion
of that population that would initiate a switch when their fund performs at the
corresponding horizontal axis level. So everyone who experienced negative 5%
to negative 10% switched and nobody who experienced positive performance of
35% or more switched. The line itself therefore represents the propensity to switch
or change funds at corresponding levels of fund performance. Kahneman and
Tversky presented the way we evaluate outcomes as a value function that clearly
shows the subjectivity of the decision maker in discerning between gains and
losses. This becomes clear when we examine the reference point (centerpoint)
of this graph. We may expect investors to differentiate between gains and losses
in absolute terms or using a 0% return as the reference point. In contrast to
homo economicus, who uses total wealth to evaluate choices (an assumption of
traditional utility theory), human beings behave differently in reality. People
03
The South African investor behaviour tax and helping investors count what counts | Nixon, Barnard, Bornman & Louw | September 2019
Page 27
Source: Adapted from Louw, Dirk JD, 2018: Investigating and quantifying the retail investor behaviour gap
0%
10%
20%
30%
40%
50%
60%
70%
80%
90%
100%
-10% to -5%
10% to 15%
5% to 10%
0% to 5%
-5% to 0%
15% to 20%
20% to 25%
30% to 35%
25% to 30%
Figure 9: Prospect theory and the investor “switch itch”
evaluate their decisions in relation to a reference point (Wright et al., 2011).
Psycho-physiology explains this relative perception by what are termed levels
of adaptation, first investigated by Harry Helson (1964). The notion is that the
subjective experience of current stimuli is influenced by the stimuli that an
organism has registered before (Wright et al., 2011). Basically, if you put your hand
in lukewarm water after icy cold water, it feels hot because of what you have
Gain Zone
Loss Zone

The South African investor behaviour tax
experienced before. Figure 9 shows that to the right of the reference point
investors are in the gain zone. We know this because the utility function to the
right of the reference point resembles the traditional diminishing marginal utility
curve. Investors become less sensitive to changes in fund performance as this
performance increases. They are more likely to switch when their funds are
performing at between 10% and 20%, for example, than when they are returning
more than 35%. To the left of the reference point investors are in the loss zone. We
can now clearly see a different relationship as the curve becomes much steeper,
indicating sensitivity is increasing at an increasing rate. The reference point in
itself is interesting in that the average investor clearly views fund performance of
less than 10% as a loss, or rather this is the inflection point at which sensitivity
increases at an increasing rate. This may provide an interesting window into what
investors deem fair compensation for taking risk as deposit rates in South Africa on
average approached 6,5% over this period. Our insights here in summary are:
1. The behaviour tax is rooted in fear and loss aversion.
2. Investors are on average 1,7 times as likely to switch when their funds perform
at between 7% and 10% than when they perform at between 10% and 13%.
3. Investors are more than twice as likely to switch when their funds are yielding
from 2,5% to 7,5% than when they return 22% or more.
4. Client engagement strategies need to cater for times when the investor “switch
itch” is heightened to keep clients invested and on track to achieve their goals.
03
The South African investor behaviour tax and helping investors count what counts | Nixon, Barnard, Bornman & Louw | September 2019
Page 28
3.7 Diversification to minimise the behaviour tax
Figure 10 shows the difference in the equivalent OBI fund and an investor’s initial
choice over time, on average. These were matched by using the closest equivalent
OBI fund based on asset allocation. The results vary from approximately 40bps on
the CPI + 2% to 3% target to 160bps on the CPI + 6% to 7% target respectively.
The investor’s initial choice was also compared to an outcome-based investing
(OBI) approach to ascertain if a more diversified investment strategy on average
would have made a difference to the eventual result for investors.
2-3 2-35-64-53-4Target (CPI+x%)
Figure 10: Investor selection versus equivalent OBI fund (CPI target %)
Source: Adapted from Louw, Dirk JD, 2018: Investigating and quantifying the retail investor behaviour gap
Average OBI return Average investor return
6%
7%
8%
9%
10%
11%
12%
13%

The South African investor behaviour tax
It should also be noted that the results were delivered at the same or (in most
cases) lower levels of investment volatility measured by standard deviation. Lower
volatility is however not an explicit aim for an outcome-based investing philosophy.
Figure 11 shows the cumulative effect of an investor who chooses a well-diversified
investment fund and sticks with the plan over his or her investment horizon.
The stack chart shows that investors could add from just over 40bps in the CPI
+ 2% to 3% target range to a substantial 140bps or 1,40% on average to their
investment returns by following this approach.
In conclusion, sticking to an outcome-based solution or fund where asset
allocation is tied to an investment outcome for investors appears to yield a better
result over time. This is particularly revealing and is also indicative of the “shock
absorber” effect that good asset allocation provides investors, who in turn are
more comfortable to stay the course of the journey and in doing so minimise the
cost of the behaviour tax.
03
The South African investor behaviour tax and helping investors count what counts | Nixon, Barnard, Bornman & Louw | September 2019
Page 29
Figure 11: The cumulative effect of both gaps per CPI mandate
Source: Adapted from Louw, Dirk JD, 2018: Investigating and quantifying the retail investor behaviour gap
1,4%
1,2%
1,0%
0,8%
0,6%
0,4%
0,2%
0%2-3 5-64-53-4 6-7
Behaviour tax
OBI gap

“Many people have made money selling magic potions and Ponzi schemes, but few have gotten rich selling the advice, Don’t buy that stuff.”- Richard Thaler
The prescription: An alternative anchor04

Helping investors count what counts
It is clear from the preceding sections demonstrating the existence and effect of
the behaviour tax that the cost of being human is still very much a phenomenon
that investors, their financial advisers and seasoned professionals suffer from.
This is despite the innumerous literature on behavioural finance. To expect all
investors to behave without any bias would be akin to expecting markets to
behave perfectly efficiently, something the past 50-60 years or so have shown to
be an unreasonable expectation. Therefore, what we propose here is not a cure,
but rather a behavioural prosthetic, as Davies refers to it, that will help investors
in making decisions that will not only help alleviate their behaviour tax, but also
reduce their anxiety along the way.
4.1 Outcome-based investing perspective
As the name eludes, outcome-based investing (also referred to as goal-based
investing) is primarily concerned with achieving a predefined outcome. Our
research has shown that the majority of client investments are made with a
particular goal or desired outcome in mind, eg save for a comfortable retirement
or invest for a child’s education. Very simplistically, from the perspective of an
investor, such an outcome simply boils down to two things; “how much” and
“by when”. Add to this the amount(s) available to invest towards this goal and
it becomes a simple time-value-of-money calculation to determine the required
investment return needed to turn the desired outcome into a reality. A successful
investment from the perspective of a client must therefore be measured by
whether or not the outcome (retiring comfortably, saving for education) was met,
which can be directly attributed to whether or not the required investment return
was realised over the full investment term. Acknowledging this perspective as the
applicable measure of a successful investment, is a reasonable precursor towards
avoiding many of the behavioural pitfalls that have been shown to lead to the
“behaviour tax”. It focusses the investor on what really matters. This is a departure
from measures of success based on intra-asset manager rankings, performance
measurement against somewhat arbitrary benchmarks and in particular the focus
on short-term (3-month to 12-month) past performance, which has been shown in
section 2 often to be a reasonable predictor of investor fund selection behaviour.
With a successful investment outcome in mind, the next logical requirement
would be to construct an investment portfolio that satisfies the determined
required rate of return over the desired investment horizon. This can be an
onerous endeavour given the varying levels of risk and the regulatory constraints
and complexity encountered in executing and managing such an investment
portfolio on an ongoing basis. Luckily this part of the investment process can
be easily outsourced. Many funds exist that have such predefined return (and
risk) objectives as stated benchmarks. The Momentum Focus Fund of Fund and
Momentum Target Fund of Fund ranges are examples of funds that are aligned to
this outcome-based investing perspective. These funds are specifically managed
to Momentum’s explicit outcome-based investing philosophy, which minimises
the risk of misalignment between the investment manager and the investor’s
measures of success, a key but often overlooked point. The Momentum outcome-
based funds cover the entire spectrum of return and risk objectives, which imply
04
The South African investor behaviour tax and helping investors count what counts | Nixon, Barnard, Bornman & Louw | September 2019
Page 30

Helping investors count what counts
that matching an investor’s desired outcome with an outcome-based fund
most suitable to achieve the investor’s desired outcome becomes a very simple
risk appetite and risk capacity discussion. Some investors elect to delegate the
responsibility of constructing suitable investment portfolios to their financial
advisers, who blend multiple funds together in an attempt to diversify risk and/
or the sources of return. While this may mitigate some of the risk of a mismatch
between investor objectives and the investment portfolio, it does not eliminate
it. Even skilful financial advisers suffer from behavioural biases such as herding,
recency, familiarity, home bias, coupled with the added pressure of demonstrating
superior fund manager selection skills to clients through all the cycles of the
markets.
4.2 Measuring the suitability of a succesful investment strategy
One popular way of assessing the success of an investment fund is to consider
the past performance as shown in the minimum disclosure documents (MDDs).
These documents are aimed at standardising critical information about Collective
Investment Schemes Control Act-approved funds in such a way that it facilitates
fair comparison between funds and informed decision-making by investors. The
information in MDDs is regulated by board notice 92 of 2014. While beneficial
and well-intended, this information is not necessarily dynamic in its applicability
to the individual circumstances and to which extent the particular fund can solve
for individual investor objectives. Many of the measurements and statistics shown
in these documents are less goal-relative (investor-centric) and rather relative to
metrics such as the asset manager’s chosen benchmark, the period since inception
of the fund, the regulated reporting periods and past or prevailing market cycles
during which such past performance occurred. For example, the fund’s most recent
five-year investment return reported at a point in time may not be the best indicator
of the return that the investor can expect over his or her five-year investment
horizon. Well-founded risk metrics such as (i) volatility, (ii) Sharpe ratios, (iii)
information ratios and (iv) Sortino ratios, to name a few, are useful metrics to asset
managers but can quickly become sources of confusion and complexity that detract
from optimal fund selection when investors aim to compare or make sense of
these. It is not uncommon to compare funds where Fund A appears superior when
measured using metrics (i), (iii) and (v) while Fund B simultaneously measures
superior on metrics (ii), (iv) and (vi). Which is better suited to the investor’s needs?
How much influence does each metric have on whether the investor’s desired
objective will be met? The next section gives a perspective on these questions.
4.3 The OBI Score™ In an effort to demystify the complexity of attempting to measure the suitability of
an investment portfolio, relative to an investor’s goal or objective, Momentum has
developed the OBI Score™. It is a simple metric that dynamically summarises the
most relevant risk and return characteristics of a fund or a portfolio (multiple funds
blended together) relative to the investor’s specific objective. The OBI Score™ is
therefore a single number that is easily understood, interpreted and compared.
04
The South African investor behaviour tax and helping investors count what counts | Nixon, Barnard, Bornman & Louw | September 2019
Page 31

Helping investors count what counts
The score is determined by considering the hit rate of the fund relative to the
investor objective. For example, if the investor requires a CPI + 5% return over a
six-year investment horizon, the score will consider how often the fund has been
able to achieve this level of return in every past rolling six-year period since the
inception of the fund. This inherently considers the ability of the fund to match the
investor’s expectations through all market cycles as opposed to snapshots in time.
In addition, the score considers the risk with which this return was delivered. We
consider the risk from the perspective of the investor as opposed to risk as defined
by investment managers. To this extent we believe that the appropriate measures
of risk are not volatility-related, but rather measured by the following indicators:
1. Shortfall risk: When the explicit return objective was not achieved (CPI + 5%
in the example above), by how much did it under-perform? This is relevant
because it relates directly to how close the investor came to the outright
achievement of his or her objective (eg provision for 100% or 95% or only 50%
of a child’s tertiary education costs).
2. Drawdowns: How often and how severe were portfolio drawdowns over any
rolling 12-month period along the way? This is relevant as the frequency and
severity of drawdowns relate directly to investor discomfort, which may initiate
switch behaviour along the way.
The outer dial refers to the investment’s success (hit) rate. For example, how often
the portfolio achieves the desired return over the requisite number of rolling-
return periods. The inner dial relates to the risk number calculated in line with
the objective we are solving for. In this context we examine if the investment has
yielded capital losses historically, as well as the magnitude of these drawdowns.
The OBI Score™ therefore provides our relative assessment of the fund’s track
record in delivering a palatable investment journey that is geared to deliver a
particular investment outcome. How much focus should be placed on each of
the risk and return metrics as a function of the investment’s return objective and
investment horizon? The answer to this is that it is dynamic. In general, for shorter-
termed investments the focus shifts more towards drawdown protection, while for
longer-duration investments, the emphasis is tilted to outright achievement of the
return objective. The OBI Score™ is a standardised score by means of generating a
statistical normalised rating of each of the four metrics used in its calculation, when
measured over all funds available on the Momentum Wealth platform. The final
score, once weighted and and totalled, is out of 100. A fund’s OBI score is a living
score as every new data point (additional monthly return) is taken into account as
it occurs. It is expected that funds that are more aligned to an investor’s objective
will have consistently higher OBI scores than funds that score high on the individual
metrics at a certain point in time only.
04
The South African investor behaviour tax and helping investors count what counts | Nixon, Barnard, Bornman & Louw | September 2019
Page 32
95% Hit Rate
31.12 Risk
OBI Score 89

Helping investors count what counts 04
The South African investor behaviour tax and helping investors count what counts | Nixon, Barnard, Bornman & Louw | September 2019
Page 33
Objective CPI + 2% CPI + 3% CPI + 4% CPI + 5% CPI + 6%
Term:3 years 4 years 5 years 6 years 7 years
Hit rate Low Medium High
Severity of miss Low Medium High
Probability of drawdown High Medium Low
Max 12-month drawdown High Medium Low
Momentum Focus 7 FoF B2 relative to CPI + 6% CPI + 6%Momentum Focus 7 Fof B2
18%
15%
14%
12%
10%
8%
6%
4%
2%
0%
-2%
Feb
15
Jun
15
Feb
16
Jun
16
Feb
18
Jun
18
Feb
17
Jun
17
Feb
19
Jun
19
Oct
15
Oct
16
Oct
17
Oct
18
Figure 12: Rolling returns of the Momentum Focus 7 Fund of Funds
Source: Momentum Investments, Morningstar Table D: Focus on factors across CPI mandates
Source: Momentum Investments

Helping investors count what counts
4.4 Does an outcome-based fund achieve better investment outcomes more often?
Figure 12 indicates the actual investment delivery of the Momentum Focus 7 Fund
of Funds, which is managed specifically in line with achieving CPI + 6% (net of
fees) for investors over any rolling seven-year investment horizon. Each month
on the chart is representative of the prior seven-year investment period. Being a
market-linked multi-asset fund functioning within the Regulation 28 limits, these
returns are not guaranteed, but the graph indicates how deliberately managing the
fund with this investor-centric objective does more often than not mean that it will
deliver on the investor objectives with a higher probability of success.
Figure 13 on the following page shows the frequency and severity of
underperforming the CPI + 6% (net of fees) experience of the Momentum Focus
7 Fund of Funds relative to the Asisa MA High Equity peer group. Deliberately
managing the fund to the investor outcome also means deliberately trying to
minimise any extent of underperformance in times when markets in general are
underperforming. Again, measured over a rolling seven-year period, the graph
indicates the success with which this was achieved.
Taking the investment delivery shown above into account, the OBI Score™ for this
fund will be as follows as at end of June 2019:
The Momentum Focus 7 Fund of Funds hit its mark on 78% of occasions (outer
dial) over the past 55 rolling seven-year return periods (available from January
2008 to June 2019) and only provided a negative return over a 12-month period on
8,66% of occasions (the inner dial also considers the extent of this negative return).
One of the most useful features of the OBI Score™ is that it facilitates (through
the Momentum OBI Score™ toolsets) like-for-like comparisons between funds
or portfolios. This allows financial advisers and investors to perform OBI Score™
comparisons, calculated over the exact same time periods, normalised against
the identical universe of other funds available and for the exact same investor
objective. Figure 14 shows a peer comparison for five of the ten largest balanced
funds in the Asisa high equity sector comprising 11,49% of industry assets (R260
billion) over the same 55 rolling return periods. The Momentum Focus 7 Fund of
04
The South African investor behaviour tax and helping investors count what counts | Nixon, Barnard, Bornman & Louw | September 2019
Page 34
8678% Hit Rate
OBI Score
Risk

Helping investors count what counts 04
The South African investor behaviour tax and helping investors count what counts | Nixon, Barnard, Bornman & Louw | September 2019
Page 35
Source: Momentum Investments, Morningstar
Feb
15
Apr
15
Jun
15
Aug
15
Oct
15
Dec
15
Feb
16
Apr
16
Jun
16
Aug
16
Oct
16
Dec
16
Feb
17
Apr
17
Jun
17
Aug
17
Oct
17
Dec
17
Feb
18
Apr
18
Jun
18
Aug
18
Oct
18
Dec
18
Feb
19
Apr
19
Jun
19
(Asisa) South African MA High EquityMomentum Focus 7 Fof B2
0%-0.5%
-1%-1.5%
-2%-2.5%
-3%-3.5%
Figure 13: Momentum Focus 7 Fund of Funds CPI + 6% Asisa peer comparison
Momentum enhanced Growth Plus Fund of Funds (B2)
Multi-asset high equity fund B
Multi-asset high equity fund D
Multi-asset high equity fund A
Multi-asset high equity fund C
Multi-asset high equity fund E
Feb
15
0%
-1%
-2%
-3%
-4%
Jun
15
Feb
16
Jun
16
Feb
18
Jun
18
Feb
17
Jun
17
Apr
19
Oct
15
Oct
16
Oct
17
Oct
18
Feb
19
Figure 14: Investment experience against five popular balanced funds
Source: Momentum Investments, Morningstar
Funds has an OBI Score™ of 86 while the balanced funds
in question have scores between 68 (fund E) and 84 (fund
A). It is clear from the journey in figure 14 that investments
with higher scores are going to provide a more palatable
investment experience for clients as outcomes will be
more predictable.
In conclusion, there are many metrics to evaluate an
investment’s performance. Yet as an industry we have
tended to focus on only investment performance. But
when an investment manager’s interests are not aligned
with that of the investor, it may not benefit the investor.
Simply put, if someone has to drive 100km and speed
is the only measure of success, a bumpy journey and a
crash are not impossible. The industry needs a new way
to measure the likelihood of an investor achieving a goal,
while not neglecting the investment experience.

Conclusion
“Humans are great. But they make systematic mistakes. Financial advisers are skilled technicians, but they are also human. And in every field, from chefs following recipes and using scales, to writers using editors, to sportspeople using coaches, to doctors following checklists, even the most skilled technicians use tools to ensure consistency.” Greg B. Davies
This paper has presented ample evidence that the past performance of funds still plays far too large a role in our ultimate investment decisions. This is hardly surprising. Investment decisions are complex and using mental shortcuts for these decisions does not lead us anywhere worth going. Our problems started some time ago with the advent of fiat currency or money. Why? Money is fungible. If our ancestors farmed apples and wanted something different (like oranges) they just needed to agree on exchange quantities and completed the transaction. It was very easy to assess the opportunity cost of apples. Money introduced the complexity of when to consume something and the levels of financial complexity have increased exponentially since. Our instinct in these situations is likely to try and remove complexity by searching for relative cues of value. Ask Ron Johnson (former JC Penny CEO) who decided to stop sale items and give customers an everyday low price. Sounds rational, but it turns out when we do not have a marked up “normal” price to compare a sale price to, we stop buying the goods altogether. It also takes away the transaction utility that makes us feel smart for spotting and taking advantage of the sale. It also cost Penny his job. The amount of information at our disposal and our uncanny knack to put up filters that conveniently let slip though information that supports our cognition and filter out that which does not, can end up costing us a significant amount of money over time. The results of this paper for financial practitioners pose three key questions:
1. Are your clients paying you to “beat the market” or are they paying you to be their guide or mentor on the path to achieving financial goals?
2. Are you able to articulate the likely investment journey for your clients en route
to the ultimate destination and are you managing their expectations along the way?
3. Are you able to show your client how they are progressing towards these investment goals and are you reporting in a manner that shows levels of volatility matched to the investment goal as opposed to arbitrary short-term and market volatility?
The answer to the first question above, to articulate the value proposition, lies squarely within the control of the financial practitioner. But the industry has to do a considerable amount of work to help its financial adviser and planner partners to manage their clients’ behaviour gaps or minimise their behaviour taxes, and to show clearly the extent to which they are successful. Momentum Investments has developed the first “decision prosthetic”, as Greg Davies puts it, for South African financial advisers to help their clients anchor on one number that steers the conversation away from market benchmarks and towards a personal benchmark. The next step in our journey is to gain a deeper understanding of investor behaviour to the extent that we are able to put forward a predictive model that enriches the engagement of practitioners and their clients. This remains an area where machine learning has a major part to play in analysing a ton of data to dig out what could be meaningful relationships between endogenous client variables (such as personality traits, income levels, gender and even advice received) and exogenous variables related to markets and even geopolitics. Think of the value added if each client along with his or her financial adviser receives a tailored engagement strategy to enrich the advice process and review discussions where information is presented in a manner that encourages the right investing decisions. The good news is that willpower can be learned and become even stronger. We need to think of it as a psychic muscle that can be strengthened if we understand where our own biases affect investment behaviour. The financial adviser has a pivotal role to play in conveying this insight.
The South African investor behaviour tax and helping investors count what counts | Nixon, Barnard, Bornman & Louw | September 2019
Page 36

Behaviour tax and helping investors count what counts
Chasing past performance is a form of
behaviour tax
Heuristics and biases Endowment effect
Loss aversion
Over confidence
Behaviour tax
Switch itch
Greed & fear
of switch investment
flow is based on past
performance Behaviour
tax can be as large as
over 10 years
60%
22%

References
The South African investor behaviour tax and helping investors count what counts | Nixon, Barnard, Bornman & Louw | September 2019
Page 37
Adelson, E.H., 1993. Perceptual organization and the judgment of brightness. Science, 262(5142),
pp.2042-2044.
Allais, M., 1953. The rational man’s behavior in the face of risk: critical of postulates and axioms of
the American school. Econometrica: Journal of the Econometric Society, pp.503-546.
Barberis, N., 2013. Psychology and the Financial Crisis of 2007-2008. Financial innovation: too
much or too little, pp.15-28.
Bargh, J.A., Chen, M. and Burrows, L., 1996. Automaticity of social behavior: Direct effects of trait
construct and stereotype activation on action. Journal of personality and social psychology, 71(2),
p.230.
Bruner, J.S., 1973. Beyond the information given: Studies in the psychology of knowing. WW
Norton.
Clare, A. and Motson, N., 2010. Do UK retail investors buy at the top and sell at the
bottom? Available at SSRN 2728214.
Clare, A., Nitzsche, D. and Cuthbertson, K., 2010. An empirical investigation into the performance
of UK pension fund managers. Journal of Pension Economics & Finance, 9(4), pp.533-547.
Dalbar. 2016. Dalbar’s 22nd Annual Quantitative Analysis of Investor Behavior 2015 For period
ended: 12/31/2015. [online]. Available from World wide web: https://www.qidllc.com/wp-
content/uploads/2016/02/2016-Dalbar-QAIB-Report.pdf
Damasio, A.R., 1994. Descartes’ error: Emotion, rationality and the human brain.
Davies, G.B. 2013. Barclays White Paper: Overcoming the cost of being human (or, The pursuit of
anxiety-adjusted returns). Barclays.
Davies, G.B. 2014. Overcoming the cost of being human. [online]. Available from World wide
web: https://www.genesiswealthmanagement.com/sites/marioyngerto.us1.advisor.ws/files/
documents/overcoming-the-cost-of-being-human.pdf
Evans, J.S.B., 2003. In two minds: dual-process accounts of reasoning. Trends in cognitive
sciences, 7(10), pp.454-459.
Fisher, G.S. 2014. Advising the Behavioral Investor: Lessons from the Real World. In: Investor
Behaviour, Hoboken, NJ: Wiley, pp.265-283.
Friesen, G.C. and Sapp, T.R., 2007. Mutual fund flows and investor returns: An empirical
examination of fund investor timing ability. Journal of Banking & Finance, 31(9), pp.2796-2816.
Fiske, S.T. and Taylor, S.E., 1991. McGraw-Hill series in social psychology. Social cognition (2nd
ed.). New York, NY, England: Mcgraw-Hill Book Company.
Gladwell, M., 2006. Blink: The power of thinking without thinking.
Grinblatt, M. and Keloharju, M., 2009. Sensation seeking, overconfidence, and trading activity. The
Journal of Finance, 64(2), pp.549-578.
Hamilton, D.L., 1979. A Cognitive-Attributional Analysis of Stereotyping. In Advances in
experimental social psychology (Vol. 12, pp. 53-84). Academic Press.
Heath, C. and Tversky, A., 1991. Preference and belief: Ambiguity and competence in choice under
uncertainty. Journal of risk and uncertainty, 4(1), pp.5-28.
Helson, H., 1964. Adaptation-level theory: an experimental and systematic approach to behavior.
Hirshleifer, D. and Luo, G.Y., 2001. On the survival of overconfident traders in a competitive
securities market. Journal of Financial Markets, 4(1), pp.73-84.

References
The South African investor behaviour tax and helping investors count what counts | Nixon, Barnard, Bornman & Louw | September 2019
Page 38
Illmer, S. and Marty, W., 2003. Decomposing the money-weighted rate of return. Journal of
Performance Measurement, 7(4), pp.42-50.
Jeffries, L. 2015. Fear Of Missing Out: An Investor’s Worst Enemy. [online]. Available from World
wide web: http://networthadvice.com/fear-of-missing-out-an-investors-worst-enemy
Kahneman, D., Knetsch, J.L. and Thaler, R.H., 1991. Anomalies: The endowment effect, loss
aversion, and status quo bias. Journal of Economic perspectives, 5(1), pp.193-206.Kahneman, D.,
2011. Thinking, fast and slow. Macmillan.
Kahneman, D. and Frederick, S., 2002. Representativeness revisited: Attribute substitution in
intuitive judgment. Heuristics and biases: The psychology of intuitive judgment, 49, p.81.
Kahneman, D. and Tversky, A., 1973. On the psychology of prediction. Psychological review, 80(4),
p.237.
Kennon, J. 2018. Past Performance Is No Guarantee of Future Results. [online]. Available from
World wide web: https://www.thebalance.com/past-performance-is-no-guarantee-of-future-
results-357862
Kinsley, J. 2000. Chasing good performance can destroy value. [online]. Available from World
wide web: https://www.fin24.com/Finweek/Archive/Chasing-good-performance-can-destroy-
value-20050920-7
Lamprecht, I. 2016. Chasing performance can destroy returns. [online]. Available from World
wide web: https://www.moneyweb.co.za/investing/unit-trusts/how-chasing-performance-can-
destroy-returns
Mark, G., Gudith, D. and Klocke, U., 2008, April. The cost of interrupted work: more speed and
stress. In Proceedings of the SIGCHI conference on Human Factors in Computing Systems (pp.
107-110). ACM.
Markowitz, H., 1952. Portfolio selection. The journal of finance, 7(1), pp.77-91.
Maymin, P.Z. and Fisher, G.S., 2011. Past performance is indicative of future beliefs. Risk and
Decision Analysis, 2(3), pp.145-150.
Metcalfe, J. and Mischel, W., 1999. A hot/cool-system analysis of delay of gratification: dynamics
of willpower. Psychological review, 106(1), p.3.
Montier, J., 2010. The little book of behavioral investing: how not to be your own worst
enemy (Vol. 35). John Wiley & Sons.
Neal, D.T., Wood, W. and Quinn, J.M., 2006. Habits—A repeat performance. Current Directions in
Psychological Science, 15(4), pp.198-202.
Piaget, J. and Cook, M., 1952. The origins of intelligence in children (Vol. 8, No. 5, p. 18). New York:
International Universities Press.
Richards, C. 2012. The Behaviour Gap: Simple Ways to Stop Doing Dumb Things with Money.
New York: Penguin.
Rizzi, J.V. 2014. Post-Crisis Investor Behavior: Experience Matters. In: Investor Behaviour,
Hoboken, NJ: Wiley, pp.439-455.

References
The South African investor behaviour tax and helping investors count what counts | Nixon, Barnard, Bornman & Louw | September 2019
Page 39
Shefrin, H. and Statman, M., 1985. The disposition to sell winners too early and ride losers too
long: Theory and evidence. The Journal of finance, 40(3), pp.777-790.
Simon, H.A., 1982. Models of bounded rationality. vol. 2, Behavioral economics and business
organization. MIT Press.
Sloman, S.A., 1996. The empirical case for two systems of reasoning. Psychological bulletin,
119(1), p.3.
Smith, E.R. and DeCoster, J., 2000. Dual-process models in social and cognitive psychology:
Conceptual integration and links to underlying memory systems. Personality and social
psychology review, 4(2), pp.108-131.
Stanovich, K.E. and West, R.F., 2000. Individual differences in reasoning: Implications for the
rationality debate? Behavioral and brain sciences, 23(5), pp.645-665.
Stephen, E. 1999. The Role of Judgmental Heuristics in Financial Decisions:
Anchoring and Availability Effects. In: Finanzpsychologie, 101–134.
Stigler, G.J., 1950. The development of utility theory. I. Journal of political economy, 58(4),
pp.307-327.
Thaler, R.H. and Sunstein, C.R., 2009. Nudge: Improving decisions about health, wealth, and
happiness. Penguin.
Tversky, A. and Kahneman, D., 1973. Availability: A heuristic for judging frequency and
probability. Cognitive psychology, 5(2), pp.207-232.
Tversky, A. and Kahneman, D., 1974. Judgment under uncertainty: Heuristics and
biases. science, 185(4157), pp.1124-1131.
Tversky, A. and Kahneman, D., 1989. Rational choice and the framing of decisions. In Multiple
criteria decision-making and risk analysis using microcomputers (pp. 81-126). Springer, Berlin,
Heidelberg.
Tversky, A. and Kahneman, D., 1992. Advances in prospect theory: Cumulative representation of
uncertainty. Journal of Risk and uncertainty, 5(4), pp.297-323.
Wright, S., Smithers, A., Warburton, P., Pepper, G., Goldberg, J., Brodie, H., Riley, B. and Napier, R.,
2011. Practical history of financial markets. Harlow: Pearson Education.

Collective investment schemes in securities are generally medium- to long-term investments. The value of participatory interests or the investment may go down as well
as up. Past performance is not necessarily a guide to future performance. Momentum Collective Investments (RF) (Pty) Ltd (the manager) does not provide any guar-
antee, either with respect to the capital or the return of a portfolio. For certain portfolios the manager has the right to close these portfolios to new investors to manage
them more efficiently, in accordance with their mandates. Collective investment schemes are traded at ruling prices and can engage in borrowing and scrip lending. The
collective investment scheme may borrow up to 10% of the market value of the portfolio to bridge insufficient liquidity. Different classes of participatory interests apply
to these portfolios and are subject to different fees and charges. A schedule of fees, charges and maximum commissions is available on request from the manager, or is
available on the website (www.momentum.co.za/collectiveinvestments). Forward pricing is used. The following transaction cut-off times apply: for Money Market portfo-
lios is 10:00 on the pricing date; for all funds, except for Fund of Funds, Feeder Funds and Money Market Funds is 14:00 on the pricing date; for Fund of Funds and Feeder
Funds is 14:00 on the business day prior to the pricing date. The following portfolio valuation times apply: All funds, except for Fund of Funds and Feeder Funds is 15:00;
Fund of Funds and Feeder Funds is 24:00. For all other funds, (excluding the above and the Momentum Money Market Fund), the daily valuation point is 15:00 while at
month end, (last business day of the month), it is 17:00. We will need to illustrate this on the MDDs for these funds going forward. The complaints policy and procedure
and the conflicts of interest management policy are available on Momentum Collective Investment’s (RF) (Pty) Ltd website at (www.momentum.co.za/collectiveinvest-
ments).
Foreign securities within portfolios may have additional material risks, depending on the specific risks affecting that country, such as: potential constraints on liquidi-
ty and the repatriation of funds; macroeconomic risks; political risks; foreign exchange risks; tax risks; settlement risks; and potential limitations on the availability of
market information. Fluctuations or movements in exchange rates may cause the value of underlying international investments to go up or down. Investors are reminded
that an investment in a currency other than their own may expose them to a foreign exchange risk. The terms and conditions, a schedule of fees, charges and maximum
commissions, performance fee frequently asked questions as well as the minimum disclosure document (MDD) and quarterly investor report (QIR) for each portfolio
are available on Momentum Collective Investments’ website at www.momentum.co.za/collectiveinvestments. Associates of the manager maybe invested within certain
portfolios and the details thereof are available from the manager. Momentum Collective Investments (RF) (Pty) Ltd is an authorised manager of collective investment
schemes in terms of the Collective Investment Schemes Control Act, No 45 of 2002. Momentum Metropolitan Life Limited is a full member of the Association for Savings
and Investment South Africa. The Standard Bank of South Africa Limited (PO Box 54, Cape Town, 8000) is the Trustee of Momentum Collective Investments Scheme.
The manager and trustee are registered and approved under the Collective Investment Schemes Control Act (No. 45 of 2002). Momentum Collective Investments (RF)
(Pty) Ltd (Reg No.1987/004287/07) (PO Box 7400 Centurion 0046).
Some of the portfolios are managed by Momentum Asset Management (Pty) Ltd and some are managed by Momentum Outcome-based Solutions (Pty) Ltd.
Investment manager Registration number FSP number Registered address
Momentum Asset Management (Pty) Ltd 1987/004655/07 623 268 West Avenue Centurion 0157
Momentum Outcome-based Solutions (Pty) Ltd 2004/023064/07 19840 268 West Avenue Centurion 0157
The above investment managers are authorised financial services provider under the Financial Advisory and Intermediary Services Act (No. 37 of 2002), to act in the
capacity as investment manager. This information is not advice, as defined in the Financial Advisory and Intermediary Services Act (No. 37 of 2002).Please be advised
that there may be representatives acting under supervision.
Disclaimer