the speakers do not have any disclosures relevant to today’s...
TRANSCRIPT

1
Copyright © 2010 Institute for Healthcare Improvement
L30: How to Improve Quality and Flow While Reducing Cost
Eugene Litvak
Peter Lachman
Jason Leitch
Copyright © 2011 Institute for Healthcare ImprovementSlide 2
Disclosures
The speakers do not have any disclosures relevant to today’s session and discussion

2
Copyright © 2011 Institute for Healthcare ImprovementSlide 3
Aims
� As funding constraints have increased under health care reform, the way hospital services are designed and managed has become paramount. This session will demonstrate that there is a cost-effective way to reorganize services to deliver safe and effective care.
� Participants will learn that the management of variability and the application of operations management theory are keys to a financially viable and safer health service. These principles will be illustrated by case studies and participatory work.
Copyright © 2011 Institute for Healthcare ImprovementSlide 4
Learning Objectives
� After this session, participants will be able to:
� Develop an understanding of the theory of managing operations
� Demonstrate how to improve flow in hospital settings
� Identify ways to decrease variation in delivery of care

3
Copyright © 2010 Institute for Healthcare Improvement
SESSION 1 INTRODUCTION TO THE PROBLEM
The growing finance gap
Peter Lachman
Copyright © 2011 Institute for Healthcare ImprovementSlide 6
Setting the Context
� Is the central problem in healthcare cost or quality?
� Does your organization need additional resources?
� Is your biggest problem deciding where to close services or how to improve quality ….or both?
� Does managed care/capitation accompanied by reduced budget leads to poorer quality of care.

4
Copyright © 2011 Institute for Healthcare ImprovementSlide 7
International Comparison of Spending on Health, 1980–2008
* PPP=Purchasing Power Parity.
Data: OECD Health Data 2011 (database), version 6/2011.
Average spending on health
per capita ($US PPP*)
Total expenditures on health
as percent of GDP
7Source: Commonwealth Fund National Scorecard on U.S. Health System Performance, 2011. 7
Copyright © 2011 Institute for Healthcare ImprovementSlide 8
Outcome rankings
Source: Calculated by The Commonwealth Fund based on 2007 International Health Policy Survey; 2008 International Health Policy Survey
of Sicker Adults; 2009 International Health Policy Survey of Primary Care Physicians; Commonwealth Fund Commission on a High
Performance Health System National Scorecard; and Organization for Economic Cooperation and Development, OECD Health Data, 2009
(Paris: OECD, Nov. 2009).

5
Copyright © 2011 Institute for Healthcare ImprovementSlide 9
Deaths per 100,000 population*
* Countries’ age-standardized death rates before age 75; including ischemic heart disease, diabetes, stroke, and bacterial infections.
See Appendix B for list of all conditions considered amenable to health care in the analysis.
Data: E. Nolte, RAND Europe, and M. McKee, London School of Hygiene and Tropical Medicine analysis of World Health
Organization mortality files and CDC mortality data for U.S. (Nolte and McKee, 2011).
Mortality Amenable to Health Care
Source: Commonwealth Fund National Scorecard on U.S. Health System Performance, 2011. 9
Copyright © 2011 Institute for Healthcare ImprovementSlide 10
Spending more does not improve quality
CMS data:
Higher spending
states have
poorer quality
Source: Baicker K, Chandra A. Medicare spending, the physician workforce, and beneficiaries' quality of
care. Health Aff (Millwood). 2004 Jan-Jun;Suppl Web Exclusives:W4-184-97.
6
Copyright © 2011 Institute for Healthcare ImprovementSlide 11
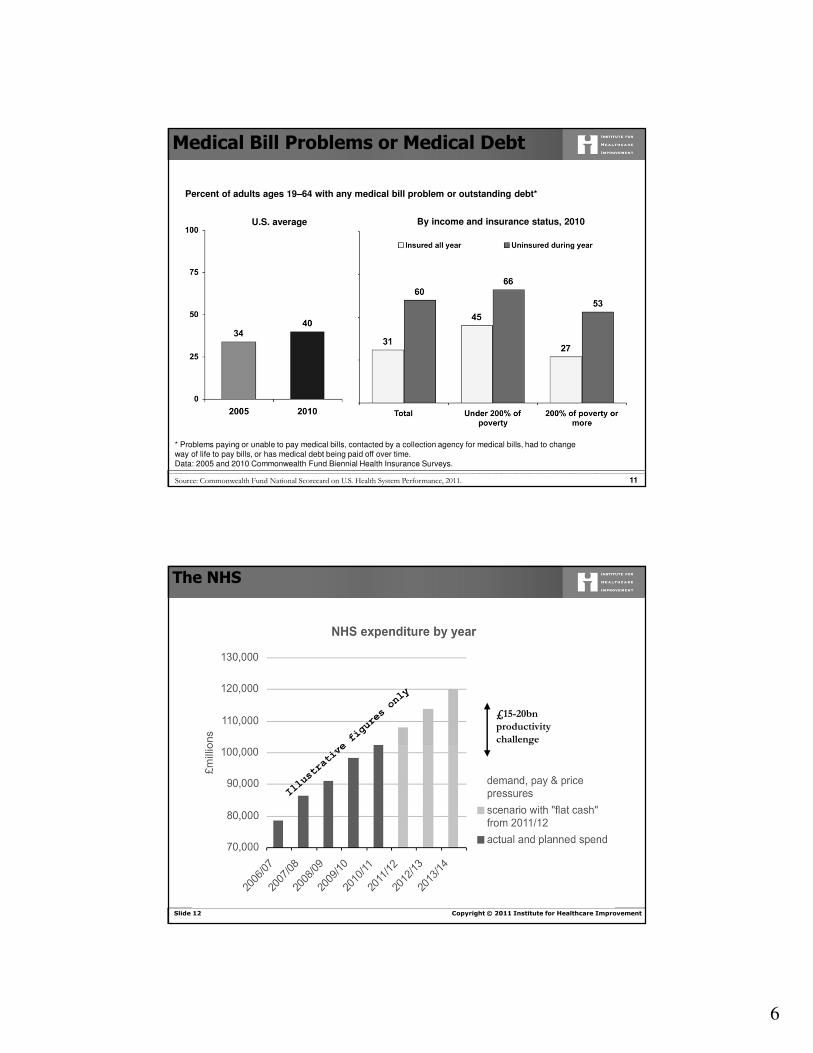
By income and insurance status, 2010U.S. average
Percent of adults ages 19–64 with any medical bill problem or outstanding debt*
* Problems paying or unable to pay medical bills, contacted by a collection agency for medical bills, had to change
way of life to pay bills, or has medical debt being paid off over time.
Data: 2005 and 2010 Commonwealth Fund Biennial Health Insurance Surveys.
Source: Commonwealth Fund National Scorecard on U.S. Health System Performance, 2011. 11
Medical Bill Problems or Medical Debt
Copyright © 2011 Institute for Healthcare ImprovementSlide 12
The NHS
£15-20bn
productivity
challenge

7
Copyright © 2011 Institute for Healthcare ImprovementSlide 13
Traditionally, healthcare
providers have prospered
without needing to focus on
costs and waste…
─Emphasis on revenue growth
─Little price transparency
─Less competitive than most industries
─Typically funded with insured dollars
…but several forces suggest that
this will not continue
─Cost inflation>incomes
─ Increased out-of-pocket funding
─CMS initiatives focusing on efficiency and cost
─Threat of disruptive, lower cost entrants
─Better credit rating for high safety/high quality providers
Providers Will Find Increasing Pressures to Focus on Costs and Waste
Copyright © 2011 Institute for Healthcare ImprovementSlide 14
Question
Can we look at ways of delivering health care and increase quality and safety?

8
Copyright © 2010 Institute for Healthcare Improvement
Session 2Introduction to Management
Operations
Eugene Litvak
Institute for Healthcare Optimization
Copyright © 2011 Institute for Healthcare ImprovementSlide 16
Center for Medicare & Medicaid Innovation
Innovation Advisors Program
The Innovation Center seeks to deepen the capacity for
transformation by creating a network of experts in
improving the delivery system for Medicare, Medicaid
and CHIP beneficiaries.
The Innovation Advisors Program will inspire
dedicated, skilled individuals in the health care system
to deepen several key skill sets, including:
� Health care economics and finance;
� Population health;
� Systems analysis; and
� Operations research

9
Copyright © 2011 Institute for Healthcare ImprovementSlide 17
Changing Patient Flow through the Parts of the System May Not Optimize Overall Patient Flow
� Can one reduce ED overcrowding just by improving patient flow through the ED?
� Can one improve ICU patient flow by increasing its size?
Copyright © 2011 Institute for Healthcare ImprovementSlide 18
Reducing the Time of Patient Transfer…
… between two hospital units or the length of stay in the unit may not be right goal
� Do we really want to transfer patients from the ED to Med/Surg bed in one hour?
� Should we “fight” for reducing ICU length of stay?

10
Copyright © 2011 Institute for Healthcare ImprovementSlide 19
High Census May Not be a Good Reason for Adding More Beds
� Midnight or midday census? The answer might be …“neither”
� Does the patient mix matter? Which patients mix?
� Does the size of your hospital/unit matter?
� What would you do when your waiting room is full?
Copyright © 2011 Institute for Healthcare ImprovementSlide 20
Is Your Goal to Have a High Utilization of Your Resources?
� Is this a right goal?
� What happens when your resources are highly utilized?
� When utilization is high enough?

11
Copyright © 2011 Institute for Healthcare ImprovementSlide 21
Can Your Hospital or Physician Office Reduce Overcrowding?
� Should this be your goal?
� Do you want to attract more patients?
� Would more patients reduce overcrowding and wait times?
Copyright © 2011 Institute for Healthcare ImprovementSlide 22
What is the Right Goal for Patient Flow Improvement?
� Can Operations Management help you to achieve this goal?
� There is a right goal for patient flow improvement – patient throughput and access to care while improving or controlling quality of care!

12
Copyright © 2010 Institute for Healthcare Improvement
The Central Health Care Problem: Cost or Quality?
To Treat or To Save Money?
Copyright © 2011 Institute for Healthcare ImprovementSlide 24
Operations Management: An Art or a Science
� Real life problems are not labeled
� Intuitive solutions are frequently wrong
13
Copyright © 2011 Institute for Healthcare ImprovementSlide 25
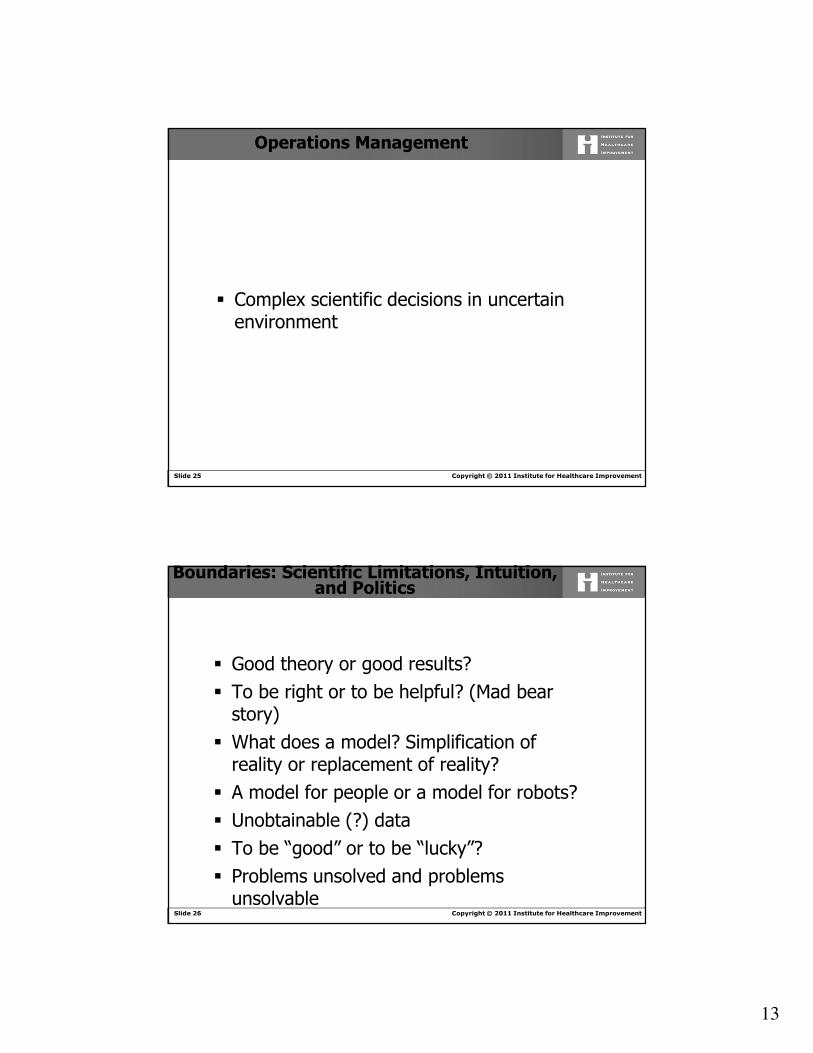
Operations Management
� Complex scientific decisions in uncertain environment
Copyright © 2011 Institute for Healthcare ImprovementSlide 26
Boundaries: Scientific Limitations, Intuition, and Politics
� Good theory or good results?� To be right or to be helpful? (Mad bear
story)� What does a model? Simplification of
reality or replacement of reality?� A model for people or a model for robots?� Unobtainable (?) data� To be “good” or to be “lucky”?� Problems unsolved and problems
unsolvable

14
Copyright © 2011 Institute for Healthcare ImprovementSlide 27
Operations Management
� Main Components
� Optimization
� Queuing Theory
� Network Theory
� Inventory Management
Copyright © 2011 Institute for Healthcare ImprovementSlide 28
Optimization
� Linear Programming
� Nonlinear Programming
� Dynamic Programming
� Stochastic Programming

15
Copyright © 2011 Institute for Healthcare ImprovementSlide 29
Queuing Theory
� Service Policies
� Queues without priorities
� Queues with priorities
� Queues with losses
Copyright © 2011 Institute for Healthcare ImprovementSlide 30
Network Theory
� Classical transportation problem
� The shortest path problem
� The longest (critical) path problem
� Flows in the network
� The assignment problem

16
Copyright © 2011 Institute for Healthcare ImprovementSlide 31
Classical Transportation Problem
S1
S2
S3
Sm
-D1
-D2
-D3
-Dn
Copyright © 2011 Institute for Healthcare ImprovementSlide 32
The Shortest Path Problem
1
7
2
3
4
5
6
8

17
Copyright © 2011 Institute for Healthcare ImprovementSlide 33
Critical Path Problem (Example)
5
42
3
23
4
21
4
323
Copyright © 2011 Institute for Healthcare ImprovementSlide 34
Critical Path Problem (Solution)
0
5
42
3
23
4
21
4
323

18
Copyright © 2011 Institute for Healthcare ImprovementSlide 35
Optimal Assignment Problem
0
Employee Job
1 1
22
33
44
Copyright © 2011 Institute for Healthcare ImprovementSlide 36
Inventory Management
� Inventory location
� Optimal inventory management when demand is uncertain

19
Copyright © 2011 Institute for Healthcare ImprovementSlide 37
Inventory Location Problem (Example)
0
1
1
1
1
1
1
Copyright © 2011 Institute for Healthcare ImprovementSlide 38
0
0.5
1
1
1
1
1
Inventory Location Problem (Solution)
0.5X

20
Copyright © 2010 Institute for Healthcare Improvement
Session 3 – Table workWhy is Operations Management Theory Relevant to Health Care?
Jason Leitch
Copyright © 2011 Institute for Healthcare ImprovementSlide 40
A case history - discuss in your groups
You are the duty manager on for the dayat your hospital. What are the key issuesthat face you during the day to ensurethere is a good flow and no delays?
10 minutes

21
Copyright © 2011 Institute for Healthcare ImprovementSlide 41
Feedback
� How did you assess the problem?� What data did you have?� What solutions did you have?
10 minutes
Copyright © 2010 Institute for Healthcare Improvement
Session 4Introduction to Queuing
Eugene Litvak

22
Copyright © 2011 Institute for Healthcare ImprovementSlide 43
Two Medical ICUs with the Same
Patients Acuity
5 beds
Average LOS = 2.5 days
Admission rate = 1pt/day
10 beds
Average LOS = 2.5 days
Admission rate = 2pts/day
Do they have the same waiting times to be admitted to these units?
Copyright © 2011 Institute for Healthcare ImprovementSlide 44
Ťw = 0.13 days
1st ICU 2nd ICU
Ťw = 0.012 days

23
Copyright © 2011 Institute for Healthcare ImprovementSlide 45
How Many Beds/Nurses/Exam Rooms Do You Need?
Suppose you are coming to a bank…
Copyright © 2011 Institute for Healthcare ImprovementSlide 46
How Many Beds/Nurses/Exam Rooms Do You Need?
Suppose you are coming to a bank…

24
Copyright © 2011 Institute for Healthcare ImprovementSlide 47
Service Mechanism
� Single Server00000
� Multiple Servers� Serial Servers
Parallel Servers
S
S S
SS
S
Copyright © 2011 Institute for Healthcare ImprovementSlide 48
Types of Service
� Queues with waiting
� Queues with rejections

25
Copyright © 2011 Institute for Healthcare ImprovementSlide 49
Service Discipline
� First come, first served
� Last come, first served
� Random
� Priorities
Copyright © 2011 Institute for Healthcare ImprovementSlide 50
Service Time
� Constant service time� Exponential service time� Non-stationary service time� Correlated service time (peak, off-peak
hours)

26
Copyright © 2011 Institute for Healthcare ImprovementSlide 51
Arrival Patterns
� Regular arrivals with unpunctuality� Request n arrivals at the time (tn+ εn)
� Aggregated (group) arrivals� Discrete-time arrivals (t1, t2,…, tk)� Non-stationary arrivals (peak, off-peak
arrivals)� Correlated arrivals (length of the queue)� Arrivals in a continuous flow (gas)
Copyright © 2011 Institute for Healthcare ImprovementSlide 52
Main Characteristics
1. Queues with rejections� Absolute throughput – the average
number of requests served during one time unit
� Relative throughput – the ratio between the average numbers of requests served and arrived during one time unit
� Average number of occupied service units
� Average number of free service units� Probability of rejection

27
Copyright © 2011 Institute for Healthcare ImprovementSlide 53
Main Characteristics
2. Queues with waiting� Average length of queue – the average
number of requests waiting for service� Average number of requests in the
system – the average total number of request being served and waiting for service
� Average request’s waiting time� Average request’s time in the system –
the average total time service and waiting time for a request
Copyright © 2011 Institute for Healthcare ImprovementSlide 54
Notations and Parameters� S - Number of servers� λ - Average number of arrivals per unit of time, λ =
1/ta (ta – average interarrival time interval)� µ - Average number of request served per unit of time,
µ = 1/ts (ts – average service time interval)� ρ = λ/µ� Ŭ = p/ S – average system’s utilization rate � pn – The probability of the system to be in the state n
when n requests “arrive” to the system:

28
Copyright © 2011 Institute for Healthcare ImprovementSlide 55
Queues with Waiting (Parallel Servers)
S
S
S
Copyright © 2011 Institute for Healthcare ImprovementSlide 56
Notations and Parameters
� No requests (n = 0)p0 = [1+ ρ/1!+ ρ2/2!+…+ ρ(s-1) /(S -1)! + ρs/S!(1+
ρ/S)]
� No queue (0 ≤ n ≤ S)pn= p0ρ
n/n!
� Queue (n > S)pn = p0ρ
n/S!S(n-s)
Queue with Random Arrivals and Exponential
Service Time (M/M/S)

29
Copyright © 2011 Institute for Healthcare ImprovementSlide 57
Main Characteristics
� Probability P(Ss) that all the servers are serving requests can be computed by the following formula: P(Ss) = ρs ⋅ S ⋅ p0/S! ⋅ (S - ρ)
� The average number (Řl) of requests in line can be computed by the following formula:Řl = P(Ss) ⋅ ρ/(S - ρ) = [ρ(s+1) ⋅ S ⋅ p0]/[S!(S - ρ)²]
� The average number (Řs) of requests in service is equal to: Řs = ρ
� The average number (Ř) of requests in system can be computed by the following formula:Ř = Řl + Řs
Copyright © 2011 Institute for Healthcare ImprovementSlide 58
� The average waiting time (Ťw) for a request can be computed by the following formula:Ťw = Řl/λ
� The average system time (Ť) for a request can be computed by the following formula:Ť = (Řl + Řs)/λ

30
Copyright © 2011 Institute for Healthcare ImprovementSlide 59
Ťw
λλλλ
λλλλ = 0.8 ⋅⋅⋅⋅ µµµµ ⋅⋅⋅⋅Sρρρρ = 0.8 ⋅⋅⋅⋅ S
Copyright © 2011 Institute for Healthcare ImprovementSlide 60
Applying Queuing Theory: Examples
1. Triage
2. Two ICUs
31
Copyright © 2011 Institute for Healthcare ImprovementSlide 61
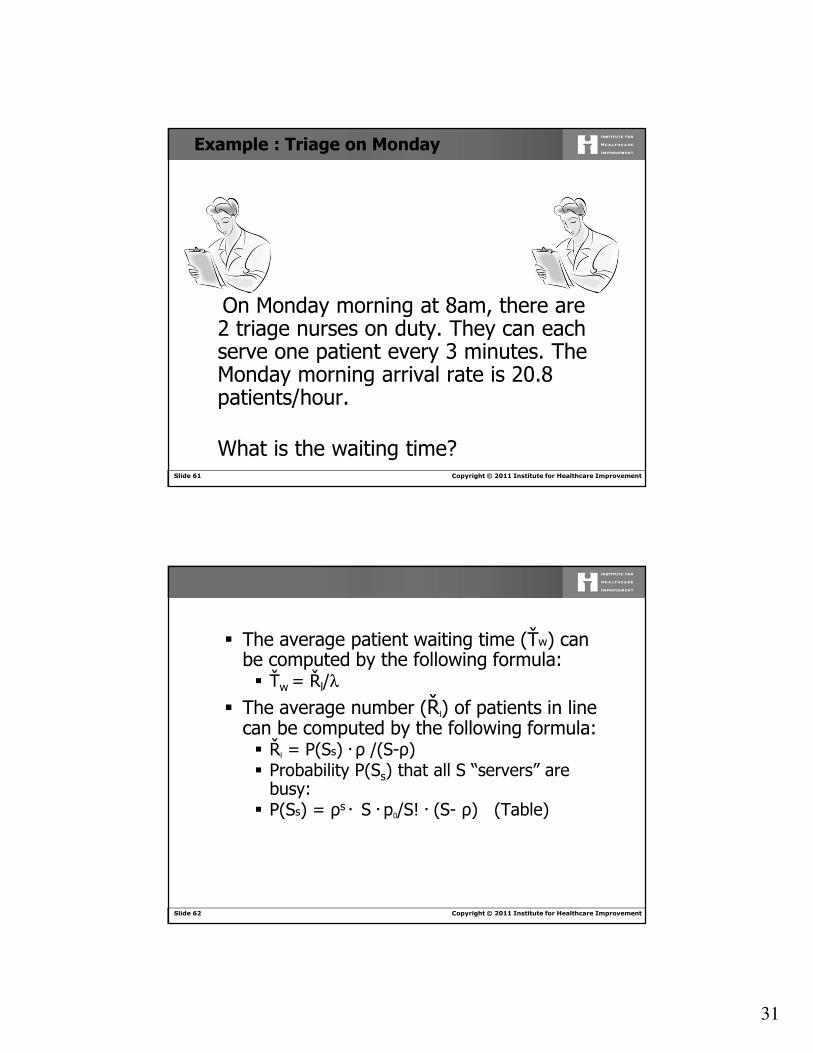
Example : Triage on Monday
On Monday morning at 8am, there are 2 triage nurses on duty. They can each serve one patient every 3 minutes. The Monday morning arrival rate is 20.8 patients/hour.
What is the waiting time?
Copyright © 2011 Institute for Healthcare ImprovementSlide 62
� The average patient waiting time (Ťw) can be computed by the following formula:� Ťw = Řl/λ
� The average number (Řl) of patients in line can be computed by the following formula:� Řl = P(Ss) . ρ /(S-ρ) � Probability P(Ss) that all S “servers” are
busy:� P(Ss) = ρs . S . p0/S! . (S- ρ) (Table)

32
Copyright © 2011 Institute for Healthcare ImprovementSlide 63
λλλλ, µµµµ , S
λ= 20.8 , µ= 1/3min = 20, S = 2
ρ = λ/ µ = 1.04
P(Ss) (table) ≈ 0.33
Řl = P(Ss) . ρ /(S-ρ) = 0.33 . 1.04/(2 - 1.04) ≈ 0.36
Ťw = Řl/λ = 0.36/20.8 = 0.017 h = 1.04 min
Copyright © 2011 Institute for Healthcare ImprovementSlide 64
Example: Triage on Friday
� On Fridays at 4 PM, the arrival rate is about 10.3 patients/hour. There is one triage nurse at this time, who can serve one patient every 3 minutes.
� What is the waiting time?

33
Copyright © 2011 Institute for Healthcare ImprovementSlide 65
λλλλ, µµµµ , S
λ= 10.3 , µ= 1/3min = 20, S = 1
ρ = λ/ µ = 0.52
P(Ss) (table) ≈ 0.52
Řl = P(Ss) . ρ /(S-ρ) = 0.52 . 0.52/(1 – 0.52) ≈ 0.56
Ťw = Řl/λ = 0.56/10.3 = 0.054 h = 3.28 min
Copyright © 2011 Institute for Healthcare ImprovementSlide 66
Two Medical ICUs with the Same
Patients Acuity
5 beds
Average LOS = 2.5 days
Admission rate = 1pt/day
10 beds
Average LOS = 2.5 days
Admission rate = 2pts/day
Do they have the same waiting times to be admitted to these units?

34
Copyright © 2011 Institute for Healthcare ImprovementSlide 67
λλλλ, µµµµ , S
λ = 1 , µ= 1/2.5 = 0.4, S = 5
ρ = λ/ µ = 2.5
P(Ss) (table) ≈ 0.13
Řl = P(Ss) . ρ /(S-ρ) = 0.13 . 2.5/(5 – 2.5) ≈ 0.13
Ťw = Řl/λ = 0.13/1 = 0.13 days
1st ICU
Copyright © 2011 Institute for Healthcare ImprovementSlide 68
λλλλ, µµµµ , S
λ = 2 , µ= 1/2.5 = 0.4, S = 10
ρ = λ/ µ = 5
P(Ss) (table) ≈ 0.036
Řl = P(Ss) . ρ /(S-ρ) = 0.036 . 5/(10 – 5) ≈ 0.036
Ťw = Řl/λ = 0.036/2 = 0.018 days
2nd ICU

35
Copyright © 2011 Institute for Healthcare ImprovementSlide 69
Ťw = 0.13 days
1st ICU 2nd ICU
Ťw = 0.018days
Copyright © 2010 Institute for Healthcare Improvement
Session 5Introduction of Variability Concept
and Methodology
Eugene Litvak
Institute for Healthcare Optimization

36
Copyright © 2011 Institute for Healthcare ImprovementSlide 71
Quotes from the 2006 IOM report The Future of Emergency Care in the U.S. Health System (Hospital-Based Emergency Care: At the Breaking Point)
� “Hospitals have direct control over operational efficiency, and have a number of variables within their control. They include such factors as impatient bed capacity, ancillary service delays, the scheduling of services and support staff…”
� “4.1 Hospital chief executive officers should adopt enterprise-wide operations management and related strategies to improve the quality and efficiency of emergency care.”
Copyright © 2011 Institute for Healthcare ImprovementSlide 72
Quotes from the 2006 IOM report The Future of Emergency Care in the U.S. Health System (Hospital-Based Emergency Care: At the Breaking Point)
� “4.3 Training in operations management and
related approaches should be promoted by
professional associations; accrediting
organizations, such as the Joint Commission on
Accreditation of Healthcare Organizations
(JCAHO) and the National Committee for
Quality Assurance (NCQA)…”
37
Copyright © 2011 Institute for Healthcare ImprovementSlide 73
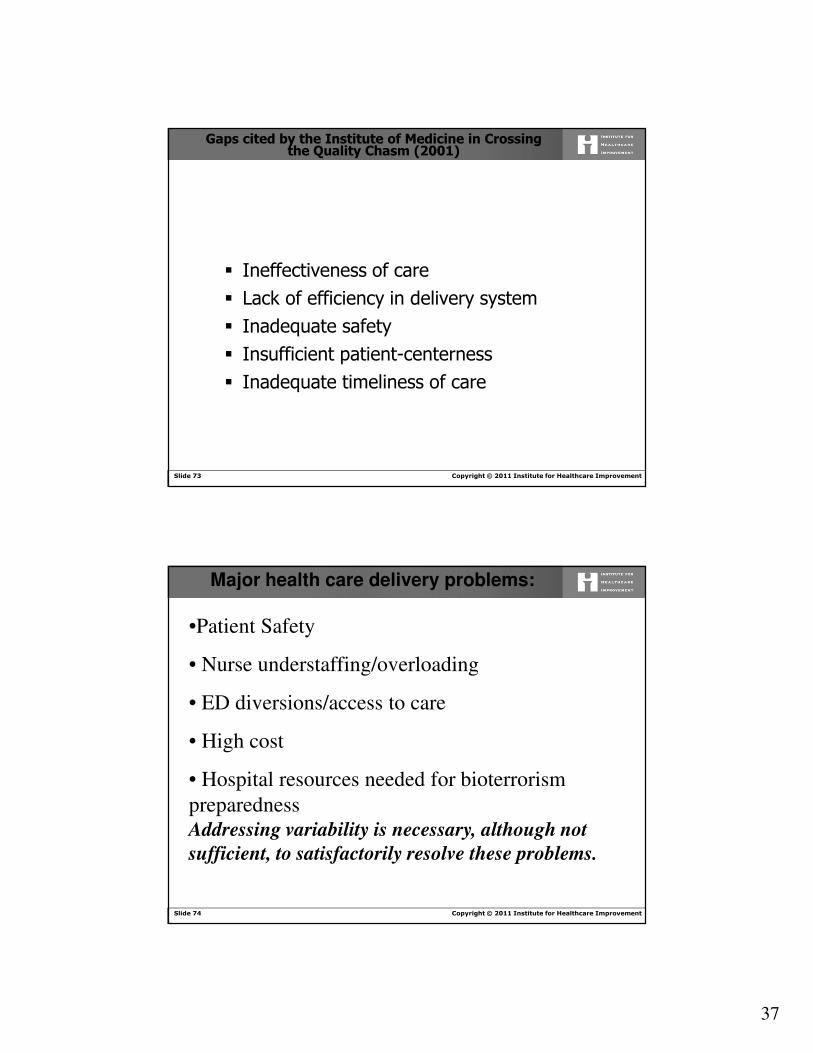
Gaps cited by the Institute of Medicine in Crossing the Quality Chasm (2001)
� Ineffectiveness of care� Lack of efficiency in delivery system� Inadequate safety� Insufficient patient-centerness� Inadequate timeliness of care
Copyright © 2011 Institute for Healthcare ImprovementSlide 74
•Patient Safety
• Nurse understaffing/overloading
• ED diversions/access to care
• High cost
• Hospital resources needed for bioterrorism
preparedness
Addressing variability is necessary, although not
sufficient, to satisfactorily resolve these problems.
Major health care delivery problems:

38
Copyright © 2011 Institute for Healthcare ImprovementSlide 75
How unsmooth census looks like?(no holidays, no weekends, weekdays only)
Copyright © 2011 Institute for Healthcare ImprovementSlide 76
How did we staff, and how do we staff?

39
Copyright © 2011 Institute for Healthcare ImprovementSlide 77
Systemic Effects of Peak Loads
� Internal Divert –Patients sent to alternative
floors\Intensive Care locations
� Internal Delays – PACU backs up
� External Divert - ED divert
� Staff overload – medical errors and inability to
retain staff
� System Gridlock – Increase in LOS
� Decreased throughput and revenue
Copyright © 2011 Institute for Healthcare ImprovementSlide 78
Controlling the total cost, without knowing cost of delivery, decreases
quality.
Take-out Pizza Example

40
Copyright © 2011 Institute for Healthcare ImprovementSlide 79
Litvak E. & Long MC. Cost and Quality Under Managed Care:
Irreconcilable Differences? American Journal of Managed Care,
2000; 6 (3): 305-312.
http://www.ajmc.com/files/articlefiles/AJMC2000MarLitvak305_312.pdf
Litvak E. "Optimizing patient flow by managing its variability". In
Berman S. (ed.): Front Office to Front Line: Essential Issues for
Health Care Leaders. Oakbrook Terrace, IL: Joint Commission
Resources, 2005, pp. 91-111.
http://www.ihoptimize.org/Collateral/Documents/English-
US/front%20lines%20chapter.pdf
Copyright © 2011 Institute for Healthcare ImprovementSlide 80
Quotes from the 2006 IOM report The Future of Emergency Care in the U.S. Health System (Hospital-Based Emergency Care: At the Breaking Point)
� “By applying variability methodology, queuing theory and the I/T/O model, hospitals can identify and eliminate many of the patient flow impediments caused by operational inefficiencies”
� “By smoothing the inherent peaks-and valleys of patient flow, and eliminating the artificial variabilities, that unnecessarily impair patient flow, hospitals can improve patient safety and quality while simultaneously reducing hospital waste and cost”

41
Copyright © 2011 Institute for Healthcare ImprovementSlide 81
The Ideal Healthcare System
(100% efficiency)
1. All patients have the same disease with
the same severity.
2. All patients arrive at the same rate.
3. All providers (physicians, nurses) are
equal in their ability to provide quality
care.
Copyright © 2011 Institute for Healthcare ImprovementSlide 82
Can your health care delivery system become a Toyota product line?

42
Copyright © 2011 Institute for Healthcare ImprovementSlide 83
Natural Variability
I) Clinical Variability
II) Flow Variability
III) Professional Variability
−Random
−Can not be eliminated (or even reduced)
−Must be optimally managed
}
Copyright © 2011 Institute for Healthcare ImprovementSlide 84
Designing and Testing Complex
Mechanical Systems: Family Car
• Hitting a pothole vs. high speed impact against
the wall
• Health care “financial bumper”
• Are the stresses an intrinsic part of health care
delivery?

43
Copyright © 2011 Institute for Healthcare ImprovementSlide 85
What makes hospital census variable?
Copyright © 2011 Institute for Healthcare ImprovementSlide 86
What makes hospital census variable?
� If ED cases are 50% of admissions
and…
� Elective-scheduled OR cases are 35% of admissions
then…
� Which would you expect to be the largest source of census
variability?

44
Copyright © 2011 Institute for Healthcare ImprovementSlide 87
The answer is…
The ED and Elective-Scheduled OR have approximately equal effects on census variability.
Why?Because of another (hidden) type of variability...
Copyright © 2011 Institute for Healthcare ImprovementSlide 88
Artificial Variability
� Non-random
� Non-predictable (driven by unknown individual priorities)
� Should not be managed, must be identified and eliminated

45
Copyright © 2011 Institute for Healthcare ImprovementSlide 89
Why managing variability today is more important than before?
Copyright © 2011 Institute for Healthcare ImprovementSlide 90
Does the healthcare system need more capacity?
90

46
Copyright © 2011 Institute for Healthcare ImprovementSlide 91
At what cost?
� Typical cost of new capacity
� Inpatient beds - $1M in capital and $250K-800K annual operating expense
� Operating rooms - $2 – 7 Million, $250K+ annual operating expense
� Major imaging (CT, MRI, PET/CT, etc.) –approx. $1M+
� Cardiac Catheterization Lab – approx. $2M
� Nursing and other provider shortages?
Slide provided by Sandeep Green Vaswani, Institute for Healthcare Optimization
91
Copyright © 2011 Institute for Healthcare ImprovementSlide 92
Is this about access to care?
47
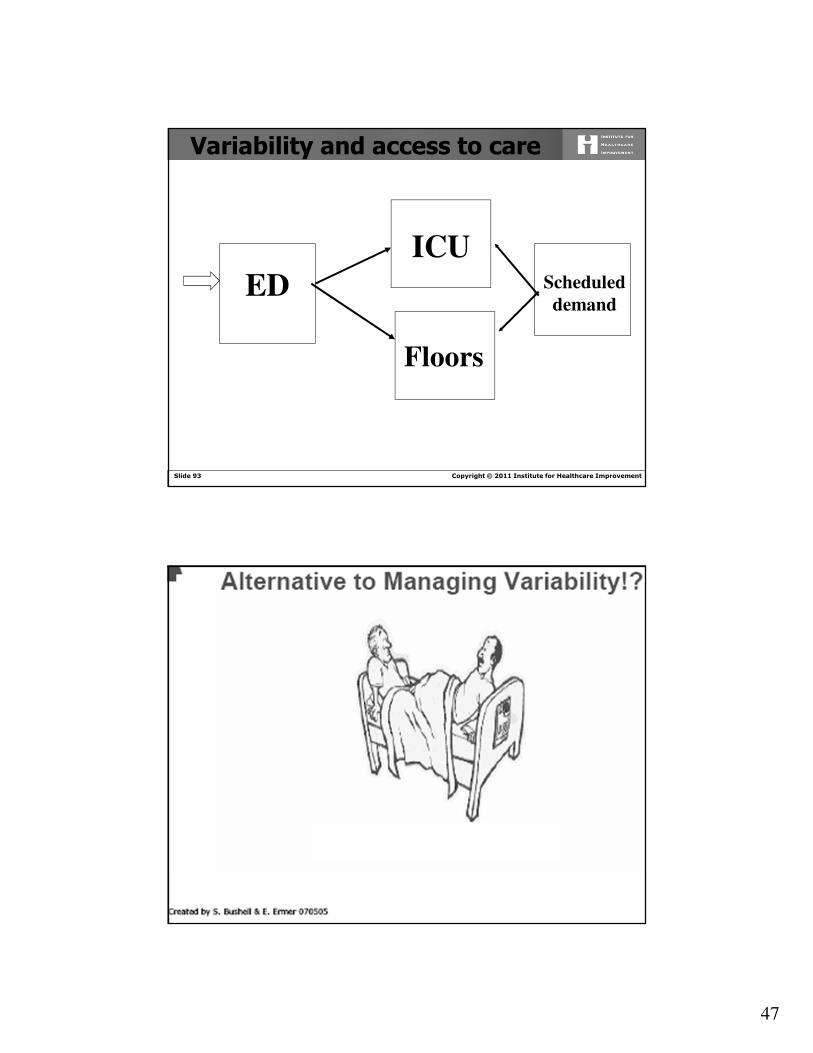
Copyright © 2011 Institute for Healthcare ImprovementSlide 93
Floors
ICU
ED
Variability and access to care
Scheduled
demand
Copyright © 2011 Institute for Healthcare ImprovementSlide 94

48
Copyright © 2011 Institute for Healthcare ImprovementSlide 95
Can you solve your ED, ICU or Med/Surgunits overcrowding without smoothing elective admissions?
Can you match your capacity and demand without throwing excessive resources at the system by other means without smoothing elective admissions?
Copyright © 2011 Institute for Healthcare ImprovementSlide 96
After elective patient flow is smoothed (and only then!) the right size of the hospital units could be determined for both scheduled and unscheduled admissions

49
Copyright © 2011 Institute for Healthcare ImprovementSlide 97
Do you always place every patient into the appropriate bed? What happens if you do not?
How important is to know the right size of the unit?
Copyright © 2011 Institute for Healthcare ImprovementSlide 98
Rapid Response Team
Does the Rapid Response Team helps at your hospital ?
Why?
Litvak E, Pronovost PJ. Rethinking rapid response
teams. JAMA. 2010;304(12):1375–6.
98

50
Copyright © 2011 Institute for Healthcare ImprovementSlide 99
Elective Surgical Requests vs Total Refusals
Michael L. McManus, M.D., M.P.H.; Michael C. Long, M.D.; Abbot Cooper; James
Mandell, M.D.; Donald M. Berwick, MD; Marcello Pagano, Ph.D.; Eugene Litvak,
Ph.D. Impact of Variability in Surgical Caseload on Access to Intensive Care
Services, Anesthesiology 2003; 98: 1491-1496.
Copyright © 2011 Institute for Healthcare ImprovementSlide 100
Variability and Readmissions
Does variability affect readmission rate?
“The main outcome variable is unplanned patient readmission to the neurosciences critical care unit within 72 hrs of discharge to a lower level of care. The odds of one or more discharges becoming an unplanned readmission within 72 hrs were nearly two and a half times higher on days when ≥9 patients were admitted to the neurosciences critical care unit …” *)
“The odds of readmission were nearly five times higher on days when ≥10 patients were admitted …” *)
*) Baker, David R. DrPH, MBA; Pronovost, Peter J. MD, PhD; Morlock, Laura L. PhD, et al. Patient flow variability and unplanned readmissions to an intensive care unit.Critical Care Medicine: November 2009 - Volume 37 - Issue 11 - pp 2882-2887

51
Copyright © 2011 Institute for Healthcare ImprovementSlide 101
Is this about nurse staffing as well?
Can you provide an adequate nurse staffing without smoothing elective admissions?
Copyright © 2011 Institute for Healthcare ImprovementSlide 102
Impact of Census Variability on Patients per Nurse Ratio
http://www.ihoptimize.org/what-we-do-methodology-artificial-variability-healthcare-
provider-nurses-other-providers.htm

52
Copyright © 2011 Institute for Healthcare ImprovementSlide 103
Variability and Quality of Care*
� Inadequate numbers of nursing staff contribute to 24% of all
sentinel events in hospitals. Inadequate orientation and in-
service education of nursing staff are additional contributing
factors in over 70% of sentinel events*
� “…higher numbers of nurse hours per patient, larger
proportions of RNs and high levels of competition with other
hospitals were all correlated with higher levels of NQF Safe
Practices adoption.”**
*Dennis S. O’Leary, JCAHO (personal communication)
** http://nursing.advanceweb.com/News/National-News/Magnet-
Designated-Hospitals-More-Likely-to-Adopt-NQF-Safety-Practices.aspx
Copyright © 2011 Institute for Healthcare ImprovementSlide 104
Variability and mortality
“Each additional patient per nurse was associated with a 7% increase in the
likelihood of dying within 30 days of admission and a 7% increase in the odds of
failure-to-rescue”*
* Linda H. Aiken, Sean P. Clarke, Douglas M. Sloane, Julie Sochalski, and Jeffrey H. Silber.
Hospital Nurse Staffing and Patient Mortality, Nurse Burnout, and Job Dissatisfaction.
JAMA, 2002; 288: 1987:1993
Litvak E, Buerhaus PI, Davidoff F, Long MC, McManus ML,
Berwick DM. “Managing Unnecessary Variability in Patient Demand
to Reduce Nursing Stress and Improve Patient Safety,” Joint
Commission Journal on Quality and Patient Safety, 2005; 31(6): 330-
338.http://www.ihi.org/NR/rdonlyres/E18D05FD-F4E5-448D-8CBE-
217CB5C03B7C/0/ManagingUnnecessaryVariabilityinPatientDemand.pdf

53
Copyright © 2011 Institute for Healthcare ImprovementSlide 105
Example:
Assumptions:
� 200 surgical beds
� average census for surgical beds 160
� staffing level 40 nurses (1 nurse per 4 patients)
� average residual from 160 patients census is 20% or 32 patients
� patients are distributed evenly between the nurses
How the mortality rate will change with 20% increase in surgical demand?
Copyright © 2011 Institute for Healthcare ImprovementSlide 106
Results:
� 32 additional patients will be distributed evenly between 32 nurses: 1 additional patient per nurse or 4 + 1 = 5 patient per nurse
� these 32 nurses now will take care of 160 patients, whose mortality rate increases by 7%
� if these additional 32 patients will be distributed evenly between 16 nurses, then each such nurse will take care of 4 + 2 = 6 patients
� these 16 nurses now will take care of 96 patients, whose mortality rate increases by 14%
54
Copyright © 2011 Institute for Healthcare ImprovementSlide 107
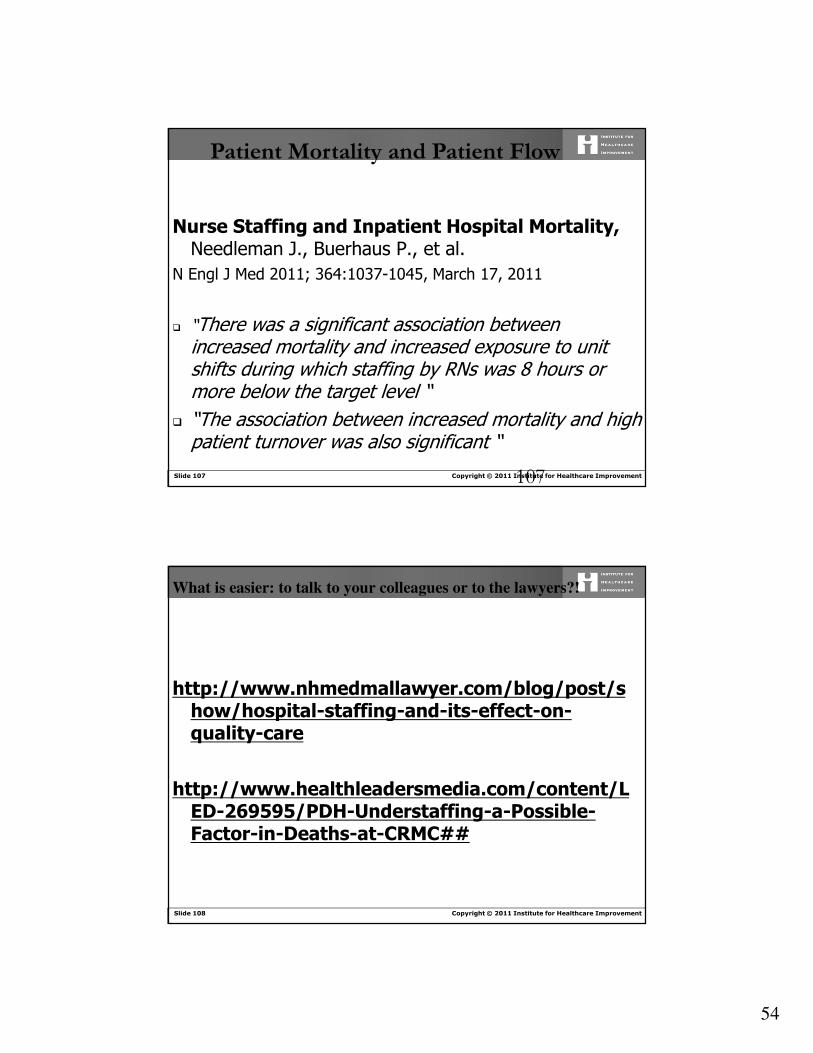
Nurse Staffing and Inpatient Hospital Mortality, Needleman J., Buerhaus P., et al.
N Engl J Med 2011; 364:1037-1045, March 17, 2011
� “There was a significant association between increased mortality and increased exposure to unit shifts during which staffing by RNs was 8 hours or more below the target level “
� “The association between increased mortality and high patient turnover was also significant “
107
Patient Mortality and Patient Flow
Copyright © 2011 Institute for Healthcare ImprovementSlide 108
What is easier: to talk to your colleagues or to the lawyers?!
http://www.nhmedmallawyer.com/blog/post/show/hospital-staffing-and-its-effect-on-quality-care
http://www.healthleadersmedia.com/content/LED-269595/PDH-Understaffing-a-Possible-Factor-in-Deaths-at-CRMC##
55
Copyright © 2011 Institute for Healthcare ImprovementSlide 109
Five ways of staffing
Nursing August 2011http://journals.lww.com/nursing/Fulltext/2011/080
00/Nurse_staffing,_hospital_operations,_care_quality,.1.aspx
Copyright © 2010 Institute for Healthcare Improvement
Session 6Applications to the health care problems
Applying theory to the front line
Eugene Litvak
Jason Leitch
Peter Lachman

56
Copyright © 2010 Institute for Healthcare Improvement
Managing variability in patient flow:Success stories
Managing Patient Flow: A Focus on Critical Processes
http://store.trihost.com/jcaho/product.asp?dept%5Fid=34&catalog%5Fitem=712
Copyright © 2010 Institute for Healthcare Improvement
Boston Medical Center (OR)
• Reduced ambulance diversions by 20%
• Increased surgical volume by ≈ 20%
• Reduced last-minute postponement of elective surgeries by 99.5%
• Reduced by 0.5h nurse hours per patient day in the step-down unit

57
Copyright © 2010 Institute for Healthcare Improvement
Cincinnati Children’s Hospital Medical Center
�Weekend waiting times:
Despite a 37% increase in the case volume in July-August as
compared to January-March the waiting times for unscheduled
procedures has been reduced by 34%
� Weekday waiting times:
Despite a 24% increase in the case volume during September-early
October, as compared to January-March, the waiting times for
unscheduled procedures has been reduced by 28%.
Copyright © 2010 Institute for Healthcare Improvement
Cincinnati Children’s Hospital Medical Center
� Throughput increase
Originally yearly equivalent to the addition of one more operating room to the OR (which would increase capacity by 1/21 or 4.8%),without any of the associated capital or operating costs. For the last two years 7% annual increase in surgical volume without additional OR(s).
� Reduction in Overtime
Overtime hours decreased by an estimated 57% between September 18, 2006 and the first week of January 2007. If OR operating costs are estimated at $250/room hour, then these savings are equivalent to $10,750/week, or $559,000 annually.

58
Copyright © 2011 Institute for Healthcare ImprovementSlide 115
Their opinion…
“this is the best thing for ortho since I have been here…we get our cases done earlier which makes our families very happy...patients don’t have to wait NPO until the evening. The weekends are unbelievably good, the OR hostility that was previously present has been virtually eliminated”. (Ortho surgeon, Division director)
Copyright © 2011 Institute for Healthcare ImprovementSlide 116
“I feel there is an improvement in our time and efficiency when assigning staff.We are assigning add-on staff the daybefore instead of pulling them fromother rooms...” (OR nurse)

59
Copyright © 2010 Institute for Healthcare Improvement
Elliot Hospital (Maternity ward)
• Eliminated morning chaos
• Reduced the demand for additional staffed beds by 6 positions (50%)
• Improved quality of care
Copyright © 2011 Institute for Healthcare ImprovementSlide 118
BMCCincinnati
Children’s
Elliot
Is it feasible for other hospitals to
manage variability in patient flow?

60
Copyright © 2011 Institute for Healthcare ImprovementSlide 119
� Provide the resources (e.g., staffing) sufficient to meet
current patient peaks in demand - historical scenario
� Staff below the peaks and tolerate ED diversions,
nursing overloading and medical errors - current scenario
� Smooth artificial variability and provide the
resources to meet patient (vs. schedule) driven peaks in
demand. Variability methodology can quantify and
justify such additional resources
Three alternatives:
119
Copyright © 2011 Institute for Healthcare ImprovementSlide 120
What would be national return on investment
from applying these concepts?
Eugene Litvak (IHO), Maureen Bisognano (IHI). More
Patients, Less Payment: Increasing Hospital Efficiency
In The Aftermath Of Health Reform. Health Affairs,
January 2011 (30):176-180

61
Copyright © 2011 Institute for Healthcare ImprovementSlide 121
OECD Acute Care Bed Occupancy
0%
10%
20%
30%
40%
50%
60%
70%
80%
90%90%
88%86% 86%
84%
79% 79% 79%76% 76%
73%
67%
Acute Care Bed Occupancy 2009
OECD Health Data
Slide provided by Sandeep Green Vaswani, Institute for Healthcare Optimization
Copyright © 2011 Institute for Healthcare ImprovementSlide 122
• Based on AHA 2010 data, overall nationwide hospital inpatient
occupancy was about 66%
• Even if one were to assume that all admissions are urgent in nature
(statistically random arrivals), 80% occupancy should be achievable
(based on queuing methodology) without compromising access or
quality of care1
• Potential savings of tens of billions of dollars annually2
1 From Front Office to Front Line- Joint Commission Resources, chapter 4:
Optimizing Patient Flow by Managing its Variability
http://www.ihoptimize.org/Collateral/Documents/English-
US/front%20lines%20chapter.pdf2 Recent IOM book:
http://www.nap.edu/openbook.php?record_id=12750&page=294
National Opportunity – An Example

62
Copyright © 2011 Institute for Healthcare ImprovementSlide 123
National Opportunity – An Example
“Early hospital adopters such as Cincinnati Children’s Hospital (CCH) have been able to increase
hospital throughput capability by more than 15%1. If the experience of early hospital adopters proves
generalizable, it will reduce U.S. hospital cost per admission by ~15 percent. Since hospitalizations,
including outpatient procedures, consume over 30 percent of US health care spending, this single
improvement would reduce the cost of U.S. health insurance by roughly 4-5 percent if hospitals pass
savings through to insurers and insurers, in turn, to insurance buyers. It is also likely to reduce hospital
mortality by sparing hospital nursing units preventable bulges in the number of new patients they must
admit in a single day.” 2
These 4%-5% mean over $1 trillion in 10 years.
1 http://www.ihi.org/ihi/files/WIHI/WIHI_20091202_Patient_Flow.mp3
2 E. Litvak, A. Milstein, M. Smith. “Engineering Science And Episode-
Based Hospital Payment”
http://healthaffairs.org/blog/2010/09/15/engineering-science-and-
episode-based-hospital-payment/
Copyright © 2011 Institute for Healthcare ImprovementSlide 124
Readings
http://www.ihoptimize.org
http://www.ihoptimize.org/knowledge-center-publications.htm
hManaging Patient Flow in Hospitals:
Strategies and Solutions, Second Edition
2009. 166 pages. ISBN: 978-1-59940-372-4
http://www.jointcommissioninternational.org/
Books-and-E-books/Managing-Patient-Flow-
in-Hospitals-Strategies-and-Solutions-Second-
Edition/1497

63
Copyright © 2011 Institute for Healthcare ImprovementSlide 125
Some helpful links:
• http://www.ihoptimize.org/what-we-do-methodology-artificial-
variability-healthcare-provider-administrators.htm
• http://www.ihoptimize.org/what-we-do-methodology-artificial-
variability-healthcare-provider-surgeons.htm
• http://www.ihoptimize.org/what-we-do-methodology-artificial-
variability-healthcare-provider-nurses-other-providers.htm
• http://www.rwjf.org/pr/product.jsp?id=50488
• http://www.ihoptimize.org/Collateral/Documents/English-US/MPF09-
Pages24-25.pdf
• http://www.ihoptimize.org/Collateral/Documents/English-
US/Cincinnati_Childrens_Questionnaire.pdf
• http://www.ihi.org/ihi/files/WIHI/WIHI_20091202_Patient_Flow.mp3
• http://www.ihi.org/NR/rdonlyres/E632D3DD-CFA8-425A-A676-
11AA11B354CA/0/ORInitiativeClip20090917.mp3
Copyright © 2011 Institute for Healthcare ImprovementSlide 126
Summary
� Scientific managing variability in patient flow is absolutely necessary to increase overall hospital patient throughput while improving quality of care, patient safety and reducing nursing workload.
� It requires rigorous data analysis, scientific management of operations, clinical and organizational behavior expertise.
64
Copyright © 2011 Institute for Healthcare ImprovementSlide 127
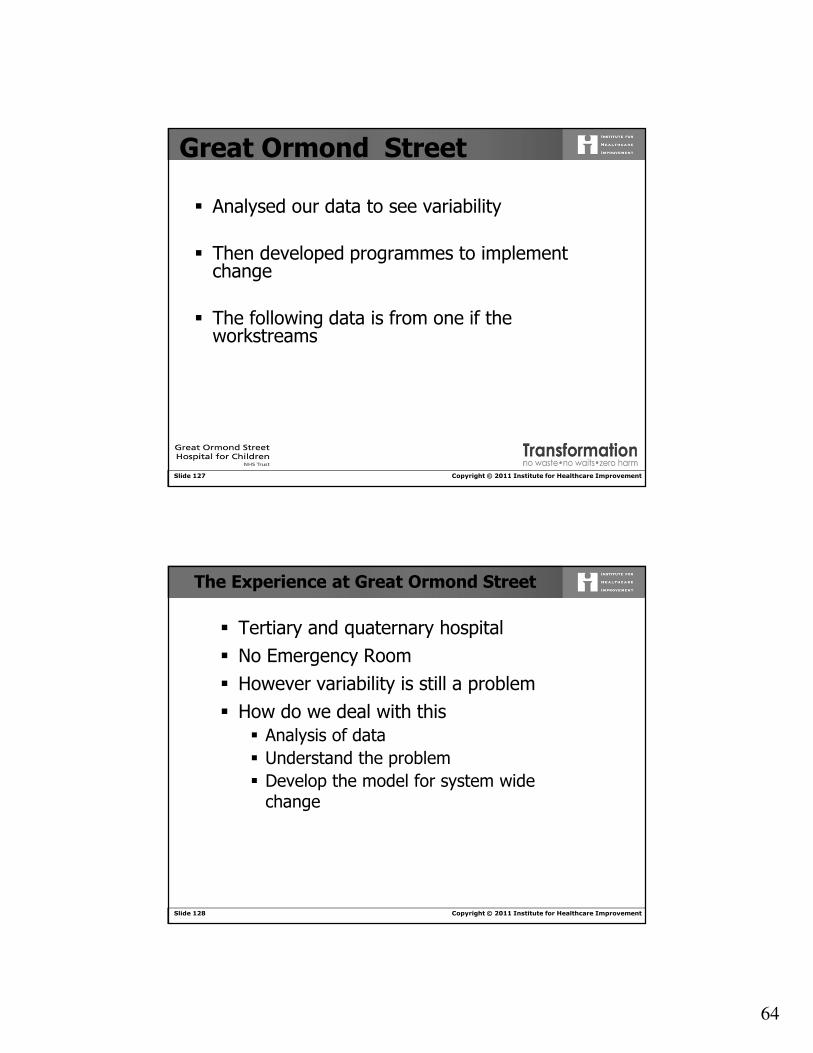
Great Ormond Street
� Analysed our data to see variability
� Then developed programmes to implement change
� The following data is from one if the workstreams
Copyright © 2011 Institute for Healthcare ImprovementSlide 128
The Experience at Great Ormond Street
� Tertiary and quaternary hospital� No Emergency Room� However variability is still a problem� How do we deal with this
� Analysis of data� Understand the problem � Develop the model for system wide
change

65
Copyright © 2011 Institute for Healthcare ImprovementSlide 129
Where will this work?
� Consider areas where you do not know how to solve the blocks in the system� Emergency room� Inpatient beds� Diagnostic procedures� Operating room� Outpatients
� i.e everywhere!!
Copyright © 2011 Institute for Healthcare ImprovementSlide 130
GOSH Admissions By Date
Program for Management of Variability in Health Care Delivery Boston
University Health Policy Institute
0
20
40
60
80
100
120
140
160
Sun/
01/0
4/07
Sun/
15/0
4/07
Sun/
29/0
4/07
Sun/
13/0
5/07
Sun/
27/0
5/07
Sun/
10/0
6/07
Sun/
24/0
6/07
Sun/
08/0
7/07
Sun/
22/0
7/07
Sun/
05/0
8/07
Sun/
19/0
8/07
Sun/
02/0
9/07
Sun/
16/0
9/07
Sun/
30/0
9/07
Sun/
14/1
0/07
Sun/
28/1
0/07
Sun/
11/1
1/07
Sun/
25/1
1/07
Sun/
09/1
2/07
Sun/
23/1
2/07
Sun/
06/0
1/08
Sun/
20/0
1/08
Sun/
03/0
2/08
Sun/
17/0
2/08
Sun/
02/0
3/08
Sun/
16/0
3/08
Sun/
30/0
3/08
Count
Admission Date
Grand Total Total Mean
Copyright Great Ormond Street

66
Copyright © 2011 Institute for Healthcare ImprovementSlide 131
Admissions By Urgency and Date
Program for Management of Variability in Health Care Delivery Boston
University Health Policy Institute
0
20
40
60
80
100
120
140
160Su
n/01
/04/
07
Sun/
15/0
4/07
Sun/
29/0
4/07
Sun/
13/0
5/07
Sun/
27/0
5/07
Sun/
10/0
6/07
Sun/
24/0
6/07
Sun/
08/0
7/07
Sun/
22/0
7/07
Sun/
05/0
8/07
Sun/
19/0
8/07
Sun/
02/0
9/07
Sun/
16/0
9/07
Sun/
30/0
9/07
Sun/
14/1
0/07
Sun/
28/1
0/07
Sun/
11/1
1/07
Sun/
25/1
1/07
Sun/
09/1
2/07
Sun/
23/1
2/07
Sun/
06/0
1/08
Sun/
20/0
1/08
Sun/
03/0
2/08
Sun/
17/0
2/08
Sun/
02/0
3/08
Sun/
16/0
3/08
Sun/
30/0
3/08
Count
Admission Date
Grand Total Total Mean Elective Elective Mean Emergency Emergency Mean
Copyright Great Ormond Street
Copyright © 2011 Institute for Healthcare ImprovementSlide 132
Elective Inpatient Admissions by Use of Theatres: Non-holiday Weekdays
Program for Management of Variability in Health Care Delivery
Boston University Health Policy Institute
0
5
10
15
20
25
30
35
40
45
50
4/2/
2007
4/9/
2007
4/16
/200
74/
23/2
007
4/30
/200
75/
7/20
075/
14/2
007
5/21
/200
75/
28/2
007
6/4/
2007
6/11
/200
76/
18/2
007
6/25
/200
77/
2/20
077/
9/20
077/
16/2
007
7/23
/200
77/
30/2
007
8/6/
2007
8/13
/200
78/
20/2
007
8/27
/200
79/
3/20
079/
10/2
007
9/17
/200
79/
24/2
007
10/1
/200
710
/8/2
007
10/1
5/20
0710
/22/
2007
10/2
9/20
0711
/5/2
007
11/1
2/20
0711
/19/
2007
11/2
6/20
0712
/3/2
007
12/1
0/20
0712
/17/
2007
12/2
4/20
0712
/31/
2007
1/7/
2008
1/14
/200
81/
21/2
008
1/28
/200
82/
4/20
082/
11/2
008
2/18
/200
82/
25/2
008
3/3/
2008
3/10
/200
83/
17/2
008
3/24
/200
83/
31/2
008
Non-theatre Non-theatre Mean Theatre Theatre Mean
Copyright Great Ormond Street

67
Copyright © 2011 Institute for Healthcare ImprovementSlide 133
Inpatient vs. Day Case Admissions: Non-holiday Weekdays Only
Program for Management of Variability in Health Care Delivery
Boston University Health Policy Institute
0
10
20
30
40
50
60
70
80
90
100M
on/0
2/04
/07
Mon
/16/
04/0
7
Mon
/30/
04/0
7
Mon
/14/
05/0
7
Mon
/28/
05/0
7
Mon
/11/
06/0
7
Mon
/25/
06/0
7
Mon
/09/
07/0
7
Mon
/23/
07/0
7
Mon
/06/
08/0
7
Mon
/20/
08/0
7
Mon
/03/
09/0
7
Mon
/17/
09/0
7
Mon
/01/
10/0
7
Mon
/15/
10/0
7
Mon
/29/
10/0
7
Mon
/12/
11/0
7
Mon
/26/
11/0
7
Mon
/10/
12/0
7
Mon
/24/
12/0
7
Mon
/07/
01/0
8
Mon
/21/
01/0
8
Mon
/04/
02/0
8
Mon
/18/
02/0
8
Mon
/03/
03/0
8
Mon
/17/
03/0
8
Mon
/31/
03/0
8
Count
Admission Date
DC DC Mean IP IP Mean
Copyright Great Ormond Street
Copyright © 2011 Institute for Healthcare ImprovementSlide 134
Theatre Cases by Date: Non-holiday Weekdays Only
Program for Management of Variability in Health Care Delivery Boston
University Health Policy Institute
0
10
20
30
40
50
60
Mon
/02/
04/0
7
Mon
/16/
04/0
7
Mon
/30/
04/0
7
Mon
/14/
05/0
7
Mon
/28/
05/0
7
Mon
/11/
06/0
7
Mon
/25/
06/0
7
Mon
/09/
07/0
7
Mon
/23/
07/0
7
Mon
/06/
08/0
7
Mon
/20/
08/0
7
Mon
/03/
09/0
7
Mon
/17/
09/0
7
Mon
/01/
10/0
7
Mon
/15/
10/0
7
Mon
/29/
10/0
7
Mon
/12/
11/0
7
Mon
/26/
11/0
7
Mon
/10/
12/0
7
Mon
/24/
12/0
7
Mon
/07/
01/0
8
Mon
/21/
01/0
8
Mon
/04/
02/0
8
Mon
/18/
02/0
8
Mon
/03/
03/0
8
Mon
/17/
03/0
8
Mon
/31/
03/0
8
Count
Admission Date
DC DC Mean IP IP Mean Outpatient Outpatient Mean
Copyright Great Ormond Street
68
Copyright © 2011 Institute for Healthcare ImprovementSlide 135
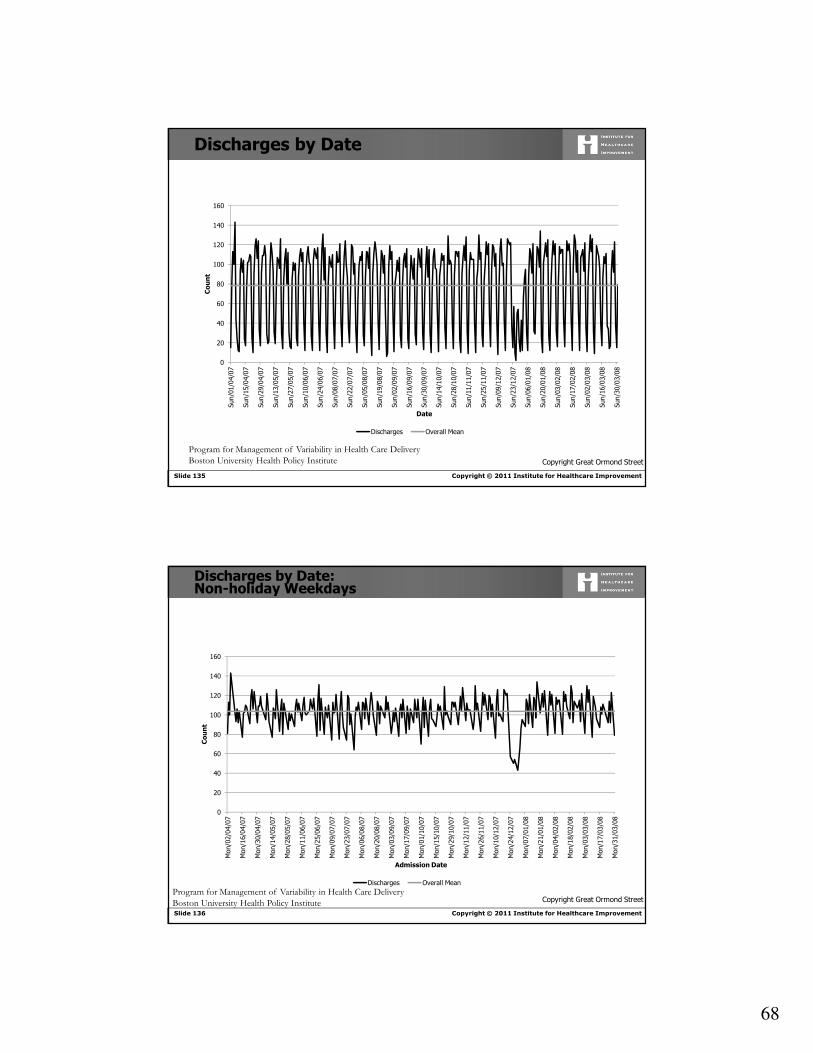
Discharges by Date
Program for Management of Variability in Health Care Delivery
Boston University Health Policy Institute
0
20
40
60
80
100
120
140
160
Sun/
01/0
4/07
Sun/
15/0
4/07
Sun/
29/0
4/07
Sun/
13/0
5/07
Sun/
27/0
5/07
Sun/
10/0
6/07
Sun/
24/0
6/07
Sun/
08/0
7/07
Sun/
22/0
7/07
Sun/
05/0
8/07
Sun/
19/0
8/07
Sun/
02/0
9/07
Sun/
16/0
9/07
Sun/
30/0
9/07
Sun/
14/1
0/07
Sun/
28/1
0/07
Sun/
11/1
1/07
Sun/
25/1
1/07
Sun/
09/1
2/07
Sun/
23/1
2/07
Sun/
06/0
1/08
Sun/
20/0
1/08
Sun/
03/0
2/08
Sun/
17/0
2/08
Sun/
02/0
3/08
Sun/
16/0
3/08
Sun/
30/0
3/08
Count
Date
Discharges Overall Mean
Copyright Great Ormond Street
Copyright © 2011 Institute for Healthcare ImprovementSlide 136
Discharges by Date: Non-holiday Weekdays
Program for Management of Variability in Health Care Delivery
Boston University Health Policy Institute
0
20
40
60
80
100
120
140
160
Mon
/02/
04/0
7
Mon
/16/
04/0
7
Mon
/30/
04/0
7
Mon
/14/
05/0
7
Mon
/28/
05/0
7
Mon
/11/
06/0
7
Mon
/25/
06/0
7
Mon
/09/
07/0
7
Mon
/23/
07/0
7
Mon
/06/
08/0
7
Mon
/20/
08/0
7
Mon
/03/
09/0
7
Mon
/17/
09/0
7
Mon
/01/
10/0
7
Mon
/15/
10/0
7
Mon
/29/
10/0
7
Mon
/12/
11/0
7
Mon
/26/
11/0
7
Mon
/10/
12/0
7
Mon
/24/
12/0
7
Mon
/07/
01/0
8
Mon
/21/
01/0
8
Mon
/04/
02/0
8
Mon
/18/
02/0
8
Mon
/03/
03/0
8
Mon
/17/
03/0
8
Mon
/31/
03/0
8
Count
Admission Date
Discharges Overall Mean
Copyright Great Ormond Street

69
Copyright © 2011 Institute for Healthcare ImprovementSlide 137
Summary
� While day case patients comprise majority of admissions, true inpatients have most impact
� Substantial variability in elective admissions� Theatre cases comprise large majority
� Wasted bed & theatre capacity� Improved scheduling of elective
admissions, especially theatre cases, needed
Program for Management of Variability in Health Care Delivery
Boston University Health Policy Institute Copyright Great Ormond Street
Copyright © 2011 Institute for Healthcare ImprovementSlide 138
Recommendations
1. Central management of admissions2. Establishment of a central ‘patient flow team’3. Central management of operationally-relevant
information systems4. Improve collection and reporting of flow data5. Separate emergency and elective beds6. Separate resources for day case and inpatients7. Determine best management strategies for ‘high utiliser’
patients8. Reconfigure wards into larger units
Copyright Great Ormond Street

70
Copyright © 2011 Institute for Healthcare ImprovementSlide 139
And how did we respond?
Copyright © 2011 Institute for Healthcare ImprovementSlide 140
0
5
10
15
20
25
30
35
13
-De
c-0
8
27
-De
c-0
8
10
-Ja
n-0
9
24
-Ja
n-0
9
07
-Fe
b-0
9
21
-Fe
b-0
9
07
-Ma
r-0
9
21
-Ma
r-0
9
04
-Apr-
09
18
-Apr-
09
02
-Ma
y-0
9
16
-Ma
y-0
9
30
-Ma
y-0
9
13
-Ju
n-0
9
27
-Ju
n-0
9
11
-Ju
l-0
9
25
-Ju
l-0
9
08
-Aug
-09
22
-Aug
-09
05
-Sep
-09
19
-Sep
-09
03
-Oct-
09
17
-Oct-
09
Ab
so
lute
Co
un
t
Date
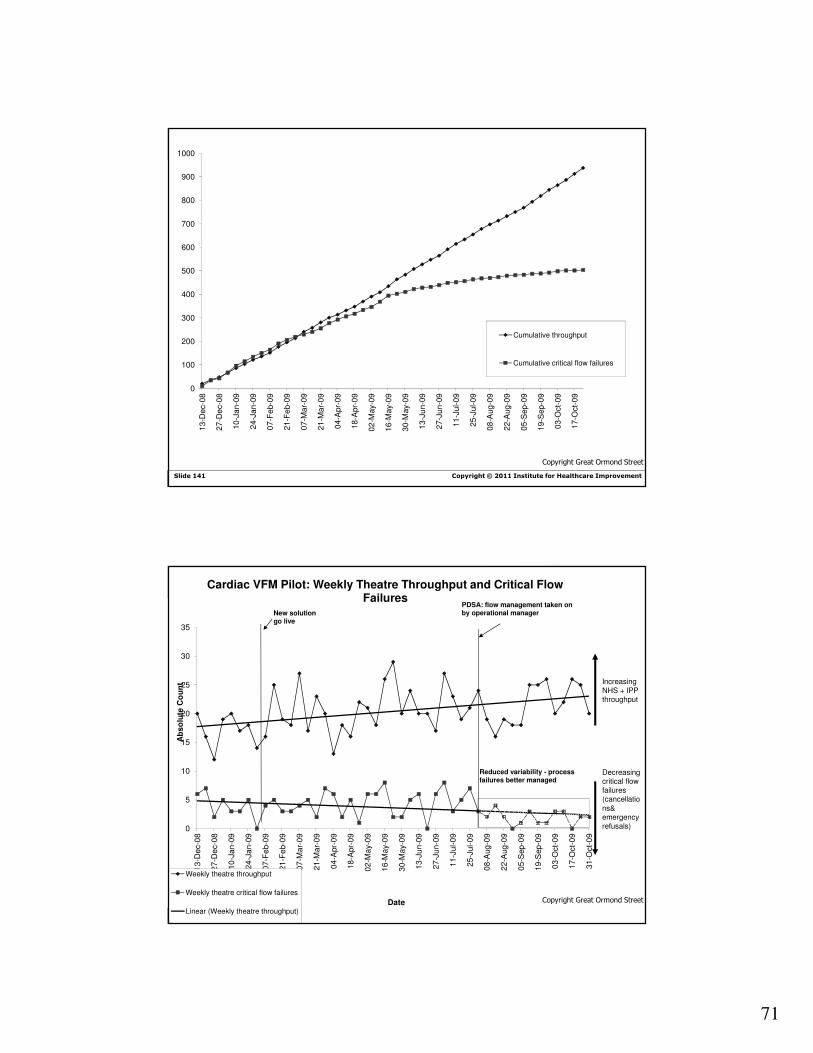
Cardiac VFM Pilot: Weekly Theatre Throughput and Critical Flow Failures
Weekly theatre throughput
Weekly theatre critical flow failures
Increasing NHS + IPP throughput
Decreasing critical flow failures (cancellations,
emergency refusals and nursing shifts lost to
sickness)
New solution go live
PDSA: flow management taken on by operational manager
Reduced variability -process more predictable
High variability -process unpredictable
Copyright Great Ormond Street
71
Copyright © 2011 Institute for Healthcare ImprovementSlide 141
0
100
200
300
400
500
600
700
800
900
1000
13
-De
c-0
8
27
-De
c-0
8
10
-Ja
n-0
9
24
-Ja
n-0
9
07
-Fe
b-0
9
21
-Fe
b-0
9
07
-Ma
r-0
9
21
-Ma
r-0
9
04
-Apr-
09
18
-Apr-
09
02
-Ma
y-0
9
16
-Ma
y-0
9
30
-Ma
y-0
9
13
-Ju
n-0
9
27
-Ju
n-0
9
11
-Ju
l-0
9
25
-Ju
l-0
9
08
-Aug
-09
22
-Aug
-09
05
-Sep
-09
19
-Sep
-09
03
-Oct-
09
17
-Oct-
09
Cumulative throughput
Cumulative critical flow failures
Copyright Great Ormond Street
Copyright © 2011 Institute for Healthcare ImprovementSlide 142
0
5
10
15
20
25
30
35
13
-De
c-0
8
27
-De
c-0
8
10
-Ja
n-0
9
24
-Ja
n-0
9
07
-Fe
b-0
9
21
-Fe
b-0
9
07
-Ma
r-0
9
21
-Ma
r-0
9
04
-Apr-
09
18
-Apr-
09
02
-Ma
y-0
9
16
-Ma
y-0
9
30
-Ma
y-0
9
13
-Ju
n-0
9
27
-Ju
n-0
9
11
-Ju
l-0
9
25
-Ju
l-0
9
08
-Aug
-09
22
-Aug
-09
05
-Sep
-09
19
-Sep
-09
03
-Oct-
09
17
-Oct-
09
31
-Oct-
09
Ab
so
lute
Co
un
t
Date
Cardiac VFM Pilot: Weekly Theatre Throughput and Critical Flow Failures
Weekly theatre throughput
Weekly theatre critical flow failures
Linear (Weekly theatre throughput)
Increasing NHS + IPP throughput
Decreasing critical flow failures (cancellatio
ns& emergency refusals)
New solution go live
PDSA: flow management taken on by operational manager
Reduced variability - process failures better managed
Copyright Great Ormond Street

72
Copyright © 2011 Institute for Healthcare ImprovementSlide 143
Copyright Great Ormond Street
Copyright © 2011 Institute for Healthcare ImprovementSlide 144
Patients:
• Reduced waiting time and improved access to care
• Reduced mortality and medical errors
Nurses:
• Reduced overtime
• Reduced workload

73
Copyright © 2011 Institute for Healthcare ImprovementSlide 145
What is here for me?
Physicians:� Reduced waste of time� Increased patient throughput� Reduced overtime
Hospital:� Better utilization of resources � Reduced hours of ED overcrowding� Staff and patient satisfaction� More staffing resources: better tolerating peak loads� Reduced mortality and medical errors� Reduced length of stay� Increased hospital throughput and revenue
Copyright © 2011 Institute for Healthcare ImprovementSlide 146
What is next?
74
Copyright © 2011 Institute for Healthcare ImprovementSlide 147
1. Provide the resources (e.g., staffing) sufficient to
meet current patient peaks in demand -
historicalscenario
2. Staff below the peaks and tolerate ED diversions,
nursing overloading and medical errors - current
scenario
3. Smooth artificial variability and provide the
resources to meet patient (vs. schedule) driven
peaks in demand. Variability methodology can
quantify and justify such additional resources
Three alternatives:
Copyright © 2010 Institute for Healthcare Improvement
END!!