the state of credit unions - check your credit report ... · the state of credit unions 2017 in the...
TRANSCRIPT

The State of Credit Unions 2017In the financial services universe, there is no shortage of players battling for consumer attention and share of wallet.
So how do credit unions stack up in a pack filled with heavy-hitting banks and aggressive online lenders? Review our latest findings, which reveal insights and stats on credit union members as well as how credit unions are faring on various loan products in comparison with the competition.
Report
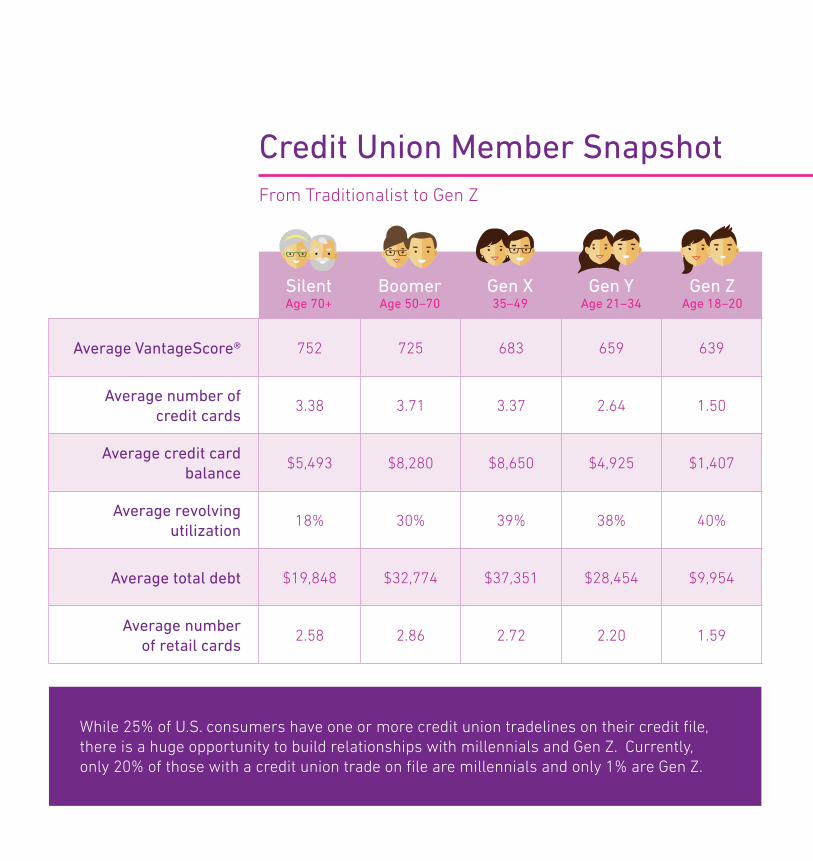
Credit Union Member SnapshotFrom Traditionalist to Gen Z
Silent Age 70+
Average VantageScore® 752 725 683 659 639
Average number of credit cards
3.38 3.71 3.37 2.64 1.50
Average credit card balance
$5,493 $8,280 $8,650 $4,925 $1,407
Average revolving utilization
18% 30% 39% 38% 40%
Average total debt $19,848 $32,774 $37,351 $28,454 $9,954
Average number of retail cards
2.58 2.86 2.72 2.20 1.59
Boomer Age 50–70
Gen X 35–49
Gen Y Age 21–34
Gen Z Age 18–20
While 25% of U.S. consumers have one or more credit union tradelines on their credit file, there is a huge opportunity to build relationships with millennials and Gen Z. Currently, only 20% of those with a credit union trade on file are millennials and only 1% are Gen Z.

Concentration of Credit Union Consumers Across the Country
Highest Concentration
Lowest Concentration
UtahAlaska Idaho Washington Hawaii
New JerseyWest Virginia Arkansas Mississippi Kentucky
55.8% 51.4% 43.1% 41.0% 38.2%
10.8% 14.1% 15.0% 15.4% 17.3%
Credit Union Member vs. Non-Credit Union Member
Consumers with 1+ CU trades
701 Average VantageScore® 665
3.35Average number of
credit cards2.90
$7,388 Average credit card balance $5,613
0.35Average number of trades
currently past due0.40
$31,626 Average total debt $20,820
Consumers with 0 CU trades
Overall, consumers with credit unions have:
• Higher risk scores.• Higher credit card
balances and utilization.
• Higher total debt (excluding mortgage).
• Lower delinquency levels.

Credit Unions vs. CompetitorsPersonal Loans
While credit unions have seen some growth in this space (up in 2 years)
— and have expressed interest in growing their personal loan business — the online
lenders and finance companies own this universe with share.51%
2%
Personal Loan OriginationsQ1 2015
Personal Loan OriginationsQ1 2017
44%
24% Credit Union
Bank
8% 4%Credit Union
Bank
Finance
Retail
Other2%
Finance
Retail
Other2%
26%
21% 16%51%

Credit Unions vs. CompetitorsCredit Card
Banks own this space, but credit unions have seen growth. Credit unions
experienced an increase in card originations from Q1 2015 to Q1 2017,
and total credit limits on newly originated cards from that same period approached
in Q1 2017.
18%
$100B
Credit Card Originations — Q1 2017
Bank — 96%
Credit Union — 4%
Credit Card Originations — Q1 2015
Bank — 97%
Credit Union — 3%
Credit Card Originations — Q1 2017
Bank — 96%
Credit Union — 4%
Credit Card Originations — Q1 2015
Bank — 97%
Credit Union — 3%

Credit Unions vs. CompetitorsMortgage
Credit unions have seen mortgage market share rise from Q1 2015 to
Q1 2017. Banks have seen a decline in that same period as online lenders start to
take away share, offering a more digital experience.
7%
Mortgage Originations — Q1 2017
Other
50%
33%
13%5%
Bank Credit Union
Finance
Mortgage Originations — Q1 2015
Other
53%37%
3%6%
Bank Credit Union
Finance

Credit Unions vs. Competitors
Credit unions have taken an edge in the auto space. Their auto originations have
increased from accounts in Q1 2015 to in Q1 2017 — a
25% increase.
1.54M 1.93M
Auto
Auto OriginationsQ1 2015
26%
23% Credit Union
Bank
21%
Captive
Finance
Other1%
Auto OriginationsQ1 2017
25%
28% Credit Union
Bank
21%
Captive
Finance
Other1%
25%29%

Experian 475 Anton Blvd. Costa Mesa, CA 92626 T: 1 888 414 1120www.experian.com
© 2017 Experian Information Solutions, Inc. • All rights reserved
Experian and the Experian mars used herein are trademarks of Experian Information Solutions, Inc. Other product and company names mentioned herein are the property of their respective owners.
VantageScore® is a registered trademark of VantageScore Solutions, LLC.
To learn more about the latest in credit union news and solutions, visit
www.experian.com/creditunions.