the state of poverty and disadvantage
TRANSCRIPT
POVERTY TRACKER ANNUAL REPORT 1
SOPHIE COLLYER
MATTHEW MAURY
LILY BUSHMAN-COPP
IRWIN GARFINKEL
LAUREN KENNEDY
KATHRYN NECKERMAN
JULIEN TEITLER
JANE WALDFOGEL
CHRISTOPHER WIMER
THE STATE OF POVERTY AND
DISADVANTAGE IN NEW YORK CITY
VOLUME 2FEBRUARY 2020

February 2020
We are pleased to present the findings from the second annual Poverty Tracker report on “The State of Poverty and Disadvantage in New York City.”
The Poverty Tracker, created in partnership with Columbia University, reflects the most important tenets of how Robin Hood fights poverty: a focus on data-driven philanthropy and a commitment to working in partnership to better understand and confront the instability that affects millions of New Yorkers year after year.
The report underscores the urgency of Robin Hood’s mission; the data shows that a staggering 50 percent of adults in New York City experienced poverty at some point over a four-year period.
Ron’s story, which is profiled in the report, highlights how common life events like medical hardships or having a child can increase the likelihood of falling into poverty or hardship and can have a lasting impact on multiple generations. The findings detailed in the report illustrate that it is far too easy for families across New York City to fall into poverty, and far too difficult for people to escape it.
Amid the sober findings of this report, there are also sources of hope. We see how educational attainment can protect someone from falling into poverty even after a life-altering event like having a child or ending a relationship. We see how the odds of falling back into poverty are diminished the longer someone is able to stay out of poverty, and we see that government programs, like housing subsidies and tax credits, are reducing poverty in New York City.
By closely examining this powerful data, we can better understand the problems we are fighting to address — and we can come together to arrive at answers that are matched to this critical moment.
Elevate,
Wes MooreCEO, Robin Hood
POVERTY TRACKER ANNUAL REPORT 3
THIS REPORT INCLUDES FIVE INDIVIDUAL SECTIONS:
IN SECTIONS 1, 2, AND 3, WE FOCUS ON THREE TYPES OF DISADVANTAGE: INCOME
POVERTY, MATERIAL HARDSHIP, AND HEALTH PROBLEMS. WE PRESENT TRENDS SINCE
2012 FOR EACH TYPE OF DISADVANTAGE AND ALSO ANALYZE WHICH NEW YORKERS ARE
MOST LIKELY TO EXPERIENCE THESE FORMS OF DISADVANTAGE.
IN SECTION 4, WE ANALYZE DISADVANTAGE TRENDS AND FIND THAT HALF OF NEW
YORKERS EXPERIENCE AT LEAST ONE FORM OF DISADVANTAGE IN ANY GIVEN YEAR.
IN SECTION 5, WE HARNESS THE POVERTY TRACKER’S LONGITUDINAL DATA AND IDENTIFY
THE LIFE EVENTS THAT ARE ASSOCIATED WITH AN INCREASED LIKELIHOOD OF FALLING
INTO POVERTY AND EXPERIENCING MATERIAL HARDSHIP.
A GUIDE TO THIS REPORTTHIS REPORT RELIES ON DATA COLLECTED BETWEEN 2012 AND 2018.

POVERTY TRACKER ANNUAL REPORT 1
TABLE OF CONTENTS
INTRODUCTION AND KEY FINDINGS 3
POVERTY TRACKER MEASURES 7
SECTION 1: INCOME POVERTY IN NEW YORK CITY 9
SECTION 2: MATERIAL HARDSHIP IN NEW YORK CITY 19
SECTION 3: HEALTH IN NEW YORK CITY 26
SECTION 4: DISADVANTAGE IN NEW YORK CITY 30
SECTION 5: FALLING INTO POVERTY AND MATERIAL HARDSHIP 34
APPENDIX A. POVERTY THRESHOLDS AND POVERTY RATES 46 UNDER THE SUPPLEMENTAL POVERTY MEASURE AND THE OFFICIAL POVERTY MEASURE – 2018
APPENDIX B. RATES OF DISADVANTAGE WITHIN SUBGROUPS 48
APPENDIX C. KESSLER-6 MENTAL DISTRESS SCALE 55

INTRODUCTION AND KEY FINDINGS

POVERTY TRACKER ANNUAL REPORT 3
In 2018, 8.4 million people lived in New York City; our public schools served 940,000 meals
each school day; there were more than 40 million 311 calls; the minimum wage reached
$13 per hour; all New York State residents were covered by comprehensive paid family
leave legislation; and each month, an average of 1.6 million people used SNAP benefits to
help put food on the table. Over the past year, the Poverty Tracker checked in with house-
holds every three months to see how they were doing and to assess poverty and other
forms of disadvantage faced by New Yorkers. Our second annual Poverty Tracker report
focuses on life in New York City in 2018 and explores trends in poverty and disadvantage
between 2012 and 2018. In this report, we also analyze events that are associated with
pushing families into poverty and material hardship, as well as the factors that can
mitigate the impacts of these events.
To better understand how poverty impacts the lives of the youngest New Yorkers, we have
recently launched the Early Child Poverty Tracker (ECPT), a study similar to the Poverty
Tracker that focuses on families with young children.

POVERTY TRACKER ANNUAL REPORT 4
BUT THE ANNUAL INCOME POVERTY RATE DOES NOT TELL THE FULL STORY, POVERTY AND DISADVANTAGE ARE PERVASIVE ACROSS THE CITY.
K E Y F I N D I N G S
In 2018, ONE IN FIVE adults in New York City lived in poverty* compared to roughly ONE IN FOUR in 2012. People of color and women in New York City were disproportionately likely to be living in poverty.
Government programs helped many families in poverty in 2018. HOUSING SUBSIDIES and rent regulations reduced the poverty rate by 5 percentage points.
CASH TRANSFERS and TAX CREDITS reduced the poverty rate by up to 4 percentage points.
*Meaning single adults earned less than $17,000 and an adult with two children earned less than $30,000.
THE POVERTY RATE IN NEW YORK CITY HAS CONTINUED TO FALL SINCE 2012, BUT IT REMAINS ROUGHLY EIGHT PERCENTAGE POINTS HIGHER
THAN THE NATIONAL POVERTY RATE.
2018 2012
Between 2015 and 2018, HALF OF NEW YORK CITY ADULTS lived in poverty in at least one of those four years.
15%
50%
45%
30%DATA 04 DATA 01
DATA 02
DATA 03
New York City adults
50%IN POVERTY
4 years
5 percentage points 4 percentage points

POVERTY TRACKER ANNUAL REPORT 5
COMMON LIFE EVENTS, LIKE ENDING A RELATIONSHIP, LOSING A JOB, OR HAVING A CHILD, ARE ASSOCIATED WITH AN INCREASED LIKELIHOOD OF FALLING INTO POVERTY AND HARDSHIP, ESPECIALLY FOR NEW YORKERS
WITH FEW ASSETS AND LOWER LEVELS OF FORMAL EDUCATION.
Over a four-year period, 53 PERCENT of adults experienced material hardship in at least one year.
In 2018, 34 PERCENT of households with children experienced material hardships because they could not afford basic necessities like housing, heat, food, and medical care.
Although rates of hardship have fallen since 2012, the share of New Yorkers who have health problems has remained the same, at about 23 percent.
HAVING ASSETS OR A COLLEGE DEGREE is associated with reducing the risk of falling into poverty after having a child, losing a job, ending a relationship, or incurring an unexpected expense.
Every year between 2012 and 2018, roughly 14 PERCENT of adults fell into poverty and 16 PERCENT entered a period of material hardship.
New Yorkers with a high school degree or less are nearly five times as likely to fall into poverty after HAVING A CHILD than New Yorkers with a bachelor’s degree.
34%
53%
14% 16%
Poverty Material Hardship
X 5
POVERTY TRACKER ANNUAL REPORT 6
15%
50%
45%
30%DATA 04DATA 01
DATA 02
DATA 03
POVERTY TRACKER MEASURES

POVERTY TRACKER ANNUAL REPORT 7
Launched in 2012, the Poverty Tracker surveys a representative sample of New Yorkers every three months, providing critical information on the dynamics of poverty and other forms of disadvantage in the city. Unlike other surveys, the Poverty Tracker explores how New Yorkers experience poverty and hardship over time, rather than in a single day, month, or year. The Poverty Tracker follows the same households every three months by contacting an adult in each household via online, phone, and paper surveys, allowing us to build a better understanding of New Yorkers’ actual lives. In addition, the Poverty Tracker focuses on more than just income poverty; we also collect data on other core measures of disadvantage, material hardships and health problems. We use these alternative measures to understand how certain disadvantages, or multiple, overlapping disadvantages, make it harder for New Yorkers to survive. The Poverty Tracker also collects data on other aspects related to New Yorkers’ well-being, from asset and debt accumulation to social service program utilization to spending and consumption patterns, to form a better understanding of how New Yorkers make decisions about their own lives.
INCOME POVERTY MATERIAL HARDSHIPS
HEALTH PROBLEMS DISADVANTAGE (INCOME POVERTY OR MATERIAL HARDSHIPS
OR HEALTH PROBLEMS)

15%
50%
45%
30%
DAT
A 04
DAT
A 01
DAT
A 02
DAT
A 03
HIGHLIGHTS
SECTION 1
INCOME POVERTY IN NEW YORK CITY
The 2018 results show that the adult poverty rate in New York City has fallen since 2012, but it remains roughly eight percentage points higher than the national poverty rate.
In New York City, one in five adults (roughly 1.4 million people) AND one in five households with children lived in poverty during 2018.
The annual income poverty rate does not tell the full story — poverty and disadvantage are pervasive across the city.
Government programs helped many families in poverty in 2018. Housing subsidies and rent regulations reduced the poverty rate by five percentage points. Cash transfers and tax credits each reduced the poverty rate by between three and four percentage points.
Fifty percent of adult New Yorkers (3.4 million people) lived below the poverty line in at least one of the four years examined.

POVERTY TRACKER ANNUAL REPORT 9
While Census data provide annual statistics on poverty in the city using the Official Poverty Measure (OPM), the Poverty Tracker collects data that allow us to analyze a more comprehensive measure of income poverty, the Supplemental Poverty Measure (SPM). The SPM defines income more broadly than the official measure, capturing resources that come to families through the tax system or in the form of near-cash benefits like food stamps or housing assistance. The SPM for New York City also uses a higher poverty line than other official statistics, recognizing that New Yorkers face higher costs of living than people do in other places across the country. Lastly, the SPM captures important expenses faced by many families, such as medical and child care costs, which official statistics ignore. See the accompanying text box for a more extended description of the SPM.
The Supplemental Poverty Measure (SPM)Every September, the U.S. government releases the latest results on national poverty using the Official Poverty Measure (OPM). The OPM was developed in the 1960s and compared families’ total before-tax cash income with a poverty line, or threshold. The threshold was defined as three times the cost of a minimally adequate food budget during that time. With the exception of some minor adjustments, this measure has only been updated annually to account for changes in inflation.
But over time, this formula has become increasingly outdated. Food costs have become less important in family budgets, while things like housing and child care have become costlier. A focus on before-tax cash income ignores benefits that many families receive through the tax system, such as the Earned Income Tax Credit, or in non-cash form, such as food stamps or housing vouchers. Importantly, the poverty threshold under the OPM does not vary with costs of living, particularly housing costs, which are notoriously high in New York City.
The SPM improves the measurement of poverty on all of these fronts. The poverty threshold is based on contemporary spending on food, as well as on other necessities like clothing, shelter, and utilities. The poverty threshold in places like New York City is also higher given its higher than average housing costs, and the threshold is different for renters and homeowners. In 2018, the SPM threshold for a two-adult, two-child family of renters in New York City was $35,730 (see Appendix A for the poverty threshold by family size). In the SPM, tax credits and non-cash benefits are also counted as income, and for families who incur them, medical, work, and child care costs are subtracted from income. The Poverty Tracker collects all the requisite data necessary to directly calculate the SPM in its sample of New Yorkers, and this data forms the basis of our income poverty statistics.
The Poverty Tracker measures poverty in New York City using the Supplemental Poverty Measure (discussed above). The New York City government also tracks trends in the city’s poverty rate using the NYCgov Poverty Measure. There are slight differences between the construction of the SPM and the NYCgov Poverty Measure, thus they produce slightly different annual poverty rates. The differences between the NYCgov Poverty Measure and the SPM are discussed in the NYCgov Poverty Measure annual report.

POVERTY TRACKER ANNUAL REPORT 10
0%
10%
20%
30%
40%
50%
2012 2013 2014 2015 2016 2017 2018
Pov
erty
Rat
e
24% 24%
21%22% 21% 21% 20%
16%
12%
21% 20% 20%18%
17% 17%
15% 15% 15% 14% 14% 13%
Trends in Poverty for New York City between 2012 and 20181
Figure 1
1 In our inaugural report, we used a more generous estimate of the value of housing subsidies when calculating the poverty rate than is used by the Census Bureau when measuring the SPM. To further align our methodology with the Census Bureau’s, we adjusted our valuation of housing subsidies to match theirs, resulting in changes to our poverty estimates for 2012 - 2017. In addition, the 2017 poverty rate is based on the data underlying our last report as well as data from our refresh sample drawn in 2017.
Poverty Rate in Largest Metropolitan Areas in the U.S.Adult Poverty in New York City
National Poverty Rate
Poverty Rate Poverty Rate for New York City Households with Children
Source: Annual Poverty Tracker survey data, 2012 to 2018.
The 2018 results show that the adult poverty rate in New York City has fallen since 2012, but it remains roughly eight percentage points higher than the national poverty rate.
Figure 1 shows trends in the adult poverty rate in the city using the SPM. For comparison, we also show the
national adult SPM poverty rate for the U.S., as well as the SPM poverty rate in other large cities (defined
as the top 25 non-New York central cities in the Current Population Survey — the national household survey
used to calculate the SPM). A comparison of the New York City poverty rate measured using the SPM versus
the Official Poverty Measure (OPM) can be found in Appendix A2.
As with any estimates based on a sample of a population, annual estimates from the Poverty Tracker have
a margin of error which is shaded in Figure 1. This margin is roughly ± 2 percentage points, so we estimate
that the poverty rate in 2018 was between 18 and 22 percent, or was 20 percent ± 2 percent. Note that a
similar margin of error surrounds all of the annual estimates in this report.
20%
Pov
erty
Rat
e

POVERTY TRACKER ANNUAL REPORT 11
Distribution of Income Relative to the Poverty Line - 2018
Table 1
Table 1 shows the full distribution of income relative to the poverty line in 2018. We see that 500,000 adult
New Yorkers lived in “deep poverty,” or below 50 percent of the poverty threshold, and 2.1 million adults
lived “near poverty” (between 101 and 200 percent of the poverty threshold). Overall, half of New York City
adults lived below 200 percent of the poverty threshold. For a two-adult, one-child family of renters, 50
percent of the 2018 poverty threshold amounted to $15,724 and 200 percent amounted to $62,898. (See
Appendix A for the poverty threshold by family size).
INCOME RELATIVE TO THE POVERTY LINE
PROPORTION OF ADULT POPULATION NUMBER OF ADULTS
UP TO 50%
51% > 100%
101% > 200%
201% > 300%
301% > 400%
401% +
7%
13%
30%
18%
13%
19%
% # 500,000
900,000
2,100,000
1,200,000
900,000
1,300,000
In New York City, one in five adults (roughly 1.4 million people) AND one in
five households with children lived in poverty during 2018.

POVERTY TRACKER ANNUAL REPORT 12
21%
22%
16%QUEENS
BROOKLYN
MANHATTAN
26%BRONX
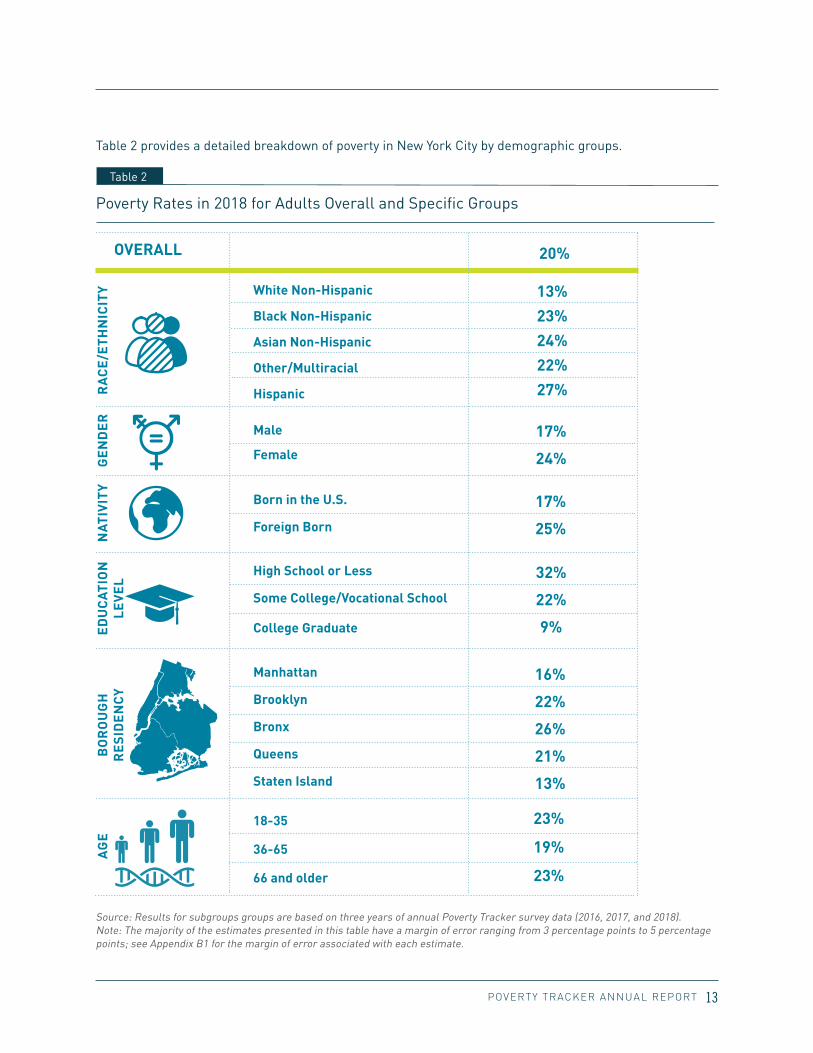
Relative to White, non-Hispanic New Yorkers, POVERTY RATES WERE SIGNIFICANTLY HIGHER for all
other racial and ethnic groups; Hispanic adults were more than twice as likely as White non-Hispanic adults
to be living in poverty.
Residents of Manhattan were less likely to live in poverty (16%) than residents of the Bronx (26%), Brooklyn (22%), and Queens (21%).
A PORTRAIT OF POVERTY IN NEW YORK CITY IN 2018
Women were SEVEN PERCENTAGE POINTS more likely to be living in poverty than men.
New Yorkers with a high school degree or less faced significantly higher poverty
rates than those with a college degree (32 PERCENT VS. 9 PERCENT).
New Yorkers who were BORN IN ANOTHER COUNTRY were more likely to live below the
poverty line than those born in the U.S. (25 PERCENT VS. 17 PERCENT).
24%17%
POVERTY TRACKER ANNUAL REPORT 13
Poverty Rates in 2018 for Adults Overall and Specific Groups
Table 2
GE
ND
ER
RA
CE
/ETH
NIC
ITY
NAT
IVIT
YA
GE
BO
RO
UG
H
RE
SID
EN
CY
ED
UC
ATIO
N
LEVE
L
White Non-Hispanic
Black Non-Hispanic
Asian Non-Hispanic
Other/Multiracial
Hispanic
13%
23%
24%
22%
27%
17%
24%
17%
25%
32%
22%
9%
16%
22%
26%
21%
13%
23%
19%
23%
Male
Female
Born in the U.S.
Foreign Born
High School or Less
Some College/Vocational School
College Graduate
Manhattan
Brooklyn
Bronx
Queens
Staten Island
18-35
36-65
66 and older
OVERALL 20%
Table 2 provides a detailed breakdown of poverty in New York City by demographic groups.
Source: Results for subgroups groups are based on three years of annual Poverty Tracker survey data (2016, 2017, and 2018).Note: The majority of the estimates presented in this table have a margin of error ranging from 3 percentage points to 5 percentage points; see Appendix B1 for the margin of error associated with each estimate.
POVERTY TRACKER ANNUAL REPORT 14
As mentioned earlier, the SPM is a more comprehensive measure of income poverty than the OPM.
Because the SPM includes tax credits and in-kind benefits, we are able to see how these different sources
of income reduce the poverty rate.
In Figure 2, we report what the poverty rate would be if New Yorkers did not receive income from (1) tax
credits, (2) food and nutrition programs, (3) cash transfers, and (4) housing subsidies. We find that housing
subsidies — which include rent regulations — are associated with the most substantial decrease in the pov-
erty rate — reducing poverty by approximately five percentage points (from 25 percent to 20 percent). This
finding demonstrates the power of housing subsidies and the need to make them more broadly available.
Programs like SNAP are available to everyone who is eligible for them; the poverty rate would be reduced
further if more New Yorkers who were eligible for housing subsidies actually received them. We also see
that the other in-kind benefits and tax credits reduce the poverty rate, underscoring the importance of
these income sources.
Government programs helped many families in poverty in 2018. Housing subsidies and rent regulations2 reduced the poverty rate by five percentage points. Cash transfers and tax credits each reduced the poverty rate by between three and four percentage points.
2We use the term “rent regulations” when referencing rent control and rent stabilization.

POVERTY TRACKER ANNUAL REPORT 15
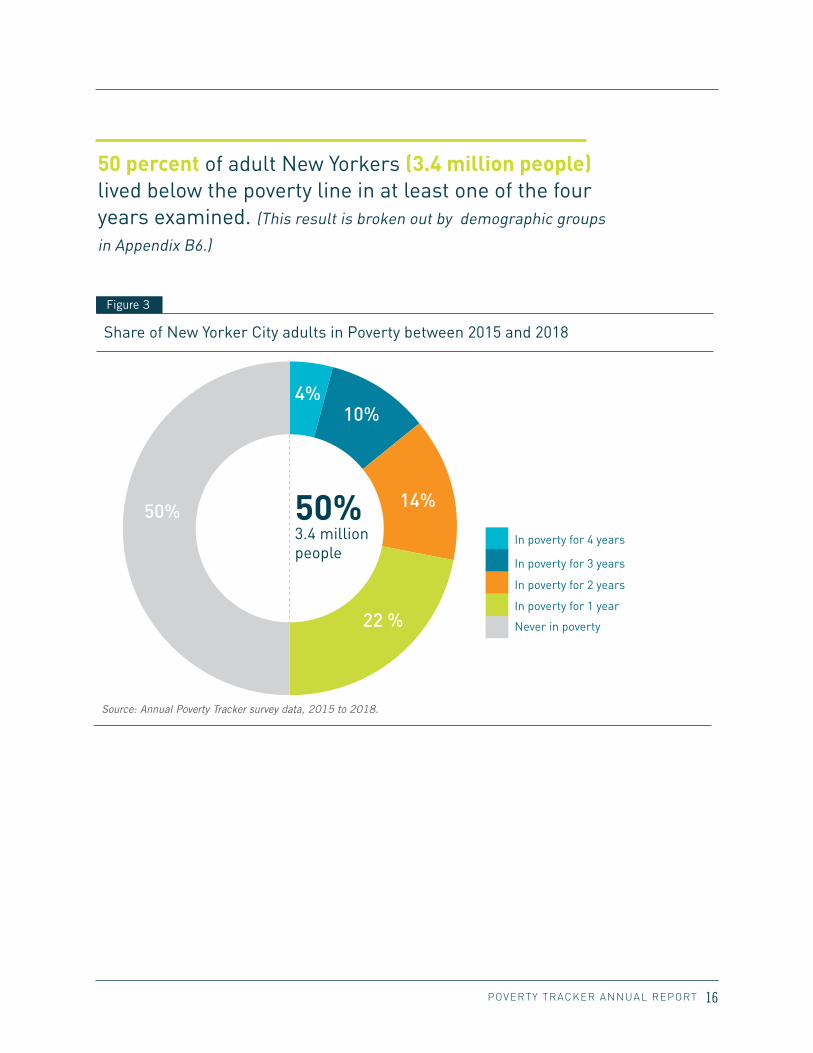
The Poverty Tracker is unique in its ability to look at poverty across the four years that households remain in
our survey (see Figure 3). With this wider lens, we see that the share of New Yorkers who have lived below
the poverty line at some point in those four years is much higher than is observed in a single year.
These results reinforce the fact that a single-year snapshot of the poverty rate fails to capture the millions
of New Yorkers who are economically vulnerable and struggle to cover basic needs at some point.
Poverty Rate
20%
Poverty Rate withoutTax Credits
Poverty Rate withoutNutrition Programs
Poverty Rate withoutCash Transfers
Poverty Rate withoutHousing Subsidies
Pov
erty
Rat
e
0%
5%
10%
15%
20%
25%
Housing subsidies are associated with the most substantial decrease in the poverty rate – from 25 percent to 20 percent.
23% 23%24%
25%
TAX CREDITS: Earned Income Tax Credit, Child Tax CreditNUTRITION PROGRAMS: SNAP, WIC, School LunchesCASH TRANSFERS: Disability, Unemployment, Temporary Assistance to Needy Families (TANF) HOUSING SUBSIDIES: Government Housing Assistance and Rent Regulations (Rent Control and Rent
Stabilization)
Adult Poverty Rates without Taxes and Transfers — 2018
Figure 2
Source: Annual Poverty Tracker survey data, 2018.
Pov
erty
Rat
e
The annual income poverty rate does not tell the full story — poverty and disadvantage
are pervasive across the city.
POVERTY TRACKER ANNUAL REPORT 16
Share of New Yorker City adults in Poverty between 2015 and 2018
Figure 3
4%10%
14%
22 %
50%In poverty for 4 years
In poverty for 3 years
In poverty for 2 years
In poverty for 1 year
Never in poverty
50% 3.4 million people
Source: Annual Poverty Tracker survey data, 2015 to 2018.
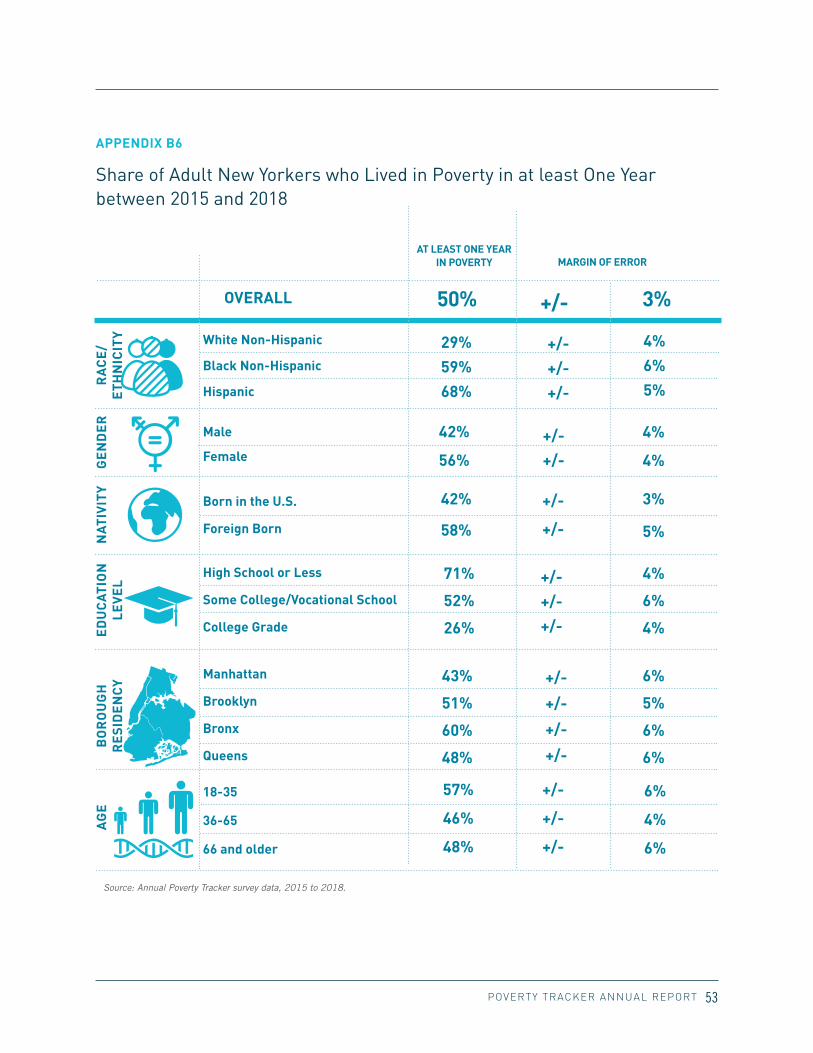
50 percent of adult New Yorkers (3.4 million people) lived below the poverty line in at least one of the four years examined. (This result is broken out by demographic groups
in Appendix B6.)

POVERTY TRACKER ANNUAL REPORT 17
Thirty-five percent of adult New Yorkers who exit poverty fall back into poverty the following year. However,
New Yorkers who are able to stay above the poverty line for two years are much less likely to fall back into
poverty. Twenty percent of adult New Yorkers who live above the poverty line for two years will fall back into
poverty in the following year. These findings underscore the importance of Robin Hood’s mission of moving
households sustainably out of poverty (see Figure 4).
The longer New Yorkers stay out of poverty, the less likely they are to fall back into poverty.
Likelihood of Falling Back into Poverty After Moving Out of Poverty
Figure 4
Sustained exits from poverty are unfortunately the exception and not the rule. We find that only a third of the
adults in poverty exit poverty for two of the following consecutive years.
Source: Annual Poverty Tracker survey data, 2015 to 2018.

POVERTY TRACKER ANNUAL REPORT 18
MATERIAL HARDSHIP IN NEW YORK CITY
HIGHLIGHTS
SECTION 2
Thirty-four percent of households with children experienced material hardships because they could not afford basic necessities like housing, heat, food, and medical care.
Between 2015 and 2018, 53 percent of adults in New York City experienced material hardship for at least one year.
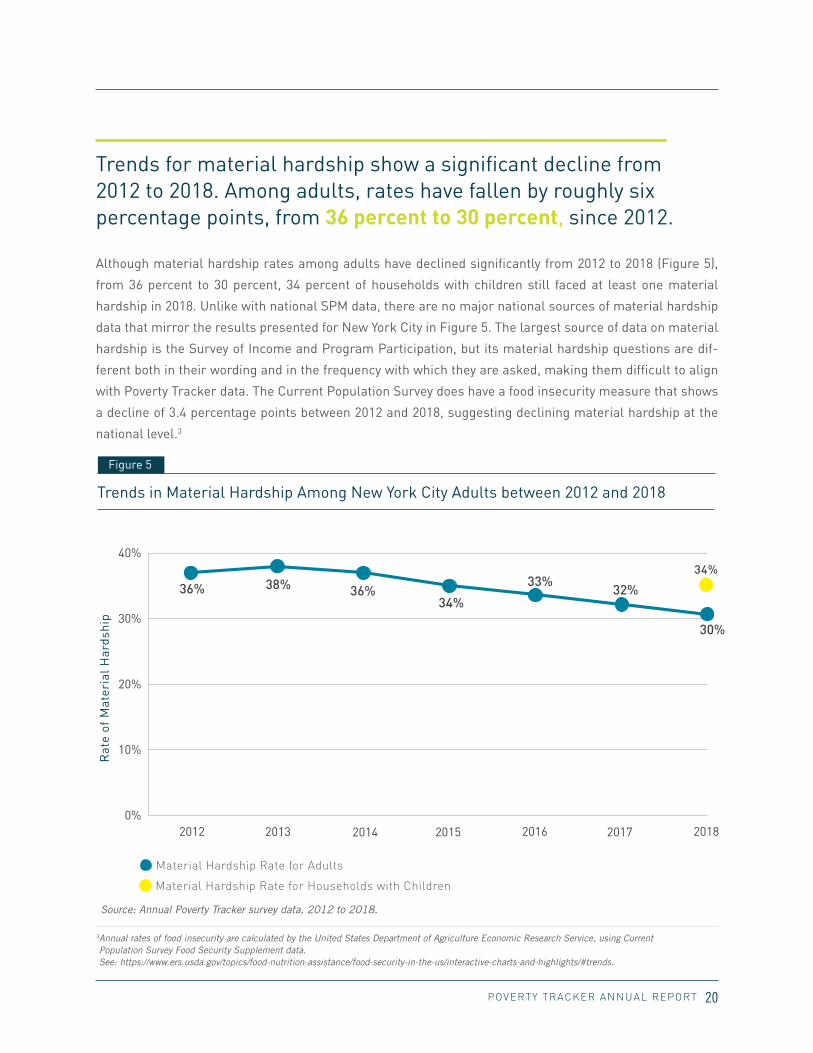
Trends for material hardship show a significant decline from 2012 to 2018. Among adults, rates have fallen by roughly six percentage points, from 36 percent to 30 percent, since 2012.
POVERTY TRACKER ANNUAL REPORT 19
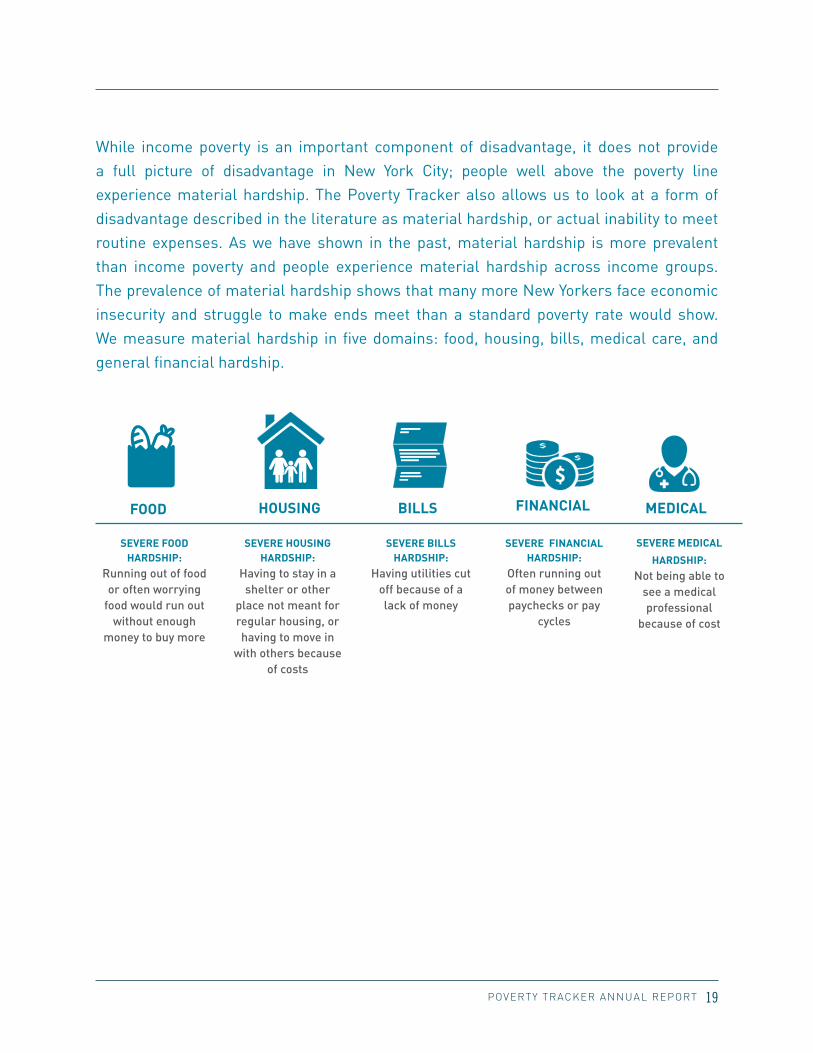
SEVERE FOOD HARDSHIP:
Running out of food or often worrying
food would run out without enough
money to buy more
SEVERE HOUSING HARDSHIP:
Having to stay in a shelter or other
place not meant for regular housing, or having to move in
with others because of costs
SEVERE BILLS HARDSHIP:
Having utilities cut off because of a lack of money
SEVERE FINANCIAL HARDSHIP:
Often running out of money between paychecks or pay
cycles
SEVERE MEDICAL
HARDSHIP: Not being able to
see a medical professional
because of cost
While income poverty is an important component of disadvantage, it does not provide a full picture of disadvantage in New York City; people well above the poverty line experience material hardship. The Poverty Tracker also allows us to look at a form of disadvantage described in the literature as material hardship, or actual inability to meet routine expenses. As we have shown in the past, material hardship is more prevalent than income poverty and people experience material hardship across income groups. The prevalence of material hardship shows that many more New Yorkers face economic insecurity and struggle to make ends meet than a standard poverty rate would show. We measure material hardship in five domains: food, housing, bills, medical care, and general financial hardship.
FOOD BILLS FINANCIALHOUSING MEDICAL
POVERTY TRACKER ANNUAL REPORT 20
0%
10%
20%
30%
40%
2012 2013 2014 2015 2016 2017 2018
Rat
e of
Mat
eria
l H
ards
hip
36% 38%34%
36%33%
32%
30%
Trends in Material Hardship Among New York City Adults between 2012 and 2018
Figure 5
Material Hardship Rate for Households with Children
Material Hardship Rate for Adults
34%
Although material hardship rates among adults have declined significantly from 2012 to 2018 (Figure 5),
from 36 percent to 30 percent, 34 percent of households with children still faced at least one material
hardship in 2018. Unlike with national SPM data, there are no major national sources of material hardship
data that mirror the results presented for New York City in Figure 5. The largest source of data on material
hardship is the Survey of Income and Program Participation, but its material hardship questions are dif-
ferent both in their wording and in the frequency with which they are asked, making them difficult to align
with Poverty Tracker data. The Current Population Survey does have a food insecurity measure that shows
a decline of 3.4 percentage points between 2012 and 2018, suggesting declining material hardship at the
national level.3
Trends for material hardship show a significant decline from 2012 to 2018. Among adults, rates have fallen by roughly six percentage points, from 36 percent to 30 percent, since 2012.
3 Annual rates of food insecurity are calculated by the United States Department of Agriculture Economic Research Service, using Current Population Survey Food Security Supplement data. See: https://www.ers.usda.gov/topics/food-nutrition-assistance/food-security-in-the-us/interactive-charts-and-highlights/#trends.
Source: Annual Poverty Tracker survey data, 2012 to 2018.

POVERTY TRACKER ANNUAL REPORT 21
Hardship Rates for New York City Adults Overall and by Specific Groups
Table 3
Table 3 provides hardship rates among adults in New York City in 2018. The disparities between groups
largely mirror those found when examining poverty rates.
Source: Results for subgroups groups are based on three years of annual Poverty Tracker survey data (2016, 2017, and 2018). Note: The majority of the estimates presented in this table have a margin of error ranging from 3 percentage points to 5 percentage points; see Appendix B2 for the margin of error associated with each estimate.
GE
ND
ER
RA
CE
/ETH
NIC
ITY
NAT
IVIT
YA
GE
BO
RO
UG
H
RE
SID
EN
CY
ED
UC
ATIO
N
LEVE
L
White Non-Hispanic
Black Non-Hispanic
Asian Non-Hispanic
Other/Multiracial
Hispanic
19%
39%
28%
40%
43%
26%
36%
30%
33%
38%
35%
23%
29%
32%
39%
29%
27%
37%
32%
20%
Male
Female
Born in the U.S.
Foreign Born
High School or Less
Some College/Vocational School
College Graduate
Manhattan
Brooklyn
Bronx
Queens
Staten Island
18-35
36-65
66 and older
OVERALL 30%

POVERTY TRACKER ANNUAL REPORT 22
In hardship for 4 years
In hardship for 3 years
In hardship for 2 years
In hardship for 1 year
Never in hardship
14%
13%
10%
16 %
47% 53% 3.4 million people
As discussed earlier, the Poverty Tracker allows us to examine the experience of New Yorkers across four
years. As was the case with poverty, we see that the share of New Yorkers who have experienced some form
of material hardship over a four-year period is much higher than is observed in a single year, or even over
two years.
Twenty-seven percent of New York City adults experienced material hardship for at least three of the four
years examined. While the rates of material hardship and poverty experienced in at least one year are
similar — 53 percent vs. 50 percent — the rate of those experiencing hardship across all four years is nota-
bly higher than the rate of those experiencing poverty across all four years — 14 percent vs. 4 percent. This
suggests that New Yorkers are more likely to move out of poverty than hardship, meaning that even mobility
out of poverty is not enough to safeguard against economic insecurity and hardship.
Share of New York City Adults Who Experienced Material Hardship between 2015 and 2018
Figure 6
Between 2015 and 2018, 53 percent of adults in New York City experienced material hardship for at least one year.
Source: Annual Poverty Tracker survey data, 2015 to 2018.

POVERTY TRACKER ANNUAL REPORT 23
Later in this report, we delve deeper into the factors associated with falling into poverty and periods of
hardship.
New Yorkers across all income levels experience hardship, not just those who earn the least. Figure 7 shows
hardship rates by family income relative to each family’s needs (income-to-needs ratio). We determine
income-to-needs by dividing a family’s resources (used to assess their poverty status) by their poverty thresh-
old. Families with an income-to-needs ratio below 1 (or 100 percent) are in poverty, while those between 1.01
and 2 have an income between 101 percent and 200 percent of the poverty threshold, and so on.
In 2018, more than 40 percent of New Yorkers in poverty experienced material hardship, and material hard-
ship was still quite prevalent among those between 100 and 150 percent of the poverty line (43 percent).
Substantial declines in hardship began when incomes were above 250 percent of the poverty line, but even
those well above the poverty line exhibited some level of hardship. For example, 11 percent of New York
City adults with incomes more than four times the poverty line reported experiencing material hardship,
showing that economic insecurity is not limited to those New Yorkers in poverty.
Rates of Material Hardship for New York City Adults by Income-to-Needs (SPM) – 2018
Figure 7Under 55%
0%
10%
20%
30%
40%
50%
60%
70%
Figure 7. Rate of Health Problems by Income to Needs (SPM)
40%
48%
43%
33%37%
21%
15%11% 11%
Rat
e of
Mat
eria
l Har
dshi
p
Under 50%
50% to 100%
100% to 150%
400%+150% to 200%
200% to 250%
250% to 300%
300% to 350%
350% to 400%
Under 50%
50%-100%
100%-150%
250%-300%
150%-200%
200%-250%
300%-350%
350%-400%
400%+
Income-to-NeedsSource: Annual Poverty Tracker survey data, 2018.

POVERTY TRACKER ANNUAL REPORT 24
The Poverty Tracker also explores individual types of hardship. In Figure 8, we show the hardship rates
for each individual category of hardship by poverty status. Those in poverty, as well as those between 100
percent and 200 percent of the poverty line, had elevated levels of each type of material hardship relative to
those living above 200 percent of the poverty line.
Rates of Hardship by Category for New York City Adults across Income Groups – 2018
Figure 8
Pre
vale
nce
of M
ater
ial H
ards
hip
17%
10%9%
6%3%
14%
21%
16%
25%
21%
10%
4% 5%
10%
4%
0%
5%
10%
15%
20%
25%
50%-100%
Under 50%
100%-150%
250%-30 0%
150%-200%
200%-250%
300%-350%
350%-400%
400%+
Financial HardshipFood Hardship Bills HardshipHousing Hardship Medical Hardship
In Poverty 100% to 200% of Poverty Line 200% + Poverty Line
Source: Annual Poverty Tracker survey data, 2018.
Rat
e of
Mat
eria
l Har
dshi
p
HEALTH IN NEW YORK CITY
SECTION 3
Compared to rates of poverty and hardship, the percentage of New York City adults with health problems remains persistently high from 2012 (21 percent) to 2018 (23 percent).
HIGHLIGHTS
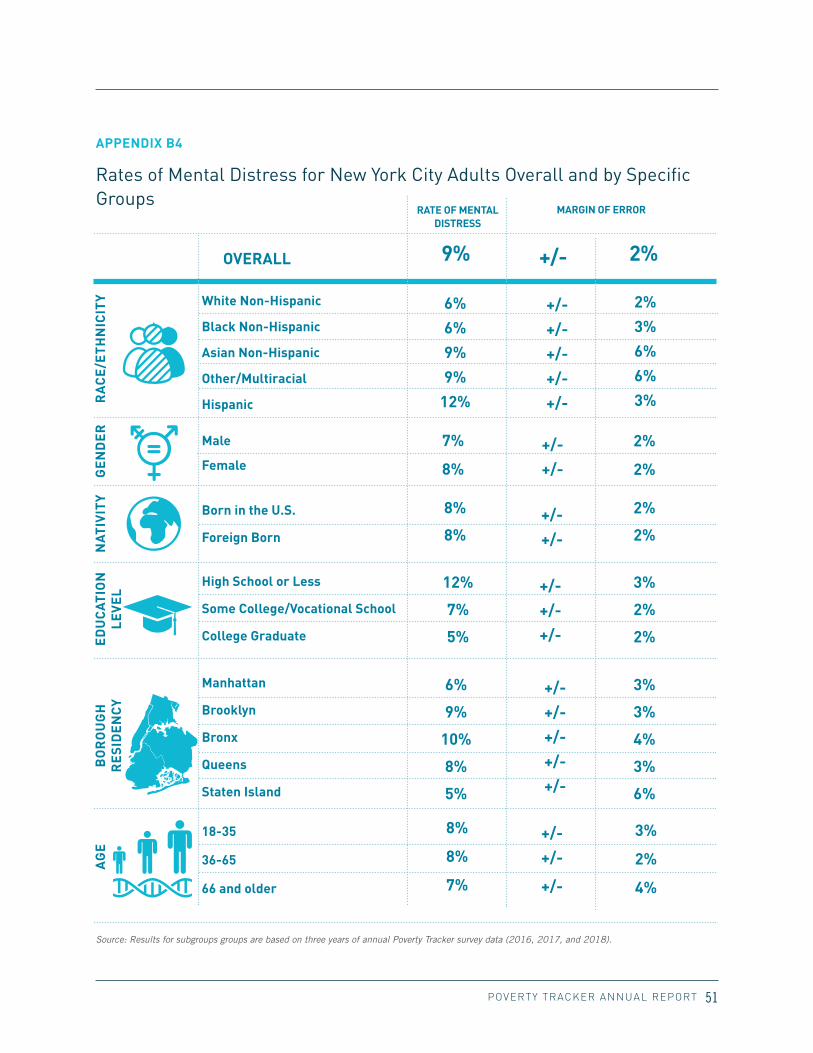
Nine percent of adults in New York City experienced some form of mental distress in 2018.
POVERTY TRACKER ANNUAL REPORT 26
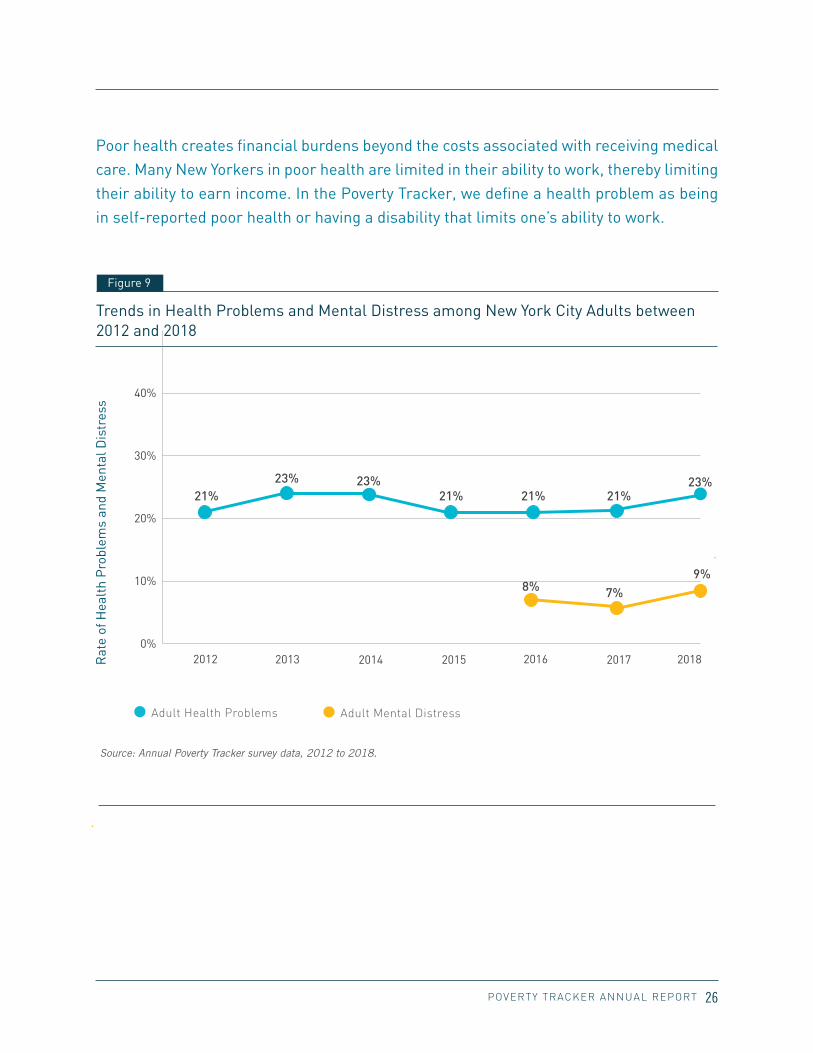
Poor health creates financial burdens beyond the costs associated with receiving medical care. Many New Yorkers in poor health are limited in their ability to work, thereby limiting their ability to earn income. In the Poverty Tracker, we define a health problem as being in self-reported poor health or having a disability that limits one’s ability to work.
Trends in Health Problems and Mental Distress among New York City Adults between 2012 and 2018
Figure 9
0%
10%
20%
30%
40%
50%
2012 2013 2014 2015 2016 2017 2018
Adult Health Problems
Pre
vale
nce
of H
ealt
h P
robl
ems
21%23%
21%23%
21%
8% 7%9%
21%23%
Source: Annual Poverty Tracker survey data, 2012 to 2018.
Adult Health Problems Adult Mental Distress
Rat
e of
Hea
lth
Pro
blem
s an
d M
enta
l Dis
tres
s
POVERTY TRACKER ANNUAL REPORT 27
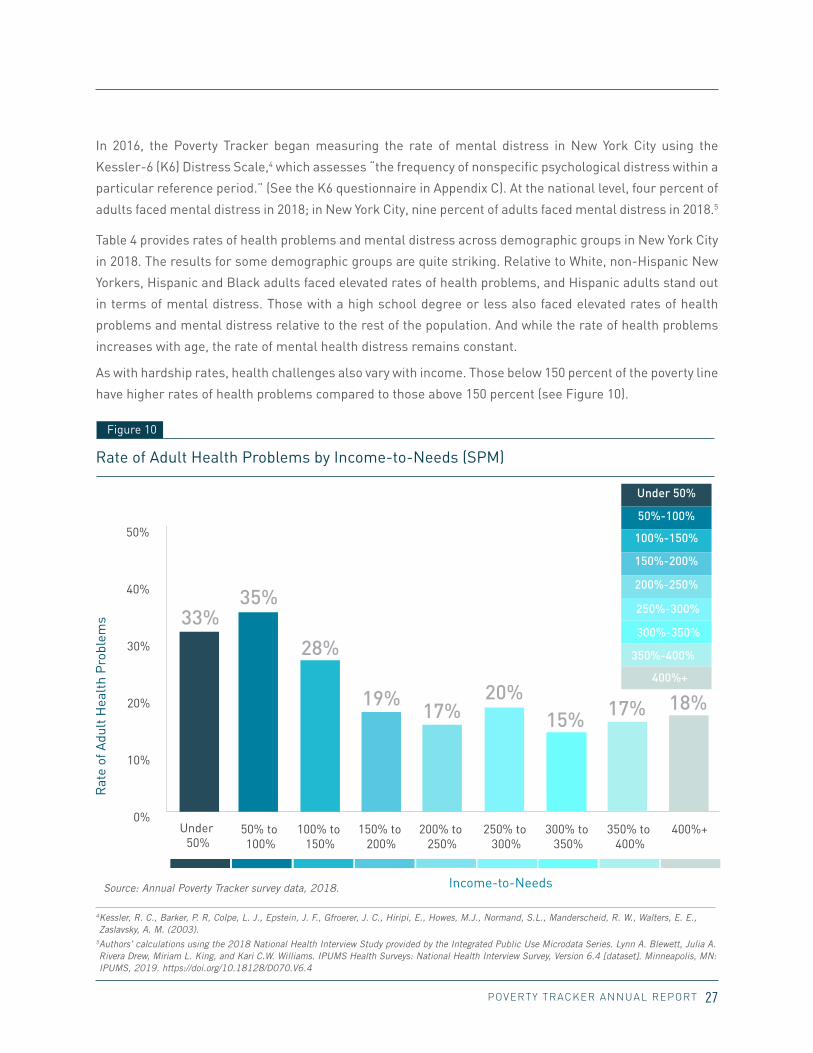
In 2016, the Poverty Tracker began measuring the rate of mental distress in New York City using the
Kessler-6 (K6) Distress Scale,4 which assesses “the frequency of nonspecific psychological distress within a
particular reference period.” (See the K6 questionnaire in Appendix C). At the national level, four percent of
adults faced mental distress in 2018; in New York City, nine percent of adults faced mental distress in 2018.5
Table 4 provides rates of health problems and mental distress across demographic groups in New York City
in 2018. The results for some demographic groups are quite striking. Relative to White, non-Hispanic New
Yorkers, Hispanic and Black adults faced elevated rates of health problems, and Hispanic adults stand out
in terms of mental distress. Those with a high school degree or less also faced elevated rates of health
problems and mental distress relative to the rest of the population. And while the rate of health problems
increases with age, the rate of mental health distress remains constant.
Rate of Adult Health Problems by Income-to-Needs (SPM)
Figure 10
As with hardship rates, health challenges also vary with income. Those below 150 percent of the poverty line
have higher rates of health problems compared to those above 150 percent (see Figure 10).
4 Kessler, R. C., Barker, P. R, Colpe, L. J., Epstein, J. F., Gfroerer, J. C., Hiripi, E., Howes, M.J., Normand, S.L., Manderscheid, R. W., Walters, E. E., Zaslavsky, A. M. (2003).
5 Authors’ calculations using the 2018 National Health Interview Study provided by the Integrated Public Use Microdata Series. Lynn A. Blewett, Julia A. Rivera Drew, Miriam L. King, and Kari C.W. Williams. IPUMS Health Surveys: National Health Interview Survey, Version 6.4 [dataset]. Minneapolis, MN: IPUMS, 2019. https://doi.org/10.18128/D070.V6.4
Under 50%
50%-100%
100%-150%
250%-300%
150%-200%
200%-250%
300%-350%
350%-400%
400%+
Source: Annual Poverty Tracker survey data, 2018. Income-to-Needs
Rat
e of
Adu
lt H
ealt
h P
robl
ems

POVERTY TRACKER ANNUAL REPORT 28
GE
ND
ER
RA
CE
/ETH
NIC
ITY
2018: HEALTH PROBLEMS
2018: MENTAL DISTRESS
NAT
IVIT
YA
GE
BO
RO
UG
H
RE
SID
EN
CY
ED
UC
ATIO
N
LEVE
L
White Non-Hispanic
Black Non-Hispanic
Asian Non-Hispanic
Other/Multiracial
Hispanic
18%
25%
16%
23%
26%
20%
23%
7%
8%
8%
8%
12%
7%
5%
6%
9%
10%
8%
5%
8%
8%
7%
24%
19%
32%
21%
12%
18%
23%
27%
21%
15%
9%
24%
39%
6%
6%
9%
9%
12%
Male
Female
Born in the U.S.
Foreign Born
High School or Less
Some College/Vocational School
College Graduate
Manhattan
Brooklyn
Bronx
Queens
Staten Island
18-35
36-65
66 and older
OVERALL 23% 9%
Rates of Health Problems for New York City Adults Overall and by Specific Groups - 2018
Table 4
Source: Results for subgroups groups are based on three years of annual Poverty Tracker survey data (2016, 2017, and 2018).
Note: The majority of the estimates presented in this table have a margin of error ranging from 3 percentage points to 5 percentage points; see Appendix B3 and Appendix B4 for the margin of error associated with each estimate.
DISADVANTAGE IN NEW YORK CITY
SECTION 4
HIGHLIGHTS
Like the rate of poverty and material hardship, the rate of disadvantage among adult New Yorkers has declined since 2012.
Among nearly all demographic groups, there have been declines in the rate of disadvantage.
Half of the adult population experienced some form of disadvantage in 2018 and there are still disparities between demographic groups in the prevalence of disadvantage.
POVERTY TRACKER ANNUAL REPORT 30
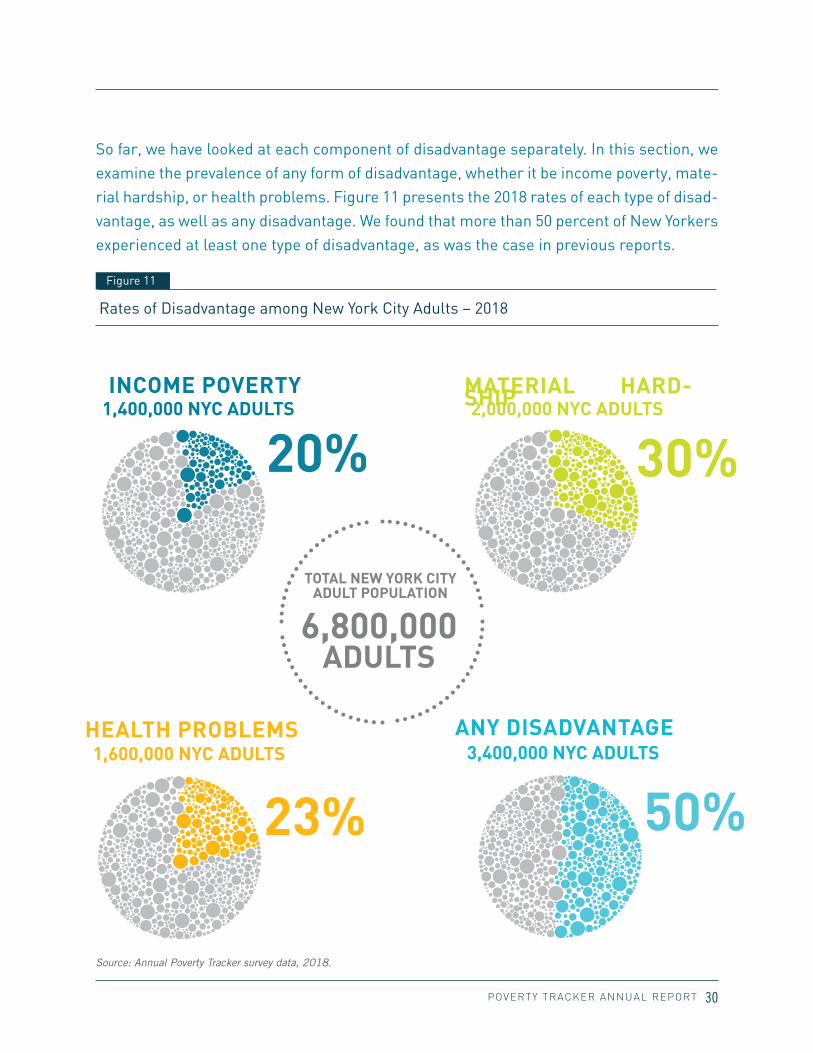
Rates of Disadvantage among New York City Adults – 2018
30%
23%
6,800,000ADULTS
20%2,000,000 NYC ADULTS
1,600,000 NYC ADULTS
TOTAL NEW YORK CITY ADULT POPULATION
INCOME POVERTY1,400,000 NYC ADULTS
MATERIAL HARD-SHIP
HEALTH PROBLEMS
50%3,400,000 NYC ADULTS
ANY DISADVANTAGE
So far, we have looked at each component of disadvantage separately. In this section, we examine the prevalence of any form of disadvantage, whether it be income poverty, mate-rial hardship, or health problems. Figure 11 presents the 2018 rates of each type of disad-vantage, as well as any disadvantage. We found that more than 50 percent of New Yorkers experienced at least one type of disadvantage, as was the case in previous reports.
Source: Annual Poverty Tracker survey data, 2018.
Figure 11

POVERTY TRACKER ANNUAL REPORT 31
Trends in Overall Disadvantage among New York City Adults between 2012 and 2018
Figure 12
20%
30%
40%
50%
60%
70%
80%
2012 2013 2014 2015 2016 2017 2018
Rat
e of
Dis
adva
ntag
e
54%57% 52%55%
53% 51%50%
Source: Annual Poverty Tracker survey data, 2012 to 2018.
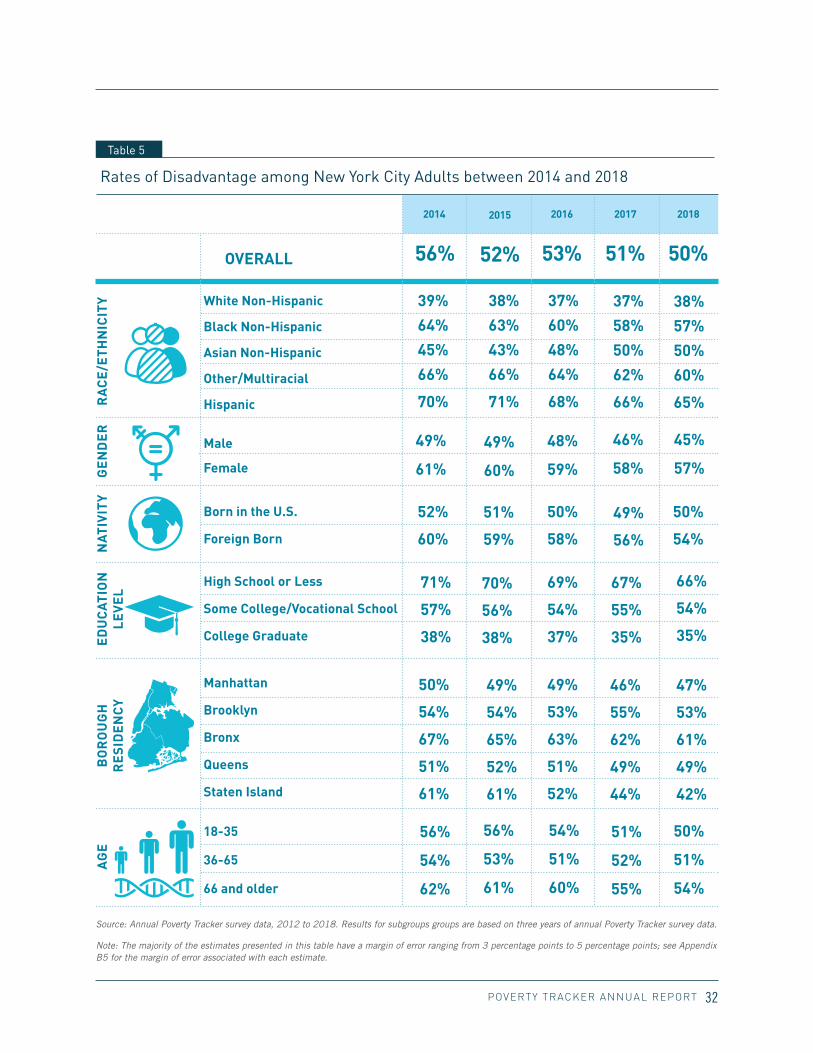
Since 2012, the prevalence of disadvantage appears to be declining, falling from 54 percent to 50 percent
(see Figure 12). Unfortunately, as no single national dataset captures trend data for all three measures of
disadvantage analyzed in this report, we cannot make national comparisons.
The decrease in rates of disadvantage since 2012 is shared across demographic groups (see Table 5). Most
groups experienced some decline in the prevalence of any disadvantage, except Asian New Yorkers. We
will explore this phenomenon further in the coming years as we incorporate results from our Mandarin-
language survey into our dataset.
The Poverty Tracker finds that although the poverty rate and the prevalence of material hardships have
decreased in recent years, many New Yorkers still experience health problems and half of the city’s adults
experience at least one form of disadvantage. Disparities across racial and ethnic lines, educational levels,
and gender have also persisted from year to year.
Rat
e of
Dis
adva
ntag
e
POVERTY TRACKER ANNUAL REPORT 32
GE
ND
ER
RA
CE
/ETH
NIC
ITY
2014
56%
2015
52%
2016
53%
2017
51%
2018
50%
NAT
IVIT
YA
GE
BO
RO
UG
H
RE
SID
EN
CY
ED
UC
ATIO
N
LEVE
L
White Non-Hispanic
Black Non-Hispanic
Asian Non-Hispanic
Other/Multiracial
Hispanic
38%
63%
43%
66%
71%
39%
64%
45%
66%
70%
37%
60%
48%
64%
68%
37%
58%
50%
62%
66%
49%
60%
49%
61%
48%
59%
46%
58%
45%
57%
50%
54%
66%
54%
35%
47%
53%
61%
49%
42%
50%
51%
54%
51%
59%
52%
60%
50%
58%
49%
56%
70%
56%
38%
71%
57%
38%
50%
54%
67%
51%
61%
49%
53%
63%
51%
52%
46%
55%
62%
49%
44%
69%
54%
37%
67%
55%
35%
49%
54%
65%
52%
61%
56%
53%
61%
56%
54%
62%
54%
51%
60%
51%
52%
55%
38%
57%
50%
60%
65%
Male
Female
Born in the U.S.
Foreign Born
High School or Less
Some College/Vocational School
College Graduate
Manhattan
Brooklyn
Bronx
Queens
Staten Island
18-35
36-65
66 and older
OVERALL
Rates of Disadvantage among New York City Adults between 2014 and 2018
Table 5
Source: Annual Poverty Tracker survey data, 2012 to 2018. Results for subgroups groups are based on three years of annual Poverty Tracker survey data.
Note: The majority of the estimates presented in this table have a margin of error ranging from 3 percentage points to 5 percentage points; see Appendix B5 for the margin of error associated with each estimate.

POVERTY TRACKER ANNUAL REPORT 33
15%
50%
45%
30%
DAT
A 04
DAT
A 01
DAT
A 02
DAT
A 03
FALLING INTO POVERTY AND MATERIAL HARDSHIP
HIGHLIGHTS
SECTION 5
Between 2012 and 2018, each year roughly 14 percent of New York City adults fell into poverty and 16 percent entered a period of material hardship.
Common life events, like ending a relationship, losing a job, or having a child, are associated with an increased likelihood of falling into poverty, especially for New Yorkers with few assets and lower educational attainment.
New Yorkers with a high school degree or less are nearly five times more likely to enter poverty after having children than New Yorkers with a bachelor’s degree (10 percent vs. 47 percent).
New Yorkers with assets and high levels of formal education face reduced risk of entering poverty or hardship when these life events occur.
POVERTY TRACKER ANNUAL REPORT 34
Before we can build policies and programs that prevent people from falling into poverty or periods of material hardship, we must first understand the life events and circumstances that led them there. The Poverty Tracker offers a unique perspective in studying entries into poverty and hardship because it follows the same New Yorkers over time and collects data on different life events and experiences of disadvantage. Using this data, we can identify the events associated with entering a period of disadvantage, as well as the characteristics that moderate the impact of these experiences — information that is key to understanding what can be done to prevent these disruptions in the first place.
What Do We Already Know About Falling into Poverty and Material Hardship?The existing research on poverty recognizes the relationship between different events and a person’s
likelihood of falling below the poverty line. Previous literature has documented the consequences of
changes in a person’s employment, household composition, and the employment situation of a spouse on a
household’s income. Specifically, DiPrete and McManus (2000) find that losing a spouse has a large impact
on a household’s income.6 In another study evaluating poverty entries and exits, researchers found that
changes in employment, household composition, and disability status were all associated with falling into
poverty; the likelihood of entering poverty was highest among those who lost their job.7 Due to the limited
availability of data, analyses that identify the events associated with changes in material hardship are less
prevalent in the literature, although a study of mothers found that poor maternal health is associated with
entrances into material hardship.8 The wealth of material hardship data collected by the Poverty Tracker
offers the opportunity to study previously unexamined influences on material hardship.
6 DiPrete, T. A., & McManus, P. A. (2000). Family change, employment transitions, and the welfare state: Household income dynamics in the United States and Germany. American Sociological Review, 343-370.
7 McKernan, S. M., & Ratcliffe, C. (2005). Events that trigger poverty entries and exits. Social Science Quarterly, 86, 1146-1169.8 Heflin, C. H., & Butler, J. S. (2013). Why do women enter and exit from material hardship?. Journal of Family Issues, 34(5), 631-660.
POVERTY TRACKER ANNUAL REPORT 35
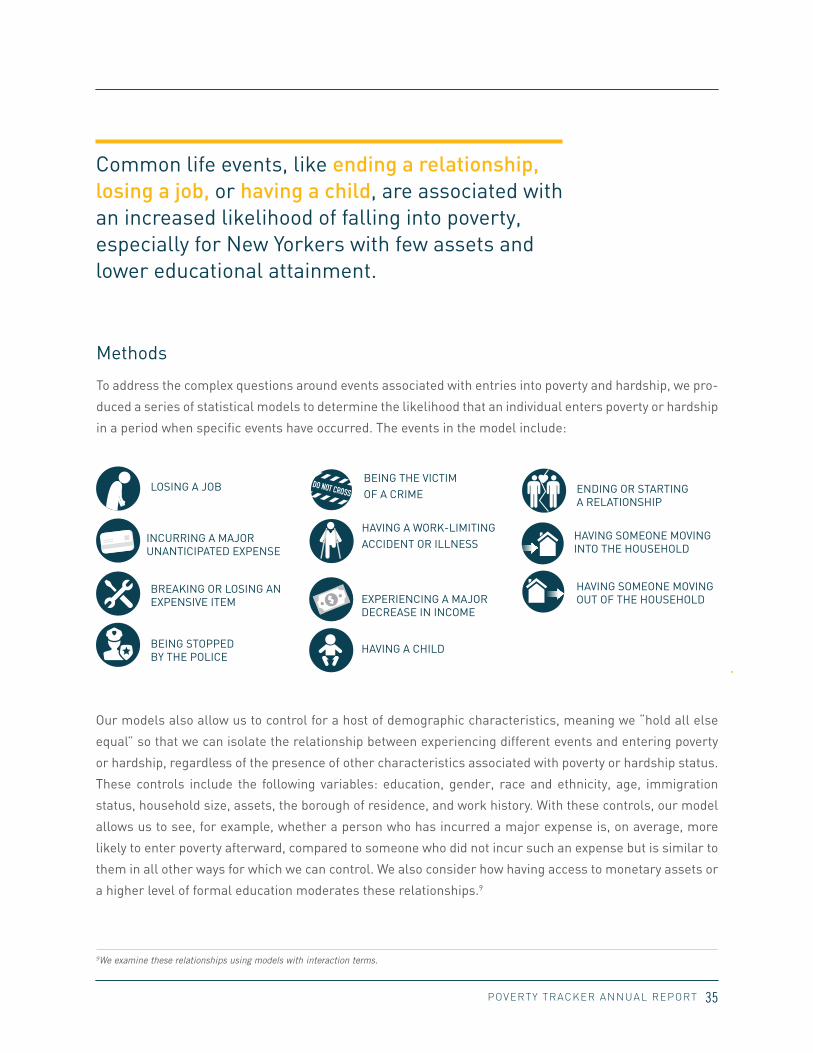
Methods
To address the complex questions around events associated with entries into poverty and hardship, we pro-
duced a series of statistical models to determine the likelihood that an individual enters poverty or hardship
in a period when specific events have occurred. The events in the model include:
Our models also allow us to control for a host of demographic characteristics, meaning we “hold all else
equal” so that we can isolate the relationship between experiencing different events and entering poverty
or hardship, regardless of the presence of other characteristics associated with poverty or hardship status.
These controls include the following variables: education, gender, race and ethnicity, age, immigration
status, household size, assets, the borough of residence, and work history. With these controls, our model
allows us to see, for example, whether a person who has incurred a major expense is, on average, more
likely to enter poverty afterward, compared to someone who did not incur such an expense but is similar to
them in all other ways for which we can control. We also consider how having access to monetary assets or
a higher level of formal education moderates these relationships.9
9We examine these relationships using models with interaction terms.
HAVING A CHILD
LOSING A JOB
BEING STOPPED BY THE POLICE
INCURRING A MAJOR UNANTICIPATED EXPENSE
BEING THE VICTIM OF A CRIME
HAVING A WORK-LIMITING ACCIDENT OR ILLNESS
BREAKING OR LOSING AN EXPENSIVE ITEM EXPERIENCING A MAJOR
DECREASE IN INCOME
ENDING OR STARTING A RELATIONSHIP
HAVING SOMEONE MOVING INTO THE HOUSEHOLD
HAVING SOMEONE MOVING OUT OF THE HOUSEHOLD
Common life events, like ending a relationship, losing a job, or having a child, are associated with an increased likelihood of falling into poverty, especially for New Yorkers with few assets and lower educational attainment.
POVERTY TRACKER ANNUAL REPORT 36
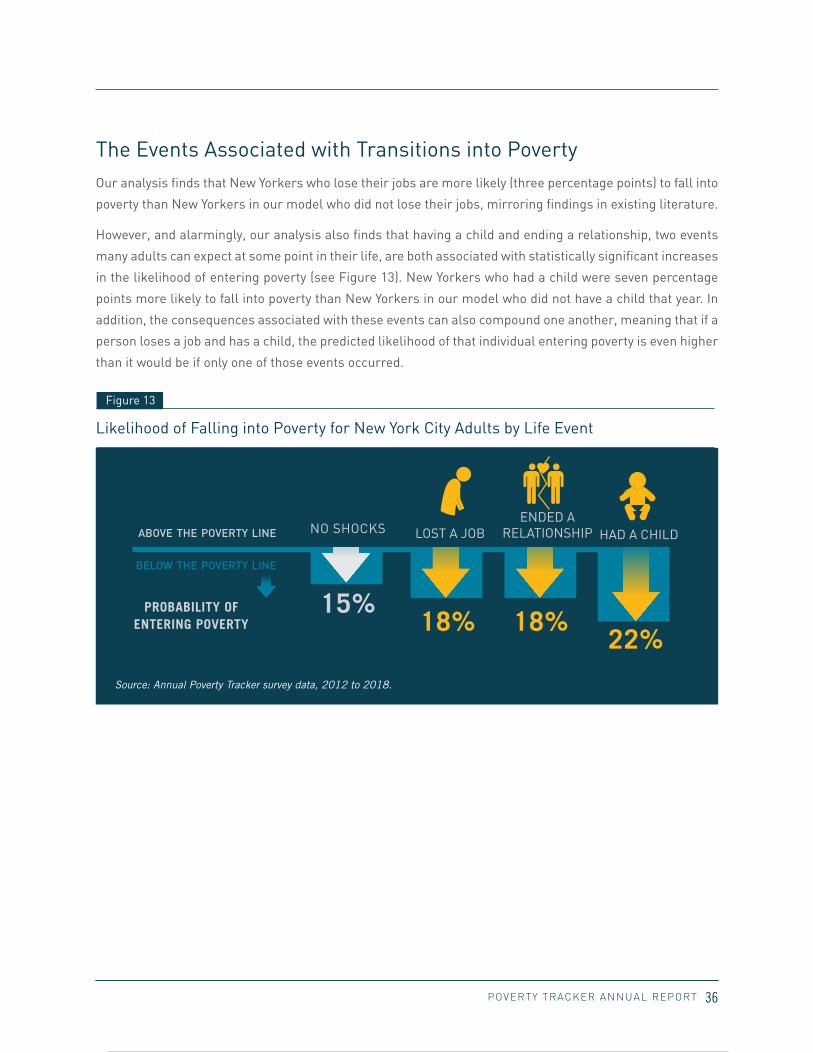
The Events Associated with Transitions into Poverty Our analysis finds that New Yorkers who lose their jobs are more likely (three percentage points) to fall into
poverty than New Yorkers in our model who did not lose their jobs, mirroring findings in existing literature.
However, and alarmingly, our analysis also finds that having a child and ending a relationship, two events
many adults can expect at some point in their life, are both associated with statistically significant increases
in the likelihood of entering poverty (see Figure 13). New Yorkers who had a child were seven percentage
points more likely to fall into poverty than New Yorkers in our model who did not have a child that year. In
addition, the consequences associated with these events can also compound one another, meaning that if a
person loses a job and has a child, the predicted likelihood of that individual entering poverty is even higher
than it would be if only one of those events occurred.
Likelihood of Falling into Poverty for New York City Adults by Life Event
Figure 13
Source: Annual Poverty Tracker survey data, 2012 to 2018.
POVERTY TRACKER ANNUAL REPORT 37
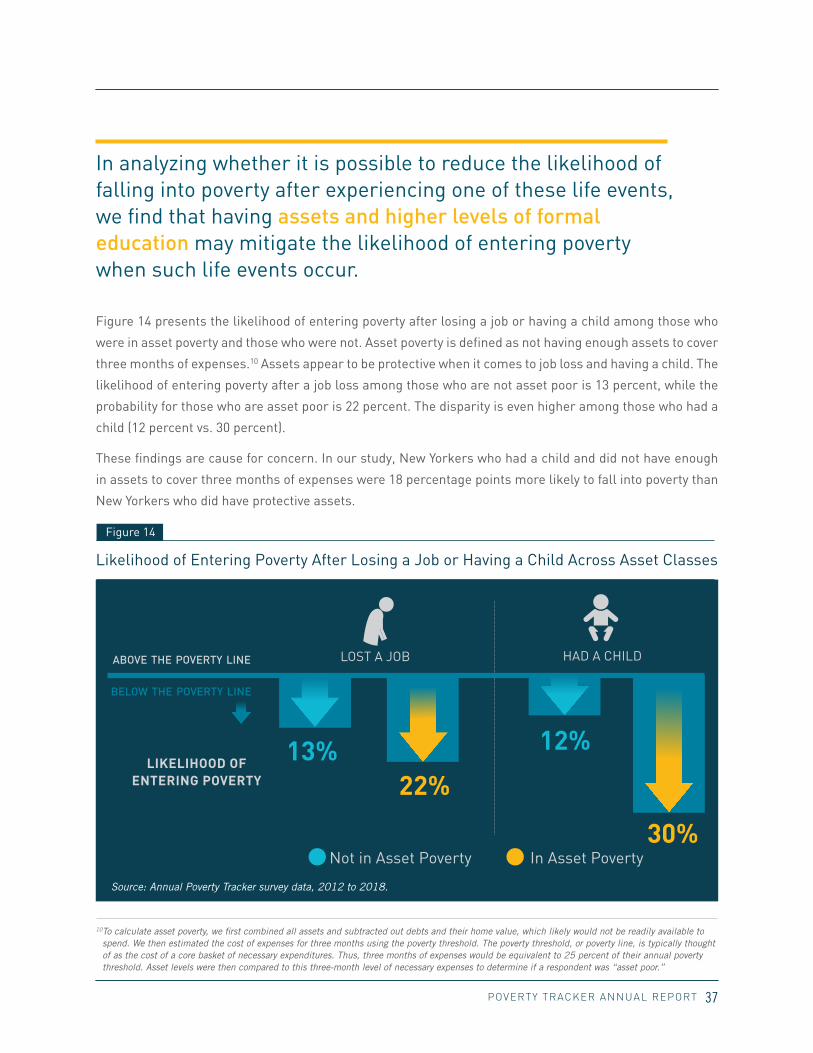
Likelihood of Entering Poverty After Losing a Job or Having a Child Across Asset Classes
Figure 14
Figure 14 presents the likelihood of entering poverty after losing a job or having a child among those who
were in asset poverty and those who were not. Asset poverty is defined as not having enough assets to cover
three months of expenses.10 Assets appear to be protective when it comes to job loss and having a child. The
likelihood of entering poverty after a job loss among those who are not asset poor is 13 percent, while the
probability for those who are asset poor is 22 percent. The disparity is even higher among those who had a
child (12 percent vs. 30 percent).
These findings are cause for concern. In our study, New Yorkers who had a child and did not have enough
in assets to cover three months of expenses were 18 percentage points more likely to fall into poverty than
New Yorkers who did have protective assets.
Not in Asset Poverty In Asset Poverty
LOST A JOB HAD A CHILD
22%
12%
30%
13%
below the poverty line
LIKELIHOOD OF ENTERING POVERTY
Source: Annual Poverty Tracker survey data, 2012 to 2018.
10 To calculate asset poverty, we first combined all assets and subtracted out debts and their home value, which likely would not be readily available to spend. We then estimated the cost of expenses for three months using the poverty threshold. The poverty threshold, or poverty line, is typically thought of as the cost of a core basket of necessary expenditures. Thus, three months of expenses would be equivalent to 25 percent of their annual poverty threshold. Asset levels were then compared to this three-month level of necessary expenses to determine if a respondent was “asset poor.”
In analyzing whether it is possible to reduce the likelihood of falling into poverty after experiencing one of these life events, we find that having assets and higher levels of formal education may mitigate the likelihood of entering poverty when such life events occur.

POVERTY TRACKER ANNUAL REPORT 38
Education and the Likelihood of Entering Poverty After Losing a Job, Having a Child, or Ending a Relationship
Figure 15
New Yorkers with higher levels of education are also less likely to fall into poverty after ending a relation-
ship, compared to those who have a high school degree or less (13 percent vs. 28 percent).
Bachelor’s Degree High School Degree or Less
LOST A JOBENDED A
RELATIONSHIP HAD A CHILD
26%
13% 10%
28%
47%
10%
below the poverty line
LIKELIHOOD OF ENTERING POVERTY
New Yorkers with a high school degree or less are nearly five times more likely to enter poverty after having a child than New Yorkers with a bachelor’s degree (10 percent vs. 47 percent).
Source: Annual Poverty Tracker survey data, 2012 to 2018.
Like having assets, we also find that those with higher levels of formal education are less likely to fall into
poverty after experiencing one of the events associated with poverty entries than those with a high school
degree or less. In Figure 15, we see that the likelihood of falling into poverty after losing a job is 26 percent
for New Yorkers with a high school degree or less – compared to 10 percent for New Yorkers with a bachelor’s
degree. But the interaction effect between educational attainment and having a child is even more alarming.
POVERTY TRACKER ANNUAL REPORT 39
Our analysis also finds that when New Yorkers fall on hard times, those with higher levels of education
are much more likely to be able to lean on their social networks for support. The annual Poverty Tracker
survey asks respondents whether they would be able to count on someone to loan them $400 if faced with
an emergency expense of that amount. Seventy-seven percent of New Yorkers with a bachelor’s degree said
they could count on someone for such a loan, compared to 51 percent of New Yorkers with a high school
degree or less.
These findings suggest that typical life events like losing a job, having a child, or ending a relationship present
greater risks for New Yorkers without assets and lower levels of formal education — and that when such
events occur, these New Yorkers are less likely to be able to turn to their social networks for financial support.
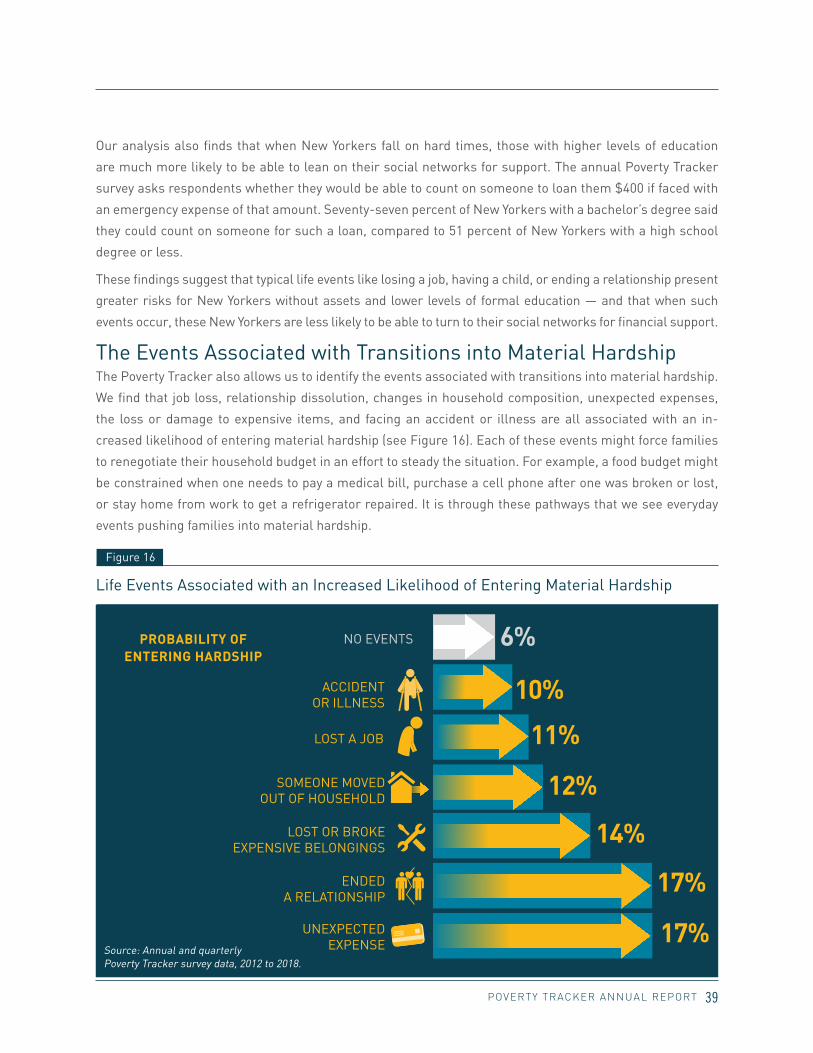
The Events Associated with Transitions into Material HardshipThe Poverty Tracker also allows us to identify the events associated with transitions into material hardship.
We find that job loss, relationship dissolution, changes in household composition, unexpected expenses,
the loss or damage to expensive items, and facing an accident or illness are all associated with an in-
creased likelihood of entering material hardship (see Figure 16). Each of these events might force families
to renegotiate their household budget in an effort to steady the situation. For example, a food budget might
be constrained when one needs to pay a medical bill, purchase a cell phone after one was broken or lost,
or stay home from work to get a refrigerator repaired. It is through these pathways that we see everyday
events pushing families into material hardship.
Life Events Associated with an Increased Likelihood of Entering Material Hardship
Figure 16
LOST A JOB
SOMEONE MOVED OUT OF HOUSEHOLD
LOST OR BROKE EXPENSIVE BELONGINGS
ENDED A RELATIONSHIP
UNEXPECTED EXPENSE
ACCIDENT OR ILLNESS
NO EVENTS 6%
10%
11%
12%
14%
17%
17%
PROBABILITY OF ENTERING HARDSHIP
Source: Annual and quarterly Poverty Tracker survey data, 2012 to 2018.

POVERTY TRACKER ANNUAL REPORT 40
Health Challenges and Material Hardship: Ron’s StoryTo further understand the experiences faced by New Yorkers and the relationship between life events, public policy, and disadvantage in New York City, the Poverty Tracker launched a qualitative study with Poverty Tracker respondents to complement the initial study’s research objectives. One story told in a recent qualitative interview reveals how common events can push families into challenging economic circumstances and, more importantly, set off a series of occurrences that completely shift a family’s trajectory.
A few years ago, Ron, a Queens resident in his late fifties, was set off course when his partner
suffered a medical emergency. Since then, she has lived in a nursing home because the family
cannot find an affordable housing unit that is handicap-accessible. At the same time, because
the electricity bill was in his partner’s name, Ron was without electricity for several months.
Every common expense counts — in order to visit the nursing home, Ron has to purchase a
$30 weekly MetroCard, and, after paying cell phone bills and rent, there was little left for any-
thing else. These challenges also spilled over on Ron’s daughter. She had been attending one
of the city’s specialized high schools, which are highly competitive to get into and serve as a
launchpad for college and other opportunities, but when finances became tight at home, she
left school, got her GED, and started working. When discussing the challenges faced by his
daughter in recent years, Ron stated, “It’s hampered her, her efforts, too. Until we get situated,
you know, she’s…she’s disabled as well.”

POVERTY TRACKER ANNUAL REPORT 41
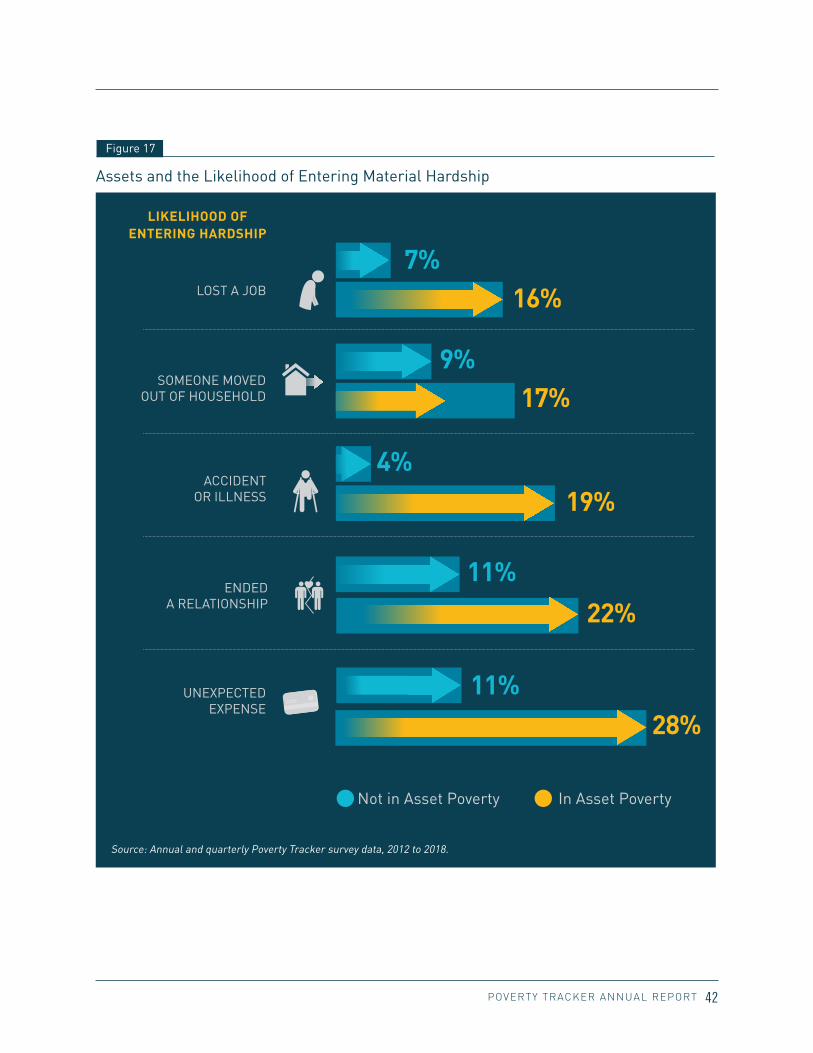
Ron’s story (see previous page) highlights how common events that can happen to anyone can have a
devastating impact — but the magnitude of these impacts is not the same for all New Yorkers. With
Poverty Tracker data, we can isolate the circumstances associated with mitigating the likelihood of
entering hardship after one of these events. Consistent with what we found when examining transitions into
poverty, assets may moderate the likelihood of entering material hardship (see Figure 17). For example, the
likelihood of entering material hardship after enduring an unanticipated expense is 28 percent for New
Yorkers in our study who are in asset poverty, compared to 11 percent for New Yorkers who are not in
asset poverty.
As was the case in Ron’s story, we find that when a New Yorker experiences an accident or illness, the
likelihood of entering hardship is 19 percent for those New Yorkers with minimal assets and just 4 percent
for those with assets. We find similar disparities when looking at other events associated with entering
hardship, specifically, job loss and changes in household composition or relationship status.
POVERTY TRACKER ANNUAL REPORT 42
Assets and the Likelihood of Entering Material Hardship
Figure 17
LOST A JOB
SOMEONE MOVED OUT OF HOUSEHOLD
ENDED A RELATIONSHIP
UNEXPECTED EXPENSE
ACCIDENT OR ILLNESS
7%16%
9%17%
4%19%
11%
22%
11%28%
LIKELIHOOD OF ENTERING HARDSHIP
Not in Asset Poverty In Asset Poverty
Source: Annual and quarterly Poverty Tracker survey data, 2012 to 2018.
POVERTY TRACKER ANNUAL REPORT 43
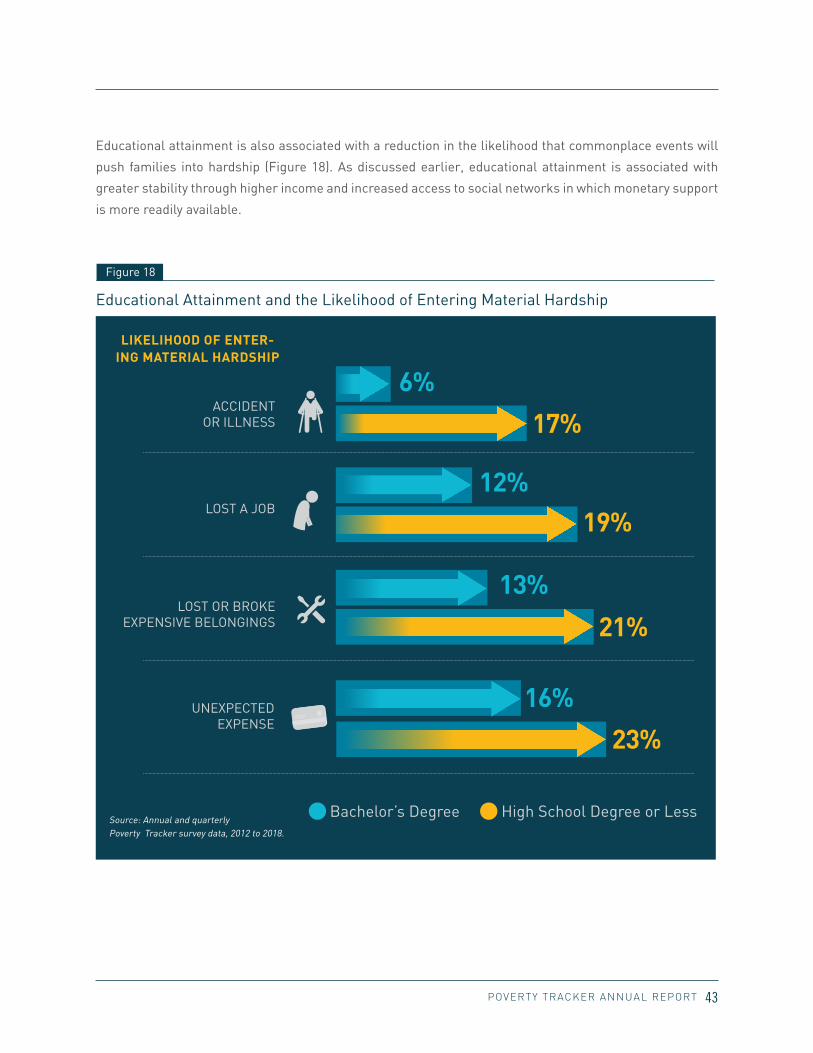
Educational attainment is also associated with a reduction in the likelihood that commonplace events will
push families into hardship (Figure 18). As discussed earlier, educational attainment is associated with
greater stability through higher income and increased access to social networks in which monetary support
is more readily available.
Educational Attainment and the Likelihood of Entering Material Hardship
Figure 18
LOST A JOB
UNEXPECTED EXPENSE
ACCIDENT OR ILLNESS
6%
17%
12%19%
13%
21%
16%
23%
LIKELIHOOD OF ENTER-ING MATERIAL HARDSHIP
Bachelor’s Degree High School Degree or Less
LOST OR BROKE EXPENSIVE BELONGINGS
Source: Annual and quarterly Poverty Tracker survey data, 2012 to 2018.
POVERTY TRACKER ANNUAL REPORT 44
Overall, we find that commonplace events push many families in New York City into poverty and material
hardship. The best way to mitigate the impact of these events is to prevent them entirely. For example,
ensuring that New Yorkers have access to stable work and income would reduce the number of families
entering economic disadvantage after a job loss, and preventive healthcare would decrease the chances
that families would enter material hardship due to accidents and illnesses.
But there are many events that we cannot prevent; everyone encounters unexpected expenses and suffers
an accident or injury from time to time. And there are also many things we should not aim to prevent; many
people leave relationships that are not right for them and others choose to have children because they want
to build a family. These decisions should not come with such debilitating consequences that they push fam-
ilies into economic turmoil.

POVERTY TRACKER ANNUAL REPORT 45
CONCLUSIONThis report, the first follow-up to the Poverty Tracker’s inaugural annual report, builds on last year’s
findings by documenting the rates of poverty, material hardship, and health problems in New York City in
2018. Since 2012, when the Poverty Tracker first launched, there has been a consistent, though modest,
decrease in poverty and hardship in New York City, a trend that has continued through 2018.
However, the report also shows that over time, many more New Yorkers experience poverty and hardship
than an annual snapshot would show, and health problems still persist year over year. Between 2015 and
2018, half of New York City adults lived in poverty at least once over those four years.
In addition to documenting key measures of poverty, hardship, and health, this report documents life events
associated with entering poverty and hardship. We find that common life events like losing a job, having a
child, or ending a relationship are all associated with an increased risk of entering poverty, especially for
New Yorkers with limited assets and those with lower formal educational attainment. The impacts of these
events are highlighted by stories like Ron’s, examples of lived experiences where events push families
living on the edge into precarious circumstances and compound into additional problems for families and
individuals.
Everyday events should not come with such severe risks — but these risks will only be mitigated when we
reduce inequality in our city and when sustainable economic mobility is the rule rather than the exception.
POVERTY TRACKER ANNUAL REPORT 46
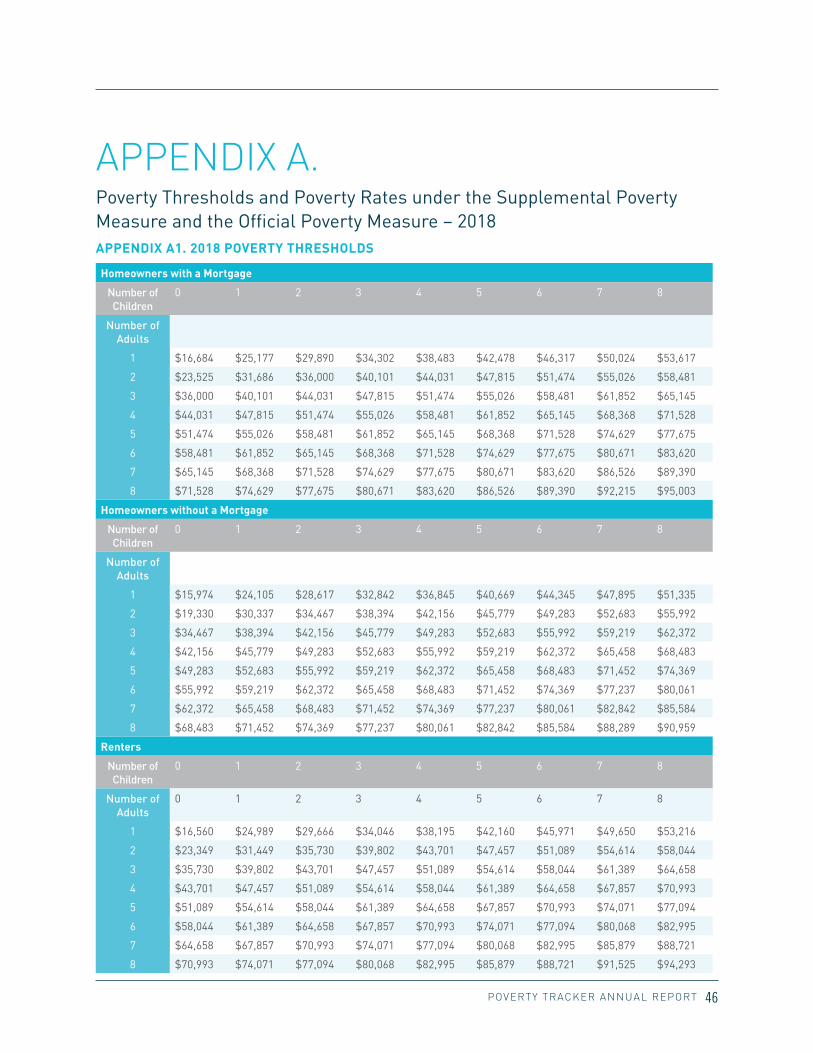
APPENDIX A. Poverty Thresholds and Poverty Rates under the Supplemental Poverty Measure and the Official Poverty Measure – 2018 APPENDIX A1. 2018 POVERTY THRESHOLDS
Homeowners with a Mortgage
Number of Children
0 1 2 3 4 5 6 7 8
Number of Adults
1 $16,684 $25,177 $29,890 $34,302 $38,483 $42,478 $46,317 $50,024 $53,617
2 $23,525 $31,686 $36,000 $40,101 $44,031 $47,815 $51,474 $55,026 $58,481
3 $36,000 $40,101 $44,031 $47,815 $51,474 $55,026 $58,481 $61,852 $65,145
4 $44,031 $47,815 $51,474 $55,026 $58,481 $61,852 $65,145 $68,368 $71,528
5 $51,474 $55,026 $58,481 $61,852 $65,145 $68,368 $71,528 $74,629 $77,675
6 $58,481 $61,852 $65,145 $68,368 $71,528 $74,629 $77,675 $80,671 $83,620
7 $65,145 $68,368 $71,528 $74,629 $77,675 $80,671 $83,620 $86,526 $89,390
8 $71,528 $74,629 $77,675 $80,671 $83,620 $86,526 $89,390 $92,215 $95,003
Homeowners without a Mortgage
Number of Children
0 1 2 3 4 5 6 7 8
Number of Adults
1 $15,974 $24,105 $28,617 $32,842 $36,845 $40,669 $44,345 $47,895 $51,335
2 $19,330 $30,337 $34,467 $38,394 $42,156 $45,779 $49,283 $52,683 $55,992
3 $34,467 $38,394 $42,156 $45,779 $49,283 $52,683 $55,992 $59,219 $62,372
4 $42,156 $45,779 $49,283 $52,683 $55,992 $59,219 $62,372 $65,458 $68,483
5 $49,283 $52,683 $55,992 $59,219 $62,372 $65,458 $68,483 $71,452 $74,369
6 $55,992 $59,219 $62,372 $65,458 $68,483 $71,452 $74,369 $77,237 $80,061
7 $62,372 $65,458 $68,483 $71,452 $74,369 $77,237 $80,061 $82,842 $85,584
8 $68,483 $71,452 $74,369 $77,237 $80,061 $82,842 $85,584 $88,289 $90,959
Renters
Number of Children
0 1 2 3 4 5 6 7 8
Number of Adults
0 1 2 3 4 5 6 7 8
1 $16,560 $24,989 $29,666 $34,046 $38,195 $42,160 $45,971 $49,650 $53,216
2 $23,349 $31,449 $35,730 $39,802 $43,701 $47,457 $51,089 $54,614 $58,044
3 $35,730 $39,802 $43,701 $47,457 $51,089 $54,614 $58,044 $61,389 $64,658
4 $43,701 $47,457 $51,089 $54,614 $58,044 $61,389 $64,658 $67,857 $70,993
5 $51,089 $54,614 $58,044 $61,389 $64,658 $67,857 $70,993 $74,071 $77,094
6 $58,044 $61,389 $64,658 $67,857 $70,993 $74,071 $77,094 $80,068 $82,995
7 $64,658 $67,857 $70,993 $74,071 $77,094 $80,068 $82,995 $85,879 $88,721
8 $70,993 $74,071 $77,094 $80,068 $82,995 $85,879 $88,721 $91,525 $94,293

POVERTY TRACKER ANNUAL REPORT 47
APPENDIX A2. POVERTY RATES FOR ADULTS UNDER THE SUPPLEMENTAL POVERTY MEASURE AND THE OFFICIAL POVERTY MEASURE
0%
10%
20%
30%
40%
50%
2012 2013 2014 2015 2016 2017 2018
24% 24%21%
22% 21% 21% 20%
18% 18%16%17% 16% 16%16%
NYC Poverty Rate (SPM) NYC Poverty Rate (OPM)
Source: Annual and quarterly Poverty Tracker survey data, 2012 to 2018.
POVERTY TRACKER ANNUAL REPORT 48
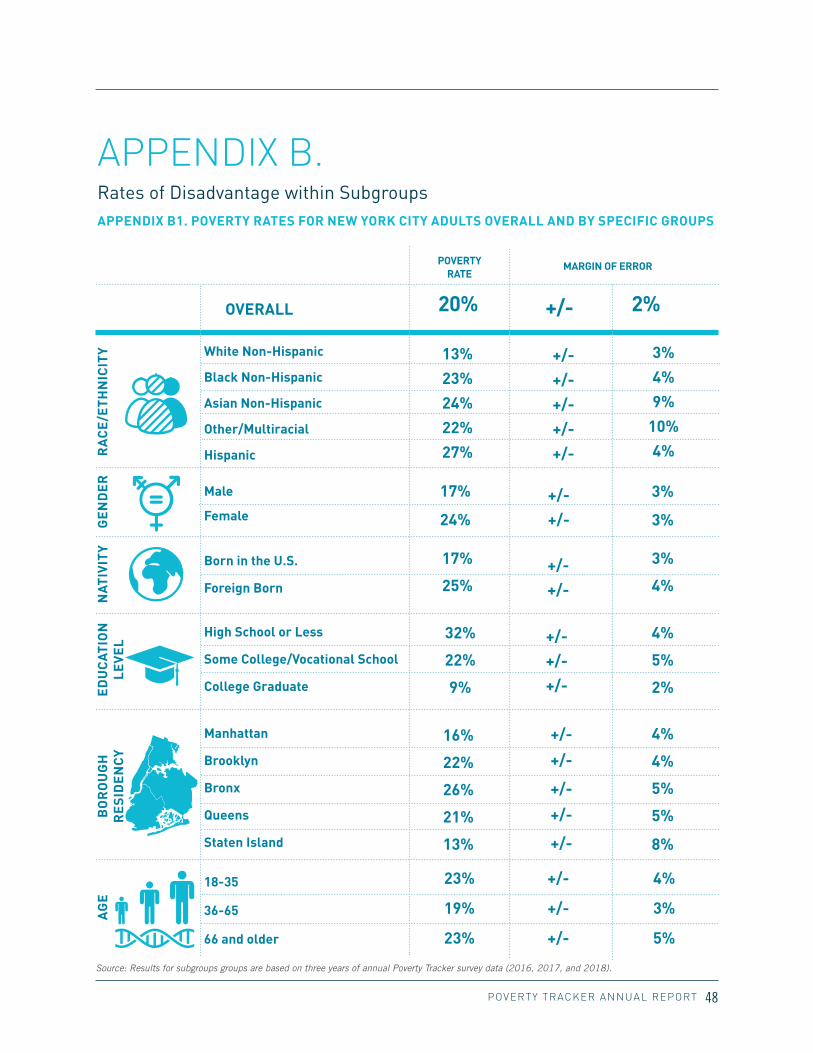
APPENDIX B. Rates of Disadvantage within SubgroupsAPPENDIX B1. POVERTY RATES FOR NEW YORK CITY ADULTS OVERALL AND BY SPECIFIC GROUPS
Source: Results for subgroups groups are based on three years of annual Poverty Tracker survey data (2016, 2017, and 2018).
GE
ND
ER
RA
CE
/ETH
NIC
ITY
POVERTY RATE
20%
MARGIN OF ERROR
+/- 2%
NAT
IVIT
YA
GE
BO
RO
UG
H
RE
SID
EN
CY
ED
UC
ATIO
N
LEVE
L
White Non-Hispanic
Black Non-Hispanic
Asian Non-Hispanic
Other/Multiracial
Hispanic
+/-
+/-
+/-
+/-
+/-
13%
23%
24%
22%
27%
3%
4%
9%
10%
4%
+/-
+/-
17%
24%
3%
3%
+/-
+/-
17%
25%
3%
4%
+/-
+/-
+/-
32%
22%
9%
16%
22%
26%
21%
13%
4%
4%
5%
5%
8%
4%
5%
2%
+/-
+/-
+/-
+/-
+/-
+/-
+/-
+/-
23%
19%
23%
4%
3%
5%
Male
Female
Born in the U.S.
Foreign Born
High School or Less
Some College/Vocational School
College Graduate
Manhattan
Brooklyn
Bronx
Queens
Staten Island
18-35
36-65
66 and older
OVERALL

POVERTY TRACKER ANNUAL REPORT 49
APPENDIX B2
Rates of Hardship for New York City Adults Overall and by Specific Groups
GE
ND
ER
RA
CE
/ETH
NIC
ITY
HARDSHIP RATE
30%
MARGIN OF ERROR
+/- 3%
NAT
IVIT
YA
GE
BO
RO
UG
H
RE
SID
EN
CY
ED
UC
ATIO
N
LEVE
L
White Non-Hispanic
Black Non-Hispanic
Asian Non-Hispanic
Other/Multiracial
Hispanic
+/-
+/-
+/-
+/-
+/-
19%
39%
28%
40%
43%
4%
6%
9%
13%
5%
+/-
+/-
26%
36%
4%
4%
+/-
+/-
30%
33%
3%
4%
+/-
+/-
+/-
38%
35%
23%
29%
32%
39%
29%
27%
5%
5%
6%
5%
11%
5%
5%
4%
+/-
+/-
+/-
+/-
+/-
+/-
+/-
+/-
37%
32%
20%
5%
4%
5%
Male
Female
Born in the U.S.
Foreign Born
High School or Less
Some College/Vocational School
College Grade
Manhattan
Brooklyn
Bronx
Queens
Staten Island
18-35
36-65
66 and older
OVERALL
Source: Results for subgroups groups are based on three years of annual Poverty Tracker survey data (2016, 2017, and 2018).

POVERTY TRACKER ANNUAL REPORT 50
APPENDIX B3
Rates of Health Problems for New York City Adults Overall and by Specific Groups
GE
ND
ER
RA
CE
/ETH
NIC
ITY
RATE OF HEALTH PROBLEMS
23%
MARGIN OF ERROR
+/- 2%
NAT
IVIT
YA
GE
BO
RO
UG
H
RE
SID
EN
CY
ED
UC
ATIO
N
LEVE
L
White Non-Hispanic
Black Non-Hispanic
Asian Non-Hispanic
Other/Multiracial
Hispanic
+/-
+/-
+/-
+/-
+/-
18%
25%
16%
23%
26%
3%
5%
8%
11%
4%
+/-
+/-
20%
23%
3%
3%
+/-
+/-
24%
19%
3%
4%
+/-
+/-
+/-
32%
21%
12%
18%
23%
27%
21%
15%
4%
4%
5%
5%
7%
4%
4%
3%
+/-
+/-
+/-
+/-
+/-
+/-
+/-
+/-
9%
24%
39%
3%
3%
6%
Male
Female
Born in the U.S.
Foreign Born
High School or Less
Some College/Vocational School
College Grade
Manhattan
Brooklyn
Bronx
Queens
Staten Island
18-35
36-65
66 and older
OVERALL
Source: Results for subgroups groups are based on three years of annual Poverty Tracker survey data (2016, 2017, and 2018).
POVERTY TRACKER ANNUAL REPORT 51
APPENDIX B4
Rates of Mental Distress for New York City Adults Overall and by Specific Groups
GE
ND
ER
RA
CE
/ETH
NIC
ITY
RATE OF MENTAL DISTRESS
9%
MARGIN OF ERROR
+/- 2%
NAT
IVIT
YA
GE
BO
RO
UG
H
RE
SID
EN
CY
ED
UC
ATIO
N
LEVE
L
White Non-Hispanic
Black Non-Hispanic
Asian Non-Hispanic
Other/Multiracial
Hispanic
+/-
+/-
+/-
+/-
+/-
6%
6%
9%
9%
12%
2%
3%
6%
6%
3%
+/-
+/-
7%
8%
2%
2%
+/-
+/-
8%
8%
2%
2%
+/-
+/-
+/-
12%
7%
5%
6%
9%
10%
8%
5%
3%
3%
4%
3%
6%
3%
2%
2%
+/-
+/-
+/-
+/-
+/-
+/-
+/-
+/-
8%
8%
7%
3%
2%
4%
Male
Female
Born in the U.S.
Foreign Born
High School or Less
Some College/Vocational School
College Graduate
Manhattan
Brooklyn
Bronx
Queens
Staten Island
18-35
36-65
66 and older
OVERALL
Source: Results for subgroups groups are based on three years of annual Poverty Tracker survey data (2016, 2017, and 2018).

POVERTY TRACKER ANNUAL REPORT 52
APPENDIX B5
Rates of Disadvantage for New York City Adults Overall and by Specific Groups
GE
ND
ER
RA
CE
/ETH
NIC
ITY
RATE OF ANY DISADVANTAGE
50%
MARGIN OF ERROR
+/- 3%
NAT
IVIT
YA
GE
BO
RO
UG
H
RE
SID
EN
CY
ED
UC
ATIO
N
LEVE
L
White Non-Hispanic
Black Non-Hispanic
Asian Non-Hispanic
Other/Multiracial
Hispanic
+/-
+/-
+/-
+/-
+/-
38%
57%
50%
60%
65%
4%
6%
10%
13%
5%
+/-
+/-
45%
57%
4%
4%
+/-
+/-
50%
54%
3%
5%
+/-
+/-
+/-
66%
54%
35%
47%
53%
61%
49%
42%
6%
5%
6%
6%
12%
5%
6%
4%
+/-
+/-
+/-
+/-
+/-
+/-
+/-
+/-
50%
51%
54%
5%
4%
6%
Male
Female
Born in the U.S.
Foreign Born
High School or Less
Some College/Vocational School
College Grade
Manhattan
Brooklyn
Bronx
Queens
Staten Island
18-35
36-65
66 and older
OVERALL
Source: Results for subgroups are based on three years of annual Poverty Tracker survey data (2016, 2017, and 2018).
POVERTY TRACKER ANNUAL REPORT 53
APPENDIX B6
Share of Adult New Yorkers who Lived in Poverty in at least One Year between 2015 and 2018
GE
ND
ER
RA
CE
/ E
THN
ICIT
Y
AT LEAST ONE YEAR IN POVERTY
50%
MARGIN OF ERROR
+/- 3%
NAT
IVIT
YA
GE
BO
RO
UG
H
RE
SID
EN
CY
ED
UC
ATIO
N
LEVE
L
White Non-Hispanic
Black Non-Hispanic
Hispanic
+/-
+/-
+/-
29%
59%
68%
4%
6%
5%
+/-
+/-
42%
56%
4%
4%
+/-
+/-
42%
58%
3%
5%
+/-
+/-
+/-
71%
52%
26%
43%
51%
60%
48%
6%
5%
6%
6%
4%
6%
4%
+/-
+/-
+/-
+/-
+/-
+/-
+/-
57%
46%
48%
6%
4%
6%
Male
Female
Born in the U.S.
Foreign Born
High School or Less
Some College/Vocational School
College Grade
Manhattan
Brooklyn
Bronx
Queens
18-35
36-65
66 and older
OVERALL
Source: Annual Poverty Tracker survey data, 2015 to 2018.

POVERTY TRACKER ANNUAL REPORT 54
GE
ND
ER
RA
CE
/ E
THN
ICIT
Y
AT LEAST ONE YEAR IN MATERIAL
HARDSHIP
53%
MARGIN OF ERROR
+/- 3%
NAT
IVIT
YA
GE
BO
RO
UG
H
RE
SID
EN
CY
ED
UC
ATIO
N
LEVE
L
White Non-Hispanic
Black Non-Hispanic
Hispanic
+/-
+/-
+/-
33%
66%
71%
4%
5%
5%
+/-
+/-
45%
60%
4%
4%
+/-
+/-
48%
59%
3%
5%
+/-
+/-
+/-
64%
57%
39%
49%
54%
65%
46%
6%
5%
6%
6%
5%
6%
4%
+/-
+/-
+/-
+/-
+/-
+/-
+/-
61%
56%
35%
6%
4%
6%
Male
Female
Born in the U.S.
Foreign Born
High School or Less
Some College/Vocational School
College Grade
Manhattan
Brooklyn
Bronx
Queens
18-35
36-65
66 and older
OVERALL
Source: Annual Poverty Tracker survey data, 2015 to 2018.
APPENDIX B7
Share of Adult New Yorkers Who Faced Material Hardship in At Least One Year between 2015 and 2018

POVERTY TRACKER ANNUAL REPORT 55
APPENDIX C. Kessler-6 Mental Distress ScaleQ1. DURING THE PAST 30 DAYS, ABOUT HOW OFTEN DID YOU FEEL:
a. …nervous? 1. All of the time2. Most of the time3. Some of the time4. A little of the time5. None of the time
b. …hopeless? 1. All of the time2. Most of the time3. Some of the time4. A little of the time5. None of the time
c. …restless or fidgety? 1. All of the time2. Most of the time3. Some of the time4. A little of the time5. None of the time
d. …so depressed that nothing could cheer you up? 1. All of the time2. Most of the time3. Some of the time4. A little of the time5. None of the time
e. …that everything was an effort? 1. All of the time2. Most of the time3. Some of the time4. A little of the time5. None of the time
f. …worthless? 1. All of the time2. Most of the time3. Some of the time4. A little of the time5. None of the time
POVERTY TRACKER ANNUAL REPORT 56
This report would not be possible without the support and partnership of Robin Hood.
We could not ask for better partners. We are particularly grateful to Sarah Oltmans
for her leadership and guidance of the Poverty Tracker, Jason Cone for bringing policy
expertise to the work, Chloe Sarnoff and Loris Toribio for their great contributions to
this report, and Mary Power for always producing such beautiful layouts and graphics to
represent the Poverty Tracker data. Here at Columbia, we also thank Sarah Tmimi for her
contributions to the analyses featured in this report, as well as Sarah Gordis and
Airenakhue Omoragbon for reviewing and fact-checking drafts of the report. Lastly,
the Poverty Tracker’s data quality is a direct product of the amazing efforts of our
survey team. We are grateful to Lily Bushman-Copp, Chloe Cargill, and Lolita Roy for their
leadership of the survey team, their commitment to the research, and their buoyant
spirits. And we are grateful to all of our amazing interviewers, past and present — we
would not be able to say much without them.

POVERTY TRACKER ANNUAL REPORT 57
826 BROADWAY, 9TH FLOOR NEW YORK, NY 10003
ROBINHOOD.ORG
robinhoodnyc facebook.com/robinhood @RobinHoodNYC