the state of social media in credit unions: opportunities ... · the state of social media in...
TRANSCRIPT

The State of Social Media
in Credit Unions:
Opportunities and Challenges
Beth AustinPrincipal
Crescendo Consulting Group, LLC
Scott GoodSenior Consultant
Crescendo Consulting Group, LLC
ideas grow here
PO Box 2998
Madison, WI 53701-2998
Phone (608) 231-8550
PUBLICATION #234 (3/11)
www.filene.org ISBN 978-1-936468-13-3
The State of Social Media
in Credit Unions:
Opportunities and Challenges
Beth AustinPrincipal
Crescendo Consulting Group, LLC
Scott GoodSenior Consultant
Crescendo Consulting Group, LLC

Copyright © 2011 by Filene Research Institute. All rights reserved.ISBN 978-1-936468-13-3Printed in U.S.A.

Deeply embedded in the credit union tradition is an ongoing
search for better ways to understand and serve credit union
members. Open inquiry, the free flow of ideas, and debate are
essential parts of the true democratic process.
The Filene Research Institute is a 501(c)(3) not-for-profit
research organization dedicated to scientific and thoughtful
analysis about issues affecting the future of consumer finance.
Through independent research and innovation programs the
Institute examines issues vital to the future of credit unions.
Ideas grow through thoughtful and scientific analysis of top-
priority consumer, public policy, and credit union competitive
issues. Researchers are given considerable latitude in their
exploration and studies of these high-priority issues.
The Institute is governed by an Administrative Board made
up of the credit union industry’s top leaders. Research topics
and priorities are set by the Research Council, a select group
of credit union CEOs, and the Filene Research Fellows, a blue
ribbon panel of academic experts. Innovation programs are
developed in part by Filene i3, an assembly of credit union
executives screened for entrepreneurial competencies.
The name of the Institute honors Edward A. Filene, the “father
of the U.S. credit union movement.” Filene was an innova-
tive leader who relied on insightful research and analysis when
encouraging credit union development.
Since its founding in 1989, the Institute has worked with over
one hundred academic institutions and published hundreds of
research studies. The entire research library is available online
at www.filene.org.
Progress is the constant replacing of the best there
is with something still better!
— Edward A. Filene
iii
Filene Research Institute

iv
We would like to acknowledge Jim Kupel and Heidi Wurpel of
Crescendo Consulting Group, LLC, in recognition of the input and
expertise they contributed in the development of this report. We
would also like to thank all the credit unions participating in this
study.
Acknowledgments

v
List of Figures vi
Executive Summary and Commentary ix
About the Authors xi
Chapter 1 Introduction 2
Chapter 2 Measuring Success 8
Chapter 3 From the Front Lines: The Promises and Pitfalls
of Social Media 15
Chapter 4 Panel Members and Survey Participants 19
Chapter 5 Social Media Users—Demographics and Habits 29
Chapter 6 Characteristics of Users and Nonusers
of Social Media 47
Chapter 7 Measurement of Social Media and
Marketing Efforts 52
Chapter 8 Conclusion 57
Endnotes 60
Table of Contents
vi
1. Success by Geography
2. Success by Frequency of Member Surveys
3. Success by Number of Marketing Staff
4. Success by Marketing Activity
5. Success by Hours Spent per Week Managing the Social Media
Program
6. Success by Length of Time Using Social Media
7. Success by How Closely Social Media Goals Are Linked to
Overall Strategic Plan
8. Success by How Actively Staff Is Involved in Promotion
9. Success by Perception of Social Media Constituent
Engagement
10. Distribution of Panel Members by Geography
11. Panel Members by Field of Membership (FOM)
12. Panel Members by Job Title
13. Panel Members by Asset Size
14. Panel Members by Number of Branch Locations
15. Panel Members by Number of Employees
16. Scatterplot Diagram of Loan and Deposit Volume 3Q 2010
17. Loan Volume 3Q 2010
18. Deposit Volume 3Q 2010
19. Scatterplot Diagram of Number of Members
20. Number of Members
21. Scatterplot Diagram of Average Membership Age
22. Average Membership Age
23. Scatterplot Diagram of Average Number of Services per
Member
24. Average Number of Services per Member
25. Frequency of Member Surveys
26. Frequency of Employee Surveys
27. Size of Marketing Budget
28. Number of FTEs on Marketing Staff
29. Use of Outside Marketing Consultants or Resources
30. Brand Update within Last 12 Months
31. New Products Launched (or Repackaged) within Last
12 Months
32. Use of Technology
List of Figures

vii
33. Credit Unions Using Social Media
34. Multiple Channel Usage
35. Messaging Disseminated through Social Media Channels
36. Media Formats of Messaging
37. Usage of Social Media by Channel
38. Length of Time Using Social Media
39. Likelihood of Adding New Social Media Channels in the Next
Three Months
40. Snapshot of Facebook Usage Habits
41. Scatterplot Diagram of Number of Facebook Fans/Likers
42. Number of Facebook Fans/Likers
43. Number of Facebook Posts per Day
44. Number of Posts by Members
45. Use of Multimedia
46. Scatterplot Diagram of Wall Posts
47. Scatterplot Diagram of Facebook Messages Received
48. Facebook Messages Received
49. Snapshot of Twitter Usage Habits
50. Number of Twitter Posts per Day
51. Scatterplot Diagram of Twitter Followers
52. Twitter Followers
53. Scatterplot Diagram of Twitter Mentions
54. Twitter Mentions
55. Scatterplot Diagram of Number of Retweets
56. Number of Retweets
57. Scatterplot Diagram of Number of Direct Messages
58. Number of Direct Messages
59. Scatterplot Diagram of Number of Click-Thrus
60. Number of Click-Thrus
61. Snapshot of Blog Usage Habits
62. Number of Weekly Blog Posts (Frequency; n = 39)
63. Scatterplot Diagram of Reader Comments on Blogs
64. Reader Comments on Blogs
65. Scatterplot Diagram of Number of Blog Visitors
66. Number of Blog Visitors
67. Snapshot of LinkedIn Usage Habits
68. Scatterplot Diagram of Number of LinkedIn Followers
(Frequency)
69. Scatterplot Diagram of Number of LinkedIn Updates

viii
70. Snapshot of Smartphone App Usage Habits
71. Snapshot of YouTube Usage Habits
72. Scatterplot Diagram of Number of YouTube Video Views
(Frequency)
73. Snapshot of Gowalla/Foursquare Usage Habits
74. Snapshot of Podcast Usage Habits
75. Snapshot of Mobile Messaging Habits
76. Person or People Responsible for Managing the Social Media
Program
77. Time per Week Spent Managing the Social Media Program
78. Strategic Components of the Social Media Program
79. Link between Social Media and Overall Marketing Messages
80. Consistency of Messages across Social Media Channels
81. Target Audience—Gender
82. Target Audience—Age
83. Channels through Which Social Media Are Promoted
84. Use of Staff to Promote Social Media
85. Usage of Social Media by Geography
86. Usage of Social Media by Average Age
87. Usage of Social Media by Number
of Members
88. Usage of Social Media by Number of Employees
89. Usage of Social Media by Marketing Budget
90. Marketing Budget Spent on Social Media
91. Barriers to Using Social Media
92. Likelihood to Begin Using Social Media
93. Perceived Success of Social Media Program—Overall
94. Perceived Success of Social Media Program—by Channel
95. Perceived Offline Impact of Social Media Program
96. Quality of Interaction with Followers/Participants
97. Engagement Level of Followers/Participants
98. Success Drivers (Frequency; n = 94)
99. Barriers to Success (n = 103)
100. Scatterplot Diagram of Number of Website Hits
101. Media Coverage
ix
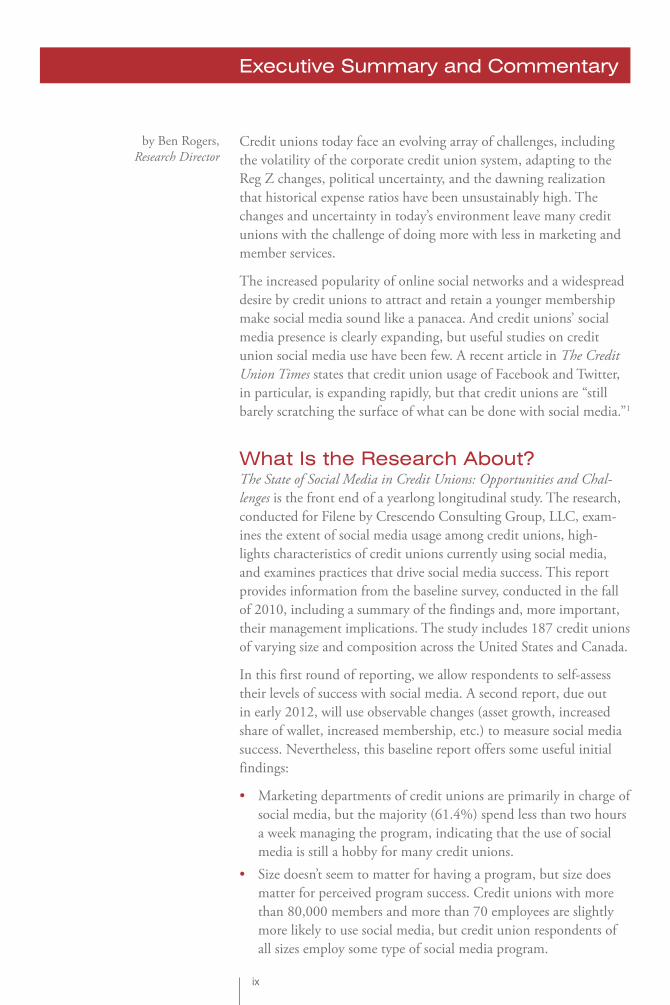
by Ben Rogers,
Research DirectorCredit unions today face an evolving array of challenges, including
the volatility of the corporate credit union system, adapting to the
Reg Z changes, political uncertainty, and the dawning realization
that historical expense ratios have been unsustainably high. The
changes and uncertainty in today’s environment leave many credit
unions with the challenge of doing more with less in marketing and
member services.
The increased popularity of online social networks and a widespread
desire by credit unions to attract and retain a younger membership
make social media sound like a panacea. And credit unions’ social
media presence is clearly expanding, but useful studies on credit
union social media use have been few. A recent article in The Credit
Union Times states that credit union usage of Facebook and Twitter,
in particular, is expanding rapidly, but that credit unions are “still
barely scratching the surface of what can be done with social media.”1
What Is the Research About?The State of Social Media in Credit Unions: Opportunities and Chal-
lenges is the front end of a yearlong longitudinal study. The research,
conducted for Filene by Crescendo Consulting Group, LLC, exam-
ines the extent of social media usage among credit unions, high-
lights characteristics of credit unions currently using social media,
and examines practices that drive social media success. This report
provides information from the baseline survey, conducted in the fall
of 2010, including a summary of the findings and, more important,
their management implications. The study includes 187 credit unions
of varying size and composition across the United States and Canada.
In this first round of reporting, we allow respondents to self-assess
their levels of success with social media. A second report, due out
in early 2012, will use observable changes (asset growth, increased
share of wallet, increased membership, etc.) to measure social media
success. Nevertheless, this baseline report offers some useful initial
findings:
• Marketing departments of credit unions are primarily in charge of
social media, but the majority (61.4%) spend less than two hours
a week managing the program, indicating that the use of social
media is still a hobby for many credit unions.
• Size doesn’t seem to matter for having a program, but size does
matter for perceived program success. Credit unions with more
than 80,000 members and more than 70 employees are slightly
more likely to use social media, but credit union respondents of
all sizes employ some type of social media program.
Executive Summary and Commentary

x
• Good content and attracting followers are the biggest concerns.
These challenges go hand in hand, and they also contribute to the
widespread belief that attracting followers, friends, and connec-
tions should be the end goal of social media.
What Are the Credit Union Implications?The credit unions that report feeling the most success with their
social media campaigns have, without exception, put in the most
work. There is a clear correlation between feeling a social media pro-
gram is successful and dedicating time, resources, and attention to it:
• There’s no substitute for time. Credit unions with more than 10
employees in the marketing department are by far the most likely
to report successful programs. Credit unions that dedicate eight
or more hours per week to social media report the highest success
rates.
• Social media have a symbiotic relationship with otherwise active
credit unions. For example, updating a logo or brand image corre-
sponds with more successful social media campaigns, and launch-
ing five or more new products also corresponds with reported
social media success.
• Social media offer a steep learning curve. As with any business
endeavor, it takes time to get up to speed. Credit unions with
more than two years of experience are the most likely to report
success (57%), while those that have three months or less are least
likely (17%).
• Successful campaigns are purposeful campaigns. Credit unions
that say their social media goals align with the credit union’s stra-
tegic goals report the highest levels of success.
Credit unions either considering or currently using social media
will find in this report an extensive summary of the current state,
a bellwether for their own efforts, and a source of direction for
improvement.

xi
Beth AustinBeth Austin, prin cipal and cofounder of Crescendo Consulting
Group, LLC, has an extensive background in strategy, communica-
tion, and research for credit unions and health-care organizations.
She is a frequent speaker on social media and how they can be
utilized within the health-care and financial industries to accom-
plish organizational goals, improve communication, and foster a
consumer’s ability to make more informed decisions. In 2009–2010,
she led a national social media pilot project that successfully engaged
consumers through a range of electronic channels and promoted
healthy behaviors.
Austin has successfully developed broad-scale communication
campaigns including websites, social media, and traditional media
channels that have led to organizational improvement. She gradu-
ated summa cum laude from the University of Maine with a BA in
English/creative writing and an MA in communication.
Scott GoodScott Good, senior consultant for Crescendo Consulting Group,
LLC, has over 20 years of experience in quantitative and qualitative
marketing research, strategic planning, and business development.
His background includes expertise in various aspects of research,
including primary data collection and analysis, Delphi Techniques,
relational database development, secondary research, meta-analysis,
and qualitative studies. He frequently works with financial ser-
vices, health care, postsecondary education, and not-for-profit
organizations.
Good earned his BA degree in economics from New College and his
MS degree in industrial administration from Carnegie Mellon Uni-
versity. He previously served as an adjunct professor in the University
of Maryland system. He is a frequent public speaker on a variety of
topics, including drivers of customer satisfaction, international busi-
ness development, and consumer product marketing.
About the Authors

The application of social media programs con-tinues to evolve at credit unions. To examine the use of social media, the authors surveyed 187 credit unions on the use and success of social media endeavors.
CHAPTER 1Introduction

3
Purpose and Description of the StudyConsumer usage of social media continues to evolve, and credit
unions are increasingly expanding their online presence to include
social media elements. When implementing social media programs,
credit unions must understand how to develop strategies that will
help them communicate effectively with members and potential
members, foster credit union growth, and build social equity and
awareness. Filene Research Institute retained Crescendo Consulting
Group, LLC, to conduct a yearlong longitudinal social media study
to determine the following:
• How credit unions are currently utilizing social media.
• How credit unions characterize their social media usage and per-
ceive program success.
• The correlative factors associated with program success (integra-
tion with current marketing objectives, dedicated resources, etc.).
• The impact of social media on credit union performance (prod-
ucts per member, membership growth, etc.).
This baseline report provides information on the quantity and
characteristics of the research panel participants, the penetration and
nature of social media usage, and the characteristics of both users and
nonusers of social media.
MethodologyTo conduct this study, Filene and Crescendo did—and, in certain
aspects, will continue to do—the following:
• Recruited a social media panel from the Filene database of
credit unions. The goal was to recruit between 100 and 300
credit unions to participate in the research. Participation entails
completion of a baseline survey (which took about 30 minutes)
and three shorter quarterly surveys.
• Determined metrics and developed survey instruments. Cre-
scendo worked with Filene to develop a focused list of metrics

4
and research hypotheses. From this list, Crescendo developed and
will continue to develop insightful survey instruments to identify
longitudinal trends.
• Administered surveys. Panel participants will take part in
quarterly surveys about their marketing initiatives (social media
and otherwise) and select financial metrics that may be affected
by impactful marketing programs. The first survey established a
benchmark, and subsequent quarterly surveys will provide a more
focused understanding of trends and the impact of social media.
• Quantitatively analyzed results/drafted reports. Crescendo pro-
duced this substantive report at the conclusion of the first survey
(benchmark report) and will produce another at the conclusion of
the fourth survey (final report). Shorter reports will be provided
following the quarterly surveys to highlight key trends.
Crescendo worked with Filene to develop a set of baseline metrics
and research assumptions. From these discussions, Crescendo devel-
oped an online survey tool designed to capture the desired informa-
tion. Participants for the social media panel were recruited primarily
through an e-mail request sent by Filene to all members and sub-
sidized by the dissemination of press releases (by both Filene and
Crescendo) and direct outreach. Through these methods, 327 credit
unions signed up to be part of the research panel.
Crescendo sent an e-mail invitation in September 2010 to all credit
unions on the research panel announcing the baseline survey. Partici-
pants were asked to complete the survey within three weeks. At the
end of three weeks, telephone and e-mail outreach was conducted
to reach out to all nonresponders, and the deadline for participation
was extended. Ultimately, 187 credit unions completed the base-
line survey. This number of respondents yields a margin of error of
+/– 7.3% at the 95% confidence interval.
Participant CharacteristicsThe majority (75.7%) of credit unions in this study use social
media, with a large percentage of the majority (72%) utilizing
more than one channel. These credit unions most commonly use
Facebook (66.3%), Twitter (43.9%), and blogs (20.9%), which is
consistent with national consumer trends.
The research panel was not randomized and therefore was more
likely to have attracted those who use or are interested in social
media. However, the responses suggest that there is a growing seg-
ment of “power users” that have a robust multichannel social media
program in place. With respect to specific channel usage, a recent
study suggests that consumers do engage in conversations about

5
financial institutions through social media channels and that Twit-
ter is the most common channel through which to do so.2 Observ-
ing how these trends develop and how channel usage by the panel
changes over the course of the study will be of interest.
Panel participants communicate a wide variety of messages
through social media channels, including credit union events
(66.3%), information to help members make better financial
choices (57.8%), and alerts/information (52.9%).
Two important keys to success in any social media program include
providing content that is of value and “listening” more than “talk-
ing,” which, if done effectively, could be accomplished in each credit
union’s three most common message areas. This will be a particularly
interesting measure to track over the course of the study to determine
whether credit unions continue the positive trend of not using these
channels exclusively for self-promotion.
The individual credit unions have a range of experience with
social media, with just 10.5% of respondents using social media
for more than two years and 13.5% having begun their social
media program in the last three months. More than one-third
(39.1%) say that they are “very likely” to add additional social
media channels in the next three months.
These findings suggest that there is a core group of early adopters
and that credit unions are actively joining the social media ranks.
The results of the baseline survey clearly demonstrate that credit
unions are using social media in diverse ways, as reflected by
an extremely broad spectrum of posting activity, followers, and
interaction.
Credit unions are using social media to varying degrees and have
widely divergent levels of activity in the social media space. Continu-
ing to discover underlying trends and correlative characteristics (e.g.,
size, length of time using social media) with regard to usage patterns
will be important as the study evolves.
Integration with Marketing and StrategyMarketing departments create and manage the social media
programs at most credit unions (82.8%), typically with one indi-
vidual holding the primary responsibility. The majority (61.4%)
spend less than two hours a week managing the program.

6
The resources and time required for successfully managing a social
media program vary among industries and organizations; however,
the responses provided here are consistent with work and research in
similar industries.
Many credit unions participating in the survey do not engage in
core strategic elements that are associated with successful tradi-
tional marketing programs: Just over one-third (38%) ensure that
social media goals are linked to credit union goals, only 30% had
a strategy prior to launch, and only 12.8% train the staff respon-
sible for managing and executing the program.
The general lack of participation in these key activities puts credit
unions at risk of disseminating inconsistent or contradictory mes-
sages, compromising brand management, and engaging in efforts
that are counterproductive to the organization’s overall strategic
efforts. Observing the evolution of these behaviors over time will
indicate whether the social media programs become more deliber-
ately aligned with overall strategic goals.
Respondents use a variety of methods to market their social
media programs, including their websites (65.2%), mentions in
print advertising (51.9%), and word of mouth (51.3%).
Interestingly, credit unions currently do not engage staff to boost
their word-of-mouth efforts; more than three-quarters of respon-
dents (78%) say that staff is “not very actively” or “not at all actively”
involved in promoting the social media sites. This may be an
untapped resource for driving followers to the credit unions’ social
media microsites.
Overa ll, size does not appear to be a barrier to entry for many
credit unions.
Credit unions with more than 80,000 members and more than
70 employees are slightly more likely to be currently engaged in
social media efforts, but credit unions of all sizes included in this
study currently employ some type of social media program.
Credit unions using social media are more likely to participate in
very specific types of marketing efforts (website ads and outdoor
advertising) and to have an average age of membership that is
younger than the overall mean.
The baseline study was not designed to uncover predictive elements,
and therefore, the exact relationship among these characteristics can-
not be determined. However, future studies should possibly be struc-
tured to more closely analyze the relationship between these relatively
7
unique marketing efforts and social media usage, and whether the
use of social media leads to a younger membership base or vice versa.
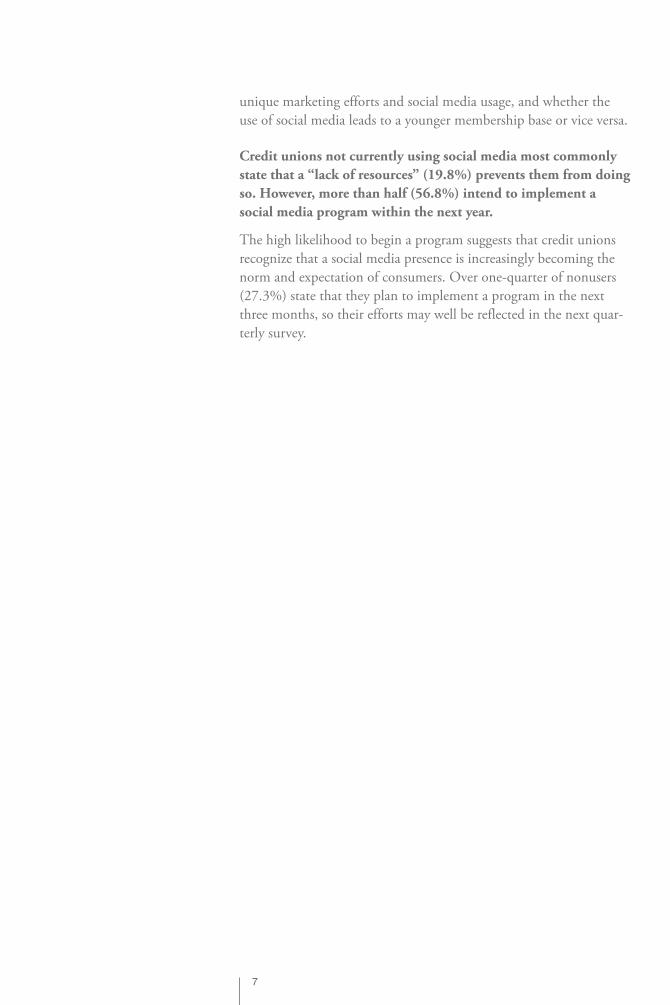
Credit unions not currently using social media most commonly
state that a “lack of resources” (19.8%) prevents them from doing
so. However, more than half (56.8%) intend to implement a
social media program within the next year.
The high likelihood to begin a program suggests that credit unions
recognize that a social media presence is increasingly becoming the
norm and expectation of consumers. Over one-quarter of nonusers
(27.3%) state that they plan to implement a program in the next
three months, so their efforts may well be reflected in the next quar-
terly survey.

The survey evaluated credit unions’ impact or influence on their community, level of par-ticipation, and engagement of website visi-tors. Additionally, the number of hours spent managing social media, geography, and staff involvement was cross evaluated to gauge success.
CHAPTER 2Measuring Success

9
The ParticipantsParticipants are reticent to characterize their overall social media
efforts as successful (61.5% describe them as “neither success-
ful nor unsuccessful”) but more strongly assert achievement
with specific channels, such as smartphone applications. While
relatively few participants use smartphone applications, 65% of
respondents consider them successful, along with blogs (42.5%).
Although not explicitly asked in this study, other data would sug-
gest that experience, knowledge levels, and higher overall use by the
general population are likely factors that contribute to the higher
perceived success with these channels. As credit unions gain more
experience with less familiar channels—and as usage demographics
continue to evolve—perceived success may also increase.
Survey participants are very likely to feel that their social media
programs have had offline success: 44.4% feel that they have had
an impact on their community, and 23% feel that they have influ-
enced social responsibility.
In addition to the impacts mentioned above, 19.3% state that their
social media programs have had a “downstream” impact; i.e., an
element of their program has gone viral or has been redistributed
in some other form. These results further suggest that many credit
unions have created successful program elements.
Respondents generally feel that visitors to their social media
sites are either “slightly engaged” (38.9%) or “somewhat pas-
sive” (23.7%), and about one-fourth (25.7%) say that they have
received no feedback from members regarding their social media
presence. However, the largest percentage (39.4%) of respondents
also state that the interaction they have with visitors on social
media sites is of “good” quality.

10
Responses regarding the engagement levels of followers and fans
suggest that interaction is relatively low but reflects overall online
behavior research, which estimates that 80% of social media users are
“passive.” The fact that the interaction that does take place is gener-
ally constructive suggests a positive trend.
Those using social media state that content development is a
primary challenge in their programs.
Uncertainty about “what to say” is a common barrier to social media
expansion and development across all industries. Concern in this
area is well justified, since providing content of value is imperative in
attracting and retaining followers.
Credit unions frequently state that contests or promotions are the
biggest generators of fans and followers.
In this open-ended question, the wide range of specific examples of
promotions that credit unions have utilized to generate interest in
their social media presence demonstrates a great deal of creativity and
commitment to making the programs successful.
Correlations with Perceived SuccessFurther analysis of the credit unions that feel the social media pro-
gram overall is “successful” or “very successful” suggests that there
are several correlations between specific characteristics/activities and
perceived success.3 Credit unions that feel their programs are “suc-
cessful” or “very successful” are somewhat more likely to:
• Conduct member surveys two, three, or four times a year.
• Have a larger marketing staff with more marketing activity (e.g.,
update their brand image and launch new products).
• Spend more time per week managing the social media program.
• Have been utilizing social media longer.
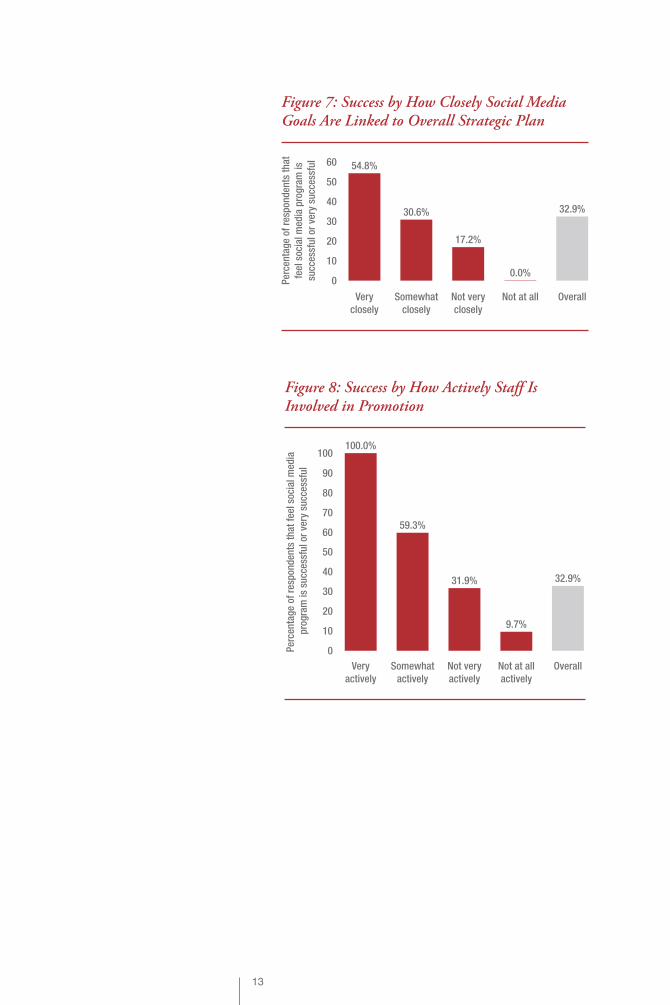
• Connect their social media program to their overall strategic plan.
• Engage staff in promoting the social media program.
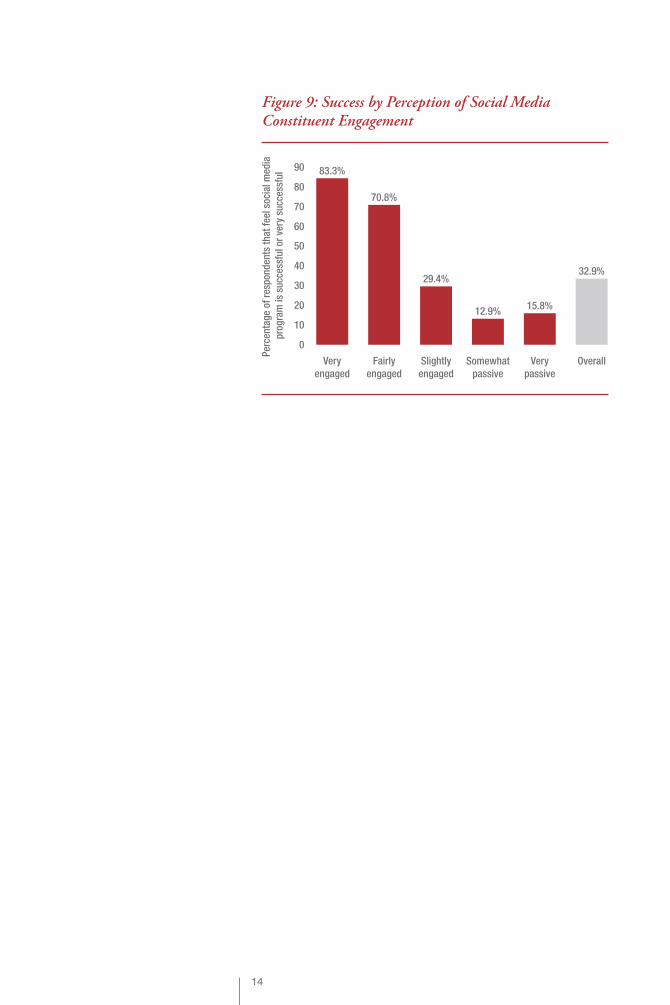
• Feel that their social media constituents are engaged.
• Be located in Canada.

11
30
0
20
10
60
50
40
90
80
70
83.3%
Canada
46.2%
Midwest
Per
cen
tag
e of
res
pon
den
ts t
hat
fee
l soc
ial m
edia
pro
gra
m is
su
cces
sfu
l or
very
su
cces
sfu
l
33.3%
Mid-
AtlanticSoutheast
17.6%
Overall
32.9%28.0%
West
25.0%
New England
23.1%
Pacific
Northwest
Figure 1: Success by Geography
Per
cen
tag
e of
res
pon
den
ts t
hat
fee
l soc
ial m
edia
pro
gra
m is
su
cces
sfu
l or
very
su
cces
sfu
l
14.3%
<1 1–2
24.0%
3–5
32.6%
6–8
42.1%
9–10
54.5%
>10
80.0%
Overall
32.9%
0
30
20
10
40
50
80
70
60
90
Figure 3: Success by Number of Marketing Staff
Per
cen
tag
e of
res
pon
den
ts t
hat
feel
soc
ial m
edia
pro
gra
m is
succ
essf
ul o
r ve
ry s
ucc
essf
ul
0
30
20
10
60
50
40
Never
20.0%
Overall
32.9%
0.5%
More
often than
monthly
24.3%
Monthly
40.0%
Quarterly
53.8%
2–3 times
per year
33.3%
Annually
27.0%
Less than
annually
Figure 2: Success by Frequency of Member Surveys

12
Per
cen
tag
e of
res
pon
den
ts t
hat
feel
soc
ial m
edia
pro
gra
m is
succ
essf
ul o
r ve
ry s
ucc
essf
ul
0
30
20
10
45.5%
Updated
logo or
brand
image
Launched
0 products
0.0%
Launched
1 product
12.5%
Launched
2–3
products
24.1%
Launched
4–5
products
40.0%50
40
Launched
>5
products
44.7%
Overall
32.9%
Figure 4: Success by Marketing Activity
0
30
20
10
40
50
80
70
60
90
7.4%
<1
hr/wk
1–2
hrs/wk
20.4%
3–5
hrs/wk
48.1%
6–8
hrs/wk
66.7%
>8
hrs/wk
88.9%
Overall
32.9%
Per
cen
tag
e of
res
pon
den
ts t
hat
fee
l soc
ial m
edia
pro
gra
m is
su
cces
sfu
l or
very
su
cces
sfu
l
Figure 5: Success by Hours Spent per Week Managing the Social Media Program
0
30
20
10
16.7%
Overall
21.1%
36.1%32.3%
54.5%60
50
40
57.1%
32.9%
Less than
3 months
3–6
months
7–12
months
13–18
months
19–24
months
More than
24 months
Per
cen
tag
e of
res
pon
den
ts t
hat
feel
soc
ial m
edia
pro
gra
m is
succ
essf
ul o
r ve
ry s
ucc
essf
ul
Figure 6: Success by Length of Time Using Social Media
13
100.0%
Very
actively
Somewhat
actively
59.3%
Not very
actively
31.9%
Not at all
actively
9.7%
Overall
32.9%
0
30
20
10
40
50
80
70
60
90
100
Per
cen
tag
e of
res
pon
den
ts t
hat
fee
l soc
ial m
edia
pro
gra
m is
su
cces
sfu
l or
very
su
cces
sfu
l
Figure 8: Success by How Actively Staff Is Involved in Promotion
0
30
20
10
40
50
60 54.8%
Very
closely
Somewhat
closely
30.6%
Not very
closely
17.2%
Not at all
0.0%
Overall
32.9%
Per
cen
tag
e of
res
pon
den
ts t
hat
feel
soc
ial m
edia
pro
gra
m is
succ
essf
ul o
r ve
ry s
ucc
essf
ul
Figure 7: Success by How Closely Social Media Goals Are Linked to Overall Strategic Plan
14
0
30
20
10
40
50
80
70
60
90 83.3%
Very
engaged
Fairly
engaged
70.8%
Slightly
engaged
29.4%
Somewhat
passive
12.9%
Very
passive
15.8%
Overall
32.9%P
erce
nta
ge
of r
esp
ond
ents
th
at f
eel s
ocia
l med
ia
pro
gra
m is
su
cces
sfu
l or
very
su
cces
sfu
l
Figure 9: Success by Perception of Social Media Constituent Engagement
In an open-ended question, respondents were asked to identify what they believe to be the biggest drivers of success with their social media programs; their comments are given here. Man-agement support, staff engagement, overall strategic goals, content, and promotions were all evaluated.
CHAPTER 3From the Front Lines:
The Promises and Pitfalls of Social Media

16
Management Support and Staff Engagement• Having a young, e-savvy person responsible for content and
graphics and connecting Facebook to other media efforts and
programs.
• Acceptance from the top down of social media as a relevant tool
to engage members.
• Empowered employees on our “Social Media Team.”
• Not letting compliance dictate the rules. Too often in the FI
space, compliance drives social media. Beyond this though, I’d
have to say the biggest driver has been executive support and
understanding of the value associated with us being involved in
social media.
• The support and enthusiasm from the executive staff has fueled
our social media success.
Link to Overall Strategic Goals• Aligning it to the overall strategies and plans with different
campaigns.
• I believe our biggest driver of success with our social media efforts
has been the personification of our brand. I have personally been
able to provide feedback, advice and assistance to members who
have been in need or frustrated. They have in turn become loyal
fans of ours spreading the word to their families and friends on
the public timeline of social media.
• We have developed social media campaigns which are highly
integrated into our overall marketing strategies. Our goal was for
these social media activities to be highly engaging, particularly
following the adage of quality of engagement before quantity.
17
Content• Casual and personal comments and status updates spoken in the
first person, adapting to the target audiences’ textuality. This cre-
ates an artificial but actual “character” with which the members
can associate, converse, and provide “real” feedback.
• Regular posts and posting information that is informative and
about the community. We don’t just post product information.
• We don’t push product or resort to carrot on a stick tactics to get
people engaged. We want to offer relevance and I think that is
appreciated by those who choose to follow.
Promotion• During a two-month period, we offered a drawing of $500 on
our Facebook page to all who were fans at the end of the period.
We gained over 700 new fans and received over 30 comments
from fans.
• Employee incentive when Facebook page was first launched
helped to grow fan base.
• Weekly give aways for friends only.
• Several small promotions that we have offered only to Facebook
followers.
• We are currently doing a Give Back campaign in our communi-
ties. We have been going out and doing random acts of kindness
such as paying for someone’s groceries, or gas, or just buying
them lunch. We post teasers of where the “Give Back Team” will
be, and then videos, and photos doing the Give Back. That’s
been our biggest success with getting people to interact with us
through social media.
• We ran a fan growth campaign where we gave away several gift
cards based on the # of new fans we received in a month. We
grew from roughly 300 fans to 1,000 during the campaign.
• We recently did a gift card offer to acquire more fans/followers.
Respondents were also asked to specify what they feel are the biggest
barriers to success. Many of the comments in this area are the con-
verse of those for “success” (e.g., they feel they haven’t done enough
promotion or the right kind of promotion). Below are a sample of
the comments received.

18
Lack of Management Support and Staff Engagement• Employees are blocked from social media sites on the company
server. I feel that this limits employees to promoting/learning
about our social media efforts.
• Lack of employee engagement and skepticism of senior
management.
• Dedicating the resources (man power).
• I think we would achieve much greater success if we put more
time and budget focused at [these channels]. With only 2 individ-
uals in the department, this is usually not a priority when faced
with other projects.
Lack of Strategy• We do not have a formal social media strategy, nor do we have the
staff time to devote to utilizing social media as we would like to.
• We have not dedicated our time to integrating our social media
strategy with our marketing strategy. We have a presence, but
not a plan. The barriers are internal. We did not take the time to
integrate the channel into our efforts and form a plan. We’ll do
that for 2011.
• Inability to get a good measurement of the success.
• Lack of a plan/strategy.
Difficulty Generating Content• Biggest barrier is creating discussion topics to get the fans
speaking.
• Insufficient material for unique, entertaining non-product related
posts.
Lack of Successful Promotion• Getting the message out.
• Our biggest barrier is just engaging our audience. Our mem-
bers don’t seem to want to respond to posts. Contests including
submitting pictures have been our most successful way to get
people involved. Simply posting financial information, or tips, etc
doesn’t get any response from our members.
• While we had gained tremendous momentum during the initial
launch of our campaign (e.g. 7,500 Facebook likes and 23,000
Facebook tags in the first 24 hours), maintaining this momentum
and maintaining consumers’ interest has been challenging.

Over the course of five weeks, 187 credit unions completed the baseline social media survey. A good cross section of credit unions was obtained. Geography, size, marketing efforts, and technol-ogy use of the participants in the baseline sur-vey were evaluated.
CHAPTER 4Panel Members and Survey Participants
20
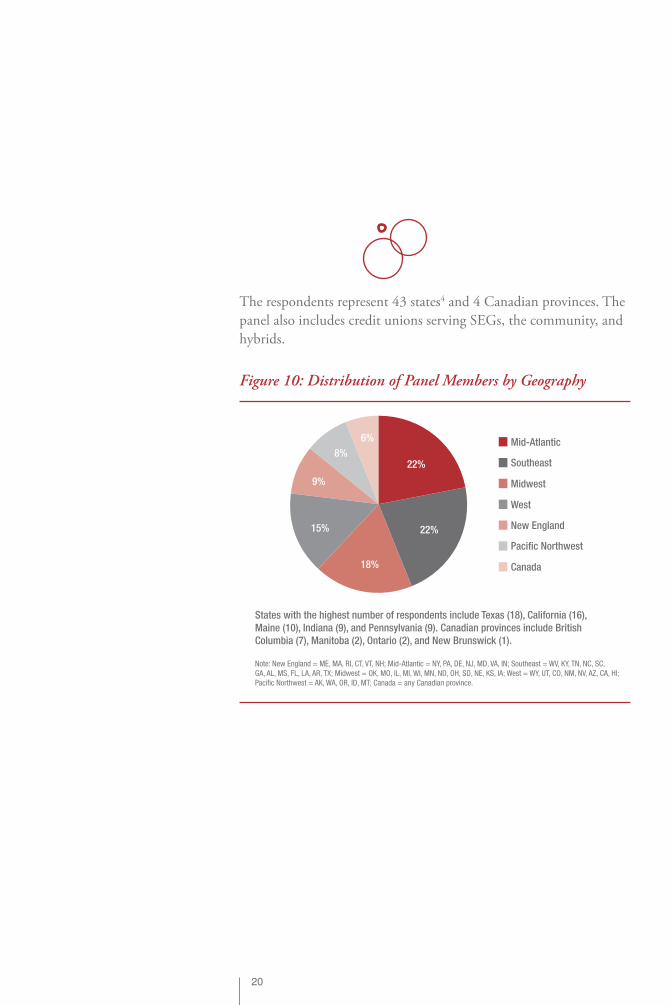
The respondents represent 43 states4 and 4 Canadian provinces. The
panel also includes credit unions serving SEGs, the community, and
hybrids.
Mid-Atlantic
Southeast
Midwest
West
New England
Pacific Northwest
Canada
22%
22%
18%
15%
6%
8%
9%
States with the highest number of respondents include Texas (18), California (16),
Maine (10), Indiana (9), and Pennsylvania (9). Canadian provinces include British
Columbia (7), Manitoba (2), Ontario (2), and New Brunswick (1).
Note: New England = ME, MA, RI, CT, VT, NH; Mid-Atlantic = NY, PA, DE, NJ, MD, VA, IN; Southeast = WV, KY, TN, NC, SC,
GA, AL, MS, FL, LA, AR, TX; Midwest = OK, MO, IL, MI, WI, MN, ND, OH, SD, NE, KS, IA; West = WY, UT, CO, NM, NV, AZ, CA, HI;
Pacific Northwest = AK, WA, OR, ID, MT; Canada = any Canadian province.
Figure 10: Distribution of Panel Members by Geography
21
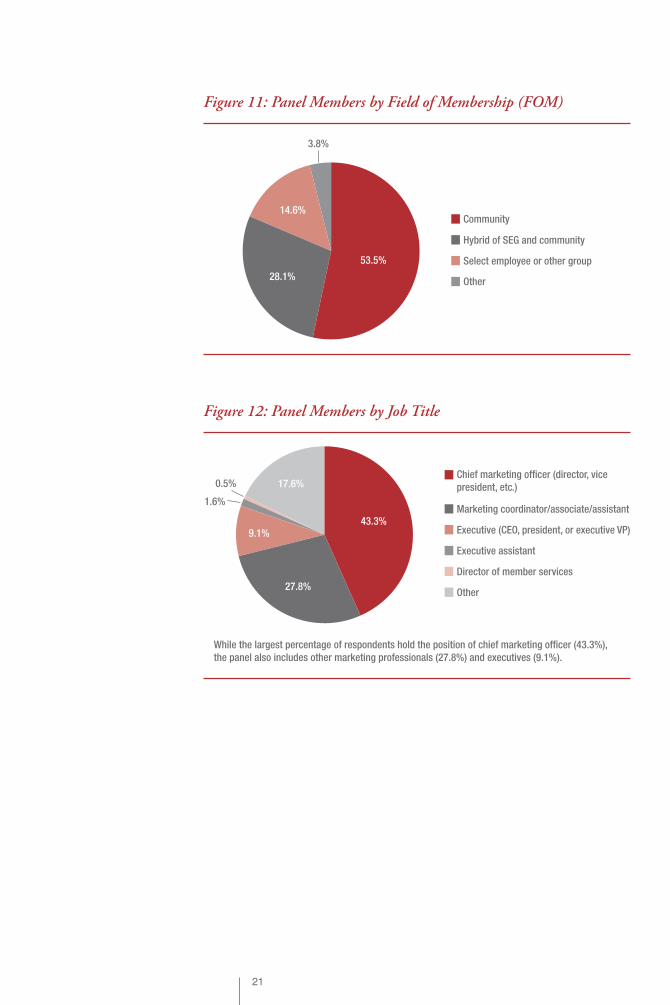
Community
Hybrid of SEG and community
Select employee or other group
Other
53.5%
28.1%
14.6%
3.8%
Figure 11: Panel Members by Field of Membership (FOM)
Chief marketing officer (director, vice
president, etc.)
Marketing coordinator/associate/assistant
Executive (CEO, president, or executive VP)
Executive assistant
Director of member services
Other
43.3%
27.8%
17.6%0.5%
9.1%
1.6%
While the largest percentage of respondents hold the position of chief marketing officer (43.3%),
the panel also includes other marketing professionals (27.8%) and executives (9.1%).
Figure 12: Panel Members by Job Title
22
1
2–3
4–5
More than 5
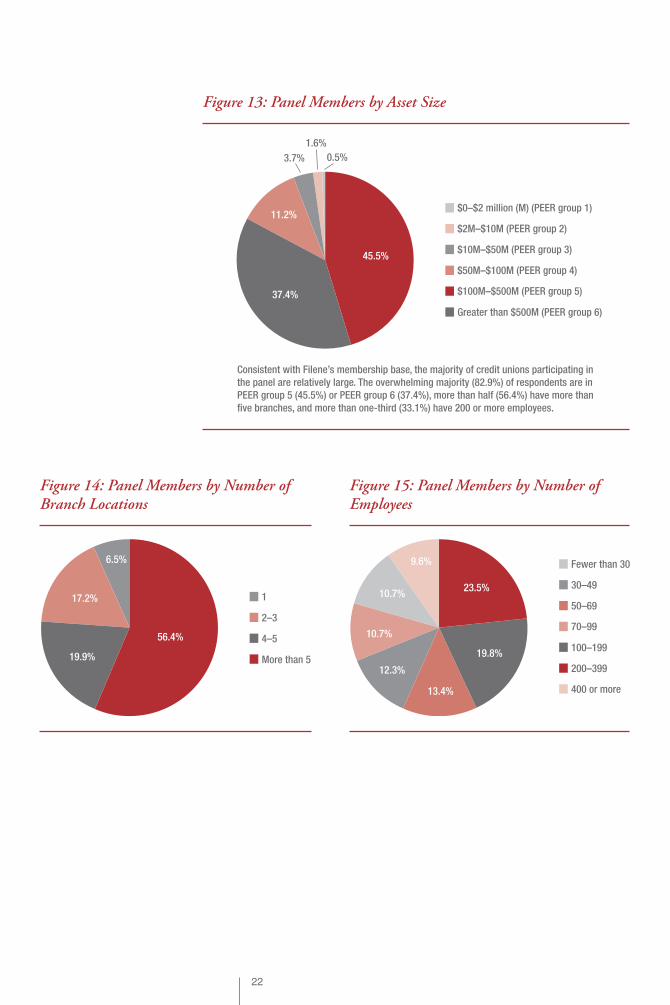
56.4%
19.9%
17.2%
6.5%
Figure 14: Panel Members by Number of Branch Locations
Fewer than 30
30–49
50–69
70–99
100–199
200–399
400 or more
23.5%
19.8%
13.4%
12.3%
9.6%
10.7%
10.7%
Figure 15: Panel Members by Number of Employees
$0–$2 million (M) (PEER group 1)
$2M–$10M (PEER group 2)
$10M–$50M (PEER group 3)
$50M–$100M (PEER group 4)
$100M–$500M (PEER group 5)
Greater than $500M (PEER group 6)
45.5%
37.4%
3.7% 0.5%
11.2%
1.6%
Consistent with Filene’s membership base, the majority of credit unions participating in
the panel are relatively large. The overwhelming majority (82.9%) of respondents are in
PEER group 5 (45.5%) or PEER group 6 (37.4%), more than half (56.4%) have more than
five branches, and more than one-third (33.1%) have 200 or more employees.
Figure 13: Panel Members by Asset Size

23
Due to the broad range in nature and size of the credit unions participating in the panel
survey, loan and share/deposit volumes cover a large spectrum.
Note: One outlier with loan volumes exceeding $28 billion (B) was intentionally omitted for ease of chart viewing.
Shares and deposits Loans
$0
$6 billion
$4 billion
$2 billionVo
lum
e of
loan
s/d
epos
its
$8 billion
$10 billion
$12 billion
Figure 16: Scatterplot Diagram of Loan and Deposit Volume 3Q 2010
0%
30%
20%
10%
0%
60%
50%
40%
80%
70%
The median loan volume is $203,901,546; the mean is $412,817,265.
>$3B–
$3.5B
1.1%
>$3.5B
0.5%
70.5%
$0–$500M
18.0%
>$500M–
$1B
6.0%
>$1B–
$1.5B
2.2%
>$1.5B–
$2B
0.5%
>$2B–
$2.5B
1.1%
>$2.5B–
$3B
Figure 17: Loan Volume 3Q 2010
0%
30%
20%
10%
64.8%
$0–$500M >$500M–
$1B
20.9%
>$1B–
$1.5B
7.7%
>$1.5B–
$2B
2.2%
>$2B–
$2.5B
0.5%
0%
60%
50%
70%
40%
>$2.5B–
$3B
1.6%
>$3B–
$3.5B
0.5%
>$4B–
$4.5B
0.5%
>$4.5B
1.1%
Figure 18: Deposit Volume 3Q 2010

24
Membership Information
Total membership varies quite significantly by institution.
Nu
mb
er o
f m
emb
ers
0
150,000
100,000
50,000
200,000
250,000
300,000
350,000
400,000
Figure 19: Scatterplot Diagram of Number of Members
0%
The number of members ranges from 1,783 to 350,637. The median number of members is 36,630, and the mean is 55,683.
30%
20%
10%
12.9%
0–9,
999
10,0
00–1
9,99
9
20,0
00–2
9,99
9
30,0
00–3
9,99
9
40,0
00–4
9,99
9
50,0
00–5
9,99
9
60,0
00–6
9,99
9
70,0
00–7
9,99
9
80,0
00–8
9,99
9
90,0
00–9
9,99
9
100,
000–
109,
999
110,
000–
119,
999
120,
000–
129,
999
130,
000–
139,
999
140,
000–
149,
999
150,
000–
159,
999
190,
000–
199,
999
200,
000–
209,
999
220,
000–
229,
999
250,
000–
259,
999
320,
000–
329,
999
350,
000+
20.4%
12.4%
2.7% 1.1% 0.5%3.8%
0.5% 0.5%
7.5%
2.2%6.5%
2.2%7.0%
1.6%
7.5%
1.6% 1.1%1.6% 1.6%4.3%0.5%
Figure 20: Number of Members
The average age of the credit union members is approximately
45 years. Members are likely to use between 2.7 and 3 services.
Ave
rag
e m
emb
ersh
ip a
ge
0
30
20
10
40
50
60
70
Figure 21: Scatterplot Diagram of Average Membership Age

25
0%
30%
20%
10%
0%
50%
40%
The average age ranges from 21 to 59.7. The median age is 45.00, and the mean age is 44.93.
50–54
8.9%
55–59
4.7%0.6%
<25
0.6%
25–29
1.2%
30–34
7.7%
35–39
34.3%
40–44
42.0%
45–49
Figure 22: Average Membership Age
Note: Two responses of 21.00 and 450.00 were intentionally omitted from the diagram.
0
3
2
1
4
5
6
7
8
Ave
rag
e n
um
ber
of
serv
ices
per
mem
ber
Figure 23: Scatterplot Diagram of Average Number of Services per Member
0%
30%
20%
10%
The average number of services per member ranges from 1.5 to 8.0. The median number of services per member
is 2.71, and the mean is 2.96.
0%
50%
40%
9.2%
1–1.99 2–2.99
48.0%
3–3.99
24.9%
4–4.99
8.1%
5–5.99
2.9%
6–6.99
4.0%
7–7.99
0.6%
8–8.99
0.6%
9+
1.7%
Figure 24: Average Number of Services per Member

26
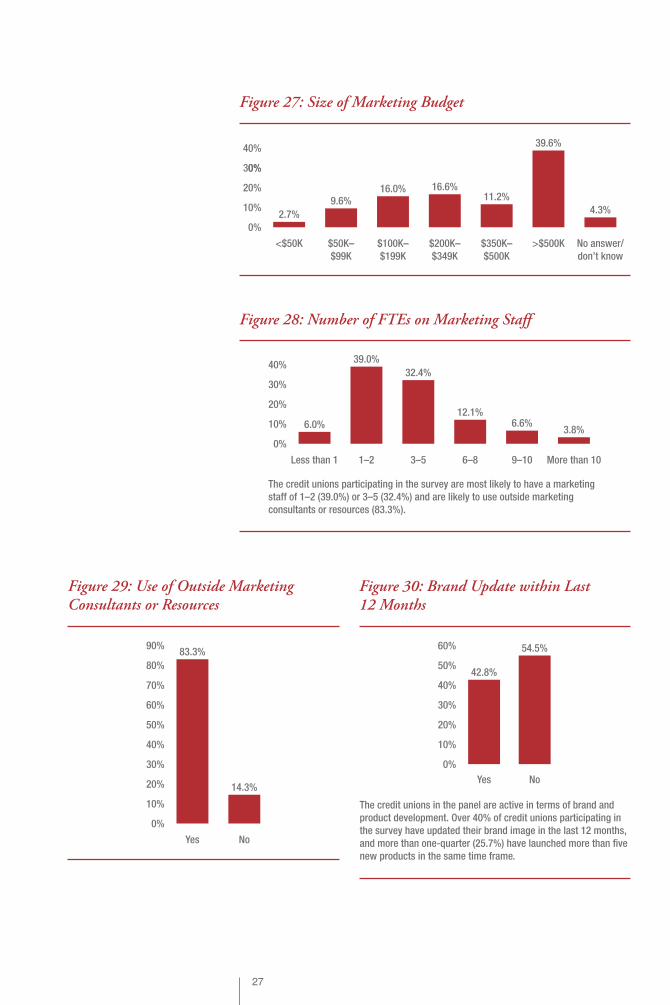
Use of Marketing and TechnologyNearly 40% of survey respondents have an annual marketing budget
in excess of $500,000, of which the largest percentage is likely to be
allocated to community events, print advertising, and/or direct mail.
• Respondents are most likely to have no budget allocated for TV
advertising (38.7%) and social media (50.9%).
• Generally speaking, respondents are unlikely to spend more than
20% of their marketing budget in any one category. Exceptions
include community events, in which 23.1% of respondents spend
21% or more of their marketing budget, print advertising (31%
of budget), outdoor advertising (37.4% of budget), and direct
mail (25.8% of budget).
0%
30%
20%
10%
About two-thirds of respondents conduct member satisfaction surveys at least annually
(67.2%), and about 59% conduct employee satisfaction surveys at least annually.
27.4%
Less than
annually
Monthly
24.7%
Annually
15.6%
More
often than
monthly
11.8%
2–3 times
per year
9.1%
Quarterly
5.9%
Never
5.4%
Figure 25: Frequency of Member Surveys
0%
20%
10%
39.0%
AnnuallyLess than
annually
27.8%
Never
13.4%
2–3 times
per year
8.0%
Quarterly
7.0%
30%
40%
More
often than
monthly
2.1%
Monthly
2.1%
Figure 26: Frequency of Employee Surveys
27
0%
30%
20%
10%
39.6%
>$500K$200K–
$349K
16.6%
$100K–
$199K
16.0%
$350K–
$500K
11.2%
$50K–
$99K
9.6%
0%
40%
No answer/
don’t know
4.3%
<$50K
2.7%
Figure 27: Size of Marketing Budget
0%
30%
20%
10%
40%
6.0%
Less than 1 1–2
39.0%
3–5
32.4%
The credit unions participating in the survey are most likely to have a marketing
staff of 1–2 (39.0%) or 3–5 (32.4%) and are likely to use outside marketing
consultants or resources (83.3%).
6–8
12.1%
9–10
6.6%
More than 10
3.8%
Figure 28: Number of FTEs on Marketing Staff
Yes
83.3%
14.3%
No
0%
30%
20%
10%
40%
50%
60%
80%
90%
70%
Figure 29: Use of Outside Marketing Consultants or Resources
Yes
42.8%
54.5%
No
0%
30%
20%
10%
40%
50%
60%
The credit unions in the panel are active in terms of brand and
product development. Over 40% of credit unions participating in
the survey have updated their brand image in the last 12 months,
and more than one-quarter (25.7%) have launched more than five
new products in the same time frame.
Figure 30: Brand Update within Last 12 Months

28
0%
30%
20%
10%
40%
50%
2.1%
0 1
6.4%
2–3
40.6%
4–5
20.3%
More than 5
25.7%
Other
1.1%
Figure 31: New Products Launched (or Repackaged) within Last 12 Months
The credit unions vary in terms of their use of technology. Nearly all credit unions offer online
banking (96.3%) and online bill pay (94.1%), and more than half (55.6%) offer mobile banking.
More than half also report using some sort of marketing customer information file (MCIF) or
customer relationship management (CRM) software (56.7%).
96.3%
Online
banking
Online
bill pay
94.1%
MCIF/CRM
software
56.7%
Mobile
banking
55.6%
PFM
software
26.7%
Remote
capture
23.5%
Other
10.2%
0%
60%
40%
20%
100%
80%
50%
30%
10%
90%
70%
Figure 32: Use of Technology

To examine social media usage and behaviors among credit unions, the majority of the ques-tions in the baseline survey probed participants on the types of social media they use and how they use them.
CHAPTER 5Social Media Users—
Demographics and Habits

30
Social Media UsageApproximately three-quarters (75.7%) of the baseline respon-
dents currently use some form of social media, with almost three-
quarters (72%) of those users utilizing multiple channels.
Note: It was the intent of the survey to attract both users and nonusers of social media,
with the knowledge that credit unions currently using social media would likely be more
predisposed to participating in the study.
Yes
75.7%
24.3%
No
0%
30%
20%
10%
40%
50%
60%
80%
70%
Figure 33: Credit Unions Using Social Media
0%
30%
20%
10%
0%
40%
28%
1
33%
2
16%
3
11%
4
7%
5
5%
6
Figure 34: Multiple Channel Usage
31
0%
30%
20%
10%
0%
60%
50%
70%
40%
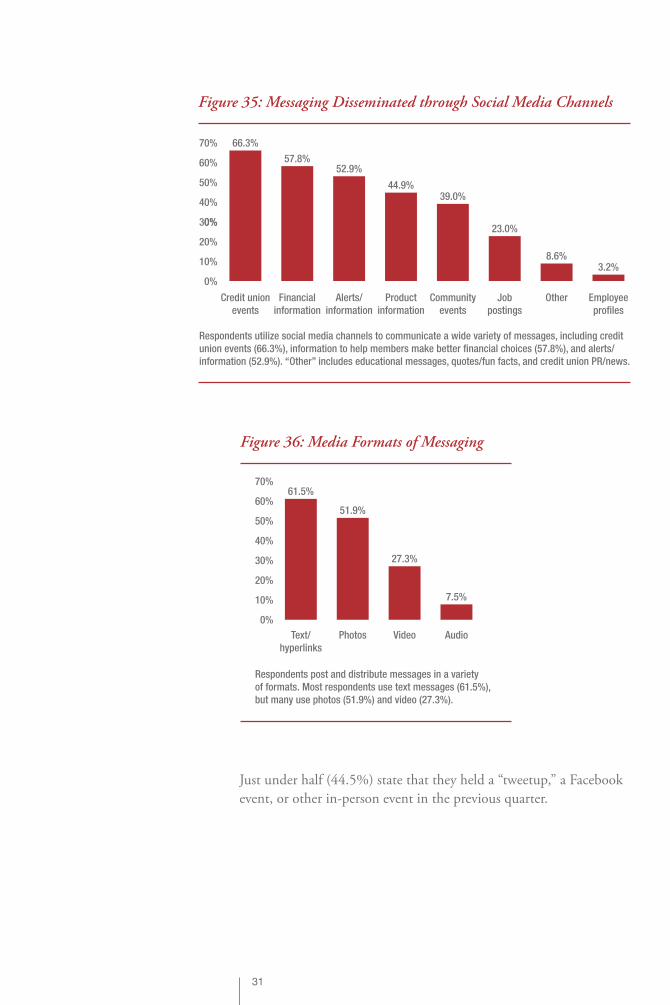
Respondents utilize social media channels to communicate a wide variety of messages, including credit
union events (66.3%), information to help members make better financial choices (57.8%), and alerts/
information (52.9%). “Other” includes educational messages, quotes/fun facts, and credit union PR/news.
Other
8.6%
Employee
profiles
3.2%
66.3%
Credit union
events
57.8%
Financial
information
52.9%
Alerts/
information
44.9%
Product
information
39.0%
Community
events
23.0%
Job
postings
Figure 35: Messaging Disseminated through Social Media Channels
0%
30%
20%
10%
40%
50%
60%
70%
Respondents post and distribute messages in a variety
of formats. Most respondents use text messages (61.5%),
but many use photos (51.9%) and video (27.3%).
61.5%
Text/
hyperlinks
Photos
51.9%
Video
27.3%
Audio
7.5%
Figure 36: Media Formats of Messaging
Just under half (44.5%) state that they held a “tweetup,” a Facebook
event, or other in-person event in the previous quarter.

32
0%
30%
20%
10%
0%
60%
50%
70%
40%
Credit unions in this study use a range of social media channels—most commonly Facebook (66.3%), Twitter (43.9%), and
blogs (20.9%). They are least likely to use mobile messaging (3.0%) or podcasting (8.1%).
66.3%
2.1%
Mobile
messaging
5.9%
Podcasts
7.0%
Foursquare
7.5%
YouTube
17.1%
Landing
page
13.9%
Phone apps
20.9%
Blogs
16.0%
43.9%
Figure 37: Usage of Social Media by Channel
0%
30%
20%
10%
There is a distinct contingency of early adopters (10.5%) that has been using social media for
more than two years, as well as a subset (13.5%) that has begun using social media in the last
three months. More than one-third (39.1%) of credit unions in the panel are very likely to add
additional social media channels in the next three months.
3.0%
Not using Less than
3 months
13.5%
3–6
months
14.3%
7–12
months
27.1%
13–18
months
23.3%
19–24
months
8.3%
More than
24 months
10.5%
Figure 38: Length of Time Using Social Media
0%
30%
20%
10%
40%
50%
39.1%
Very
likely
Somewhat
likely
Not very
likely
Not at all
likely
33.1%
24.1%
3.8%
Figure 39: Likelihood of Adding New Social Media Channels in the Next Three Months

33
FacebookOverall, 66.3% of respondents report that they use Facebook, with
a diverse range of participation within that group. The vast majority
(91.2%) of credit unions that use social media use Facebook.
0%
30%
20%
10%
25.2%
1–99
1.7%
900–999
1.7%
800–899
3.4%
700–799
3.4%
600–699
10.9%
500–599
5.0%
400–499
8.4%
300–399
14.3%
200–299
18.5%
100–199
7.6%
1,000+
The median number of Facebook fans is 237; the mean is 404.
Figure 42: Number of Facebook Fans/Likers
Figure 40: Snapshot of Facebook Usage Habits
Members or fans/likers As few as 6 to as many as 4,279
Number of posts per day Less than 1 to more than 5
Use of multimedia 24.0%–84.6% use something other than
text—most commonly photos
Wall posts by fans in most recent quarter As few as 1 to as many as 1,500
Messages in most recent quarter As few as 1 to as many as 800
0
1,500
1,000
500
2,000
2,500
3,000
3,500
4,000
4,500
Nu
mb
er o
f Fa
ceb
ook
fan
s
Figure 41: Scatterplot Diagram of Number of Facebook Fans/Likers

34
0%
30%
20%
10%
40%
50% 46.3%
<1 1
26.0%
2–3
11.4%
4–5
3.3%
5+
0.8%
Varies/
inconsistent
12.2%
Figure 43: Number of Facebook Posts per Day
0%
30%
20%
10%
40%
50%
60%
12.7%
51.7%
13.6%
5.1%0.8% 0.8% 3.4% 1.7% 1.7% 1.7% 0.8% 2.5% 0.8% 0.8% 1.7%
01–
25
26–5
0
51–7
5
76–1
00
101–
125
151–
175
201–
225
251–
275
351–
375
401+
126–
150
176–
200
226–
250
276–
300
Figure 44: Number of Posts by Members
0%
30%
20%
10%
40%
50%
80%
70%
60%
90% 84.6%
Photos Events
82.6%
Videos
41.3%
Discussions
37.5%
Custom
tabs
25.2%
Landing
page
24.0%
Figure 45: Use of Multimedia

35
0
600
400
200
800
1,000
1,200
1,400
1,600
The median number of posts by fans is 16; the mean is 61.
Nu
mb
er o
f w
all p
osts
Figure 46: Scatterplot Diagram of Wall Posts
0
150
100
50
200
250
The median number of messages received is 0; the mean is 13.
Nu
mb
er o
f m
essa
ges
rec
eive
d
Figure 47: Scatterplot Diagram of Facebook Messages Received
0
1–25
26–50
51+61%
34%
3% 2%
Figure 48: Facebook Messages Received

36
TwitterOverall, 43.9% of respondents report that they use Twitter, with a
diverse range of participation within that group. Over half (59.4%)
of credit unions that use social media have a Twitter account.
0%
30%
20%
10%
40%
50%
60%
70%61.9%
<1 1
15.2%
2–3
14.3%
4–5
3.8%
5+
4.8%
Figure 50: Number of Twitter Posts per Day
Figure 49: Snapshot of Twitter Usage Habits
Followers 0–1,200
Number of posts per day <1–>5
Mentions in previous quarter 0–91
Retweets in previous quarter 0–75
Direct messages (DMs) in previous quarter 0–100
0
600
400
200
800
1,000
1,200
1,400
The median number of followers is 192; the average is 295.
Nu
mb
er o
f fo
llow
ers
Figure 51: Scatterplot Diagram of Twitter Followers
0%
30%
20%
10%
0%
60%
50%
40%
51.3%
1–199
1.3%
1,100–1,199
1.3%
900–999
2.6%
800–899
1.3%
700–799
3.9%
600–699
6.6%
500–599
5.3%
400–499
7.9%
300–399
17.1%
200–299
1.3%
1,200+
Figure 52: Twitter Followers

37
0%
30%
20%
10%
0%
60%
50%
40%
70%
81–90
4.5%
91+
1.5%
68.7%
1–10
9.0%
11–20
9.0%
21–30
3.0%
31–40
1.5%
41–50
3.0%
71–80
Figure 54: Twitter Mentions
0
30
20
10
40
50
60
70
80
Nu
mb
er o
f re
twee
ts
Figure 55: Scatterplot Diagram of Number of Retweets
0
150
100
50
200
250
300
The median number of mentions is 5; the average is 23.6.
Nu
mb
er o
f m
enti
ons
Figure 53: Scatterplot Diagram of Twitter Mentions

38
0
60
40
20
80
100
120
Nu
mb
er o
f d
irec
t m
essa
ges
Figure 57: Scatterplot Diagram of Number of Direct Messages
0
1–10
11–20
21–30
81–90
46%
36%
11%
1%
6%
The median number of direct messages is 2; the average is 6.2.
Figure 58: Number of Direct Messages
0
1–10
11–20
21–30
31–40
71–80
40%
39%
13%
1%
6%
1%
The median number of retweets is 2; the average is 6.9.
Figure 56: Number of Retweets

39
0%
30%
20%
10%
The median number of click-thrus is 10; the average is 53.8.
0%
40% 35.3%
0 1–49
35.3%
50–99
11.8%
100–149
8.8%
150–199
2.9%
200–249 250–299
2.9% 2.9%
Figure 60: Number of Click-Thrus
Nu
mb
er o
f cl
ick-
thru
s
0
150
100
50
200
250
300
350
400
450
Figure 59: Scatterplot Diagram of Number of Click-Thrus
40
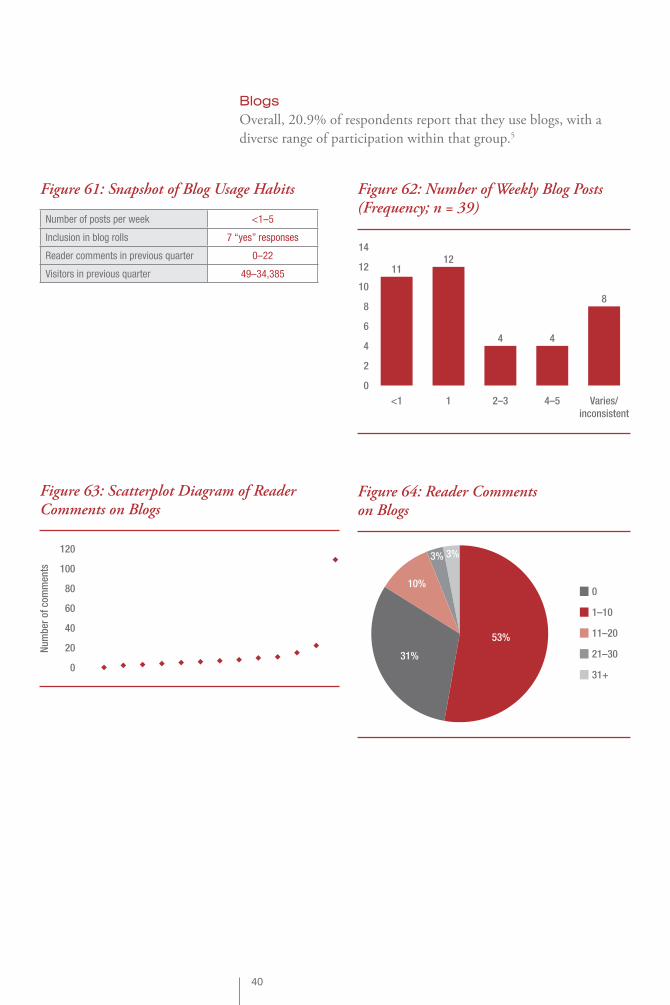
BlogsOverall, 20.9% of respondents report that they use blogs, with a
diverse range of participation within that group.5
0
60
40
20
80
100
120
Nu
mb
er o
f co
mm
ents
Figure 63: Scatterplot Diagram of Reader Comments on Blogs
0
6
4
2
8
10
12
14
11
<1 1
12
2–3
4
4–5
4
Varies/
inconsistent
8
Figure 62: Number of Weekly Blog Posts (Frequency; n = 39)
Figure 61: Snapshot of Blog Usage Habits
Number of posts per week <1–5
Inclusion in blog rolls 7 “yes” responses
Reader comments in previous quarter 0–22
Visitors in previous quarter 49–34,385
0
1–10
11–20
21–30
31+
53%
31%
10%
3%3%
Figure 64: Reader Comments on Blogs

41
Customized Landing PagesOverall, 17.1% of respondents report that they use customized
landing pages outside of Facebook. No follow-up or measurement
questions were included in the baseline survey.
LinkedInOverall, 16% of respondents (n = 30) report that they have a
LinkedIn company page.6
15,000
10,000
5,000
20,000
25,000
30,000
35,000
0
Nu
mb
er o
f vi
sito
rsFigure 65: Scatterplot Diagram of Number of Blog Visitors
1–1,000
1,001–2,000
2,001–3,000
3,001–4,000
4,001+
41%
36%
9%
9%
5%
Figure 66: Number of Blog Visitors
Figure 67: Snapshot of LinkedIn Usage Habits
Number of updates in most recent quarter 0–75
Number of followers 0–135
The median number of LinkedIn followers is 45; the mean is 55.9.
60
40
20
80
100
120
140
0
Nu
mb
er o
f fo
llow
ers
Figure 68: Scatterplot Diagram of Number of LinkedIn Followers (Frequency)
0
30
20
10
40
50
60
70
80
Nu
mb
er o
f u
pd
ates
Figure 69: Scatterplot Diagram of Number of LinkedIn Updates

42
Smartphone AppsOverall, 13.9% of respondents report that they have developed at
least one smartphone app in the last quarter (n = 26).7
Figure 70: Snapshot of Smartphone App Usage Habits
Number of apps created in last five years 1–5
Number of apps created in most recent quarter 0–2
Number of downloads No data available
Cost to purchase app All free
YouTube, Vimeo, or Blip Ch annelsOverall, 7.5% of respondents report that they have a YouTube,
Vimeo, or Blip channel (n = 14).8
Foursquare or GowallaOverall, 7% (or 13) respondents report that they use Foursquare,
Gowalla, or a similar application.9
Nu
mb
er o
f vi
ews
15,000
10,000
5,000
20,000
25,000
The median number of views is 301; the mean is 1,029.
0
Figure 72: Scatterplot Diagram of Number of YouTube Video Views (Frequency)
Figure 71: Snapshot of YouTube Usage Habits
Number of videos posted 1–6
Number of uploads 0–22,468
Note: Respondents were given the opportunity to provide information on how many videos
were posted, since one does not need to create a dedicated channel to post videos.
Figure 73: Snapshot of Gowalla/Foursquare Usage Habits
Number of check-ins 5–450

43
PodcastsOverall, 5.9% of respondents report that they have created podcasts
(n = 11).10
Figure 74: Snapshot of Podcast Usage Habits
Number of podcasts available in most recent period 0–67
Number of downloads 0–13,548
Mobile MessagingOverall, 2.1%—or 4 respondents—report that they use mobile mes-
saging for marketing purposes.11
Management of Social Media ProgramThe majority of credit unions supervise their social media efforts
through one or more individuals in the marketing department
(82.8%), and the majority (61.4%) report spending less than two
hours per week managing the program.
Figure 75: Snapshot of Mobile Messaging Habits
Number of messages sent in most recent quarter 0–26,567
Number of subscribers 500–9,000
0%
30%
20%
10%
0%
60%
50%
40%
The majority of respondents (71.6%) state either that they are the person responsible for managing the
social media program (40.6%) or that they manage that person (31.6%). Only two respondents state that
they have “no direct involvement” with the person or team who manages the social media program.
No one
1.5%
Membership
department
0.7%
55.2%
One
person in
marketing
27.6%
Multiple
people in
marketing
5.2%
Other
4.5%
Combination
of
departments
3.0%
Executive
team
2.2%
Outside
consultant
Figure 76: Person or People Responsible for Managing the Social Media Program

44
Planning and Execution of Social Media Program
With regard to planning and
strategic alignment, 38% of
respondents ensure that the
social media goals are linked
to the credit union’s overall
strategic goals, only 30% had
a launch strategy, and about
one-eighth (12.8%) train the
staff responsible for executing
the program.
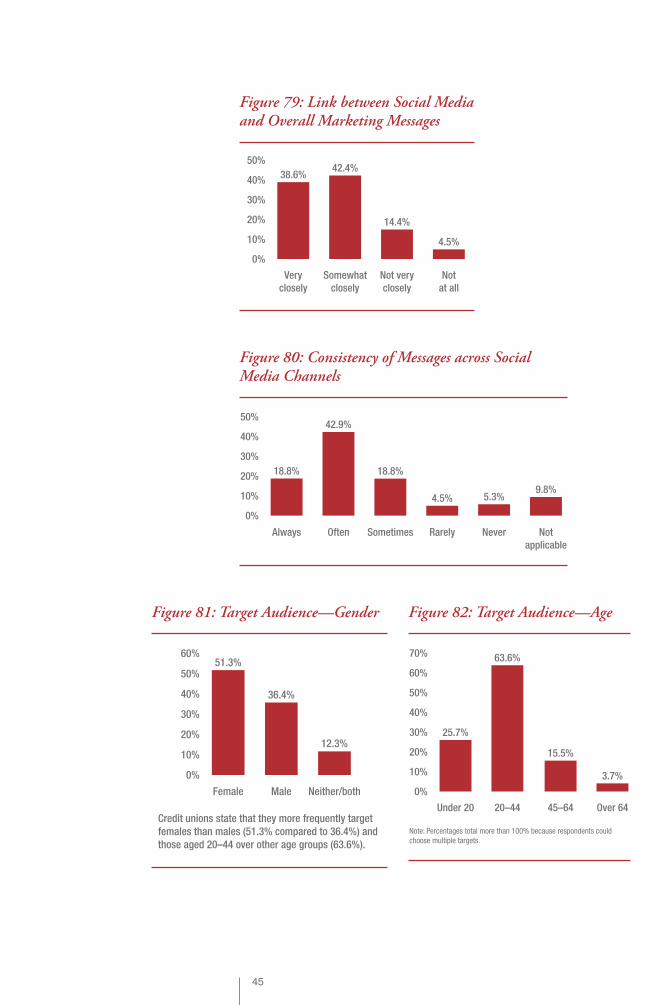
Most (81%) credit unions report that the messages dis-
seminated on social media “very closely” or “somewhat
closely” match overall marketing messages and that the
messages are “always” or “often” consistent across social
media channels (61.7%).
0%
30%
20%
10%
40%
50%
20.5%
Less than
1 hour
per week
1–2 hours
per week
40.9%
3–5 hours
per week
20.5%
6–8 hours
per week
11.4%
More than
8 hours
per week
6.8%
Figure 77: Time per Week Spent Managing the Social Media Program
0%
30%
20%
10%
40%
Nearly one-quarter (21.4%) state that they do not
engage in any of the strategic components.
38.0%
Link social
media goals
to credit
union goals
Develop a
strategy
Train staff Work with
consultants
29.9%
12.8%10.7%
Figure 78: Strategic Components of the Social Media Program
Most (81%) credit unions report that the messages dissemi-
nated on social media “very closely” or “somewhat closely”
match overall marketing messages and that the messages are
“always” or “often” consistent across social media channels
(61.7%).
45
0%
30%
20%
10%
40%
50%
60%
70%
25.7%
Under 20 20–44 45–64
Note: Percentages total more than 100% because respondents could
choose multiple targets.
63.6%
15.5%
Over 64
3.7%
Figure 82: Target Audience—Age
0%
30%
20%
10%
40%
50%
18.8%
Always Often
42.9%
Sometimes
18.8%
Rarely
4.5%
Never
5.3%
Not
applicable
9.8%
Figure 80: Consistency of Messages across Social Media Channels
0%
30%
20%
10%
40%
50%
60%51.3%
Female Male
36.4%
12.3%
Neither/both
Credit unions state that they more frequently target
females than males (51.3% compared to 36.4%) and
those aged 20–44 over other age groups (63.6%).
Figure 81: Target Audience—Gender
0%
30%
20%
10%
40%
50%
38.6%
Very
closely
Somewhat
closely
Not very
closely
Not
at all
42.4%
14.4%
4.5%
Figure 79: Link between Social Media and Overall Marketing Messages

46
0%
30%
20%
10%
0%
60%
50%
70%
40%
Respondents use a variety of methods to market their social media programs, including their website (65.2%),
print advertising (51.9%), and word of mouth (51.3%). However, credit unions typically do not utilize staff as
part of their word-of-mouth efforts, with more than three-quarters of respondents (78.0%) saying that staff is
“not very actively” or “not at all actively” involved in promoting the social media sites.
“Other” includes print or e-newsletters, e-mail signatures, and targeted e-mail campaigns to members.
Radio/TV
11.8%
Other
8.0%
65.2%
Credit union
website
51.9%
ads
51.3%
Word of
mouth
19.8%
ads
19.8%
Point of
service
13.4%
Other
online ads
Figure 83: Channels through Which Social Media Are Promoted
0%
30%
20%
10%
40%
50%
60%
1.5%
Very
actively
Somewhat
actively
Not very
actively
Not at all
actively
20.5%
54.5%
23.5%
Figure 84: Use of Staff to Promote Social Media
The results of the survey suggest that a broad range of credit unions are currently engaged in a social media program. Credit unions that are not currently using social media cite several barriers to doing so, most commonly a lack of resources, a perception that other initiatives better accomplish the organization’s goals, and a concern about how to handle disgruntled members in that forum.
CHAPTER 6Characteristics of Users and
Nonusers of Social Media

48
Demographic Comparisons of Users versus NonusersThe results of the survey suggest that a broad range of credit
unions are currently engaged in a social media program. Credit
unions that do utilize social media are somewhat more likely to:
• Be located in the southeastern, western, or Pacific northwestern
areas of the United States or in Canada.
• Have an average age of membership that is lower than the mean.
• Have more than 80,000 members.
• Have more than 70 employees.
• Have a hybrid FOM.
• Have an annual marketing budget of $200,000–$350,000 (but
note that there is not a consistent correlation with increased
budget size).
• Utilize certain marketing channels, including website ads and
outdoor advertising.
There is also a slight correlation between frequency of disseminating
member surveys and social media usage, with those administering
surveys at least twice annually being slightly more likely to use social
media.

49
45 or
higher
74.2%
91.67%
44 or
lower
0%
30%
20%
10%
40%
50%
80%
90%
100%
60%
70%
Figure 86: Usage of Social Media by Average Age
MidwestNew England
Mid-Atlantic West
Pacific Northwest
Southeast
Canada
0%
60%
40%
20%
0%
120%
100%
80%
Twitter FoursquareMobile
messaging
YouTubePhone appsPodcastsLinkedInBlogsFacebook
Figure 85: Usage of Social Media by Geography
0%
30%
20%
10%
40%
50%
80%
70%
60%
90%
100%
87.5%
More than
200K*
90.0%
100K–
200K*
83.3%
80K–99K*
75.0%
50K–79K
77.8%
31K–49K*
69.5%
Less than
30K
* “Yes” responses are statistically higher than in the overall population (75.7%).
Figure 87: Usage of Social Media by Number of Members
50
68.4%
Fewer than
30
30–49
68.2%
50–69
66.7%
70–99*
85.0%
100–199
61.1%
200–399*
90.5%
400
or more*
88.9%
0%
30%
20%
10%
40%
50%
80%
70%
60%
90%
100%
* “Yes” responses are statistically higher than in the overall population (75.7%).
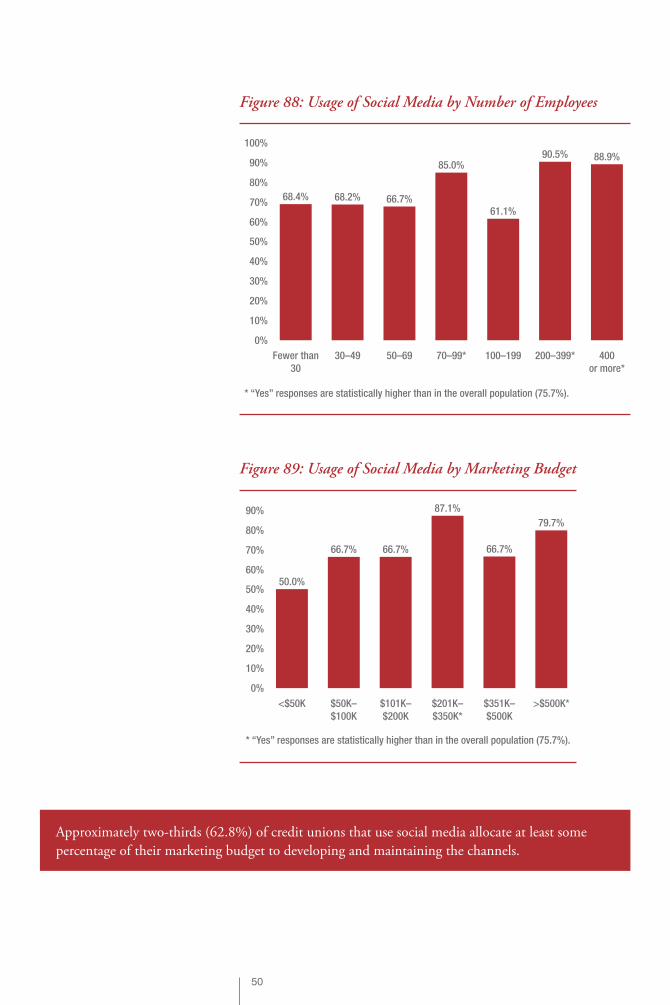
Figure 88: Usage of Social Media by Number of Employees
0%
30%
20%
10%
40%
50%
80%
70%
60%
90%
50.0%
66.7% 66.7%
87.1%
66.7%
79.7%
<$50K $50K–
$100K
$101K–
$200K
$201K–
$350K*
$351K–
$500K
>$500K*
* “Yes” responses are statistically higher than in the overall population (75.7%).
Figure 89: Usage of Social Media by Marketing Budget
Approximately two-thirds (62.8%) of credit unions that use social media allocate at least some
percentage of their marketing budget to developing and maintaining the channels.

51
Approximately two-thirds (62.8%) of credit unions that
use social media allocate at least some percentage of their
marketing budget to developing and maintaining the
channels.
Nonusers: Likelihood to Begin Using Social MediaCredit unions that are not currently using social media
cite several barriers to doing so—most commonly a lack
of resources to set up and/or maintain the sites (19.8%),
a perception that other initiatives better accomplish the
organization’s goals (11.2%), and a concern about how
to handle disgruntled members in that forum (10.2%).
However, more than half (56.8%) intend to implement a social
media program within the next year.
0%
30%
20%
10%
40%
50%
60%
37.2%
0% 1%–10% 11%–20% 21%–30%
53.5%
5.4% 3.9%
Figure 90: Marketing Budget Spent on Social Media
0%
30%
20%
10%
0%
Other
reason
3.2%
No interest/
bad fit
0.5%
19.8%
Lack of
resources
11.2%
Other
initiatives
better
10.2%
Disgruntled
members
9.1%
Lack of
expertise
8.6%
Compliance
issues
3.2%
No support
from
management
Figure 91: Barriers to Using Social Media
0%
30%
20%
10%
40%
27.3%
We hope to
develop a
social media
presence in
the next 3–6
months
We hope
to develop
a social
media
presence
in the next
7–12 months
29.5%
We have
considered
it, but have
no definitive
plans to
start
anything
31.8%
We
haven’t
considered
it, but
may in the
future
2.3%
We have
no interest
in utilizing
social
media
2.3%
Other
6.8%
Figure 92: Likelihood to Begin Using Social Media

Just over 60% of respondents say that their social media program has little impact, neither successful nor unsuccessful. Additionally, 39.4% of respondents feel that they have a “good qual-ity” interaction with followers/participants.
CHAPTER 7Measurement of Social Media
and Marketing Efforts

53
Program SuccessThe majority (61.5%) of respondents were most likely to state
that their overall social media program is “neither successful nor
unsuccessful,” but that they have been successful with iPhone
applications (65%) and blogs (42.5%).
Podcasting (12), mobile messaging (6), and Foursquare/Gowalla (10)
have too few respondents to be meaningful, so they are excluded
from Figure 94. However, the small sample of respondents using
podcasts and mobile messaging think the program is “successful” or
“very successful”; those using Foursquare/Gowalla feel it is neither
successful nor unsuccessful.
The overwhelming majority (85%) feel that their social media
program has had some sort of offline impact, many in multiple
areas.
0%
30%
20%
10%
40%
50%
60%
70%
0.7%
Very
successful
Successful
32.6%
Little
impact
(neither successful
nor unsuccessful)
61.5%
Unsuccessful
2.2%
Very
unsuccessful
3.0%
Figure 93: Perceived Success of Social Media Program—Overall
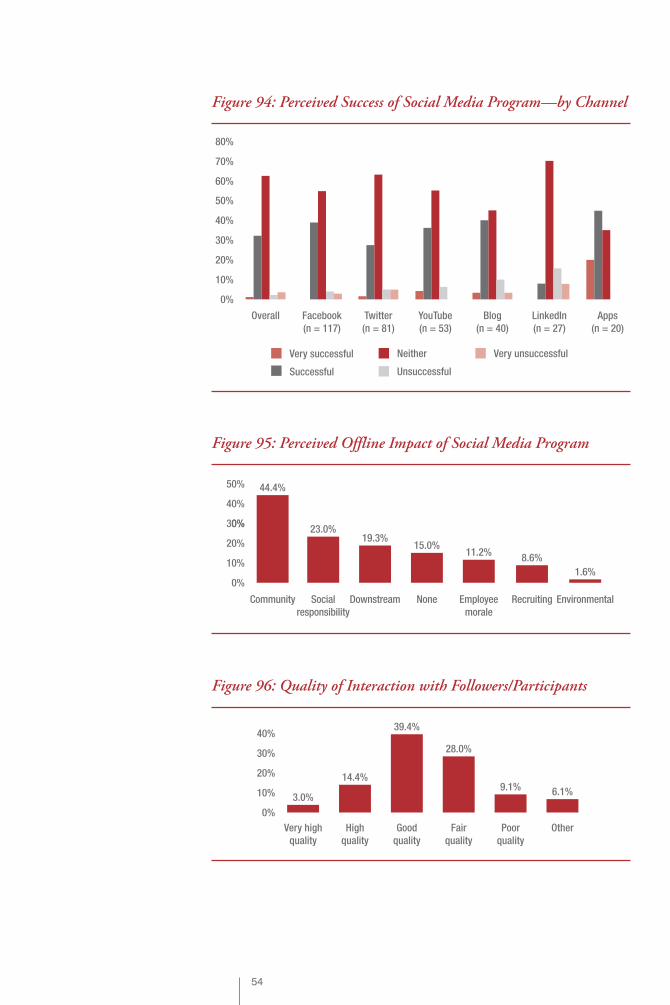
54
Very successful
Successful
Neither
Unsuccessful
Very unsuccessful
0%
30%
20%
10%
40%
50%
80%
70%
60%
Overall Apps
(n = 20)
(n = 27)
Blog
(n = 40)
YouTube
(n = 53)
(n = 81)
(n = 117)
Figure 94: Perceived Success of Social Media Program—by Channel
0%
30%
20%
10%
44.4%
Community Social
responsibility
23.0%
Downstream
19.3%
None
15.0%
Employee
morale
11.2%
0%
50%
40%
Recruiting
8.6%
Environmental
1.6%
Figure 95: Perceived Offline Impact of Social Media Program
0%
30%
20%
10%
40%
3.0%
Very high
quality
High
quality
14.4%
Good
quality
39.4%
Fair
quality
28.0%
Poor
quality
9.1%
Other
6.1%
Figure 96: Quality of Interaction with Followers/Participants

55
Creating quality content is most commonly identified as both an important driver of success
and a barrier to success. Many respondents also feel that tying social media efforts into
community events or other credit union promotions is critical.
0%
20%
10%
20%
Good
content
Tie into
community
events
17%
Cross
promotion
14%
Contests to
generate
interest
10%
Expertise
6%
Using staff
to spread
the word
5%
Figure 98: Success Drivers (Frequency; n = 94)
0%
30%
20%
10%
40% 38%
Lack of
time/
resources
Content
generation/
lack of
expertise
38%
Not
enough
promotion
21%
Internal
policies
17%
Lack of
support
from senior
staff/IT
10%
Figure 99: Barriers to Success (n = 103)
Respondents generally feel that visitors to their social media sites are either “slightly
engaged” (38.9%) or “somewhat passive” (23.7%), and about two-thirds (66.3%) say
that they have received no feedback from members regarding their social media
presence. However, the largest percentage (39.4%) of respondents also state that the
interaction they have with visitors on social media sites is of “good” quality.
0%
30%
20%
10%
40%
4.6%
Very
engaged
Fairly
engaged
18.3%
Slightly
engaged
38.9%
Somewhat
passive
23.7%
Very
passive
14.5%
Figure 97: Engagement Level of Followers/Participants

56
Respondents were asked to answer two quantitative measures that
will be used in future surveys as success measures: website hits and
media coverage. The results are shown in Figures 100 and 101.
Consistent with other responses, a diverse range of website hits
was reported during the previous quarter.
0
1,500,000
1,000,000
500,000
2,000,000
2,500,000
3,000,000
3,500,000
The median number of web hits is 258,563; the average is 518,631.
Note: The seven largest web hit responses were intentionally omitted for ease of chart viewing.
Nu
mb
er o
f h
its
Figure 100: Scatterplot Diagram of Number of Website Hits
Per
cen
tag
e of
res
pon
den
ts t
hat
feel
soc
ial m
edia
pro
gra
m is
succ
essf
ul o
r ve
ry s
ucc
essf
ul
Increased
38.8%
61.2%
Stayed the
same
0%
30%
20%
10%
40%
50%
60%
70%
Nearly two out of five respondents (38.8%) state
that they have seen increased media coverage
compared with the previous quarter.
Figure 101: Media Coverage

Social media is a tool with enormous potential. Some possible insights into social media success include the following: conduct member surveys, invest time and staff into social media, keep at it, be creative, and engage your staff in promot-ing the program.
CHAPTER 8Conclusion
58
To a hammer, every problem looks like a nail. Social media is a tool
with enormous potential. But it is a to ol, nonetheless. Wielded well,
it can foster interaction between credit unions and their members.
Wielded poorly, it helps nobody and might even detract from a
credit union’s image. The trick is to find the right nails and not just
bang away with the closest tool at hand.
This first social media report supports two important hypotheses:
• North American credit unions find the use of social media
increasingly attractive and are expanding their use of social media.
• Credit unions are finding ways to use social media to address stra-
tegic goals, but doing so clearly requires a lot of planning, time,
and resources.
This report is both a useful first stop for credit unions considering a
social media program and a helpful source of information for those
already engaged in a social media program. Social media interac-
tion should, almost by definition, be unique to each institution and
its brand proposition, making a checklist approach problematic.
Nevertheless, we want to reemphasize some of the strong correlations
we found between social media activities and social media success.
Consider weaving these activities into your own programs:
• Connect a social media program to the overall strategic plan. This
may seem basic, but only about half of the respondents indicate
that their social media efforts are closely tied to the strategic plan.
• Conduct member surveys two to four times per year. These serve
as check-ins to make sure you’re addressing real, and not just
assumed, membership needs.
• Invest in or support a larger marketing staff with more market-
ing activity (e.g., updating brand image and launching new
products).
• Dedicate time to manage the program. The appropriate amount
of time will vary depending on the goals and structure of your
program, so be sure to consider this when developing or expand-
ing your social media presence.

59
• Keep at it. Credit unions reporting the most success have been
utilizing social media for more than two years.
• Engage staff in promoting the social media program. “Social” is
the name of the game, so more social media champions means
more success.
• Be located in Canada. Not much to manage here, but it seems
that American credit unions can learn from our friends north of
the border.
Throughout 2011, Filene and Crescendo Consulting will continue
to gather social media data. The final report, following three consec-
utive quarters of polling, will help shed light on not only the per-
ceived success of social media programs but the actual influence they
have on cross selling, relationship building, and ultimately financial
performance. Until then, use your hammers with care.

60
1. M. DiGiovanni, “The Marketing Challenges of 2010 May
Help Foster Innovative Solutions in 2011,” November 2010,
Credit Union Times, www.cutimes.com/2010/11/10/the-
marketing-challenges-of-2010-may-help-foster-innovative-
solutions-in-2011.
2. Serendio BankInsight for USA, Q3 2010 report.
3. Since this analysis was performed only for those credit unions
that use social media and that answered the perceived success
question (n = 135), some of the subgroups compared do not
have statistically meaningful representation. However, the data
presented here are helpful for directional purposes.
4. There were no respondents from Arkansas, Iowa, North
Dakota, South Dakota, Connecticut, Oklahoma, or West
Virginia.
5. Number of respondents was too low to be considered statisti-
cally significant. Therefore, the chart for this channel shows
data as number of respondents rather than as a percentage of
respondents.
6. Number of respondents was too low to be considered statisti-
cally significant. Therefore, the chart for this channel shows
data as number of respondents rather than as a percentage of
respondents.
7. Number of respondents was too low to be considered statisti-
cally significant. Therefore, the chart for this channel shows
data as number of respondents rather than as a percentage of
respondents.
8. Number of respondents was too low to be considered statisti-
cally significant. Therefore, the chart for this channel shows
data as number of respondents rather than as a percentage of
respondents.
9. Number of respondents was too low to be considered statisti-
cally significant. Therefore, the chart for this channel shows
data as number of respondents rather than as a percentage of
respondents.
10. Number of respondents was too low to be considered statisti-
cally significant. Therefore, the chart for this channel shows
data as number of respondents rather than as a percentage of
respondents.
11. Number of respondents was too low to be considered statisti-
cally significant. Therefore, the chart for this channel shows
data as number of respondents rather than as a percentage of
respondents.
Endnotes

The State of Social Media
in Credit Unions:
Opportunities and Challenges
Beth AustinPrincipal
Crescendo Consulting Group, LLC
Scott GoodSenior Consultant
Crescendo Consulting Group, LLC
ideas grow here
PO Box 2998
Madison, WI 53701-2998
Phone (608) 231-8550
PUBLICATION #234 (3/11)
www.filene.org ISBN 978-1-936468-13-3