the structure of wholesale produce markets
TRANSCRIPT

ficfi. Hi
THE STRUCTURE
OF
WHOLESALE PRODUCE MARKETS
^w•^6t«« Rt^í^^^•
,AP
M^R 2S ^^^^
600 ^:^ ¿02^3
Agricultural Economic Report No. 45
UNITED STATES DEPARTMENT OF AGRICULTURE Economic Research Service
Marketing Economics Division

THE STRUCTURE
OF
WHOLESALE PRODUCE MARKETS
Issued Apru 1964 ^ Agricultural Economic Report No. 45
UNITED STATES DEPARTMENT OF AGRICULTURE
Economic Research Seryice Marketing Economics Division

other Publications From This Study
Published by the U.S. Department Of Agriculture THE CHANGING ROLE OF THE FRUIT AUCTIONS, by Alden C. Manchester. Mktg.
Res. Rpt. No. 331, June 1959. CHAINSTORE MERCHANDISING AND PROCUREMENT PRACTICES. THE CHANGING
RETAIL MARKET FOR FRESH FRUITS AND VEGETABLES, by William E. Folz and Alden C. Manchester. Mktg. Res. Rpt. No. 417, July 1960.
THE ORGANIZATION OF THE WHOLESALE FRUIT AND VEGETABLE MARKET IN BOSTON, by Alden C. Manchester. Mktg. Res. Rpt. No. 515, January 1962.
THE ORGANIZATION OF THE WHOLESALE FRUIT AND VEGETABLE MARKET IN WASHINGTON, D.C., by Aldcu C. Manchester. Mktg. Res. Rpt. No. 524, February 1962.
THE ORGANIZATION OF THE WHOLESALE FRUIT AND VEGETABLE MARKETS IN DENVER, SALT LAKE CITY, EL PASO, ALBUQUERQUE, AND BUTTE, by Alden C. Manchester. Mktg. Res. Rpt. No. 541, June 1962.
THE ORGANIZATION OF THE NEW YORK CITY WHOLESALE FRUIT AND VEGETABLE MARKET, by Alden C. Manchester. Mktg. Res. Rpt. No. 542, June 1962.
THE ORGANIZATION OF THE WHOLESALE FRUIT AND VEGETABLE MARKET IN PITTSBURGH, by Aldcu C. Manchester. Mktg. Res. Rpt No. 557, August 1962.
THE ORGANIZATION OF WHOLESALE FRUIT AND VEGETABLE MARKETS IN DALLAS- FORT WORTH, HOUSTON AND LITTLE ROCK, by AldcH C. Manchester. Mktg. Res. Rpt. No. 558, August 1962.
THE ORGANIZATION OF THE WHOLESALE FRUIT AND VEGETABLE MARKET IN PHILADELPHIA, by Joscph C. Podauy. Mktg. Res. Rpt. No. 559, August 1962.
THE ORGANIZATION OF THE WHOLESALE FRUIT AND VEGETABLE MARKETS IN DETROIT, ALBANY-SCHENECTADY-TROY, AND WEST VIRGINIA, by Alden C. Manchester. Mktg. Res. Rpt. No. 562, October 1962.
THE ORGANIZATION OF THE WHOLESALE FRUIT AND VEGETABLE MARKETS IN SEATTLE-TACOMA, PORTLAND, AND SPOKANE, by W. Fred Chapman, Jr. Mktg. Res. Rpt. No. 563, October 1962.
THE ORGANIZATION OF THE WHOLESALE FRUIT AND VEGETABLE MARKETS IN MIAMI AND TAMPA-ST. PETERSBURG, by Robcrt W. BohuU. Mktg. Rcs. Rpt. 593, April 1963.
Published by State Experiment Stations PRODUCE WHOLESALERS IN THE CAPITOL DISTRICT, NEW YORK, 1958, by D. C.
Hodges and R. Brian How, Cornell University. A.E. Ext. 106, 1961. WHOLESALE MARKETING OF FRESH FRUITS AND VEGETABLES IN OMAHA AND
LINCOLN, NEBRASKA, by Clarence J. Miller. Nebr. Agr. Expt. Sta., Dept. Agr. Econ. Rpt. No. 21, June 1961.
WHOLESALE FRUIT AND VEGETABLE MARKETS IN EL PASO AND ALBUQUERQUE, by James L. Stallings and Jere E. Boyer. N. Mex. Agr. Expt. Sta., Res. Rpt. 43, July 1960.
THE PORTLAND WHOLESALE FRUIT AND VEGETABLE MARKET, by AldcU C. Manchester and Charles H. Merchant. Maine Farm Res., Jan. 1961.
ORGANIZATION OF THE LOUISVILLE WHOLESALE FRUIT AND VEGETABLE MARKET, 1959, WITH CHANGES SINCE 1936, by C. D. PhiUips. Ky. Agr. Expt., Sta., Bui. 674, September 1961.

Foreword This is the final report of a study of organization and operation of wholesale
fruit and vegetable markets throughout the country. This is part of a program of research designed to broaden understanding of the food marketing system and, thereby, to make it more efficient. A number of reports on the individual markets studied have been published by the Department and cooperating experiment stations. (See the list on the inside front cover.)
The cooperation of naany persons was necessary to make this study possible. John K. Hanes was assistant project leader. Joseph C. Podany, W. Fred Chapman, Jr., Robert A. Bohall, Alvin Z. Macomber, Merritt M. Thomas, George L. Capel, Dale L. Stallings, William T. Manley, James W. Diunas, Mrs. Priscilla Bonnucelli, and Mrs. Dorthy Lundquist were invaluable members of the team. The Fruit and Vegetable Division of the Agricultural Marketing Service furnished information and counsel, especially Arthur E. Browne and Fred S. Nightingale. We are most grateful for the cooperation of research personnel from many experiment stations, including Donald E. Farris and Roy E. Lambert of Arkansas; C. D. Phillips of Kentucky; Harlon D. Traylor of Louisiana; Charles H. Merchant, L. J. Jewett and Fred A. Perkins of Maine; Frank J. Smith of Minnesota; Heinz Speilman and Edward H. Ward of Mon- tana; Clarence J. Miller and George B. O'Neal of Nebraska; JereBoyer and James Stallings of New Mexico; D. C. Hodges, Donald Marion, and R. Brian How of Cornell; Mark Fowler and Kermit Bird of Oklahoma; J. F. Pittman of South Carolina; Ellis Lamborn and Reed D. Taylor of Utah; Paul A. Atkins and W. W. Armen trout of West Virginia ; and Jerry Gunnelson and W. F. Mueller of Wisconsin.
Ill

Contents Page
Highlights V Introduction 1
The study 1 Classification of firms 2
PART I
The marketing system for fresh fruits and vegetables. _ 3 Shipping-point markets 3 Wholesale markets 4
Wholesale market structure, 1958-59 8 Number, size, and type of firms 8 Commodity specialization 14 Interfirm relationships 19 Legal form of organization 22 Marketing channels 22 Functions and services of wholesalers 35 Risk-taking 46 Functions of brokers and distributors 46 Functions of different types of markets 49
Buying methods of wholesalers 53 Terms of purchase 55 Procurement practices 55
The structure of the retail market for produce 59 Functions performed by retail organizations 62 Physical handhng functions 65
Buying methods of retail organizations 67 Buying organizations 68 Sources of produce 69 Buying methods from local farmers 70 Buying methods trom shipping point 72 Direct buying and the terminal market 76
Costs, margins, and efiiciency 77 Payroll and employees 82 Unit margins 85 Marketing charges in different types of markets. 86 Returns to owners and managers 87 Target margins -- 87 Brokerage and commission rates 89
Page The price-making process 92
Price-making systems 93 The use of market information in price making. _ 95 Price variability 95
PART II
The changing marketing system 97 Changes in the structure of the retail market 99
The growth of direct buying 100 Warehouse prepackaging 101
Changes in the structure of wholesale markets 101 Number, size, and type of firms 102 Entrance and exit of wholesalers 106 Growth and decline 107 Changes in trade channels 107 Changes in services 110 The place of fruit auctions in a changing market-
ing system 111 Outlook of wholesalers 111
PART III
The nature of competition in produce markets 113 Shipping-point markets 113 Wholesale markets 114 Product differentiation 114 Retail markets 115
Prospects 117
Literature cited 120 Appendix: Definitions of terms 121
General terms 121 Size of firms 121 Types of firms 121 Terms of purchase 122 Marketing costs and margins 123
Index 125
IV

Highlights
Many changes have taken place in the produce marketing system in the past quarter century. Direct buying by chains and other retail organi- zations has increased markedly. Many whole- salers have gone out of business, but many others have entered the field. Consumer-unit packaging has become an important element in wholesale and retail markets. To understand better the present organization of wholesale produce markets, as well as the changes which have taken place since the 1930's, the Economic Research Service studied 52 wholesale markets of all sizes and types throughout the country.
These markets were selected to represent the wholesale markets of the United States. They received about 1.6 million carlots of fresh fruits and vegetables out of a total market supply of 2.2 million carlots in 1958. There were about 5,200 wholesalers in these markets, plus 315 chains, retailer cooperatives, and wholesaler- sponsored voluntary groups handling produce. About 30 percent of the wholesalers in the country doing about 20 percent of the business were outside these markets in small cities and towns.
Wholesalers: The 5,200 wholesalers in these markets were made up of the following groups, all in round numbers:
1,600 primary handlers—^receivers, commission merchants, service wholesalers, etc.—selling 800,000 carlots of produce;
2,560 secondary handlers—1,000 jobbers, 540 truck jobbers, 500 purveyors, 200 prepackagers, and 300 tomato repackers—selling 335,000 carlots;
120 shippers and truckers—these are mixed-load shippers and less than carload lot shippers and truckers headquartered in the markets—selling 30,000 carlots;
110 importers and exporters with sales of 220,000 carlots;
500 brokers and distributors selling about 500,000 carlots of produce;
135 cooperative and importers' sales agencies sellmg 185,000 carlots;
10 auctions with sales of 46,000 carlots; 140 buying brokers and buying offices buy-
ing 50,000 carlots. One third of the primary handlers sold more than
500 carlots each. Fifteen percent sold more than 1,000 carlots. On the other hand, 95 percent of the secondary handlers sold less than 500 carlots each per year. Only a handful of prepackagers and banana jobbers handled more than 2,000 carlots during the year.
A third of the brokers and distributors sold less than 500 carlots annually, a fourth between 500 and 1,000 carlots, and another fourth between 1,000 and 2,000. Nearly 80 percent of the buying brokers and two-thirds of the buying offices purchased less than 500 carlots.
Concentration of control, measured by the share of the volume sold by the 4 largest primary handlers in each market, is almost entirely a function of the size of the market. In the smallest markets, the 4 largest firms did all or nearly all of the business. In the largest markets, they had about 15 percent of the business, even though the biggest firms had average sales of 3,000 to 4,000 carlots per year in the largest markets compared to a few hundred carlots in the smallest.
The wholesalers in these markets received 1.1 million carlots of produce directly from shipping points, from local growers, and from other mar- kets, including imports. Brokers and distribu- tors bought 28 percent of this total, plus about half again as much which they sold to out-of-town customers and which bypassed the market. Cooperative and importers' sales agencies sold 9 percent of the total entering the market, and nearly as much which bypassed the market, Receivers, commission merchants, service whole- salers, and other primary handlers piu-chased half of the total themselves and another 11 percent bought through brokers and distributors. The remaining 13 percent entering the markets was bought by prepackagers, jobbers, importers, shippers, and other types of wholesalers.
The importance of brokers and distributors varied greatly among markets, from nothing to two-thirds of the total purchases of wholesalers. In about a quarter of the markets, brokers and distributors bought more of the produce directly from shipping point and other outside sources than did receivers, jobbers, and other wholesale handlers. Most of these ''broker" markets are between Chicago and the Rocky Mountains, from Texas to Minnesota.
In 40 percent of the markets, direct purchases by chains and other retail organizations accounted for 35 percent or more of the produce entering the market. None of the large markets and only a few of the medium-sized ones are in this group. The largest markets in the group are Washington, D.C., Seattle, Wash., and Miami, Fla. The smallest are Charleston, W. Va., and Butte, Mont.

Prepackaging: Over 1,000 wholesalers pre- packaged or repacked nearly 114,000 carlots of produce in 1958. Two-thirds of the volume was put up by 200 prepackagers and 270 tomato repackers. The remainder was handled by wholesalers of almost every type, with receivers, receiver-jobbers, and service wholesalers account- ing for the biggest share. Over 600 firms pre- packaged or repacked only 1 commodity; nearly 200 put up 2 different commodities; another 200 put up 3 or 4 items; and 27 firms packaged 5 or more commodities.
Chains and other retail organizations pre- packaged or repacked 32,500 carlots of produce. The national chains accounted for over three- fourths of this quantity. Potatoes are packaged by more retail organizations than any other commodity.
Retail Organizations: The retail side of these markets was composed of 249 chains or divisions of chains and 66 retailer cooperatives and wholesaler-sponsored volimtary groups which han- dled produce. At least 160 other small chains buy no produce directly from shipping point and several hundred retailer cooperatives and vol- untary groups do not handle produce. Five restaurant chains also bought some produce di- rectly. The retail organizations as a group han- dled about 600,000 carlots of produce. Most of the chains are large—66 percent of them handled more than 1,000 carlots and 16 percent more than 4,000 carlots. The retailer cooperatives and vol- untary groups are somewhat smaller—about three-fourths handled between 500 and 2,000 carlots and only a few more than 2,000.
On the selling side, the retail market is divided about like this:
Percent of total produce
sales by Chains with 11 or more stores each: retailers National chains 17 Regional chains 12 Local chains with produce warehouse 7 Local chains without produce warehouse 2
All chains 38 Chains with 2 to 10 stores each 9
All chains 47
Retailer cooperatives with produce ware- house 3
Voluntary groups with produce warehouse. _ 2 Other grocery stores 39 Specialty fruit and vegetables stores 9
All retail stores 100
The importance of chains and other types of retailers varies decidedly from one market to another. The percentage of total retail produce business done by chains, cooperatives, and voluntaries ranged from 19 to 84 percent. In most of the markets this share fell between 40 to 60 percent. The share of the largest single retailer in the market ranged from 5 to 42 percent ; in over half the markets this share was between 15 and 25 percent.
vi
Direct Buying: Direct purchases from shipping point, from local farmers, and from other markets by chains, cooperatives, and voluntaries were 26 percent of the total receipts in these markets in 1958—for the country as a whole, approximately 20 percent. These firms bought another 5 percent of the total through local brokers and sales agencies. In terms of their total volume the chains and other retail organizations bought 50 percent direct from shipping point; 6 percent from local farmers; 7 percent from firms in other markets, including brokers, and other warehouses of the same chain; 13 percent through local brokers and sales agencies, with deliveries directly to the chain warehouse; 24 percent from receivers, jobbers, prepackagers, and other wholesalers in the local market.
The procurement methods and buying organizations of the different groups vary from one to another, but there are broad similarities within the major types. Each of the three national chains has an extensive field buying staff, with offices (year-round or seasonal) in all the major producing areas, who are in direct touch with growers and shippers and can buy largely on the basis of actual inspection. The national chains buy 70 percent of their total supplies directly from shipping point, mostly through field buyers.
The regional chains—those with several warehouse divisions in different markets—are not large enough to maintain field buying offices as extensive as those of the national chains, but many have a few field offices in the most important production areas. They buy about half of their supplies directly from shipping point. About 45 percent of their direct purchases are made through their own buyers at shipping point and another 45 percent directly by telephone. About 10 percent is bought through buying brokers at shipping point.
Local chains—those with only one warehouse division—have no field buyers. Their direct purchases from shipping point amount to a little less than 30 percent of their volume. Nearly two-thirds of their direct purchases are made by telephone directly to the shipper and about a third through shipping-point buying brokers.
Most chains, like most wholesalers, made use of U.S. grades in buying directly from shipping point, at least to some extent. Over half of the retail organizations buying directly from shipping point generally purchased produce of higher quality than U.S. No. 1, compared with about 11 percent of wholesalers who bought direct. Frequently, such buyers did not have detailed specifications, but asked for *'good quality'' or ^Hhe best available.'' The meaning of such terms was clarified over time as a buyer and seller did business with one another.
Growth of Direct Buying: Direct buying of fresh fruits and vegetables by chains dates back to the early 1920's. The national chains adopted

he practice first, but by the late twenties a number of large local and regional chains were also buying directly. By 1936, 12 percent of the volume entering the major wholesale markets was purchased directly from shipping point by chains.
After World War II, there was a rapid increase in the number of chains large enough to engage in direct buying. Most of the direct buying is done by national and regional chains—in 1958, 90 percent. There has been little change in the percentage of retail food store business done by the national chains since the mid-1930's. However, over this same period, the share of the regional chains has increased sharply, as the number increased. In 1935, three regional chains were doing about 3 percent of the total retail food store business. By 1948, eight regional chains had 5 percent of the business and, by 1958, 20 of them did 12 percent of the business. Thus, most of the increase in direct buying resulted from the increased number and sales of regional chains. The remaining portion of the increase was caused by some large local chains starting to buy directly, and by a number of retailer cooperative and volun- tary chains adding produce to the commodities which they carried.
Changes in Wholesale Markets: Between the late 1930's and the late 1950's, the volume of fruits and vegetables sold by farmers and imported for fresh market, excluding that eaten on farms where grown, increased 12 percent. With direct purchasing by chains and other retail organizations increasing during this period, the total volume handled by the wholesale marketing system probably declined about 10 to 12 percent. The number of wholesalers in these markets listed in the Red Book declined 19 percent between 1939 and 1958. Receivers, commission merchants, and receivers-jobbers declined 27 percent; jobbers declined 29 percent; brokers 41 percent; and buying brokers 8 percent. During the same period, the number of repackers and pre-packagers listed increased from 15 to 205; truck jobbers increased from 383 to 572; and the number of importers and exporters was unchanged.
Since 1939, 5,100 wholesalers have left the produce business. But, in that same period, 3,700 others entered the field in these markets. Of the firms in business in 1958, 8 percent had been in business 50 years or more; 33 percent 30 years or more; and 19 percent had been orga- nized within the past 10 years.
The fruit auctions developed as the major distributors of citrus fruits and west coast deciduous fruit. In 1930, they handled 84 percent of the citrus fruit received in auction cities and nearly as high a percentage of western deciduous fruits. They were the mass distributors of these fruits at the wholesale level. They maintained this position fairly well during the 1930's.
Auction sales declined from 33 percent of all citrus and 10 percent of all deciduous fruit
sold fresh in 1937 to 15 percent of the citrus and 6 percent of the deciduous fruit in 1957. They sold about half of the citrus fruit and western deciduous fruit received in the auction cities in 1956-57.
The auctions are becoming more and more specialty distributors rather than mass distrib- utors. Sales of higher valued fruits are holding up much better than those of lower priced, larger quantity items. The attractions of direct buying by chains, wholesalers, and others are much greater for the large-quantity commodities. The auctions seem well suited to the sale of imported fruit—most of it from Chile and Argentina—and the New York City auction probably will retain these commodities.
Nature of Competition Produce markets both at shipping point and
wholesale are essentially competitive in nature. In most of these markets, the number of firms is quite large, but, even where it is not, the variability in quality of fruits and vegetables compels buyers to maintain actual or potential alternative sources and sellers alternative outlets. The existence of these alternate sources or outlets precludes the exercise of any significant power, even by the largest buyers or sellers. The largest buyer in one fairly typical major shipping- point market purchased a little over 10 percent of the produce.
At the retail level, the competitive situation is somewhat different. The largest groups— chain or affiliated—typically have a substantial share of the business. Each attempts to augment his share by differentiating the products and services which he offers from those of his compet- itors. The largest group in a market usually has some measure of market power, but it is severely circumscribed by actual and potential competition from others in the market. No one has a monopoly of the appeals to consumers. The group which makes its appeal in terms of higher quality fruits and vegetables than its competitors must be prepared to charge some- what higher prices for them or forego some of the profits from the produce department. The group which relies on the appeal of low prices must be prepared to offer a quality level some- what lower than that of its high-quality competitors or forego profits. Thus, there are leaders and followers in the retail field, but no leader can count on being followed where his competitors do not wish to go—the market power of the leader is employed only within a narrow sphere.
Prospects Looking ahead 5 or 10 years, where might some
of these changes lead? The Limits of Direct Buying: Obviously, the
controlling factor in the expansion of direct purchasing is the share of the total fruit and vegetable market controlled by chains—corporate,
Vll

voluntary, and cooperative—which are large enough to buy economically direct from shipping point. To some extent, the decisions of expanding organizations to go into direct buying and how far to go into it will be conditioned by the per- formance of the terminal markets. If adequate supplies of produce are available at competitive prices on the terminal markets, the incentive for smaller groups to buy direct will be much less.
While there is no basis on which to predict the precise nature of the structure of food retailing in the years ahead, a projection of the changes of the past 30 years seems to indicate further growth of buying groups of all types which are big enough to buy directly from the shipping point if they wish to do so. The outside limits of such growth seem to be set by the needs of at least three groups: (1) restaurants, hotels, and institutions; (2) imaffiliated independent grocery stores; and (3) chains making some local purchases. A conservative estimate might be for direct buying to increase from a fifth to something like a third of total sales in the next 10 to 15 years.
Fruit Auctions: The share of the total volume of fruit sold by the auctions probably will continue a slow decline for a number of years. There may be a further decline in the number of such auc- tions, continuing the trend of the last 40 years.
Wholesalers: The share of the total volume handled by receivers, jobbers, service wholesalers, and other terminal-market operators as a group probably will continue to decline somewhat as direct buying by various types of chains increases. The possible limits to this decline have been indicated, and it is quite possible that the decline will not go this far, particularly if smaller chains
find that they can obtain supplies on the local markets which are competitive in quality and price with those which other firms are purchasing from shipping points.
The traditional function of wholesale distribution—purchasing large lots and breaking them down into smaller lots for sale to retailers and secondary wholesalers—probably will become less and less important. Many terminal market operators will need to become specialists.
The Nature of Marketing: Two general, interrelated trends are at work in the marketing system for fresh fruits and vegetables. One is the shift toward more specialized markets. The changes in the types of fruit handled by the auctions are evidence pointing in this direction. The increase in the consumer-unit packaging is another. The shift toward direct buying is also related. Many chains see direct buying as a means of providing their stores with produce which more nearly meets their own requirements than the varied supplies from many sources which are available on the wholesale market.
The second change is the shift in emphasis from what may be called trading to merchandising. The emphasis in old-line wholesale markets often was on the opportunity to make a profit from changes in prices. This type of emphasis is disappearing gradually. More and more the opportunities for profit are to be found in performing a service which contributes to orderly marketing and to moving the commodity through the marketing channels in a steady flow. The supermarkets—chains and independents—are geared to this type of marketing. The rest of the marketing system is gradually adjusting to such an outlook.
VIU

THE STRUCTUEE OF WHOLESALE PRODUCE MARKETS By Alden C. Manchester, Agricultural Economist, Marketing Economics Division, Economic Research Service
Introduction This is a study of the nature of competition
in the fresh fruit and vegetable business, of the structure or organization of produce markets, the behavior of firms in these markets, and of the efficiency with which markets of various types perform their finictions. Its primary focus is on markets at the wholesale level, but it also considers the competitive process at shipping point and at the retail level.
Wholesale produce markets and the marketing system in which they operate developed into the modern form between about 1880 and the mid- 1920-s. In the four decades since then, there have been many changes in the organization and functions of wholesale markets. While the total volmne handled by the produce-marketing system increased about one-eighth from the late 1930's to the late 1950's, the increase in direct buying by chains and afllliated groups brought a decline in the vohmie handled by wholesalers of something like 10 percent. There was a substantial turnover in wholesalers, with a net decline of nearly one- fifth. The retail level became dominated by the supermarket, with its emphasis on mass merchandising of relatively standardized goods at lower margins than had prevailed in earlier periods. These and many other changes brought about further changes in the nature of produce marketing which are stiU affecting producers, packers, and wholesalers. This study analj^zes the present structure and functions of wholesale produce markets, changes during the last 30 years, and the outlook for the next decade or two.
Most of the fresh fruits and vegetables marketed in the United States pass through one or more wholesale markets. These markets play a key role in the produce marketing system, and the efficiency with which they perform their many functions is of major importance to the firms in the markets, to farmers, packers, shippers, retailers, and consumers.
The Study
The primary information for this study was supplied by 2,620 firms in 52 markets selected to represent all of the wholesale markets in the Nation on the basis of three factors: (1) size of market; (2) importance of direct buying by retail
711-059—64 2
organizations; and (3) importance of service wholesalers.
In each sample market, all firms in the metro- politan area were contacted in a combination mail-and-telephone sm'vey to determine: (1) type of firm; (2) commodity specialization; and (3) size of firm. In the small markets, all firms were interviewed. In the larger markets, a sample of firms classified on the basis of these three factors was interviewed. The sample in the largest market ranged from all of the large firms to as low as 20 percent of the smallest firms. The data supplied by the firms interviewed were expanded to represent all of the firms identified in the maü-and-telephone survey. All data were obtained for the calendar year 1958, except in Louisville and Pittsburgh, where the needs of cooperating agencies made it necessary to obtain information for 1959. For convenience, throughout this report ^^1958" is used to include data for 1959 from these two markets.
Additional information, primarily historical, was obtained from a wide variety of sources (5, 6, 11, 15, 17, 21, 22, 27, 32)}
Generous cooperation was forthcoming from many State experiment stations. Survey data were obtained by experiment station personnel in the following markets : Experiment station Market Arkansas Little Rock Kentucky Louisville Maine Portland Minnesota Duluth-Superior Montana Butte Nebraska Lincoln and Omaha New Mexico Albuquerque New York (Cornell) Albany-Schenectady-Troy Oklahoma Oklahoma City and Tulsa Utah Salt Lake City West Virginia All markets in State Wisconsin Milwaukee
Fieldwork was conducted jointly by experiment station and U.S. Department of Agriculture personnel in these markets : Experiment station Market Louisiana New Orleans Maine Boston, Mass. New Mexico El Paso, Tex. South Carolina Columbia and Greenville
Ï Italic numbers in parentheses refer to Literature Cited, p. 120. See also: BRANCH, G. V. DETROIT'S NEW UNION TERMINAL MARKET. Paper presented at meeting of Nati. Assoc. Mktg. Off., Detroit, 1928.
1

The information for the San Francisco-Oakland market was obtained by the University of CaU- fornia under contract with the Department and for Pittsburgh by the Midwest Research Insti- tute under contract. In all other markets, the information was obtained by Departmental personnel.
Classification of Firms For purposes of this study, the firm is defined
as the individual business operation. This does not necessarily coincide with the legal definition of the firm or with other definitions. For a number of companies, a single corporation conducting more than one operation is defined as two firms. For example, a legal entity operating both as a receiver and a prepackager generally is treated as two firms. This permits treatment of different types of operations as single-function firms, rather than trying to handle mmtiple operations under one ownership as a single firm which does not fit any of the definitions. The ownership of such multiple-firms is described on pages 19 to 22.
Each type of firm was defined in terms of the way in which three major functions—buying, selling, and physical handling—were performed. Firms which received more than half of their produce directly from shipping point (including direct purchases from shipping point and purchases through local brokers and agencies) were distinguished from those which received more than half from local wholesale handlers. In terms of the selling function, firms were classified as selling more than half or less than half of their produce to wholesalers or retail organizations with warehouses. Firms which handled the merchandise themselves were generally classified as wholesale handlers, while those that did not were brokers and agencies. Firms which prepack- aged, repacked tomatoes, or processed bananas were classified as separate types of firms if they carried out these functions for more than haK of their produce.
Application of these criteria resulted in the following types of firms, by major groupings (for definitions of each type, see appendix, p. 121) :
Retail organizations Chains, retailer cooperatives, voluntary
groups.
Wholesalers Wholesale handlers—firms physically han-
dling the merchandise. Primary handlers—firms receiving more
than half of their produce directly from shipping point.
Receivers Commission merchants Receiver-jobbers Commission wholesalers Service wholesalers Wholesale grocers
Secondary handlers—firms receiving less than half of their produce directly from shipping point in most cases. A few firms are classified here on other criteria.
Jobbers Jobbers (delivery) Banana jobbers Service jobbers Secondary wholesalers Truck jobbers Piu-veyors Receiver-piKveyors Prepackagers Tomato repackers
Shippers and truckers Mixed-load shippers L.c.l. (less-than-carload lot) shippers Packers-shippers Merchant truckers Itinerant truckers
Importers and exporters Importers Commission importers Exporters
Brokers and agencies—mostly firms which do not physically handle the merchandise.
Brokers and distributors Selling brokers Auction representatives Terminal brokers Carlot distributors Distributors
Sales agencies Cooperative Importer's
Others Buying brokers Buying oflâces Sales agents Auctions
PART I
The Marketing System for Fresh Fruits and Vegetables
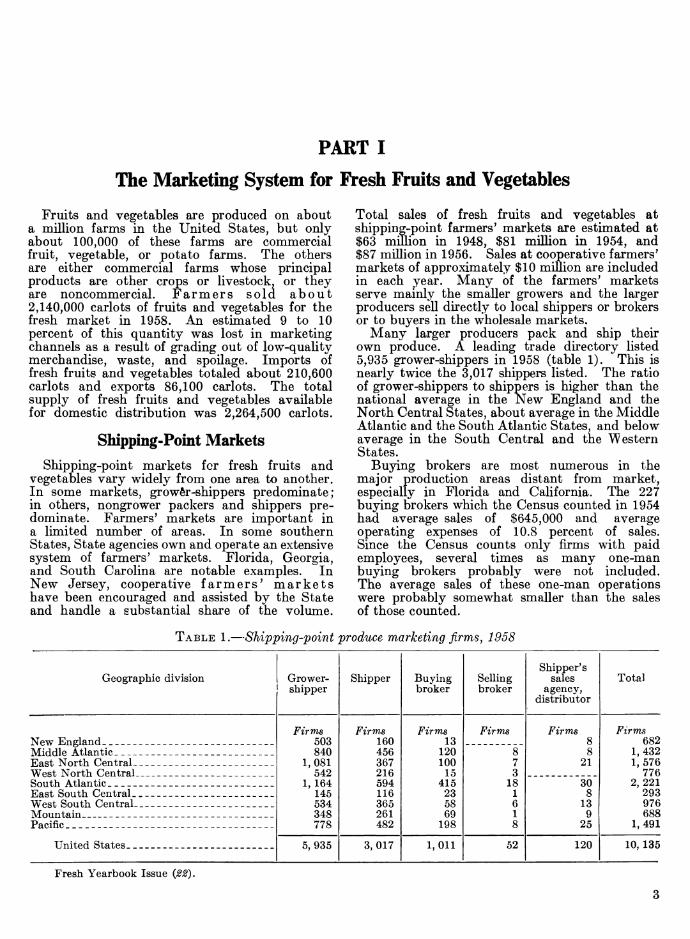
Fruits and vegetables are produced on about a million farms in the United States, but only about 100,000 of these farms are commercial fruit, vegetable, or potato farms. The others are either commercial farms whose principal products are other crops or livestock, or they are noncommercial. Farmers sold about 2,140,000 carlots of fruits and vegetables for the fresh market in 1958. An estimated 9 to 10 percent of this quantity was lost in marketing channels as a result of grading out of low-quality merchandise, waste, and spoilage. Imports of fresh fruits and vegetables totaled about 210,600 carlots and exports 86,100 carlots. The total supply of fresh fruits and vegetables available for domestic distribution was 2,264,500 carlots.
Shipping-Point Markets Shipping-point markets for fresh fruits and
vegetables vary widely from one area to another. In some markets, grower-shippers predominate; in others, nongrower packers and shippers pre- dominate. Farmers' markets are important in a limited number of areas. In some southern States, State agencies own and operate an extensive system of farmers' markets. Florida, Georgia, and South Carolina are notable examples. In New Jersey, cooperative farmers' markets have been encouraged and assisted by the State and handle a substantial share of the volume.
Total sales of fresh fruits and vegetables at shipping-point farmers' markets are estimated at $63 million in 1948, $81 million in 1954, and $87 million in 1956. Sales at cooperative farmers' markets of approximately $10 million are included in each year. Many of the farmers' markets serve mainly the smaller growers and the larger producers seU directly to local shippers or brokers or to buyers in the wholesale markets.
Many larger producers pack and ship their own produce. A leading trade directory listed 5,935 grower-shippers in 1958 (table 1). This is nearly twice the 3,017 shippers listed. The ratio of grower-shippers to shippers is higher than the national average in the New England and the North Central States, about average in the Middle Atlantic and the South Atlantic States, and below average in the South Central and the \\^estern States.
Buying brokers are most numerous in the major production areas distant from market, especially in Florida and California. The 227 buying brokers which the Census counted in 1954 had average sales of $645,000 and average operating expenses of 10.8 percent of sales. Since the Census counts only firms with paid employees, several times as many one-man buying brokers probably were not included. The average sales of these one-man operations were probably somewhat smaller than the sales of those counted.
TABLE 1.—Shipping-point produce marketing firms, 1958
Geographic division Grower- shipper
Shipper Buying broker
Selling broker
Shipper's sales
agency, distributor
Total
New England _ ___ Firms
503 840
1,081 542
1, 164 145 534 348 778
Firms 160 456 367 216 594 116 365 261 482
Firms 13
120 100
15 415
23 58 69
198
Firms Firms 8 8
21
Firms 682
Middle Atlantic _ _ 8 7 3
18 1 6 1 8
1,432 East North Central 1,576 West North Central _ _ _ 776 South Atlantic 30
8 13
9 25
2,221 East South Central._ _ __ __ _ 293 West South Central 976 Mountain _ _ _ _ 688 Pacific - - 1,491
United States 5,935 3,017 1,011 52 120 10, 135
Fresh Yearbook Issue

Buying brokers represent a number of whole- salers or retail organizations in buying at shipping point. Many of them move from one shipping point to another, following the crops. They bought 8 percent of the produce for the firms in the major wholesale markets covered in this study.
Farmer cooperatives sold $859 million of fruits and vegetables in 1958-59 {12). This includes not only fruits and vegetables for the fresh market but also those which were canned, frozen, or processed in other forms. The business of bargaining associations which do not physically handle the merchandise is also included. These sales were made by 714 fruit and vegetable cooperatives and 48 other associations whose primary business was in farm supplies or in marketing other farm products. Local co- operatives sold $516 milhon of fruits and vegetables. Regional associations had fruit and vegetable sales of $741 million, including $398 million sold for member local associations, also included in the sales of local cooperatives.
Perhaps a thousand or more truckers buy produce at shipping point, haul it to market, and sell it for whatever profit they can make. Many are for-hire truckers who regularly or occasionally purchase a load to provide themselves with a backhaul. For instance, some truckers who regularly haul fruits and vegetables from Florida, Georgia, and other southern States on a for-hire basis make a fairly regular practice of buying a load of apples in the Appalachian area, often the lower quahty merchandise, and hauling it to Atlanta or other southern cities for sale. Thus they obtain a return load and the possibility of making a profit if market conditions are good.
Nearly 4,400 truckers of fresh fruits and vegetables were hcensed by the Department of Agricidture imder the Perishable Agricultural Commodities Act in 1959. Those licensed in- cluded most of the truck jobbers as well as a fairly large number of for-hire truckers who wished to have a PACA license if the opportunity for a profitable backhaul became available, or for other reasons. Some probably did not have the opportunity, and many others probably took advantage of it only once or twice during the year.
Wholesale Markets Probably 90 percent of the fresh fruits and
vegetables consumed in this country passes through one or more wholesale markets. Not all of this is handled by wholesalers. Farmers sell an unknown proportion directly to consmners at roadside stands, at the farm, and on the tree. They also sell some produce directly to retail stores.
Most wholesalers handling fresh fruits and vegetables are produce specialists. Some firms whose main line of business is in dry groceries or other types of food also handle some produce (table 2). Fruit and vegetable wholesalers sold 93 percent of the fruits and vegetables sold by all the wholesalers with identifiable sales of produce in 1958. General-line grocery wholesalers, includ- ing retailer cooperatives and voluntary groups, sold 4 percent of the total. Wholesalers selling other groceries—probably mostly frozen foods wholesalers—sold 2.6 percent of the total, and meat, poultry, and fish wholesalers accounted for 0.4 percent.
TABLE 2.—Merchant wholesalers selling fresh fruits and vegetablesj United States, 1958
Type of wholesaler
Establishments selling fresh fruits and
vegetables
Total
Fresh fruit, vegetable General-line grocery ^ Poultry, poultry products Fish, seafood Meat, meat products Other groceries and related products ^_-
Total produce wholesalers
Number 6,291
274 25
219
6,886
Percentage of each type of
wholesaler
Sales of fresh fruits and vegetables "
Total value
Percent 100.0 17.6 1.9 1.0 2.3 5. 1
Million dollars
2,925 132
2 1 7
79
As percentage of-
Total produce
sales
Percent 92.9 4.2
. 1
.02
. 2 2. 6
3, 146 100. 0
All sales of firms selling
produce
Percent 94.5 7.2 8.5
21. 1 10. 1 33.0
All sales of firms of this type
Percent 94. 5
2. 2 .2 . 2 .3
2. 1
1 Sales of fresh fruit, vegetable wholesalers represent sales of all firms in the group. Sales of other types of wholesalers are only those of firms reporting commodity- line sales.
2 Includes retailer cooperatives and voluntary groups.
3 Includes restaurant, bakery, hotel-supply houses; bread, baked goods distributors; canned foods whole- salers; frozen foods wholesalers; and others.
Census of Business {31, 1958, vol. 3).
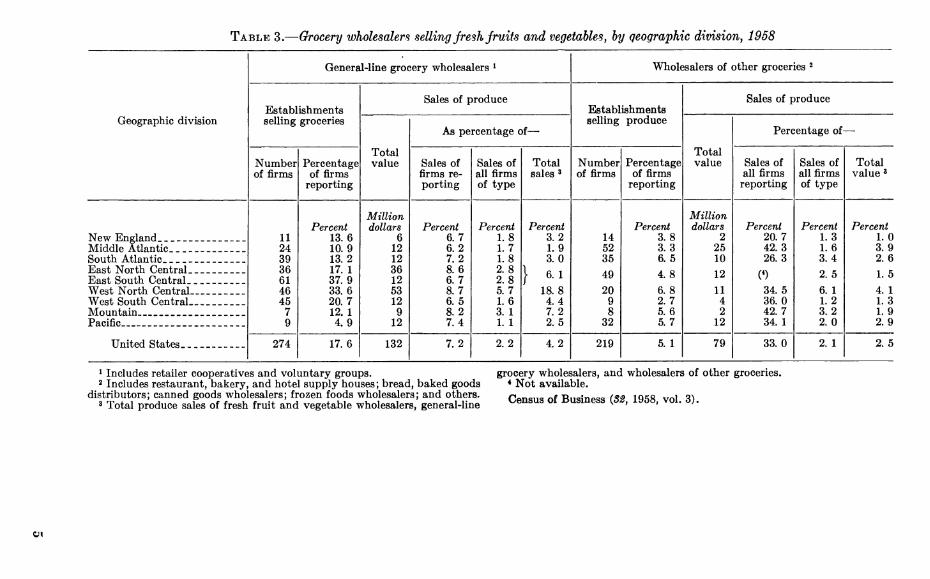
TABLE 3.— Grocery wholesalers selling fresh fruits and vegetablesj by geographic division, 1958
General-line grocery wholesalers ^ Wholesalers of other groceries ^
Establishments selling groceries
Sales of produce Establishments selling produce
Sales of produce
Geographic division
Total value
As percentage of—
Total value
Percentage of —
Number of firms
Percentage of firms
reporting
Sales of firms re- porting
Sales of all firms of type
Total sales 3
Number of firms
Percentage of firms
reporting
Sales of all firms reporting
Sales of all firms of type
Total value 3
New England 11 24 39 36 61 46 45
7 9
Percent 13.6 10.9 13.2 17. 1 37.9 33.6 20.7 12. 1 4.9
Million dollars
6 12 12 36 12 53 12
9 12
Percent 6.7 6.2 7.2 8.6 6.7 8.7 6.5 8.2 7.4
Percent 1.8 1.7 1.8 2.8 2.8 5.7 1.6 3. 1 1. 1
Percent 3.2 1.9 3.0
} »■■ 18.8
4. 4 7.2 2.5
14 52 35
49
20 9 8
32
Percent 3.8 3.3 6.5
4.8
6.8 2.7 5.6 5.7
Million dollars
2 25 10 12
11 4 2
12
Percent 20.7 42.3 26.3
34.5 36.0 42.7 34. 1
Percent 1.3 1.6 3.4
2.5
6. 1 1.2 3.2 2.0
Percent 1. 0
Middle Atlantic 3.9 South Atlantic 2.6 East North Central 1.5 East South Central West North Central 4. 1 West South Central-__ 1.3 Mountain 1.9 Pacific 2.9
United States 274 17.6 132 7.2 2. 2 4.2 219 5. 1 79 33.0 2. 1 2.5
1 Includes retailer cooperatives and voluntary groups. 2 Includes restaurant, bakery, and hotel supply houses; bread, baked goods
distributors; canned goods wholesalers; frozen foods wholesalers; and others. 3 Total produce sales of fresh fruit and vegetable wholesalers, general-line
grocery wholesalers, and wholesalers of other groceries. * Not available. Census of Business (5^, 1958, vol. 3).

Only about 5 percent of the sales of fruit and vegetable wholesalers was of other products, principally dry groceries and frozen foods. Produce was a minor part of the sales of most of the other types of wholesalers, except those selling other groceries, who had about a third of their sales in produce, and the eight fish merchants with 21 percent of their sales in produce.
The general-line grocery wholesalers selling produce were concentrated to a considerable ex- tent in Minnesota, the Dakotas, Iowa, Nebraska, Missouri, and Kansas (table 3). Most wholesale grocers handling produce in this region and in the West South Central Region were units of "chain" organizations of wholesale grocers. There were only a few of these organizations in other parts of the country.
The wholesalers of other groceries selling prod- uce were scattered over the country, although they were more important in the Middle Atlantic and West North Central States than elsewhere (tables).
Pruit and vegetable wholesalers were less con- centrated in the larger cities than meat and specialty-line grocery wholesalers, but more con- centrated than poultry and egg wholesalers and general-line wholesalers. Conversely, fewer fruit and vegetable wholesalers were located in areas of less than 300,000 population than any of the other thi*ee types of food wholesalers.
The Markets Studied
The 52 markets covered in this study were chosen to represent 145 wholesale produce markets throughout the country, as follows:
Size of market (1,000 carlots) All markets
Sample markets
43 or more Number
7 6
13 7
48 16 12 36
Number 7
25 to 42 3 15 to 24 7 10 to 14 4 3to9 14 2to2.9 4 ltol.9-_ -. 4 Less than 1 _ 9
Total 145 52
The universe represented by this sample con- tains nearly all of the metropolitan areas with enough wholesalers so that they might be called 'Wholesale markets." In general, wholesalers outside the markets studied here are in cities or towns with one to four firms. Such places seldom have enough volume to generate more than token sales between wholesalers, so there is considerable justification in not calling such groups of firms *'wholesale markets."
In 1958, there were nearly 5,200 produce whole- salers in wholesale markets and 2,274 in all other places (table 4). Wholesale handlers in the whole-
sale markets averaged about 80 percent larger than those in other places. This is partly because truck jobbers were relatively more numerous in small towns, and they seldom handle more than 100 carlots apiece per year. Most of the primary handlers in the smaller cities and towns were receiver-jobbers. About 125 brokers were listed in these other towns and cities. Probably many of them were shipping-point brokers.
TABLE 4.—Number of wholesalers and retail orga- nizations fiandling produce, wholesale markets and all other places, 1958
Type of firm Wholesale markets
All other places
Total
Receiver, commission mer- chant
Firms
943
656 1,536
481
Firms
128
918 285
38
Firms
1 071 Receiver-jobber, service
wholesaler 1, 574 Jobber, purveyor. _ 1, 821 Prepackager, repacker 519
Total 3,616 1,369 4,985
Truck jobber. _ 540 89 30
112
452 101
is'
1, 192 Trucker. _ __ 190 Shioper 30 Importer, exporter 130
Total 771 771 1, 542
All wholesale handlers. 4,387 2, 140 6,527
Broker 420 78
136 10
166
126 5 3
546 Distributor 83 Sales aeencv ... 139 Auction __ 10 Bu3âng broker, buying office,
sales agent 166
All brokers and agen- cies - 810 134 944
All wholesalers 5,197 2,274 7,471
Chain 257 36 30 16
137 13 46
550
394 Retailer cooperative Voluntary group
49 76
Wholesale grocer 566
All firms 5,536 3,020 8,556
Over 100 chains, most of which were small, were located outside the wholesale markets. The aver- age produce volume per chain probably was considerably less than half that of chains in the wholesale markets. There were 550 wholesale grocers in these places listed as handlers of fruits and vegetables. A high proportion of them handled only a few "hardware" items, such as potatoes and onions, sometimes with the addition of apples and citrus. About half of these whole- sale grocers were located in the South Central States.
Truck jobbers were most often found in the less-urbanized areas—the South, the Midwest, and the Mountain States. Jobbers were con-

centrated in the Northeast, where they were close enough to terminal markets to obtain their sup- plies personally.
The wholesale markets in this study handled about 1.6 million carlots of produce in 1958. Wholesalers in other places probably sold about one-half million carlots, much of which was bought either from wholesale handlers or through brokers and distributors in these wholesale markets.
Types of Markets
The markets studied are divided into seven types on the basis of four major characteristics—• the size of the market and three functional attri- butes (table 5). The functions considered include the importance of each market as a local wholesale market, each market's importance as a supplier of out-of-town wholesale buyers, and the importance of retail organizations as suppliers of the market.
The seven largest markets, each handling 48,000 carlots or more, are designated primary markets. Secondary markets, handhng from 9,000 to 34,000 carlots apiece, were divided into three functional groups: (1) Local wholesale markets, with sales to local wholesalers averaging 19 percent of the net supply for resale; (2) out-of-town wholesale mar- kets, with sales to out-of-town wholesale buyers averaging 32 percent of the net supply for resale ; and (3) other secondary markets, where neither type of wholesale sales was of major importance.
Tertiary markets, each with a net supply of from 4,000 to 7,000 carrots, were divided into: (1) chain markets, where direct purchases by retail organizations averaged 54 percent of the net supply, and (2) other tertiary markets, where direct purchases by retail organizations averaged 25 percent of net supply. Small markets, with net supply of 1,000 to 3,000 carlots each, consti- tute the final category.
TABLE 5.—Characteristics oj wholesale produce markets, by type oj market, 1958
Type of market and location Net supply
Sales to local whole- salers by primary
and secondary handlers ^
Sales to out-of-town wholesalers, retail organizations, and
exports 2
Direct pur- chases by
retail organi- zations 3
Primary markets : New York _-
lyOOO carlots 236 141 121 70 58 51 48
Percent 31 27 23 14 16 13 29
Percent 17 35 47 13 41 22 12
Percent 21
Los Angeles 9 Chicaffo -- 17 Philadelphia _ 23 Boston 20 San Francisco - _- 17 Detroit 31
Average - 103 24 23 18
Secondary markets: Local wholesale :
Pittsburgh - - 34 30 24 20 19 19 17 14
26 23 11 16 15 17 19 29
24 17 4 2
28 19 26 24
24 Dallas-Fort Worth __ 23 Washington 36 Houston 20 Denver 32 Miami - 47 Milwaukee 38 Louisville -_ 31
Average - 23 19 18 29
Out-of-town wholesale : Atlanta 29
17 16 17 15 13 13
9
9 8 6 1
13 12
5 11
48 36 41 25 34 28 31 40
22 New Orieans 23 Albanv-Schenectadv-Trov _ 47 Columbia 9 Tamna-St. Petersburg 31 Salt Lake City -- __ 21 Oklahoma City ___ 35 Raleigh 51
Averaere 16 8 32 29 Other:
Seattle-Tacoma 22 21 17
9
5 4 6 9
17 13
3 4
35 Minneapolis-St. Paul 20 Portland. Oree_ - 25 Omaha -- -- 49
Average _ 15 7 8 33
See footnotes at end of table.

TABLE 5.—Characteristics oj wholesale produce markets, by type of market, 1958—Continued
Type of market and location Net supply
Sales to local whole- salers by primary
and secondary handlers ^
Sales to out-of-town wholesalers, retail organizations, and
exports 2
Direct pur- chases by
retail organi- zations *
Tertiary markets: Chain:
Wichita ___ _
1,000 carlots
6 5 5 5
Percent
8 25
0 6
Percent
8 3
14 10
Percent
37 45 85 66
Little Rock Portland, Maine _ Greenville
Average - 5 5 3 54
Other: El Paso 7
5 5 4
13 12 13 18
15 10 12 51
20 35 27 99
Tulsa - Spokane Huntington
Average 5 14 22 25
Small markets: Winston-Salem 3
3 3 3 3 2 2 1
9 1 7 3
48 28 13 11 28 15
1 10
Albuquerque Duluth-Superior 20
40 28 51 27
Charleston --- -_- Wheeling Butte 1 Lincoln Other West Virginia 17
Average 2 3 22 18
1 Percentage of net supply for resale. 2 Excluding sales to out-of-town truck jobbers.
• Percentage of net supply.
Wholesale Market Structure 1958-59 The elements composing the market for fresh
fruits and vegetables or any other commodity are the firms which buy, sell, and handle the product. The relationships among those firms in buying, seUing, and handüng the product and in ownership or control constitute the structure or organization of the market.
Number, Size, and Type of Firms The wholesale produce markets of the United
States, comprised of 5,541 firms, had total sales of 2.7 million carlots in 1958 (tables 6 and 7). The sales figures included sales from one whole- saler to another^ as well as sales to retail organi- zations. About 1,600 primary handlers sold nearly 800,000 carlots. These included nearly 700 receivers, nearly 500 receiver-jobbers, and about 250 commission merchants.
Over 2,500 secondary handlers had total sales of 335,000 carlots. About 1,050 jobbers of five diflFerent types handled 148,000 carlots; 540 truck jobbers, 25,000; 484 purveyors and receiver- purveyors, 73,000; and 481 prepackagers and tomato repackers, 89,000 carlots. About 120 shippers and truckers sold 31,000 carlots and 112 importers and exporters sold 68,000 carlots of produce.
8
The 810 brokers and agencies had total sales of 849,000 carlots. These included 498 brokers and distributors seUing 495,000 carlots; 136 cooperative and importer's sales agencies with 257,000 carlots; 10 auctions with 46,000 carlots; 139 buying brokers and buying offices with 50,000 carlots; and 27 sales agents for New York City purveyors with 3,000 carlots.
There were 323 chains and affiliated groups which bought some produce directly from shipping point, not including many small chains which bought all of their produce from local wholesalers. These retail organizations had a total volume of 602,000 carlots of produce in 1958. In addition, 5 chain restaurants bought directly from shipping point.
Most wholesale handlers were small firms— nearly two-thirds sold less than 200 carlots in 1958 and another fifth sold between 200 and 499 carlots (table 6). Thirty-seven percent of the primary handlers, 81 percent of the secondary handlers, 71 percent of the shippers and truckers, and 46 percent of the importers and exporters sold less than 200 carlots a year. Wholesale handlers with sales of 1,000 carlots or more— 6 percent of the total—^made 38 percent of the sales of the entire group. The 10 percent with

TABLE'6.—Number oj firms oj each type and percentage distribution by size, U.S. wholesale produce markets, 1958-59
All firms
Size of firm, by annual volume of sales
Type of firm Less than
200 carlots
200 to 499 carlots
500 to 999 carlots
1,000 to 1,999
carlots
2,000 to 3,999
carlots
4,000 or more
carlots
Primary handlers: Receiver
Number 691 252 486
40 130
16
Percent 34 27 52 36 20 38
Percent 32 23 29 41 24 28
Percent 18 25 13 18 37
9
Percent 12 21
5 5
15 25
Percent 3 4 1
Percent 1
Commission merchant ^ _ _ 0) Receiver-jobber Commission wholesaler Service wholesaler 5 Wholesale grocer
Total 1,615 37 29 19 12 2 Ci)
Secondary handlers: Jobber 290
422 260
44 36
540 359 125 207 274
83 83 70 50 74 99 81 58 57 88
14 15 25 46 18
1 16 29 20 11
2 1 3 2 8
(0
2
Jobber (delivery) Banana jobber (}) Service jobber Secondary wholesaler Truck jobber Purveyor 3
12 17
0)
1 1 4
(0
Receiver-purveyor Prepackager 2 Tomato repacker
Total 2,557 81 14 3 1 (0 Shippers and truckers:
Mixed-load shipper 16 8 6
66 23
19 25 25
6 9
55 25 58
3
19 7 L.c.l. shipper 38 12 Packer-shipper 17 Merchant trucker 91
91 Itinerant trucker
Total .- 119 71
42 43 51
11
23 13 34
14
6 13 10
3
11 13 4
1
11 18
1
Importers and exporters: Importer 41
23 48
7 Commission importer Exporter
Total - 112 46 26 9 8 8 3
All wholfiSfllp. hiindlfirs 4,403 64 20 10 5 1 (0 Brokers and distributors :
Sellin g broker 362 28 30 48 30
11 8
10 8
13
22 21 36 15 44
27 39 17 27 33
28 28 26 19
7
12 4
11 23
3
1 Auction representative Terminal broker Carlot distributor 8 Distributor
Total 498 11 23 27 26 12 1
Sales agencies : Cooperative 79
57 23
7 31 12
23 13
17 23
5 23
1 21 Importer's.^
Total 136 15 26 19 19 12
50 2
9
Others: Auction 10
121 18 27
ñfi Buying broker 47
23 78
32 43 22
14 29
5 5 Buying office
Sales agent
All brokers and agencies _ 810 19 25 23 21 9 3
See footnotes at end of table.

TABLE 6.—Number ojfirms oj each type avd percentage distribution by size, U,S. wholesale produce market, 1958-59—Continned
AU firms
Size of firm, by annual volume of sales
Type of firm Less than
200 carlots
200 to 499 carlots
500 to 999 carlots
1,000 to 1,999
carlots
2,000 to 3,999
carlots
4,000 or more
carlots
Chains: Nflt.ional chain
Number 294 2 64
71 20
Percent Percent 6 6
22 28
Percent 6
21
25 5
Percent 46 21
17 15
Percent 16 31
23
Percent 26
"Rpffional chain 3
7 57
17 Local chain:
With warehouse 7 W^it.hniit "warehouse
Total 249 7 12 15 30 20 16
Tîpt.nilpr noonerative - 36 30
6 11 20
48 43
27 37
6 2 Vrklnn+ßrv ffroiiri - -
All rpt.ail oro"anizations 315 6 13 24 30 17 13
5 78 22
1 Less than 0.5 percent. 2 Number of warehouse divisions.
TABLE 7.—Sales by each type of firm, and percentage distribution by size, U.S. wholesale produce markets, 1958-59
Type of firm
Primary handlers: Receiver Commission merchant. Receiver-jobber Commission wholesaler Service wholesaler Wholesale grocer
Total or average..
Secondary handlers: Jobber Jobber (delivery) Banana jobber Service jobber Secondary wholesaler.. Truck jobber Purveyor Receiver-purveyor Prepackager Tomato repacker
Total or average. _
Shippers and truckers: Mixed-load shipper L.c.l. shipper Packer-shipper Merchant trucker Itinerant trucker
Total or average..
See footnote at end of table.
10
AU firms
1,000 carlots
365 169 144
14 92
7
792
33 52 47 10 6
25 46 27 60 29
335
12 7 5 5 2
31
Size of firm, by annual volume of sales
Less than 200
carlots
Percent 6 4
12 11 3 7
6
45 52 31 22 42 93 40 23 12 62
40
61 72
16
200 to 499 carlots
Percent 20 12 30 39 12 20
19
0)
39 35 42 54 28 7
37 38 20
32
C)
6 8
20 28
10
500 to 999 carlots
Percent 23 26 30 32 39 10
27
0)
12 6
12
30
0) 0)
0) 40
17
0) 44
58 19
34
1,000 to 1,999
carlots
Percent 31 40 23 18 28 63
31
C) 0) 0)
0) 0)
18
C)
"(0"
18
2,000 to 3,999
carlots
Percent 13
0) 5
18
13
0) 0)
10
0)
0)
4,000 or more
carlots
Percent
0)
i})
0)

TABLE 7.— Sales by each type oj firm, and percentage distribution by size, U.S. wholesale produce markets 1958-ô9—CoTLtm\iea
All firms
Size of firm, by annual volume of sales
Type of firm Less than
200 carlots
200 to 499 carlots
500 to 999 carlots
1,000 to 1,999
carlots
2,000 to 3,999 carlots
4,000 or more
carlots
Importers and exporters: Importer
Number 39 17 12
Percent 1 5 9
Percent 6 5
46
Percent 3
12 25
Percent 14 20 20
Percent 33 58
Percent 4
Commission importer Exporter
Total or average 68 3 13 9 16 34 24
All wholesale handlers 1,228 16 22 23 23 11 4
Brokers and distributors: Selling broker. 355
23 26 76 15
1 1 1 1 4
8 10 14
3 22
19 34 15 12 41
37 0)
34 15
C)
0) C)
36 35
0)
0) Auction representative Terminal broker Carlot distributor 34 Distributor
Total or a vera ce 495 1 8 19 33 31 7
Sales agencies : Cooperative 55
202 2 1
16 1
24 3
30 8
0) 17
0) Importer's 71
Total or average 257 1 4 7 13 16 58
Others: Auction 461
3
23 0)
77 Buying broker 12
7 48
28 27 42
32 0)
0) 0) Buying office
Sales agent
All brokers and agencies 849 2 8
1 1
5 19
15 24 25 26
Chains: National chain 261
167
107 7
2 6
13 0)
23 13
16 0)
17 36
44
57 Regional chain 1
1 13
45 Local chain:
With warehouse Without warehouse
Total or average 542 1 2 5 19 27 46
Retailer cooperative 35 25
1 3 9
34 38
35 53
0) en Voluntary group
\ j
All retail organizations 602 1 2 8 21 25 43
1 Withheld to avoid disclosure of individual firm's operations.
sales of 500 to 999 carlots accounted for another 23 percent. Most of the large firms were primary handlers—15 percent of them accounted for nearly half of the total sales of the group.
In contrast, there were few small brokers and agencies. Only 19 percent had sales of less than 200 carlots, while about 33 percent had sales oí 1,000 carlots or more, accounting for three-fourths of all sales of the group. Most of the small firms were buying brokers and sales agents, while the large firms were mostly selHng brokers, terminal brokers, carlot distributors, or sales agencies.
Most retau organizations are large. In 1958, 60 percent handled more than 1,000 carlots apiece. The local chains are considerably smaller than the national and regional groups. Retailer coopera- tives and voluntary groups are predominantly in the middle-size groups, between 500 and 2,000 carlots.
Type of Firm by Type of Market The distribution of different types of firms is an
important element in the organization of the vari- ous classes of markets. The organization of a
11

large and complex market such as New York or Chicago is different from the organization of a small, straightforward market such as Albu- querque or Lincoln. The large market performs a greater variety of functions and requires a greater variety of firms.
Receivers were foimd in all the primary markets and all the secondary markets but one, Oklahoma City. They were found in only half of the tertiary chain markets, all of the other tertiary markets, and only a quarter of the small markets. Sales of receivers accounted for a third of the net supply for resale in all wholesale markets, ranging from 9 percent in small markets to 40 percent in sec- ondary local wholesale markets (table 8).
Commission merchants and commission whole- salers are confined mostly to the larger markets. They sold 28 percent of the net supply for resale in primary markets and no more than 8 percent in any other type of market. They were most important in Philadelphia and Boston.
The importance of service wholesalers varied inversely with that of receivers in many of the markets. They were most important in small markets and tertiary chain markets. On the con- trary, there were no service wholesalers in four of the seven primary markets and in only one, Detroit, were they of much importance. Although five of the eight secondary local wholesale markets had service wholesalers, they were important only in the Dallas-Fort Worth and the Milwaukee markets. They played a major role in one out-of- town wholesale market—Salt Lake City—and a moderate one in New Orleans and Albany- Schenectady-Troy.
Wholesale grocers found in only seven of the wholesale markets studied were confined largely to the Plains and Mountain States.
Jobbers were most important in the more com- plex primary markets, where they accounted for 18 percent of the net supply for resale, ranging from 8 percent in San Francisco-Oakland to 32 percent in New York City, the largest market of all. They accounted for 16 to 17 percent of the net supply for resale in all other primary markets except Los Angeles. There were no jobbers in over half of the small markets and in Seattle- Tacoma and Portland, Maine.
Truck jobbers were not a major factor in any type of market, although they were fairly im- portant in a few markets—notably Louisville and Houston. About 20 percent of the markets had none at all.
Purveyors became important chiefly in cities with a substantial hotel and restaurant business such as Miami, Washington, San Francisco, and New York. Their importance in Greenville and Raleigh may be due more to institutional business.
Prepackagers and tomato repackers accounted for 6 to 9 percent of the net supply for resale in all types of markets except the tertiary. Two small markets had none.
Brokers and distributors were most important in markets located between Chicago and Denver east-west, and Minneapolis-St. Paul, and Houston and Dallas-Fort Worth north-south. Outside of this area, they accounted for more than 50 percent of the net supply for resale only in San Francisco- Oakland, Albany-Schenectady-Troy, and Wheel- ing.
Buying brokers were found only in the larger markets. They were most important in Boston and Philadelphia, where they represented cus- tomers both at the fruit auctions and the terminal sales, accounting for 11 to 12 percent of the volume. They handled 6 to 8 percent of the
TABLE 8.—Sales of specified types of wholesalers as percentage^ of net supply for resale, U.S. wholesale produce markets, 1958-59
Commis- sion mer- Serv- Job- Purveyors Repack- Brokers
Receiv- chants ice Whole- bers Truck and re- ers and and dis- Buying Type of market ers and com- whole- sale of all job- ceiver- pre- trib- brokers
mission salers grocers types bers purveyors pack- utors whole- agers salers
Per- Per- Per- Per- Per- Per^ Per- Per- Per- Per- cent cent cent cent cent cent cent cent cent cent
Primary 34 28 1 C) 18 2 7 7 40 7 Secondary:
Local wholesale 40 8 14 C) 9 4 9 9 48 2 Out-of-town whole-
sale 39 18
17 38
9
1 3
6 14
25 7
37
4
--
(0
10 4
10 5 9
3 2
3 6 2
4 3
13 8 2
9 6
11
1
45 65
27 36 31
1 Other _ -
Tertiary : Chain _ _ __ Other.. _ __ 6
Small
All markets 33 15 8 1 13 3 6 8 44 4
1 Less than 0.5 percent.
12

business in New York, Los Angeles, Detroit, and Pittsburgh and 4 percent in Chicago and New Orleans. In these cities the bulk of their pur- chases were made at the fruit auctions, except in Los Angeles, an important shipping market, and New Orleans where they bought substantial quan- tities of bananas.
Firm Size and Market Type
The largest wholesalers are foimd in the largest markets. Firms seUing as much as 4,000 carlots a year were located only in the primary markets (table 9). The largest firms accoimted for 8 per- cent of the sales of primary handlers in primary markets and 12 percent of the sales of brokers and distributors. In secondary markets, the larg-
est firms of primary handlers and of brokers and distributors sold between 2,000 and 3,999 carlots. In tertiary and small markets, the largest firms were generally in the next smaller size class.
Secondary handlers averaged smaller than either primary handlers or brokers and distributors (table 9). However, the pattern of larger firms in larger markets is similar to that of the other groups of firms, except that the largest firm in the primary markets were in the 2,000 to 3,999 carlot group.
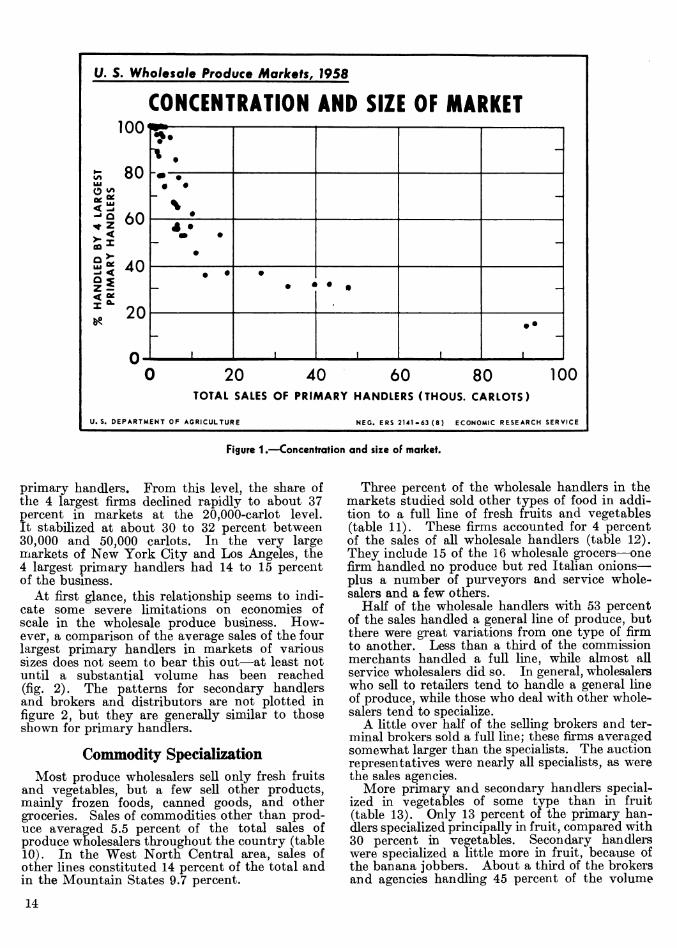
Concentration, as measured by the share of the 4 largest primary handlers, is almost entirely a function of the size of the market (fig. 1). In the smallest markets, the four largest primary han- dlers did from 95 to 100 percent of the business. In some markets, there were only two or three
TABLE 9.—Percentage distribution of volume sold by major groups of handlers in specified types of markets^ by size of firm, U.S. wholesale produce markets, 1958-59
Firms with sales of—
Type of handler and market Less than
200 carlots
200 to 499
carlots
500 to 999
carlots
1,000 to 1,999
carlots
2,000 to 3,999
carlots
4,000 or more
carlots
All firms
Primary Handlers
Primary
Percent
4
8 8 4
8 10 20
Percent
16
22 19 22
34 16 33
Percent
22
19 21 45
58 39 38
Percent
33
40 41 23
Percent
17
11 11 6
Percent
8
Percent
100 Secondary:
Ijonal wholesale 100 Out-of-town wholesale - 100 Other 100
Tertiary : Chain 100 Other 35
9 100
Small - - 100
All markets 6 19 26 33 12 4 100
Secondary Handlers
Primary 37
38 50 58
34 33 47
30
40 25 24
66 32 36
15
17 25 18
12
5
6 100 Secondary :
Local wholesale _ 100 Out-of-town wholesale 100 Other 100
Tertiary: Chain 100 Other 35
17 100
Small 100
All markets 40 32 16 9 3 100
Brokers and Distributors
Primary 2
1 0)
1
5
9
6 3 5
16 23 16
25
23 11 23
26 54
26
41 27 29
53 23 62
26
29 59 42
12 100 Secondary:
Local wholesale 100 Out-of-town wholesale 100 Other 100
Tertiary: Chain 100 Other ___ - 100
Small -- - - -- 22 100
All markets __ _ _ 1 8 23 31 32 5 100
Less than 0.5 percent.
13
1 U. s. Wholesale Produce Markets, 1958
%
HA
ND
LE
D
BY
4 LA
RG
ES
T P
RIM
AR
Y
HA
ND
LE
RS
^
K3
i^
O
0
0
O
CONCENTRATION AND SIZE OF MARKET
-
• • • • -
4 • m •
• -
• • • • * • • -
1 1 1 1
• •
1
0 20 40 60 80 100 TOTAL SALES OF PRIMARY HANDLERS (THOUS. CARLOTS)
U.S. DEPARTMENT OF AGRICULTURE NEC. ERS 2141-63(8) ECONOMIC RESEARCH SERVICE
Figure 1.—Concentration and size of market.
primary handlers. From this level, the share of the 4 largest firms declined rapidly to about 37 percent in markets at the 20,000-carlot level. It stabilized at about 30 to 32 percent between 30,000 and 50,000 carlots. In the very large markets of New York City and Los Angeles, the 4 largest primary handlers had 14 to 15 percent of the business.
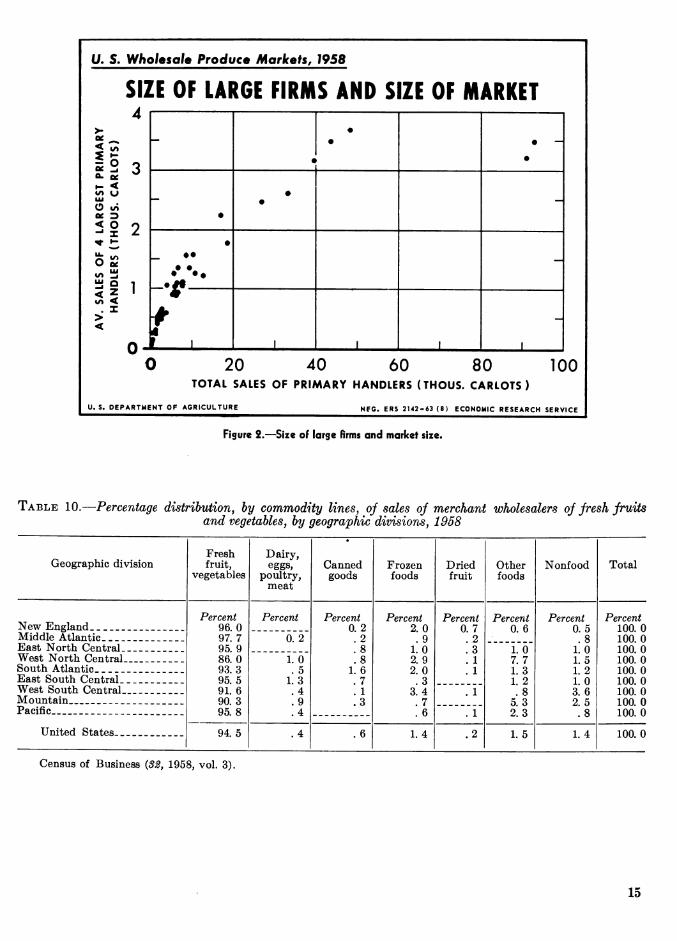
At first glance, this relationship seems to indi- cate some severe limitations on economies of scale in the wholesale produce business. How- ever, a comparison of the average sales of the four largest primary handlers in markets of various sizes does not seem to bear this out—at least not until a substantial volume has been reached (fig. 2). The patterns for secondary handlers and brokers and distributors are not plotted in figure 2, but they are generally similar to those shown for primary handlers.
Commodity Specialization Most produce wholesalers sell only fresh fruits
and vegetables, but a few sell other products, mainly frozen foods, canned goods, and other groceries. Sales of commodities other than prod- uce averaged 5.5 percent of the total sales of produce wholesalers throughout the country (table 10). In the West North Central area, sales of other lines constituted 14 percent of the total and in the Mountain States 9.7 percent.
Three percent of the wholesale handlers in the markets studied sold other types of food in addi- tion to a full line of fresh fruits and vegetables (table 11). These firms accounted for 4 percent of the sales of all wholesale handlers (table 12). They include 15 of the 16 wholesale grocers—one firm handled no produce but red Italian onions— plus a number of pm*veyors and service whole- salers and a few others.
Half of the wholesale handlers with 53 percent of the sales handled a general line of produce, but there were great variations from one type of firm to another. Less than a third of the commission merchants handled a full line, while almost all service wholesalers did so. In general, wholesalers who sell to retailers tend to handle a general line of produce, while those who deal with other whole- salers tend to specialize.
A little over half of the selling brokers and ter- minal brokers sold a full line; these firms averaged somewhat larger than the specialists. The auction representatives were nearly all specialists, as were the sales agencies.
More primary and secondary handlers special- ized in vegetables of some type than in fruit (table 13). Only 13 percent of the primary han- dlers specialized principally in fruit, compared with 30 percent in vegetables. Secondary handlei*s were specialized a little more in fruit, because of the banana jobbers. About a third of the brokers and agencies handling 45 percent of the volume
14
U. s. Whofeso/e Produce Markets, 1958
SIZE OF LARGE FIRMS AND SIZE OF MARKET
<
O
<
O in
> <
4 •
o
< u
O
3
2
« • • —
•
• • -
X •
tu
Û 1
—
< X
•
n- 1... 1 1 J 20 40 60 80 100
TOTAL SALES OF PRIMARY HANDLERS (THOUS. CARLOTS )
DEPARTMENT OF AGRICULTURE MFC. ERS 2I«-63 {«) ECONOMIC RESEARCH SERVICE
Figure S.—^Size of large firms and market size.
TABLE 10.—Percentage distnbution, by commodity lines, of sales of merchant wholesalers of fresh fruits and vegetables, by geographic divisions, 1958
Geographic division Fresh fruit,
vegetables
Dairy, eggs,
poultry, meat
Canned goods
Frozen foods
Dried fruit
Other foods
Nonfood Total
New England Percent
96.0 97.7 95.9 86.0 93.3 95.5 91. 6 90.3 95.8
Percent Percent 0.2 .2 .8 .8
1. 6 .7 . 1 .3
Percent 2.0 .9
1.0 2.9 2.0 .3
3.4 .7 .6
Percent 0.7 .2 .3 . 1 . 1 ...
__.
Percent 0. 6
Ï."Ô' 7.7 1.3 1.2 .8
5.3 2.3
Percent 0.5 .8
1.0 1. 5 1.2 1.0 3.6 2.5 .8
Percent 100 0
Middle Atlantic _ 0.2 100 0 East North Central__ _ _ _. 100 0 West North Central _ _ 1.0
. 5 1.3 .4 .9 .4
100 0 South Atlantic _ 100 0 East South Central _ 100 0 West South Central.__ 100 0 Mountain _ 100 0 Pacific 100 0
United States 94.5 .4 .6 1.4 .2 1.5 1.4 100 0
Census of Business {SZ, 1958, vol. 3).
15

TABLE 11.—Degree oj specialization oj wholesalers, by type of firm, U.S. wholesale produce markets, (Percentage of each type of firm)
1958-59
Firms handling complete line of produce Firms specializing in —
Type of firm No speciali- zation
Some speciali- zation
Plus other
types of food
Several com-
modity classes
One class of
com- modities
A single com-
modity
Several commodi-
ties of different classes
Total
Primary handlers: Receiver
Percent 36 23 67 20 83
Percent 2 7 2 3 3
Percent
__
___
94
Percent 22 27
8 51
2
Percent 21 20
9 12
1 6
Percent 11
5 7 3
Percent 8
18 4
11
Percent 100
Commission merchant 100 Receiver-jobber 100 Commission wholesaler. __ 100 Service wholesaler 100 Wholesale grocer 100
Average 47 3 2 18 15 7 8 100
Secondary handlers: Jobber 47
71 3 3
1 2
22 13
9 4
8 1
100 5 3 3 _-
21 93
10 6
100 Jobber (delivery) 100 Banana jobber 100 Service jobber 88
38 73 63 70
5
5 6 1 2 2 9
2 3
15 3 4
16 7
100 Secondary wholesaler
--- 4
37 5 9
11 16
13 4 2 8
33
100 Truck jobber _ 100 Purveyor 100 Receiver-purveyor _ 100 Prepackager 100 Tomato repacker 100
Average 47 2 4 9 6 24 8 100
Shippers and truckers: Mixed-load shipper 28
76 17
7
53 12
13 6 12
100 L.c.l. shipper 100 Packer-shipper 50
21 35
33 20 30
100 Merchant trucker. 31
15 21 20
100 Itinerant trucker 100
Average 14 28 23 18 17 100
Importers and exporters: Importer 20
45 12
38 18 19
42 33 11
100 Commission importer __ 4
19 100
Exporter 5 19 15 100
Average 9 2 8 7 22 25 27 100
All wholesale handlers 45 2 3 13 10 18 9 100
Brokers and distributors: Selling broker 43 6
4 2 18
47 23 17 10
15 38
3 17 10
10 11 18 48 40
6 100 Auction representative« _* 100 Terminal broker 51
12 37
5 100 Carlot distributor 2 4 100 Distributor 3 100
Average 38 5 2 19 16 16 4 100
Sales agencies: Cooperative 3 1 88 1
100 7 100
Importer's _ _ 100
Average-_ 1 1 51 43 4 100
Others: Auction 100
22 100
Buying broker 57 89
100
37
4 13 4 11
100 Buying office 100 Sales agent 100
4 1 16 All brokers and agencies 20 18 4 100
1 Less than 0.5 percent.
16

TABLE 12.—Degree of specialization oj wholesalers ^ by type of firm, U.S. wholesale produce markets, 1958-59 (Percentage of volume of each type of firm)
Firms handling complete line of produce Firms specializing in—
Type of firm No speciali- zation
Some speciali- zation
Plus other
types of food
Several com-
modity classes
One class of
com- modities
A single com-
modity
Several commodi-
ties of difiFerent classes
Total
Primary handlers: Receiver
Percent 47 34 75 27 88
Percent 3 9 1 1 2
Percent 1 __
_.
100
Percent 18 26
8 46
1
Percent 18 19
7 8 1
(0
Percent 8 1 2 1
Percent 5
11 2
17
Percent 100
Commission merchant 100 Receiver-jobber 100 Commission wholesaler. 100 Service wholesaler 100 Wholesale grocer __ __ __ _ __ 100
Average 54 4 3 16 14 4 5 100
Secondary handlers: Jobber 55
71 2 5
1 2
23 15
9 2
4 1
100 4 2 3 _.
25 86
6 4
100 Jobber (delivery) 100 Banana jobber 100 Service jobber 90
31 82 51 72
5
2 7 3
(0 3 6
4 9 3 2 1
14 14
100 Secondary wholesaler.
42" 5
40 4 4
14 24
11 5 1 4
26
100 Truck jobber __ ___ 100 Purveyor 100 Receiver-purveyor 100 Prepackager 100 Tomato repacker 100
Average 39 3 7 11 7 27 6 100
Shippers and truckers: Mixed-load shipper __ 31
93 35
7
50 5
9 10 2
100 L.c.l. shipper 100 Packer-shipper 34
23 54
31 40 15
100 Merchant trucker 17
15 13 16
100 Itinerant trucker 100
Average _ 40 24 16
10 35 15
13
86 37
4
7
4 25
9
100
Importers and exporters: Importer 100 Commission Importer 3
26 100
Exporter 5 7 34 100
Average 5 46
1 3
1 4
6 15
17 12
60 14
10 6
100 All wholesale handlers _ « 100
Brokers and distributors: Selling broker 53 5
4 1 13
56 22 17 4
10 30
16 9
10 10 8
43 32
8 100 Auction representative 100 Terminal broker 68
23 51
2 100 Carlot distributor (0 1 100 Distributor 4 100
Average. _ 47 4 1 16 11 15 6 100
Sales agencies: Cooperative 4 4 90 (0
100 2 100
Importer's 100
Average 1 1
100 16
19 79 (0 100
Others: Auction 100 Buying broker.__ . _. 67
80 100
9 3 5 20
100 Buying office 100 Sales agent _ 100
All brokers and agencies 32 3 (}) 15 13 33 4 100
1 Less than 0.5'percent.
17

TABLE 13.—Principal commodity lines of firms specializing in various commodities or commodity lines, by major groups of firms j U.S, wholesale produce markets, 1958-59
Principal commodity line Primary handlers Secondary handlers Brokers and agencies All wholesalers
Firms Volume Firms Volume Firms Volume Firms Volume
General line of fruit Percent
3 4 5 1
Percent 3 3 4 1
Percent 3 1 1
10
Percent 4 1 1
14
Percent 7
11 6
10
Percent 9 7 4
25
Percent
Í 4 8
Percent 6
Citrus fruit _ 4 Deciduous fruit. 3 Other fruit, including bananas 15
Total... 13 11 15 20 34 45 19 28
General line of vegetables Hardware vegetables _ _
11 10
9
9 10 9
5 6
16
6 10 14
4 14
6
3 12
5
7 9
12
6 11
Wet vegetables 8
Total 30 28 27
1 6
30
4
24
1 3
20 28 25
Melons 3 5
1 3
(0 3
1 5
1 Other specialties 3
All specialist firms 51 43 49 54 62 68 53 57
1 Less than 0.5 percent.
specialized in fruit, with about a quarter of them selling 20 percent of the total in vegetables. If the sales agencies and auctions were separated from the other brokers and agencies, the remainder would not be so highly specialized in fruit.
The principal commodity lines in table 13 were not necessarily the only types of produce handled by these firms. Many had a secondary line or lines in addition to the principal one shown here.
Large primary handlers of most types were more likely to handle a general line of produce than were
TABLE 14.—Percentage oj firms handling a general line oj produce, by size of firm, U.S. wholesale produce markets, 1958-59
TABLE 14.—Percentage of firms handling a general line of produce, by size of firm, U.S. wholesale produce markets, 1958-59—Continued
Type of firm Small firms
Medium firms
Large firms
Primary handlers: Receiver
Pet. 26 15 66 21
100 83
Pet. 34 16 69 18 93
100
Pet. 54
Commission merchant. _ Receiver-jobber Commission wholesaler. Service wholesaler Wholesale grocer
45 90 33 99
100
Average 46 46 64
Secondary handlers: Jobber! . 49
75 100 49 73 84 72
11
62 84 85 43
100 96 86
24
65 Jobber (delivery) ^ Service jobber
71 100
Secondary wholesaler._ _ Truck jobber
0
Purveyor 100 Receiver-purveyor Prepackager, tomato re-
packer
70
10
Average 54 54 36
Type of firm Small firms
Medium firms
Large firms
Shippers and truckers: Mixed-load shipper
Pet. Pet. 0
50 0 0
Pet. 35
L.c.l. shipper 67 100 Packer-shipper 22 Merchant trucker 8 0
Average 8 8 38
Importers and exporters: Importer 0
0 40
0 0
53
0 Commission importer. _ _ Exporter
10 29
Average 19 30 10
All wholesale handlers 50 48 56
Brokers and distributors: Selling broker 5
0 33
0 0
50 0
46 29
8
59 Auction representative. _ Terminal broker Car lot distributor Distributor
5 58 19 77
Average 6 41 52
Sales agencies 0 0 0
Others: Auction 0 Buvine broker 48
100 100
73 100 100
72 Buvinsc office 67 Sales aeent .
All brokers and agencies 35 45 43
1 Includes banana jobbers.
18

TABLE 15.—Percentage of firms handling a general line of produce, by type of market, U.S. wholesale prod- uce markets, 1958-59
Percentage of firms Percentage of voh ime
Type of market Primary handlers
Secondary handlers
All wholesale handlers
Wholesale handlers
Wholesale handlers except
importers and exporters
Brokers and
agencies
Primary _ Percent
23
44 60 86
70 72 94
Percent 53
55 47 62
72 53 45
Percent 44
50 53 74
72 62 76
Percent 42
51 54 85
80 82 87
Percent 44
54 63 85
80 82 87
Percent 19
Secondary: Local wholesale Out-of-town wholesale
49 36
Other Tertiary:
Chain Other
Small__
63
81 59 81
All markets _ _ _ _ 52 53 53 54 56 35
the smaller firms of the same t3rpe (table 14). This was also true of jobbers, but not of most other types of secondary handlers. Few small selling brokers handled a complete line, while more than half of the medium- and large-sized firms did so.
Specialized firms were concentrated mostly in the larger markets. Over three-fourths of the primary handlers in the primary markets were specialists, but only 6 percent in the small markets (table 15). Similarly, in the primary markets brokers and distributors selling 81 percent of the volume were specialists, as compared with 19 percent in the small markets. Secondary handlers were more evenly distributed between specialists and general-line firms in all types of markets.
Interfirm Relationships Several hundred produce wholesalers own or
have a controlling interest in other firms in the produce business. Some of these relationships are a result of the definition of the firm used in this study. By defining the firm on a functional basis, 71 companies or groups of companies under com- mon ownership were treated as two (occasionally more) firms, each performing markedly different functions. Sixteen of the primary firms were receivers; 17 of the secondary firms were prepack- agers and 10 tomato repackers. The others are scattered through about half of the 42 types of firms identified in this study.
In total, 318 wholesale handlers, or 7 percent of all firms, owned or controlled other firms in the produce business (table 16). These firms ac- counted for 17 percent of the sales of all wholesale handlers. Primary and secondary handlers com- prised 94 percent of the wholesale handlers owning or controlling others and 95 percent of the sales.
There were 62 brokers and distributors and 6 buying brokers who owned or controlled others,
or 12 percent of all brokers and distributors. They had 23 percent of total sales.
Seventy-seven of the wholesalers with total sales of 45,000 carlots owned one or more farms or orchards; 88 owned or had an interest in a pack- inghouse or shipping operation; 110 with sales of 83,000 carlots owned other wholesalers in the same market; and 111 with sales of 72,000 carlots owned wholesale firms in other markets.
Two national chains own several packinghouses. Two regional chains and 2 local chains own prod- uce wholesalers which sell to the general public as well as supplying the chain's own stores.
About 400 wholesalers with total sales of 362,000 carlots were owned by other firms in the produce business (table 17). Most of these were local units of multi-unit operations, including all of the cooperative and importer's sales agencies and a number of brokers, service wholesalers, and receiver-jobbers. Most of those owned by other firms in the same market were prepackagers, tomato repackers, selling brokers, or purveyors. Thirteen wholesalers are owned by growers, packers or shippers, including four receivers, two commission merchants, and four tomato re- packers. Sales of wholesale handlers owned or controlled by other firms in the produce business amounted to 9 percent of the total volume of all wholesale handlers; those of brokers and distrib- utors 13 percent.
''Chain'' or multi-unit wholesalers are not important in the wholesaling of fresh fruits and vegetables. In 1954—the latest year for which data are available—''chain" merchant wholesalers with 10 or more units operated 2 percent of the establishments with 4 percent of the sales in the United States. Those with four to nine units each had 1 percent of the establishments with 2 percent of sales, and those with two or three units each, 4 percent of the establishments with
19
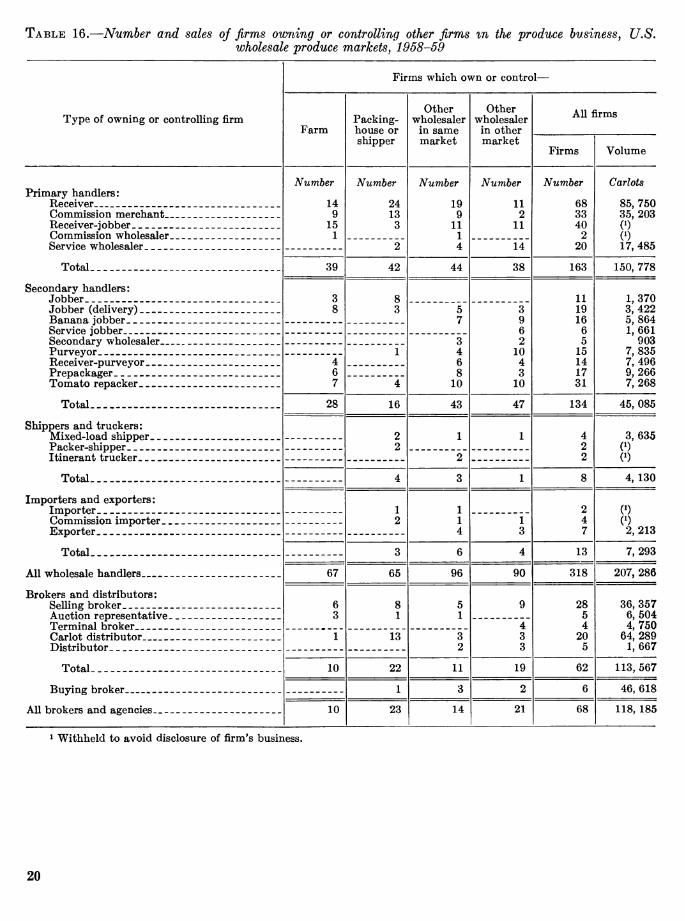
TABLE 16.—Number and sales of firms owning or controlling other firms m the produce business, U.S. wholesale produce markets, 1958-59
Firms which own or control—
Type of owning or controlling firm Farm
Packing- house or shipper
Other wholesaler
in same market
Other wholesaler
in other market
All firms
Firms Volume
Primary handlers: Receiver
Number
14 9
15 1
Number
24 13
3
Number
19 9
11 1 4
Number
11 2
11
Number
68 33 40
2 20
Carlots
85, 750 Commission merchant _ 35, 203 Receiver-jobber (0 Commission wholesaler 0) Service wholesaler 2 14 17, 485
Total 39 42 44 38 163 150, 778
Secondary handlers: Jobber 3
8 8 3
11 19 16
6 5
15 14 17 31
1,370 Jobber (delivery) __ _ 5
7 3 9 6 2
10 4 3
10
3,422 Banana jobber 5,864 Service jobber 1, 661 Secondary wholesaler 3
4 6 8
10
903 Purveyor 1 7,835 Receiver-purveyor 4
6 7
7,496 Prepackager 9,266 Tomato repacker 4 7,268
Total — 28 16 43 47 134 45, 085
Shippers and truckers: Mixed-load shipper __ _ 2
2 1 1 4
2 2
3,635 Packer-shipper 0) Itinerant trucker 2 0)
Total _ - 4 3 1 8 4, 130
Importers and exporters: ImDorter 1
2 1 1 4
2 4 7
(0 Commission importer _ 1
3 0)
Exporter 2,213
Total _ 3 6 4 13 7,293
All wholesale handlers 67 65 96 90 318 207, 286
Brokers and distributors: Selling broker 6
3 8 1
5 1
9 28 5 4
20 5
36, 357 Auction reDresentative 6,504 Terminal broker __ 4
3 3
4,750 Carlot distributor 1 13 3
2 64, 289
Distributor 1,667
Total 10 22 11 19 62 113,567
Buying broker _ 1 3 2 6 46, 618
All brokers and agencies _ 10 23 14 21 68 118, 185
1 Withheld to avoid disclosure of firm's business.
20

TABLE 17. 'Wholesale produce firms owned or controlled by other firms, U.S. wholesale produce markets, 1958-59
Type of firm owned or controlled Firms owned or
controlled by others in same
market
Firms owned or controlled by others outside this market
All firms owned or controlled by other firms
Firms Volume
Primary handlers: Receiver _
Number 9 2
Number 14
6 27 36
7
Number 23
8 27 36
9
1,000 carlots
19 4
14 40
6
Commission merchant Receiver-jobber Service wholesaler. Wholesale grocer. 2
Total- __. 13 90 103 83
Secondary handlers: Jobber._ _ _ __ 2
4 2 4 7 2 3 8
22 28
0) 0)
0)
Jobber (delivery) _ _ Banana jobber __ _ 7 1 Truck jobber 2
3 8
17 10
Purveyor __ _ 1 1 7 5
Receiver-purveyor ____ __ ___ Prepackager _ 5
18 Tomato repacker __ _ __
Total 46 30 76 16
Shippers and truckers: Mixed-load shipper 2 2
1 2
8 0)
Packer-shipper 1 Itinerant trucker 2
Total _ 4 1 5 3
Importers and exporters: Importer 1
1 2 1
3 2
0) 0) Exporter
Total 2 3 5 3
All wholesale handlers _ 65 124 189 105
Brokers and distributors: Selling broker 9
1 31
1 6 1
40 2 6 6
0)
0)
54 Auction representative Terminal broker _ ___ __ 6 Carlot distributor ._ 5
Total 15 39 54 66
Sales agencies: Cooperative 79
57 79 57
55 202 Importer's __ ___
Total 136 136 256
Others: Auction _ 3 3
1 18
P) 0)
30 Buying broker 1 1 Buying oifice 17
All brokers and agencies 17 195 212 362
1 Withheld to avoid disclosure.
21

9 percent of sales (^^, 1954, vol. 3). It is probable that there has been some decline since that time.
The fruit and vegetable business is about mid-way among various types of food wholesalers in percentage of total sales made by single-unit firms in 1954.
Percent Voluntary group grocery wholesalers 53 Retailer cooperative food wholesalers. _ 75 Cash-carry food depots 17 Other general-line grocery wholesalers __ 67 Bakery, restaurant, hotel supply houses. 94 Canned food wholesalers 93 Dairy products distributors 79 Frosted, frozen food distributors 76 Poultry, poultry products distributors__ 84 Meat, meat products distributors 94 Fresh fruit, vegetable wholesalers 84
Legal Form of Organization
Most large wholesale firms were corporations, while most small firms were single-owner pro- prietorships (table 18). The same general relationships with some variation, applied for most types of firms.
There were no partnerships among small brokers and distributors, chiefly because these are mostly one-man operations with not enough business to support two partners. There were more proprie- torships among the large brokers and distributors than among wholesale handlers, largely because a large-volume brokerage operation can be handled with fewer employees and a smaller investment than other types of wholesale operations.
Marketing Channels
The wholesale markets of the Nation sold a total of 2.1 million carlots of produce in 1958, of which 1.6 million passed through one or more markets and 0.5 million bypassed the market (table 19). About 5 percent of this total may represent double-counting of the same produce, since 35,000 carlots were bought from wholesale handlers in other markets and 85,000 carlots through sales agencies or brokers in other markets. Most of the sellers in these cases were undoubtedly located in other wholesale markets.
The figures on marketing channels were com- piled by summing the data for the individual markets, weighted to represent the group of markets from which the sample was drawn. They do not treat all markets as though they were part of a single market. In other words, out-of- town sales of firms in each market were handled as out-of-town sales in these summary tables even where they were made to firms in other wholesale markets.
The major channels through which produce passes are shown in tables 19 to 22. The total
22
supply entering the wholesale markets was divided among major groups of buyers as follows:
Percent Brokers and distributors 19 Sales agencies 6 Primary handlers 35 Secondary handlers 7 Shippers, truckers, importers, exporters. 2
All wholesalers 69 Retail organizations 26 Retailers, eating places 3 Others 2
Total 100
Most of the supply—69 percent—came directly from shipping point or port of entry; 13 percent was imported; and 10 percent came from local growers.
Nearly a third of the net supply entering these markets was sold by one wholesaler to another (table 20). Brokers, distributors, receivers, and commission merchants accounted for most of these sales:
Percent Brokers and distributors 40 Sales agencies 14 Auctions 6 Receivers and commission merchants.- 28 All other wholesalers 12
Total 100
Receivers and commission merchants bought 37 percent of the volume sold to other wholesalers, jobbers 24 percent, and all other wholesalers 39 percent.
Forty-five percent of the net supply was sold by wholesalers to various types of retail outlets and final users, including chains (table 21). Over a third of these sales were to chains and other retail organizations, 48 percent to retail stores and peddlers, and 14 percent to eating places and in- stitutions. The remainder was sold to processors, consumers, and the military. The principal sellers to retail organizations were brokers, dis- tributors, receivers, and commission merchants. The major sellers to retail stores were other pri- mary handlers (receiver-jobbers, service whole- salers, commission wholesalers, and wholesale grocers), receivers and commission merchants, and jobbers. Over haK of the sales to eating places and institutions were made by purveyors.
Nearly a quarter of the net supply passing through wholesale markets was sold to out-of- town buyers by wholesalers (table 22). In addi- tion, 493,000 carlots were sold to out-of-town buyers and bypassed the market where the seller was located. One fourth of the out-of-town sales were made by brokers and distributors. Almost all of this produce bypassed the market where the seller had his place of business. Other major sellers to out-of-town firms were importers and exporters, receivers and commission merchants, sales agencies, and other primary handlers.

TABLE 18.—Legal jorra oj organization, hy type and size oj firm , U.S, wholesale produce ' markets, 1958-69
Size of firm, by annual sales volume
Type of firm Less than 200 carlots 200 to 499 carlots 500 or more carlots
Proprie- torship
Partner- ship
Corpora- tion
Proprie- torship
Partner- ship
Corpora- tion
Proprie- torship
Partner- ship
Corpora- tion
Primary handlers: Receiver
Percent 52 56 56 61 44
Percent 29 22 31 24
Percent 19 22 13 15 56
100
Percent 31 22 21 38 10
Percent 36 31 31 28 20
Percent 33 40 48 34 70
100
Percent 16 18 8
35 5
Percent 28 21 19 39 17
Percent 56 61 71 26 78
inn
Commission merchant. _ Receiver-jobber Commission wholesaler Service wholesaler Wholesale grocer
Average 53 27 20 25 32
26 30 36 55 80
42
47 24 50 40
14
14
'4'
31"
23
49 48 28 32 38
63
Secondary handlers: Jobber 69
47 35 32 37 83 42 31 33 41
24 33 19 43 31 16 18 35 31 24
7 20 46 25 32
1 40 34 31 35
27 46 14
5 20
100 23 25 38 17
37 52 68 68 31
Jobber (delivery) __ Banana jobber Service jobber Secondary wholesaler Truck jobber Purveyor 33
26 19
6
45 49 43 77
23"
35 41 26 80
"65 59 51 20
Receiver-purveyor _ Prepackager Tomato repacker
Average 51 24 24 27
51 39
100 56
100
29
èr
44
49
13
40
33
40 9
62
54
20 91 38
Shippers and truckers: Mixed-load shipper L.c.l. shipper 20 34 46 Packer-shipper Merchant trucker 83
50 10 50
7 44 100 Itinerant trucker
Average 69 23
25"
8
63 24 54
64
20
10 26
80 100 75
24 34 42
Importers and exporters: Importer 37
76 21
100 89 Commission importer 5 6
13 Exporter 25 87
Average 44 11 45 21 79 1 3
23
19 23
4Ö" 6
96
All wholesale handlers 52 25 23 27 30 43 13
40 13 36 16 18
64
Brokers and distributors: Selling broker _ 83 17
100 35 16 70
51 23 44 33 24
10 40 56 47 48
39 37
2Ö" 28
41 64 64 44 76
Auction representative Terminal broker 65
84 30
Carlot distributor Distributor
Average 72 28 45 22 33
21 100
34 21 45
Sales agencies: Cooperative 37
100 20 96 Importer's 4
Average 58 39 (0 85 Others:
Auction 100 Buying broker 75 48 45
8 17 52 55
67 34
9 40
24 26
100
33 31
18 Buying office _ 49
Sales agent 69
All brokers and agencies 64 3 33 45 18 37 22 14 D4
' Less than 0.5 percent.
23

TABLE 19.— Sources of supply, by class of firm, U,S. wholesale produce markets, Î958-59
Class of buyer
Direct from
shipping point or port of entry
From other
terminal markets
Through sales
agencies or brokers in other
cities
From truckers
From local
growers Imports Total
Volume bypass- ing the market ^
Volume passing through
the market
Broker, distributor Sales aeencv
1,000 carlots
475 184
11
1,000 carlots
1
1,000 carlots
4
1,000 carlots
1,000 carlots
1
1,000 carlots
1
1,000 carlots
482 184
21
1,000 carlots
165 81
4
1,000 carlots
317 103
Shipper and trucker Auction
« 0) 9 17
Importer and exporter Receiver, commission
merchant
9
391 105
6
9 56
5 11
1
1 2
8 22 15
3 2
41 19 4 2
3 4
203
1
212
446 159 27
2
16 65
199
42 2
— (V) —
13
404 Other primary handlers Jobbers of all types Truck jobber
157 27
2 Purveyor, receiver-
purveyor 16 Repacker, prepackager 65
All wholesalers 1,246 21 54 2 83 207 1,618 493 1, 121
Chain, voluntary, cooper- ative erouD 335
1 24
14 31 _. .42 42
422 49 24
422 Retailer, eating place Processor, military^
49 24
All buyers 1,606 35 85 8 167 207 2,113 493 1, 616
1 Includes imports which are shipped to other markets for sale. ^ L^gg than 500 carlots. The figures may not add to the total because of differences in rounding.
TABLE 20.—Sales of wholesalers to other local wholesalers, by class of firm, U,S. wholesale produce market 1958-59
Type of wholesale buyer
Class of seller Broker, dis-
tribu- tor
Auc- tion
Ship- per,
truck- er
Import- er,
export- er
Receiv- er,
commis- sion mer- chant
Other pri-
mary han- dlers
Job- bers of all
types
Truck jobber
Pur- veyor, receiv-
er- pur-
veyor
Re- pack-
er, pre-
pack- ager
Total
Broker, distributor Sales asfencv
1,000 carlots
8 2 1
1,000 carlots
23 17
1,000 carlots
2 1
0) 1 3
18 0) C) 0)
1,000 carlots
2
0) ---(I)—
__
1,000 carlots
61 9 4 1 1
9
<''3
1,000 carlots
64 12
2 1
(0
10 6
(0
1,000 carlots
13 28 16
1 3
49 4 5
1,000 carlots
2 0)
1 0) 0)
15 2 2
0)
1 1
1,000 carlots
13 1 4
S3 32
3 2
1,000 carlots
15 0)
2 0) 0)
4
8
1,000 carlots
203 71
Auction 30 Shioner and trucker 3 Importer and exporter Receiver, commission
m erchant _
1
2 0)
1
4 0) 0)
10
143 Other primary handlers Jobbers of all types
17 12
Trunk iobber 0) Purveyor, receiver-pur-
veyor - 8 ._ 0) 2 '\
1 1 8 2
Renacker Dreoackaser 1 1 13
Total 13 46 28 5 88 98 123 25 57 22 503
1 Less than 500 carlots. The figures may not add to the total because of differences in rounding.
24

TABLE 21.—Sales oj wholesalers to retail outlets and final users, by class oj firm, U.S. wholesale produce markets, 1958-59
Class of seller
Type of buyer
Chain, voluntary, cooperative
group
Retail store,
peddler Processor, consumer
Eating place,
institution Military
Total
Broker distributor Sales agency Auction Shipper and trucker Importer and exporter Receiver, commission merchant. Other primary handlers Jobbers of all types Truck jobber Purveyor, receiver-purveyor Repacker, prepackager
Total
1,000 carlots
55 31
7 2 2
98 21 11
1,000 carlots
0)
0) 21
1 3 1
93 116 90 17
5 13
1,000 carlots
i 0)
1,000 carlots
0)
1,000 carlots
0)
0)
0) 0)
0) 9
19 10
2 59
1 0)
1,000 carlots
70 31
9 6 4
213 160 112
19 65 38
248 345 19 103 11 726
* Less than 500 carlots.
The figures may not add exactly to the total because of rounding.
TABLE 22.—Sales of wholesalers to out-of-town buyers and total sales, by class affirm, U.S. wholesale produce markets, 1958-59
Class of seller
Type of out-of-town buyer
Truck jobber
Other whole- saler
Chain, volun- tary,
cooper- ative group
Re- tailer
Eating place, insti- tution
Proc- essor, mili- tary
Ex- ports
Total
Total sales
in the market
Total sales
Broker, distributor Sales agency Auction Shipper and trucker Importer and exporter Receiver, commission mei
chant Other primary handlers Jobbers of all types Truck jobber Purveyor, receiver-purveyor. Repacker, prepackager
1,000 carlots
3 0) 0) 0)
27 5
0) 0)
1,000 carlots
155 70
6 29
183
96 14 11
0) 0)
19
1,000 carlots
54 12
1 7 9
48 19
5 1
1,000 carlots
0) 0) 0) 0)
1,000 carlots
1,000 carlots
5
1,000 carlots
3
(0 11
C)
3 34
3 5
0)
13 0) 0) 0)
0)
0) 0)
1,000 carlots
220 82
8 37
203
178 80 26
6 5
37
1,000 carlots
273 102 39
9 14
356 177 124
19 67 51
1,000 carlots
495 184 46 47
217
534 258 148 25 73 89
Total- 48 583 169 46 11 17 882 1,229 2, 113
Ï Less than 500 carlots.
The figures may not add exactly because of rounding.
711-059—64- 25

Of the total out-of-town sales, 66 percent went to wholesalers other than truck jobbers, 19 percent to retail organizations, 5 percent each to truck jobbers and retailers, and the remainder to various buyers.
Sources of Supply Each type of wholesaler has a diflFerent pattern
of sources of supply (table 23). Primary handlers, on the average, bought 62 percent of their suppHes directly from shipping point, while secondary handlers averaged 21 percent. Within these groups, variation is as great as between groups. Commission merchants, commission wholesalers, and receivers obtained most of their supplies from shipping point. Commission wholesalers and commission merchants also handled significant quantities of produce from local growers but bought very little from local wholesalers. Re-
ceiver-jobbers and service wholesalers bought about 40 percent from shipping point and 28 to 33 percent through local brokers and agencies. Wholesale grocers obtained about two-thirds of their supplies through brokers and agencies.
Jobbers of all types, truck jobbers, and pur- veyors bought little directly from shipping point. Banana jobbers bought mostly from importer's sales agencies in the local market or nearby mar- kets. Receiver-purveyors bought about a third of their supplies from local brokers and sales agencies and about a fourth directly from shipping point. Prepackagers and tomato repackers pur- chased most of their needs directly from shipping point.
Mixed-load shippers bought mostly from growers, either locally or at shipping point, plus about a quarter of their needs from local wholesale handlers. L.c.l. shippers were primarily assem-
TABLE 23.—Sovrces of produce j wholesale handlers, by type of firm j U.S. wholesale produce markets, 1958-59
Type of firm Shipping
point Local
growers Other
out-of- town
Local brokers, agencies
Local wholesale handlers
and auctions
Total
Primary handlers: Receiver
Percent
69 82 39 75 40 14
Percent
6 12
8 18 4 8
Percent
3 1
18 0)
11 3
Percent
17 4
28 3
33 68
Percent
5 1
12 7
Percent
100 Commission merchant - 100 Recei ver-iobber 100 Commission wholesaler 100 Service wholesaler 100 Wholesale srocer _ _ 100
Averaffe 62 7 7 18 6 100
Secondary handlers: Jobber 4
5 1 9
16 1 5
27 61 70
4 5
0) 1 2 6 3 7 7 1
4 2
31 0 3 2
0) 16 6 7
6 13 64 12 23
9 10 35 20 11
82 75
4 78 56 82 82 15 6
11
100 Jobber ideliverv) __ 100 Banana iobber 100 Service jobber 100 Secondarv wholesaler 100 Truck jobber 100 Purveyor 100 "R PRpivpr-Durvevor 100 Prenackaser 100 Tomato reDacker _ 100
Average 21 4 8 21 46 100
Shippers and truckers: Mixed-load shioDer 36
25 0
54 79
29 6
82 4
21
1 0)
0 3 0
8 11
0 22
0
26 58 18 17 0
100 L c 1. shiDDer 100 Packer-shJDDer _ 100 Merchant trucker 100 Itinerant trucker _ 100
Averaffe -»- 34 20 11 9 26 100
Importers and exporters: IrriDorter __- 2
9 58
(0 0 0
98 91
7 « 0
21
0) 0)
14
100 Commission imoorter 100 ExDorter - 100
Average 13 0) 81 4 2 100
All wholesale handlers 42 6 20 16 16 100
i Less than 0.5 percent.
26

biers of small lots from local wholesalers. Packer- shippers obtained over 80 percent of their supplies from local growers and another 18 percent from wholesale handlers in the local market. Supplies handled by itinerant truckers—those without a fixed base of operations in the local market—came entirely from growers, mostly at shipping point. Those of merchant truckers—who have a store in the local market—were more nearly divided between supplies purchased in the local market and those obtained at shipping point.
Almost all supplies of importers and commission importers were bought from foreign suppliers. Exporters obtained over half of their supplies directly from shipping point, 21 percent through local brokers and agencies, and 14 percent from local wholesale handlers. Some exporters also imported small quantities of produce.
The channels through which produce moves in different types of markets vary substantially, depending on the size of the market. Primary handlers in the largest markets bought about three-fourths of their supplies directly from ship- ping point, while those in tertiary and small markets obtained about half in this way (fig. 3). Supplies from local growers were less important in small and tertiary markets than in most types of larger markets. Primary handlers in the smallest markets bought overea third of their supplies from other markets of through brokers and agencies in other markets; those in primary markets only 1 percent.
Brokers and agencies were of minor importance in supplying primary handlers in primary markets, furnishing only 9 percent of their needs. They furnished 27 to 36 percent in secondary markets, 21 to 25 percent in tertiary markets, and 13 percent in the small markets with few brokers and agencies. Local wholesale handlers furnished only 1 percent of supplies of primary handlers in the small markets, 5 percent in the primary markets, and 4 to 10 percent in the other types of markets.
Sources of supplies of secondary handlers also varied markedly between types of markets (fig. 4). These variations are partly due to the different combinations of firm types which make up the secondary handler group in each type of market. Prepackagers and tomato repackers ac- count for a larger proportion of the business of secondary handlers in small and tertiary markets than in most larger markets. Other differences in sources result from differences in organization of markets of different size and type.
Total direct pm-chases of secondary handlers varied from 22 percent of purchases in primary markets to 73 percent in small markets, with a much higher proportion coming from other markets in the smaller markets. Local brokers and agencies were most important as a source of supply in secondary markets, particidarly out-of- town wholesale and other secondary types. Purchases from local wholesale handlers declined from 58 percent of the total in primary markets
PRIMARY HANDLERS' SOURCES By Type of Market, 1958-59
LOCAL WHOLESALE HANDLERS
LOCAL BROKERS AND AGENCIES
OTHER OUT-OF-TOWN
LOCAL GROWERS
SHIPPING POINT
PRIMARY SECONDARY MARKETS
MARKETS Local Out'-of- Other wholesale 'o«vn
wholesale
U. S. DEPARTMENT OF AGRICULTURE
TERTIARY MAR^KETS SMALL
Choin Otlier MARKETS
NEC. ERS 2139-63(8) ECONOMIC RESEARCH SERVICE;
Figure 3.—Sources of supply of primary handlers, by type of market. United States wholesale produce markets, 1958-59.
27

to 8 percent in the small markets, although there was less différence between secondary and tertiary- markets in this regard.
In general, large primary and secondary handlers bought a larger proportion of their supplies directly from shipping point than did smaller firms of the same type (table 24). At the same time, they bought a smaller proportion from local farmers. There are some exceptions to these
generalizations—notably, wholesale grocers and receiver-purveyors. In addition to purchasing more from local growers, smaller firms tended to buy more from other wholesalers and to utilize local brokers for more of their needs. The procurement patterns of other types of whole- salers are more variegated than those of priniary and secondary handlers, and no generalizations are useful.
TABLE 24.—Direct purchases from shipping point and from local farmers as percentage of total pur- chases, by size of firm, U.S. wholesale produce markets, 1958-59
Type of firm
Primary handlers: Receiver Commission merchant. _ Receiver-jobber Commission wholesaler. Service wholesaler Wholesale grocer
Average.
Secondary handlers: Jobber Jobber (delivery) . Banana jobber. Service jobber- Secondary wholesaler- Truck jobber- Purveyor Receiver-purveyor- Prepackager- Tomato repacker-
Average
Shippers and truckers: Mixed-load shipper L.c 1. shipper. Packer-shipper Merchant trucker. Itinerant trucker
Average
Direct from shipping point
Small firms
Percent 60 78 25 58 26 43
48
Medium firms
Percent 63 80 32 72 39 21
55
Large firms
Percent 74 85 49 82 42
9
68
From local farmers
Small firms
Percent 15 16 13 34
7 8
ImpK)rters and exporters: Importer Commission importer Exporter
Average
All wholesale handlers
Brokers and distributors Selling broker Auction representative Terminal broker. _ Carlot distributor Distributor
Average
Others: Buying broker. Buying office.
15
Medium firms
Percent 14 19 12 18
5 7
13
Large firms
Percent 3
10 7
14 4 9
1 Less than 0.5 percent.
28

SECONDARY HANDLERS' SOURCES By Type of Market, 1958-59
LOCAL WHOLESALE HANDLERS
, LOCAL BROKERS ..•** AND AGENCIES
OTHER OUT OF-TOWN /
LOCAL GROWERS
SHIPPING POINT '
PRIMARY SECONDARY MARKETS
MARKETS Local Out-of- Other wholesale town
wholesale
U.S. DEPARTMENT OF AGRICULTURE
TERTIARY MARKETS SMALL
Chain Other MARKETS
NEG. ERS 2140-63 (B) ECONOMIC RESEARCH SERVICE
Figure 4.—^Secondary handlers* sources, by type of market, 1958-59.
Sales Outlets
Each type of wholesaler has its own distinctive pattern of sales outlets, although there are some broad similarities within groups. Sales in the local market averaged 63 percent of total sales for all wholesalers, with 37 percent sold to out-of-town buyers (table 25). For individual firm types, local sales varied from 7 percent for exporters to 100 percent for sales agents. Primary handlers varied from 50 to 75 percent, averaging 68 percent, sold locally. Local sales of secondary handlers ranged from 58 percent for prepackagers and tomato re- packers to 95 percent for purveyors, with an average of 76 percent. Shippers and truckers sold more of their produce out-of-town, ranging from 33 percent for itinerant truckers to 92 percent for mixed-load shippers and averaging 76 percent. Importers and exporters sold 81 percent to out-of- town buyers.
Brokers and distributors sold 55 percent locally, on the average, ranging from 29 percent for carlot distributors to 82 percent for auction representa- tives. Cooperative sales agencies had three- fourths of their sales in the local market, importer's sales agencies 55 percent, auctions 84 percent, and buying brokers and buying offices 25 percent.
The only types of firms with more than 10 percent of sales to local primary handlers were selling brokers, terminal brokers, distributors, packer-shippers, itinerant truckers and auctions. Sales to local secondary handlers were important
for commission merchants, receivers, secondary wholesalers, commission wholesalers, distributors, importer's sales agencies, terminal brokers, and buying brokers.
Sales to local retail organizations—chains, re- tailer cooperatives, and voluntary groups—aver- aged 13 percent of the sales of all wholesalers. They were above-average for itinerant truckers (40 percent), importer's sales agencies, receivers, commission merchants, cooperative sales agencies, auctions, and merchants' truckers. Sales to re- tailers and institutional outlets were most impor- tant to various types of jobbers and purveyors, truck jobbers, receiver jobbers, and commission wholesalers.
Variations in the sales patterns of receivers and commission merchants in different types of mar- kets emphasize the differences in functions per- formed by each type of market (table 26). On the average, receivers and commission merchants sold haK of their produce to other wholesalers, both local and out-of-town, 27 percent to retail organizations and 23 percent to retailers and other types of outlets.
In other types of markets, sales to other whole- salers by receivers and commission merchants ranged from 41 to 67 percent of total sales—the highest figure being in secondary out-of-town wholesale markets, where over half the sales were to wholesalers in other markets including truck jobbers.
29

CO o
TABLE 25.—Sales oj wholesalers^ by type of buyer, U.S. wholesale produce marketsj 1958-59
Local buyers Out-of-town buyers
Type of firm Pri- mary han- dlers
Second- ary han- dlers
Other whole- salers
Retail organi- zations
Re- tailers, institu- tional outlets
Proces- sors, con-
sumers, military
Total Truck job- bers
Other whole- salers
Retail organi- zations
Re- tailers, institu- tional outlets
Proces- sors,
military, exports
Total
Total sales
Primary handlers: Receiver __
Pet. 4 3
0) 1 6 3
Pa. 17 22
4 11
2 2
Pet. 5 6 2 2
Pet. 19 16
9 4 7 1
Pet. 17 23 57 57 45 44
Pet. 3 2 2
0) 1
Pet. 65 73 74 75 61 50
Pet. 6 3 2 1 3
Pet. 19 14
8 11 2 3
Pet. 9
10 5 3
13 3
Pet. 1
0) 12 10 20 44
Pet. «
1 1 _-
Pet. 35 28 26 25 39 50
Pet. 100
Commission merchant Recei ver-j obber
100 100
Commission wholesaler Service wholesaler
100 100
Wholesale grocer 100
Average _ 3 14 3 15 31 2 68 4 44
12 8 2
15 1 1 1
21
8
3 --
2 2
?! 15
6
1 2 9
C) 21
3 8
1
__
__
1
32
22 13 19 26 24
5 11
42
100
Secondary handlers: Jobber ^ 3
P) 8 4 1
31 0)
1 5
8
--
0) 1
2
5 9 8 9 1
(0 1
24
60 73 72 24 74 92 82
17
2 1
0) 4 1 1 1
2
78 87 81 74 76 95 89
58
6 3 1 9
« C)
1
5
100 Jobber (delivery) * _ _ _ 100 Service jobber 100 Secondary wholesaler Truck j obber_
4 100 100
Purveyor _ C)
5
100 Receiver-purveyor 100 Prepackager, tomato re-
packer 100
Average 2 6 1 11 55 1 76 4 10 6 4 0) 24 100
Shippers and truckers: Mixed-load shipper 1
6 1 7 9
1 --
1
2 3
-- 4 0)
8 11 29 56 67
1
--
62 65 53 36
9
24 21 18
3 21
3 5 92
89 71 44 33
100 L.c.l. shipper 100 T*ii plrpr-csVi irmpr 26
6 17
100 Merchant trucker- _ 15
40 25
1 2 1 __ 100
Itinerant trucker 100
Average _- 6 4 1 6 5 2 24 1 53 19 ■- : =
1 2 76 100
Importers and exporters: TtYrnnTtrPrQ ^ 2
2 1
4 8 1
9 8 4
4 4
2 1
0) "-(1) —
0)
21 23
7
70 46
1
9 29
79 77 93
100 Commission importer. _ _ _ Tf.Ynnrtpr
2 92
100 100
Average 2 5 7 3 2 0) 19 52 10 19 81 100

Brokers and distributors: Selling broker 33
4 26
8 23
9 3
11 4
41
3 72
1 4
0)
7
12 1
11 8
11
1 1
(0 4 2
2 0)
4 1 2
59 82 53 29 79
1 1
_______
1
30 12 31 47 11
9 5
15 20
4
1 41 18 47 71 21
Auction representative 100 100 Terminal broker 1
3 5
100 Carlot distributor. Distributor 100
100
Average 25 9 11 2 1 55 1 31 11 2 45 100
Sales agencies: Cooperative 23
7 3
25 32
3 16 20
0) 0) 1
75 55
0) 1
19 36
4 9
2 25 45 Importer's 100
100
Average 12 17 13 18 0) (0 61
84 25
100
0)
1 0)
31 7 1 39 100
Others: Auction _ 12
1 50 11
3 0)
15 4
4 9
100
._-.„._ 12 66
3 9
16 75 Buying broker, buying office, . 100
100 Sales agent 100
All wholesalers 10 12 4 13 22 2 63 2 22 9 3 1 37 100
Í Less than 0.5 percent. 2 Includes banana jobbers. 3 Excludes quantities transferred to sales agencies.
CO

Sales to retail organizations were highest in other tertiary markets and lowest in small markets. They were fairly low in out-of-town wholesale markets. Sales to retailers and other outlets were highest in secondary local wholesale markets and relatively high in tertiary chain and small markets.
Other types of primary handlers—^receiver- jobbers, service wholesalers, commission whole- salers, and wholesale grocers—sold mostly to re- tailers and final users, averaging 70 percent to these outlets (table 26). The range was only be- tween 69 percent and 80 percent of sales. How- ever, there was considerable variation between types of markets in the proportion sold in the local market and out-of-town. These handlers in primary markets made 83 percent of their sales
locally, while those in tertiary chain markets sold only 40 percent within the local market.
Two-thirds of the sales of secondary handlers were to retailers, eating places and other outlets for all markets (table 26). The proportion varied from 35 percent in secondary out-of-town whole- sale markets to 74 percent in primary markets. The lowest figure in any other type of market was 54 percent, found in both tertiary chain and small markets. Sales to other wholesalers by secondary handlers were relatively high in secondary out-of- town wholesale, other tertiary and small markets.
In general, the larger wholesale handlers of each type sold a higher proportion of their produce to retail organizations and to wholesalers than did the smaller firms (table 27). Smaller firms of most types sold more to retailers than did larger
TABLE 2ß.—Sales of produce by specified groups oj handlers, by type of buyer and type of market, U.S- wholesale markets, 1958-59
Sales to local buyers Sales to out-of-town buyers
Wholesaler and type of market Whole- salers
Retail organi- zations
Retail- ers and
others
Total Truck job- bers
Other whole- salers
Retail organi- zations
Retail- ers and
others
Total
Total sales
Receivers and commission mer- chants:
Primary Pet.
34
26 13 27
45 15 18
Pet. 20
15 9
22
13 29
9
Pet. 20
30 16 19
29 20 28
Pet. 74
71 38 68
87 64 55
Pet. 1
4 11 19
2 7 3
Pet. 14
16 43
4
19' 42
18
10
5 13 2
2 2 1
Pet. 10
8 8 6
11 6
Pet. 1
1 1 3
--
Pet. 26
29 62 32
13 36 45
Pet. 100
Secondary: Local wholesale 100
Out-of-town wholesale Other
100 100
Tertiary: Chain 100
Other 100
SmaU_ 100
All markets 27
9
15 3 2
10 9 1
18
7
5 7
16
3 7 7
22
67
61 37 61
27 41 49
67
83
81 47 79
40 57 57
5
0) 2 4 4
2 0) 0)
9
3
4 11
9
3 7
16
1
4
8 25
6
53 34 26
33 100
Receiver-jobbers, commission wholesalers, service wholesalers, and wholesale grocers:
Primary 17
19 53 21
60 43 43
100
Secondary: Local wholesale 100
Out-of-town wholesale Other
100 100
Tertiary: Chain
100 100 100 Other
Small
All markets 7 8 54 69 2 6 7 16 31 100
Secondary handlers: Primary 9
9 9 3
2 13
3
10
10 6
15
18 2 8
68
61 32 58
49 55 48
87
80 47 76
69 70 59
1
3 12
8
1 1
0)
5
9 27
4
2 17 28
6
5 3 1
5 9 6
1
3 11 11
23 3 7
13
20 53 24
31 30 49
22
100
Secondary : Local wholesale
100 100 100 Out-of-town wholesale
Other --- Tertiary :
Chain 100 100 100 Other
Small
All markets 8 9 61 78 3 9 6 4 100
I Less than 0.5 percent.
ae

TABLE 27.—Percentage of sales to retail organizations^ retailers, and wholesalers, by size of firm, U.S. wholesale produce markets, 1958-59
Retail organizations Retailers Wholesalers
Type of firm Small firms
Medium firms
Large firms
Small firms
Medium firms
Large firms
Small firms
Medium firms
Large firms
Primary handlers: Receiver
Percent 20 26
5 5
14 46
Percent 25 36 15 12 27
Percent 32 30 17
6 24
Percent 16 17 73 78 56 17
Percent 14 14 61 66 59 48
Percent 13 17 58 65 48 83
Percent 57 53 10 14
2 2
Percent 57 48 12 22
3 41
Percent 50 48 16 29 15
Commission merchant Receiver-jobber Commission wholesaler Service wholesaler _ _ Wholesale grocer
Average 15 23 28 41 32 27 35 38 39
Secondary handlers: Jobber. __ __ _ 1
4 19 13
9 3 1 3
43 20
6 4
18 7
14 22
38 37
1 24 42 38 13
__
1 51 68
87 77 43 73 14 85
9 6
26 15
73 80 31 72 25 78
3 20 14 7
59 57 29 51
3 _.
9 9
12
7 3
34 3
64 1 1 4
44 55
16 6
49 6
58
20 15 28
Jobber (delivery) __ _ Banana jobber _ Service jobber Secondary wholesaler Truck jobber
81
Purveyor 2 5
47 49
8 9
35 10
Receiver-purveyor Prepackager Tomato repack er
Average 9 13
29 0)
35 75 12
33
26 28 16
. 51 38 18 16 23 25
Shippers and truckers: Mixed-load shipper. _ 71
45 65 25 43
ft4. L.c.l. shipper 18 24 65 72
A4. Packer-shipper Itinerant trucker 55
26 2
25 38 44 Merchant trucker 40 94
Average 32
3 0)
26
14 51
23
10 33
18
29 0)
17
23 1 i})
44
69 94
50
55 40
9
71
90 64
7
Importers and exporters: Importer Commission importer Exporter
Average __ 1 11
9 19
16 27
6 47
7 33 %s
47 22
26 32
75 41 All wholesale handlers __
Brokers and distributors: Selling broker 23 14
0) 24
7 12
21 8
32 30 11
0) (}) 2 1
77 100 83 58
5
84 100 87 91 48
75 89 68 62 79
Auction representative Terminal broker 15
42 2
Carlot distributor 1 1 Distributor 26 7
Average 21 13 21 3 1 2 69 83
65 58
73
Sales agencies: Cooperative 36
46 35 42
17 14
11 52 54
80 86 Importer's 0)
Average 40 36 15 7 (0 53 64 85
Others: Auction 14
31
18
2 10
83 69
100 Buying broker 3 11 22 5 75
100 76
100 Buying office
10 1 All brokers and agencies _ 14 Ifi 1 64 77 77 1 1 Less than 0.5 percent.
711-059—64- 33

TABLE 28.—Percentage of sales to out-of-town buyers, by size and type oj firm, U.S. wholesale produce markets, 1958-59
Type of firm Small firms
Vledium firms
Large firms
Primary handlers: Receiver
Percent 83 94 87 16 36 53
Percent 89 21 74 11 40 30
Percent 45
Commission merchant- _ Receiver-jobber Commission wholesaler. Service wholesaler Wholesale grocer
50 65 36 40 51
Average 87 82 50
Secondary handlers: Jobber 94
14 23 98 20 83 4 4
11 32
8 4
35 95
7 19
7 17 18 29
1 Jobber (delivery) Banana jobber Ï2 Service iobber 24 Secondary wholesaler. __ Truck "iobber
18
Purveyor 6 Receiver-purveyor Prepackager
8 78
Tomato repacker 53
Average 79 52 57
Shippers and truckers: Mixed-load shiüDer 83
72 100
92 L.c.l. shipper 93 90 Packer-shiDDer 68 Merchant trucker _ _ 17
96 Itinerant trucker 46 88
Average 94 58 87
Importers and exporters: Importer 12
9 100
41 8
91
77 Commission importer Exporter
76 93
Average 47 83
69 75
78 All wholesale handlers 53
Brokers and distributors: Selliner broker 11
0 0
16 14
22 3
41 59 39
37 Auction representative- Terminal broker Carlot distributor _ Distributor
20 34 73 21
Average 10 27 42
Sales agencies: Cooperative 15
0 38 99
25 ImDorter's 80
Average 9 93 72
Others: Auction _____--.- 19 BuvinfiT broker -- 98
100 0
74 100
0
95 Buvine oflBce 98 Sales asent
All brokers and agencies 58 74 90
firms of the same type. Taking all wholesale handlers as a group, small firms made 11 percent of theh' sales to retail organizations, 22 percent to wholesalers and 47 percent to retailers. (The re- maining 20 percent went to all other types of out- lets—eating places, institutions, the military, processors, consumers, export, etc.) Large whole- sale handlers sold 27 percent to retail organiza- tions, 41 percent to wholesalers, and 23 percent to retailers.
Sales patterns of brokers and agencies vary more between large and small firms than those of wholesale handlers. Brokers and distributors, except for smaU distributors, sold little to retailers. Small sales agencies—^found mostly in small markets—sold a higher proportion to retail organi- zations than did the larger sales agencies, generally located in the larger markets. SmaU buying brokers bought more for retailers than did larger ones, which bought more for chains.
Considering all wholesale handlers as a group, large firms made a smaller proportion of their sales out-of-town than did small firms (table 28). This was also true for primary handlers as a group and for receivers, commission merchants, and re- ceiver-jobbers. Service wholesalers and whole- sale growers sold roughly the same proportion out- of-town regardless of firm size, and large com- mission wholesalers sold more out-of-town than small ones.
In half the types of secondary handlers, large firms sold less out-of-town than small firms, but in two—purveyors and secondary wholesalers— the proportions were about the same. In three others—^receiver-purveyors, prepackagers and to- mato repackers—^large firms sold more out-of-town than did smaU firms.
These patterns—with large firms generally, but not imiversally, selling a higher proportion locally than small firms—are chiefly the result of two tendencies: (1) more large firms tend to be located in large markets (table 9) and (2) wholesale han- dlers in large markets sell a higher proportion locally than do those in smaller markets (table 26).
The business of brokers and distributors is not so closely tied to the market in which they are located. They can and do sell over a wide area. Thus, large brokers and distributors—more often found in large markets—sell more of their produce out-of-town than do small firms of the same type, in contrast with wholesale handlers.
Bayers and Sellers at Auction At every auction sale the seller, who is usually
a packer or shipper, is represented by a local agent. In most cases, this agent was a cooperative sales agency or a broker. In a small proportion
34

of sales, the seller or his representative was a receiver or other type of wholesale handler.
Percent of auction
Type of seller receipts * Cooperative sales agency 37 Auction representative 35 Selling broker 14 Carlot distributor 1
All brokers and agencies 87
Receiver 7 Commission merchant 2 Importers and exporters 3 Repacker and prepackage! 1
All wholesale handlers 13 1 Types of firms selling less than 0.5 percent not listed separately.
Most sales were made to wholesale handlers in the local market, with the biggest share going to jobbers of various types.
Type of buyer
Jobber Jobber (delivery) Service jobber Secondary wholesaler
All types of jobbers
Truck jobber... Purveyor Prepackager, repacker
All secondary handlers
Receiver Receiver-jobber Service wholesaler L.c.l. shipper
All wholesale handlers Carlot distributor and distributor.
All wholesalers
National chain Regional chain Local chain with warehouse Local chain without warehouse.., Retailer cooperative and volun-
tary group Others
Total
Percent of auction sales to—1
Local buyers
14 16 2 3
35
50
63 2
65
84
Out-of- town
buyers
12
12
(2)
16
1 Types of firms buying less than 0.5 percent not listed separately.
2 Less than 0.5 percent.
Functions and Services of Wholesalers Produce wholesalers perform a wide variety of
functions, but none perform all. Each type of firm represents a different combination of functions
and services. The principal functions of produce wholesalers are as follows:
I. Buying 1. Purchasing less-than-carload lots from near-
by farmers. 2. Purchasing carlots from packers and ship-
pers. 3. Purchasing l.c.l. lots from first receivers. 4. Consolidating orders for l.c.l. lots into carlot
purchases. II. Selling
1. Selling carlots to first receivers. 2. Selling wholesale lots to second handlers. 3. Selling retail lots to retailers and final users.
III. Physical handling—either arranging or per- forming, or both
1. Transportation to market. 2. Unloading. 3. Cartage from terminal or team tracks to
warehouse. 4. Cartage between wholesale houses. 5. Warehousing, storage; including handling
in and out. 6. Inspection. 7. Reconditioning and recoopering. 8. Breaking down carlots into wholesale lots. 9. Breaking down wholesale lots into retail
lots. 10. Delivery from wholesale house to retailer. 11. Prepackaging in consumer-size packages. 12. Processing—ripening tomatoes and cutting
bananas. 13. Assembling mixed loads from first receivers.
IV. Financing 1. Provision of short-term credit to buyers. 2. Financing production.
V. Merchandising 1. Suggesting selling prices to retailers. 2. Guaranteeing prices to retailers for specials. 3. Price concessions to retailers for specials. 4. Assisting retailers with advertising. 5. Assisting retailers in training produce per-
sonnel. 6. Assisting retailers with displays.
VI. Risk-taking 1. Bearing risk of price change in transit. 2. Bearing risk of price change in the market. 3. Bearing risk of quality change in transit. 4. Bearing risk of quality change in the market.
A firm may perform these functions itself or it may hire them done by someone else. In buying carlots from packers and shippers, the firm may employ its own buyers on salary or retainer at the principal shipping points; it may ''hire" buying brokers at shipping point; it may delegate this function to brokers or sales agencies in the local market; or it may do its own purchasing over the telephone.
Buying Functions
Purchasing from nearby farmers is seldom delegated to others. Most purchases from first receivers are made by the firm's own buyers, although buying brokers are utilized to some extent in the largest markets.
The different types of firms varied substantially in the extent to which they delegated the buying function to others (table 29). Among primary handlers, commission wholesalers and commission merchants placed the least reliance on intermedi- aries in the buying process, handling over 90
35

TABLE 29.—Buying functions performed by wholesale handlers, U.S. wholesale produce markets, 1958-59 (Percentage of purchases of each type of firm less imports)
Type of firm
Purchas- ing l.c.l.
lots from farmers by firm
Purchasing carlots from packers and shippers by—
Firm Shipping
point broker
Local brokers
and agencies
Purchasing l.c.l. lots from first receivers by—
Firm Buying brokers
Buying carlots from other
markets by
brokers and
agencies
Buying l.c.l. lots
from other
markets by firm
Total purchases by firm
Primary handlers: Receiver Commission merchant.. Commission wholesaler. Receiver-jobber Service wholesaler Wholesale grocer
Secondary handlers: Jobber Jobber (delivery) Banana jobber Service jobber Secondary wholesaler. _ Truck jobber Purveyor Receiver-purveyor Prepackager Tomato repacker
Shippers and truckers: Mixed-load shipper L.c.l. shipper Packer-shipper — Merchant trucker Itinerant trucker
Exporter
Percent 6
12 18
8 4 8
(0
4 5
1 2 6 3 7 7 1
29 6
82 4
21
Percent 56 79 72 34 31 14
4 3 1 3
14 1 3
20 51 52
36 24
Percent 13
3 3 5 9
(})
(0
6 2
2 7
10 18
Percent 17 4 3
28 33 68
6 13 64 12 23
9 10 35 20 11
11
53 50 54
All wholesale handlers _ 41
1 29
4
22
'21
Percent 5 1 4 7
12 7
79 74
4 74 55 82 80 15
6 11
26 53 18 17
Percent 0
Percent 2 1
Percent 1
(0 (0
12 8 3
(0
31 1 2 1
(0 (0
12 3 4
22
14
15
Percent 68 92 94 55 50 29
89 84 5
79 72 90 86 46 67 67
91 83 100 77 71 69
65
1 Less than 0.5 percent.
percent of the transactions themselves. Whole- sale grocers, on the other hand, handled less than a thh-d of their purchases themselves, relying heavily on terminal market brokers. Receiver- jobbers and service wholesalers handled 50 to 55 percent of their purchases themselves and receivers about 66 percent.
Most types of secondary handlers bought two- thirds or more of their produce themselves. The only exceptions were the banana jobbers, who obtained nearly all of their supplies from importer's sales agencies, and receiver-purveyors who relied heavily on local brokers.
Shippers bought most of their own produce and truckers 71 to 77 percent. Merchant truckers obtained 22 percent through local brokers and itinerant truckers 29 percent through shipping- point brokers. Brokers and distributors did al- most all of their own buying. Auctions relied entirely on others—mostly brokers and coopera- tive sales agencies.
Selling Functions
Nearly all wholesalers do their own selling. The principal exception is purveyors in New York City, many of whom have arrangements with
sales agents to sell for them on commission. About 16 percent of their sales were made through sales agents. In other scattered instances, a wholesaler will call on a broker to dispose of a car for him.
The division between carlot sales, wholesale lots, and retail lots is indicated in the distribution of sales discussed in the preceding section (table 25). Most sales to wholesalers, retail organiza- tions, and processors by brokers and distributors were in carlots, although the proportion of split loads was fairly substantial in several secondary and tertiary markets. Sales by primary handlers to wholesalers, retail organizations, and processors were almost all in wholesale lots, except for relatively small amounts which bypassed the market and were delivered directly from shipping point to the buyer. Sales to most other types of buyers were in retail lots.
Almost all sales of secondary handlers were in retail lots, except for a few sales by tomato re- packers at auction. Mixed-load shippers and packer-shippers sold mostly in carlots; l.c.l. shippers mostly in wholesale lots. Truckers divided their sales about evenly between whole- sale and retail lots. Importers and exporters sold almost entirely in carlots.
36

The selling function takes on difïerent char- acteristics when selling to regular customers who return day after day or week after week as com- pared with selling to ''in-and-out" buyers who may show up one day and then not return for several weeks. Most of the wholesale produce business is conducted on the basis of regular buyer-seller relationships. This does not mean that every buyer patronizes only one seller. On the contrary, many times it means that the buyer *'shops'' several wholesalers—in general, the same ones—each day and buys from one of them on the basis of his own assessment of relative quality and price. Thus, when a receiver speaks of ''regular customers,'' he means more nearly "regular shop- pers," while a truck jobber has no competition on a day-to-day basis. His customers are regular in the sense that he is the sole supplier, although they may shift to another supplier if they become dissatisfied with his quality or prices.
In general, wholesalers selling to retailers and institutional outlets make more sales to regular customers. Those selling to other wholesalers find somewhat more of a tendency among their customers to shop the entire market.
Sales to regular cus- tomers as percent-
Type of wholesaler age of total sales Primary handlers:
Receiver 87 Commission merchant 88 Receiver-jobber 93 Commission wholesaler 96 Service wholesaler 94 Wholesale grocer 100
Average 89
Secondary handlers: Jobber 84 Jobber (delivery) 93 Banana jobber 92 Service jobber 98 Secondary wholesaler 83 Truck jobber 99 Purveyor 94 Receiver-purveyor 97 Prepackager 94 Tomato repacker 82
Average 92
Shippers and truckers: Mixed-load shipper 90 Packer-shipper 90 Merchant trucker 79
Average 87
Importers and exporters: Importer 92 Commission importer 88 Exporter 87
Average 90
All wholesale handlers 90
Sales to regular cus- tomers as percent-
Type of wholesaler age of total sales Brokers and distributors:
Selling broker 88 Auction representative ^22 Terminal broker 96 Carlot distributor 91 Distributor 97
Average 85
Sales agencies: Cooperative 71 Importer's 100
Average 92
Others: Auction 88 Buying broker 96 Buying office 100 Sales agent 100
All brokers and agencies 88
All wholesalers 89 > Sales at auction are not considered to be sales to regular customers by
the auction representative.
The wholesaler who provides more services apparently has somewhat more regular customers than others. For example, jobbers who provided few services sold 84 percent to regular customers, delivery jobbers sold 93 percent, and service jobbers 98 percent.
To a considerable extent, wholesalers in smaller markets sold a higher percentage to regular cus- tomers (table 30). Primary handlers in primary
TABLE 30.—Sales to regular customers as a per- centage of total sales, by type of market, U,S. wholesale produce markets, 1958-59
Type of market Primary handlers
Secondary handlers
Brokers and dis- tributors
Primary Percent
83
89
90 96
98 91 94
Percent 90
94
89 95
96 93 96
Percent 69
95
92 95
100 88
100
Secondary: Local wholesale Out-of-town whole-
sale Other
Tertiary: Chain Other
Small
All markets 89 92 85
markets sold 83 percent to regular customers while those in tertiary chain markets—which are small markets as far as sales by wholesalers are concerned—sold 98 percent to regular customers. Sales to regular customers by secondary whole-
37

salers and brokers^and distributors were also generally lower in primary markets than in smaller markets, markedly so in the case of brokers and distributors.
Brokers and distributors in primary markets perform a different function than those in the smaller markets. The latter largely act as buyers for wholesalers and retail organizations in their own and nearby markets, while those in the primary markets are more often utilized by shippers to dispose of rollers and other unsold merchandise. On a transaction of this kind, there is no such thing as a regular customer. The broker disposes of the car wherever he can find a buyer.
Physical Handling Functions Transportation to Market.—The decision as to
the means of transportation is customarily made jointly by the shipper and the buyer of the produce, although in individual cases the desires of one or the other may override. The decision is influenced by a number of factors, including: (1) relative charges by rail and by truck, (2) relative time in transit by rail and truck, (3) facilities available for loading and unloading, (4) costs of miloading by different methods, often influenced by labor contracts or local market customs, and (5) the need to load or unload at one or more points.
Between many points, one method of transpor- tation—either rail or truck—^has a clear cost advantage and few shipments are made by the higher cost method. In other cases, the rates are similar enough that shipments may be divided between the two methods on the basis of other considerations. Transit time is important, both because of the effects on the quality of many products and because of the need to obtain the commodity in the shortest possible time. Truck transit time is frequently less than that by rail on short' and medium-length hauls. Some buyers prefer to have as many shipments as possible arrive by one means or the other since the facilities available to them make it more convenient to handle shipments by that method. Some prefer rail because they can use the rail car for temporary storage. . . j
Generally speaking, rail transportation is used more in shipping to large markets than to small markets. In primary markets, 44 percent of all receipts from distant points (excluding receipts from nearby producers and boat receipts) arrived by rail. In two out of three types of secondary markets, it was 33 to 35 percent; in tertiary mar- kets 23 to 28 percent; and in small markets 21 percent (table 31). Truck receipts are high in the secondary out-of-town wholesale markets partly because of the large redistribution markets in Atlanta and Columbia.
In most types of markets, brokers and agencies appear to exhibit a greater preference for rail compared with truck than do either wholesale handlers or retail organizations. This is due to
38
TABLE 31.—Percentage of receipts from distant points that arrive by rail, by type of market, U.S, wholesale produce markets, 1958-59 ^
Type of market All
firms Brokers
and agencies
Whole- sale
handlers
Retail organi- zations
Primary Pet.
44
35
23 33
28 23 21
Pet. 58
41
28 42
40 19 40
Pet. 37
32
18 26
17 24 16
Pet. 42
Secondary: Local wholesale Out-of-town
wholesale Other
33
24 29
Tertiary: Chain 31 Other 23
Small 25
All markets 35 46 30 32
1 Total receipts excludes those by boat and from nearby farmers.
at least two factors. First, brokers tend to prefer rail shipment for produce which is not yet sold when it leaves the shipping point, since this gives them more time to find a buyer and the diversion E)rivileges are somewhat more clearly known and ess subject to negotiation than with exempt truckers. Second, a high proportion of bananas are shipped by rail and most of these are included in the receipts of importer's sales agencies.
The apparent preference of retail organizations for rail receipts as compared with wholesale han- dlers is probably that, on the average, the individ- ual retail organization warehouses are larger units than the individual wholesale handler and they can utilize a full car of produce more readily. In some markets, many wholesale handlers have no rail sidings at their stores, whereas most retail organizations must have sidings to receive dry groceries and other products.
Unloading.—Most wholesalers use their own employees to unload rail cars and trucks (table 32 and 33). Nearly three-quarters of the firms han- dling 65 percent of the volume unloaded trucks with their own employees. Another 13 percent of the firms used their own employees to move the produce from the truck tailgate where it was placed by the trucker or by a crew hired by the trucker. Nine percent of the wholesalers hired stevedores to unload trucks.
Over half of the wholesalers selling nearly half of the volume unloaded rail cars at the terminal with their own employees; 20 percent had the un- loading done by railroad employees; 12 percent by stevedores; and 6 percent by employees of the terminal company. Three-fourths of the whole- salers unloading at team tracks used their own employees, while 13 percent hired stevedores to do the job.
In most markets, the method of unloading is specified in labor contracts or by market custom. In many larger markets, rail cars at terminal or

TABLE 32.—Percentage oj Vjholesalers unloading produce by various methods^ U,S. wholesale produce markets^ 1958-59
Unloaded by-
Railroad cars unloaded at— Trucks
unloaded
Ter- minal
Team tracks
Store at store
Firm's employees Stevedores, union crews,
swampers
Per- cent
55
12
4 20
6
2
Per- cent
75
13
3 4
Per- cent
96
1
1
Per- cent
72
9 Partly by firm's employ-
ees and partly by stevedores 1
Railroad employees Terminal company
employees Cartage company em-
ployees 5 Trucker 5 Trucker to the tailgate
and firm's employees into store 13
Other- 0) O 2 0) Total 100 100 100 100
1 Less than 0.5 percent.
team track must be unloaded by stevedores who are hired by the job or by employees of the railroad or terminal company. In a number of markets where rail receipts are smaller, wholesalers use their own employees for this job.
Cartage and Sales Out-of-Car.—Nine percent of the total volume of wholesale handlers (exclud- ing importers and exporters) was hauled from terminal or team track to the wholesaler's store before the produce was sold (table 34). This is 22 percent of the total receipts by rail in these wholesale markets, including both direct purchases arriving by rail and pinchases through brokers and agencies. This practice was most common among commission merchants, tomato repackers, commission wholesalers, secondary wholesalers, and receivers and receiver-purveyors.
Two-thirds of the produce unloaded at team tracks was hauled in the firm's own trucks and the remainder in hired trucks, mostly by regular cartage firms in the market. Secondary handlers did most of the hauhng in their own trucks, while primary handlers tended to rely more on cartage firms. Commission wholesalers used hired haulers almost entirely, while commission merchants hauled only about 40 percent in their own trucks.
Eighty-five percent of the produce hauled by hired truckers was moved by cartage firms at published rates. In many cases, rates are regu- lated by the Interstate Commerce Commission or by State public utilities commissions. Two per- cent was hauled by contract or custom haulers at rates negotiated with each buyer. The charges for the remainder were not specified.
Fifteen percent of the total volume of wholesale handlers was sold directly out of the rail car or truck, without going through the wholesaler's store. Most of the out-of-car sales were made by receivers, commission wholesalers and commission merchants and most of the out-of-truck sales by shippers and itinerant truckers. Only 4 percent of the volume of secondary handlers was sold out-of-car or truck, compared with 16 percent for primary handlers and 28 percent for shippers and truckers.
Delivery.—DeHvery is the most commonly offered service, except for credit. Over three- quarters of the wholesale handlers delivered at least a part of the produce they sold (table 35). These firms deUvered 69 percent of the produce which they sold, or 52 percent of the total sales of all wholesale handlers including those who did not provide dehvery service.
Generally speaking, firms with a high proportion of sales to retailers or institutional outlets are more likely to provide delivery service than are those selling mostly to wholesalers. Receivers and commission merchants delivered 37 to 44 percent of their sales, while receiver-jobbers, service wholesalers, and wholesale grocers delivered from 71 to 89 percent of their sales. Among secondary handlers, truck jobbers, service jobbers, purveyors, re- ceiver purveyors, jobbers, and jobbers (delivery) de- livered most of the volume they sold. Secondary wholesalers, prepackagers and tomato repackers— who sold more to wholesalers and retail organi- zations—delivered less than half of their volume.
TABLE 33.—Percentage oj total volume of produce handled by wholesalers that was unloaded by various methods, U.S. wholesale produce markets, 1958-59
Unloaded by-
Railroad cars unloaded at— Trucks
unloaded
Ter- minal
Team tracks
Store at store
Firm's employees Stevedores, union crews,
swampers
Per- cent
46
11
7 25
8
3
Per- cent
68
20
2 5
Per- cent
98
1
(0
Per- cent
65
In Partly by firm's employ-
ees and partly by stevedores 1
Railroad employees Terminal company
employees Cartage company em-
ployees 5 Trucker 4 Trucker to the tailgate
and firm's employees into store 15
Other 0) 0) 1 0) Total --_ 100 100 100 100
1 Less than 0.5 percent.
39

The various types of shippers delivered only a small proportion of their volume, since most of their sales were to out-of-town buyers. The truckers delivered most of their sales; importers 9 to 10 percent; and exporters none.
Among primary handlers, larger firms tend to provide somewhat more delivery service than small firms (table 36). This was especially pronounced among commission merchants, where 30 percent of the small firms, 45 percent of the medium firms, and 67 percent of the large firms provided some delivery service. A similar tend- ency was not noticeable among secondary handlers, except for banana jobbers.
Most deliveries (85 percent) were made in the wholesaler's own trucks. Only 5 percent was delivered in hired trucks, plus small amounts by farmers, in rented trucks, by a jobber under con-
tract, or by handtruck. Hired trucks were used mostly by firms which did not deliver much of theh' produce. Nearly three-fourths of the deliv- eries by hired trucks were made by cartage firms at published rates. Small amounts were hauled at custom rates (that is, rates negotiated between the hauler and the wholesaler), at a flat rate of 5 cents per package, and at rates determined by other means.
Few wholesalers made a separate charge to their customers for delivery. Only 6 percent of whole- salers delivering in their own trucks made such a charge and 50 percent of these only on out-of-town deliveries. Wholesalers using hired trucks for de- livery were somewhat more likely to make a sepa- rate charge for the service. However, such a charge was made on only 18 percent of the volume delivered in hired trucks.
TABLE 34.—Physical handling by wholesale handlers, U.S. wholesale produce markets, 1968-69
(Percent of total purchases of each type of firm)
Receipts from out-of-town * Rail receipts hauled from terminal or team tracks
to store prior to sale Volume sold out
Type of firm
Total Rau Truck Purchased
through brokers and
agencies
Total 2 In own truck
By others
of rail car or truck
Primary handlers: Receiver
Percent 89 87 85 78 84 85
Percent 26 29 13 22 13
5
Percent 46 54 44 53 38 12
Percent 17 4
28 3
33 68
Percent 11 17
6 13
5
Percent 8 7 5
(') 4
Percent 3
10 1
13 1
Percent 23
Commission merchant 20 Receiver-jobber «_ 3 Commission wholesaler 22 Service wholesaler 3 Wholesale errocer i?)
Average 87
14 20 96 21 42 12 15 78 87 88
22
2 3 5 9 -.
8 26 24
47
8 5
29 4
10 3 3
35 41 53
18
6 13 64 12 23
9 10 35 20 11
11
1 4 9 1
13 («)
2 11
3 15
6
1 4 6 1 9
10 3
12
5
"s" --
.......
16
Secondary handlers: Jobber. 6 Jobber fdeliverv)__ 6 Banana jobber 1 Service iobber 9 Secondary wholesaler 12 Truck iobber 0) Purveyor « Recei ver-Durve vor 3 Prepackager 4 Tomato reoacker 8
Average 50 9
9 1
20
28 24
21
8 11
5
3 1
4
3
1 *4
Shippers and truckers: Mixed-load shiooer. 45
36 0
79 79
42 L.c.l. shiDDer 23 Pfl nker-shÎDDer AT probant trucker (0 57
79 22 22
Itinerant trucker 92 . Average 54 4 41
38
9
17
1
9
1
6 3
28
All wholesale handlers, except importers and exDorters- 73 18 15
1 Receipts by rail and truck, excluding receipts from local growers.
2 Includes small amounts hauled by unknown methods.
3 Less than 0.5 percent. * Includes only sales out of rail car or truck in which
received.
40

Prepackaging, Repacking, and Processing.— Over 1,000 wholesalers prepackaged or repacked nearly 114,000 carlots of fruits and vegetables in U.S. wholesale markets in 1958 (table 37). This is about 7 percent of the total supply entering these markets. Including another 32,000 carlots prepackaged or repacked by 97 retail organiza- tions, about 9 percent of the net supply was pre- packaged or repacked at the wholesale level. This does not include bananas or items packaged in the backroom of the retail store. Specialized pre- packagers accounted for 43 percent of the produce prepackaged or repacked by wholesalers, tomato repackers 23 percent, receivers 14 percent, receiver- jobbers 7 percent, and service wholesalers 6 per- cent. The remaining 7 percent was put up by every other type of wholesale handler except truck jobbers, and a few brokers and distributors.
Nearly 60 percent of the wholesalers prepack- aged a single commodity, 18 percent, two com- modities; 12 percent, three commodities; 6 per- cent,, foiu- commodities; and 2 percent, five or more products.
Tomatoes were put up by more firms than any other commodity, closely followed by potatoes (table 38). Sixty percent of the wholesalers who prepackaged or repacked anything repacked to- matoes, while 42 percent prepackaged potatoes, 23 percent onions, 13 percent citrus, and 11 per- cent apples. Tomatoes, potatoes, and onions were put up by nearly every type of wholesale handler. Celery, carrots, spinach, kale, cole slaw, and salad mix were handled to a much greater extent by the specialized prepackagers.
Most of the large wholesalers were about as likely to do some prepackaging as smaller ones of
TABLE 35.—Extent oj delivery services by wholesale handlers, U.S. wholesale 'produce markets, 1958-59
Type of firm
Volume delivered as Percentage of deliveries by— percentage of sales of—
Percentage of firms pro- viding de- All firms of Firms mak- Firm's Hired Other
livery service this type mg some deliveries
trucks trucks methods or method
unknown
Percent Percent Percent Percent Percent Percent 74 44 55 83 6 11 51 37 55 82 13 5 Sb 71 81 92 1 7 45
100 75
16 89 80
50 89 98
58 95
5
42 5
93
74 52 66 86 5 9
26 7 19 91 2 7 100 87 87 82 4 14 69 49 64 88 5 7 98 60
100 91
80 36 99 87
81 59 99 97
95 85
100 85
5 _..
6 9 95 86 91 97 1 2 78 48 66 S^ 9 3 62 42 60 79 17 4
80 63 78 85 5
18
10
66 32 45 49 33 38 59 73
100
19 25 78 99
24 44 89 99
39 32
61 68
100 100
74 40 52 65 13 22
55 10 68 90 6 4 29
0 9 62 100
25 12 66 67 31 2
77 52 69 85 5 10
Primary handlers: Receiver Commission merchant. Receiver-jobber Commission wholesaler Service wholesaler Wholesale grocer
Average
Secondary handlers: Jobber Jobber (delivery) Banana jobber Service jobber Secondary wholesaler,. Truck jobber Purveyor Receiver-purveyor Frepackager Tomato repacker
Average
Shippers and truckers: Mixed-load shipper L.c.l. shipper Packer-shipper Merchant trucker Itinerant trucker
Average
Importers and exporters: Importer Commission importer. Exporter
Average
All wholesale handlers
41

the same type. Among primary handlers, large receiver-jobbers and wholesale grocers prepack- aged a considerably higher percentage of their produce than did smaller firms of the same type. But large receivers, commission merchants, and service wholesalers prepackaged the same propor- tion of their sales as did small ones. Small jobbers of most types prepackaged or repacked more of their produce than did the large firms. Small service jobbers were the exception to this generalization, with large ones prepackaging or repacldng 8 percent of their volume and small firms only 2 percent.
Most of the processing of bananas—ripening, cutting, and boxing—was done by banana jobbers and national chains. AU types of jobbers ac- counted for 37 percent of the bananas processed in
1958 and national chains for 26 percent. Other types of retail organizations took another 16 percent—regional chains 7 percent, local chains with warehouse 4 percent, retailer cooperatives 3 percent, and voluntary groups 2 percent. Primary handlers processed 19 percent of the bananas—^receivers and receiver-jobbers 7 percent each and service wholesalers 5 percent. Receiver- purveyors and merchant truckers took 1 percent apiece and several other types of wholesalers handled small quantities.
Other Physical Handling Functions.—Nearly all wholesale handlers except some truck jobbers do some warehousing of produce. Some truck jobbers have a garage or warehouse where they store some produce temporarily and arrange it for loading. Others have only the truck in which to hold any
TABLE 36.—Extent of delwery services by wholesale handlers, by size oj firm, U.S, wholesale produce markets, 1958-69
Type of firm
Percentage of firms of each size providing delivery service
Volume delivered as per- centage of sales of all firms of each size
Percentage of firms of each size delivering 60 percent or more of their sales
Small firms
Medium firms
Large firms
Small firms
Medium firms
Large firms
Small firms
Medium firms
Large firms
Primary handlers: Receiver
Percent
67 30 84 37
100 83
Percent
77 45 93 48
100 67
Percent
80 67 93 22
100 100
Percent
74 32 86 33
100 98
Percent
77 42 93 53
100 59
Percent
79 73 91 17
100 100
Percent
38 10 68
7 92 50
Percent
38 28 77 34
100 67
Percent
39 Commission merchant Receiver-j obber
36 78
Commission wholesaler _ Service wholesaler "90 Wholesale grocer 100
Average 71 78 81 73 78 81 49 52 52
Secondary handlers: Jobber 22
100 68 95 62
100 96
100 83 64
55 100
73 100 46
100 100 100 90 97
26 100 85
100 67
91" 100 77 50
26 100
71 96 65
100 96
100 85 66
61 100 74
100 47
100 100 100 90 95
20 100 92
100 69
93" 100 84 80
Jobber (delivery) 92 41 90 17
100 94
100 79 38
96 43 85 31
100 100 94 73 62
86 Banana jobber 46 Service jobber 50 Secondary wholesaler Truck jobber
67
Purveyor 91 Receiver-purveyor 94 Prepackager 51 Tomato repacker
Average 82 87 81 82 88 84 76 68 60
Shippers and truckers: Mixed-load shipper 100 59
67 78
Í05"
31" 100 68
91 62
iöö"
5Ö" 67 16
L.c.l. shipper 50 33 Packer-shipper 33 Merchant trucker 100
84 100 100
100 92
100 100
100 82
100 50 Itinerant trucker 100
Average 88 78 67 91 80 74 ' 86 52 29
Importers and exporters: Importer 64
26 84 33
26 20
76 18
79 42
10 10
51 10
21 15 Commission importer ExDorter
20
Average - 26 31 18 21 27 9 19 7 13
All wholesale handlers 79 80 78 80 80 76 66 57 50 4
42

TABLE 37.—Volume and nvmber of items prepackaged or repacked, by type of firm, U.S, wholesale produce markets, 1968-59
Number of firms 1
Volume prepack- aged or
repacked
Firms prepackaging or repacking—
Type of film 1 item 2 items 3 items 4 items 5 or more
items
Primary handlers: Receiver 155
19 144
3 89
8
Carlots 15, 425 2,585 7,727
29 6,960 1,087
Firms 93
7 51
3 26
Firms 25
4 42
Firms 15
5 38
Firms 8 1 9
Firms
Commission merchant 1 Receiver-j obber_ 3 Commission wholesaler Service wholesaler 14 25
8 20 4
Wholesale grocer
Total 418 33, 813 180 85 91 38 8
Secondary handlers: Jobber 34
39 13 12
7 26 40
207 274
507 879 230 388
52 616
2,318 48, 552 25, 722
26 20
7 4 3
16 17 84
256
12 14
2 5 Jobber (delivery)
Banana jobber Service jobber 2
2 8 8
46 13
5 1 Secondary wholesaler Purveyor 5
5 19
Receiver-purveyor 2 23
5 Prepackager 19 Tomato repacker _
Total 652 79, 264 433 105 42 30 19
All wholesalers ^ 1,078 113, 647 619 190 131 68 27
1 Includes firms prepackaging an unknown number of items. 2 Includes small quantities by wholesalers of types not listed.
TABLE 38.—Number oj firms prepackaging or repacking specified commodities, by type oj firm, U.S. whole- sale produce markets, 1958-59
Type of firm Potatoes Onions Tomatoes Celery Carrots Spinach, kale
Cole slaw, salad mix
Citrus Apples
Primary handlers: Receiver
Firms
73
12 96
Firms
23
11 57
Firms
68
4 65
Firms
8
2 7
3 4
Firms
5
1 3
Firms
1
Firms
2
Firms
26
7 43
Firms
14 Commission mer-
chant 2 Receiver-jobber Commission whole-
saler
1 29
Service wholesaler Wholesale grocer
77 8
38 2
40 4
4 2 6 2
26 6
29 2
Total 266 131 181
20 24
7 7 1
17 21 64
274
24 13 3 11 108 76
Secondary handlers: Jobber 22
27 14
9 Jobber (delivery) Banana jobber
3
Service jobber 11 2
19 24 93
1
4 2
12 5
46 4
1 4 Secondary wholesaler« 2
2 1
42
Purveyor 2
28" 1
2 Receiver-purveyor 2
41 5
Prepackager 48 41 13 Tomato repacker 18
Total - 199 96 435 48 41
56
43 47 32 A^
All wholesalers * 458 249 624 72 45 59 142 119
1 Includes a few firms of types not listed.
43

TABLE 39.—Percentage oj wholesalers offering various credit terms to noninstitutional cnstomerSy U.S. wholesale produce markets, 1958-59
Type of firm Cash 7 days 10 days 14 to 15 days
30 days Other All firms reporting
Primary handlers: Receiver. _
Percent 6
Percent 63 39 64 45 86 79
Percent 18 47 13 36
Percent 8
11 9
19 5
Percent 2 2 3
Percent 3 1 2
Percent 100 100 100 100
Commission merchant Receiver-jobber. _ 9 Commission wholesaler Service wholesaler 1 8 100 Wholesale grocer 21 100
Average.. 5 61 20 8 3 3 100
Secondary handlers: Jobber 24
8 12
43 57 50 59 58 48 54 31 60 53
16 5
22 10 24
12 17
9 9 6 9 8 8 2 4
5 6 6
15
100 Jobber (delivery). 7
1 7
12 6
28 31 10 7
inn Banana jobber . 100
100 100
Service jobber Secondary wholesaler. _. Truck jobber . . 31
5 12
2 8
6 5
100 Purveyor.. 100 Receiver-purveyor 18
22 22
100 Prepackager 4
6 100
Tomato repacker _ inn
Average 12 47 10 10 13 8 100
Shippers and truckers: Mixed-load shipper 73
43 51
100
9 18 100 Packer-shipper ... 57
5 100
Merchant trucker _ . 5 5 100 Itinerant trucker _ 100
Average 24 57 2 7 7 3 100
Importers and exporters: Importer 12 51
14 3
16 59 4
9 27
7
12 100 Commission importer 100 Exporter _ _ _ . 18 10 58 100
Average _ __ 13 10
23 51
18 14
11 10
5 8
30 7
100 All wholpsale handlers 100
Brokers and distributors: Selling broker 5
33 22 33
50 89 21 11
27 17 11 14
8 5 100 Auction representative . _ 100 Terminal broker 100 Carlot distributor 58
34 7
33 100
Distributor 11 11 100
Average _ _ 6 26 37 18 5 8 100
Sales agencies: Cooperative . 59
8 33 46
8 100 Importer's 38 8 100
Average 32 40 20 4 4 100
Others: Auction 17
52 33
50 31 40
33 8
100 Buying broker 9
27 100
Buying office 100
AU brokers and agencies 8 36 32 13 6 5 100
44

unsold part of the load overnight. Some receivers and commission merchants sell a fairly large pro- portion of their supplies out of the rail car and truck and consequently do little warehousing on their own premises. A few purveyors, essentially truck jobbers with eating places or institutions as their major outlets, do little warehousing.
Most wholesale handlers do a little recondition- ing and recoopering of occasional lots of produce. A few specialize in this type of business, buying salvage lots from the railroads or from other whole- salers, reconditioning them, and selling them to other buyers.
Mixed-load shippers and l.c.l. shippers specialize in'assembling loads of produce from first receivers, chiefly for sale to wholesalers and retail organiza- tions in distant markets. Mixed-load shippers also buy fairly substantial quantities from nearby growers and both types of shippers buy a fair amount from shipping point for this purpose.
Inspection of incoming merchandise to deter- mine whether or not it is of acceptable quality is generally carried out by the firm's own employees. Most wholesalers rely on inspection by the U.S. Department of Agriculture only for some lots of doubtful quality. In 1958, 30 percent of the primary handlers did not use Federal inspection at all, while 64 percent used it only for receipts of doubtful quality. A few used Federal inspection for all purchases, 1 percent on sales to institutions and ships' stores, and small numbers on export shipments and sales to the mihtary and local gov- ernment institutions. In general, the larger firms were more likely to use Federal inspection than the smaller firms of the same type. The firms which did not use inspection services sold only 18 percent of the volume of all primary handlers. Primary handlers reported using Federal inspec- tion nearly 25,000 times during 1958, equivalent to 4 percent of the total number of carlots sold by them in that year. If each inspection were of a coraplete carlot—which it was not—4 percent of their purchases would have been federally in- spected at the terminal market level in 1958. This does not include Federal-State inspection at shipping-point level, which covered a much larger quantity.
Secondary handlers were much less likely to use Federal inspection. Sixty-eight percent of second- ary handlers—including 84 percent of jobbers and 94 percent of truck jobbers—did not utilize Federal inspection. Two-thirds of the brokers and distributors used Federal inspection on mer- chandise of doubtful quality and another 7 percent in other ways.
Financing
Customer Credit.—Over 90 percent of all whole- salers offered credit to their customers (table 39). The usual credit terms in a market are typically established by agreement among the wholesalers, either formally through a credit association or by general acquiescence in market customs. Credit
terms of either 7 or 10 days for noniustitutional customers were most common. The most com- mon credit terms were 7 days in 80 percent of the markets where information on credit terms was obtained.
Credit to eating places and institutions was usually 30 days in contrast to the 7-day terms usually offered to wholesalers and retailers (table 40). Eighteen percent of the wholesale handlers varied the credit terms they offered to different buyers, depending on the credit rating and volume of sales to the particular firm.
TABLE 40.—Percentage oj firms oj each type offer- ing specified credit termSy U.S. wholesale produce markets, 1958-59
Type of firm
30 days for institu- tional trade, shorter
for others
Vary for
indi- viduals
Longer credit terms
for some types of
firms
Primary handlers: Receiver _ __
Percent 8 4
18
Percent 21
7 10
8 15 12
Percent 3
Commission merchant. _ Receiver-jobber Commission whole-
saler
15 1
9 Service wholesaler Wholesale grocer
26 25
Average 12 15 5
Secondary handlers: Jobber. 2
15
25 6
10 24 10
5 6
15 24 27 26 11 19 22 27 22 16
2 Jobber (delivery) Banana jobber__
1
Service jobber Secondary wholesaler Truck jobber Purveyor 1 Receiver-purveyor Prepackager
3 4
Tomato repacker 4
Average 10 21 2
Shippers and truckers : Mixed-load shipper 6
21 7
13 Merchant trucker Itinerant trucker
Average 14 2
Importers and exporters: Importer 2 Commission importer 9 Exporter 26 3
Average _ 1 11 3
All wholesale handlers 10 18 4
^ Less than 0.5 percent.
Production Loans.—Loans to growers to finance production of fruits and vegetables—once an im- portant function of wholesalers—are of minor importance. Only 124 wholesalers, less than 3 percent of the total, reported financing production
45

on a regular basis. Another 211 firms made occa- sional loans, advanced payment for future ship- ments, or otherwise advanced funds for shorter periods. Most of the wholesalers making such loans were receivers or commission merchants.
Type of firm
Firms making produc-
tion loans
Total sales of firms making
production loans
Receiver Number
28 33 10
7
Thous. carlots 36
Commission merchant 35 Receiver-jobber 2 Service wholesaler 5
All primary handlers 78 78
Jobber and jobber (delivery) Receiver-purveyor
3 4 9 2
« 1 Prepackager 6 Tomato repacker 0)
All secondary handlers 18 8
Mixed load shipper 3 2 3 6 2
112
à Itinerant trucker 1 Importer Commission importer
1 5
ExDorter 1
All wholesale handlers 96
Selling broker 2 2 7 1
4 Auction representative Carlot distributor
3 19
Distributor _ 1
All brokers and distributors.. 12 27
All wholesalers 124 123
* Less than 500 carlots.
Most of the firms making occasional loans or short-term advances were also receivers and com- mission merchants.
Merchandising Services Eighty percent of the wholesalers offered no
merchandising services to their customers (table 41). The ordy primary and secondary handlers where more than a quarter of the firms offered at least one merchandising service were service whole- salers, service jobbers, wholesale grocers, receiver- jobbers, and truck jobbers. None of the second- ary wholesalers and only 3 percent of the purveyors offered any services. Only 7 percent of the brokers and distributors offered services, but many of the sales agencies offered one and a few two services.
The service made available by the largest num- ber of wholesalers was suggesting retail selling prices to their customers (table 42). This was
closely followed by assisting retailers with dis- plays and promotion, offered by 400 wholesalers. Less than half as many offered to guarantee prices in advance for commodities to be advertised as a special; about 100 wholesalers helped to train produce personnel for retail stores. In some cases, assistance in price determination extended to a price comparison service, indicating what the principal chains in the market were selling various items for each week.
Larger firms of each type were more likely to offer at least one merchandising service than were small firms (table 43). The exceptions were serv- ice wholesalers and service jobbers, all of which offered at least two merchandising services, and a few small secondary handlers of scattered types who offered, in most cases, one service. A few truck jobbers offered two or three services.
Among receivers, 29 percent of the large firms offered at least one service, while only 11 percent of the small firms did so. None of the small commission merchants offered merchandising serv- ices, but 15 percent of the large firms did. A third of the small wholesale grocers provided at least one merchandising service, but all of the large ones did so.
Risk-Taking P'^^The incidence of risk-bearing, insofar as price change in transit or while m the market is con- cerned, depends upon the method and terms of purchase—to be discussed in a later section (pp. 55-57). For consignment sales, which ac- counted for 27 percent of all direct purchases of wholesale handlers, the risk of price change is borne largely by the shipper. Of course, the wholesaler's return is also affected to a limited extent since it is usually a percentage of the selling price. Under the common f.o.b. conditions of sale, the wholesaler bears the risk of both price and quality change in transit, but on a delivered sale, the shipper assumes the risk of price and quality change in transit.
Functions of Brokers and Distributors Brokers and distributors perform a number of
functions. Many handled more than one type of transaction, although one type of transaction pre- dominated for each (table 44). All the firms made some sales representing sellers, representing buyers, and taking title. Selling brokers bought 5 percent in their own names and made scattered transactions on consignment, on joint account with the shipper, representmg buyers, and other- wise. Auction representatives sold 58 percent at auction, 27 percent in other transactions repre- senting sellers, and 13 percent in other ways. About 75 percent of the sales of terminal brokers were representing buyers, nearly 25 percent repre- senting sellers, and 3 percent for their accounts.
46

TABLE 41.—Firms offering specified numbers of merchandising services, U.S. wholesale produce markets, 1958-69
Percentage of firms which offered—
Type of firm No serv-
ices 1 service 2 services 3 services 4 or more
services
All firms
Primary handlers: Receiver __
Percent 81 91 70 92
Percent 15
7 24
5
Percent 3 2 6 3
45
Percent 1
Percent Percent 100
Commission merchant 100 Receiver-jobber 0) Commission wholesaler 100 Service wholesaler _ 36
52 19 100
Wholesale errocer 48 100
Average 72 15 7 4 2 100
Secondary handlers: Jobber « 93
86 94
7 12 4
100 Jobber Tdeliverv^ 2
2 16
100 Banana jobber _ 100 Service jobber 64 20 100 Secondarv wholesaler 100
72 97 81 88 94
100 Truck jobber 15
3 11 10 6
9 0)
8 1
0)
4 100 Purveyor 100 Receiver-Durvevor 100 Prepackager 1
0) 100
Tomato repacker 100
Average 85 9 3 2 1 100
Shippers and truckers: Mixed-load shipper 90
100 100 88
100
10 100 L.c.l. shipper _ _ 100 Packer-shipper« 100 Merchant trucker 12 100 Itinerant trucker 100
Average 92 8 100
Importers and exporters: Importer _» 97
100 100
3 100 Commission importer 100 Exporter 100
Average 99 81
1 5
100 All wholesale handlers 10 3 1 100
Brokers and distributors: Selling broker 92
100 95 94 95
7 1 100 Auction representative 100 Terminal broker 5 100 Carlot distributor 6 100 Distributor _ 5 100
Average 93 6 1 100
Sales agencies: Cooperative 63
77 29 23
8 100 Importer 100
Average 68 27 5 100
Others: Auction 60
87 100 100
40 10
100 Buying broker 3 100 Buying office _ 100 Sales agent 100
All brokers and agencies 88 80
10 11
2 5
100 All wholesalers 3 1 100
1 Less than 0.5 percent.
47
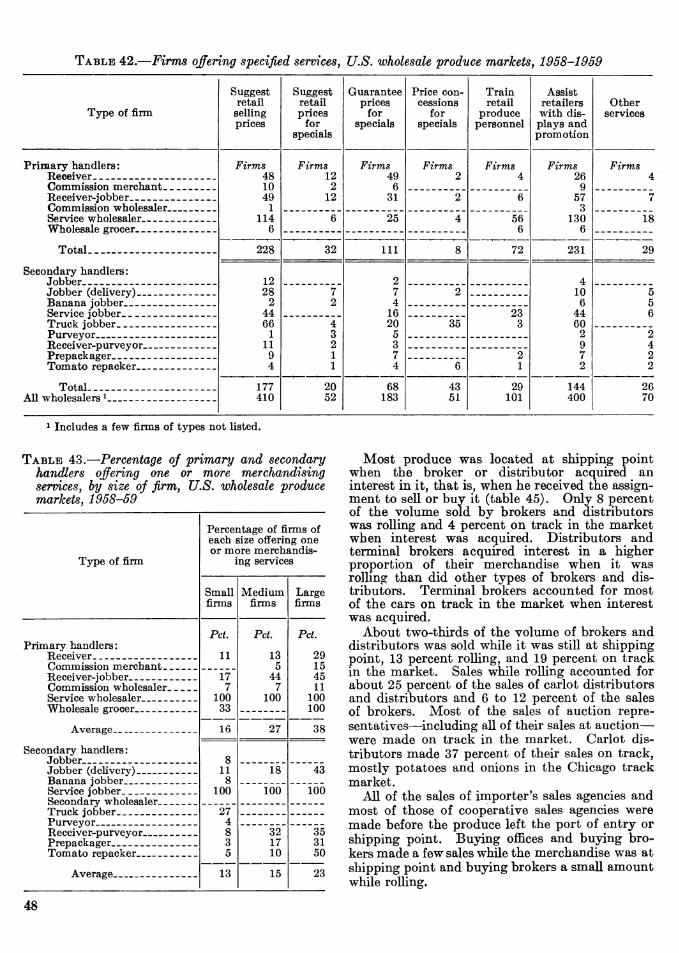
TABLE 42.—Firms offering specified services. U.S. wholesale produce markets , 1958-1959
Type of firm
Suggest retail selling prices
Suggest retail prices
for specials
Guarantee prices
for specials
Price con- cessions
for specials
Train retail
produce personnel
Assist retailers with dis- plays and promotion
Other services
Primary handlers: Receiver
Firms 48 10 49
1 114
6
Firms 12 2
12
Firms 49
6 31
Firms 2
Firms 4
Firms 26
9 57
3 130
6
Firms 4
Commipsinn mernhant... Receiver-jobber 2 6 7 Commission wholesaler Service wholesaler 6 25 4 56
6 18
Wholesale grocer
Total 228 32 111 8 72 231 29
Secondary handlers: Jobber 12
28 2
44 66
1 11
9 4
2 7 4
16 20
5 3 7 4
4 10
6 44 60
2 9 7 2
Jobber (delivery) 7 2
2 5 Banana jobber 5 Service jobber __ 23
3 6
Truck jobber 4 3 2 1 1
35 Purveyor 2 Receiver-Durvevor 4 Prepackager 2
1 2
Tomato repacker _ 6 2
Total - _ 177 410
20 52
68 183
43 51
29 101
144 400
26 All wholesalers ^ _ -- 70
^ Includes a few firms of types not listed.
TABLE 43.—Percentage oj primary and secondary handlers offering one or more merchandising services, by size oj firm, U.S. wholesale produce markets, 1958-59
Type of firm
Percentage of firms of each size offering one or more merchandis-
ing services
Small firms
Medium firms
Large firms
Primary handlers: Receiver _ _
Pet.
11
Pet.
13 5
44 7
100
Pet.
29 Commission merchant 15 Receiver-jobber 17
7 100
33
45 Commission wholesaler Service wholesaler
11 100
Wholesale grocer 100
Average _, _ _ 16 27 38
Secondary handlers: Jobber 8
11 8
100
Jobber (delivery) 18 43 Banana jobber Service jobber 100 100 Secondary wholesaler Truck jobber 27
4 8 3 5
Purveyor _ Receiver-purveyor. 32
17 10
35 Prepackager 31 Tomato repacker 50
Average 13 15 23
Most produce was located at shipping point when the broker or distributor acquired an interest in it, that is, when he received the assign- ment to sell or buy it (table 45). Only 8 percent of the volume sold by brokers and distributors was rolling and 4 percent on track in the market when interest was acquired. Distributors and terminal brokers acquired interest in a higher proportion of their merchandise when it was rolling than did other types of brokers and dis- tributors. Terminal brokers accounted for most of the cars on track in the market when interest was acquired.
About two-thirds of the volume of brokers and distributors was sold while it was still at shipping point, 13 percent rolling, and 19 percent on track in the market. Sales while rolling accounted for about 25 percent of the sales of carlot distributors and distributors and 6 to 12 percent of the sales of brokers. Most of the sales of auction repre- sentatives—including all of their sales at auction— were made on track in the market. Carlot dis- tributors made 37 percent of their sales on track, mostly potatoes and onions in the Chicago track market.
All of the sales of importer's sales agencies and most of those of cooperative sales agencies were made before the produce left the port of entry or shipping point. Buying offices and buying bro- kers made a few sales while the merchandise was at shipping point and buying brokers a small amount while rolling.
48

TABLE 44.—Percentage of volume oj brokers and distributors sold in various ways, U.S. wholesale produce markets, 1958-59
Brokerage sales representing—
On own account
All other Type of firm Seller Seller at
auction Buyer
Total
Selling broker Percent
92 27 24
6 9
Percent
58
Percent
2 2
Percent 5 2 3
87 89
Percent 2
13
Percent 100
Auction representative 100 Terminal broker 100 Carlot distributor _ _ _ _ _ 5 100 Distributor 100
Average. _ 69 2
3 5 96
20 2
2 C)
100 Buvinc broker 100
Average _ 64 3 12 19 2 100
1 Less than 0.5 percent.
TABLE 45.—Location oj merchandise when interest acquired and when sold by brokers and agencies, U.S. wholesale produce markets, 1958-59
Location when acquired interest Location when sold
Type of firm At ship-
ping point
Rolling On
track Total At ship-
ping point
Rolling On
track Total
Brokers and distributors: Selling broker
Percent 89 90 67 91 81
Percent 8 9
15 5
16
Percent 3 1
18 4 3
Percent 100 100 100 100 100
Percent 75 14 68 35 53
Percent 11 6
12 28 24
Percent 14 80 20 37 23
Percent 100
Auction representative 100 Terminal broker 100 Carlot distributor- 100 Distributor 100
Average _ 88 8 4 100 68 13 19 100
Sales agencies: Cooperative 99
100 1 100
100 94
100 1 5 100
Importer's 100
Average 100 « 100 97 1 2 100
Others: Buying broker 5
13 2 93
87 100 100
3 13
2 95 87
100 Buying oflSce _ _ 100
All brokers and agencies 89 7 4 100 70 12 18 100
1 Less than 0.5 percent.
Nearly all of the out-of-town sales of brokers and distributors and of sales agencies bypassed the market where the seller was located and were delivered directly to the buyer. Sales of this type accounted for 45 percent of the sales of all brokers and distributors and 39 percent of those of sales agencies (table 25).
Functions of Different Types of Markets
Every market is different from the others in some way. In this study, wholesale produce
markets have been classified on the basis of four attributes discussed earlier (p. 7). If all the possible attributes had been used as a basis for classification, there would have been as many types of markets as there were markets.
In addition to the functions generally performed by wholesale produce markets, some operate as shipping markets. Los Angeles is the most im- portant shipping market in the study, where 17 percent of the total supply, excluding imports, was sold by shippers, truckers, buying brokers, and buying ofliices of out-of-town firms. Shippers
49

and truckers accounted for 11 percent of the sales in Denver, 8 percent in Chicago, and 6 percent each in Salt Lake City and Wichita.
Atlanta and Columbia are redistribution mar- kets. They serve as central points for assembly of produce from production areas and sales to truckers and others for shipment to distant markets. Out-of-town truckers accounted for about 13 percent of the total supply in Atlanta and 20 percent in Columbia.
Many, but not all, of the coastal cities are im- portant ports of entry for imported produce. New York is the most important with over 56,000 car- lots of imports in 1958—over a quarter of all imports into the country. New Orleans is an im- portant banana-importing center, accounting for nearly 43,000 carlots. Miami and Los Angeles imported about 11,000 carlots each and San Francisco-Oakland, Seattle-Tacoma, and Tampa- St. Petersburg about 4,000 apiece.
Eight of the cities in the survey—and Cleveland and Cincinnati which were not included—had fruit auctions. These included all of the primary markets except Los Angeles, San Francisco-Oak- land, and Pittsburgh.
The buying and selling functions of wholesalers are performed in differing degrees by various types of firms in different markets. The physical handling functions are performed more often in one type of market than in another. These variations will be discussed in the sections that foUow.
Buying Functions Considering all wholesale markets as a group,
shipping-point brokers bought 10 percent of the carlots purchased from packers and shippers, terminal market brokers and agencies 27 percent, wholesale handlers 37 percent, and retail organiza- tions 26 percent (table 46). In primary markets, wholesale handlers bought more of the produce than average, while retail organizations bought considerably less. Terminal market brokers and agencies made 27 percent of the purchases, the same as the average for all markets, and shipping- point brokers a little more than average.
In secondary local wholesale markets, both classes of brokers handled approximately the average proportion of purchases, while wholesale handlers were less important and retail organiza- tions more important than in all markets as a group. In secondary out-of-town wholesale mar- kets, terminal-market brokers and agencies and retail organizations handled a larger share than the average, while wholesale handlers were sub- stantially less important. Other secondary mar- kets showed purchases through shipping-point brokers and by wholesale handlers markedly less than in all markets. Terminal-market brokers and agencies and retail organizations were well above average.
In tertiary chain markets, retail organizations made 51 percent of the purchases from packers
and shippers—nearly tmce the average for all markets—terminal-market brokers and agencies and wholesale handlers were markedly below average, and shipping-point brokers somewhat higher. In other tertiary markets, the figures for wholesale handlers and retail organizations were about average, while those for shipping-point brokers were a little above and those for terminal- market brokers and agencies a little below average.
TABLE 46.—Class oj firm buying carlots jrom packers and shippers, by type of market, U.S. wholesale produce markets, 1958-59
(Percentage of direct purchases from shipping point and port of entry, excluding bypass)
m s« Ö
+3 ë O
Type of market
Is
inal
-mar
ke
kers a
nd
ncie
s
T3
1 fcüO (H O
S2§) ^O •^ -z 2^
EH ^ 1 o
Pet. PcL Pet. Pet. Pet. Primary 12 27 44 17 100 Secondary:
Local wholesale 10 26 33 31 100 Out-of-town
wholesale 9 31 30 30 100 Other 5 36 25 34 100
Tertiary: Chain 13
12 16 24
20 37
51 27
100 Other 100
Small 14 17 49 20 100
All markets 10 27 37 26 100
In small markets, nearly half the purchases were made by wholesale handlers, shipping-point brokers were well above average, and the other types below the all-market average.
For all wholesale markets as a group, shipping- point brokers made 12 percent of the purchases for wholesale handlers, terminal-market brokers and agencies 33 percent, and wholesale handlers them- selves 55 percent (table 47). Wholesale handlers in tertiary chain and small markets depended mostly on shipping-point brokers, while those in other secondary markets scarcely used their services. Terminal-market brokers and agencies were most important in other secondary and secondary out-of-town markets and least impor- tant in small markets. Wholesale handlers in primary, secondary local wholesale, and small markets brought about 60 percent of their carlot volume themselves, while those in secondary out- of-town wholesale, other secondary, and tertiary chain markets bought 42 to 45 percent themselves.
50

TABLE 47.—Class of firm buying carlots from packers and shippers for wholesale handlers^ by type of market, U.S. wholesale produce markets, 1958-59
(Percentage of supply for wholesale handlers)
TABLE 48.—Percentage of sales of wholesale han- dlers in carlots, wholesale lots, and retail lots, by type of market, U.S. wholesale produce markets, 1958-59
-1-3 <D
-u M Ö bTÍ
Type of market O
bß Í-"
SS inal
-ma
kers a
n nc
ies
ao d o 0^ w-i (H
d, f-i Ö M bß O c3 C3
Í
Pet. Pet. Pet. Pet, Primary 13 27 60 100 Secondary:
Local wholesale 14 9
27 47
59 44
100 Out-of-town wholesale 100 Other __. 1 57 42 100
Tertiary : Chain 19
13 17
36 34 22
45 53 61
100 Other 100
Small 100
All markets 12 33 55 100
Selling Functions The differences in the functions performed by
the various types of markets are perhaps best illus- trated by the selling functions performed by whole- sale handlers. Sales in carlots—almost entirely sales of rail cars or trucks which bypass the mar- ket—were made only by wholesale handlers in primary and secondary markets (table 48). They accounted for 7 percent of sales in primary mar- kets, 3 percent in secondary local wholesale markets, and 1 percent in each of the other types of secondary markets. Sales in wholesale lots (of about 10 packages or more) were most impor- tant in secondary out-of-town wholesale markets where they accounted for 70 percent of the sales of wholesale handlers. They were also more impor- tant than sales in retail lots in primary, other tertiary, and secondary local wholesale markets. Sales in retail lots were most important in other secondary, tertiary chain, and small markets.
Physical Handling Functions Both hauling from terminal or team track and
selling out of rail car or truck are more prevalent in larger markets than in smaller ones (table 49). Wholesale handlers in primary markets hauled 12 percent of the supply from terminal or team track to their stores prior to sale; those in secondary markets, 6 to 7 percent; and those in tertiary markets, 1 to 3 percent. However, in small markets 9 percent was hauled from team tracks to the wholesaler's store before it was sold. Firms in these markets were less likely to have their own railroad sidings than those in many secondary and tertiary markets.
^ CD o O c3 ^ ■+J rn
Type of market 2 SI
"^ (D '^ DO
S "¿^ 03 1—1 l—H CO Tá '-^ T^ 03 & 03
H
Pet. Pet. Pet. Pet. Primary 7 58 35 100 Secondary:
Local wholesale 3 54 43 100 Out-of-town wholesale 1 70 29 100 Other 1 47 52 100
Tertiary : Chain 32
56 34
68 44 66
100 Other 100
Small 100
All markets -_ 4 56 40 100
In primary markets, 28 percent of the supply was sold out of car or truck; in secondary local wholesale and out-of-town wholesale markets 17 to 20 percent; and in each of the other types of markets 5 to 8 percent.
TABLE 49.—Physical handling functions performed by wholesalers in dijerent types of markets, U.S. wholesale produce markets, 1958-59
Percentage of net supply for resale
M >» -a o ^* o c3 • a; r^
1 1 Type of market
ed f
rom t
e er
min
al b
y ha
ndle
rs O fi
O 03
Xi
Han
dl
or t
sa
le
1* > g
PH
Pet. Pet. Pet. Pet. Primary 12 28 48 11 Secondary:
Local wholesale 7 17 63 10 Out-of-town wholesale 6 20 44 11 Other 7 5 62 11
Tertiary : Chain 3
1 9
6 8 5
95 89 80
18 Other 20
Small 10
All markets 9 20 56 11
51

Delivery service was more common in smaller markets than in larger ones. Only 48 percent of the net supply in primary markets was delivered by wholesale handlers; 62 to 63 percent in second- ary local wholesale and other secondary markets; and 80 to 95 percent in tertiary and small markets. The proportion delivered in secondary out-of- town wholesale markets was smaller than in other types of secondary markets, principaUy because out-of-town sales are less often delivered than those to local buyers.
The volmne prepackaged or repacked by whole- salers was 10 to 11 percent of the net supply for resale in primary, secondary, and small markets. In tertiary markets, it was 18 to 20 percent of the supply, largely because the chains in this group of markets do less warehouse prepackaging than those in many other markets. They rely more heavily on local prepackagers and repackers to supply them with these products. Thus, the volume prepackaged or repacked by both whole- salers and retail organizations is 9 percent of the total supply, including that of chains—at the same level as in primary and secondary markets. How- ever, on this basis of comparison, the volume prepackaged or repacked by all types of firms in other tertiary markets was 17 percent of the net supply and in small markets only 7 percent.
Prepackaging and tomato repacking are much less important in some sections of the country than in others. In California, retail sales of pre- packaged fruits and vegetables are low compared to other parts of the country and many of the tomatoes are vine-ripened and sold in bulk. In Los Angeles, only 4 percent of the net supply for resale was prepackaged or repacked by whole- salers and in San Francisco only 2 percent. In contrast, in the three primary markets in the northeast a simple average of 17 percent of the supply was prepackaged or repacked and fn the two midwestern markets 9 percent.
In midwestern markets of all types, prepackag- ing and repacking averaged about 8 percent of the supply, while in other regions, except California, it averaged between 13 and 16 percent. The same general picture is obtained if the prepackaging and repacking by both wholesalers and retail organi- zations are considered.
Merchandising Services and Credit Wholesalers in the largest and the smallest
markets offered the fewest merchandising services, while those in medimn-sized markets were much more likely to make these services available to their customers (table 50). It is comparatively easy to explain the relative lack of merchandising services in primary markets. A substantial share of the volume in these markets is handled by receivers and commission merchants, who sell mostly to other wholesalers with no need for mer- chandising services or to retail organizations per- forming these services for themselves.
The low level of merchandising services in smal rnarkets may be due in part to the competitive situation in the areas served by wholesalers in these markets. Many of their retail customers are in small towns or villages where there may be no other retail stores. Small retailers in areas such as these do not feel direct competitive pres- sm-es from stores in other towns and may not feel the need for merchandising services as much as retailers in larger towns.
TABLE 50.—Merchandising services and credit terms offered by wholesalers in different types of markets, U,S, wholesale produce markets, 1958-69
Percentage of sales of primary and
secondary handlers offering—
Type of market
It anee
in
ning
so
nnel
'Zu «3 « Ö 1
a> <—i -JJ "-* Y". ■^ t-i .^ p ssis
tr
a pe
l .2 §.2 c3
m < < t)
Pet. Pet. Pet. Days Primary _ 8 3 8 9 Secondary:
Loc£d wholesale 19 11 20 7 Out-of-town wholesale 29 7 17 7 Other 21 12 23 7
Tertiary : Chain 26
6 6
13 7 2
50 13
7
7 Other 9
Small 10
All markets 16 6 17 8
Services were more numerous in tertiary chain markets, suggesting that the pressure of competi- tion from strong chains has encom'aged retailers to seek and wholesalers to provide many merchan- dising services. However, this general hypothesis is not borne out by a comparison of the mer- chandising services provided with the structure of the retail market. There is no relationship between the sales volume of firms offering mer- chandising services and the share of the retail market controlled by chains, voluntary groups, and cooperatives. Wholesalers in markets in the Plains and Mountain States tended to offer more merchandising services than did those in the other parts of the country.
In a sense, wholesalers in the largest and the smallest markets would appear to compensate for the few merchandising services they offer by extending longer credit terms. While the typical terms were 7 days in all types of secondary markets and in tertiary chain markets, they were 9 to 10 days in primary, other tertiary, and small markets.
52

Buying Methods of Wholesalers The wholesaler has a choice of many different
methods of procm*ing supplies. If he decides to contact shipping-point marketing firms himself, he has a range of choices from personally visiting the seller to delegating the buying function to a buying broker or ''field man/' Each type of firm combines the various buying methods in different proportions (table 51). For all wholesale han- dlers, the largest share—39 percent—was bought directly by telephone or, occasionally, by wire. Another 27 percent was handled on consignment. Thirteen percent was bought through shipping- point buying brokers and 12 percent by the whole- saler's own buyer, either salaried or a member of the firm. Small amounts are obtained from pack- inghouses or farms owned wholly or in part by the wholesaler, through shipping-point selling brokers, on joint account with shippers, from farmers' markets, by personal contact with the shipper, and by other means.
Service wholesalers, tomato repackers, wholesale grocers, prepackagers, and receiver-jobbers relied most heavily on their own buyers. Most service wholesalers, wholesale grocers, and receiver-jobbers employing salaried buyers were members of multi- unit wholesale organizations. The individual units of each organization are classified according to their own characteristics, so units from one organization may be found in several firm types. A few tomato repackers also belonged to multiunit organizations, but most of them have their own buyers because they handle relatively few com- modities—only one commodity for most tomato repackers—and often a single buyer can cover the major production areas as the season progresses.
Commission merchants and commission whole- salers are, by definition, firms which handle most of their supplies on consignment. Half or more of the small quantities to which they took title were bought directly over the telephone.
TABLE 51.—Sources of supply and buying methods on purchases from shipping point, by type of firm y U.S. wholesale produce marked?, 1958-59
Type of firm Con- sign- ment
On joint
account with
shipper
Direct
phone or
wire
Through shipping-
point buying broker
Through shipping-
point selling broker
From own or affili-
ated shipper, packing-
house, or farm
Through own
buyer
From shipping-
point farmers' market
Other Total
Primary handlers: Receiver
Percent 12 79 10 86
2
Percent 1 3 1 1 1
Percent 48 11 58
9 35 78
41 49 31 58 68 48 58 53 29
93 18
7
Percent 16 4
12 4
23
Percent 3
0) 1
Percent 5 1 1
0)
Percent 11
1 17
39' 22
3
Percent 1 0
0) P) 0)
Per- cent
3 1
0)
Per- cent
100 100 100 100 100
Commission merchant.._ Receiver-jobber Commission wholesaler. _ Service wholesaler Wholesale grocer 100
Secondary handlers: Jobber ._ 35
16 4
29
10 21 65 13 4
41 26 16 26
_._ 9 2 3
100 100 Jobber (delivery)
Service jobber 100 100 Second ary wholesaler
Truck jobber 9 2 19 21
2 13 1 2
2 3 72 2 89 249
100 100 100
Purveyor __ i}) 1 2
0)
2 6 1
0) 0)
2 Receiver-purveyor
10 Prepackager. 22
32
3
0) 1
2
100 100
100 100 100 100
100 100
Tomato repacker Shippers and truckers:
Mixed-load shipper L.c.l. shipper 5
1 37
5 2 Merchant trucker
Itinerant trucker 0) 1
14 Importers and exporters:
Importer 17 16 10
-. 83 41 71
Commission importer 1 7
2 '~3"39' 34 Exporter 6 2 100
All wholesale han- dlers 27 1 39 13 2 4 12 O {') 100
Ï Less than 0.5 percent. 2 Personal contact at the packinghouse. 3 As a broker.
53

Nearly one-half of receivers' direct purchases from shipping point were made by telephone. Other sources of some importance were shipping- point buying brokers (16 percent), consignment (12 percent), and their own buyers (11 percent). Receiver-jobbers, service wholesalers, and whole- sale grocers obtained most of their direct purchases over the telephone, aside from that bought by their own buyers. Service wholesalers also ob- tained 23 percent through shipping-point buying brokers and receiver-jobbers 12 percent by this means.
Except for prepackagers and tomato repackers, secondary handlers bought small quantities di- rectly from shipping point. In most cases, these purchases were made over the telephone, although service jobbers bought 65 percent through buying brokers. Purveyors and receiver-purveyors also relied fairly heavily on buying brokers. Jobbers, secondary wholesalers, and jobbers (delivery) handled from 16 to 35 percent on consignment.
Prepackagers purchased over haK over the tele- phone and tomato repackers 29 percent. Both obtained most of the remainder of their supplies through their own buyers or through buying brokers.
Most of the supplies of mixed-load shippers and l.c.l. shippers were purchased in the local market. For the small amounts which they bought directly from shipping point, mixed-load shippers relied heavily on direct dealing over the telephone and
l.c.l. shippers handled most of theirs in a brokerage capacity.
Merchant truckers did most of their buying in person. Itinerant truckers bought about half in person at the packinghouse, 14 percent at farmers' markets, and relied on buying brokers for 37 percent. Importers and exporters bought mostly by telephone.
In general, large primary handlers had procure- ment patterns which do not differ markedly from those of smaller firms of the same type (table 52). Large receivers and receiver-jobbers handled some- what more on consignment and bought a little less over the telephone and through buying brokers than did medium and small receivers. Small com- mission merchants and commission wholesalers handled over 90 percent on consignment, while large firms had about 80 percent consignment business. Large service wholesalers bought much less by telephone and through buying brokers than did the smaller firms, the difference being made up by purchases through their own buyers.
Procurement patterns of secondary handlers varied much more than those of primary handlers, mostly because their direct purchases were much smaller. Probably the differences are significant only for prepackagers and tomato repackers. Large prepackagers and tomato repackers ob- tained more of their supplies from their own packinghouses and their own buyers than did small firms.
TABLE 52.—Percentage oj direct purchases jrom shipping point made by certain methods, by size of firmj U.S. wholesale produce markets, 1958-59
Type of firm
Consignment Direct by phone or wire Through shipping-point buying broker
Small firms
Medium firms
Large firms
Small firms
Medium firms
Large firms
Small firms
Medium firms
Large firms
Primary handlers: Receiver
Percent 4
91 3
94
Percent 9
89 8
81 1
Percent 13 78 11 80
1
Percent 55
8 67
6 67
Percent
59 4
33 100
Percent 47 12 60 12 31
100
Percent 22
0) 15
1 34
Percent 15
2 16
1 61
Percent 17
Commission merchant Receiver-! obber
5 9
Commission wholesaler Sprvice wholesaler
6 16
^^ImlPQolp OTrtPPT
Averaffe 25 27
55 5
32
14 11
46
48 31 52 16 68 47 45 45 37
42
30 61
8 61
36
86 71 32 67
16
19" 17
1 4
48 6
25 35
14
2 31 92 31
12
Secondary handlers: .Jobber Jobber Tdeliverv) 6
31 83
18 Sîervice iobber - 68 Secondary wholesaler Tfiinlr irkH'hf*r
7 24 9
Purveyor - - - 2 4 2
0) JL ¥
0)
36 86 69 21
57 44 50 16
50 14 14 15
35 Receiver-Durvevor 56 Prepackager 15 Tomato repacker 19
Average 2 3 3 40 49 47 28 17 19
All wholesale handlers 14 21 30 40 45 37 19 15 12
' Less than 0.5 percent.
54

TABLE 53.—Buying methods and sources on direct purchases from shipping point by wholesale handlers, by type of market, U.S, wholesale produce markets, 1958-59
Percentage of purchases of wholesale handlers
Type of market Con- sign- ment
Joint account
with shipper
Direct by
tele- phone
Through buying
broker at shipping
point
Through selling broker
at shipping
point
Through own
buyer
From own or affili- ated
farm or packer
Pur- chased in per- son at
shipping pomt
Other methods
Total
Primary Percent
39
23
6 4
2 10
Percent 2
0)
1
__
Percent 30
50
56 53
44 42 48
Percent 11
17
16 2
30 19 19
Percent 3
1
0) 0)
__
Percent 8
4
12 37
14 25 30
Percent 4
1
8 3
__
Percent 1
3
0) 0)
8 3 1
Percent 2
1
1 1
2
Percent 100
Secondary: Local wholesale Out-of-town whole-
sale
100
100 Other 100
Tertiary: Chain 100 Other _._ 100
Small loo All markets 27 1 39 13 2 12 4 1 1 100
Ï Less than 0.5 percent.
Nearly 40 percent of the direct purchases of wholesale handlers in primary markets were handled on consignment, compared to 23 percent in secondary local wholesale markets, and 10 per- cent or less in each of the other types of markets (table 53). Direct purchases by telephone ac- counted for 30 percent of total direct purchases in primary markets, 50 to 56 percent in secondary markets, and 42 to 48 percent in tertiary and small markets.
Shipping-point buying brokers were used more by wholesale handlers in tertiary chain markets (30 percent) than by those in any other type of market. Firms in other secondary, small, and tertiary chain markets used their own buyers more extensively than did firms in the other types of markets. Few firms in primary and secondary local wholesale markets had buyers of their own at shipping point.
Terms of Purchase The terms of purchase define the responsibilities
of buyer and seller for payment of transportation, refrigeration, and associated charges and for loss of quality in transit. The terms are defined in regulations issued under the Perishable Agricul- tural Commodities Act. Definitions of most of the common terms are given in the appendix. On transactions where the wholesaler took title to the produce—omitting consignment, joint account, and brokerage sales—nearly 60 percent of the firms making over 70 percent of the purchases from shipping point bought the biggest share f.o.b. shipping point (table 54). Under these terms, the shipper's responsibility is to place the produce in the car or truck in suitable shipping condition. The buyer assmnes all responsibility for transpor- tation charges and for loss in transit (other than
losses attributable to the railroad or trucker). F.o.b. terms were used on a minority of purchases by another 12 percent of the wholesalers, including some commission merchants whose consignment transactions are excluded from the first two columns of table 54.
Most of the remaining wholesalers bought prin- cipally on a delivered basis or f.o.b. acceptance. The delivered basis was also popular as a ''second choice" by wholesalers many of whose ''first choice'' was f.o.b. shipping point. Small quanti- ties were bought under a wide variety of terms.
F.o.b. acceptance and shipping-point inspection final terms were used most often by firms purchas- ing through buying brokers or their own buyers at shipping point, since they could inspect the produce before or during loading to determine whether or not it was of the quality desired. De- livered sale terms were more often used by firms buying over the telephone, as they could not inspect the produce until it was received.
Procurement Practices More detailed information on procurement prac-
tices was furnished by a subsample of wholesale handlers representing 22 percent of the firms mak- ing some purchases directly from shipping point and 30 percent of the direct purchases. Over 70 percent of the firms reporting were primary han- dlers; 42 percent receivers, 16 percent receiver- jobbers, and 9 percent commission merchants. Nearly a quarter were secondary handlers, mostly prepackagers and repackers. Receivers accounted for 56 percent of the volume purchased directly from shipping point by wholesale handlers in this group, conunission merchants, 21 percent; re- ceiver-jobbers, 10 percent; and prepackagers and tomato repackers, 7/percent.
55

TABLE 54.—Terms oj ^purchase on direct purchases from shipping point by wholesalersj U,S, wholesale produce markets, 1958-59
Terms of purchase *
Terms used for largest volume
or purchases
Terms used for next largest volume of purchases
Firms Volume
pur- chased direct 2
Firms Volume
pur- chased direct ^
F.o.b, shipping point (suitable shipping condition)
Per- cent
59 10
1
1
1
1
2 21
1 1 1
Percent 71
6 2
1
1
1
1 14
(?) (?) (?) «
Per- cent
12 1 1
1
(?)
(?)
1
1 13
Percent 31
F.o.b. acceptance F.o.b. acceptance finaL. F.o.b. shipping point:
Shipping-point in- spection
2 1
2 Shipping-point in-
spection final Subject approval
wired Government inspection
F.o.b. inspection and acceptance arrival
F.o.b. sale at delivered price
(?)
(?)
1
(?) Delivered sale 20 Delivered sale—accept-
ance and inspectional final
Price arrival (?) 2 Cash track Other terms (?) (?)
Total 100 100 30 61
Firms not using a sec- ond set of terms. 70 39
Total 100 100 100 100
^ See appendix for definitions of terms of purchase. * Total volume purchased directly from shipping point
by wholesalers using these terms of sale for largest (or second largest) volume of purchases.
3 Less than 0.5 percent.
Most wholesalers have a group of shippers from whom they bay regularly. Eighty-one percent of tbera bought from regular shippers; 17 percent from any shipper; and 2 percent had some regular shippers but also shopped around. Over 60 per- cent of the wholesalers buying from regular shippers usually bought a given commodity from a given area from among one and three shippers.
Number of regular shippers Percentage per commodity per area of firms
1_ _ 27 2 18 si: 17 4 7 5 10 6 6 7 1 8 2 9 or more 12
Total 100
The average number of regular shippers was three for celery and carrots, four for citrus, onions, and lettuce, five for apples, grapes, potatoes, and tomatoes, and seven for watermelons.
Forty-five percent of the wholesalers made daily purchases of most commodities from regular shippers in a given area. Twenty percent typically bought weekly. Most of the others bought from 2 to 4 times per week. The tabulation that fol- lows shows the wholesalers frequency of purchase from regular shippers for each commodity from each area.
Percentage Frequency of purchase of firms Daily 45 Number of times per week:
3 to 4 5 3 5 2 to 3 1 2 17 1 to 2 20
Other__ 6
Total 100
Most direct purchases from shipping point were made by telephone—87 percent of all purchases. The remainder includes less than 1 percent made by telephone with wired confirmation, 3 percent by wire, and 10 percent by personal contact, principally by truckers.
For about half the sales, the shipper called the wholesaler. First contact by the shipper was more likely for those wholesalers who dealt with a group of regular shippers than wholesalers who bought from any shipper. Wholesalers with no regular sources of supply—made the first call two-thirds of the time.
Prices for about 50 percent of all direct pur- chases by wholesalers were determined without bargaining and about 40 percent with some bargaining.
Method of price determination Firms Volume
purchased direct
Shipper quotes a price; wholesaler either accepts or rejects it with- out barffaining
Percent 31
11
42
9
1 6
Percent 40
Price not discussed; shipper bills at the market price for the day
Shipper quotes a price; wholesaler makes counter-offer and bargain for the final Drice
5
39 Bargain over price some times or
with some shippers 9 Shipper quotes a price; wholesaler
either accepts or rejects it with- out bargaining; if market price later changes, shipper bills at the market price _ - - - - 1
Other methods 6
Total --- --- -- 100 100
56

Nearly 90 percent of direct purchases by whole- salers were completed in one telephone call.
The average length of time between receipt of a load of produce from shipping point and payment was a little over 6 days. Payments of 29 percent of the wholesalers making 41 percent of the direct purchases were made in 1 to 4 days; 46 percent of them with 37 percent of the direct purchases in 5 to 9 days; and 19 percent with 16 percent of the purchases in 10 to 14 days. Two percent each made payment in 15 to 19 days, 20 to 24 days, and 30 days. In general, the larger firms made pay- ment more promptly than the smaller ones. Wholesalers paying in less than 5 days had average direct purchases of 6,000 carlots per year, while those paying in 5 to 9 days and 10 to 14 days averaged about 3,500 carlots.
Buying Through Brokers Approximately one-fourth of all purchases of
wholesale handlers were made through brokers on one kind or another—12 percent from local brokers, 5 percent from brokers at shipping point, and the remainder from brokers in other terminal markets. Not all wholesalers bought through brokers, but two-thirds of those who did dealt with 4 or fewer brokers (table 55). Most wholesalers used brokers in only one kind of market—rela- tively few dealt with brokers in shipping-point markets, the local market, and in other terminal markets, or even in two of these kinds of markets.
In buying a single commodity from one area, three-quarters of the wholesalers usually dealt with a single broker, wherever he might be located. Another 10 percent regularly utilized the services of one or two brokers, depending on the com- modity being purchased.
TABLE 55.—Percentage oj wholesalers dealing with various numbers oj brokers, U.S, wholesale prod- uce markets, 1958
Number of
Percentage of wholesalers dealing with specified numbers of brokers located in—
brokers Shipping-
point markets
Local market
Other terminal markets
All markets
1 Percent
24 23 13 12
9 3 2 3
11
Percent 23 19 27
9 8 6 1 3 4
Percent 39 41
3 17
Percent 17 19 20 11
9 7
2 3 4 5 6 7 4
4 q
8 9 or more_
Total
Average number of brokers
100
4
100
3
100
2
100
4
711-059—64-
Numher of brokers usually con- tacted for a single commodity Percentage from one area of firms
1 76 1 to 2 10 1 to 3 2 1 to 5 1 1 to 6 1 1 to 9 1 2 to 3 4 2 to 4 1 2 to 5 2 2 to 9 1 6 1
Total 100
Grades and Quality Specifications Over 85 percent of the wholesalers bought at
least some commodities on the basis of U.S. grades, when buying directly from shipping point (table 56). Nearly two-thirds bought all com- modities on U.S. grades. Almost two-thirds of the wholesalers, buying everything on U.S. grades who specified the grade generally bought U.S. No. 1. About 20 percent of the firms bought only a part of their produce on the basis of U.S. grades. Among the 90 firms mentioning specific commodi- ties bought on grades, 34 firms purchased pota- toes, 21 tomatoes, and 12 peaches on Federal grades. A few firms bought all commodities on U.S. grades except a few specific ones. Com- modities which were not purchased on Federal grades included: local produce (6 firms), greens (6 firms), lettuce (2 firms), and tomatoes (1 firm).
Few wholesalers have their own specifications in addition to or in place of those found in the U.S. grades. Out of the 55 firms purchasing a higher quality than U.S. No. 1, 8 of them said they specified ''good quality" and 6 picked their ship- pers to ensure receiving the quality desired. Among other wholesalers, seven specified size limits more narrowly than in the U.S. grades, and five specified Fancy. None of the firms had color specifications. Sixteen firms specified "good quality," six selected shippers, and five the broker to obtain the desired quality. Eleven had no detailed specifications; one utilized inspection on arrival to ensure quality; and eleven followed other procedures.
To a considerable extent. Federal grades and inspection services are taken for granted in the produce business. They are seldom mentioned, except perhaps to complain about their deficiencies for certain purposes. This doesn't mean that they are not used. In fact, they provide a strong base upon which to conduct a very complicated and fast-moving business with a minimum of formality. Few other multimillion dollar busi- nesses are conducted almost entirely over the telephone.
Buying Methods From Local Growers Over half of the purchases of wholesale handlers
from local growers were straight cash purchases either at the farm or at the wholesaler's place of business (table 57). Another 28 percent were on
57
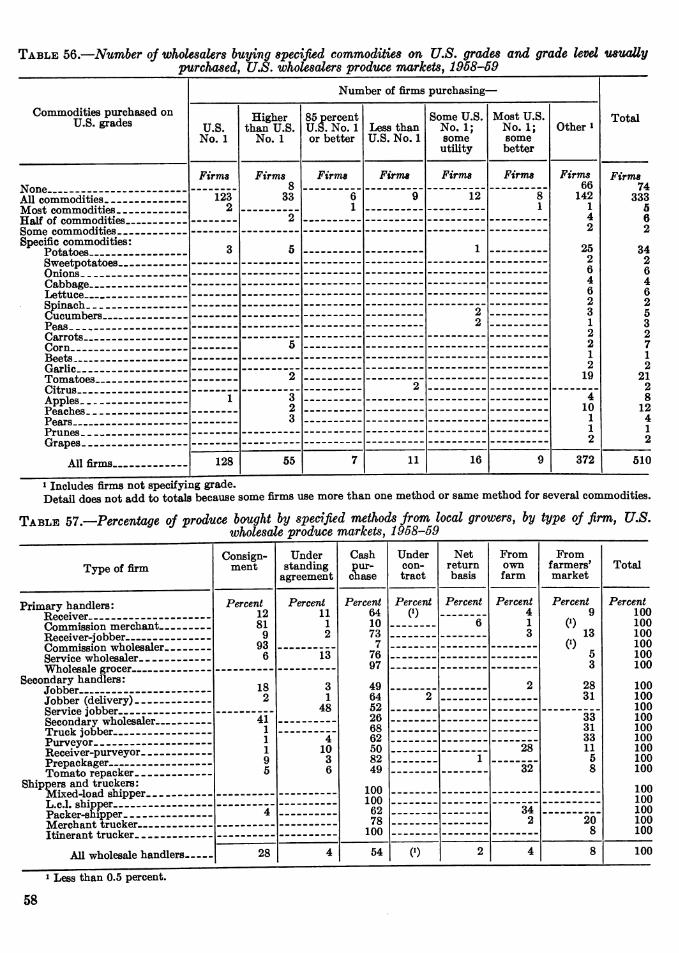
TABLE 5ß.—Number oj wholesalers buying specified commodities on U.S. grades and grade level usuauy purchased, U.S. wholesalers produce markets, 1958-69
Number of firms purchasing—
Commodities purchased on U.S. grades U.S.
No. 1
Higher than U.S.
No. 1
85 percent U.S. No. 1 or better
Less than U.S. No. 1
Some U.S. No. 1; some utiüty
Most U.S. No. 1; some better
Other » Total
Firms Firms 8
33
Firms Firms Firms Firms Firms 66
'1 4 2
25 2 6 4 6 2 3 1 2 2 1 2
19
Firms 74
All commodities ---------- 123 2
6 1
9 12 8 1
333 5
2 6 2
Specific commodities: 3 5 1 34
2 6
(^oKKofTp 4 6
i^rtînnpVi 2 2 2
5 L/Ucumoers 3 r'eas—, 2
C^f\yr\ 5 7 Rppfq 1 Oitrlip 2
2 21 ± uuia tues- - -------------- 2 2 1 3
2 3
4 10
1 1 2
8 12 jreacnes ____------------- 4 x ears.------------------- 1
Grapes 2
All firms 128 55 7 11 16 9 372 510
1 Includes firms not specifying grade. Detail does not add to totals because some firms use more than one method or same method for several commodities.
TABLE 57.—Percentage oj produce bought by spedfi£d methods from local growers, by type oj firm, U.S. wholesale produce markets, 1958-59
Type of firm Consign-
ment Under
standing agreement
Cash pur- chase
Under con- tract
Net return basis
From own farm
From farmers' market
Total
Primary handlers: "Rpceiver __ ------------
Percent 12 81
9 93
6
Percent 11
I Percent
64 10 73
7 76 97
49 64 52 26 68 62 50 82 49
100 100
62 78
100
Percent P)
Percent
6"
Percent 4 1 3
Percent 9
«.a
3
28 31
Percent 100
Cnmmisflion TTierohant----. 100 100
Commission wholesaler 100 13 100 öervice wiioicomer------------ 100
Secondary handlers: 18
2 3 1
48
2 100 2 100 JODoer ^uciivcrjry ------------- 100
41 1 1 1 9 5
33 31 33 11
5 8
100 100
4 10 3 6
100 28
32*
100 Prpnflckftfirer ---------- 1 100
100 Shippers and truckers: 100
100 JL.c.i. snipper-- — 4 34
2 100 iracKer-smpper —-— 20
8 100 iYierciia.111; truoJi.cr-- - ----------
Itinerant trucker 100
All wholesale handlers 28 4 54 0) 2 4 8 100
Less than 0.5 percent.
58

consignment, made mostly by commission mer- chants and conunission wholesalers. Four per- cent were bought under standing agreements, mostly oral contracts, with nearby farmers who marketed all or a large part of their produce
through one wholesaler. Less than 0.5 percent were handled under written contracts, mostly by jobbers (delivery). Eight percent came from local farmers' markets and 4 percent from the whole- saler's own farm.
The Structure of the Retail Market for Produce Most produce reaches the final consumer
through retail stores. A small but unknown âuantity is sold directly to consumers by farmers,
lating places and institutions take a modest 11 percent of the total in these markets. Peddlers still handled a small quantity—less than 1 percent. But retail stores probably handle about 80 to 85 percent of the produce reaching consumers in fresh form.
In the wholesale markets included in this study, all types of chains sold about 46 percent of the produce handled by retail stores (table 5S). Chains with 11 or more stores each accounted for a little over 42 percent and those with 2 to 10 stores each 4 percent. National chains made about 17 percent of the sales, regional chains 12 percent, and local chains with a produce warehouse 11 percent.
TABLE 58.—Percentage of retail store sales of fresh fruits and vegetables sold by each type of retailer, United States, 1958-59
Type of retail organization Wholesale markets in this study
United States
Chains with 11 or more stores: National chain
Percent 16.9 12.3 11.4 1.7
Percent 17 2
Regional chain 11 8 Local chain with warehouse Local chain without warehouse.
7. 1 2.0
Total.. 42.4 38 1
Chains with 2 to 10 stores: With warehouse .4
3.6 2
Without warehouse 8 4
Total... 4.0 46.4
8 6 All chains 46 7
Retailer cooperative with produce warehouse 2.4
.9 41.6 8.7
3 0 Voluntary group with produce
warehouse 1 8 Other grocery store 39 3 Specialty fruit and vegetable store.. 9.2
Total retailers 100.0 100 0
For the country as a whole, 8 chains each with total sales of $500 million or more in 1958 ac- counted for 63 percent of the produce purchases of all chains with 11 or more stores each (table 59). National chains accounted for over 70 percent of this volume. Sixteen chains with total sales of $100 million to $499 million each bought 17 per-
cent of the produce handled by all chains. Half of these chains were regional and half local with a produce warehouse. The regional chains han- dled nearly two-thirds of the volume. Local chains with a produce warehouse predominated in the $50 million to $99 million sales group, with 11 of the 16 chains and over 80 percent of the volume. This group handled 10 percent of the produce of all chains.
Member stores of retailer cooperatives and voluntary groups which handled produce made a little over 3 percent of the sales. Independent grocery stores, not afl51iated with a retailer co- operative or voluntary group which handled prod- uce, sold about 42 percent of the total and specialty fruit and vegetable stores nearly 9 percent.
These figures are for sales within the metro- politan area of each market. Sales by all stores serviced by these firms, including those within the metropohtan areas and outside them, as well as stores serviced from other cities and towns are shown in the second column of table 58. For the country as a whole, the share of chains with 11 or more stores is 38 percent of the total retail store market, compared with 42 percent in the markets in this study. The principal difference is that local chains with a produce warehouse are considerably less important outside these mar- kets. Small chains with 2 to 10 stores are substantially more important in other places. Retailer cooperatives and voluntary groups handling produce sold a somewhat larger share of the volume in the smaller cities and towns than in the markets studied, although it was still a httle less than 5 percent of the total. The shares of un- aflShated grocery stores and specialty fruit and vegetable stores were a Httle higher in smaller cities and towns.
AU but one of the chains with 1958 sales of less than %2b milhon were local chains. Eleven of the 30 with sales of $25 million to $49 million were identified as having a produce warehouse. It is Hkely that a few of the 18 Hsted in table 59 as not having a produce warehouse actually did have one, but this study did not provide this information for firms outside of the markets studied. The 115 chains with sales of less than $50 miUion each handled 10 percent of the produce of all chains in 1958.
The structure of the retail market varies con- siderably from one type of market to another. All retail organizations handled about half of the produce sold at retail in aU markets and in fom* out of seven types of markets (table 60). How-
59

TABLE 59.—Structure of the chain market for produce, United States, 1968-69
Type of chain and size of sales Chains Stores Total sales
Produce purchases
Value Quantity
Nfltional chaina sales of $500 million or more Number
3
5 8 5 1
Number 7,440
3,145 1,855
256 28
Million dollars
8,787
3,601 2,320 0) 0)
Million dollars
541
210 168
0) 0)
Thousand carlots
261 Regional chains, sales of—
if>500 million or more 104 $100 million to $499 million 65 $50 million to $99 million 0) $25 million to $49 million 0)
Total - 19
8 19
Ml 28 23
5,284
620 913 346 211 136
6,293
1,070 1,366
387 130
12
403
82 95 24 14 2
180
Local chains: With warehouse, sales of—
$100 million to $499 million 33 $50 million to $99 million 47 $25 million to $49 million 10 $10 million to $24 million 7 Tjesa than $10 million 1
Total 49 2,226 2,965 217 98
Without warehouses, sales of— ^ $25 million to $49 million 18
39 35
862 716 851
705 615 214
44 36 12
19 $10 million to $24 million 16 Less than $10 million 5
Total 92 2,429 1,534 92 39
All phfliriR with 11 or more stores 163 17, 379
2,312 4,960
19, 579
1,843 2,084
1,253 579 Chains with—
53 2 to 3 stores 60
24, 651 23, 506 692
> Withheld to avoid disclosure. 2 Includes only those chains in the sample.
^ Includes all local chains with sales of less than $50 million each which were not sampled.
TABLE (JO.—Market shares for produce of retail organizations, by type of firm and type of market, U.S. wholesale produce markets, 1968-69
Chains Retailer coopera-
tive, voluntary
group
All retail organiza-
tions
Total retail
Type of market
National Regional Local with
warehouse
Local without
warehouse All
produce sales in market
Primajv Percent
16
26 12 20
22 18 16
Percent 14
9 26
3
11 13
3
Percent 15
11 8
11
2 3 4
Percent 4
2 7
11
7 4 8
Percent 49
48 53 45
42 38 30
Pertent 2
2 4 7
7 4 4
Percent 51
50 57 52
49 42 34
Percent 100
Secondary: Local wholesale Out-of-town wholesale- Other _
100 100 100
Tertiary: Chain 100
Other --- 100
Small 100
All markets 17 12 12 5 46 3 49 100
60

ever, in secondary out-of-town wholesale markets sales of all retail organizations were 57 percent of the total; in other tertiary markets 42 percent; and in small markets only 34 percent.
The share of the largest single retail organiza- tion in the market averaged 18 percent of total retail store sales of produce in wholesale markets as a group (table 61). In tertiary chain and secondary out-of-town wholesale markets, the largest organization averaged about 25 percent of the sales in the market, in primary and small markets only 14 percent. The share of the four largest retad organizations averaged 40 percent for all markets and followed the same pattern as for the single largest firm.
TABLE 61.—Market shares jor produce of the largest retail organization and the 4 largest retail organi- zations y by type of marketj U.S. wholesale produce markets, 1958-59
Percentage of total retail sales of
produce in market
Type of market Largest retail
organi- zation
4 largest retail
organi- zations
Primary _ __ Percent
14
20 24 21
25 17 14
Percent 35
Secondary : Local wholesale 44 Out-of-town wholesale Other __ _ __ _
52 44
Tertiary : Chain 54 Other 43
Small _ _ _ _ 34
All markets 18 40
In individual markets, the share of all retail organizations—chains, voluntary, and cooperative groups—in total retail store sales of produce ranged from 19 to 84 percent (table 62). In 22 of 106 markets, retail organizations as a group sold from 55 to 59 percent of the total; in 16 markets, they sold 45 to 49 percent. In two-thirds of the markets, the share of all retail organizations was between 40 and 64 percent of the produce sales of all retail stores.
The share of the four largest retail organizations in each market ranged from 13 to 74 percent. In nearly 30 percent of the markets, the four largest firms had 50 to 59 percent of the sales. In over half the markets, it was between 45 and 64 percent and in another quarter of the markets between 30 and 39 percent.
The share of the single largest firm in each market ranged from 5 to 42 percent of total retail store produce sales, with a median of 19 percent. It was between 10 and 24 percent in nearly three- quarters of the markets.
TABLE 62.—Freguency distribution oj markets: Market shares jor produce oj the largest retail organization, the 4 largest retail organizations, and all retail organizations, U.S. markets, 1958-59
Percentage of total retail store sales of
produce in the market
5 to 9 percent 10 to 14 percent- 15 to 19 percent- 20 to 24 percent- 25 to 29 percent- 30 to 34 percent- 35 to 39 percent- 40 to 44 percent- 45 to 49 percent- 50 to 54 percent- 55 to 59 percent- 60 to 64 percent- 65 to 69 percent- 70 to 74 percent- 75 to 79 percent- 80 to 84 percent-
Total markets L_
Number of markets with specified market shares for—
Largest retail or- ganization
Markets 7
22 28 26
6 6 9 2
106
4 largest retail or-
ganizations
Markets
5 7
13 14
6 12 16 15 12
106
All retail organiza-
tions
Markets
4 4 4 7 5
11 16 11 22 11
4 1 2 4
106
1 Omitting very small markets for which data is not available.
When markets are ranked from the largest to the smallest on the basis of total retail sales— rather than on the basis of total market receipts, which is the basis of the size classification for the seven market types in table 61—and divided into four groups, the share of the largest single firm averaged 18.5 percent in the largest markets, 20 percent in the next larger group, 25 percent in the third group, and 18 percent in the small- market group. The figures for the four largest firms for these market-size groups were: 41 per- cent, 47 percent, b^ percent, and 40 percent, from largest to smallest.
The largest single firm in the market was more likely to be a national chain than any other type (table 63). Forty-three percent of the national chains ranked first in the market, compared with 24 percent of the regional chains, 5 percent of the local chains with warehouse, 2 percent of the local chains without warehouse, none of the retailer cooperatives, and 4 percent of the voluntary groups. From 21 to 28 percent of the national, regional, and local chains with warehouse ranked second in the market where located, while only 4 to 8 percent of the other three types of firms ranked second.
The number of retail organizations in a market is closely related to the size of the market. There were nine or more retail organizations operating in 70 percent of the large markets, 28 percent of
61

TABLE 63.—Percentage of markets in which each type of retail organization had specified rank in share of retail produce market, U.S. wholesale produce market, 1958-59
Rank in share of total retail sales
Type of firm 1 2 3 4 5 6 7 8 9 or
more
Total
National chain Percent
43 24
5 2
Percent 21 28
25 4 5 8
Percent 16 12
18 12 29 29
Percent 15 18
9
5 36
Percent 4 5
13 10 20 13
Percent Percent Percent Percent 1 4
15 34 16
6
Percent 100
Regional chain 3
9 13
2
3 12 10 2
4
3 7
13 2
100 Local chain:
With warehouse 100 Without warehouse 100
Retailer cooperative 100 Voluntary srouD __ _ _ 4 100
the second-largest group, and none in the two smaller groups (table 64). The average number of firms per market declined from about nine in the largest markets to between three and four in the smallest markets.
TABLE 64.—Percentage of markets with specified numbers of retail organizations y by size of market, U.S. wholesale produce markets, 1958-59
Markets with total retail produce sales of—
All Number of retail
organizations 10,000 or
more carlots
5,000 to
9,999 carlots
2,000 to
4,999 carlots
Less than 1,000
carlots
mar- kets
1
Per^ cent
Per- cent
Per- cent
Per- cent
4 9
35 27 12 4
9"
Per- cent
2 2 4 3 16 4 6
19 11 28
8 28
60 33 --
25 5 - 12
12 18
6 6 7 6 8 6
70 6
9 or more 17
Total 100 100 100 100 100
Functions Performed by Retail Organiza- tions
Retail organizations perform many of the same functions as wholesalers. Some functions are unnecessary because of the integrated nature of the organization. Others are not performed by choice of the individual firm.
Warehousing The fundamental decision as to the functions
performed by the produce department of a retail organization is made when it decides to start warehousing produce. Up to that point, most of
62
the functions are performed by other firms— carlot buying, unloading, warehousing, delivery to the retail stores, and many others. When the firm decides to set up its own produce warehouse, it assumes a much greater share of these functions. Most small firms do not find it economical to take on these functions—it is more profitable to have most of them performed by wholesalers specializ- ing in them and having a sufficient volume to carry them out more efficiently than the small retail organization.
All of the chains having total sales of $50 million or more in 1958 were warehousing their own produce, as were a good many of those with sales between $25 million and $49 million (table 59). Relatively few of the chains with sales of less than $25 million find it profitable to operate their own produce warehouses, although many can and do operate a dry grocery warehouse.
The chains without produce warehouses used a variety of methods of handling produce. The majority of them had all produce delivered directly to the retail stores from the market, sometimes in their own trucks but more often by the whole- salers. A few used the grocery warehouse, the back room of one of the stores, or some other point as a distribution point where produce from the market was received, sorted, and loaded out for delivery to the retail stores. A few bought a small number of interns direct from shipping point, un- loading directly from the rail car or highway truck into trucks which dehvered to the stores.
Some of the isolated stores belonging to national and regional chains received produce from whole- salers in the local market rather than from the distant warehouse of the chain which supplied them with dry groceries. For these stores, the chain usually made an arrangement with a local wholesaler to supply all of the produce for its stores in that area.
Over 70 percent of the retail organizations presently warehousing produce have been doing so for 10 years or longer (table 65). These firms handled 89 percent of the volume of all chains warehousing some produce (table 66). Thirty- eight percent of the local chains with warehouses

TABLE 65.—Percentage oj retail organizations warehousing produce for specified numbers oj years, by type offimij U.S. wholesale produce markets, 1958-69.
Type of firm lto4 years
5 to 9 years
10 to 19 years
20 to 29 years
30 to 39 years
40 to 49 years
50 to 59 years
60 or more years
Total
Chains: National chain
Percent Percent 8
16 21
Percent 10 20 28
Percent 49 37 19
Percent 25
8 13
Percent 4 2 2
Percent 4
Percent Percent 100
Reinonal chain 17 17
100 Local chain with warehouse 100
All chains 12 16 20 34 15 2 1 100
Retailer coooerative 13 19
23 29 38
29 33
6 100 Voluntary erouo 10 100
All retail organizations 13 15 23 33 12 2 1 1 100
TABLE 66.—Percentage of sales of retail organizations warehousing produce for specified numbers of years, by type of firm, U.S. wholesale produce markets, 1968-69
Tjrpe of firm 1 to 4 years
5 to 9 years
10 to 19 years
20 to 29 years
30 to 39 years
40 to 49 years
50 to 59 years
60 or more years
Total
Chains: National chain
Percent Percent 3 4
19
Percent 9
25 32
Percent 32 47 30
Percent 26 13 12
Percent 22
7 (0
Percent 8
Percent Percent 100
Regional chain 4 7
100 Local chain with warehouse- 100
All chains 3 8 21 37 17 11 3 100
Retailer cooperative. 19 16
18 26 29
34 41
3 100 Voluntary grouo 14 100
All retail organizations. 5 8 21 37 16 9 3 1 100
* Less than 0.5 percent.
TABLE 67.—Average produce sales of retail organizations warehousing produce for specified numbers of years, by type of firm, U.S. wholesale produce markets, 1968-69
Type of firm 1 to4 years
5 to 9 years
10 to 19 years
20 to 29 years
30 to 39 years
40 to 49 years
50 to 59 years
60 or more years
Firms not warehous- ing pro-
duce
National chain
100 cariota
100 carlois
12 7
14
100 carlois
25 34
18
100 carlois
19 36
24
100 carlois
31 44
14
100 carlots
157 92
3
100 cariota
62
100 cariota
100 cariota
5 Regional chain 7
6
1 Local chain:
With warehouse Without warehouse 3
Retailer cooperative 15 8
9 9 7
12 11
5 Voluntary group 14
All retail organizations. _ 8 11 19 23 26 102 62 14 3
started warehousing produce within the past 9 years, compared with 36 percent of the retailer cooperatives, 33 percent of the regional chains, 19 percent of the voluntary groups, and 8 percent of the national chains. In general, the larger firms of each type of retail organization have been
warehousing produce for longer periods (table 67)« Average produce sales of firms warehousing prod- uce less than 10 years were smaller than those of firms handling produce for longer periods for aU types of retail organizations except retailer co- operatives. Many retailer cooperatives adding a
63

produce line in recent years abeady had large sales of other food products and their produce volume soon grew relatively large.
The reasons for starting to warehouse produce given by firms which had taken that action during the past 10 years bear out the importance of volume in the decision.
Reason for starting to Percent Percent warehouse prodiLce of firms of volume
Volume became large enough to go into direct buying or warehouse prepackaging or both 6 11
Volume became large enough to justify central warehouse. 28 10
Started warehouse when start- ed handling produce 9 9
Started warehouse when start- ed business 4 6
Built new grocery warehouse and had room for produce. _ 27 47
Started warehousing produce to lower costs 9 6
Old setup became almost im- possible to manage or too expensive in terms of dis- tribution to stores 6 4
Went into warehousing for bet- ter control or more buying power 11 7
The methods by which these organizations obtained produce before they began warehousing it themselves are as foUows:
Percent Percent of firms of volume
Stores bought individually 19 24 Purchased from one whole-
saler who delivered to stores. 4 (^ Wholesalers delivered directly
to stores 53 56 Retail organization had central
buyer for firm and— Wholesalers own trucks
picked up in market and delivered to stores — 22 17
Used grocery warehouse platform as an assembly and distribution point-- 2 3
1 Less than 0.6 percent.
Most retail organizations had a central buyer who purchased all of the produce—chiefly on the local market—before they went into warehousing. For over half the firms, the wholesalers delivered directly to the individual stores. This is a high- cost method of store distribution, since several wholesalers usually cover the same distance de- livering different commodities to each store. Also, store personnel must spend more time in receiving and checking small quantities of produce from a number of wholesalers.
Some retail organizations had previously at- tempted to meet this problem by picking up all of the produce from the wholesalers' stores and delivering it to their own retail units in their own trucks. However, this requires the truck driver to sort out the produce going to each store from the lots assembled from several different wholesalers, a time-consuming task. One chain had attempted
to solve the problem by using the grocery ware- house as an assembly point, making up the prod- uce orders for each store there and then loading them into its own trucks for delivery.
Many chains went into the produce operation by buying out an independent produce wholesaler, often one which had been its principal supplier previously. Several of these are still operating as produce wholesalers, supplying the stores of the parent company and selling to the trade as well. These subsidiaries have been treated as separate wholesale operations in this study.
Only a minority of the retailer cooperatives and voluntary groups in the country handle produce. Twenty-nine percent of the 144 retailer coopera- tives surveyed by the Federal Trade Commission purchased produce in 1958. Retailer members owning 27 percent of the stores purchased produce from the retailer cooperative (5^, p. 167). Twenty- two percent of the voluntary groups purchased produce for 21 percent of the member stores {34j pp. 220, 223). There are several reasons for the reluctance of many affiliated groups to go into the produce business. Probably the most important is that many groups include a fairly high propor- tion of smaller stores. These firms are geared to supplying relatively small stores with dry gro- ceries, either by fairly infrequent deliveries or by a cash-and-carry operation. Produce must be pro- cured every day or two in order to remain fresh and appealing, requiring either much more fre- quent delivery schedules or a cash-and-carry operation selling small quantities at each sale. Some groups have met this problem by making produce available only to those members who handle a volume large enough to be delivered economically. One requires all new members to buy produce from the cooperative.
Another contributing factor is that in some markets—Los Angeles is probably the most notable example—the wholesalers have provided quality and service at a price with which the affiliated groups felt they could not compete. Thus, there has been little call from their members for a produce-buying service.
In other cases, the limitation is one of volume. The total produce requirements of the member- ship—even if they could be handled economi- cally—are not large enough to make an eflicient buying and warehousing operation possible.
Thus, the decision to start a produce warehouse is a major step for most retail organizations. Some made this decision many years ago. Some are making it today. In general, it is primarily a function of volume. When a firm becomes large enough so that it feels it can conduct a produce operation efíiciently, it sets up its own warehouse. If the service it is receiving from the wholesale market is especially satisfactory, the shift to its own produce operation may be delayed for a time, but & the firm continues to grow, the chances are very high that it will eventually start its own warehouse.
64

The organization of its purchasing operation is closely tied to the physical handling functions. A retail organization without a produce warehouse must rely on other firms to do most of the carlot buying. It can buy an occasional car of a staple product like potatoes or even apples and deliver them directly from the car to the retail stores, but it cannot go into extensive carlot buying without its own warehouse. The organization of the buying function is discussed pp. 67-68.
Physical Handling Functions Retail organizations did most of the unloading
of rail cars and trucks with their own employees rather than with stevedores (tables 68 and 69). Since most retail organization warehouses were located away from the wholesale market districts, often they were not governed by the same rules or contracts as wholesalers. By rule or custom in many markets, truckers—or crews hired by them—partly or completely unloaded over-the- road trucks.
Retail organizations receive only a small pro- portion of their shipments on team tracks or at the terminal. Most of them have their own rail- road sidings where produce is received. All retail organizations combined hauled a total of 5,500 carlots of produce from team tracks of terminal to the warehouse in 1958. The volume hauled from team track or terminal was negligible for national chains, 2 percent of direct receipts for regional chains, 4 percent for local chains with warehouse, 4 to 5 percent for retailer cooperatives and volun- tary groups, and about 66 percent of the small total received direct by local chains without warehouse.
TABLE 68.—Percentage oj retail organizations un- loading produce by various methods, U.S. whole- sale produce markets, 1958-59
TABLE 69. Percentage oj volume handled by retail organizations unloading by various methods, U.S. wholesale produce markets, 1958-59
Unloaded by—
Railroad cars unloaded at— Trucks
un-
Ter- minal
Team tracks
Store loaded at store
Firm's employees Stevedores, union crews,
swampers
Per- cent 100
Per- cent
91
3
Per- cent 100
Per- cent
62
4 Partly by firm's em-
ployees and partly by stevedores. _ _ _ 2
Cartage company em- ployees- _ 6
Truckerl- _ 10 Trucker to the tailgate
and firm's employees into store. 20
Other _ 2
Total 100 100 100 100
Unloaded by—
Railroad cars unloaded at— Trucks
un-
Ter- minal
Team tracks
Store loaded
at store
Firm's employees Stevedores, union crews,
swampers _ _
Per- cent
100
Per- cent
84
6
Per- cent
100
Per- cent
61
10 Partly by firm's em-
ployees and partly by stevedores 4
Cartage company em- ploy ees_ _ __ 10
Trucker _ 7 Trucker to the tailgate
and firm's employees into store 16
Other 2
Total 100 100 100 100
Prepackaging, Repacking, and Processing About 30 percent of the retail organizatione did
some prepackaging or repacking in the warehouse (table 70). Many chains did some prepackaging in the backroom of the retail store. However, one local chain without a warehouse which had a cen- tralized prepackaging operation in the backroom of one store which supplied all the stores in the chain is included here. The prepackaging opera- tions of all types except national chains were on a fairly small scale. The average volume pre- packaged by firms of each of the other types was less than 200 carlots per year, while the national chains averaged over 800 carlots.
Retail organizations prepackaged or repacked in their own warehouses about 5 percent of all the produce they sold. They bought another 15 per- cent of their total volume from specialized pre- packagers and tomato repackers. National chains and retailer cooperatives have gone into warehouse prepackaging more extensively than other types of retail organizations. The national chains pre- packaged 9 percent of their total volume in the warehouse, retailer cooperatives 6 percent, volim- tary groups and local chains with warehouse 3 percent each, and the others 1 to 2 percent. A subsample of 67 retail organizations reported that about 43 percent of their produce sales were made in prepackaged form. If this subsample is reason- ably representative of all retail organizations, they were apparently buying a little over 33 percent of their prepackaged produce from terminal market prepackagers and repackers, and prepackaging about 12 percent in their own warehouses, with a little over 50 percent prepackaged either at ship- ping point or in the retail store.
711-059—Ge- es

TABLE 70.—Volume and nvmber of items prepackaged or repacked by retail organizations, U.S. wholesale produce markets, 1958-69 *
Number of firms
Volume prepack- aged or
repacked
Firms prepackaging or repacking—
Type of firm litem 2 items 3 items 4 items 5 or more
items
National chain «30 10
24 1
Carlota 24, 873
1,750
3,023 163
Firma 4 3
8 1
Firma 4 4
8
Firma 1
4
Firma 6 2
3
Firms 14
Regional chain.« 1 Local chain:
With warehouse Without warehouse
All chains 65 29, 809 16 16 5 11 15
"Retailer cnnperAtîve „.^ »18 14
1,958 756
4 10
1 5 4
6 Voluntary group
AU retail orgariisfatíoní? 97 32, 523 30 16 6 20 21
1 Only produce prepackaged or repacked at the warehouse. Does not include prepackaging in the retail store. Excludes bananas.
' Includes firms prepackaging an unknown number of items.
Different chains utilize prepackaging of produce in various ways. A few prepackage every item in the produce department, at least to the extent of i)rice marking it as for watermelons and canta- oups. Several chains experimented with 100
percent prepackaging in a few test stores, found that it was not successful for them, and shifted to offering consumers a choice between prepackaged and bmk displays 'on many items. Other chains put their main emphasis on bulk displays, with prepackaging confined to a few items such as potatoes, onions, carrots, grapefruit, and perhaps some apples.
To some extent, the emphasis on prepackaging varies from one market to another. In Los Angeles, surrounded by fruit and vegetable grow- ing areas, prepackaging has not taken hold and no chain prepackages more than perhaps 20 percent of the items in the produce department. The average for a number of Los Angeles chains was 12 percent of all produce sold in prepackaged form. Other markets in the West also de-emphasize pre- packaging. On the other hand, some chains m northeastern markets—and at least one in Florida—^have gone to 100 percent prepackaging. The average in many eastern and midwestern markets is probably 60 percent. Chains which operate in more than one market have adapted themselves to local preferences, prepackaging heavily in one market and much less in another.
Over three-fourths of the volxmie prepackaged or repacked by retail organizations was put up by the national chains. TVo-thirds of the national chains and retailer cooperatives handled four or more items, while two-thirds of the local chains with warehouse put up one or two commodities.
Retau organizations were much less Hkely to repack tomatoes than to prepackage potatoes or onions (table 71). Over 85 percent of the retail
66
organizations reporting prepackaged potatoes, compared with 37 percent repacking tomatoes.
A number of the regional and local chains were anxious to get out of the warehouse prepackaging business entirely, largely because of the necessity for close supervision demanding more time than the produce manager could devote to it without slighting his other duties. Several argued that prepackaging should be done as close to the source as possible and still maintain quality.
A few chains have prepackaging done for them on a custom basis by terminal market prepack- agers. Generally, the chain buys the produce and has it shipped directly to the prepackager's plant. The prepackager then delivers the merchandise, either to the chain warehouse or to the individual retail stores. Often, the prepackager does the buying and sells it to the chain on a cost-plus basis. Thirteen chains in 5 markets had about 1,500 carlots of produce custom prepackaged in 1958. Potatoes, onions, citrus, and tomatoes were the commodities most frequently mentioned.
In addition to the produce bought by retail or- ganizations and custom prepackaged, some pre- packagers put up produce which they bought in the regular manner under the retail organization's label. One large regional chain had two pre- packagers putting up onions under its label and four repacking tomatoes.
A banana processing (ripening, cutting, and boxing) operation generally must be conducted on a fairly large scale in order to be efficient. Nearly aU of the retail organizations maintaining their own banana rooms were large. The national chaiQS processed most of their own bananas; re- gional chains something less than half of theirs; local chains with warehouses about a third; and retailer cooperatives and voluntary groups about three-fom'ths of their needs.

TABLE 71.—Number oj firms prepackaging or repacking specified commodities^ U.S. wholesale produce markets, 1958-69
Type of firm Potatoes Onions Tomatoes Celery Carrots Spinach, kale
Cole slaw, salad mix
Citrus Apples
National chain __ _ _ Firms
27 10
20 1
Firms 14
5
11
Firms 21
1
4
Firms 10
Firms 7
Firms 5 1
Firms 2 1
Firms 13 2
6
Firms 10 3
A
Regional chain Local chain:
With warehouse Without warehouse. _-
All chains 58 30 26 10 7 6 3 21 19
Retailer cooperative 16 10
12 4
10 8 4
11 Voluntary group 8
All retail organizations. 84 46 36 10 7 6 3 33 38
Store-Door Delivery Direct delivery to the store by suppliers of
chains which operate produce warehouses is in- creasing in importance. It accounts for only a small part of the total volume but the quantity is growing. Items which are often delivered directly to the stores are of three types: large-volume, bulky, and highly perishable items. Watermelons have all three characteristics. They are bulky, easily bruised, and move in large volume in season.
A number of chains have all or most locally grown f)roduce delivered directly to the store by the armer. This has worked especiallv well for sweet
corn and has also been used for apples, squash, and other items. There is also some growth in store- door delivery of trucks of mixed vegetables and some fruit from distant points, such as California and Florida. One large chain is buying truckloads of mixed fruits and vegetables in California and delivering them directly to its stores in the Midwest.
Buying Methods of Retail Organizations The buying methods of chains and affiliated
groups vary with the type of organization and the size of the firm. Most of the produce purchases of chains with 11 or more stores each were made by firms with a central buying organization doing some direct buying (table 72). All of the chains with sales of $500 million or more (total sales of all products) had such a buying organization and pur- chased directly from shipping point. This in- cludes the three national chains and five regional chains (table 59). A few of the stores of national chains in isolated markets were supplied by inde- pendent wholesalers who furnished all of the prod- uce for the chain's stores in that market.
Nearly all of the chains with sales of $100 million to $499 million—^regional chains and local chains with warehouse—^bought some produce direct. Regional and local chains with warehouse with sales of $25 million to $99 miUion were less likely to buy direct. The smaller regional chains relied on cooperating wholesalers to a considerable ex- tent, while the local chains with warehouse in this group obtained some supplies through local brokers or receivers which were delivered directly to the chain's warehouse. Nearly all the local chains with warehouse in the under $50 million size groups bought at least a part of their supplies directly from shipping point.
Few local chains without warehouse bought any produce direct, except a few of the largest. Firms
with 13 percent of the volume of the group obtained their supplies from retailer cooperatives and a few of those in the middle-size group had affiliated f)roduce wholesalers who suppUed them. Most ocal chains without warehouse obtained all of
their supplies from local wholesale handlers, however.
Purchasing arrangements of chains with 4 to 10 stores each are more varied than those of larger firms. Only 4 percent of these chains operating 5 percent of the stores bought any produce directly from shipping point (table 73). Most of these chains were in tertiary markets. Another 1 per- cent of the firms, all in primary markets, bought small quantities through local brokers. Thirty Eercent of the chains with 35 percent of the stores
ad their own buying staffs, but all of their pur- chases were made in the local market. A few chains in primary markets leased their produce departments as concessions to other firms.
Sixty-four percent of the chains with 4 to 10 stores operating 58 percent of the stores did not have a produce buyer. For most of these firms, purchasing arrangements are not known. Some, mostly in secondary markets, delegated the prod- uce buying to the managers or produce managers of the individual stores. Others bought all of their produce from one wholesaler or a retailer cooperative.
67

TABLE 72.—Purchasing arrangements of chains with 11 or more stores, by type and size of firm, U.S. whole- sale produce markets, 1958-59
(Percentage of purchases of each type of organization by firms using each purchasing arrangement)
Central buyer
and some direct pur-
chasing
Central buyer and local purchasing only
Indi- vidual store
buying
Supplied by coop- erating whole- saler
Supplied
aíRliated whole- saler
Type of firm and size of sales in 1958 No
direct receipts
Direct receipts through—
Total
Local broker
Local receiver
National chain, sales of $500 million or more
Percent 100
100 99 47
Percent Percent Percent Percent Percent 0)
Percent Percent 100
Regional chain: $500 million or more 100 $100 million to $499 million 1
19 0) 100
$25 million to $99 Tnillion 2 2 16 16 100
Average 97 1 0) (') 1 1 100
Local chain with warehouse: ÍP100 million to $499 million 85
70 61 95 97
18"
15 19 21
5 3
100 $50 million to $99 million 11 100 $25 million to $49 million 100 $10 million to $24 million 100 Less than $10 million 100
Averasre 76
16
2
67 69 89
17 5 100
Local chain without warehouse: $25 million to $49 million 3 17
3 10 3 11
_- 100 $10 million to $24 million 13 100 Under $10 million 100
Averasre 7 71 6 3 13 3 100
All chains 89 5 3 1 0) 1 '
100
1 Less than 0.5 percent. 2 7 percent from independent wholesaler; 9 percent from retailer cooperative. 3 Retailer cooperative.
Buying Organizations The three national chains ha\?e broadly similar
buying organizations. Each has field buyers who cover as many of the important producing areas as possible. They select the merchandise and negoti- ate the prices. The orders for merchandise originate with the divisions of the chains and, in some cases, are relayed through the national buying departments. The buying departments then in- struct the buyers what commodities and quantities to purchase. In other cases, the divisions order directly from the field buying ofPces.
For a special promotion, the flow of information is somewhat different. When large quantities of merchandise are to be pm'chased and moved, the national office may suggest the promotion and secure the cooperation of the various divisions or branches in following through.
The national chains have their own packing sheds in a few areas, prmcipally for large-volume commodities such as potatoes. One national
68
chain does substantially more of its own packing than the others; a second is generally moving out of the packing business on the ground that it is not profitable, and a third does little or none of its own packing.
AU of the large organizations have their own buyers in the terminal markets. Terminal market purchases provide fill-ins when, as often happens, planning is less than perfect and additional quanti- ties are needed to meet the requirements of the stores for the next few days. Specialty items which are not needed in carlot quantities also are purchased at terminal markets or at the fruit auctions, particularly at the beginning or end of the season for a particular commodity when prices are high, and the quantities needed are small. Replacement purchases are made in the terminal markets when merchandise bought direct from the shipping point turns out, on arrival, not to meet the quality specifications. Some terminal pur- chases are made simply because prices in the local market are temporarily low relative to those at the

TABLE 73.—Percentage oj chains with 4 to 10 stores and supermarkets oj such chains with specified pur- chasing arranoements, by type of market^ U.S. wholesale produce markets^ 1958-69
Central buyer, some direct buying
Central buyer, local buying only
No central buyer
Supplied by one wholesaler—
Produce depart- ments
as conces- sions
Type of market No
direct receipts
Direct receipts through— Indi-
vidual store buyer
Buying method
un- known
Inde- pendent
Cooper- ative
Total
Local broker
Local receiver
Chains
Primary _ _ Percent
2 Percent
39
32
25 35
13 10 28
Percent 2
Percent 1
Percent 2
21
13 6
12
Percent 31
47
54 44
50 25 65
Percent 6
Percent 13
Percent 4
Percent 100
Secondary: Local wholesale. 100 Out-of-town whole-
sale 8 100 Other _- 9 6 100
Tertiary: Chain _ 25
10 100
Other 55 7
100 Small 100
All markets 4 30 1 0) 6 43 10 5 1 100
Supermarkets of chains ^
Primary _ _ _ 2 48
45
30 40
5 8
20
4 1 1
13
18 4
7
24
42
47 39
46 18 55
4 13 3 100 Secondary:
Local wholesale _ _ 100 Out-of-town whole-
sale 5 100 Other.__ _ _ ___ 13 4 100
Tertiary: Chain 42
14 100
Other . _ 60 15
100 Small. _ 100
All markets 5 35 1 (0 4 36 14 4 1 100
1 Less than 0.5 percent.
shipping point. In addition to the field buying organizations, all of the national chains buy, on occasion, either through brokers or directly from shippers.
One large chain is decentralized to the point where the division has authority to buy its produce in any amount desired from any source, either at the shipping point or the terminal market, without reference to the national buying organization. The division produce buyers often consider the national buying organization as one alternative source to be considered in buying.
The procurement methods of the regional chains vary from those of the national chains only in degree. Their piu*chases are not as large as those of the national chains; consequently, they cannot afford to cover the growing areas as completely with their own ñeldmen. All regional organiza- tions have their own carlot buying operations. The carlot buyers at the chain headquarters keep in daily contact with the growing areas by tele- phone, buying direct from shippers and, on occa- sion, through brokers. They select the growers
2 One supermarket=3 small stores.
with whom they deal on the basis of experience and occasional trips to the major production areas to become better acquainted with the shippers and their operations.
In addition to the carlot buying operations, some regional chains have field buyers. They have fewer buying ofiices than the national chains located in the most important producing areas.
In general, the buying methods of local chains with warehouses, retailer cooperatives, and volun- tary groups are similar to those of the regional chains. As they are somewhat smaller, they find it necessary to buy larger proportions of their merchandise on the local markets, and their dis- tant purchases are more often made through bro- kers. Few of them have field buyers.
Sources of Produce National chains were the most numerous type
of retail organizations in wholesale markets in 1958 and handled the largest volume (fig. 5). There were more regional chains than local chains
69

with warehouses; regional chains handled a some- what larger volume. The other three types were less important both in terms of numbers and vol- mne handled.
Retail organizations as a group obtained 50 percent of their supplies of produce directly from shipping point, 6 percent from local gi'owers, 7 percent from wholesalers in other markets, 13 per- cent through local brokers and agencies, and 24 percent from local wholesale handlers and auctions. National chains obtained 70 percent directly from shipping point, regional chains 52 percent, local chains with warehouse 28 percent, local chains without warehouse 1 percent, retailer cooperatives 21 percent, and voluntary groups 30 percent (fig. 6). Purchases from local farmers ranged from 6 to 8 percent for national and regional chains, retailer cooperatives, and voluntary groups. They were 4 percent for local chains with warehouse and 1 percent for local chains without warehouse, rurchases from other out-of-town sources were 8 percent or less for chains of various types, but 13 percent for retailer cooperatives and 26 percent for voluntary groups.
Retailer cooperatives relied most heavily upon local brokers and sales agencies, obtaining 39 percent of their supplies from them. Brokers and agencies were also important to volimtary groups and local chains with warehouse. Other types of chains obtained from 8 to 11 percent of their prod- uce through local brokers and sales agencies. Local chains relied heavily on local wholesale handlers (including auctions), those without ware- houses receiving 86 percent of their supplies from them and those with warehouses 47 percent. Regional chains and retaüer cooperatives pur- chased 21 to 23 percent from local wholesale handlers and national chains and volimtary groups 9 to 13 percent.
About 75 percent of the produce bought by retail organizations from local wholesale handlers and auctions came from primary handlers, 20 percent from secondary handlers, 4 percent from auctions, and 2 percent from shippers, truckers, and importers (table 74). Chains of all types with warehouses bought nearly 50 percent of their local supplies from receivers, 20 percent from commission merchants, 15 percent from prepackagers and tomato repackers, and 5 percent from auctions. Local chains without warehouses relied more on receiver-jobbers and service wholesalers. The smaller volume of purchases from prepackagers, tomato repackers, and auctions by local chains without warehouses is partly attributed to the higher proportion of these chains located in Los Angeles, a market without an auction and where prepackaged produce was not as popular as else- where in the country.
Voluntary and cooperative groups relied more upon the fruit auctions for supplies than did the chains. For most other sources, except com- mission merchants, their procurement patterns
TABLE 74.—Percentage of purchases of retail or- ganizations from local wholesale handlers and auction^y by type of fimiy U,S. wholesale produce markets, 1958-59
Type of supplier II
Loc
al c
hain
s w
itho
ut
war
ehou
se
Vol
unta
ry,
co-
oper
ativ
e gr
oups
02
el
Primary handlers: Receiver
Pet 49 20
3
Pet, 31 11 22
(0 13
(0
Pet, 38
9 16
'■'s
Pet, 44
Commission merchant Receiver-jobber.
17 9
Commission wholesaler. _ _ Service wholesaler Wholesale grocer
4 (0
Total - 73 77 66 74
Secondary handlers: Jobber • 1
3 1
0)
2 8
(0 1
(0 (0
8
2 4
(0 (0
0) 10
2 Jobber (delivery) » Service jobber
4 (0
Secondary wholesaler Truck jobber 8 Purveyor, receiver-pur-
veyor (0 15
(0 Prepackager, tomato re-
packer __ 13
Total 20 20 17 20
Shippers and truckers Importer, commission im-
porter
1
1 5
1
1 1
3 1
1 Auction 4
Total 100 100 100 100
^ Less than 0.5 percent. * Includes banana jobbers.
are about midway between those of chains with warehouses and those without.
Buying Methods From Local Farmers
Most purchases from local farmers by retail organizations were cash (table 75). Most of these were telephone orders for delivery a day or two later. Nearly all of the purchases by national chains and retailer cooperatives were made in this fashion, 87 percent of those of voluntary groups, about 66 percent of those of regional and local chains with warehouses, and about 25 percent of those of local chains without warehouses.
Regional and local chains obtained about one- fourth of their locally grown produce under stand- ing agreements with nearby producers. Typical- ly, these agreements were verbal contracts that the chain would take all of the produce of the grower which met specifications. A few specified quantities or maximum quantities to be delivered.
70

CHAINS AND AFFILIATED GROUPS Warehouses and Produce Volume, 1958
NUMBER
150
100
THOUS. CARLOTS
300
Nat*l. chain R«g. chain * ¡
Local with whs«. ¡ \ Chain, no whs«. i
RotaiUr co-op Vol. group
U. S. DCPARTMENT OF AGRICULTURE
200-
100-
Nat'l. chain • Reg. chain Local with whs«. ¡ j \
Chain, no whs«. ¡ S R«tail«r co-op ¡
Vol. group
NEC. ERS 1129-63 (S) ECONOMIC RESEARCH SERVICE
:
Fisure 5.
CHAINS AND AFFILIATED GROUPS Sources of Proc/uce, 1958
National Regional Local Chains R«taiUr Voluntary chains chains with without coop«rativ«. group
wore— wore — houses houses
U. S. DEPARTMENT OF AGRICULTURE NEC. ERS 1128-62(5) ECONOMIC RESEARCH SERVICE
Figure 6.
71
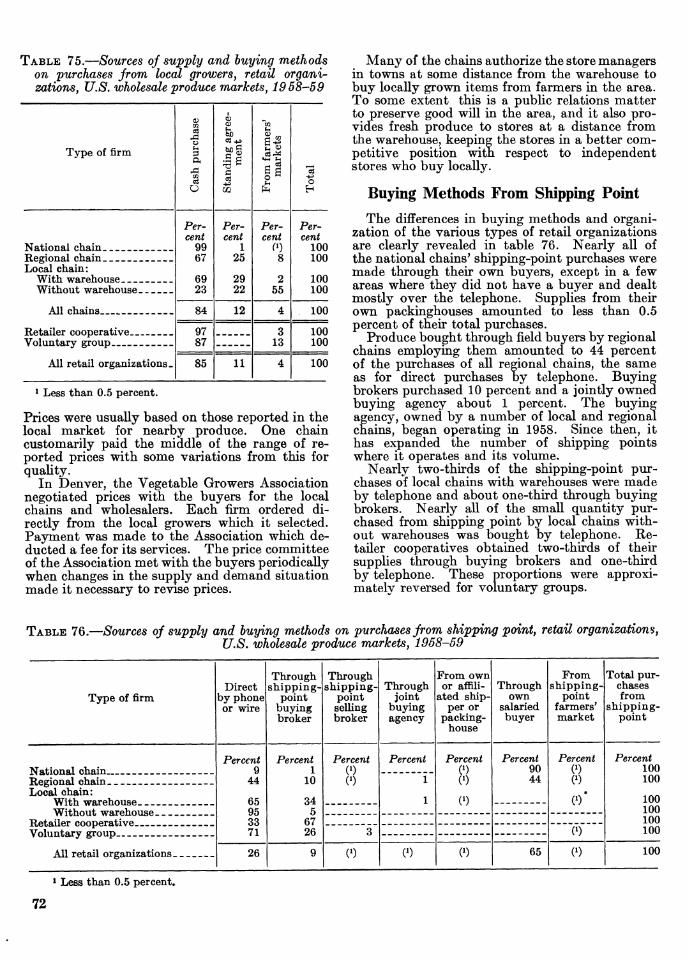
TABLE 75.—Sources of supply and buying methods on purchases from local growers, retail organi- zations, U.S. wholesale produce markets, 1958-59
o 1
"CQ C3
Type of firm ft So 5 o
O 02 ^ H
Per- Per- Per- Per- cent cent cent cent
National chain 99 67
1 25
0) 8
100 Regional chain 100 Local chain:
With warehouse 69 23
29 22
2 55
100 Without warehouse 100
All chains 84 12 4 100
Retailer cooperative 97 3 100 Voluntary eroup 87 13 100
All retail organizations. 85 11 4 100
1 Less than 0.5 percent.
Prices were usually based on those reported in the local market for nearby produce. One chain customarily paid the middle of the range of re- ported prices with some variations from this for quaUty.
In Denver, the Vegetable Growers Association negotiated prices with the buyers for the local chains and wholesalers. Each firm ordered di- rectly from the local growers which it selected. Payment was made to the Association which de- ducted a fee for its services. The price committee of the Association met with the buyers periodically when changes in the supply and demand situation made it necessary to revise prices.
Many of the chains authorize the store managers in towns at some distance from the warehouse to buy locally grown items from farmers in the area. To some extent this is a public relations matter to preserve good will in the area, and it also pro- vides fresh produce to stores at a distance from the warehouse, keeping the stores in a better com- petitive position with respect to independent stores who buy locally.
Buying Methods From Shipping Pomt The differences in buying methods and organi-
zation of the various types of retail organizations are clearly revealed in table 76. Nearly all of the national chains' shipping-point purchases were made through their own buyers, except in a few areas where they did not have a buyer and dealt mostly over the telephone. Supplies from their own packinghouses amounted to less than 0.5 percent of their total purchases.
Produce bought through field buyers by regional chains employing them amounted to 44 percent of the purchases of all regional chains, the same as for direct purchases by telephone. Buying brokers purchased 10 percent and a jointly owned buying agency about 1 percent. The buying agency, owned by a number of local and regional chains, began operating in 1958. Since then, it has expanded the number of shipping points where it operates and its volume.
Nearly two-thirds of the shipping-point pur- chases of local chains with warehouses were made by telephone and about one-third through buying brokers. Nearly all of the small quantity pur- chased from shipping point by local chains with- out warehouses was bought by telephone. Re- tailer cooperatives obtained two-thirds of their supplies through buying brokers and one-third by telephone. These proportions were approxi- mately reversed for voluntary groups.
TABLE 76.—Sources of supply and buying methods on purchases from shipping point, retail organizations, U.S. wholesale produce markets, 1958-59
Type of firm Direct
by phone or wire
Through shipping-
point buying broker
Through shipping-
point selling broker
Through joint
buying agency
From own or affili-
ated ship- per or
packing- house
Through own
salaried buyer
From shipping-
point farmers' market
Total pur- chases from
shipping- point
national chain Percent
9 44
65 95 33 71
Percent 1
10
34 5
67 26
Percent
8 Percent Percent
0)
(0
Percent 90 44
Percent 0) 0)
Percent 100
Regional chain. 1
1
100 Local chain:
With warehouse 100 Without warehouse 100
"Rptailer cooDerative 100 Vohintarv STTOUD 3 (0 100
All retail organizations 26 9 0) 0) 0) 65 0) 100
> Leas than 0.5 percent.
72

TABLE 77.—Sovrces of supply and buying methods on purchases from shipping pointy selected types retail organizations, by company size, U.S. wholesale produce markets, 1958-59
Type of firm and cgmpany size, by quantity of produce handled
Direct
^^ phone or
wire
Through shipping
point buying broker
Through shipping
point selling broker
Through joint
buying agency
From own or affili- ated
shipper or
packing- house
Through own
salaried buyer
From shipping
point farmers' market
Total pur-
chases from
shipping point
Direct pur-
chases as percent- age of total
volume
Regional chain: 15,000 to 30,000 carlots
Percent 43 77 51
71 47 57 66
16 92 99
78 63 39
Pereent 9
13 48
28 53 40 34
84 8
22 28 61
Pereent Percent Percent (0
Percent 47
7
Percent 1
Percent 100 100 100
100 100 100 100
100 100 100
100 100 100
Percent 50 59 3*?
10,000 to 14,999 carlots 1,000 to 9,999 carlots
__ 3
Local chain with warehouse: 1,500 to 7,000 carlots 1 32 1,000 to 1,499 carlots 0) 55 500 to 999 carlots 3 34
23 Less than 500 carlots Retailer cooperative:
1,500 to 4,000 carlots ^1 1,000 to 1,499 carlots 13 Less than 1,000 carlots 1 4
Voluntary group: 1,000 to 1,499 carlots (0 'ÍQ 500 to 999 carlots _ _ _ 9 30 Less than 500 carlots
1 Less than 0.5 percent.
The economies of scale in operating a field buying organization are clearly indicated when the buying methods of chains are related to the total volume of the chain organization rather than to the volume of the individual warehouse (table 77). National chains, all of them larger than the biggest regional chain, bought about 90 percent through their own buyers. The largest regional chains, with total volumes between 15,000 and 30,000 carlots, bought 47 percent through their own buyers; regional chains with total volumes of 10,000 to 15,000 carlots bought only 7 percent in this manner.
The division of purchases between those made by telephone and those made by buying brokers shows very little discernible pattern. The de- cision is obviously made on other grounds than the volume to be bought. The contrast between retailer cooperatives and voluntary groups is par- ticularly interesting. The largest retailer cooper- atives obtained 84 percent of their supplies through buying brokers and the smallest none. In contrast, the largest voluntary groups bought 22 percent through buying brokers and the small- est 61 percent.
Terms of Purchase The terms of purchase define the responsibihty
of buyer and seller for payment of transportation and associated charges and for loss of quality and price decline in transit. Most purchases by retail organizations were made either f.o.b. shipping point, where the responsibility of the shipper ends with placing the merchandise in the freight car or truck in ''suitable shipping condition," ^^ ^^ "
delivered basis, where the shipper's responsibility for quaUty and payment of transportation charges extends to the point of delivery to the buyer (table 78). Retail organizations bought sub- stantially more on a delivered basis than did whole- salers. A few firms reported buying on a price
TABLE 78.—Terms of purchase on direct purchases from shipping point by retail organizations, U.S. wholesale produce markets, 1958-59
Terms of purchase *
Method used for most
purchases
Method used for next largest
volume of purchases
Firms Volume
pur- chased direct
Firms Volume
pur- chased direct
F.o.b. shipping point. _ . F.o.b. acceptance F.o.b. acceptance and
inspection arrival
Pet. 59
4
4 33
Pet. 58
8
4 30
Pet. 13
1
Pet. 11
1
Delivered sale 28 1
23 Price arrival 2
Total 100 100 42
58
37
63 Firms not using a sec-
ond set of terms
Total 100 100 100 100
or on a i See appendix for definitions of terms of purchase.
73

arrival basis, where the price was not determined until the merchandise arrived in the market. There are some indications that this type of purchase may be increasing.
Buying Practices A subsample of about one-fourth of the retail
organizations supplied additional information on buying practices on direct piu'chases from shipping point. This information deals entirely with pur- chases made by produce buyers of retail organiza- tions in the warehouse divisions or chain headquarters, either over the telephone directly to the shipper or through brokers. It does not apply to purchases made by the field buying organizations of national and regional chains.
On direct purchases by telephone or wire, most retail organizations had a group of regular shippers from whom they usually bought. Seventy-eight percent of the retail organizations regularly bought from the same shippers; 6 percent shopped around within a group of regular shippers; 3 percent had some regular shippers but also shopped around to some extent; and 13 percent bought from any shipper. Firms buying from a group of regular shippers typically dealt with from one to three shippers for each commodity in a given area. For a number of major commodities purchased direct by each firm, 26 percent bought from one regular shipper for each commodity from a certain area, 22 percent from two shippers, 26 percent from three shippers, 17 percent from four to seven shippers, and 9 percent from nine or more regular shippers. Thus, almost three-fourths relied on fewer than four regular shippers to supply their needs for a commodity such as California lettuce, Northwestern apples, or Maine potatoes during the season. The average number of regular shippers in each area varied from five for citrus fruit and apples to three for table grapes and two for potatoes, lettuce, and carrots.
Retail organizations made daily purchases of 30 percent of these commodities and weekly pur- chases of 25 percent; 31 percent were bought twice a week. The remainder were bought on other schedules, including 2 percent where the order was placed once a week for several dehveries during the coming week.
Nearly all of the business, 92 percent, was done by telephone. Only about 5 percent of the purchases were made by telegraph or teletype, and about 3 percent were made by personal contact with the packer at shipping point.
While there is no such thing as a standardized procedure applying to aU transactions, we can describe a typical purchase by telephone from a packer or shipper. Somewhat more often than not—56 percent of the time—the shipper caUed the buyer to try to make a sale. They discussed supplies, the state of the market, the weather at shipping point, sometimes quality, and perhaps price About two-thirds of the buyers did not bargain over price. Half merely accepted or
74
rejected the price quoted by the shipper; 15 Eercent did not even mention price, the shipper
illing at the market price for the day. About 25 percent of the buyers regularly bargained over price; another 10 percent of them bargained sometimes. Nearly two-thirds of the purchases were completed on the first telephone call, and most of the remainder on the second.
Method of price determination Firms Volume
purchased direct
Shipper quotes a price; retailer either accepts or rejects it with- out barsaininsT
Percent 45
14
25
2 8
2 4
Percent 51
Price not discussed; shipper bills at the market price for the day
Shipper quotes a price; retailer makes a counter offer and bar- crains for the final Drice
15
19 Bargains over price only on produce
for specials 4 Bargains over price sometimes Retailer asks for shipper's best
quality produce and then bar- gains.for the Drice
6
4 Other methods 1
Total - 100 100
Retail organizations were a little more prompt in paying for produce purchased directly from shipping point than were wholesalers. The aver- age length of time between acceptance of a load of produce and payment was a little over 5 days for retail organizations, compared to sUghtly over 6 days for wholesalers. None of the retail organiza- tions took more than 14 days to make payment, while 6 percent of the wholesalers took between 15 and 30 days. Twenty-seven percent of the retail organizations making 18 percent of the direct purchases paid in less than 5 days; 66 percent with 80 percent of the direct purchases paid in from 5 to 9 days; and 7 percent with 2 percent of the volume in 10 to 14 days.
These figures include only retail organizations making payment after acceptance at the ware- house. At least one national chain wi^J^ * fi^^d buying organization paid for a part of its produce after acceptance by the field buyer. Usually this meant that the grower or shipper received his money before the produce arrived at the warehouse.
Buying Through Brokers Many retail organizations regularly bought a
number of commodities through orokers, either at shipping point, in the local market, or in other markets. Others called upon local brokers chieflj for items which they could not obtain from their regular shippers. Some of them preferred to deal with brokers because they felt they could not save any money by buying direct and they could pass such problems as negotiating with shippers

For any one commodity from a given area, half of the retail organizations usually dealt with a single broker. Another 12 percent usually con- tacted two brokers for a given commodity and 3 percent one or two brokers. The remainder contacted varying numbers of brokers, depending upon the commodity, the state of the market, and other factors.
and obtaining adjustments, to the brokers. Other buyers felt that they could buy cheaper by doing their own purchasing.
Half the retail organizations using brokers dealt with from one to three brokers at shipping point, in the local market, and in other terminiS markets (table 79). Only a few utilized the services of a single broker either at shipping point or in the local market. Half dealt with only one broker in other terminal markets, often for specialty items which were not generally available in some of the smaller markets. For many of them, this was a buying broker at the auction in New York or Chicago or a buying broker in Los Angeles. On the average, retail organizations dealing with brokers utiUzed the services of six brokers at shipping point, three in the local mar- ket, and three in other terminal markets.
TABLE 79.—Percentage oj retail organizations dealing with various numbers of brokers, U.S. wholesale produce markets, 1958-59
Grades and Quality Specifications
Ninety percent of the retail organizations bought at least some commodities on U.S. grades (table 80). Over two-thirds bought all or most on the basis of Federal grades. Ten percent did not make use of U.S. grades in any of their buying. About a fifth of the firms bought some commodi- ties on grades. Specific products mentioned where grades were used were potatoes, tomatoes, corn, peaches, and pears.
About half of the firms generally bought produce of higher quality than U.S. No. 1 or its equivalent. Only 12 percent regularly bought U.S. No. 1. Many retail organizations did not have detailed specifications; they wanted ''good quality" or "the best available." A fair amount oi effort may be expended in attempting to communicate to ship-
-Percentage of retail organizations buying produce on U.S. grades and grade level usually pur- chased, U.S. wholesale produce markets, 1958-59
Number of brokers
Percentage of retail organizations dealing with specified numbers of brokers located at—
Ship- ping point
Local market
Other terminal markets
All mar- kets
1 Percent
10 23 18 5 5
Percent 14 29 30
6 6
13
Percent 50
5Ö'
Percent 5
2 29 3 _ 24 4.__ 7 5 7 6 _. 7 7 3 8 5 9 or more 39 2 13
Total 100 100 100 100
Number of brokers usually contacted Percentage
of retail organizations
1 __ 50 1 to 2 3 1 to 3 _ 5 1 to 4 6 1 to 6 _ _. 3 2 12 2 to 5 __ 6 2 to 6 9 2 to 9 or moré _ 6
Total__ __ _ 100
TABLE 80.-
Percentage of firms purchasing—
Commodities purchased on U.S. grades U.S.
No. 1
Higher than U.S.
No. 1
Less than U.S.
No. 1
Most U.S. No. 1; some better
Other 1 Total
None Percent Percent
4 31
3 10
Percent Percent Percent 6
20 1 6 1 1
Percent 10 All commodities 10 1 62 Most commodities 4
Some commodities 5 20 Nearby produce * 1 All except nearby produce 2
Total replying 12 48 5 1 34 100
* Own specifications or grade not specified.
75

pers what they considered to be "good quality." Some firms laid down specifications for some commodities which are more stringent than the U.S. No. 1 grade. A quarter of those with specifi- cations set up more stringent standards for size, especially of potatoes and apples; and 12 percent each for color and the amount of defects permitted. A few mentioned condition, which is not a factor in U.S. grades, or specified 'Veil within grade," which effectively narrows the tolerances on all factors considered in the grade.
Most retail organizations utilized Federal in- spection on receipt for part of their produce. In general, it was used only on merchandise of doubt- ful quality. A few firms had a general policy of obtaining Federal inspection on all or nearly all of the produce about which they had questions as to its quality. Most asked for inspection on only a part of the questionable carlots or trucklots. Ten percent of the firms did not use Federal inspection at all. Some of these were located in markets where there was no Federal inspector and it was fairly expensive to request that one come in from the nearest point where an inspector was located. The firms which used Federal inspection did so on 1 percent of their total receipts.
Direct Buying and the Terminal Market The decision as to sources and buying methods
is not a simple one for the retail organization. It varies from one firm to another, depending on many factors, and within the firm from one com- modity to another. Some commodities are bought in the local market by almost all firms. Specialty items needed in smaU quantities are usually bought locally. The needs of even a large chain for such a commodity are too small to make it worthwhile to buy it directly from shipping point, since it cannot be purchased in carload lots. Nearly every organization finds it necessary to purchase fill-ins of large-volume items on the local market. No one can predict consumer purchases perfectly a week or two in advance and the needs for small additional quantities are met by purchases from local wholesalers.
Many retail organizations buy substantial quan- tities of prepackaged commodities from local pre- packagers and repackers. Many of these items are too perishable to be successfully prepackaged at shipping point. A primary motivation for many firms is to shift the labor and supervision problem to specialists. A final group of com- modities bought on the local market quite regu- larly might be termed *'problem commodities." These are items which have rather unusual quality problems, making direct purchase hazardous. Many firms prefer to buy such items only after personal inspection by their own buyers as close to the retail level as possible, in order to obtain the particular quality characteristics desired. Watermelons are probably the most important item in this category. Damage in transit has been
so extensive with watermelons that many buyers refuse to buy until they have inspected the fruit personally.
The most important factor in determining whether a specific commodity will be bought directly from shipping point by a particular retail organization is the relative size of the unit of purchase of the commodity and the daily, semi-weekly, or weekly needs of the firm. The most obvious candidates for direct purchase are s tor able items such as potatoes which are sold in large quantities. Even a relatively small chain can buy a carlot of potatoes and sell them over a period of several weeks. One small chain without a warehouse used the railroad car as a storage and distribution point.
The unit of purchase for many firms is the carlot or trucklot. This is the simplest unit to buy and probably about the lowest-cost to sell. However, in many areas mixed loads of several fruits or vegetables or both can be obtained, sometimes from one seller or from several shippers. Split loads are another possibility, with partial loads going to a number of buyers in the same market or in different markets.
These considerations set a lower limit on direct purchasing. At the other end, the size of the lot needed by a particular firm must be compared with the size of lot available in the local wholesale market. The retail organization needs reasonably uniform quality of each commodity. If its needs for a given commodity are large relative to the supplies normally avaüable in the market, it wiU find it difficult, if not impossible, to assemble a large lot of uniform quality. Frequently, even where it is possible to do so, the cost of inspecting many smaU lots, selecting those of similar quality, and purchasing them would be substantially higher than that of buying in carload lots at shipping point.
The size of lot available in a given wholesale market is largely determined by the size of the market. A large chain located in a small market finds it impossible to buy more than a few special- ties and occasional small lots of fill-ins. In the largest markets, the chain can buy a larger part of its needs on a regular basis.
When the effects of several of these variables on the proportion received direct were tested by means of regression analysis, the variable having the greatest effect was size of market (table 81). For all types of retail organizations, the larger the wholesale market the smaller were direct receipts from shipping point. The effect was somewhat less for national and regional chains than for local chains and affiliated groups, primarily because their buying organizations and practices were established in terms of the total needs of the company, rather than the needs of the individual warehouse units. The buying organization was in existence, and there was some tendency to use it for direct purchases even when the local market might be able to supply the commodity in question.
76
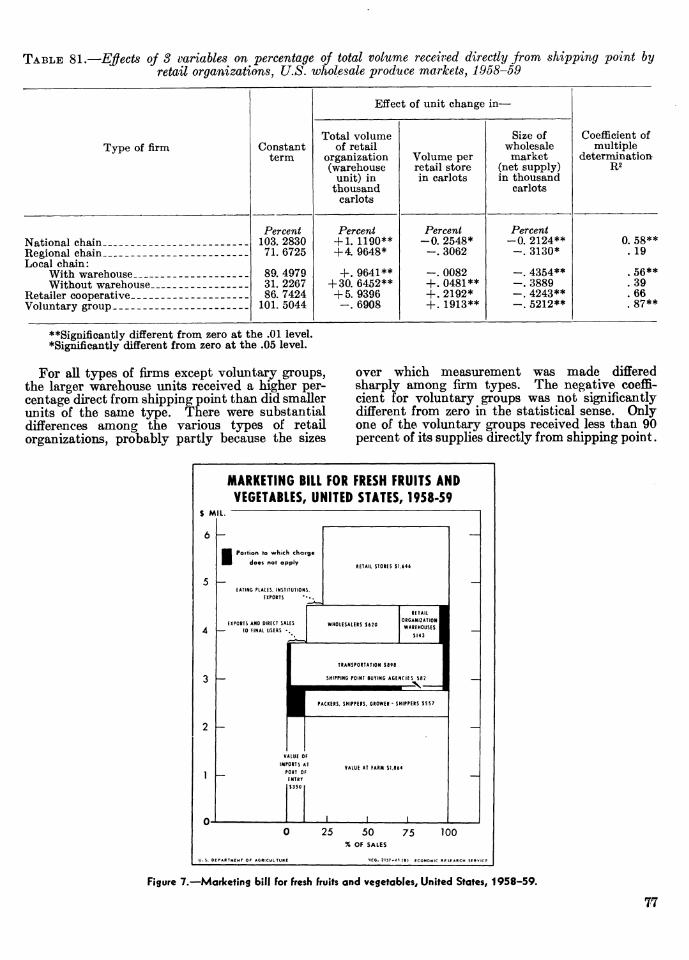
TABLE 81.—Effects of 3 variables on percentage of total volume received directly from shipping point by retail organizationsj U.S. wholesale produce marketsj 1958-59
Constant term
Effect of unit change in—
Type of firm Total volume
of retail organization (warehouse
unit) in thousand
carlots
Volume per retail store in carlots
Size of wholesale market
(net supply) in thousand
carlots
Coefläcient of multiple
determination R2
National chain _ __ Percent
103. 2830 71. 6725
89. 4979 31. 2267 86. 7424
101. 5044
Percent + 1. 1190** + 4. 9648*
+. 9641** + 30.6452** + 5.9396 -. 6908
Percent -0. 2548* -. 3062
-. 0082 +. 0481** + . 2192* +.1913**
Percent -0. 2124** -.3130*
-. 4354** -.3889 -.4243** -.5212**
0. 58** Regional chain __ - . 19 Local chain:
With warehouse .56** Without warehouse _ .39
Retailer cooperative. .66 Voluntary group - .87**
**Significantly different from zero at the .01 level. *Significantly different from zero at the .05 level.
For all types of firms except voluntary groups, the larger warehouse units received a higher per- centage direct from shipping point than did smaller units of the same type. There were substantial differences among the various types of retail organizations, probably partly because the sizes
over which measurement was made differed sharply among firm types. The negative coeffi- cient for voluntary groups was not significantly different from zero in the statistical sense. Only one of the voluntary groups received less than 90 percent of its supplies directly from shipping point.
MARKETING BILL fOR FRESH FRUITS AND VEGETABLES, UNITED STATES, 1958-59
$ MIL.
H Portion lo which char 9«
^B does rtot apply RETAIL STORES Jl,646
EATING PLACES. INSTITUTIONS. EXPORTS ::^
RETAIL 1
EXPORTS AND DIRECT SAIES — TO FIHAl USERS •.
WHOLESALERS S620 ORGANIZATION H
WAREHOUSES ■ SI43 H
TRANSPORTATION t898
SHIPPING POINT BUYING AGENCIES SB2
PACRERS. SHIPPERS. GROWER - SHIPPERS Í557
VALUE OF
IMPORTS AT PORT OF
ENTRT t3S0
VALUE AT FARM }l,a64
25 50 75 % OF SALES
100
NEC. JIJT-AI (•) ECONOMIC RESEARCH SERV
Figure 7.—Marketing bill for fresh fruits and vegetables. United States, 1958-59.
77

The effect of the size of the individual retail store on sources of supply was mixed. For national and regional chains, there was a negative effect; for local chains, not much of any effect; and for retailer cooperatives and voluntary groups, a posi- tive effect. The rationale for the inclusion of the factor leads one to expect a positive effect, since the firm serving larger stores finds it somewhat easier to plan ahead in its purchases. Only the negative coefficient for national chains was signifi- cantly different from zero.
This analysis was made in terms of the per- centage of the total volume received directly from
shipping pomt, including both direct purchases and those made through local brokei-s and agencies. A similar analysis using percentage of total volume purchased directly from shipping point as the dependent variable yielded generally similar re- sults, but the coefficients of multiple determina- tion were substantially lower in most cases. Thus, it would appear that the decision as to the partic- ular agency through which purchases are to be made—through a broker or by the retail organi- zation's own buyers—is frequently made after the decision to "go direct" on a particular commodity.
Costs, Margins, and Efficiency Performing the wholesale market fimctions for
fresh fruits and vegetables cost a total of $763 million throughout the country in 1958 (fig. 7). This was 13 percent of the retail sales value of produce sold through retail stores in that year (fig. 8). Farmers and foreign suppliera of im- ported produce received 32 percent of the retail store price at the packinghouse or at port of entry. Packers and shippers, including grower- shippers, received 8 percent of the total; shipping- point buying brokers and other buying agencies, 1 percent; transportation agencies, 13 percent; and retail stores, 32 percent.
In wholesale markets, wholesale handlers as a group—excluding truckers, packer-shippers, and a few large importers who also produce and trans- port bananas in their own vessels—sold produce
valued at $2.7 billion in 1958, for which they paid $2.3 billion (table 82). They incurred costs of $359 million over half of which was in salaries and wages, and had profits before taxes of $37 miUion. Primary handlers accounted for most of the sales ($1.7 bulion) and costs ($204 million) and secondary handlers for the biggest portion of the remainder—$880 million m sales and $142 million in costs. Brokers and distributors sold nearly $800 million worth of produce and had costs of $30 million.^
Margins of major groups of wholesalers ranged from 4.3 percent of sales for brokers and dis-
2 See appendix for definitions of terms used throughout this section.
MARKETING MARGINS FOR FRESH FRUITS AND VEGETABLES SOLD THROUGH RETAIL STORES,
UNITED STATES, 1958-59 100
80 UJ
^ 60 <
o 40
20
RETAIL STORES ~ -
WHOLESALERS**,..
RETAIL ORGANIZATION WAREHOUSES ...
TRANSPORTATION -
SHIPPING POINT BUYERS-
PACKERS AND SHIPPERS *'*
FARMERS AND IMPORTERS*
f/fffé*f*é**f**ff***f
/^•//•••/^•////
:íí:5í55S5 3í?ííííííí5
U. S. DEPARTMENT OF AGRICULTURE NEC. ERS 2138-63 \o) ECONOMIC RESEARCH SERVICE
78 Figure 8.—^Marketing margins for fresh fruits and^vegetableslsoldlthrough retail stores,tUnited States, 1958-59.

TABLE 82.—Marketing costs and margins, by type of firm, U.S. wholesale produce markets, 1958-59
Type of firm Sales Cost of goods sold
Gross margins
Salaries and
wages
Other costs
Total costs
Net income
Corpo- rate in-
come tax
Net income
after tax
Primary handlers: Receiver
1,000 dol.
736,011 332, 304 340, 740
25, 092 233, 923
lyOOO dol.
645, 153 293, 289 289, 762
22, 112 198, 302
1,000 dol,
90, 858 39, 015 50, 978 2,980
35, 621
1,000 dol.
40, 609 20, 328 27,601
1,511 20, 133
1,000 dol.
41, 903 17, 077 18, 302 1,296
12, 586
1,000 dol.
82, 512 37, 405 45, 903 2,807
32, 719
1,000 dol. 8,346 1,610 5,074
174 2,902
1,000 dol.
778 210
1,146 1
475
1,000 dol. 7,568
Commission merchant._ Receiver-jobber Commission wholesaler._ Service wholesaler
1,399 3,928
172 2,427
Total Ï 1, 685, 225 1, 463, 244 221, 982 111, 584 92, 084 203, 668 18, 314 2,626 15, 686
Secondary handlers: Jobber 98, 046
143, 897 94, 586 26, 594 21, 959 71, 700
126, 387 88, 176
121, 268 87, 797
87, 303 123, 681 76, 688 22, 653 19, 830 60, 075
100, 003 72, 618 91, 817 65, 436
10, 743 20, 216 17, 898 8,941 2,129
11, 625 26, 384 15, 558 29, 451 22, 361
5,719 9,773 8,036 2,039
981 3,527
13, 297 7,540
14, 716 9,672
3,797 7,321 8,776 1,607
936 5,049 9,893 5,897
12, 734 11,040
9,516 17, 094 16, 812 3,646 1,917 8,576
23, 190 13, 437 27, 450 20, 712
1,227 3,122 1,085
295 212
3,049 3,194 2,121 2,001 1,650
59 60
228 14 0 0
89 99
186 313
1,168 Jobber (delivery) Banana jobber
3,062 858
Service jobber 281 Secondary wholesaler Truck jobber
212 3,049
Purveyor 3,105 Receiver-purveyor Prepackager
2,022 1,815
Tomato repacker 1,337
Total 880, 410 720, 104 160, 306 75, 300 67, 050 142, 350 17, 956 1,048 16, 909
Shippers and truckers: * Mixed-load shipper L.c.l. shipper
25, 686 10, 874
22, 453 9,430
3,233 1,444
870 635
2,066 704
2,936 1,339
296 106
33 0
263 106
Total 36, 560 31, 883 4,677 1,505 2,770 4,275 402 33
127 47 48
369
Importers and exporters: Importer ' 56, 708
29, 783 16, 374
52, 043 27, 425 15, Oil
4,665 2,358 1,363
1,781 1,032
359
3,038 1,214
926
4,819 2,246 1,285
-154 112 77
-281 Commission importer E:¿porter
65 29
Total _ 102, 865 94, 479 8,386 3,172 5,178 8,350 35 222 -187
All wholesale handlers. 2, 705, 060 2, 309, 710 395, 351 191, 561 167, 082
8,566 1,381
468 5,054
779
358, 643
16, 660 2,233 1,009 8,058 1,651
36, 707 3,929 32, 777
Brokers and distributors: Selling broker 591, 538
48, 631 37, 859 92, 330 29, 009
38, 034 2,493 2,574 1,135 1, 111
21, 120 2,370 1,212 8,098 1,790
8,094 852 541
3,004 872
4,460 136 203
40 140
277 16 9
13 66
4,183 Auction representative-- Terminal broker Carlot distributor. Distributor
120 194 27 74
Total _ .. 799, 367 45, 347 34, 590 13, 363 16, 248 29, 611 4,979 381 4,598
Others: Auction 166, 188
89, 810 12, 699 4,139
3,920 4,842
1,863 2,603
1,266 1,897
3,129 4,500
791 342
372 30
418 Buying broker. 313
All brokers and agencies * 1, 055, 365 62, 185 43, 352 17, 829 19,411 37, 240 6,112 783 5,329
1 Includes figures for wholesale grocers not shown separately.
* Excludes packer-shippers and truckers.
3 Excludes large importers who also produce and trans- port bananas.
* Excludes sales agencies, buying offices, and sales agents.
79

TABLE 83.—Marketing costs and margins as percentage of sales, by type oj firrUy U.S. wholesale produce markets j 1958-59
Type of firm Sales Cost of goods sold
Gross margin
Salaries and
wages
Other costs
Total costs
Net income
Corpo- rate in-
come tax
Net in- come
after tax
Primary handlers: Receiver
Percent 100.0 100.0 100.0 100.0 100.0
Percent 87.7 88.3 85.0 88. 1 84.8
Percent 12.3 11.7 15.0 11.9 15.2
Percent 5.6 6.1 8.1 6.0 8.6
Percent 5.7 5. 1 5.3 5.2 5.3
Percent 11.2 11.2 13.4 11.2 13.9
Percent 1.1 .5
1.5 .7
1.2
Percent 0.1 .1 .3
0) .2
Percent 1.0
Commission merchant Receiver-iobber --
.4 1.2
Commission wholesaler Service wholesaler __ _
.7 1.0
Average 100.0 86.8 13.2 6.7
5.9 6.8 8.5 7.7 4. 5 4.9
10.5 8.5
12.2 11.0
5.4
3.9 5. 1 9.2 6.0 4.2 7. 1 7.7 6.7
10.4 12.3
12.0
9.7 11.9 17.7 13.7 8.7
12.0 18.2 15.2 22.6 23.3
1. 1
1.3 2.2 1.1 1. 1 1.0 4.3 2.5 2.4 1.7 1.9
.2
. 1
. 1
.2
. 1
-__
.1
.2
.4
.9
Secondary handlers: Jobber-- - -- 100.0
100.0 100.0 100.0 100.0 100.0 100.0 100.0 100.0 100.0
89.0 86.0 81.0 85.2 90.3 83.7 79.1 82.4 75.7 74.5
11.0 14.0 19.0 14.8 9.7
16.3 20.9 17.6 24.3 25.5
1.2 Jobber fdeliverv) _ - 2.1 Banana jobber .9 Service iobber 1.1 Secondary wholesaler Truck i obber
1.0 4.3
Purveyor -- 2.5 Receiver-Durvevor - - - 2.3 Preüackaeer _ -- - 1.5 Tomato repacker__ 1.5
Average _ - _ 100.0 81.8 18.2
12.6 13.3
8.6
3.4 5.8
7.6
8.0 6.4
16.1
11.4 12.3
2.0
1.2 1.0
.1
. 1
1.9
Shippers and truckers: Mixed-load shiDDcr _- 100.0
100.0 87.4 86.7
1.0 L.c.l. shipper 1.0
Average 100.0 87.2 12.8 4.1 7.5 11.7 1. 1 . 1 1.0
Importers and exporters: ImDorter -- 100.0
100.0 100.0
91.8 92.1 91.7
8.2 7.9 8.3
3.1 3.5 2.2
5.4 3.9 5.6
8.5 7.4 7.8
-.3 .4 .5
.2
.2
.3
-.5 Commission importer Exporter
.2
.2
Average 100.0 91.8 8.2 3.1 5.0
6.1
1.4 2.8 1.2 5.5 2.7
8.1
13.2
2.8 4.6 2.6 8.7 5.7
i})
1.4
.8
.3
.5 0)
.5
.2
.1
-.2
All wholesale handlers 100.0
100.0 100.0 100.0 100.0 100.0
85.4
96.4 95.1 96.8 91.2 93.8
14.6
3.6 4.9 3.2 8.8 6.2
7.2
1.4 1.7 1.4 3.3 3.0
1.2 Brokers and distributors:
Selling broker .7 Auction representative Terminal broker - - -
.2
.5 Carlot distributor - - - « Distributor .3
Average - - 100.0 95.7 4.3 1.7 2.0 3.7 .6 0) .6
Others: Auction 100.0
100.0 97.6 94.6
2.4 5.4
1.1 2.9
.7 1.9 5.0
.5
.4 .2
0) .3
Buying broker _ - - .3
1 Less than 0.05 percent.
tributors to 18.2 percent for secondary handlers (table 83). Generally speaking, the types of firms which performed more functions had higher costs and higher margins than others. The highest margins were found among tomato repackers (25.5 percent of sales) and prepackagers (24.3 percent). These firms have relatively high costs for labor, supplies, and shrinkage. Purveyors also had relatively high margins because of the services which they provided such as frequent delivery and sales in small units to fit the needs of their restaurant, hotel, and institutional customers.
The lowest margins were those of auctions (2.4 percent) and terminal brokers (3.2 percent of sales). These firms perform few functions, as compared with most wholesale handlers; conse- quently, their costs and margins are lower. Some auctions—those in New York City, for instance- do not handle the produce themselves at all. This service is provided by the railroads.
In general, larger firms operated on lower margins than did smaller firms of the same type, although there were a number of exceptions (table 84). Small receivers had average margins of 15.2 percent of sales, medium receivers 14.7
80

TABLE 84.—Gross margins as percentage of sales, by type and size oj firm, U.S. wholesale produce markets, 1958-59
TABLE 84.—Gross margins as percentage o-f sales, by type and size oj firm, U.S. wholesale produce markets, 1958-59—Continued
Firms with sales of—
Type of firm Less than 200
carlots
200 to
499 carlots
500 or
more carlots
All firms
Primary handlers: Receiver
Per- cent 15.2 11.2 16.3 10.3 27. 2
Per- cent 14.7 13.4 14. 9 10. 1 17. 5
Per- cent 11. 2 11.5 14.7 14. 4 14.3
Per- cent 12. 3
Commission merchant.. Receiver-jobber Commission wholesaler. Service wholesaler
n. 7 15.0 11. 9 15.2
Average. 15.4 14.8 12. 3 13. 2
Secondary handlers: Jobber 11.3
14.6 18.5 14.2 12. 7 16.3 2L 1 20.7 42.5 25. 3
10. 4 13.9 18.7 15.2 8.0
11.6 10. 7 19.6 15.4 7.3
11. 0 Jobber (delivery) Banana jobber Service jobber
14. 0 19.0 14. 8
Secondary wholesaler... Truck jobber
9.7 16. 3
Pur veyor 20. 2 16.3 25. 6 26.4
21. 2 16. 1 18. 8 n. 9
20.9 Receiver-purveyor Prepackager _ .
17.6 24.3
Tomato repacker 25. 5
Average 19. 3 17.2 17.4 18. 2
Shippers : Mixed-load shipper 12. 6
12.9 12. 6
L.c.l. shipper 13. 8 19. 2 13. 3
Total 13.8 19.2 12.7 12.8
Importers and exporters: Importer 13. 6
10. 4 8. 6
10.0 n. 6 9.4
7.9 7. 2 8.0
8. 2 Commission importer. _ Exporter
7. 9 8. 3
Average 9. 6 9.7 7.7 8.2
Firms with sales of—
Type of firm Less than 200
carlots
200 to
499 carlots
500 or
more carlots
All firms
All wholesale handlers
Per- cent 18. 2
Per- cent 15.5
Per- cent 12. 9
Per cent 14.6
Brokers and distributors: Selling broker __ 6. 5
""5."Ö" 24. 8
6. 0 3.5 3.8 3.5 4. 8
3.3 5. 1 3. 0 9.0 7. 0
3. 6 Auction representative. Terminal broker Carlot distributor Distributor
4.9 3.2 8.8 6. 2
Average 7. 7 5.4 4. 2 4. 3
Others : Auction 2.4
4. 0 2.4
Buying broker 5. Ö 7.3 5. 4
TABLE 85.
percent, and large firms 11.2 percent. Large service wholesalers operated on margins only a little over half as great as those of small firms of the same type. Among tomato repackers and prepackagers, the margins of large firms averaged less than half those of small firms.
Margins varied considerably from one firm to another within each firm type (tables 85 and 86). In most types, half or more firms had margins within three or four percentage points of the median figure for that firm type.
For all merchant wholesalers in the country having paid employees, aU costs averaged 14.8 per-
-Percentage of primary and secondary handlers with specified gross margins, by type of firm, U.S. wholesale produce markeis, 1958-59
Type of firm Less
than 7.5 percent
7.5 to 12.4
percent
12.5 to 17.4
percent
17.5 to 22.4
percent
22.5 to 27.4
percent
27.5 to 32.4
percent
32.5 to 37.4
percent
37.5 percent or more
Total
Primary handlers: Receiver __
Percent 15 15 2
Percent 42 62 37 71 26
50 36 13 19 36 59 13
6 8 2
Percent 22 16 40 24 48
26 34 39 51 25 24 18 22 18 4
Percent 11 4
11
Percent 3 __
Percent 3 1 1
Percent 0)
__
Percent 4 2 __
Percent 100
Commission merchant Receiver-jobber _
100 100
Commission wholesaler 100 Service wholesaler 22
9 24 24 30 13 11 36 48 14 25
4 100 Secondary handlers:
Jobber 15 2 3
100 Jobber Tdeliverv^ 4
8 100
Banana jobber. 4 7 2 100 Service iobber 100 Secondary wholesaler Truck jobber
13 13 3
22 14
3 20
100 3 2
100 Purveyor i
3 7 7
11 30
1 100 Receiver-Durvevor 100 Prepackager 3
13 43
4 100
Tomato repacker 2 100
1 Less than 0.5 percent.
81

TABLE 86.—Percentage of brokers and distributors with specified gross margins, by type of firm, U.S. whole* sale produce markets, 1958-59
Type of firm Less than 2.5 per-
cent
2.5 to 7.4 percent
7.5 to 12.4 percent
12.5 to 17.4 percent
17.5 to 22.4 percent
22.5 per- cent or
more Total
Selling broker Percent
32 37 12
5 13
Percent 48 57 88 60 75
Percent 9
Percent 8
Percent 2
Percent 1 6
Percent 100
Auction representative 100 Terminal broker 100 Carlot distributor 5 10 10 10
12 100
Distributor 100
cent of sales and payroll 6.4 percent in 1958 (table 87). Figures for the comparable group in whole- sale markets—^wholesale handlers less commission merchants, commission wholesalers and whole- sale grocers—are costs 13.6 percent of sales and {)ayroll 7.7 percent. The higher proportion of arger firms in the wholesale markets than is found
in the smaller cities and towns yields lower average costs for firms in wholesale markets. Payroll costs
TABLE 87.—Operating expenses and payroll of mer- chant wholesalers of fresh fruits and vegetables, by sales size, United States, 1958
Annual sales (1,000 dollars)
Establishments operated entire year: 10,000 or more 5,000 to 9,999 2,000 to 4,999 1,000 to 1,999 500 to 999 300 to 499 200 to 299 100 to 199 50 to 99 Less than 50
All operated entire year Establishments not operated entire
year
All establishments
Percentage of
Operat- ing ex- penses
(in- cluding
pay- roll)!
Percent
12. 1 7.6
13.4 14,9 15.6 15.8 16.6 16.8 24.4 27.7
14.7
18.0
14.8
Payroll
Percent
5.0 3.6 5.8 6.7 7.2 6.8 6.7 6.4 6.7
10.5
6.4
6.5
6.4
* Operating expenses include payroll, overhead ex- penses, and general office expenses, but not cost of mer- chandise for sale, income or excise taxes, or withdrawals by owners or part owners of unincorporated businesses.
Census of Business {32^ vol. 3, Sales Size and Employ- ment Size, pp. 2-7).
are higher largely because impaid proprietors and partners are a smaller part of the work force.
Costs declined fairly regularly from a high of 27.7 percent of sales for firms with sales of less than $50,000 per year to 12.1 percent for the largest wholesalers. Costs of firms with sales of $5 million to $10 million were much lower than for any other group.
Detailed information on costs for categories other than payroll were obtained only for whole- sale handlers in Boston (table 88). Payroll costs were half of all costs for these firms as a group; materials and supplies—^mostly for prepackaging and tomato repacking—^were 16 percent of the total; ownership and operation of buildings and equipment 12 percent; cartage, delivery, and storage 5 percent; buying and selling expenses 5 percent; and overhead 12 percent.
Payroll and Employees Salaries and wages accounted for about half of
the costs of all wholesalers—the largest item of costs. Nearly 4,600 wholesale firms had nearly 40,000 enaployees in 1958 (table 89). The retad organizations employed over 7,000 more in their produce warehouses. Over 4,600 of these workers m the wholesale firms were owners or part owners, 62 percent of them in small firms, 20 percent in medium, and 18 percent in large firms. In many small firms, the owners are the only workers. Of the truck jobbers in the wholesale produce markets 70 percent of them hired no employees, most of them being one-man businesses. Twenty-seven percent of the jobbers, 19 percent of the purveyors, 12 percent of the jobbers (delivery), and 10 percent of the receiver-jobbers had no paid employees. For wholesale handlers as a group, the work force of 17 percent of the firms was composed solely of its owners.
A fairly good-sized brokerage business can be carried on by one man, or by two in partnership, without any other assistance. Thirty-seven per- cent of the terminal brokers, 21 percent of the selling brokers, 54 percent of the buying brokers, and 56 percent of the sales agents hired no employees.
82

TABLE 88.—Marketing costs and margins of wholesale handlers in detail, by type of firm, Boston wholesale produce market, 1958
Item 27 re- ceivers
30 com- mission
merchants
7 com- mission whole- salers, service jobbers
60 job- bers
14 pur- veyors
35 tomato repackers, prepack-
agers
Total
Sales 1,000 dol
65, 179 59, 461
1,000 dol. 21, 584 19, 691
1,000 dol 3,391 2,752
1,000 dol. 18, 919 16, 699
1,000 dol 3,690 2,930
1,000 dol. 15, 424 11, 429
1,000 dol 128, 187
Costjof goods sold- 112,872
Gross margin 5,718 1,983 639 2,220 760 3,995 15,315
Costs of operation: Payroll 2,716
231 780
1,187 60 81
367 38 27
1,053 260 234
504 34 11
1,380 161
1,181
7,207 Cartage, delivery, storage 784 Materials and supplies _ 2,314
Buildings and equipment: Rent 282
50 48 89 98 34
89 7
12 25
" 9"
22 14 10 26
102 13 60
15] 11 2
18 11 12 8
38 5
153 128 82
101 25
9
666 Repairs and maintenance 223 Utilities 224 Depreciation 400 Equipment rentals 172 Store expense 62
Total 601 142 75 339 92 498 1 747
Buying and selling expense: Travel and entertainment Telephone and telegraph
24 ]90 26 31
39 78
2 10
10 23
1 5
47 54
46 20
68 74
7 6
234 439
Inspection 36 Advertising 9 6 67
Total 271 129 39 110 72 155 776
Overhead: Taxes 66
38 41
9 75 35
395
53 15 25
5 47 22
127
20 10 2 1
28 4
24
54 7 7
29 5 2
60 16 12
282 Interest 91 Bad debts 89 Contributions 15 Insurance 117
21 17
2,219
30 21 20
100 24 49
397 Accounting, audit, legal 127 Other 632
Total costs of operation 5,258 1,893 635 820 3,636 14 461
Net income before income tax 460 381
90 64
4 1
1 -7
-60 -61
359 330
854 Net income after income tax__ ._ 708
TABLE 89.—Number of employees by type and size of firm, U,S, wholesale produce markets, 1958-59 ^
Type of firm
Primary handlers: Receiver Commission merchant Receiver-jobber Commission wholesaler Service wholesaler Wholesale grocer
Total
Secondary handlers: Jobber Jobber (delivery) Banana jobber See footnote at end of table,
Size of firm, by 1958 sales
All sizes Less than 200 to 500 or
200 499 more cariots cariots cariots
Firms Employees Employees Employees Employees 654 7,314 1,033 1,953 4,328 218 3,068 216 370 2,482 419 4,992 1,213 1,566 2,213
21 139 39 69 31 126 4,069 280 575 3,214
7 83 66 17
1,446 19, 665
965
2,847
598
4,550
299
12, 268
245 68 359 2, 121 1,386 573 162 240 1,867 696 787 384

TABLE 89.—Number of employees by type avd size oj firm, U.S. wholesale produce markets, 1958-59 ^—Con.
All sizes
Size of firm, by 1958 sales Type of firm Less than
200 carlots
200 to 499
carlots
500 or more
carlots
Secondary handlers—Continued Service jobber __ ___
Firms 39 30
472 304 114 195 265
Employees 430 186 755
2,308 1,464 3, 674 2, 652
Employees 107 101 737
1, 139 464 975
1,866
Employees 194 45 18
680 739 807 745
Employees 129
Secondary wholesaler 40 Truck jobber Purveyor __ _ 489 Receiver-purveyor _ __ 261 Prepackager_ _ 1, 892 Tomato repacker 41
Total _ _ _ 2,263 16, 422 8,069 4,887 3 466
Shippers and truckers: Mixed-load shipper 14
6 6
57 19
322 113 172 220
50
61 6
75 38 16
261 L.c.l. shipper 9 98 Packer-shipper 97 Merchant trucker. _ 112
34 70
Itinerant trucker
TotaL__ 102 877 155 196 526
Importers and exporters: Importer _ __ 36
21 46
260 122 214
39 27 85
73 3
88
148 Commission importer. _ 92 Exporter 41
Total _ .__ 103 596 151 164 281
All wholesale handlers. _ . 3,914 37, 560 11, 222 9,797 16, 541
Brokers and distributors: Selling broker _ _ . 337
22 24 38 26
1,064 79 57
208 87
58 8 4 6 7
185 12 20 13 24
821 Auction representative . 59 Terminal broker . 33 Carlot distributor . 189 Distributor .. ._ _ 56
Total 447 1,495 83 254 1, 158
Sales agencies: Cooperative . 38
28 155 152
29 34 4
92 Importer's 148
Total... - .-_ _._ . _. 66 307 29 38 240
Others: Auction .. _ 5
105 18 27
225 266
41 28
225 Buying broker _ __ 64
4 21
71 12
7
131 Buying oflSce _ 25 Sales agent
All brokers and agencies . 668 4,582
2,362 39, 922
201 11, 423
382 10, 179
1,779 All wholesalers 18, 320
Retail organizations : Chains :
National chain 43 50
57 17
2,085 2,110
1,370 60
2, 085 Regional chain 4
27 24
28
161 16
2, 078 Local chain:
With warehouse _ _ _ _ . 1, 182 Without warehouse _ ___ 20
Total 167 5,625 55 205 5,365
Retailer cooperative. 36 21
1,090 469
40 44 94
1, 006 Voluntary group 375
All retail organizations._ 224 2
7, 184 89
95 343 89
6,746 Chain restaurant. _ _
Grand total 4,808 47, 195 11,518 10, 611 25, 066 ^ Number of employees including both owners and paid employees.
84

With few exceptions, larger firms sold a greater volume per employee than did smaller firms of the same type (table 90). Small receivers averaged 20 carlots per employee, medimn receivers 37 carlots, and large ones 55 carlots. Service wholesalers handled about half as much produce per employee at each size level as did receivers, reflecting the additional functions performed by such firms. Brokers and agencies sold from 3 to 7 times as much per employee as did wholesale handlers, because most of these firms performed only the buying and selling functions.
TABLE 90.—Volume sold per employee^ by type and size of ßririj U.S. wholesale produce markets^ 1958-69 '
TABLE 90.—Volume sold per employee^ by type and size of ßrmy U.S. wholesale produce markets^ 1958-59 ^—Continued
Firms with annual sales of—
Type of firm Less than 200
carlots
200 to
499 carlots
500 carlots
or more
All firms
Primary handlers: Receiver
Carlots 20 25 13 30 10
6
Carlots 37 44 24 32 17 36
Carlots 55 51 29 76 24
Carlots 45
Commission merchant. _ Receiver-jobber Commission wholesaler- Service wholesaler Wholesale grocer
48 23 41 22 14
Average. _ __ 16 30 41 35
Secondary handlers: Jobber. 22
17 19 18 19 27 13 11
7 9
34 25 24 27 39 94 22 13 14 10
60 37 29 19 47
""is" 38 20
28 Jobber (delivery) Banana jobber Service jobber
20 23 23
Secondary wholesaler. __ Truck jobber
30 28
Purveyor _ . 17 Receiver-purveyor Prepackager. _ .
17 15
Tomato repacker 10
Average 14 20 24 18
Shippers and truckers: Mixed-load shipper 13
36 5
27 31
40 64 49 14
35 L.c.l. shipper 31 60 Packer-shipper 30 Merchant trucker Itinerant trucker
25 33
22 32
Average 27 15 43 34
Importers and exporters: Importer 11
31 12
35 117 57
129 171 111
85 Commission importer. __ Exporter
139 50
Average. _ _ 15 15
48 25
140 39
83 All wholesale handlers 28
Firms with annual sales of—
Type of firm Less than 200
carlots
200 to
499 carlots
500 carlots
or more
All firms
Brokers and distributors: Selling broker
Carlots 54 40 50 88 74
Carlots 131 160 180 173 100
Carlots 376 275 438 289 198
Carlots 316
Auction representative. Terminal broker Carlot distributor Distributor
234 349 276 161
Average _ 57 136 352 299
Sales agencies: Cooperative.- _. _ __ 26 114
414 257 402
182 Importer's 402
Average ... 26 145 346 291
Others: Auction 72
193 223
72 Buying broker _ _ 52
156 60
147 196 193
144 Buying office .. ._ 209 Sales agent ._ 93
All brokers and agencies 53 142 304 256
Chains : National chain 53
62
68
110
53 Regional chain Local chain:
With warehouse_._ Without ware-
house
41
33
32
40
26
82
62
62
71
Average 33 32 60 59
Retailer cooperative Voluntary group _
5 26 23
33 40
32 37
All retail organizations- 21 29 55 53
1 Including both owners and paid employees.
Unit Margins Unit margins for wholesalers of different sizes
reflect much of the effect of greater volume per employee in larger firms. For most but not aU firms, gross margins per carlot average substan- tially lower for large firms than for smaller firms in the same group (table 91). Large receivers had average margins of $212 per carlot, while the margins of small receivers were a little over twice as large at $437. This includes the effects of more eflScient operations at larger sizes as well as the fact that large receivers warehoused 73 percent of the produce sold, while small ones put 85 percent through the warehouse.
85

TABLE 91.—Margins per carlotfor selected types of wholesalers, U,S. wholesale produce markets, 1958-59
Average margins per carlot of firms
with sales of—
Type of firm
Les
s th
an
200
car-
lo
ts
05
0 t> 0
S, 0
10
All firms 1
Primary handlers: Receiver
DoU lars 437 284 443 140
Dol- lars 334 270 325
Dol- lars 212 224 348
Dol- lars
250 Commission merchant. _ Receiver-]'obber Commission wholesaler
230 353 218
Service wholesaler 328 386 Secondary handlers:
Jobber _ 302 456 450 418 300 481 701 357
1, 328 767
323 Jobber (delivery) Banana jobber 2 Service jobber
356 489
389 512 382
Secondary wholesaler. _ _ Truck jobber _ _
341 458
Purveyor 407 577 Receiver-purveyor Prepackager _
580 440 375 499
Tomato repacker Brokers and distributors:
Selling broker
781
130 53 112
60 Auction representative 108 Terminal broker. 60 Carlot distributor 108
114
85 98
104 Distributor 120
Others: Auction - 85 Buvine broker 76 148
1 Includes firms not classed by size. 2 Volume adjusted to average weight per carlot of all
produce.
Among commission merchants, unit margins declined much less as size increased, to a con- siderable measure because the proportion of sales delivered increased from 6 percent for small firms to 39 percent for large firms.
Some idea of the costs of performing various functions can be obtained from comparisons of the unit margins of firms of different types. Firrns which buy and sell only, and transact most busi- ness over the telephone (selling brokers and ter- minal brokers) had average unit margins of $60 per carlot. When buying must be done in person, as by auction representatives, costs averaged $108 per carlot. Firms which physically handle the merchandise had unit margins from $218 per carlot for commission wholesalers up to $781 for tomato repackers. Unit margins of those who sell mostly in wholesale lots and perform few other services (receivers, commission merchants, and commission wholesalers) ranged from $218 to $250 per carlot. Selling in retail lots contributed to unit margins of $353 for receiver-jobbers. The addition of merchandising services was a major factor in rais-
ing margins to an average of $386 per carlot for service wholesalers.
The unit margins of jobbers, jobbers (delivery), and service jobbers are roughly comparable to those of primary handlers who perform similar services. Banana jobbers, prepackagers, and to- mato repackers have much higher margins because of the physical handling and shrinkage. Truck jobbers' margins are relatively high because of the small volumes they handle and those of purveyors and receiver-purveyors because of the small size of lot involved in most sales.
Marketing Charges in Different Types of Markets
There was a wide range in marketing charges per carlot of produce in different types of markets, ranging from $317 per carlot in secondary out-of- town wholesale markets to $568 in small markets. Most of this variation can be attributed to differ- ences in the functions performed by the various types of markets. From the differences in margins of firms performing dift'erent functions, we estimate in a crude fashion the costs per carlot of performing specified functions as follows:
Dollars Buying and selling 60 Handling but not warehousing (selling out
of car or truck) 50 Warehousing 140 Delivery., 100 Prepackaging or tomato repacking 250 Selling in retail lots (additional cost over
selling in wholesale lots) 100 Hauling from terminal or team track 60
The average costs calculated on this basis for each type of market compare quite well with the actual marketing charges in most cases.
Actual Calculated marketing marketing
charges charges Type of market per carlot * per carlot
Dollars Dollars Primary 400 348 Secondary :
Local wholesale 359 357 Out-of-town wholesale- 317 319 Other 341 327
Tertiary: Chain 430 442 Other 433 413
Small 568 376 1 Gross margins of all wholesalers except truckers, packer-shippers, buying
offices, and sales agents, including an estimate for sales agencies, less $60 per carlot for volume bypassing the market, divided by net supply for resale.
The only sizable discrepancies between the ac- tual and the calculated figures were in the primary markets and the small markets. At least a part of the difference (in primary markets) is probably due to the existence of higher wage rates in large cities as compared to those in smaller cities and perhaps higher prices of certain other inputs. In the small markets, diseconomies of scale are prob- ably of substantial importance. There are no large firms in these markets and a much larger
86

proportion of small ones (table 9). This would tend to raise costs well above average levels.
While any such crude test as this cannot be said to be conclusive, the results are not incon- sistent with the hypothesis that the costs of per- forming the major functions are similar in five types of markets and perhaps somewhat higher in me largest and the smaller markets. If this is so, these markets would have to be regarded as being equally efficient in performing any given set of functions. Any conclusion as to the relative effi- ciency of markets of different types would have to be answered in terms of the desirability of per- forming the functions of each type.
Returns to Owners and Managers Most wholesale produce firms are owned and
managed by the same persons. Only a few rela- tively large corporations are partly owned by people who are not active in the operation of the firm. Thus, the profits from the operation of the business go almost entirely to compensate the owners for their management and labor services and for the use of their capital. There was con- siderable variation from one type of firm to an- other in the average return to owners, depending in substantial measure on the size of the average firm of each type. Primary handlers averaged $11,658 per owner in 1958-59; secondary handlers $7,523; and brokers and distributors $12,867.
Type of firm Returns per owner ^ Primary handlers:
Receiver. $11, 487 Commission merchant 12, 801 Receiver-jobber 9, 255 Commission wholesaler. 6, 753
Average 2 11, 658
Secondary handlers: Jobber 5, 682 Jobber (delivery) 6, 468 Banana jobber ._ 6, 000 Service jobber 10, 303 Secondary wholesaler 5, 695 Truck jobber 5, 057 Purveyor 10, 261 Receiver-purveyor 11, 050 Prepackager 11,182 Tomato repacker _ 9, 303
Average 7, 523
Brokers and distributors: Selling broker 13, 781 Auction representative 10, 035 Terminal broker 10, 852 Carlot distributor 8, 075
Average 2 12, 867
Buying broker 8, 939 1 Profits before Federal income taxes plus salaries of owners. * Includes firm types not shown separately.
Target Margins If a produce wholesaler is to survive and remain
in business, be must cover bis costs of doing busi-
ness. For tbe small firm, tbe biggest element of costs may be the return to the owner for his own labor, and it is extremely diflScult to determine what the costs are, since the owner takes a residual income when other expenses are paid. The cost which must be covered if the firm is to remain in business is the minimum income which the owner will accept.
For larger firms, conventional accounting costs have more meaning in this connection. In a corporation, the officers receive salaries which probably provide the income needed to keep most of them in business. In a partnership or pro- Erietorship, the owners are still residual claimants, ut the book costs cover a much higher proportion
of total costs than for a one-man business. An approximation of this minimum level of
costs which must be covered is supplied by the managers' statements as to the margins which they aim to achieve. Eighty percent of the wholesale handlers gave some kind of an answer to this question (table 92). Half of them (62 percent of those replying) replied in terms of a target margin as a percentage of either sales price or cost price. All of these figures were converted to percentage of sales price for this analysis. Another 13 percent of the wholesalers answered in terms of cents per package; 17 percent said that the firm has no target margin—it charges what the market will bear, or prices are deter- mined by supply and demand, or other answers.
Percentage naargins are about equally common among the major groups of wholesale handlers, but secondary handlers are about twice as likely as primary handlers to think of target margins in cents per package. About 17 percent of each major group except importers and exporters had no target margin.
Among more than 2,000 firms quoting a per- centage target margin, the average margin was 13.7 percent of selling price (table 93). Primary handlers averaged 13.1 percent, secondary handlers 15.7 percent, shippers and truckers 11.6 percent, and importers and exporters 14.3 percent. Within each of these groups, there was substantial varia- tion between types and sizes of firms. Among re- ceivers and receiver-jobbers—the only types of firms with substantial numbers in all size categories quoting percentage target margins—the margins at which the firm aimed were averaged lower as the size of firm increased.
For 104 chains, target margins averaged 29.5 percent of the retail selling price, covering both wholesaling and retailing functions. For the wholesaling function only, retailer cooperatives and voluntary groups averaged about 10 percent.
Target margins of firms of some types clustered around one figure. All of the l.c.l. shippers and commission importers, 88 percent of the exporters, 81 percent of the commission merchants, 72 per- cent of the truck jobbers, and 55 percent of the receivers aimed at a margin of about 10 percent
87

TABLE 92.—Percentage of firms quoting various types of target margins, U.S. wholesale produce markets, 1968-59
Percentage margin
Margin in cents per package
Firm has no target margin—
Other Type of firm Prices are set by
supply and demand
Buy and sell on
speculation
Charge what the market
will bear
All firms
replying
Primary handlers: Receiver _ --
Percent 48 33 64 40 68 39
Percent 12
7 4
13 1
Percent 9 8 7
Percent 0)
Percent 10
6 4 3 4
Percent 2
10 1 8 2
Percent 81
f^ommiscsion merchant 64 "R p/»pivpr-i nhbpr 80 Cinm m lesion ■wholesaler 3 67 RpTvipp "wholp^fllpr 4 79 W^hnlpsîfllp erocpr 39
Average 52 8 7 0) 7 3 77
Secondary handlers: •Tohhpr 52
47 42 69 55 51 66 63 36 34
26 20 19 11 22 18 13
1 6
13
11 7 8
16 7 5 3
17 5
10
10 6 6 5 6 5 3 3 7
14
3 3 4
_-
3 2 5 5
2 100 Tfthbpr rdplivPTV^ 83 Banana iobber 1 80 RpTviPP inhhpr 2 100 Sppnndflrv 'whnlpQnlpr 90 Triipk iohbpr 81 "Pnrvpvnr 88
86 T^rpnii pkn cpr 59 T'nmntn rpnflcker 76
Average 50 16 7 0) 7 3 83
Shippers and truckers: l\/Ti"ypd-loflH shinnpr 47
67 50 49 33
6 6 59 TJ r» 1 shinnpr 17 84 T'ii pkpr-^h 1 irnpr 42
15 13
92 T\/Tprf»hflnt trucker 15 3
15 13' 82
Ttinprant trucker 9 83
Averace 46 14
18 5 8
8
4
2
6 5
6
8
4
5 23
80
Importers and exporters: Importer 29
23 62
70 56
TT-ynortpr 4 5 79
Averasre 42 11 3 3 5 1 65
All wholesale handlers 50 13 7 0) 7 3 80
1 Less than 0.5 percent. 2 Some firms gave more than one answer.
88

TABLE 93.—Target margins as percentage of selling price, by type and size of firm, Ü.S, wholesale produce markets, 1958-69
Firms with annual sales of—
Type of firm o o (M
II os
li o « o ÍÍ5
•S
Primary handlers: Receiver
Per- cent 13.8
Per- cent 12.7 10.7 14.2
"iä.'ö"
Per- cent 11.4 11.5 14. 1
Per- cent 11.8
Commission merchant- 11.4 Receiver-jobber Commission wholesaler. Service wholesaler
14. 4 11.2 17.9
14.2 13.2 16.6
Average 14.2 13.3 12. 9 13.1
Secondary handlers: Jobber 12.9
13. 8 16.7 12.3 14.5 11.5 18.4 17.0 19. 2 18.8
10.0 11.8 17.6 14.0
9.6 11.3 Jobber (delivery) Banana jobber Service jobber
13.3 18.9 13.5
Secondary wholesaler. _ Truck iobber
11. 2 12.2
Purveyor _ _ _ 18.3 16. 1 16.3
18.5 17.8
18. 4 Receiver-purveyor Prepackager
17.0 16. 1
Tomato repacker 18. 2
Average 15.5 15.4 16.9 15. 7
Shippers and truckers: Itinerant trucker 12. 0 12. 0
Average 12.7 15. 9 10. 8 11.6
Exporter 10.0 10.0
8.7 8.9
7.2 12.3
8. 0 Importers and exporters 14.3
All wholesale handlers 14.9 14.0 13.2 13.7
Chains: National chain 32.2
28.9
28.3
32. 2 Regional chain _ _ 28. 9 Local chain:
With warehouse Without warehouse-
27.2 28.3 29. 4
Average 28. 1 29.6 29. 5
Retailer cooperative. 9.3 10.7
9.3 Voluntary group« 11. 1
All retail organizations. 22.8 22.4 26.9 26.8
Figures not shown for less than 10 firms, but included in group averages.
(table 94). Target margins of other types of firms ranged more widely—in many groups, over a 20- or 25-percent range.
Over 500 wholesale handlers quoted target margins in cents per package, averaging 33.5 cents per package (table 95). Most of these firms were secondary handlers—jobbers, truck jobbers, and purveyors. Three-quarters of the firms where margins are thought of in terms of cents per package were small. In such firms the common unit of physical volume is the package, not the carlot. If we figure an average of 600 packages per carlot, many of these types of firms would have target margins around $200 per car- lot, a little less than 10 percent of the average selling price.
Target and Realized Margins
In general, the margins actually realized by produce wholesalers in 1958 were a little higher than those they aimed to obtain (compare tables 83 and 93). Realized margins for small firms of 13 out of 15 types of primary and secondary handlers were higher than their target margins. Actual 1958 margins for medium firms of three out of five types of primary handlers and all types of secondary handlers were above their target margins. For large primary handlers, realized margins were lower than target margins for three types of firms, the same for one, and higher for one. Realized margins were lower than target margins for five types of large secondary handlers and higher for two types.
For all primary handlers as a group, target margins averaged 13.1 percent of sales and realized margins 13.2 percent. ReaUzed margins were 2.5 percentage points higher than target margins for secondary handlers as a group.
Brokerage and Commission Rates
Commission rates, the charges by wholesale handlers on consignment sales where the whole- saler physically handles the merchandise in addi- tion to selling it for the account of the shipper, averaged 10.7 percent of the selling price for all wholesale handlers (table 96). Most of those han- dling consignment sales were commission mer- chants and receivers. Eighty-one percent of the wholesale handlers charged commission rates be- tween 7.5 and 12.4 percent of the sales price, 16 percent between 12.5 and 17.4 percent, and 3 percent, rates below 7.5 percent.
711-059—64-
89

TABLE 94.—Percentage oj firms of each type quoting specified target margins as percentage of selling price, U.S. wholesale produce markets^ 1958-59
Percentage of firms with target margins of—
Type of firm 2.5 to
7.4 percent
7.5 to 12.4
percent
12.5 to 17.4
percent
17.5 to 22.4
percent
22.5 to 27.4
percent
27.5 to 32.4
percent
32.5 to 37.4
percent
37.5 to 42.4
percent
Any per- centage margm
Primary handlers: Receiver
Percent 3 1
Percent 55 81 39 11
Percent 27 14 35 49
Percent 10 4
21 35
Percent 5
Percent Percent Percent (■)
Percent 100
Commisaion merchant 100 Receiver-jobber 2 1
5 2 100
Service wholesaler 100
Average _- 2
11 10 4 3 9 2
7
46
49 36 28 39 46 72 21 12 24 34
31
20 37 31 45 20 11 27 42 25
8
16
19 11 19 13 25 12 33 33 16 20
3
1 2 8
1 1 (0 100
Secondary handlers: Jobbers 100 Jobber fdeliverv) 2
2 -_ 2
7 100
Banana jobber 100 Service iobber 100 Secondary wholesaler Truck iobber
100 1
14 8
16 18
2 4
100 Purveyor 1 100 Receiver-Durvevor 100 Prepackager 7
7 5
11 2* 100
Tomato repacker 100
Average 5 39 25 20 7 2 1 1 100
Shippers and truckers: TtiTipmnt trncker 60 40 100
Averasre 2 50 32 10 6 100
Tmnortpra nnd exrjortera 9 4
81 42
8 27
100 All wholesale handlers 18 5
6 25 42
2
38 40 41
1
56 32 13
1
--
100
Chains: National chain. 100 Re&rional chain 100 Local chain with warehouse 2 2 100
Average 1 2 29 37 30 1 100
Rptfliler coonerfttive 11 82 56
23
7 44
7
100 VnliintflTV OTOim 100
All retail organizations 2 1 20 26 21 1 100
1 Less than 0.5 percent. Figures not shown for less than 10 firms but included in averages.
Brokerage rates, which do not include any charge for physically handling the goods, averaged 6.7 gercent of selling price for those brokers and
istributors charging on a percentage basis. Rates for selling brokers averaged 8.3 percent of selling price; those of auction representatives 6.1
Sercent; and those of buying brokers 5.8 percent, lost of the selling brokers charging on a per-
centage basis had rates in the 7.5 to 12.4 percent range, while the majority of the auction repre- sentatives and buying brokers charged rates around 5 percent of the selling price (table 97).
90

TABLE 95.— Target margins in cents jper package, by type and size oj firm, U.S. wholesale produce markets, 1958-59
Weighted average margin of firms with sales of—
Type of firm §
II 8"
0)
O
tí 8"
All sizes
Primary handlers: Receiver
Cents 29.6 10. 0 30.4
Cents 30. 1
Cents 24.0
Cents 25 9
Commission merchant 34. 0 Receiver-jobber 28 7
Average. 29. 3 29.9 27. 1 27 9
Secondary handlers: Jobber 37. 1
38.8 4.3
40.0 46.6
28.3 36. 2
32 6 Jobber (delivery) Banana jobber
40. 5 7 2
Truck jobber 40. 0 Purveyor 45 7 Prepackager ._ 80 4 Tomato repacker 62. 1 67. 9
Average 37. 3 31.3 61. 0 42 5
Shippers and truckers Importers and exporters
38. 1 10. 4
25. 0 25.0
22.3 26. 5
24. 2 25.3
All wholesale handlers. _ 35.8 30.4 33.8 33. 5
TABLE ^1—Percentage oj brokers and agencies charg- ing specified brokerage rates as percent oj selling price, U.S. wholesale produce markets, 1958-59
TABLE 96.—Average brokerage and commission rates as percentage oj selling prices, by size and type oj firm, U.S. wholesale produce markets, 1958-59
Type of firm
Brokerage and com- mission rates of firms with sales of— All
Les
s th
an
200
car-
lo
ts
OÏ
¡1 8" 500
or
mor
e ca
rlot
s
sizes
Primary handlers: Receiver
Per- cent 9.9
10.0 12.5 10.6
Per- cent 10.5 10.3 12.4 11.2
Per- cent 10.6 11.0 12. 6
Per- cent 10 6
Commission merchant Receiver-jobber Commission wholesaler Service wholesaler
10. 8 12.6 10. 9 10.6
Average 10.2
9.7 6.9
10. 1
9.2
10.7
9.9 8.6
10.5
10.3
10.9
10.0 8.2
10.8
8. 1
10 8
All secondary handlers All importers and exporters. All wholesale handlers
Brokers and distributors: Selling broker
9.9 8.2
10.7
8 3 Auction representative 6. 1
Average 9.2 9.7 6.5 6 7
All brokers and agen'îies 8.5 8.8 10. 6 5.5
Percentage of brokers and agencies with rates of—
Type of firm
Les
s th
an
2.5
perc
ent
^0
12.5 t
o 17
.4
perc
ent Total
Brokers and dis- tributors :
Selling broker Auction repre-
sentative
Per- cent
4
Per- cent
32
70
Per- cent
60
30
Per- cent
4
Per- cent
100
100
Average 7 38 52 3 100
Buying broker 75
43
25
47 2
100 All brokers and
agencies 8 100
Figures not shown for less than 10 firms but included in averages.
TABLE 98.—Weighted average brokerage rates in cents per package, by size oj firm, brokers and agencies, U.S. wholesale produce markets, 1958-59
Rates of firms handling—
Type of firm 42 o
Ja m O
Ci 05 03
Zs 8"
"S
8° »O
03 Oí
<
Brokers and distributors: Selling broker
Cents 10.0
Cents 10.4
Cents 9.2
Cents 9 3
Terminal broker 10. 0 Carlot distributor 10.0 10. 0
Average 9.9 10. 4 9.2 9 4
Buying broker 9.6 8.2 9 4
Figures not shown for less than 10 firms but included in averages.
Figures not shown for less than 10 firms but included in averages.
More brokers and distributors charge on the basis of fixed rates per package or per carlot than in terms of percentage of seUing price. Seventy firms quoted percentage rates, while 187 brokers and distributors quoted brokerage rates in cents per package. Fifty-five buying brokers charged on a package basis, compared to 16 on the per- centage basis. Package brokerage rates averaged 9.4 cents per package (table 98). The rates of the larger brokers were about a cent lower than those of the medium and small brokers.
91

THE PRICE-MAKING PROCESS The heart of any marketing system is the
price-making process. This is true of any industry but especially for one handling highly perishable products such as most fresh fruits and vegetables where supply conditions change daily, even hourly. The static concepts of price theory provide a beginning in understanding the operation of the price-making process, but full understanding can come only with recognition of the essentially dynamic character of the process of price deter- mination. Emphasis must be placed upon the process rather than upon the state of being. The concept of the equihbrium price is a convenient fiction which assists in understanding some of the forces at work, but one must go beyond this abstraction to begin to understand the dynamic process which makes one price ''right" at a given moment in time and ''wrong" the next minute.
At the outset, it is necessary to recognize that the fruit and vegetable industry is dealing with a type of supply-and-demand pricing, not to be confused with the quoted-price system prevalent in most manufacturing industries (4, pp. 108-110). Under supply-and-demand pricing, the seller offers his available" supply of goods for sale at whatever price the market will bring. In contrast, under the quoted-price system, the seller names a price at which he is willing to sell and takes orders. Since most of the theory of imperfect competition has been developed lor industrial markets operating under some variant of the quoted-price system, some caution is indicated in applying the theory to a market operating under supply- and-demand pricing.
The objective of any type of pricing system is to estabhsh the price for each commodity— strictly speaking, each type, size, grade, and quality of the commodity—which wiU equate supply and demand, that is, clear the market, at a given point in time. It should establish that price or those prices with a minimum expenditure of effort on the part of buyers and sellers, that is, by the most efficient means. Fm-thermore, it should minimize uncertainty by minimizing distortions in the price structure— the relationships between: (1) prices of different grades and types of the commodity; (2) prices of substitutable commodities; (3) prices of the commodity at different geographic points; and (4) prices of the commodity at different points in time.
To accomplish these objectives perfectly would require complete knowledge of present, potential, and forthcoming supplies (that is, supply elas- ticity) and their locations and of present and future demands, their elasticities and cross- elasticities. Complete knowledge is impossible. Even if it were possible, differences in evaluations of the meaning of known facts by different buyers and sellers in the market would cause variations in prices. Thus, the realistic goal is not complete
elimination of variations in prices and distortions of the price structure but their minimization.
Given these objectives, how are prices actually determined in different types of wholesale produce markets? In every market, buyers and sellers begin with a set of facts, more or less imperfectly known. Each firm starts with some knowledge of its own cost structure and the margin it needs to average in order to operate profitably. The "target margins" discussed in the preceding section are expressions of these facts, which are fairly well-known to the management of each firm. Then, there are the objective facts of supply and demand—prices at major shipping poiats, yes- terday's wholesale prices, arrivals, unloads and diversions of each commodity, the weather in the production areas and in the market area. The state of knowledge concerning these supply and demand factors varies from one buyer or seller to another, from one hour to the next, from one market to another. Knowledge is better for major commodities than for minor ones. Lacking perfect knowledge, the process of price-making would inevitably yield imperfect results, even in a static world. In the dynamic world in which produce markets exist, the prices determined would be only approximations even if it were not for the problem of quality.
This is the great unknown. Even if everyone in the market knew exactly how many cars of potatoes, lettuce, or apples were unsold in the market, how many were enroute to the market, and how many would be diverted to or from the market before arrival, knowledge of the supply conditions would be far from perfect. Potatoes are not simply potatoes, the possible variations in quality are almost infinite. Those actually found in a given market at a given moment in time are very considerable. EInowledge and intuition about the quality of each commodity are the great area for expertise. Granting the importance of knowl- edge of all of the other factors influencing price, lack of expertise in the quality area is the rock upon which many a produce business has floundered. It is the most important element which cannot be reduced to rote. Federal grades help to reduce the variability in quality. Grades with narrowly defined tolerances would help to reduce the variability somewhat more than the present grades do, if the trade would use them. But they would not eliminate the uncertainty about the quality of forthcoming supplies—those to be harvested tomorrow or those enroute to the market.
Thus, lack of knowledge of objective facts concerning quality introduces one of the major elements of uncertainty into the pricing of fresh fruits and vegetables. Whüe uncertainty could probably be reduced somewhat by steps such as more narrowly defined grades, compulsory ship- ping-point inspection, and reporting of grade and
92
size composition of shipments and unloads, it resists complete elimination. A major element of micertainty would remain, differentiating the marketing and pricing of fresh fruits and vege- tables from that for most other commodities.
This diversity in quality is the inevitable con- sequence of the biology of production. It is impossible to grow a fruit or vegetable crop where every individual fruit is just like every other one. Improved breeding and production practices have reduced somewhat the variation. Improved grad- ing can reduce the heterogeneity within a given lot. But the diversity will still be present in significant amounts creating an important element of uncertainty.
Price-Making Systems
The price-making process takes on different forms in different institutional environments. Each of the major types of environments has different characteristics and yields somewhat different results.
Fruit Auctions The fruit auctions are a highly sophisticated
refinement of the old-fashioned farm auction. The procedures under which they operate have been modified in many ways, so that the rules are complex and detailed. The uninitiated visitor is confused by much more than the unintelligible chant of the auctioneer. The transition from the one-time auction to dispose of the estate of a bankrupt or deceased farmer or householder to a continuing business institution holding a sale 5 days a week, 52 weeks a year has resulted in a set of procedures designed to assure equitable treatment for all buyers and a price to the seller which is the highest he can obtain and still assure that the buyers will return the next day.
The auction rules recognize that quality is a^ many-dimensional set of characteristics. Those most desirable to one buyer at a given time are not the same as those which appeal to another. Thus, bidding is not restricted to a single lot of fruit at one time. All lots on a given page in the auction catalog are included in one round of bidding. The highest bidder then selects the ''line'' or lot which he desires to purchase. He may take all or a part of it. Then, the second- highest bidder makes his choice, taking either the remainder (all or a part) of the same lot or any other one on the page. The process proceeds through all bidders in reverse order as they dropped out of the bidding until the entire page is disposed of.
The catalog for each day's sale describes each lot of fruit in considerable detail, giving the name of the shipper, the brand, size, grade, and quantity. The fruit is available for inspection. Several packages in each lot are open and each buyer has the right to open as many others as he wishes.
Thus, the fruit auction is in some ways almost the classic case. Supplies are visible and known; that is to say, the immediately present supplies are visible and known. Potential supply is known only imperfectly. Each seller jealously guards his personal knowledge of the supplies which he has enroute to market to be sold tomorrow or the next day. Reports of shipments tell how much of each commodity left the major shipping points each day, but not its destination nor its quality characteristics. Neither buyer nor seller has complete knowledge of the supplies which may be in the coolers awaiting sale.
The state of demand is known more imperfectly than that of supply. It is revealed gradually as the auction sale proceeds but the whole picture is not complete until the last lot is sold—and then the knowledge becomes only background for the next day's business. This gradual unfolding of demand means that the supply and demand condi- tions for each lot sold are unique. As each sale is completed, the conditions change. Some part of the demand has been satisfied, and it no longer exists to influence the sale of subsequent lots. Thus, auction prices are much more variable than those at private sales. Lots which appear to be identical may and usually do sell for different prices. This is the inevitable result of the system of auction selling and no amount of tinkering with the rules could alter it.
The fruit auction can only be successful in a market so large that the individual buyer takes only a small fraction of the total volume. When the small buyer's needs are satisfied and he ceases to bid, the price does not break drastically. Other small buyers are still bidding. The price may be slightly lower for the next lot sold—or it may be higher—but meeting the needs of a few large buyers does not bring on an utter rout.
The management of many fruit auctions recog- nize this fundamental fact and attempt to en- courage a large number of buyers. If one buying broker begins to concentrate too much business in his hands, they may seek to persuade his principals to do their own buying. They may also seek to discourage occasional buying by a large firm such as a chain. This may drive prices to delerious heights on the day he buys, but it discourages small regular buyers who find them- selves cut off from normal supplies on those days and encom-ages them to look elsewhere for fruit.
Thus, the closing of fruit auctions in many medium-sized markets is not primarily the result of high costs of operation resulting from small volume, but rather of the inadequate number of potential buyers in markets such as Baltimore, Minneapolis, St. Paul, New Orleans, Toledo, Newark, Kansas City, and Buffalo, all of which had fruit auctions at some time during the past 40 years or so. In the first four of these markets, fruit auctions existed for many years but the decline in the nmnber of buyers eventually forced them to close.
93

The Track Sale The Chicago carlot track sale is very nearly a
unique marketing institution. It exists by virtue of Chicago's location as the crossroads of the national railway system and the railroad rate system which permits a car to be routed to Chicago, placed on track, opened, the contents sold, resealed, and shipped to its final destination, all on a single through rate. The participants are a group of 15 or so Chicago brokers and dis- tributors with nationwide connections. Mostly they trade in potatoes from Idaho, California, the Red River Valley, Wisconsin, and other areas, but substantial quantities of onions and some lettuce are sold.
This is a highly informal marketing institution. There is no governing body and no set of rules. AU participants are both buyers and sellers, either as brokers or in their own right. One track in the Wood Street railroad yard is set aside for their use. Here each car to be sold is spotted and the door opened. Potential buyers may peer into the car, climb up on the load, open a sack of potatoes, and reach a judgment as to the quahty repre- sented. Bargaining is informal and deceptively casual.
Many of the conditions are similar to those at the fruit auctions. Immediately available sup- plies are visible and known. The state of demand and of potential suppHes are imperfectly known. However, since potatoes and onions can be stored for relatively long periods, potential supplies in the medium time span are somewhat better known from storage reports and other market informa- tion than for commodities yet to be harvested.
The Terminal Sale The terminal sale exists only in Boston, Phila-
delphia, and Cleveland, although many other mar- kets once had them, for example, Detroit. The procedures of the Boston sale are typical of those elsewhere, with some differences in detail.
The terminal sale is conducted under rules estab- lished by the Boston Market Terminal Co., a corporation made up of members of the trade, which sets opening and closing hours for selling and limits the time period during which deliver- ies must be made. Samples are taken from the cars or trucks and placed on the terminal floor. Sample containers are opened and the merchan- dise *'conditioned" for exhibition, so that the buy- ers can inspect it. Each selling firm has one or more salesmen on the floor. All buyers are admit- ted at the opening hour. Most of them make a circuit of the terminal floor, inspect the samples and obtain price quotations from the salesmen. Some then place orders. Others—probably most buyers—engage in at least a minimum of bargain- ing, the amount depending on market conditions, the relative bargaining strength of buyers and sellers on a given day (a ''buyers' market" vs. a ''sellers' market"), and personal inclination.
Opening price quotations are often adjusted as the sale progresses, to bring prices into line with those being asked by others, to "clean up" a car, or to "stretch out" supplies which appear to be short. Buyers will quickly tell a salesman if his prices are higher than those being asked by others.
A sales ticket is written when each transaction is completed. Usually deliveries are made direct from car or truck, although occasionally merchan- dise is unloaded on the terminal floor, and delivery is made from that point. The buyer has the right to reject the merchandise at delivery, if he finds it does not measure up to the quality implied by the sample displayed on the floor.
The basic supply condition in the terminal sale is that supplies are partially known. The list- ings of cars to be sold are of unknown accuracy. The reservation demands of the sellers are un- known, probably even to the sellers themselves until the moment of decision arrives. Tomorrow's supplies are no better known than in any other type of sale. The need to "clean up" supplies exists, although it may not be quite as compelling as at the auction. For all commodities, the seller faces demurrage charges by the railroad after a minimimi time period and, for highly perishable products, the certainty of quality decline compels the seller to dispose of his merchandise at almost any price before many days have gone by.
The Car-Door Sale The car-door sale is a variant of the track sale,
wheie produce is sold in wholesale and even retail lots for local consumption, rather than in carlots for movement to other markets. Watermelons have often been sold in this manner and wine grapes in some markets where they are not sold by the fruit auction. The supply and demand conditions are generally similar to those for the track sale and the terminal sale.
The Street Sale The street sale is the most prevalent method of
selling in larger wholesale markets. It is found wherever wholesalers' places of business are concentrated in a small area. Notable examples are Washington Street in New York, South Water Market in Chicago, and most of the terminal buildings in markets such as Detroit, Pittsburgh, and Los Angeles. Buyers who wish to compare prices and quality offered by different wholesalers in the market shop some or all of the wholesalers. Then they make their selections and return to make the actual purchases. They often buy different commodities from different wholesalers, perhaps a half dozen or more. Not all business is con- ducted in this fashion. Some buyers do all of their business by telephone, perhaps obtaining prices and exhortations as to the excellent quality available from several wholesalers, but more often dealing chiefly with a single wholesaler. The street sale sets the tone of the market, however.
94

Prices are determined by the interplay of buyer and seller. The wholesaler who finds that his sales of a given commodity are small or non- existent on a given day will quickly lower his price to draw a larger share of the business.
Supply and demand conditions are less well known in the street sale than at the auction or terminal sale. Supplies are visible only to a limited extent, since those on the selling floor are only a part of each wholesaler's stock. Additional supplies may be in the cooler or still in the rail car or truck. Sometimes a rail car is spotted on a siding several miles from the customary location or a truck is parked on the outskirts of town to preserve an element of bargaining power for the seller.
Diffuse Markets In many medimn-sized and smaller markets,
sellers are physically separated, perhaps by several miles, more often by several doors or a block or two. Competition is not so close-at-hand as in the street market, with several blocks of produce wholesalers one next to the other. In such markets, prices are typically announced by the sellers; some of them issue price lists. Just as in street markets, many buyers shop several whole- salers, either in person or on the basis of the price lists, and then make their purchases where price and quality are most suitable to them. Prices are adjusted on the basis of sales, although the ad- justments probably do not come about quite so promptly as in street markets.
Seattle is an excellent example of this type of market. Wholesalers are strung out for some distance along the railroad tracks, with a number located a mile or so away from the main concen- tration. All major wholesalers issue price lists several times a week.
The supply and demand conditions in such markets are similar to those in a street market, but the adjustment process does not take place as rapidly. Communication is slower. While the wholesaler can change his prices at any time, an interim price change is not as effective in attract- ing business as a change in the price list, since many potential customers may not learn of it.
The Use of Market Information in Price Making
A great deal of market information is available to owners and managers of produce firms in U.S. markets. The Market News Service of the U.S. Department of Agriculture reports prices in and volume of shipments from most of the major shipping-point markets, as well as wholesale sell- ing prices and the volimie received (unloads) in many major wholesale markets. In several of the largest wholesale markets, private firms also report wholesale selling prices to a select clientele willing to pay for the information. In addition, every
firm in the market has a multitude of contacts among both buyers and sellers which furnish it with much information about prices, the ''tone" of the market (sales are "brisk,'' ''steady," or "slow"), and the state of supply and demand, in the local market, in other terminal marisets, and at shipping point. Each seller combines all of this information with the evidence from his own sales and receipts to provide him with an estimate of the current state of affairs and likely develop- ments in the near future.
Half of the firms replying used USDA market news prices. Primary handlers, brokers and dis- tributors were more likely to use this information than were secondary handlers. In general, large firms of a given type were more likely to use mar- ket news prices than were small firms of the same type. Sixty-three percent of the primary handlers and 79 percent of the brokers and distributors used USDA reports of wholesale prices compared to 37 percent of the secondary handlers. Nearly all the firms using USDA market news prices utilized them for general information, "to follow the market," or occasionally, in settling claims for spoiled or damaged merchandise, or to set prices.
Price Variability The price-making process yields its results in a
somewhat different manner with each of these types of pricing systems. The timing of price changes is different. The pricing system in some markets makes them more sensitive to small changes in supply and demand factors than some others.
Prices at the fruit auctions are the most sensi- tive. The nearly unique condition of supply and demand surroimding the sale of each lot results in prices which vary many times dm-ing a day. Reports of prices at the auctions are presented in terms of averages, partly because the information for calculating averages is available but also be- cause there frequently is no modal price.
With other types of pricing systems, the ques- tion is not how many times a day a price changes but how many days go by before it changes. An index of price variability was constructed for five vegetables sold in most markets (table 98). This index measures the variability of prices in different markets in terms of the percentage of market days on which price changes. For this purpose, any change in the price quotation of the Market News Service is considered a price change—whether it be in the top or the bottom of the reported range or in both. Only vegetables were used in these comparisons, since most of the nationally marketed fruits are sold at auction in some of the markets, making comparisons impossible by the method used here. AH of the indexes were calculated as a ratio of the price variability in New York City. Comparisons were possible for 16 of the sample markets where the Market News Service reports prices.
95

Prices were most variable in Boston and Phila- delphia, the two sample markets with terminal sales. The index was markedly higher in these two markets than in any of the others, averaging 127 in Boston and 117 in Philadelphia. This result was to be expected considering the sensi- tivity of this type of pricing system to small changes in supply and demand factors, because of the close physical proximity of the sellers, and the pressure to ^'clean up" supplies held in railroad cars subject to demurrage and usually without refrigeration.
The other cities have either street markets or diffuse markets. Some, such as Minneapolis, have several market areas each of which might be con- sidered a street market. If these are nearly equal in volume handled and numbers of buyers and sellers, it is difficult to say just what type of pricing system exists. It might be weU to recog- nize a subcategory and caU this a segmented street market.
In these markets, two factors seem to affect the variability of prices—the size of the market and distance from shipping point. Price variability is the highest in the two large markets at a sub- stantial distance from shipping point—New York and Chicago. Chicago, as the crossroads market in the middle of the coimtry, shows slightly more variability than New York.
The next four markets—New Orleans, Pitts- biKgh, Detroit, and Washington—are aU in the eastern half of the country, three of them in the
Northeast. The net supply for resale averaged about 20,000 carlots in these markets in 1958. Los Angeles and San Francisco are considerably larger than these fom-, but they are both within a few hours haul of the production areas for many of these commodities. Thus, there is less timelag in adjusting supply to changes in demand. The need for price ''signals" to bring in suppHes is less, and there is less "over-adjusting" to the signals given, since supplies can be turned off and on much more promptly.
Atlanta, Seattle, Dallas, and Denver average about 16,000 carlots with three of them in the western half of the country, nearer the shipping points than the eastern markets. The last two markets listed—Minneapolis and Portland—^had substantially less price variabihty than any of the others. Net supply for resale averaged about 12,000 carlots, 25 percent less than in the next- higher group.
These factors do not provide a perfect explana- tion of the differences in price variabihty. There are unexplained variations within these groups, such as the high price variabihty in New Orleans compared to other cities of its size. Perhaps some of the apparent differences in price variabihty are due not so much to changes in actual prices in these markets as to differences in the practices of different market news reporters. Some are more likely to report small changes in the high and the low of the range than are others.
TABLE 98.—Index oj price variability for selected commodities in 16 wholesale produce markets, average 1957-58
(New York =100)
Market California carrots
Texas carrots
Idaho potatoes
California lettuce
California celery
All commod- ities listed
Boston 132 126 102 100
162 154 123 100 94
110 110
1 88
131 94 98
100 113 83 57 73 75 37 35 44 55 28 20 15
114 110 103 100 88 89 83 80
104 111 72 78 64 93 66 47
94 100 92
100 84 78 77 78 70 75 61 66 40 51 33 24
127 Philadelphia 117 Chicago _ -- 104 New York 100 New Orleans» 95 Pittsburgh 70
90 88 23 42 69 33
86 Detroit 83 Washington 81 Los Ansíeles 68 San Francisco 66 Atlanta _ 62 60 Seattle__ _ _ 55 Dallas - - 2 36
38 49
Denver 28 31
8
48 Minneapolis - - 38 Portland 23
' 1957 only. ^ Local repacks.
96

PART n
The Changing Marketing System
The central fact of all human experience is change, in matters economic as in all other areas. The marketing system of today can be understood only in terms of its development and of its relation- ship to economic forces at work.
The key factor which differentiates fruit and vegetable marketing from most forms of economic activity in the United States is that t)ie total market for its product is growing so slowly as to be just barely distinguishable. Between 1935-39 and 1957-61, the total volume of fresh fruits and vegetables handled by the marketing system grew 12 percent—less than 0.5 percent per year (figure 9). In comparison, during the same period population grew 35 percent, real income 143 percent, and the consumption of all foods 53 percent.
The reasons for the slow growth of the market for fresh fruits and vegetables are well known— primarily the shift to processed forms of these
products. The most spectacular increase was in frozen fruits and vegetables, from almost nothing in the late thirties to 11 percent of consumption (fresh-weight equivalent) in recent years. The market for canned fruits and vegetables more than doubled during that period.
This essential fact conditions everything else known about changes in the produce industry. It means that, even if no other changes took place, the growth in total volume would create very little opportimity for new firms. Their sales must come largely from the share of the business previ- ously done by existing firms.
A significant change in transportation methods for fresh fruits and vegetables has occiu*red since the 1930's. While the total volume handled by the marketing system increased 12 percent, the total shipped by rail declined 19 percent (fig. 10). Comparable figures are not available on the volume shipped by truck. The nonrail volume
TOTAL VOLUME OF FRESH FRUITS AND VEGETABLES MARKETED
MIL. CARLOTS
1935 "40 '45 '50 TOTAL CIVILIAN DISAPPEARANCE OF FRESH FRUITS AND VEGETABLES LESS QUANTITIES USED ON
FARMS WHERE CROWN, IN CARLOTS OF 30. 286 POUNDS. " " "t* uieo ON
U. S. DEPARTMENT OF AGRICULTURE NEC. ERS 1126-62(5) ECONOMIC RESEARCH SERVICE
Figure 9.—^Total volume of fresh fruits and vegetables marketed.
711-059—64 8 97

TOTAL PRODUCE VOLUME AND RAIL SHIPMENTS
MIL CARLOTS
1935 "40
U. S. DEPARTMENT OF AGRICULTURE NEC. ERS 2143-63(8) ECONOMIC RESEARCH SERVICE
Figure 10.—^Total produce volume and rail shipments.
AVERAGE LOAD PER RAIL CARLOAD OF FRESH FRUITS AND VEGETABLES
THOUS.LB.
All fruits and vegetables
Melons
■■'''''■■''■'■ I I I I
1935 "40 '45 '50 '55 '60 '65 INTERSTATE COMtAERCE COMMISSION NET WEIGHTS ESTIMATED.
•70
U.S. DEPARTMENT OF AGRICULTURE NEC. ERS 3144-63(8)1 ECONOMIC RESEARCH SERVICE
Figure 11.—Average load per rail carlot of fresh fruits and vegetables.
98

in figure 10 includes long-distance truck shipments, short-haul movement largely by truck from nearby producers, and sales by farmers directly to con- sumers and retailers at roadside stands and delivered to homes and stores.
In 23 markets for which information is available for both 1936 and 1958, the rail share of total rail and truck tonnage dropped from 57 percent in 1936 to 38 percent in 1958 and to 37 percent by 1961.
The carlots in figure 9 were standardized to a weight of 30,286 pounds, equivalent to the net weight of the average railroad carlot in 1958,
because of the substantial changes in weights per car which have taken place over the past 25 years (fig. 11). In the late thirties, the average load was a little over 27,000 pounds. During World War II, loads were much heavier, but by 1950 they had declined to about 29,000 pounds where they remained until 1955. Since then loads of many products, especially vegetables and melons, have increased sharply largely in response to new rates which provided incentives for heavier loads. Some of these rates set a flat charge per carlot, regardless of the amount loaded in the car. Others increased the minimum load for which a charge was made.
Changes in the Structure of the Retail Market
The present retail food marketing system devel- oped through several different stages. In the first three decades of the 20th century, the chain- store systems—several of them founded between 1859 and the turn of the century—developed into a major force in grocery distribution. By 1929, chains with four or more stores were doing slightly more than one-fourth of the foods tore business, including the substantial business done by specialty food stores (such as meat markets and fruit and vegetable stores), but excluding a sig- nificant volume of business still done by country general stores. The typical chainstore of the twenties was small, stocked a limited number of fast-moving grocery items and more limited lines of perishables or perhaps none, and served a fairly limited area on a cash-and-carry basis, when **cash and carry" meant that in a literal sense for a majority of the customers. The chains of that period built their success on a low- price policy, made possible by the elimination of services such as credit and delivery and the econo- mies of mass procurement and warehousing.
The "hard money" years of the depression created a fertile field for the food retailer who could feature even lower prices. But the chains had already exploited the economies of mass pro- curement and elimination of services. Into this fertile field came the early supermarkets, cutting costs and prices even further through the econo- mies of mass distribution. Some of the early enterprises even eliminated display racks, piling cases of canned goods and other groceries on the floor of bankrupt auto display rooms or ware- houses.
The "cheapie" supermarkets, as some of the early ones were called, appealed to the mood of the depression, but the late thirties and early forties brought better times, and supermarkets changed with the times. They became attractive places in which to shop, with more of the amenities, while retaining the advantages of mass distri- bution. The chains, some of which were at first reluctant to convert to supermarkets, became convinced that the road to prosperity led—and
the pressures of competition compelled—in this direction, and they began to close small stores and open supermarkets.
By the time the 1939 census was taken, chains with four or more stores operated 82 percent of the supermarkets, compared to 52 percent in 1935—taking the then-current definition of a supermarket as a store with sales of at least $300,000 per year. Both chains and independents continued to shift to supermarkets until World War II brought a virtual halt to the construction of new stores, except in areas which had no other retail facilities or grossly inadequate ones.
After the war, the conversion shifted into high gear. With only a brief pause during the Korean conflict, the supermarket share of food sales leaped upward year after year until it reached 63 percent of total grocery store sales in 1960, where it leveled off.
During the postwar period, the voluntary and cooperative groups of retailers, whose history dates back nearly as far as that of the chains, also began a vigorous growth as their members shifted into supermarket operations. New groups were formed, in some cases consisting entirely of inde- pendent supermarkets or small supermarket chains. Through centralized procurement and warehousing, the independents and the small chains were able to gain many of the economies which the larger chains possessed. By 1961, a major trade publication estimated that 81 percent of sales of independent grocery stores (single units and "chains" with 10 stores or less) were made by stores aflîliated with voluntary or cooperative groups, although many of their supplies were not actually bought through these groups.
The available data do not tell us all we would like to laiow about the share of the market held by each of the groups, and how it has changed over the years. The general picture is that, as supermarkets grew, the share of specialty food stores (such as meat markets, fruit and vegetable stores, and delicatessens) declined from 17 to 11 percent of total retail store sales of food between 1935 and 1961. Over the same period, country
99
general stores and other stores found their food sales falling from 9 to 2 percent of the national total. These figures cover only sales of food in retail stores, not sales of all items including non- foods. Figures on total sales would be somewhat different in detail, although the general picture is similar.
Both chains and independents increased their shares of total food sales as specialty food stores and general stores declined in relative importance. Chains as a group increased their share from 26 to 37 percent between 1935 and 1961. The three national chains held virtually steady at 15 to 16 percent of total food sales. Regional chains in- creased sharply in importance as new firms entered the group and older regionals increased their sales. In the midthirties, there were only three regional chains. Today there are at least 23. Local chains increased their share of the market from 1935 to 1954, but their proportion declined between 1954 and 1961 as several of these firms moved into the regional group through mergers.
The Growth of Direct Buying Direct buying of produce from shipping point
by chains has a long history. One national chain started to handle perishable commodities in the early 1920's ''and soon found the necessity of setting up an intermediate organization as a contact between the producers and its retail stores'' (2). Its produce buying subsidiary was organized in 1925 and handled about 4,500 cars in its first year. The volume increased rapidly, to about 80,000 carlots in 1929, 108,000 in 1936, and 142,000 in 1941 (1, 2, S3). From the be- ginning, 25 to 30 percent of its purchases were sold to other buyers and 10 to 20 percent of the total volume was handled on a brokerage basis. It never handled all of the produce purchases for the retail stores operated by the parent company, particularly of the more perishable items. In 1935-36, for instance, total purchases of the parent company of grapes, grapefruit, and to- matoes were greater than the purchases of the produce subsidiary, while those of oranges, apples, peaches, white potatoes, lettuce, onions, and cabbage were greater for the subsidiary.
The other national chains soon followed suit, organizing produce buying subsidiaries with oflîces in the major producing areas. One of these firms generally has followed a policy of buying only to meet its own needs, while the other sold to the trade—about 15 percent of its total volume in 1936 {33, pp. 605-607).
Some of the larger regional chains also went into direct buying during the 1920's. In 1927, two large New York chains bought 6,624 carlots of fresh fruits and vegetables directly from ship-
3 MCNEEL, HTJLDA. PERISHABLE CARLOT BUSINESS OP CHAIN STORE COMPANIES IN METROPOLITAN NEW YORK. 1929. Paper for the New York Food Marketing Research Council.
ping point.^ This was 49 percent of their total purchases. Most of these purchases were of storable items, including 4,290 carlots of potatoes, 254 carlots of onions, 117 carlots of sweetpotatoes, and 512 carlots of apples. They also bought 452 carlots of oranges and 198 carlots of watermelons direct from shipping point. At least three other New York chains were buying directly at this time, but the figures are incomplete for these firms.
In 1935, a national chain in a large eastern market procured 75 percent of its total receipts of nearly 2,000 carlots of produce through its produce buying subsidiary.* If bananas are excluded, 66 percent was bought directly from shipping point or local grower. Large-volume items were mostly bought directly. At least two-thirds of each commodity of which 50 or more carlots were handled was bought directly. Over 80 percent of the celery, onions, potatoes, watermelons, apples, cabbage, cantaloups, let- tuce, spring onions, and sweetpotatoes were bought direct. The only commodities handled in fair volume which were bought mostly on the local mai*ket were carrots (40 carlots) and kale (44 carlots). Other items of which 86 percent or more was bought locally were cucumbers, lima beans, blackberries, brussels sprouts, peaches, peppers, squash, and turnips. Total purchases of each of these commodities ranged from 1 to 8 carlots during the year.
By the midthirties, direct buying was common in most parts of the country. A study of 38 markets foimd that 15 percent of the produce was received directly from shipping point by chains {6). This included both direct purchases from shipping point by the chain and purchases through brokers and sales agencies with deliveries direct to the chain warehouse. Probably about 12 percent represented direct purchases.
Direct receipts by retail organizations, in the 19 markets where comparisons can be made, had grown to 30 percent of total receipts—20 percent direct purchases and 10 percent through brokers and sales agencies. No further increase is ob- servable between 1958 and 1961, when comparisons are made with figures reported by the Fruit and Vegetable Market News Service.
Nearly all of the change occurred after World War II. Thirty-five percent of the retail organi- zations reported more direct purchases in 1958 than in 1948, mostly replacing purchases from local wholesalers (table 99). The greatest changes were reported by regional chains, with two-thirds buying a higher percentage directly from shipping point, local chains with warehouse (46 percent), and voluntary groups (37 percent).
National and regional chains, retailer coopera- tives, and voluntary groups had each reduced purchases through local brokers. However, sev- eral local chains moved from complete dependence
* ScHNEBLY, LEWIS A. FRUIT AND VEGETABLE PUR- CHASING BY CHAIN STORES IN BALTIMORE. 1938. Master's thesis, Md. Univ., College Park.
100

TABLE 99.—Percentage of retail organizations reporting increases or decreases in purchases from specified sources between 1948 and 1958, U.S. wholesale produce markets, 1958-59
Type of firm
Direct from shipping
point
From local
wholesalers
From local
brokers
From nearby farmers
Shipping- point buy- mg broker
From farmers markets
In- creased
De- creased
In- creased
De- creased
In- creased
De- creased
In- creased
De- creased
Decreased Decreased
Chains: National chain... Regional chain... Local chain:
With ware- house
Without ware-
Pet. 16 67
46
6
Pet. Pet. Pet. 14 46
42
17
Pet.
13
19
Pet. 2
10
4
Pet. Pet. 1
Pet. Pet.
9
12
17
3
8 17 8
Average. __ 36 3 1 30 5 4 1 2 2 1
Retailer coopera- tive 17
37 9 9 4
22 13 15 Voluntary group
All retail organi- zations 35 3 2 27 4 6 1 2 2 1
on local wholesale handlers to some purchases through local brokers and from nearby farmers during the decade.
Warehouse Prepackaging
Fourteen percent of the retail organizations made some kind of change between 1948 and 1958 in their warehouse prepackaging. Eight percent of them increased the proportion prepackaged in
the warehouse, while 6 percent decreased it. Most of the firms prepackaging more were national chains (14 percent prepackaged more in 1958 than in 1948), local chains without warehouse (16 per- cent) , and voluntary groups (17 percent). Fifteen percent of the regional chains were prepackaging less and 6 percent more at the end of the period than at the beginning. Four percent of the local chains with warehouse increased the proportion prepackaged and 2 percent decreased it. Retailer cooperatives reported no changes in prepackaging.
Changes in the Structure of Wholesale Markets
The development of a national market for fresh fruits and vegetables was made possible by the introduction of refrigerated railroad cars after the Civil War. At first, natural ice was used, limiting their use to the northern half of the country where natural ice was available. In the 1880's, the manufacture of artificial ice was introduced, and the entire country was opened to refrigerated shipments. By the 1920's, the broad outlines of the modern fruit and vegetable marketing system were laid down {SO, Chap. ?>)8]18).
Since that time, change in the wholesale produce business has been largely a matter of adaptation of new conditions within the general framework already established. In the late twenties and early thirties, the motortruck entered the picture. It has gradually extended its economic range from a few hundred miles to several thousand miles, changing competitive relationships among ship- ping point markets and terminal markets.
Prior to World War I, almost all transportation of fresh fruits and vegetables was by rail, except for very short hauls by horse and wagon and a small amount by intercity streetcar line. Since the cost of short hauls by rail was relatively high, most wholesalers in smaller markets received as much as possible in full cars directly from shipping point. Other commodities were bought in nearby primary markets and shipped by rail in less-than- carload lots. With the introduction of the motor- truck, it became possible to ship from primary to nearby secondary markets at a lower cost, and many wholesalers in smaller markets shifted to buying from wholesalers and auctions in nearby markets.
Thus, shippers who had organized their business on the basis of sale to carlot buyers in many markets large and small were faced with adjust- ments which many found painful. The manager of the California Fruit Exchange complained in his 1938 annual report that the number of private
101

sale markets had been reduced from about 450 for deciduous fruits to less than 300.
This reduction has been caused by improved highways and increased refrigeration truck trans- portation, which make possible the hauling of fruit from auction markets to a jobber in a private sale market in conformity with his daily or weekly requirements, thereby obviating the necessity of his investing $1200 or $1400 in a carload of fruit, which he might have to carry for a week or ten days before he could dispose of it ... a jobber can purchase these supplies from the auctions by paying a small brokerage, 5 cents a package, receive delivery of the fruit less than 24 hours from the time it leaves the auctions (3).
After World War II, long-distance hauling of produce by truck increased rapidly. With more flexibility of operation, a truck could pick up a load from several shippers and deliver it to a number of different buyers. Mixed loads of several commodities and split loads going to a number of buyers have become increasingly important. It became much easier for a smaUer wholesaler to obtain supplies of a given commodity in quantities suited to his needs, and there has been a shift away from buying in primary markets to buying mixed loads directly from shipping point.
The second major factor was the declining share of the total fruit and vegetable market handled by wholesalers. Between 1939 and 1958, net sales of fruit and vegetable wholesalers—excluding sales to other wholesalers—declined about 17 percent, while the total quantity of fresh fruits and vegetables handled by the marketing system
increased 9 percent. Most of the difference was due, of course, to the increase in direct buying by retail organizations.
Number, Size, and Type of Firms
The number of merchant wholesalers of fresh fruits and vegetables in the United States re- ported in the Census has shown surprisingly little change over the past 30 years (table 100). In the two decades between 1929 and 1948, the number of these firms increased from just over 6,000 to nearly 6,900. Between 1948 and 1954, the number with paid employees increased by more than 500 but declined by more than 200 in the next 4 years. The largest percentage increase was in the number of truck jobbers, from 149 in 1949 to over 500 in 1958. The 1929 figure in- cludes both firms with and without paid em- ployees. It is probable that the one-man truck jobber operations were several times the number of those reported by the Census with some help on the payroll.
The number of commission merchants declined steadily from 1929 to 1948 and then increased in 1954 and 1958. Some of this fluctuation may have resulted from changes in classification proce- dm-es by the Census Bureau, rather than to changes in number of such firms. The number of brokers—^which includes both selling brokers and buying brokers—has fluctuated from one census to another, although it has declined at least since 1954.
TABLE 100.—Number offrait and vegetable wholesalers, by type of operation, U.S., census years 1929 to 1958
Type of operation
All establishments
1929 1935 1939 1948
Establishments with paid employees
1948 1954 1958 1
Merchant wholesalers: Truck jobbers Exporters Importers Other wholesalers and jobbers
Total
Agents and brokers: Commission merchants Auctions ^ Brokers Cooperative sales agencies Selling agents Export agents Import agents Other agents
Total»
149 15 14
5,841
278 13 95
5,778
273 11 81
5,989
279 20 28
6,544 (2)
380 25 31
6,084
508 33 46
5,704
6,019 6,164 6,354 6,871 5,984 6,520 6,291
825 18
444 32 39 15 4 4
648 15
521 (?) e)
15 5
507 14
459 90
21 6
11
287 11
506 71 20
5 46
(2) 1 11
Vi
312 11
407
SS
5 42
4
492 10
347
84
4 33
1,381 1,211 1, 108 946 791 869 968
1 Details estimated. ^ Not available. * Revised to exclude auctions outside of terminal markets.
Census of Business {32, 1929, 1935, 1939, 1948, 1954, 1958).
102

TABLE 101.—Sales of fruit and vegetable wholesalers in 1958 dollars^ by type of operation, U.S., census years 1929 to 1968
Type of operation
All establishments
1929 1935 1939 1948
Establishments with paid employees
1948 1954 1958»
Merchant wholesalers: Truck jobbers Exporters Importers Other wholesalers and jobbers
Total _..
Agents and brokers: Commission merchants Auctions ^ Brokers Cooperative sales agencies Selling agents Export agents Import agents Other agents
Total»
Mil doL
6 8
17 2,630
Mil. dol.
13
125 1,796
Mil, dol
13 6
154 2,546
Mil dol
31 20 38
3,611
Mil dol
Mil dol
50 26 65
3,406
MÜ. dol
60 26 51
2,955
2,661 2,120 2,719 3,700 3,640 3,557 3,092
620 266 345 135
55 9 1
(*)
641 305 376 250
594 339 413 420
11 4
44
380 241 564 199 28
2 181
241
199
449 229 496 325
9 188
16
760 170 412 292
198
1,431 1,583 1,825 1,595 1,514 1,712 1,832
* Details estimated. 2 Not available. * Revised to exclude auctions
markets. outside of terminal
Sales of all merchant wholesalers of fresh fruits and vegetables in the United States as reported by the Census of Business and adjusted to 1958 price levels decreased from $2.7 billion in 1929 to $2.1 billion in 1935 (table 101). Then, they in- creased to $3.7 billion in 1948, dropped slightly by 1954 and dechned to $3.1 billion in 1958. Sales of truck jobbers increased more than ten times over the three decades, although they still amounted to only about 2 percent of the total in 1958. Sales of importers and exporters also increased sharply but still represent only 1 or 2 percent of the sales of all merchant wholesalers.
Commission merchants increased their total sales, as reported, somewhat between 1929 and 1958; those of auctions dropped over a third. Brokers' sales increased from 1929 to 1948 and have declined since that time. Figures for other types of agents and brokers are not clear, since the classifications have been combined in different ways in various census years.
The distribution of merchant wholesalers be- tween small, medium, and large firms has been surprisingly constant for nearly 20 years. In each year of the Census of Business—1939, 1948, 1954, and 1958—the largest 5 percent of merchant wholesalers made about one-third of total sales, the largest 10 percent a little less than half, and 25 percent of the wholesalers with the largest sales did about three-fourths of the business (fig. 12). In short, there is no evidence that large establishments have gained any large additional share of the market since 1939.
* Less than $500,000. Census of Business (32, 1935, 1939, 1948, 1954, 1958).
The scanty data available seem to indicate that multiunit merchant wholesalers have declined in importance in the produce business. Between 1948 and 1954—the only 2 years for which data are available—the share of total sales of fruit and vegetable merchant wholesalers with 2 or more units declined from 19.2 percent of total sales to 15.5 percent, while that of wholesalers with 10 or more units dropped from 10.8 to 4.0 percent of the total.
The number of grocery wholesalers—^including retailer cooperatives and voluntary group whole- salers—selhng produce has declined from 819 in 1939 to 274 in 1958, or from 25 percent of all grocery wholesalers to 18 percent (table 102). Total sales of those selling produce averaged somewhat larger in 1958 than in earher years, although produce represented a smaller proportion of their total sales. This is probably due partly to the fact that in recent years many firms han- dling produce also have sold fresh meat and other perishables, so produce represents a smaller proportion of their total sales than it did in earlier years. Produce sales by grocery whole- salers have ranged between 5 and 8 percent of the sales of merchant wholesalers of fruits and vege- tables throughout this period.
The importance of retailer cooperatives and voluntary groups in the census general-line grocery wholesaler classification has increased sharply. In 1939, they accounted for 20 percent of the estab- lishments and 37 percent of sales. In 1958, they
103

PERCENT OF SALES ACCOUNTED FOR BY LARGEST PRODUCE WHOLESALERS, U. S.
% OF SALES
1939 "58 •39 '58 ■39 '58 '39 '58 1939 INCLUDES FIRMS WITHOUT PAID EMPLOYEES» 1958 EXCLUDES SUCH FIRMS.
U. S. CENSUS OF BUSINESS, 1939 AND 7958.
U.S. DEPARTMENT OF AGRICULTURE NEG. ERS 2145-63(8} ECONOMIC RESEARCH SERVICE
Figure 12.
TABLE 102.—Number and sales of general-line grocery wholesalers selling fresh fruits and vegetablesj U.S., census years 1939 to 1958
Item 1939 1948 1954 1958
Grocery wholesalers selling produce number. _ 819 693 425 274
Percentage of grocery wholesalers selling pro- duce percent- _ 25 20 20 18
Total sales (of all products) of grocery wholesalers selling produce as per- centage of total sales of all grocery wholesalers
percent 27 26 29 31 Sales of produce by gro-
cery wholesalers as per- centage of:
Sales of all grocery wholesalers _ _ percent. 3 4 3 2
Total sales of grocery wholesalers selling produce percent. _ 10 14 11 7
Total sales of merchant wholesalers of fresh fruits and vegetables
percent 5 7 8 6
All figures are for establishments reporting commodity line sales. General-line grocery wholesalers include retailer cooperatives and voluntary groups.
Census of Business {32, 1939, 1948, 1954, and 1958).
had 30 percent of the estabhshments and 62 per- cent of the sales. This includes firms selling pro- duce as well as those who do not.
Numbers of Firms in Wholesale Markets The number of produce wholesalers in U.S.
wholesale produce markets—^not the entire country as in the preceding section—as listed in the Bed Book y a leading trade directory, declined 17 per- cent between 1939 and 1958, from nearly 6,500 to less than 5,400 (table 103). The number of firms declined in all types except prepackagers and tomato repackers and truck jobbers. Both of these groups showed sharp increases (fig. 13). There was an increase in the number of truckers reported also simply because they were not listed in the directory in 1939. The number of importers was unchanged between 1939 and 1958, although it dipped sharply in 1948.
The number of firms listed as receivers, commis- sion merchants, and receiver-jobbers declined 25 percent from 1939 to 1958, with the biggest part of the decline occurring in the last decade of the period. Over the same period, the number of jobbers dropped 31 percent, brokers 37 percent, and wholesale grocers handling produce 56 percent.
The classifications in table 103 and the re- mainder of this section are not necessarily the same as those in the rest of this study. They
104

CHANGES IN NUMBERS OF PRODUCE WHOLESALERS IN MAJOR MARKETS
NUMBER - 1939
dufiSfl.
Receiver Jobber Prepaclc" ager,
repacker
Broker jobber-
Wholesale grocer
U.S. DEPARTMENT OF AGRICULTURE NEC. ERS 1127-62(5) ECONOMIC RESEARCH SERVICE
Figure 13.
TABLE 103.—Number of firms, by type, U.S. wholesale produce markets, 1939, 1948, and 1968
Type of firm 1939 1948 1958
Receiver, commission merchant, receiver-j obber
Firms 3,033 1, 189
15 383
Firms 2,760
816 58
475 21 96
404
Firms 2, 275
Jobber 817 Prepackage!, tomato repacker Truck jobber
205 572
Trucker 92 Importer 143
449 143
Shipper 365
All wholesale handlers 5,212 4,620 4,469
Broker 927 131 219
13
702 102 193
10
583 Buying broker 121 Distributor, sales agency Auction
192 10
All brokers and agencies All wholesalers._
1,280 6,492
1,007 5,627
906 5, 375
Chain 314 370
275 441
282 Wholesale grocer _ 162
All firms 7,176 6,343 5,819
Packer Red Book {21, 1939 and 1948) ; Fresh Yearbook Issue {22).
axe based on the first listing in the trade directory. For most firms, several different types are listed— often as many as five or six—indicating the variety
of functions and services performed by many firms. Throughout the remainder of this report (except in this section), the firms are classified on the basis of information obtained in the survey and the definitions in the appendix.
There was considerable variation among dif- ferent types of markets in the patterns of change in numbers of firms (table 104). For each type of firm, in at least one type of market the number increased where the total for all markets decreased. The total number of wholesalers decreased from 10 to 40 percent in 5 types of markets but in- creased 8 percent in other tertiary markets and 22 percent in secondary out-of-town wholesale markets. For many firms, the increases or smaUer-than-average declines in the total number of wholesalers took place in markets where popula- tion and total produce sales grew quite rapidly during this period, but many other factors were also at work.
The number of brokers declined in all types of markets except other tertiary markets. In the latter case, a large percentage increase in the num- ber of brokers in one of the sample markets more than offset declines in the other markets in the group. In the other types of markets, the decrease was small—only 5 percent—in primary markets, substantially larger—from 38 to 46 percent— in secondary markets, and very large—66 to 67 percent—in tertiary chain and small markets.
105

TABLE 10^,—Changes in numbers oj firms for selected type of firTns, by type of market, U.S, wholesale produce markets, 1939 to 1958
Type of market
Receiver, commis-
sion merchant, receiver-
jobber
Jobber Truck jobber
All whole-
sale handlers
Broker Buying broker
All whole- salers
All firms
Primary Percent
-35
-22 + 28 -19
-49 + 18 -40
Percent -32
-13 + 28 -73
+ 69 -39 -30
Percent + 546
+ 60 + 26 + 98
+ 22 + 26 -10
Percent -25
-4 + 41 -22
-27 + 11 -33
Percent -5
-46 -38 -46
-67 + 4
-66
Percent -4
+ 31 + 25
-100
0 -100 (0
Percent -23
-10 + 22 -29
-40 + 8
-36
Percent -22
Secondary: Local wholesale -10 Out-of-town wholesale + 11 Other -24
Tertiary: Chain -38 Other -5
Small -41
All m^arkets -25 -31 + 49 -14 -37 -8 -17 -19
1 Increased from 0 to 4. Packer Red Book (21, 1939 and 1948) ; Fresh Yearbook Issue
Entrance and Exit of Wholesalers
The wholesale produce business is relatively easy to enter. Capital requirements are low. Buildings can be rented and, for most types of business, little equipment is needed. Expensive equipment such as trucks can be rented, leased, or bought on time payments. This means that new firms are entering the business quite fre- quently and some old ones are going out, since both entry and exit are relatively easy. In addition to the turnover in firms, there is frequent turnover in ownership and management. Only a small portion of the firms now in existence—
and some firms are over 100 years old—have been owned by the same persons or the same families over their entire history.
Frequently, as the owners reach retirement age they sell out to junior members of the firm or to others in the produce business, often employees of other firms who wish to go into business for themselves.
Nearly half of the firms listed in the trade directory in 1939 in wholesale markets went out of business before 1948 (table 105). Another fourth left the business between 1948 and 1957. Only 28 percent were still in business in 1958. Considering only the firms listed as in business
TABLE 105,—Percentage of firms in business for specified periods, U.S. wholesale produce markets, 1939 to 1958
Type of market
Primary Secondary:
Local wholesale Out-of-town wholesale. Other
Tertiary : Chain Other
Small
All markets.
Firms in business in 1939 and—
Out before 1948
Out be- tween 1949
and 1957
Percent 48
42 46 51
41 59 40
47
Percent 24
24 26 22
32 23 33
25
Still in business in 1958
Percent 28
34 28 27
27 18 27
28
Firms in business in 1958
Started 1939 or before
Percent 35
38 25 38
44 19 45
35
Started 1940-48
Percent 15
13 17 20
21 20 11
16
Packer Red Book (^í, 1939 and 1948); Fresh Yearbook Issue
106
Started 1949-58
Percent 50
49 58 42
35 61 44
49

in 1958, 35 percent started in 1939 or earlier, 16 percent between 1940 and 1948, and 49 percent between 1949 end 1958.
The proportion of 1939 firms still in business in 1958 was highest in secondary local wholesale markets (34 percent), lowest in other tertiary mar- kets (18 percent) and about average in all other types of markets (27 to 28 percent). If consider- ation is limited to those firms in business in 1958, the highest proportion of firms started in 1939 or before was found in tertiary chain and small mar- kets (44 to 45 percent). It was about average in primary, secondary local wholesale, and other secondary markets (35 to 38 percent), and low in out-of-town wholesale and other tertiary markets (19 to 25 percent).
Business failures—bankruptcies and similar ac- tions—account for a fairly small portion of aU of the exits from the fruit and vegetable business. In the years 1940 through 1948, Dun and Brad- street (7) reported 301 failures in the wholesale fruit and vegetable business for the entire United States. This is less than 10 percent of the approx- imately 3,000 produce wholesalers disappearing from the listings in the trade directory in whole- sale produce markets, and some of the failures undoubtedly took place outside our definition of wholesale markets. From 1949 through 1958, Dun and Bradstreet reported 592 business fail- ures among fruit and vegetable wholesalers, about 20 percent of the nearly 3,000 firms leaving the business in the wholesale markets alone.
Nearly half of the wholesalers interviewed had been in business less than 20 years; 6 percent of them less than 5 years; and 19 percent less than 10 years (table 106). More than a fourth had been in business between 10 and 19 years and nearly two-fifths between 20 and 39 years. Only 3 percent had been in business more than 60 years.
The oldest firms, on the average, were the fruit auctions with a median age of 60 years—that is, half of the auctions had been in business more than 60 years and half of them less than that period of time. The median age of all wholesale busmesses was between 21 and 22 years. All types of pri- mary handlers had median ''ages" greater than this. The ''youngest'' firms were the few packer- shippers, the prepackagers, tomato repackers, importers, and the merchant truckers.
Growth and Decline The constant turnover of firms in the wholesale
produce business, as well as the relative fortunes of various lines of business, can be observed in the changes which took place in sales during the 1948-58 decade (table 107). Among all whole- salers as a group, sales changed less than 10 percent for 26 percent of the firms; they increased 10 percent or more for 36 percent; and decreased 10 percent or more for 38 percent of the firms. All of these figures exclude firms which either went out of business between 1948 and 1958 or entered the business in that period.
Among the major groups of firms, the median change in sales over the decade was an increase of 5 percent for primary handlers, a decrease of 4 percent for secondary handlers, a decrease of 3 percent for shippers and truckers, a decrease of 1 percent for importers and exporters and for all wholesale handlers, a decrease of 2 percent for brokers and distributors, and an increase of 8 percent for sales agencies.
The largest increases were registered by types of firms providing speciahzed services to their customers—service wholesalers, service jobbers, prepackagers, tomato repackers, mixed-load ship- pers, wholesale grocers, packer-shippers, and com- mission importers. The dechne of consignment selhng is indicated by decreases in average sales of commission merchants and commission whole- salers. All types of jobbers, purveyors, and truckers also lost volume on the average.
In general, differences in sales patterns among markets of different types are not marked for primary handlers, although secondary out-of-town wholesale markets show a somewhat higher pro- portion of the firms with increased sales (table 108). The pattern of change for secondary handlers shows somewhat more variation. Sixty- one percent of the secondary handlers in secondary local wholesale markets reported declining sales, as compared with 13 percent in small markets and 26 percent in other tertiary markets. Brokers and distributors showed even more variation be- tween markets of various types. Twenty percent of the firms in secondary local wholesale markets and 27 percent in primary markets reported in- creased sales, compared with 76 percent in other tertiary markets and 91 percent in small markets.
Changes in Trade Channels Most of the changes in the channels through
which produce moves from farm to consumer during the past 20 years have been brought about by changing importance of various types of firms, rather than by shifts in the channels utilized by the wholesalers already in the market. The most important factors have been the growth in direct buying by retail organizations and the decline in the relative importance of auctions and brokers.
Less than 10 percent of the wholesalers who were in business throughout the 1948-58 decade re- ported any change in sources of supply. Five percent of the wholesalers reported that they are now buying more directly from, shipping point than they did 10 years ago, and 3 percent reported buying a smaller proportion directly.
Thirty-five percent of the retail organizations bought more of their produce directly from ship- ping point in 1958 than they did in 1948, but 3 percent of them had cut back such purchases. Twenty-seven percent reported buying less from local wholesale handlers than previously, while 6 percent bought smaller amounts from brokers in the local market.
107

TABLE 106.—Percentage of firms in business for specified number oj years, U.S. wholesale produce markets, 1958-59
Type of firm 1 to4 years
5 to 9 years
10 to 19
years
20 to 29
years
30 to 39
years
40 to 49
years
50 to 59
years
60 years or
more Total
Primary handlers: Receiver _
Percent
4 4 5 2 2
Percent
10 10 10
5 ---
Percent
30 25 25 12 29 13
Percent
24 19 25 18 19 17
Percent
16 23 20 25 25
9
Percent
9 7 6 8 5
35
Percent
5 5 4 9
14
Percent
2 7 5
21 6 9
Percent
100 Commission merchant Receiver-jobber.
100 100
Commission wholesaler Service wholesaler
100 100
Wholesale grocer 100
Average 4 9 27 23 19 8 6 4 100
Secondary handlers: Jobber -- 4
5 9 5
11 3 8 7
12 16
18 12 13
2 11 14 17 10 12 23
19 25 31 26 17 34 24 34 37 33
28 27 17 24 20 19 20 20 23 19
18 19 13 14 15 19 15 12
9 7
8 4
10 10 11
9 9 7 2 2
4 6 6
l\i 12
2 2 7 4
1 2 1 _.
5 3 1
100 Jobber ideliverv)- - 100 Banana jobber 100 Service i obber ._ 100 Secondary wholesaler Truck iobber
100 100
Purveyor 100 Receiver-Durvevor 100 PrpDackaeer 100 Tomato reDacker 100
Average - 7 15 29 21 15 7 4 2 100
Shippers and truckers: A/ri"5Cpd-load shiDDer 22 7 22
38
5Ö" 19
22 25 25 15 28
16 11 37 17
100 TJ f*, 1 shiDDer 100 T*fi pkpr-shiDDPr 33
18 9
25 7 9
100 IVTprrhant trucker 100 T+.inprnnt trucker 22 13 100
Averase 16 8 37 20 11 8 100
Importers and exporters: Tm^Dorters -- 11 18
31 7
40 26 29
22 9
19
3 10 20
3 4 4
-- 3 16 19
100 Commission importers 100 Exporters 2 100
Averasre 5 6
16 13
33 29
18 21
11 17
4 7
1 4
12 3
100 All wholesale handlers 100
Brokers and distributors: Selline broker 4
13 13 11 13
17 7
29 11
22 19 10 30 20
22 25 23 21 30
19 17 25 13 20
8 4
6 4
2 11
100 Auction representative Tprminnl broker
100 100
Carlot distributor 8 13
6 4
100 Distributor 100
Average 7 14 23
4
31 6
22
25 5
21 33
18
19 24
12 12 20
8
23 19
5
6
14 14
2 6
20
2
15 14
2
6Ö"
100
Sales agencies: CooDerative 100 ImDorter's 14
12
10
15 43
100 Others:
BuvinsT broker - 100 BuvinsT office - - 100 Auction __ _ 100
All brokers and aeencies 7 14 22
28
22
21
17
17
8
7
6
5
4
3
100
All wholesalers 6 13 100
108
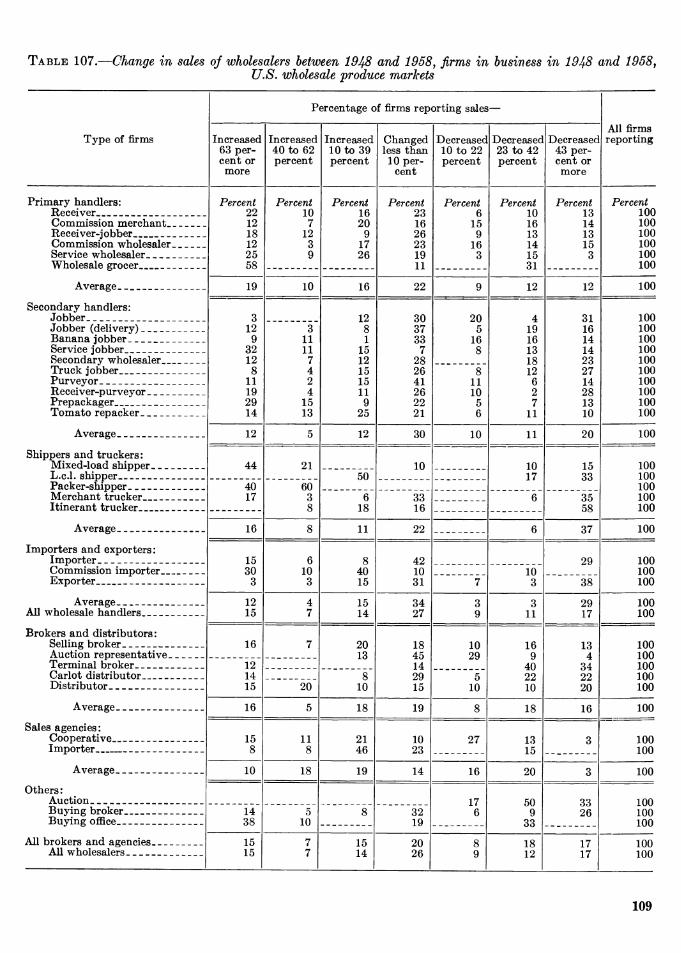
TABLE 107.—Change in sales oj wholesalers between 1948 and 1958, firms in business in 194-8 and 1958f U.S. wholesale produce markets
Percentage of firms reporting sales —
Type of firms Increased 63 per- cent or
more
Increased 40 to 62 percent
Increased 10 to 39 percent
Changed less than
10 per- cent
Decreased 10 to 22 percent
Decreased 23 to 42 percent
Decreased 43 per- cent or more
All firms reporting
Primary handlers: Receiver
Percent 22 12 18 12 25 58
Percent 10
7 12
3 9
Percent 16 20
9 17 26
Percent 23 16 26 23 19 11
Percent 6
15 9
16 3
Percent 10 16 13 14 15 31
Percent 13 14 13 15
3
Percent 100
Commission merchant Receiver-jobber _
100 100
Commission wholesaler Service wholesaler
100 100
Wholesale grocer 100
Average 19 10 16 22 9 12 12 100
Secondary handlers: Jobber 3
12 9
32 12 8
11 19 29 14
12 8 1
15 12 15 15 11 9
25
30 37 33
7 28 26 41 26 22 21
20 5
16 8
4 19 16 13 18 12 6 2 7
11
31 16 14 14 23 27 14 28 13 10
100 Jobber (delivery) _ _ 3
11 11
7 4 2 4
15 13
100 Banana jobber 100 Service jobber _ 100 Secondary wholesaler 100 Truck jobber 8
11 10
5 6
100 Purveyor _ __ _ _ 100 Receiver-purveyor 100 Prepackager 100 Tomato repacker 100
Average 12 5
21
12 30 10 11 20 100
Shippers and truckers: Mixed-load shipper 44 10 10
17 15 33
100 L.c.l. shipper _ 50 100 Packer-shipper 40
17 60
3 8
100 Merchant trucker 6
18 33 16
6 35 58
100 Itinerant trucker 100
Average 16 8 11 22 6 37 100
Importers and exporters: Importer 15
30 3
6 10
3
8 40 15
42 10 31
29 100 Commission importer 10
3 100
Exporter 7 38 100
Average 12 15
4 7
15 14
34 27
3 9
3 11
29 17
100 All wholesale handlers 100
Brokers and distributors : Selling broker. _ 16 7 20
13 18 45 14 29 15
10 29
16 9
40 22 10
13 4
34 22 20
100 Auction representative 100 Terminal broker. 12
14 15
100 Carlot distributor 8
10 5
10 100
Distributor 20 100
Average 16 5 18 19 8 18 16 100
Sales agencies: Cooperative 15
8 11 8
21 46
10 23
27 13 15
3 100 Importer 100
Average 10 18 19 14 16
17 6
20
50 9
33
3
33 26
inn
Others: Auction 100 Buying broker 14
38 5
10 8 32
19 inn
Buying ofläce 100
All brokers and agencies. _ 15 15
7 7
15 14
20 26
8 9
18 12
17 17
100 100 All whnlpsfllftrs
109

TABLE 108.—Percentage oj firms in each group reporting various changes in sales volume jrom 1948 to 1958, U.S. wholesale produce markets y 1958
Primary handlers reporting sales—
Secondary handlers reporting sales—
Brokers and distributors reporting sales—
Type of market Increased
10 percent or more
Changed less than
10 percent
Decreased 10
percent or more
Increased 10
percent or more
Changed less than
10 percent
Decreased 10
percent or more
Increased 10
percent or more
Changed less than
10 percent
Decreased 10
percent or more
Primary _ Percent
42
44
52 47
43 49 46
Percent 22
20
17 26
24 10 28
Percent 36
36
31 27
33 41 26
Percent 29
19
37 35
38 29 45
Percent 34
20
22 22
28 45 42
Percent 37
61
41 43
34 26 13
Percent 27
20
55 42
47 76 91
Percent 31
25
26 7
Percent 42
Secondary: Local wholesale Out-of-town whole-
sale
55
19 Other ___ __ ___ 51
Tertiary: Chain _ __ 53 Other 24
Small 9
All markets 45 22 33 30 30 40 38 21 41
Many more wholesalers reported changes in the types of firms to which they sell. Ten percent now sell more to chains than previously and 8 per- cent less. Fourteen percent are selling less to independent grocery stores; 3 percent more. Sales to hotels, restaurants, and institutional outlets have increased for 5 percent and decreased for 2 percent. Jobbers are a more important outlet for 3 percent and less important for 5 per- cent. In addition, 10 percent of the wholesalers reported that the number of customers to whom they sell has declined in the past 10 years. This was especially true of the numbers of independent grocery stores.
The wholesalers whose sales have grown during the past 10 years have been those who shifted their outlets away from independent grocery stores and jobbers and toward retail organizations and institutional outlets. Those with declining total sales also are selling less on balance to in- dependent grocery stores and jobbers, but fewer of them have been successful in increasing sales to retail organizations. They too are selling more to restaurants, hotels, and institutions.
Between September 1920 and July 1921, 65 per- cent of 9,476 cars studied in Boston, Chicago, New York, Philadelphia, Pittsburgh, and small amounts in other cities were sold on commission (25, p. 12). Gross commissions on all consigned goods averaged 6.4 percent of the sales price. In 1958-59 in these same cities, 38 percent of the receipts of wholesale handlers directly from ship- ping point were handled on consignment.
Changes in Services Most wholesalers made no change in the services
which they offered their customers between 1948 and 1958. In each of the major groups, three- quarters or more of the firms which were in business throughout the decade offered the same services throughout the period. Most of the changes which were made were in delivery services. Six percent of the primary handlers (mostly receiver-jobbers and receivers) provided more, or more frequent, delivery service in 1958 than they had 10 years earlier. Three percent (mostly of the same types) provided less or less frequent delivery service. Five percent of the secondary handlers increased delivery service during the period and 1 percent decreased such service. A few firms did more prepackaging and a few less. Even fewer wholesalers offered more or less merchandising assistance. Only a few iirins changed the credit terms which they made avail- able between 1948 and 1958.
The major change in the brokerage business in the past 10 years has been the shift toward more split cars—one carload divided among several buyers—and more mixed cars—one car containing several commodities. Forty-three brokers and distributors reported selling more split cars then they did a decade ago. Eleven selling brokers— including 10 of those selling more split cars— are selling more mixed cars now. This shift was especially important in the markets between the Mississippi River and the Rocky Mountains.
110

The Place of the Fruit Auctions in a Chang- ing Market System
The fruit auctions developed as the major distributors of deciduous fruits from the West Coast and of citrus fruit. In 1930, they handled 84 percent of the citrus fruit in auction cities and nearly as high a percentage of western deciduous fruits. They were the mass distributors of these fruits at the wholesale level. They maintained this position fairly well dm^ing the 1930^s, although changes were beginning to take place in the marketing system around them which, in the post- World War II period, brought about a major change in the role of the auctions (10^ 20, 28),
The auction cities' share of the national market declined and direct buying by corporate and volun- tary chains increased markedly, mostly because of the increase in the number of retail organizations large enough to take advantage of direct buying.
Auction sales declined from a third of all citrus and 10 percent of all deciduous fruit sold fresh in 1937 to 15 percent of the citrus and 6 percent of the deciduous fruit in 1957. They sold about half of the citrus fruit and western deciduous fruit received in the auction cities in 1956-57.
A portion of this volume was maintained by the decision of the major supplier of California citrus to sell to wholesalers and jobbers only through the auctions in the auction markets. The effects of this policy in maintaining the sales volume of the auctions may be indicated to some extent by the experience of a major supplier of Florida Indian River citrus. For many years this orga- nization maintained a policy of selling only in the terminal markets, either through the auctions or through brokers and commission merchants in cites where there were no auctions. In 1951, this policy was changed, and they began selling f.o.b. shipping point as well as at the terminal. In 6 years, 40 percent of their total sales were on an f.o.b. basis. A similar policy change on the part of their California counterparts could have results of the same type and scope.
In many ways, the fruit auctions are better adapted to sale of high-valued specialty items than to the sale of large quantities of standardized fruit. The auctions are increasing this type of business. Four deciduous fruits—California nec- tarines and apricots. Northwest cherries, and Washington apricots—are sold almost exclusively through the auctions in cities having these facili- ties. These are all small quantity items and rela- tively high valued. The advantages of direct buying are not nearly as great as for Northwestern
apples or pears, which are purchased in carload lots and carried as standard items in the produce department of nearly every supermarket in the country.
Within commodity groups such as Northwest apples, auction sales of the higher-valued items are holding up better than those of the standard items. Golden Delicious apples brought nearly $2 per box more on the auctions during the 1957- 58 season than any other variety—and 23 percent of the production was sold through the auctions. The next highest share for auction sales was for Delicious, including the fairly high-priced Red Delicious.
This picture is probably clearest for Florida citrus. Fruit from the Indian River section along the east coast brings fairly substantial premiums over that from the interior, and a much higher proportion is sold through the auctions.
Auction sales of lower-valued fruit are declining much faster than those of the higher priced items. In the past decade, the share of lower-priced Florida citrus items sold at auction declined by one-fifth to one-third. In addition, the proportion of higher grade fruit of a given type sold at auction is somewhat higher than for total shipments.
Outlook of Wholesalers Produce wholesalers as a group are not very
sanguine about the future of the business. Over half of the wholesale handlers expressing an opinion felt that the outlook for their type of business was poor, 17 percent thought it was fair, and 25 percent good (table 109). More than half of each type of primary handler except service wholesalers and wholesale grocers thought the outlook was poor, as did a majority of each type of jobbers, shippers, and truckers. Purveyors, receiver-purveyors, prepackagers, tomato repack- ers, importers, and exporters were more optimistic. Selling brokers and terminal brokers were fairly optimistic, auction representatives, carlot dis- tributors, and distributors, more pessimistic.
About 400 wholesalers expect to go out of business in the next few years. Nearly 750 of them have plans to make changes in their busi- nesses. A little over 100 plan an aggressive search for new business. Nearly 80 plan to change to a different type of business; 54 hope to sell more to chains. Twenty-seven plan to shift their pur- chases towards more direct buying from shipping point, and an equal number plan to shift their entire operations to a shipping-point market. The remaining 400 have a wide variety of plans.
Ill

TABLE 109.—Outlook oj wholesalers, U.S, wholesale produce markets, 1958-59
Type of firm
Percentage of firms in the group whose opinion of the future for their type of business is— Total
replying
Good Fair Poor Unknown Other
Primary handlers: Receiver
Percent 28 20 20
6 60 74
Percent 13 11 9
Percent 55 66 66 87 18 13
Percent 3 1 3 7 8
13
Percent 1 2 2
Percent 100
Commission merchant 100 Receiver-]'obber 100 Commisaion wholesaler 100 Service wholesaler __ 9 5 100 Wholesale erocer 100
Average _ _ 27 11 57 3 2 100
Secondary handlers: Jobber 11
15 11 13 26 14 41 35 53 39
17 21 14 19 12 25 26 29 11 12
66 62 72 63 62 60 27 32 33 45
5 2 3 5
1 100 Jobber (delivery) 100 Banana jobber 100 Service jobber 100 Secondary wholesaler 100 Truck jobber 1
1 100
Purveyor _ _ 5 4 3 4
100 Receiver-Durvevor 100 Prepackager 100 Tomato renacker 100
Average 24 20 53 3 0) 100
Shippers and truckers: Mixed-load shipper 29
20 64 60
68' 76
7 100 L.c.l. shipper 20
60 100
Packer-shipper 40 5
100 Merchant trucker 27 100 Itinerant trucker 24 100
Average 20 10 64 6 100
Importers and exporters: Importer 35
47 29
30 5
36
35 43 17
100 Commission importer 5
7 100
Exporter __ 11 100
Average 35 25
27 17
30 54
4 3
4 1
100 All wholesale handlers 100
Brokers and distributors: Selling broker 42
27 45
9 42
15 11
9 24
38 54 46 63 50
4 8
1 100 Auction reDresentative 100 Terminal broker 100 Carlot distributor _ _ 2
8 2 100
Distributor 100
Average __ 38 14 43 4 1 100
Sales agencies: Ooonerative 87
82 10
6 3 100
ImDorter's 12 100
Average 85 9 2 4 100
Others: Aiifition 50
22 24
38
50 18 40
15
100 BuvinsT broker 54
36
42
6 100 Buvinff office 100
All brokers and agencies _- 4 1 100
* Less than 0.5 percent.
112

PART ni
The Nature of Competitionfln Produce Markets
This study has dealt primarily with the organi- zation and operation of wholesale markets for fresh fruits and vegetables. These markets stand in the center of the marketing system, looking backward to the shipping-point markets and forward to the retail markets. It provides an excellent point from which to assess the nature of competitive in markets at each level. While the emphasis is primarily upon the wholesale level, a considerable measure of understanding of markets at other levels is also provided by this analysis.
Shipping-Point Markets
The production of fruits and vegetables is characterized, almost without exception, by large numbers of firms, each with a small proportion of the total output. For a few small-volume commodities produced in limited areas, the numbers of producers may be small enough so that the individual grower is aware of the effect of his own production decisions on the total supply. These cases are so few—and in most of them the existence of close substitutes from other areas or of other commodities greatly dilute the effects of the actions of what appears to be a large or dominant producer—that they may be ignored with impunity.
At the packer level, numbers are somewhat smaller. For some commodities, only the largest Producers can afford to operate their own packing-
ouses and most of the produce passes through commercial packinghouses. For others, farm packing requires little investment and is feasible for many growers. In Aroostook County, Maine, for instance, there were 1,300 packers of potatoes in one year, most of them growers.
The number of selling agencies in any shipping- point market is substantially smaller than the number of packers. Small growers in particular often find that selling is too time-consuming and specialized to handle themselves, and they fre- quently delegate the responsibility to a specialized selling agency, a cooperative, a broker, or a com- mission merchant in the terminal market. Except in the most narrowly-defined markets (in terms of geography and commodity specialization), the number of sellers generally remains fairly large with no one seller large enough to posesss signifi- cant market power. In addition, the tenuous connection between grower and selling agent over
time means that any market power which a seller may have at a given point in time may well be eroded away in a few years.
Recent studies in three shipping-point markets which are, in many ways, quite different—Cali- fornia deciduous fruits, Salinas lettuce, and Lower Rio Grande Valley tomatoes—aU lead to the same general conclusion: regardless of the number of sellers in the market, their behavior is essentially competitive {26) .^ Each seller attempts to differ- entiate his product and his services in some degree, but the number of possible dimensions is severely restricted and the extent of differentiation in any one of them quite limited.
An attempt, for instance, to offer the best apricots on the market will run into severe limi- tations from nature. It simply is not possible to produce the best apricots in the world year after year in one orchard—weather, insects, disease, or a shortage of skilled harvest labor will sooner or later occm*. In the end, the principal source of differentiation which the shipper has to offer is reliability—such as by packing a consistent quality imder his best label, shipping on schedule, and packing carefuUy. This is highly desirable but hardly unique. Few buyers will pay a premium for it; too many other sellers offer a generally similar package.
Thus, while each shipper typically has a regular group of buyers with whom he deals and each of the buyers has a regular group of shippers, these regular relationships confer no market power on either buyer or seller. Either can shift his busi- ness elsewhere with a minimum of effort. Many buyers purposely deal with several shippers, in order to have alternatives ready at hand, although they are usually thinking in terms of alternate sources if the desired quality is not available from one shipper. Similarly, many shippers maintain contacts with one or more brokers or commission merchants, sending them an occasional car even though it might not appear to be the most profit- able outlet at the moment in order to preserve the outlet for times when the regular customers are not buying for one reason or another.
^ JAMISON, JOHN A. ECONOMIC IMPLICATIONS OF THE STRUCTURE AND ORGANIZATION OF THE CALIFORNIA DE- CIDUOUS FRUIT INDUSTRY. 1962. Ph. D. thesis, Univ. Calif., Berkeley; SMITH, FRANK J. THE IMPACT OF TECHNOLOGICAL CHANGE ON THE MARKETING OF SALINAS LETTUCE. 1960. Ph. D. thesis, Univ. Calif., Berkeley.
113

Most incentives to maintain alternate sources or outlets arise from the variability in quality which nature imposes. No seller can afford to have commitments to supply something he does not have. No buyer can afford a commitment to accept whatever quality the shipper may have to offer. Each must maintain alternate sources or outlets to exist in the face of quality variation. It is somewhat incidental that this necessity also precludes any effective use of market power. Even the largest buyer in the country, who might be expected to have some market power at least in some situations, carefully spreads his purchases among a large number of suppliers. If he were to concentrate his purchases with one or a few suppliers in order to make them dependent upon him for an outlet and thus gain a bargaining ad- vantage, some day the vagaries of nature woiild force him either to accept inferior merchandise or to refuse it in such quantity as to bankrupt a shipper. Only a few examples of this would be necessary to warn other potential suppliers to avoid such a dependence.
The buyers at shipping-point markets are the firms at the wholesale level or their representa- tives, such as buying brokers or cash buyers (who perform the same general functions as buying brokers but take title to the produce). No wholesaler is large enough to possess significant market power when buying at shipping point. The largest wholesaler in the coimtry has less than 1 percent of the market. The three national chains as a group bought about 11 percent of the total supply. Their direct purchases were 8 percent of the total produce supply.
Thus, allowing for the fact that a given buyer might be somewhat stronger in one shipping- f)oint market than in others, the share of the argest single buyer might range from 1 percent
to somewhere between 5 and 10 percent in a given market. The largest buyer of Maine potatoes, a chain, accounted for 10.4 percent of the table potatoes shipped from that State during the 1959^ 60 season (ili). While this is large enough to command respectful attention from sellers, it is hardly enough to confer significant market power upon such a buyer. The study of the Lower Rio Grande Valley market confirms this: The price paid for tomatoes by two national chains averaged within 1 or 2 cents of that paid by all other buyers during the 1961 season.
Wholesale Markets Wholesale produce markets are essentially
competitive in nature, in terms of number and size of firms. The concentration of business is largely governed by the size of the market—in very small markets two or three primary handlers of modest size are all that the market can support. Larger markets have enough volume to maintain larger firms in business, but they handle smaller shares of the produce.
Even in the smallest markets where a small number of wholesalers would seem to have an opportunity to exploit their market power, they find it severely limited by potential competition from the smaller firms in the same market who seek an opportunity to grow and from whole- salers in nearby markets who would be happy to extend their business into additional cities. If the few firms in the market were to attempt to take advantage of their dominant position and raise prices and profits, competition would soon appear from one or more of these sources to bring prices back to competitive levels.
There is much partial segmentation of the mar- ket—in terms of commodity specialization, types of customers appealed to, and services offered— more in large markets than in smaU. Most firms specialize in one or two lines of business, defined in one or more of these terms. A substantial part of the change which has taken place in whole- sale markets in the postwar years has been due to the search by individual firms for newer, perhaps additional, areas of specialization. Many have changed the functions they perform or the type of customer catered to. Others have added other functions, such as prepackaging, delivery, or merchandising services. This, combined with the ease of entry into and exit from the wholesale produce business, makes for a fluid state of affairs.
However, we must be on our guard lest the pictm-e of ceaseless change comes to dominate oui* thinking. At the firm level, change is the domi- nating theme. In the market as a whole, at least some of the elements are more static. Total volume rises slowly. The volume sold by whole- salers—excluding direct purchases by retail or- ganization—has declined somewhat over the past 30 years. In one sense, perhaps the most important characteristic of the wholesale produce industry is the lack of strong innovating forces. Firms are essentially 1- or 2-man or family opera- tions. Only a few are really large-scale organiza- tions, and there are some signs that these are be- coming less important; witness the decline of chain or multiple-unit wholesalers. The strong drive for innovation in other industries populated by large corporations simply does not exist in the produce business. In general, it provides a comfortable living for its owners and managers, but it does not generate profits on a scale compar- able to that in many other industries. Thus, the necessity to find profitable uses for large amounts of capital through innovation is not present.
Product Differentiation Product differentiation exists in a sense, as
certain ^'marks" or labels have a reputation for consistent quality at a given level, whether the best possible, middle-of-the-grade, or somewhat lower. This type of product differentiation, if it can be called that, is effective only at the shipping point and wholesale levels, since the label is on the wholesale container in most cases. The existence
114

of this type of product differentiation contributes to the segmenting of the market into different quality levels—which is also done by U.S. and State grades to some extent—but it does not alter the compulsion to have nearly identical prices for a given quality level.
Only a small amount of product differentiation follows through to the consumer level in the form of prepackaged goods and some *'branding" of individual fruits such as oranges, avocadoes, and and cantaloups. The impact of these efforts at product differentiation upon the competitive process is relatively minor, since the consumer is conditioned to individual selection in fresh fruits and vegetables and has not become accustomed to relying on brand names.
Retail Markets The Elements of Competition
Food retailing is nearing the end of the transi- tion from dominance by the small, neighborhood grocery store (whether chain or independent, aflSil- iated or unaffiliated) to dominance by the super- market, although the bantam supermarkets and food discount houses may well play a significant role in rather specialized portions of the market.
In the neighborhood store era, the chains built their business on the basis of lower prices than those of their independent competitors. Inde- pendents were able to gain some of the economies of mass buying of the chains by joining the coopera- tive and voluntary groups which grew up, and through a lowering of wholesalers' margins. However, independent stores generally were not able to match the prices of the chains during that period.
The elements of competitive strategy today are somewhat different, both in kind and in relative importance. The degree to which each of these elements is available to each of the major types of firms and the skill with which management applies them will largely determine the structure and performance of the retail food market in the decade ahead. In broad terms, there are six elements of competitive strategy:
(1) The economies of mass buying. (2) The economies of internal distribution. (3) The economies of mass selling. (4) Ease of entry of new firms into food
retailing. (5) Private brands. (6) Merchandising policies.
Within each of these areas, there is a ''scale effect''; in other words, the degree to which a given organization can utilize each of these ele- ments of competitive strategy depends partly upon the size of the organization itself, as well-as upon the type of organization.
The economies of mass buying are of two types. First, economies obtained by buying in carload (or trainload) lots rather than in lots of 10 to 20
cases. This involves reduced costs of physical handling both for seller and buyer and reduced unit costs of buying and selling. Second, econo- mies obtained through increased bargaining power on the part of large retailers, the ability to manu- facture products themselves, or—perhaps more important—the ever-present unspoken threat to manufacture a product rather than to buy it from present sources. These economies are almost entirely a matter of scale—the larger the firm, up to some unknown point, the greater the economies of mass buying. Generally speaking, these econo- mies are available to all supermarket operators. The national chains have sufficient buying power to enjoy them in their own right. Regional and local chains can achieve a quite similar position through joint buying organizations formed by the chains. Independent supermarkets and small local chains can join cooperative or voluntary groups, which in turn may be affiliated with national organizations that buy for the member groups.
The economies of internal distribution (whole- sale handling) are largely a function of the size of the warehouse unit; that is, the volume of mer- chandise handled through the wholesale warehouse. Thus, the national chains with from 20 to 40 warehouse units each probably do not obtain significantly lower warehouse costs (including distribution to retail stores) than do large local chains or cooperative or voluntary groups with similar volumes per warehouse. Approximately equal levels of warehousing and distribution costs are availabe to almost every supermarket operator.
The economies of mass distribution at the retail level—lowering of costs by spreading the overhead and operating costs of the retail store over a large sales volume with rapid turnover— are almost entirely a function of the size of the individual retail store. In short, every super- market of a given size has essentially equal opportunities to reduce the costs of retail store operation.
The question of ease of entry of new firms into food retailing and its importance is widely debated in the retail food industry. Individual store sites have become important competitive factors. Shopping centers have become targets for the location of supermarkets. In turn, the reputation and ''drawing power" of the supermarket firm have become significant factors in the success of shopping centers. Generally speaking, chains which are important in the local market—whether they are national, regional, or local—and which have a large enough number of stores to spread the risk are more highly regarded by developers and financers of shopping centers as "drawing cards" than are the independent stores. Several chains have embarked on shopping center de- velopment programs of their own to control entry into strategic locations. By this means, they can prevent the location of more than one super- market in a shopping center, as often happens.
115

with the result of spUtting the business and raising the costs for all concerned.
Ease of entry is also closely related to the availability of financing. The large chain gener- ally has a wide variety of sources of credit, in- cluding retained earnings, sale of securities to the public, and many tjrpes of financial institutions. Many cooperative and voluntary groups have developed financing programs of their own which make these sources of credit available to potential operators of independent supermarkets. While sources of credit such as these may not entirely equalize opportunities for financing, they have certainly narrowed the gap materially.
Private brands under the retailer's or whole- saler's own label (as contrasted with the manu- facturers' brands) are a competitive tool in both buying and selling. Generally speaking, the retailer can obtain private-label merchandise to his own specifications at somewhat lower prices than he pays for comparable nationally advertised brands for two reasons: First, the manufacturer does not have the expenses involved in advertising and promoting his own brands; second, the bar- gaining power which the retailer possesses, just because the label is his own, enables him to buy his private-label merchandise from many different manufacturers, or he can manufacture it himself.
On the selling side, private brands furnish a merchandising tool. The operator may use it in different ways. Because he purchases private- label goods at a somewhat lower price than national-brand goods, he has the possibility of using them either as a promotional device or a margin-builder. If he chooses to use private brands as a promotional device, he will set a relatively low margin on the goods and use the resulting lower retail prices to attract business. Alternatively, he may choose to maintain the retail prices of private-label items close to those of national brands, gaining better-than-average mar- gins on these commodities and using other means to attract business. Private brands may be a means of attracting business, in some cases, through superior quality.
The availability of private brands to the indi- vidual retailer is chiefly a matter of buying power. If the firm is large enough, either alone or in combination, to obtain the economies of mass buying, it also can obtain private-label mer- chandise at competitive price levels. In addition, all firms have the alternative of buying unad- vertised manufacturers' brands which can be utilized hke other brands.
The elements of merchandising policy, in addi- tion to the use of private brands, are infinitely varied. An important element is advertising. Al- though other means are used by some operators with some success, generally speaking the basic method of communication with potential cus- tomers is through the daily newspapers. Volume of sales within the local market is the basic de- terminant of the cost of advertising per dollar
of sales (that is, the cost of a week's newspaper advertising divided by the firm's sales within that market) and, thus, of the usefulness of newspaper advertising to the firm. The substantial local chains are about on a par with regional and na- tional chains in advertising, but voluntary and cooperative groups operate at some disadvantage because of the necessity of agreeing on the items to be advertised and of setting uniform prices for all members of the group. Successful programs by some affiliated groups indicate that such co- operation is possible, but it requires a closely knit group of supermarkets with similar overall mer- chandising policies. In a number of cases, the sponsors of voluntary and cooperative groups have established separate groups, using different store names, to achieve this end.
The wide variety of goods available in today's supermarket is itself an element of competitive strategy. The potential shopper is attracted by the prospect of choosing from among 5,000 or more items. Management must balance the draw- ing power of wider variety against the lower rates of turnover to be obtained with additional com- modities, since the fast-moving items are already in the store. All types of firms are on an essen- tially equal footing as to the availability of any item they choose to stock. The limiting factors are the amount of shelf space available to hold the items chosen and the availability of capital to finance the additional stock.
The perishable commodities (meat and fruits and vegetables) play an important part in com- petitive strategy, serving as ''traffic builders." Shoppers quite generally appear to consider that dry groceries and household supplies will be avail- able in all supermarkets at similar, if not exactly equal, prices—with some differences because of the availability and relative price levels of private brands and the number and variety of items offered. Therefore, their decisions as to which store to patronize can be strongly influenced by their impressions of the quality and price levels of the perishables. For perishables, quality consid- erations are relatively more important than for other commodities, which are commonly assumed to be approximately equal in quality. The ''store image" in the mind of the shopper—the shopper's overall impression of the store and the class of customer patronizing it—appears to be influenced more by the quality and price of perishables than by any other factor {29).
In meats, the use of U.S. grades for beef puts retailers of all sizes and types on substantially equal footing in promotion (and in purchasing, except for advantages derived from volume buy- ing) , and has effectively offset the market power of the national meatpackers' brands {35). Broilers have been almost universally used as a traflâc builder, and have been featured, at prices which represent very low margins, by all types and sizes of retailers {IS),
116

Fresh fruits and vegetables also are in front rank of traffic builders, as attested by the location of the produce department in many supermarkets as the first department which the shopper enters. Freshness and appearance are the most important elements in buUding a quality reputation for the produce department. With almost no brands or grades at the retail level, fruits and vegetables are bought almost universally by inspection.
These elements of competitive strategy are utilized and combined difiFerently by each firm, attempting to make a somewhat unique appeal to the potential shopper and to attract a group of customers who wUl return week after week. Some stores make their strongest appeal to shoppers seeking economy—they try to offer the lowest general price level within the group of supermarkets available in a given market. Others make their appeal more on the basis of high quality—they offer the best merchandise available, even though at somewhat higher prices. Still others emphasize wide assortments of items, with gigantic stores, a maximum number of brands of each item, and extensive specialty-food departments.
All types of supermarkets are on substantially equal footing in the availability of these varied competitive strategies, or at least they can become so through affiliation with one type of organization or another.
Pricing Policies Typically, each chain sets a target margin for
each major department. The target for the produce department varies fairly widely among chains, depending partly on the overall target for the firm and partly on variations in the role which the produce department plays in creating the ''store image" and contributing to the profits of the firm. Only a few chains are concerned about being "competitive" on all items in the produce department. Most are concerned only about the general impression or ''image" which their prices create.
The decisions on pricing policy for specials—^the products to be advertised—and for other products
are not necessarily the same. The poHcy of the chain may range all the way from high prices both on specials and on unadvertised items to relatively low prices in both categories. Generally, a chain's ranlang in terms of price level will vary markedly between specials and other items. Some groups confine their advertising to mer- chandise at the same prices prevailing when those commodities are unadvertised. The variety of strategies available and used by supermarket groups is infinitely varied {14).
On the other hand, the chains pay a price for their size. This is especially evident in the field of pricing, where biu-eaucratic rigidities arising out of the difficulties of communication within a large organization and the need for financial controls make optimizing behavior—the setting of prices which would bring optimum returns to the firm in each area where it operates—well-nigh impossible to achieve. Prices are determined in the divisional office, where the price-makers are typically well informed about prices of competitors in the major market in which they are located. They are frequently less well or poorly informed on the competitive situation in the many other smaller markets throughout the division's trading area. Prices which are reasonably optimal in the central market may be indifferently so in the outlying cities {16),
Independent supermarkets and those of small chains typically are well informed of the selling prices of their major competitors, the larger chains—often through the efforts of the whole- salers who furnish them with price lists from the major chains. Their pricing decisions are made with the prices of their major competitors in mind. The decision as to which prices to meet depends partly upon the image which the manager is attempting to maintain—that he is "com- petitive" on price, or quahty, or both.
Small retailers generally can be characterized as price-takers or followers, although not in the sense that they attempt to meet the prices of the dominant chains. They typically deal with a different class of customer or a different type of business (the off-horn's business of those who do most of their shopping at a supermarket).
Prospects
The meaning of a study such as this is in the understanding of the past and the present de- rived from it and its use in looking to the future. It does not enable us to predict with certainty the path of future events, but it does increase greatly the probability that our view of what is yet to come is grounded more solidly in a knowledge of the facts and of the relationships which exist in these complicated markets. In this spirit, we look to the future.
The total volume of fresh fruits and vegetables marketed will depend largely on the success of the
marketers of processed fruits and vegetables in capturing an increasing share of the total fruit and vegetable market. Consumption of fruits and vegetables in all forms, both fresh and processed, probably will continue to rise as incomes rise {28). For many commodities, the share going into the fresh and processed markets has been fairly well stabilized, as new forms (especially frozen) be- came established {19), Further shifts, on the scale of the past 25 years, would appear to be likely only as new products are developed which are significantly more convenient or superior in
117

quality or flavor than those they attempt to replace. In many cases, such new products would have to compete with fresh fruit for eating out-of-hand or with fresh fruit or vegetables for salad use. The processes now in the development stage do not seem to offer much competition for this kind of market.
Considering all of these possibilities, it seems a reasonable prospect that the total volume of fresh fruits and vegetables marketed will continue to rise over the next decade or so at something like the rate of the last 25 years, or about one-third the rate of population growth.
The volume sold by wholesalers will be the total volume marketed less the amount purchased directly from shipping point by retail organiza- tions. In 1958, direct buying by retail organiza- tions amounted to about 20 percent of the total fruit and vegetable supply, and it has stayed at about that level since then. (Direct buying accounted for 26 percent of the supply entering wholesale markets, but very few retail organiza- tions large enough to buy directly are located outside of wholesale markets.) The volume of direct buying in the future wUl depend largely upon the structure of the retail market. If types of retail organizations which depend upon direct buying increase their share of retail sales, the share of the market handled by wholesalers will decline.
The national chains depend more upon direct buying than any other group, but their share of the retail food market has been virtually constant for 25 years. If it stays at about that level, as seems likely, they will not bring about an increase in the share of direct purchases. Most of the increase in direct buying in the past quarter century has been due to the greater number of regional chains. Some further increase seems likely in the next decade or two. Some large local chains wiU no doubt buy more directly from shipping point, but many of these will doubtless become regional chains by expanding into other markets and the net expansion in direct buying by this group will be small.
The affiliated groups seem almost certain to go into produce handling and direct buying in con- siderable numbers in the years ahead. At present, few retailer cooperatives or voluntary groups in the major markets handle produce. If these firms should decide to go into produce handling in considerable numbers, they could expand their direct purchases several-fold, although this would still represent a fairly small portion of the total supply.
There are some signs that the dominance of food retailing by the supermarket is weakening slightly. The emergence of discount house food seUing—both the discount food store and the food department in the discount house—has attracted much attention in the last few years. Probably equally important has been the growth in bantam food stores or superettes. Neither of these types of operations emphasizes perishables. Most of
their volume is in dry groceries and a few perish- ables such as milk and bread. Their produce sections, if any, generally are limited to a smaU number of fast-turnover items.
Specialty fruit and vegetable stores have grown in some areas, including a few chains of such stores. They make a strong quality appeal and compete mostly with supermarkets for produce business.
It seems unlikely that any of these types of stores will account for a major portion of food sales, but in total their share could be significant. None of them are in a position to buy much, if anything, directly from shipping point. They will all be dependent on the local wholesale market.
One additional sector of the market which is almost wholly dependent upon the wholesale markets for produce supplies is what is generally called the institutional market—niass-feeding estabhshments of all kinds including hotels, restaurants, industrial-feeding facilities, trans- portation agencies, and public and private institu- tions. This market is growing as a share of the total food market and is expected to continue to grow at a faster rate than the at-home market. These institutional outlets use more processed fruits and vegetables and less in fresh form than do households on the average. Such purchases of fresh produce as they make are almost entirely from focal wholesalers. Only a handful of res- taurant chains are large enough to buy directly from shipping point. Growth in this market will probably be mostly in salad vegetables, but the expansion here couy be fairly significant, par- ticularly if the art of restaurant salad-making in the rest of the country should advance to the level found in many West Coast restaurants.
Evaluating these somewhat divergent trends, it seems evident that there is a tendency to a somewhat more diverse market at the retail level than that which prevailed during the late 1950's. The supermarket will no doubt continue to be the dominant type of food retailer for many years to come, but here, too, there may be more diversity as supermarket owners—chain, affiliated, and independent—seek to differentiate their product and services from those of their competitors.
The impacts of all this on the volume of produce purchased directly from shipping point are not easily evaluated. The contradictory trends in the retail scene seem to indicate some conserva- tism in predicting the growth of direct buying. An estimate of growth from the present one-fifth to something in the neighborhood of a third in 10 or 15 years seems consistent with the prospects for the various types of retailers. This, of course, suggests a nominal dechne in the total volume handled by wholesalers over that period.
As the total volume handled by wholesalers gradually declines, there will be some additional pressure on the sales volume of individual firms. In markets with rapidly increasing population, the pressure will not be felt. In those where
118

population is growing slowly, it will be more acute. The lower costs associated with larger scale operations will increase the pressure on small firms. For many of these firms, the owners will face the choice of accepting reduced returns for their labor and management inputs or going out of business. Probably a good part of this reduc- tion in niunber of firms will be accomplished by firms going out of business as their owners reach retirement age. The disadvantages of small wholesalers may also be increased somewhat as the number of small customers, especially neighbor- hood grocery stores, are further reduced.
The functions of wholesalers will tend towards more specialization. Some of this has already taken place, for example, the shift in the kinds of fruit handled by the auctions and the increase in centralized prepackaging. Another indication is the growth of service wholesalers, providing a specialized type of service to supermarkets. These kinds of specialization of functions seem likely to increase in importance. The traditional function of the wholesaler—buying large lots and breaking them down into smaller, retail-sized lots—^wul become less important as these other services assume a more important role.
One type of wholesaling which has shown marked expansion in the postwar period is truck jobbing. In many areas, truck jobbers have virtually taken over distribution to smaller grocery stores and restaurants. This is especially true in smaller cities and towns where small wholesalers are often no longer found. Some further expansion in this type of business in areas of this kind is quite possible.
The share of the total volume of fruit sold by the auctions will probably continue a slow decline for a number of years. There may be a further decline in the number of such auctions, continuing the trend of the past 40 years.
A corollary of the changed role of the auctions as sales agencies for fruit is found in their role in price making. During earlier periods, when most fruit was sold through the auctions, auction sales set the price level for the entire crop, since supply and demand conditions on the auction markets were generally representative of those throughout the country. As the auctions became less im- portant in the mass distribution of fruit, they became less representative of price-making condi- tions over the entire Nation, and the price-forma- tion function has gradually shifted back to the
shipping-point level. This shift has created prob- lems ana will probably continue to accentuate them, since shipping-point markets do not provide the convenient locus of supply and demand forces in one location at one time which was provided by auction markets. Shipping-point markets are spread out over much larger areas—buyers and sellers are physically separated, perhaps by several thousand miles—so the price-making function has become more diffused.
The market news problem of finding out what the price is becomes much more diflicult; a need develops for many more kinds of market informa- tion so that buyers and sellers—who are much more isolated than before—can make better de- cisions as to market conditions and the appropriate prices at which to transact their business.
As the size of the retail operations increases and a larger proportion of total supplies are bought directly from the shipping point, the demand for a more uniform product will increase. The size of the lot piu-chased by an individual organization wiU increase, on the average. It wiU be increas- ingly diflScult to dispose of variable lots, small lots, and lots of odd size, grade, color, and other char- acteristics. This seems to indicate an increasing emphasis on large packing and shipping opera- tions—each one large enough to put up uniform lots to meet the specifications of some part of the market. The packer or shipper whose volume is small or whose quality and pack are variable will find it increasingly difficult to dispose of his product at profitable prices.
Markets may tend to become more segmented. In other words, as more buyers begin to buy di- rectly, the first step for many will be to locate a small number of shippers in each area with whom they can reach an understanding on quality, and to buy most of their requirements from these shippers. Thus, shippers will tend to become identified with a relatively small number of buyers, and vice versa. While this wiU simplify the problem of '^finding a market," it wiU tend to divide the total market for a given commodity into many submarkets which are less closely connected.
If this analysis is correct and the general trend is toward a more segmented or specialized market, the choice facing many growers, packers, and shippers in the years ahead seems to be that of choosing the particular market which each can best serve and concentrating more and more upon it.
119

Literature Cited (1) ADELMAN, M. A.
1959.
(2) BAUM, H. A
A. & p. A STUDY IN PRICE-COST BEHAVIOR AND PUBLIC POLICY. Harvard Econ. Stud., Vol. 113. Cambridge, Harvard Univ. Press. 537 pp.
1930.
(6)
CHAIN STORE METHODS OF BUYING FRESH FRUITS AND VEGETABLES. Jour. Farm Econ. 12(2): 280- 282. April.
(3) CALIFORNIA FRUIT EXCHANGE. 1939. ANNUAL REPORT, 1938. Sacra-
mento. (4) CLARK, JOHN MAURICE
1961. COMPETITION AS A DYNAMIC PROC- ESS. Washington: The Brook- ings Institution, 501 pp.
(5) CROW, WILLIAM C. 1938. WHOLESALE MARKETS FOR FRUITS
AND VEGETABLES IN 40 CITIES. U.S. Dept. Agr. Cir. 463, 142 pp., illus.
C, CALHOUN, W. T., and PARK, J. W. 1940. THE WHOLESALE FRUIT AND VEGE-
TABLE MARKETS OF NEW YORK CITY. U.S. Dept. Agr., 123 pp., illus.
(7) DUN and BRADSTREET, INC. 1941-1949. DUN'S STATISTICAL QUAR-
TERLY REVIEW.
(8) ERDMAN, HENRY E. 1928. AMERICAN PRODUCE MARKETS.
Boston: D.C. Heath and Co., 449 pp., illus.
(9) FRENCH, BEN C, AND BRESSLER, RAYMOND G. 1962. THE LEMON CYCLE. Jour. Farm
Econ. 44(4): 1021-1036.
(10) GARDNER, KELSEY B. 1938. TERMINAL FRUIT AUCTIONS AS
MARKETING AGENCIES FOR FARMERS' COOPERATIVES. U.S. Farm Credit Admin. Bui. 29, 90 pp., illus.
(11) GERREALD, T. N. 1939. AN ECONOMIC STUDY OF FRUIT
AND VEGETABLE WHOLESALING
AND JOBBING FIRMS IN NEW YORK CITY. N.Y. (Cornell) Agr. Expt. Sta. Bui. 721, 67 pp.
(12) GESSNER, ANNE L. 1961. STATISTICS OF FARMER COOPERA-
TIVES, 1958-59. Farmer Coop. Serv., Gen. Rpt. 93, 88 pp., illus.
(13) GRAY, LEO R. 1963. RETAIL PRICE SPECIALS FOR FRY-
ING CHICKENS IN SELECTED U.S. CITIES, 1960-61. U.S. Dept. Agr., Econ. Res. Serv., ERS- 101, 20 pp., illus.
(14) GRAY, ROGER W., AND ANDERSON, ROICE. 1962. ADVERTISED SPECIALS AND LOCAL
COMPETITION AMONG SUPER- MARKETS. Food Research In- stitute Studies 3(2): 125-140. May.
(15) HEDDEN, W. P. 1923. A STUDY OF THE FRUIT AND VEGE-
TABLE TRAFFIC MOVEMENT WITH- IN THE PORT OF NEW YORK DISTRICT. U.S. Bur. Agr. Econ. in cooperation with Port of New York Authority, 45 pp.
(16)
(17)
(18)
(19)
(20)
(21)
(22)
(23)
(24)
(25)
(26)
(27)
(28)
(29)
(30)
HoLDREN, BOB R. 1960. THE
HOPPER, W. C.
1934.
STRUCTURE OF A RETAIL MARKET AND THE MARKET BE- HAVIOR OF RETAIL UNITS. Engle- wood Cliffs, N.J.: Prentice-Hall, Inc., 203 pp.
AN ECONOMIC STUDY OF THE MAR- KETING OF CERTAIN PERISHABLE FARM PRODUCTS IN ALBANY, NEW YORK. N.Y. (Cornell) Agr. Expt. Sta. Bui. 585, 61 pp.
MCKAY, A. W., AND OTHERS.
1926. MARKETING FRUITS AND VEGE- TABLES. U.S. Dept. Agr. 1: ear- book 1925: 623-710, illus.
MANCHESTER, ALDEN C, AND PODANY, JOSEPH C.
1958. SHIFTS IN SUPPLY AREAS AND CON-
SUMPTION RATES FOR VEGE-
TABLES, 1939 TO 1955. U.S. Agr. Mktg. Serv., Mktg. Res. Rpt. 221, 30 pp.
MILLER, ADMER D., AND HAUCK, CHARLES W.
1925. AMERICAN FRUIT AND PRODUCE AUCTIONS. U.S. Dept. Agr. Bui. 1362, 36 pp., illus.
THE PACKER PRODUCE MERCANTILE AGENCY.
1939. THE PACKER RED BOOK. (Also 1948 ed.)
THE PACKER PUBLISHING COMPANY. 1958. FRESH YEARBOOK ISSUE THE PACK-
ER. Part II (May 31). PARK, J. W.
1932.
PERRY, ALVAH. 1962
AMERICAN FRUIT AND VEGETABLE AUCTIONS. U.S. Dept. Agr. Cir. 250, 47 pp., illus.
SHIPPERS AND RECEIVERS OF MAINE TABLE POTATOES. Maine Agr. Expt. Sta., Misc. Pub. 654, 23 pp. October.
PHILLIPS, R. G., ASSISTED BY FRASER, SAMUEL. 1922. WHOLESALE DISTRIBUTION OF FRESH
FRUITS AND VEGETABLES. The Joint Council. 256 pp., illus. July.
PoDANY, JOSEPH C, AND FARRISH, RAYMOND O. P. 1963. TOMATO PRICES AND MARKET STRUC-
TURE IN THE LOWER RIO GRANDE VALLEY. U.S. Econ. Res. Serv., Mktg. Res. Rpt. No. 588, 23 pp.
RASMUSSEN, MARIUS P. 1929. SOME FACTS CONCERNING THE DIS-
TRIBUTION OF FRUITS AND VEGE- TABLES BY WHOLESALERS AND
JOBBERS IN LARGE TERMINAL MARKETS. N.Y. (Cornell) Agr. Expt. Sta. Bui. 494, 115 pp.
ROCKWELL, GEORGE R., JR. 1959. INCOME AND HOUSEHOLD SIZE.
THEIR EFFECTS ON FOOD CON- SUMPTION. U.S. Agr. Mktg. Serv., Mktg. Res. Rpt. 340, 152 pp.
ScHAPKER, BEN L.
1961. 1961 SURVEY OF SUPER MARKET SHOPPERS. THEIR BUYING HAB- ITS AND ATTITUDES. 8th AuUUal Report by Burgoyne Index, Inc., 48 pp. October 12.
SHERMAN, WELLS A. 1928. MERCHANDISING FRUITS AND VEGE-
TABLES. A NEW BILLION DOLLAR INDUSTRY. 499 pp. Chicago and New York: A. W. Shaw Company.
120

(31) SMITH, ROY J. 1961. THE LEMON PRORATE IN THE LONG
RUN. Jour. Polit. Econ. 69(6): 573-586.
(32) U.S. BUREAU OF THE CENSUS. 1929-61. U.S. CENSUS OF BUSINESS: 1929;
1935; 1939; 1948; 1954; and 1958. Washington, D.C.
(33) U.S. FEDERAL TRADE COMMISSION. 1938. REPORT OF THE FEDERAL TRADE
COMMISSION ON AGRICULTURAL IN- COME INQUIRY. PART II. FRUITS, VEGETABLES, AND GRAPES. 906 pp. PART III. SUPPLEMENTARY REPORT. 154 pp. Washington, D.C.
(34) U.S. FEDERAL TRADE COMMISSION.
1960. ECONOMIC INQUIRY INTO FOOD MAR- KETING. PART 1. CONCENTRA- TION AND INTEGRATION IN RE- TAILING. Washington, D.C, 338 pp.
(35) WILLIAMS, WILLARD F., BOWEN, EARL K., AND GENOVESE, BRANK D.
1959. ECONOMIC EFFECTS OF U.S. GRADES FOR BEEF. U.S. Agr. Mktg, Serv., Mktg. Res. Rpt. 298, 199 pp., illus.
Appendix: Definitions of Terms General Terms
Agents and brokers.—A classification used in the Census of Business, generally similar to "Brokers and Agencies," except that Commission Merchants are included by the Census. Direct purchases from shipping point.—Purchases by the buying firm from sellers located at a shipping point. Direct receipts from shipping point.—Receipts of produce directly from shipping point, including both direct pur- chases from shipping point and purchases from brokers, sales agencies, and others in the terminal market where the actual shipment is made directly to the first receiver. Firm.—The firm in this study is a separate business operation. It does not necessarily coincide with the legal or other definition of the firm. For example, a single corporation which operated a prepackaging plant and a receiving operation generally would be treated as two firms in this study. The relationships between the two firins so defined is indicated under interfirm relationships. This type of definition permits us to treat different types of operations as relatively pure single-function firms, rather than trying to handle multiple operations as a single firm which does not fit in any category. Market.—The standard metropolitan statistical area or, if one has not been defined, the county in which the city is located. For New York and Chicago, the standard consolidated area. Merchant wholesaler.—A classification used in the Census of Business, generally similar to ''Wholesale Handler," except that Commission Merchants are not included by the Census. Net supply.—Total quantity of produce received in a market, excluding sales which bypass the market and imported produce sold outside the market. Net supply for resale.—Net supply less direct purchases from shipping point by chains and other retail organiza- tions. Produce.—Used interchangeably with "fresh fruits and vegetables."
Size of Firm Large firms.—Those selling 500 or more carlots of produce annually. Medium firms.—Those selling 200 to 499 carlots of produce annually. Small firms.—Those selling less than 200 carlots of produce annually.
Types of Firms Wholesale handlers.—Firms which physically handle the merchandise. Primary handlers:
Receiver.—Purchases produce for own account usually in full carlots or trucklots. Direct receipts
from shipping point account for more than half of his purchases. Performs the physical functions of unloading and handling in his own facilities, on team track, or at the terminal. More than half of his sales are to other wholesalers, chainstore warehouses, or processors. Commission merchant.—A receiver who handles more than half his volume on consignment from growers or shippers. Receiver-jobber.—Direct receipts from shipping point are more than half of his purchases. More than half of his sales are to retail stores and institu- tional outlets. Receives and handles produce in his own warehouse or store. Commission wholesaler.—A receiver-jobber who handles more than half of his volume on consign- ment from growers or shippers, often nearby growers. Service wholesaler.—A receiver-jobber who per- forms at least two additional services for his cus- tomers, the retail stores, such as suggesting retail prices, training produce personnel, and assisting with advertising and merchandising. Wholesale grocer.—A receiver-jobber or service wholesaler whose main line is dry groceries and who does not sponsor a voluntary group or retailer cooperative.
Secondary handlers: Jobber.—Purchases more than half of his volume from wholesale handlers in the local market. Sells more than half of his volume to retail stores and institutional outlets. Handles the merchandise through his own store. Jobber (delivery).—A jobber who delivers more than half of his volume to his customers. Banana jobber.—Considered a special case and classified as a jobber even though he is usually the first receiver in the market. He ripens, cuts, and boxes bananas. Service Jobber.—A service wholesaler who buys more than half of his volume from local wholesale handlers. Secondary wholesaler.—A wholesaler who buys from local wholesale handlers and resells to other wholesalers, such as jobbers and truck jobbers. Handles the merchandise and takes title. Truck Jobber.—A jobber who conducts his business from his truck. Although he does not sell from a store, he usually has a regular customer route, and delivers on a fixed schedule. Purveyor.—A jobber who sells more than half of his volume to hotels, restaurants, and institutions. Receiver-purveyor.—A purveyor who receives more than half of his volume directly from shipping point. Prepackages—Prepackages more than half the volume sold in consumer packages. Tomato repacker.—Ripens, sorts, and packages tomatoes.
711-059—64 9 121

Shippers and truckers: Mixed-load shipper.—Buys in'the terminal market and takes title. Ships full loads (mostly truck- loads) to wholesalers and chains in other markets. L.c.l. shipper.—Buys in the terminal market and takes title. Ships less-than-carload lots to whole- salers and chains in other markets. Packer-shipper.—Receives products directly from farms, packs, and ships. Most such firms are located in the country, but a few are found in markets such as Los Angeles. Only those who buy some produce from other wholesalers are included in this study. Merchant trucker.—A trucker who buys at shipping point or in other markets, and then hauls his produce in his own truck to the terminal market where he maintains a store or warehouse. Itinerant trucker.—A trucker who does not maintain a store or warehouse. Usually, he buys on specu- lation and hauls to another city where he hopes to resell at a higher price. He may operate as a for- hire trucker at one time and as an itinerant trucker at another time.
Importers and exporters: Importer.—Imports produce from foreign countries and takes title. Commission importer.—An importer who operates on a commission or agency basis. Exporter.—Buys produce on his own account or as an agent and ships to foreign countries, or to noncontiguous areas of the United States (for example, Alaska, Hawaii, or Puerto Rico).
Retail organizations: Corporate chains:
National chain.—The three largest chains with warehouse distribution areas over more than half of the country. Regional chain.—A corporate chain organization with two or more warehouse distribution areas. Local chain with warehouse.—A corporate chain with only one warehouse distribution area. Local chain without warehouse.—A local chain which does not operate its own produce warehouse, although it almost always operates a dry grocery warehouse. Voluntary group.—A group of retail stores sponsored by an independent wholesale grocer. Retailer cooperative.—A wholesale operation owned by member retailers.
Brokers and agencies.—Firms which do not physically handle the merchandise, although^they may arrange for such physical handling by ^others. Brokers and distributors: -^M
Selling broker.—Negotiates sales on behalf of a number of shippers, but does not take title and does not physically handle the merchandise. Auction representative.—A selling broker, more than half of whose business is on the fruit auction as a shipper's representative. Terminal broker.—Operates like a selling broker except that he represents buyers rather than sellers, and collects his fee from the buyer. Carlot distributor.—Buys and sells fuU carlots and takes title. He may do some brokerage business as well. He does not physically handle the merchandise. Distributor.—Buys full carlots or trucklots. Sells in l.c.l. quantities to wholesalers, chainstores, and others. Does not physically handle the mer- chandise, but sells out of car, either before or after receipt. May do some brokerage business as well.
Sales agencies: Cooperative sales agency.—Salaried representative of a farmer cooperative in the terminal market; does not physically handle produce. Importer's sales agency.—Salaried representative of an importer (usually a banana importer) in the terminal market; does not physically handle produce.
122
Others: Buying broker.—Buys in l.c.l. lots in the terminal market, including the fruit auction, for out-of-town wholesalers and chains or for local retailers. May arrange for loading and shipment, but does not handle the merchandise himself. In some cases, he may accept the billing for the merchandise (especially when buying for foreign customers, usually Canadian), but this is done as a conven- ience for the buyer. Buying office.—A salaried buyer for an out-of-town wholesaler or chain. Arranges for loading and ship- ment but does not handle the merchandise himself. Sales agent.—An independent selling agency for wholesaler, who receives a commission on sales made for the principal. Typically, a one-man operation selling for a purveyor. Auction.—A terminal market fruit auction, which acts strictly as a service agency, providing facilities and organization for selling, and handling the merchandise (or arranging for such handling) but having no financial interest in the merchandise.
Terms of Purchase F.o.b. shipping point.—The produce is placed free on board in "suitable shipping condition" and the buyer assumes all risk of damage and delay in transit not caused by the shipper. The buyer shall have the right of inspection at destination before the goods are paid for, but only for the purpose of determining that the produce shipped complied with the terms of the contract or order at time of shipment. Cash track.—Same as "f.o.b. shipping point," except that the buyer is expected to make immediate payment, either in cash, or by check, or by funds wired to the seller. F.o.b. acceptance.—Same as "f.o.b. shipping point," except that the buyer assumes full responsibility for the produce at shipping point and has no right of rejection on arrival. The buyer's remedy is by recovery of damages from the shipper and not by rejection of the shipment. F.o.b. acceptance final.—The buyer accepts the produce at shipping point without recourse.
Suitable shipping condition.—In relation to direct shipments, it means that the commodity, at time of billing, is in a condition which, if the shipment is handled under normal transportation service and conditions, will assure delivery without abnormal deterioration at the destination specified in the contract of sale.
When shipping-point inspection is utilized for f.o.b. shipments, one of the following requirements is substituted for "suitable shipping condition." Shipping-point inspection.—The seller is required to obtain Federal or Federal-State inspection, or such private inspection as has been mutually agreed upon, to show the compliance of the lot sold with the quality, condition, and grade specifications of the contract, and that the seller assumes the risk incident to incorrect certification. Shipping-point inspection final.—Same as "shipping- point inspection," except that the buyer assumes the risk incident to incorrect certification and is without recourse against the seller because of quality, condition, and grade. Subject approval wired Government inspection.— Same as "shipping-point inspection," except that the seller is required to correctly communicate, by wire or other agreed means, the statements on the certificate as to quality, condition, and grade, and other essential information, whereupon the buyer upon approval thereof, will be deemed to have accepted the produce without recourse against the seller because of quality, condition, and grade.
Delivered sale.—Means that the produce is to be delivered by the seller at the market in which the buyer is located, or at such other market as is agreed upon, free of any and all charges for transportation or protective service. The

seller assumes all risks of loss and damage in transit not caused by the buyer and the produce must meet all the requirements as to quality, condition, and grade. Price arrivai.—In the absence of a contrary specific under- standing, the produce is shipped either direct to the cus- tomer or to an agent of the shipper, for the benefit of the customer, the price subject to agreement between the customer and the shipper upon the arrival of the produce at the customer's destination, with sufficient time being permitted for inspection. F.o.b. inspection and acceptance arrival.—The produce is placed free on board at shipping point, the cost of trans- portation to be borne by the buyer, but the seller to assume all risks of loss and damage in transit not caused by the buyer, who has the right to inspect the goods upon arrival and to reject them if they are found not to meet the speci- fications of the contract of sale at destination. Such a sale is f.o.b. only as to price and is on a delivered basis as to grade, quality, and condition. F.o.b. sale at delivered price.—Means the same as f.o.b., except that transportation charges from shipping point to destination shall be borne by the seller; that is, the sale is f.o.b. as to grade, quality, and condition, and delivered as to price. Joint account.—A special, equal partnership in profits and losses between a shipper and a receiver. The shipper partner purchases, loads, and ships to the receiver partner
who sells to the best advantage in his market on arrival (or in other markets if so agreed in advance). The shipper is responsible for payment of purchases at shipping point and the receiver for collection at destination. The partners share equally in the costs of the produce, transportation, and other costs; they also share equally in profits or losses.
Marketing Costs and Margins Sales.—Net sales=gross sales less returns. Cost of goods sold.—Delivered cost, including incoming freight and terminal charges. Gross margins.—Sales minus cost of goods sold. Salaries and wages.—Including salaries of corporation officers but not returns to partners and proprietors. Other costs.—All other costs except salaries and wages, incoming freight, and terminal charges. Total costs.—Salaries and wages plus other costs. Net Income.—Gross margins minus total costs; includes returns to partners and individual proprietors and profits of corporations. Corporate income tax.—Federal income tax paid by corporations. Net income tax after tax.—Net income minus corporate income tax.
123

Index Adelman, M. A., 120 Advertising, by retailers, 116 Agents and brokers, dg/., 121 Anderson, Roice, 120 Armentrout, W. W., iii Assembling loads, 45 Atkins, Paul A., iii Auction
buyers and sellers, 34 def., 122 See also fruit auctions representative, def.j 122
Banana jobber, def., 121 processing, by retail organizations, 66 See also prepackaging
Bantam food stores, prospects for, 118 Baum, H. A., 120
See also prepackaging Bird, Kermit, iii Bohall, Robert A., iii Bonucelli, Priscilla, iii Bowen, Earl K, 121 Boyer, Jere, iii Branch, G. V., 1 Bressler, R. G., 120 Brokerage
and commission rates, 89-91 services, changes in, 110
Brokers and agencies, def., 122 and distributors, by firm size and
market type, 13 buying through, by wholesalers, 57 defs., 122
Buyers at shipping point, 114 Buying broker
at shipping point, 3 def., 122
Buying functions by firm type, 35 by market type, 50
Buying methods from local farmers, of retail organiza-
tions, 70-72 from local growers, of wholesalers, 57 from shipping point, of retail organiza-
tions, 72 of retail organizations, 67 of wholesalers, 53
uying office, def, 122 organizations, of retail organizations,
68 practices, of retail organizations, 74 through brokers, by retail organiza-
tions, 74 through brokers, by wholesalers, 57
Ihoun, W. T., 120 lifornia Fruit Exchange, 120 lel, George L., iii -door sale, price-making in, 94 ot lying operations, of retail organiza- tions, 69
Carlot—Continued distributor, def., 122 sales, see also Selling functions
Carlots per employee, by firm type and size, 85
Cartage, 39 Cash track
def., 122 purchases, 56
Chain wholesalers, 19 Chains, 59
by size, 60 growth of, 99 in the marketing system, 97 in the structure of the retail market,
99 Changes, planned by wholesalers. 111 Channels, marketing
see Marketing channels Chapman, W. Fred, Jr., iii Charges, marketing
see Marketing charges Clark, John M., 120 Classification of firms, 2 Commercial farms, 2 Commission
importer, def., 122 merchant, def., 121 merchants, sales of, changes in, 103 rates, see also Brokerage and commis
sion rates wholesaler, def., 121
Commodity-line sales, of produce whole salers, 15
Commodity specialization, 14 by firm size, 18 by market type, 19
Competition, elements of, in retail markets, 115
nature of, 113 in shipping-point markets, 113 in wholesale markets, 114 in retail markets, 115
Concentration, and market size, 14 Consignment purchases, 53
from local growers, by wholesalers, 58 Consignment selling, changes in, 110 Consumption, prospects for, 117 Cooperatives, farmer, 4 Cooperative sales agency, def., 122 Corporations, 22 Corporate
chains, defs., 122 income tax, def, 123
Costs and margins, by firm type, 79 by firm type, Boston, 83 by firm type and size, 81 marketing, defs., 123
Costs, margins, and efficiency, 77 Cost of goods sold, def., 123 Credit
by market type, 52 customer, 44-45
Crow, William C, 120 Customer credit
see Credit, customer
Customers, regular see Regular customers
Decentralization in purchasing, chains, 69
Definitions of terms, 121 Delivery by
firm size, 42 firm type, 41
Delivered sale, 56, 73 acceptance and inspection final, 56 def, 122
Diffuse markets, price variability at, 96 price-making in, 95
Direct buying, by retail organizations, and the terminal market, 76 growth of, 100
Direct purchases by firm type, 28 from shipping point, def., 121 by retailers, prospects for, 118 of retail organizations, 72
by firm size and type, 68 of wholesalers, 53
methods, 54 Direct receipts
from shipping point, def., 121 of retail organizations, factors af-
fecting, 76 Discount house food selling, prospects
for, 118 Distributor, def., 122 Dumas, James W., iii Dun and Bradstreet, Inc., 120
Efficiency, 77 Employees, number, by firm type and
size, 83 Entrance and exit of wholesalers, 106 Entry, into retailing, ease of, 115 Erdman, Henry E., 120 Exit of wholesalers, 106 Exporter, def., 122 Exports, 3
Failures, business, of wholesalers, 107 Farmer cooperatives, 4 Farms, 3 Farris, Donald E., iii Farrish, Raymond O. P., 120 Federal grades
see Grades Field buyers, of retail organizations,
69, 72 Fill-ins, of retail organizations, 76 Financing, 45
availability to retailers, 116 Firm, def, 121 Firms, number, size and type, 8
changes in, 102 Firms, number in wholesale markets by
type, changes in, 104 Firms, sales volume by size and type, 10 Firm size, 8
and market size, 14 and market type, 13 def, 121
125

Firm type, 2, 8 def., 121
F.o.b. acceptance def., 122 final, def., 122 purchases, 56, 73
F.o.b. inspection and acceptance arrival, def., 123
F.o.b. sale at delivered price, 56 def., 123
F.o.b. shipping point def., 122 f.o.b. inspection and acceptance ar-
rival purchases, 56, 73 purchases, 56, 73 shipping point inspection final pur-
chases, 56 shipping point inspection purchases,
56 subject approval wired Government
purchases, 56 Form of organization, legal, 22 Fowler, Mark, iii Fraser, Samuel, 120 French, B. C, 120 Fruit auctions, 50
def., 122 changes in role. 111 changes in sales. 111 closing of, 93 number of buyers, 93 price-making in, 93 price variability at, 95 prospects for, 119
Functions of brokers and distributors, 46 of different types of markets, 49 of wholesalers, 35
prospects for, 119 performed by retail organizations, 62
Gardner, Kelsey B., 120 Genovese, Frank D., 121 Gerreald, T. N., 120 Gessner, Anne L., 120 Grades and quality specifications,
of retail organizations, 75 of wholesalers, 57
Gray, Leo R., 120 Gray, Roger W., 120 Grocery wholesalers, 4
selling produce, by region, 6 selling produce, changes in, 104
Gross margins, def., 123 Grower-shipper, 3 Growth
and decline, of wholesalers, 107 of total market, 97
Gunnelson, Jerry, iii
Hanes, John K., iii Hauck, Charles W., 120 Hedden, W. P., 120 Hodges, D. C., iii Holdren, Bob R., 120 Hopper, W. C., 120 How, R. Brian, iii
Importer, def., 122 Importers and exporters, defs., 122 Importer's sales agency, def., 122 Imports, 3, 50 Imformation,
market, use in price making, 95 Inspection, 45
use by retail organizations, 76 Institutional market, prospects for, 118 Interfirm relationships, 19
Internalî'distribution, economies of, retail organizations, 115
Itinerant trucker, def., 122
Jamison, John A., 113 Jewett, L. J., iii Jobber
def., 121 (delivery), def., 121
Joint account, def., 123
Lambert, Roy E., iii Lamborn, Ellis, iii Large firm, def., 121 L.c.l. shipper, def., 122 Legal form of organization, 22 Loans for production, 45 Local
chains, 59 chain with warehouse, def., 122 chain without warehouse, def., 122
Location of merchandise when interest acquired,
49 of merchandise when sold, 49
Lundquist, Dorothy L., iii
Macomber, Alvin Z., iii Manchester, Alden C., 120 Manley, William T., iii Margins, 77
for fresh fruits and vegetables, 78 per carlot, by firm type and size, 86 See also Cost and margins target, 92,87 target, by firm type and size, and
realized margins, 89, 91 unit, by firm type and size, 85
Marion, Donald, iii Market
def., 121 information
see Information, market news problem, changes in, 119 share, and market size, 14 shares, of retail organization, by
market type and firm type, 60 shares, of retail organizations, changes
in, 99 size, and concentration, 14 size, and firm size, 14 type, and firm size, 13 type, characteristics, 7 type, firm type in, 11
Marketing bill for fresh fruits and vegetables,
77,78 channels, 22 charges in different types of markets,
86 Markets studied, 5 Mass
buying, economies of, 115 distribution at retail level, economies
of, 115 McKay, A. W., 120 McNeel, Huida, 100 Medium firm, def., 121 Merchant, Charles H., iii Merchant
trucker, def., 122 wholesaler, def., 121 wholesalers selling produce, 4
Merchandising '% policy, of retailers, 116 f services, 46, 47, 48
services, by market type, 52 Miller, Admer D., 120 Miller, Clarence J., iii
Mixed load shipper, def., 122 loads, changes in, 102
Mueller, W. F., iii
National chain, def., 122 chains, 59
Net income after tax, def., 123 income, def., 123 supply, def., 121 supply for resale, def., 121
Nightingale, Fred S., iii Number
size and type of firms, 8
O'Neal, George B., iii Operating
expenses, by sales size, 82 Organization
legal form of, 22 Other
costs, def., 123 secondary markets, characteristics, 7 tertiary markets, characteristics, 8
Outlets changes in, 110 sales
see Sales outlets Outlook
of wholesalers, 111 Out-of-car sales, 39 Out-of-town sales
see Sales, out-of-town Ownership
or control by other firms, 19
Packer, 3 Produce Mercantile Agency, 120 Publishing Company, 120 shipper, def., 122
Packing sheds, owned by chains, 68
Park, J. W., 120 Partnerships, 22 Payment
time on direct purchases by whole- salers, 57
Payroll, by sales size, 82
Perkins, Fred A., iii Perry, Alvah, 120 Phillips, CD., iii Phülips, R. G., 120 Physical handling functions, 38
by market type, 51 other, 42 retail organizations, 65
Pittman, J. F., iii Podany, Joseph C, 120, iii Ports of entry, 50 Potatoes, track sale of, 94 Prepackager, def., 121 Prepackaging,
as a merchandising practice, 66 custom, for retail organizations, 66 repacking and processing, 41, 43 repacking and processing, by reta
organizations, 65 warehouse, by retail organization^
growth of, 101 Price
arrival, def., 123 ^ arrival purchases, 56, 73 determination, methods, by r
organizations, 74 making process, 92 ^ making system, 93
126

Price—Continued variability, 95
factors affecting, 96 Prices
of local produce, 72 Pricing
policies, retail, 117 quoted-price, 92 supply-and-demand, 92
Primary handler, de/., 121 handlers, by firm size and market
type, 13 markets, characteristics, 7
Private brands, 116 sale markets, changes in number of,
102 Problem commodities, 76 Processing banana
see Banana processing Procurement
practices, of wholesalers, 55 Produce
def., 121 Product differentiation, 114 Production, volume, 3 Proprietorships, 22 Prospects, 117 Purchase
frequency of, by wholesalers, 56 terms
see Terms of purchase Purchases
from shipping point, by firm type, 28 Purveyor, def. y 121
Quality as element in pricing, 92 specifications, see also Grades
Quoted price pricing, 92
Rail, receipts by, by market type, 38 shipments, changes in, 98
Railroad carlot, changes in weight, 98
Rasmussen, Marius P., 120 Receiver
def., 121 jobber, def., 121 purveyor, def., 121
Reconditioning, 45 Refrigerated
railroad cars, introduction of, 101 Regional
chains, 59 chain, def., 122 egular customers, sales to, 37 ¿distribution markets, 50 3gular shippers, of wholesalers, 56
epacker, tomato, def., 121 epacking tomatoes see Prepackaging
letail lot, see Selling functions market for produce, structure of, 59 organizations, defs., 122 organizations, number, by market
size, 62 •jailer ooperatives, 59 :)operatives, def., 122 operatives, growth of, 99 operatives, percent handling pro- duce, 64
Returns to owners and managers, by firm
type, 87 Risk-taking, 46 Rockwell, George R., Jr., 120 Rolling, sales when, 49
Salaries and wages, def., 123 Sales
agencies, defs., 122 agent, def., 122 changes in, of wholesalers,
by firm type, 109 by market type, 110
def., 123 of wholesalers, changes in, 103 outlets, 29 outlets, by firm size, 33 outlets, by market type, 32 outlets, by firm type, 30 out-of-town, by class of firm, 25 out-of-town, by firm size and type,
34 to regular customers, 37 to other wholesalers, by class of firm,
24 to retailer outlets, by class of firm, 25 volume of firms, by size and type, 10
Sample markets, 5 Sampling methods, 1 Schapker, Ben L., 120 Schnebly, Lewis A., 100 Secondary
handler, defs., 121 handlers, by firm size and market
type, 13 local wholesale markets, character-
istics, 7 markets, characteristics, 7 out-of-town wholesale markets, char-
acteristics, 7 wholesaler, def., 121
Segmentation of markets, prospects for, 119
Selling broker, def., 122 see also Broker functions, 36 functions, by market type, 51
Service jobber, def., 121 wholesaler, def., 121 wholesalers, prospects for, 119
Services of wholesalers, 35 of wholesalers, changes in, 110
Sherman, Wells A., 120 Shipper, 3
Shippers and truckers, def., 122 Shipping
markets, 49 point inspection def., 122 point inspection final, def., 122 point marketing firms, by region, 3 point markets, 3
Shopping centers, entry into, 115 Size
of firm, see Firm size of lot 76 of market, see Market size
Small firm, def., 121 markets, characteristics, 8
Smith, Frank J., 113, iii Smith, Roy J., 121 Sources
of data, 1 of supply, changes in, 107 of supply, by class of firm, 24 of supply, by firm type, 26
Sources—Continued of supply, by firm size, 28 of supply, by market type, 27 of supply, primary handlers, 27 of supply, retail organization, 69 of supply, secondary handlers, 29
Specials, retail, 117 Specialty
fruit and vegetable stores, 59 fruit and vegetable stores, prospects
for, 118 items, sales by fruit auctions. 111
Speciahzation, commodity, see. Commodity specialization
Specifications, quality see Grades
Speilman, Heinz, iii Split loads, changes in, 102 Spoilage, 3 Stallings, Dale L., iii Stallings, James, iii Standing
agreements with local farmers, of retail organizations, 72
Store door delivery to retailers, 67 image, 116
Street sale, price-making in, 94 markets, price variability at, 96 market, segmented, 96
Structure of retail market, changes in, 99 of retail market for produce, 59
Subject approval wired Government inspection, def., 122
Suitable shipping condition, def., 122 Superettes, prospects for, 118 Supermarkets,
growth of, 99 prospects for, 118
Supply and demand pricing, 92 sources of
see Sources of supply
Target margins see Margins, target
Taylor, Reed D., iii Terminal
broker, def. 122 market purchases, of retail organiza-
tions, 8, 68, 70, 76 sale, Boston, 94 sale, price-making in, 94 sales, price variability at, 95
Terms of credit
see Credit of purchase, defs., 122 of purchase, of retail organizations, 73 of purchase, of wholesalers, 55
Tertiary chain markets, characteristics, 8 markets, characteristics, 8
Thomas, Merritt M., iii Tomato rep acker, def., 121 Total costs, def., 123 Track
sales, price-making in, 94 sales, 49
Trade channels, changes in, 107 Traffic
builders, in retail stores, 116 Transaction type
of brokers and distributors, 49 Transportation
methods, changes in, 97 to market, 38
127

Tray lor, Harlon D., iii Truckers, 4 Truck
jobber, def.y 121 jobber, prospect for, 119 jobbers, location, 5
Type of firm
see Firm type of market
see Market type
Unaffiliated grocery stores, 59
Uniform product, changes in demand for, 119
Unit of purchase, 76 Unloading, 38
by retail organizations, 65 U.S.
Bureau of the Census, 121 Federal Trade Commission, 121
Variability, price see Price variability
Variety as element of retail competitive strat-
egy, 116 Volume
of produce marketed, changes in, 97 Voluntary
group, de/., 122 groups, 59 groups, growth of, 99 groups, percent handling produce, 64
Warehousing, 42 by retail organizations, 62 by retail organizations, reasons for, 62
Waste, 3 Ward, Edward H., iii Williams, Willard F., 121 Wholesale
grocer, de/., 121 grocers, selling produce, location, 5
W holesale—C ontinued handler, de/., 121 lot sales, see Selling functions markets, and other places, whole-
salers in, 5 market structure, 1958-59, 8 market structure, changes in, 101
Wholesalers by size of city, 5 chain, 19 changes in size distribution of sales,
103, 104 entrance and exit of, 106 in wholesale markets and other places,
5 prospects for, 118 multi-unit, 19 multi-unit, changes in, 103 selling produce, 4
Years in business, wholesalers, 107, 108
o
128