the sustainability of the hungarian pension … · second draft the sustainability of the hungarian...
TRANSCRIPT

SECOND DRAFT
THE SUSTAINABILITY OF THE HUNGARIAN PENSION SYSTEM:
A REASSESSMENT
Gábor Orbán – Dániel Palotai*
9 November 2005
Abstract
This paper gives a reassessment of the sustainability of the reformed Hungarian pension system with a special focus on whether the introduction of the fully funded pillar in 1998 has led to any improvement in the sustainability of the pension system. After a brief description of the 1997/1998 reform of the Hungarian pension system, we present results from simulations with a revised pension model. Our results show that 1) the pension system is unsustainable with uncovered implicit public liabilities in the system close to 250% of GDP. 2) The series of policy measures taken since the 1997/1998 reform account for over two-thirds of the uncovered liability implicit in the pension system, reflecting an alarming tendency of undoing the progress made by the reform in terms of improving the system’s sustainability. 3) The funded pillar only helps in lowering the uncovered implicit liabilities, if the transition costs involved in the reform are financed by budgetary adjustment. 4) The returns recorded so far in the private pension funds fall short of expectations and, on the condition that these low returns persist, the second pillar is projected to provide annuities that do not make up for the reduction in benefits received from the public pillar. This conclusion is valid even if we compare a hypothetical sustainable full pay-as-you-go system with a sustainable multi-pillar system.
* The authors are economists, Monetary Strategy Division, Economics Department, Magyar Nemzeti Bank, email: [email protected] and [email protected]. The views expressed here are those of the authors and do not necessarily represent the official views of the Magyar Nemzeti Bank.
We are indebted to András Simonovits, Levente Máté, Péter Holtzer, István Hamecz, Attila Csajbók, Balázs Vonnák and István Czajlik for valuable discussions and suggestions. We thank Ildikó Tokaji, Katalin Petőfi and Balázs Párkányi for data used in simulations.

2
Contents
I. INTRODUCTION 3
II. REFORMING THE HUNGARIAN PENSION SYSTEM (1997/1998) 5
II. 1. PARAMETRIC REFORMS 5 II. 2. THE PARADIGMATIC REFORM: A MANDATORY FULLY-FUNDED PILLAR 7 II. 3. THE FISCAL IMPACT OF REFORMS 9
III. IS THE HUNGARIAN PENSION SYSTEM SUSTAINABLE? 10
III. 1. ASSUMPTIONS 10 III. 2. SIMULATION RESULTS 12 III. 2. 1. THE LONG-TERM DEFICIT PROFILE OF THE PENSION SYSTEM 12 III. 2. 2. THE UNCOVERED IMPLICIT LIABILITIES OF THE SYSTEM 14
IV. EXPECTED PENSION BENEFITS FROM THE SECOND PILLAR 17
IV. 1. THE BREAK-EVEN RETURN IN THE EXISTING SYSTEM 17 IV. 2. THE BREAK-EVEN RETURN IN A SUSTAINABLE SYSTEM 19 IV. 3. CONTINGENT LIABILITIES DUE TO LOW RETURNS? 20
V. CONCLUSION 22
REFERENCES 23
APPENDIX 1 – THE MNB PENSION MODEL 24
APPENDIX 2 – SIMULATION OF LEGISLATED CHANGES IN 2013 28
APPENDIX 3 – SIMULATIONS OF DIFFERENT SCENARIOS 30
3
I. Introduction
In Hungary a major overhaul of the pension system was legislated in 1997 and enacted in 1998, with both parametric and paradigmatic reforms. The most important objective underlying the reforms was to minimize the long-term burden for the Hungarian budget implied by the pension system. As Benczúr (1999) showed, the parametric changes of the system improved its financial sustainability substantially.
The reassessment of the Hungarian pension system given in this study was motivated by the return of the pension issue in the centre of policy discussions for a number of reasons. As Hungary was the first country to carry out such a comprehensive reform in the region and is often cited as an example, the issue of the sustainability of the Hungarian pension system has been viewed, both at home and internationally, as more or less settled. What received considerably less attention is that since the reform, successive governments have been moving in the opposite direction, undoing much of the progress that had been achieved in 1997-1998. This, as well as issues left open by the reform, was already noted in Augusztinovics et al. (2002), but the tendency has continued and is now increasingly alarming. Contribution rates received by the Pension Insurance Fund are 4.5 percentage points lower today than envisaged by the reform, and they are to be lowered by further 2 ppt in 2007 and 2009. On the expenditure side, additional long-term spending commitments, such as 13th month pensions, have been taken on by the government. These measures are not only inconsistent with the long-term sustainability of the pension system in view of the ageing of the population, but they also create financing problems already in the near-term.
The fact that the system has a fully funded component (a mandatory second pillar introduced in 1998) has probably contributed to the general misperception that the system is financially sound. The issue of whether the introduction of the funded pillar has led to an improvement in the sustainability of the system became a central one in the policy discussions in the context of the European Union’s Stability and Growth Pact. In the recent debate on the reform of the SGP an argument has been formulated for the exclusion of the “transition costs” of systematic pension reforms from the ESA 95 general government deficit figure, in order to avoid punishing the countries that had introduced a fully funded pillar in their pension systems with the aim of improving their sustainability. This argument was especially strongly articulated by countries under the excessive deficit procedure. The question was essentially whether to allow the debt financing of the transition costs (the shortfall of revenues as they are diverted into the second pillar) or cover these costs through budgetary adjustment (higher taxes or lower spending elsewhere). The resulting compromise allows for partial debt-financing as it allows the deduction of a gradually decreasing share of these “costs” from the deficit figure which is taken into consideration in the excessive deficit procedure.
Another reason that warrants a reassessment of the Hungarian pension system and its reform is the poor performance of the pension funds in the fully funded pillar. The low yields recorded in these funds have cast doubt on the sustainability of present replacement ratios for pension benefits. The question may be raised whether future pensioners who had no choice but to enter the two-tier pension system and who will have spent a lifetime contributing to a private pension fund that may perform poorly over the long run, will put pressure on future governments to compensate for the difference between their pension

4
benefits and the amount they could have received, had this systematic reform not taken place.
The ultimate goal of this paper is to quantify and draw attention to the growing sustainability problem in the pension system since the 1997/1998 reform. Furthermore, the paper addresses the issue of whether the introduction of the fully-funded pillar has indeed improved the sustainability of the Hungarian pension system and whether the low returns recorded in the past seven years in the pension fund sector may alter that picture in any way.
The paper is structured as follows. In the next section we give a brief description of the Hungarian pension system focusing on the changes that have taken place over the past decade. In the following section, we present the most important macroeconomic and demographic assumptions that we used to project the future trends of the pension system. Details on the model and results obtained with different sets of assumptions are provided in the Appendix. In the second part of Section 3 we move on to show the projected future balances of the pension system currently in place and calculate the (uncovered) public liabilities that are implicit in the system (IPL). We show the extent to which the government’s intertemporal position has deteriorated as a result of the modifications since 1998. We also calculate the change in IPL that resulted from the introduction of the fully funded pillar to see whether it has improved the sustainability of the system.
In the fourth part of the paper we show calculations of the average net real return of the private pension fund sector that provides the members of the two-tier system with a pension benefit equivalent to what they would have received from a full pay-as-you go (PAYG) system (the “break-even return”). Here we compare a defined contribution (DC) system to a subsidised defined benefit (DB) system, which is not a fair comparison and requires further qualifications. We resolve this problem by also comparing benefits provided by a hypothetical sustainable PAYG with the benefits coming from a sustainable reduced PAYG and the private pillar. We also calculate the break-even return in this relation. Finally, we quantify the additional contingent public liability that arises if we assume that current trends continue, regulations remain in place as they are now and the government decides to compensate pensioners for the losses suffered because of low returns. The last section concludes.
5
II. Reforming the Hungarian pension system (1997/1998)
In Hungary a PAYG pension system, encompassing old-age, disability and survivor schemes, was set up around 1950. This scheme covered a growing share of the working population, reaching coverage of nearly 100 percent by 1975. The economic crisis that accompanied the transition to a market economy in the early 1990’s had adverse consequences for the pension system: the systemic dependency ratio1 grew from 51.4% in 1989 to 83.9% in 1996 due to both a fall in employment and an increase in the number of people drawing benefits, as an increasing share of people out of jobs chose early retirement and disability schemes instead of unemployment.
These developments raised pension expenditures to above 10% of GDP in 1992, which gradually fell to 7.1% in 1997. Ballooning expenditures and declining revenues from contributions left an average deficit of 0.4% of GDP between 1992 and 1996 in the Pension Insurance Fund. This deficit was automatically covered by transfers from the central government budget. 1997 was an exceptional year in which a small surplus was recorded, but deficits were projected for the near future as a result of unfavourable demographic trends. Major reforms, both parametric and paradigmatic, were legislated in 1997 (and came to force in 1998) to meet this challenge.
II. 1. Parametric reforms
The Hungarian pension system has been under permanent reform since the early 1990’s, which explains its high degree of complexity and low transparency. The most important parametric reforms included the gradual raising of the statutory retirement age and the introduction of the Swiss indexation formula, which both had a large downward impact on future pension liabilities and an immediate favourable effect on the expenditure side. However, employer contributions were gradually reduced after 1998 and this was not matched by an equivalent increase in employee contributions, lowering also the revenues of the Pension Insurance Fund.
The reform envisaged a reduction of employer contribution rates to 22% accompanied by an increase of the rate of employee contributions to 9%, 8 of which would go to the funded pillar. In contrast, by 2005 employer contribution rates fell from 24% to 18%, while employee contributions rose to 8.5% (8% of which is paid to the second pillar) as shown in Table 1. Employer contribution rates are to be cut by further 2 percentage points in two steps.
Table 1: Employer and employee contribution rates, 1997-2009
1997 1998 1999 2000 2001 2002 2003 2004 2005 2006 2007 2008 2009Employer 24 24 23 22 20 18 18 18 18 18 17 17 16
PAYG 6 1 2 2 2 2 1.5 0.5 0.5 0.5 0.5 0.5 0.5Private - 6 6 6 6 6 7 8 8 8 8 8 8
Total 30 31 31 30 28 26 26.5 26.5 26.5 26.5 25.5 25.5 24.5
Employee
1 The systemic dependency ratio is the ratio of pensioners to the active workforce. The old-age dependency ratio is the ratio of people above retirement age to those in active cohorts. For more details see Section III.1.
6
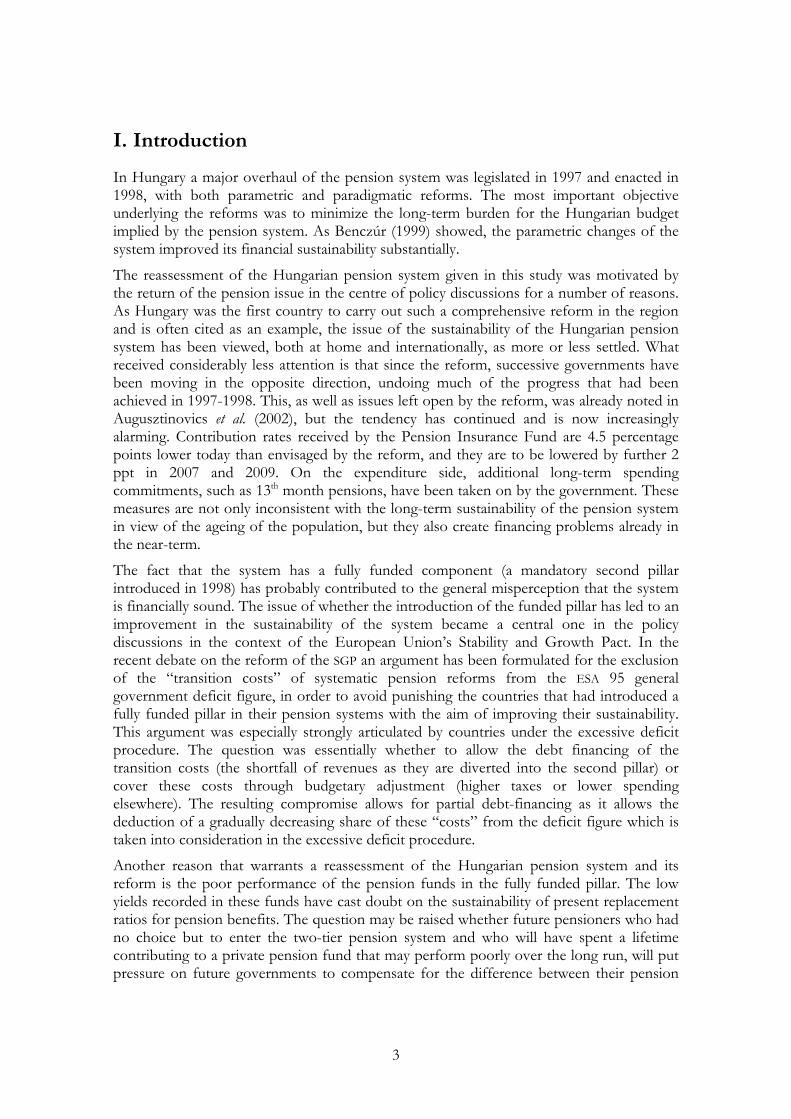
The reform of 1997/1998 raised the statutory retirement age for men from 60 to 62 years and for women it is currently rising from 57 in 1998 to 62 by 2009. Early retirement is possible at the age of 55 and 60 years (men and women, respectively), if the individual has enough service years. Data on the effective retirement age suggest that most individuals, especially men, take this opportunity, as the large number of service years accumulated particularly in the state socialist period, when unemployment was virtually unknown, enables them to do so (Figure 1).
Figure 1: Statutory and effective retirement age 1998-2004
52
54
56
58
60
62
64
1998 1999 2000 2001 2002 2003 2004
age (years)
52
54
56
58
60
62
64
age (years)
Effective retirement age for men Effective retirement age for womenStatutory age for men Statutory age for women
Source: Pension Insurance Directorate (ONYF)
There are built-in disincentives for early retirement and bonuses encourage working beyond the normal retirement age. A minimal 38 years of service are necessary for early retirement. Individuals may retire with five less service years if they accept a lower compensation of 1.2% with each service year shortfall, multiplied by the number of years before normal retirement. An 0.5% bonus is given for every additional month worked after the statutory age.
The last measure in the 1997/1998 reform package was the introduction of the so-called Swiss indexation. Between 1992 and 1997 pensions were indexed to expected net nominal wages, which led to declining real pension benefits as real wages declined in this period. As a consequence, pension expenditures fell steadily in this period. The 1997/1998 reform introduced partial indexation: since 2001 pension benefits are increased every year by the Swiss formula. Pensions in January are raised by the arithmetic mean of the projected increase in net (gross from 2013 onward) nominal wages and prices in the given year. This implies that real pensions are raised by half of the real wage index. A gradual transition was pursued with a 30% weight assigned to inflation and 70% to wages in 2000, and then moved on to a 50-50% weighted Swiss indexation as of 2001.

7
II. 2. The paradigmatic reform: a mandatory fully-funded pillar
On the legal foundations of the voluntary pension pillar (referred to as the third pillar)2 a mandatory, fully-funded system of pension funds, an example of the “new pension orthodoxy” advocated by the World Bank was introduced in 1998 as the second pillar of the new pension system. The active population had to choose between staying in the (by then reformed) full PAYG system or moving to the multi-pillar system. The rules for retirement in the multi-pillar system including indexation are the same as in the full PAYG system but benefits from the PAYG are reduced by a quarter. Individuals moving to the mixed system automatically renounced approximately 25% (1.22/1.65) of their pension claims in the state PAYG without any compensation and were obliged to join a private pension fund (i.e. the second pillar). Part of their mandatory contributions, presently 8% (see Table 1) of the gross wage is diverted to the private pension fund of his/her choice. These contributions are given no special tax treatment.
Before 2013 members of the multi-pillar system receive 75% of the benefits they would receive from an exclusively PAYG system, as of 2013 they receive 1.22% of their individual average wage multiplied by their number of contribution years (instead of 1.65% as in the full PAYG system). The flow of benefits purchased at retirement from the accumulated funds in the second pillar would complement the reduced benefit coming from the PAYG. Since the second pillar is a defined contribution system without any explicit guarantees, there is a high degree of uncertainty concerning the future benefits of the multi-pillar system. Depending on the performance of these funds, the benefit received from the second pillar may or may not make up for the lost PAYG pension claims. We explore this issue in greater detail in Section 4. Those individuals in the multi-pillar system who become handicapped and therefore start drawing disability benefits before reaching the retirement age have to return to the full PAYG and their accumulated funds in the second pillar are transferred to the Pension Insurance Fund.
Transition to the new system has been mandatory for labour market entrants as of 1998 (it was temporarily made optional in 2002), and optional for others. Currently 2.4 million individuals are members of the multi-pillar system, most of them opted for it voluntarily, while the rest were obliged to join as new entrants to the labour market. After September 1999 members of the PAYG system may not opt out to the two-pillar system. Backing out from the multi-pillar system was made possible before 2003. An option has been given recently to retirees who joined the second pillar less than 10 years before retiring and whose benefit from the second pillar is less than 25% of PAYG: they are allowed to move back to the PAYG before 2012.
It is a puzzle to researchers why so many people joined the multi-pillar system voluntarily, renouncing 25% of their pension claims from the PAYG after having contributed to the full PAYG for a number of years. One possible reason is that accumulated funds may be inherited prior to retirement, so in the case of the death of an active individual, orphans and widows are left with some funds. However, this argument is not fully convincing because the PAYG pillar also pays benefits to widows and orphans. According to a second, more appealing argument higher income-earners were better-off moving to the multi-pillar system because the redistribution element of the PAYG is absent in the funded pillar. This
2 The voluntary pillar was introduced in 1993.

8
incentive, however, disappears as of 2013 due to the fact that the regressive feature in the pension formula will be phased out. The large number of opt-outs is probably best explained by the fact that individuals perceived the market risk involved in accumulating savings in a pension fund to be lower than the policy risk of participating in a full PAYG with very low credibility and an overall negative image (Rocha and Vittas 2002). This negative image was exploited by large-scale mis-selling from the part of pension funds, whose agents pressed and often misled customers in order to recruit more members. A further reason for moving from the full PAYG to the multi-pillar system may have been the guarantees that initially (up to 2001) existed in the new system in the form of a minimal benefit. At present no explicit (legal) state guarantee exists for minimum benefits or returns. However, it may be hypothesised that the government would be tempted/pushed to compensate pensioners for a very unfavourable outcome.
This issue is extremely relevant because the return performance of the pension fund sector has so far been rather disappointing: the annual weighted3 average real yield net of asset management fees was 2.2% since its introduction (see Figure 2). Real yields are calculated as nominal yields less year-on-year inflation. It should be noted that there is considerable uncertainty regarding the quality of the data, but we have no reason to believe that there is a systematic bias in the figures.
Figure 2: The yield performance of the pension fund sector (second pillar)
-4
-2
0
2
4
6
8
10
12
1998 1999 2000 2001 2002 2003 2004
%
-4
-2
0
2
4
6
8
10
12
%
Weighted average net real return Average over 1998-2004
Source: Authors’ calculations using data from the Financial Supervisory Authority (PSZÁF)
The unfavourable performance has partly to do with the very conservative portfolio structure with 75% of total assets held in government bonds and partly with high operating 3 We used pension fund assets as weights to get the weighted averages across funds in each year. In order to assess the performance of the pension fund sector from 1998 to 2004, we took the simple arithmetic mean of these annual weighted cross-section averages (i.e. we did not use weights over time). In principle, it is also possible to use weights over time, which is relevant if we want to understand the development of the assets in the pension fund sector in the past seven years. This calculation however, introduces a bias towards more recent years as fund asset sizes continuously grow in the accumulation period. Therefore it does not reflect average annual investment performance properly, and is not informative from the point of view of future returns.
9
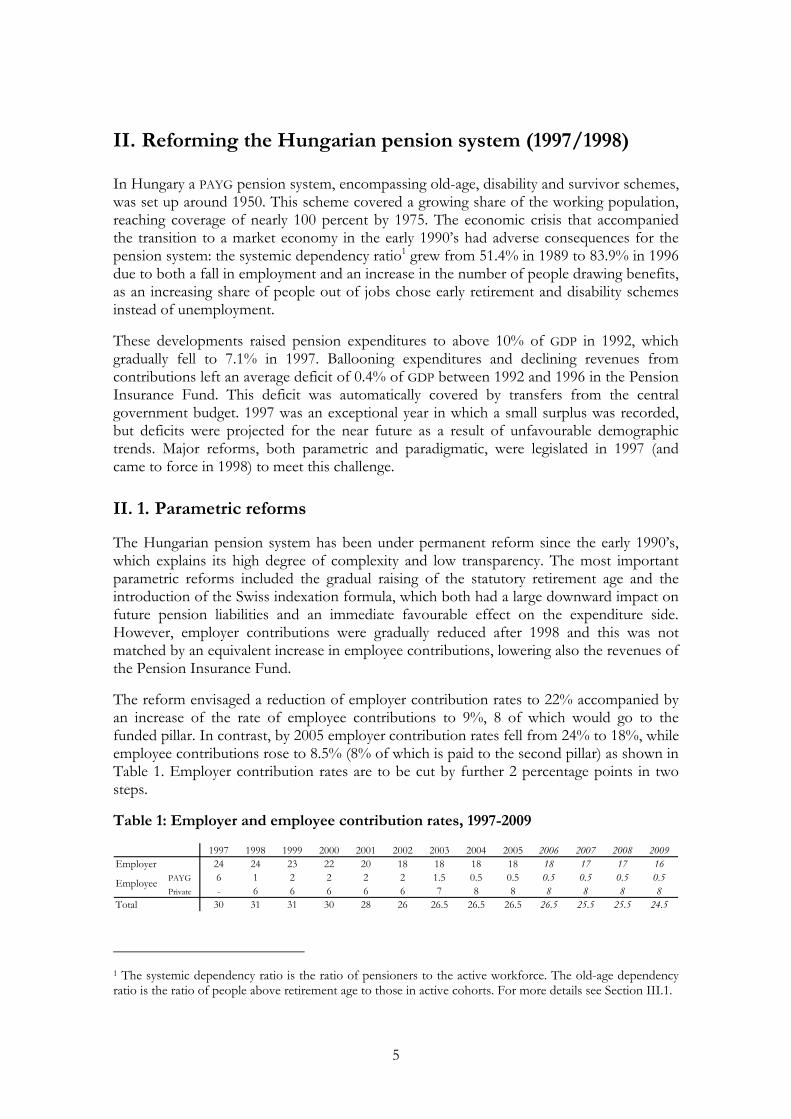
costs. Fees related to the administration of contributions amounted to 2% of total assets and over 6% of contributions in 2004, which is considered to be high in comparison to other countries (FSAP 2005). Concentration in the sector is quite strong (the five largest funds represent roughly 80% of the market) but economies of scale have not been realised so far. Marketing costs are low, but switching between pension funds is also quite uncommon, so competition may be imperfect, too. The low rates of net real return in the pension fund sector raises concerns about the sustainability of present levels of old-age pension benefits. In Section 4 we explore this issue in detail.
II. 3. The fiscal impact of reforms
The experience with the fiscal impact of the reforms has been mixed. Although the parametric reforms helped to contain pension expenditures after 1998, the sustainability of the system did not improve in the short run because of a shortfall in revenues due to successive reductions in contribution rates. The introduction of the second pillar has so far only led to increased deficits because part of the contributions are being redirected to the second pillar and represent a revenue shortfall from the point of view of the Pension Insurance Fund.
Figure 3: The short-term fiscal impact of reforms
-0.5
0.0
0.5
1.0
1.5
2.0
2.5
3.0
1992 1993 1994 1995 1996 1997 1998 1999 2000 2001 2002 2003 2004 2005*
% of GDP
-2
0
2
4
6
8
10
12
% of GDP
Other deficits Redirected contributions Pension expenditures (right scale)
Source: MNB. *: forecast
We address the issue of the long-term prospects of the pension system and the fiscal impact of the systemic reform in the following section.

10
III. Is the Hungarian pension system sustainable?
In this section we present results from simulations with the MNB pension model in order to assess the sustainability of the Hungarian pension system. To this end we project future balances of the Pension Insurance Fund for each year between 2004 and 2105 and summarise these flows in a single indicator, the implicit public liabilities (IPL) of the pension system, which is the present value of its future deficits. We quantify the impact of the introduction of the second pillar on the sustainability of the system by comparing the implicit liabilities in a hypothetical full PAYG system (where all individuals participate in a full PAYG) to that in the actual multi-pillar pension system.
Our analytical framework is a revised, updated and upgraded version of the Finance Ministry’s pension model. On the basis of the existing regulations/policies, the model projects base year figures of the number of pensioners and the sum of benefits into the future using exogenous assumptions for demographic trends and projections of activity rates (Hablicsek, 2005), as well as paths of macroeconomic variables. (To learn more about our model see Appendix 1.)
III. 1. Assumptions
Our baseline demographic assumptions include a declining population; an increase in longevity and a rise in the old-age dependency ratio (see Figure 4). After a minor improvement in the next 5-10 years, Hungary will experience a rapid ageing of its population in our baseline scenario as large cohorts born in the 1950’s begin to retire after 2012. Even more adverse demographic trends will set in around 2035-2040, with another large generation projected to reach the retirement age. Besides the policy settings, demography has proved to be the key factor in determining the future deficit profile of the system.
Figure 4: Dependency ratios implied by the baseline demographic assumptions
0.0
0.2
0.4
0.6
0.8
1.0
1.2
1.4
2004
2009
2014
2019
2024
2029
2034
2039
2044
2049
2054
2059
2064
2069
2074
2079
2084
2089
2094
2099
2104
0.0
0.2
0.4
0.6
0.8
1.0
1.2
1.4
Old-age dependency ratio System dependency ratio
Source: Hablicsek (2005)

11
We have used two scenarios for the development of activity rates for each cohort, both of which are consistent with our baseline demographic projection. In both our baseline activity scenario and the optimistic one we assume a lengthening of the period that younger generations spend at school (therefore lower activity rates are assumed in these cohorts) and a larger share of active individuals in older age cohorts.4 As a result of the declining population the active labour force decreases significantly throughout the projection period despite the improvement in the aggregate activity rate. The model has been extended to also incorporate a third scenario used by the European Commission’s Ageing Working Group.
Figure 5: Aggregate activity rates in three scenarios
60
62
64
66
68
70
72
74
76
2004
2009
2014
2019
2024
2029
2034
2039
2044
2049
2054
2059
2064
2069
2074
2079
2084
2089
2094
2099
2104
as %
of
the
acti
ve p
opu
lati
on
60
62
64
66
68
70
72
74
76
Baseline Optimistic EC-AWG
Source: Hablicsek (2005)
Our macroeconomic assumptions (summarised in Table 2) include a fall in inflation rates to the ECB’s definition of price stability and a long-term GDP-growth weaker than today as a result of the declining population and the completion of the catching-up process. The model also incorporates the macroeconomic projections used by the European Commission for calculations on Hungary. Simulations of the future balance of the system have appeared to be fairly robust to macro assumptions.
We present results of our baseline scenario in the next section, while simulations with the other scenarios are shown in Appendix 3.
4 The reason for the drop in the aggregate activity rate around 2040 is a composition-effect: cohorts with higher activity rates are significantly smaller, whereas low-activity cohorts are larger in that particular period.

12
Table 2: The baseline macroeconomic assumptions
2005-2010 2010-2020 2020-2040 2040-2105
Inflation 3.1 2.0 2.0 2.0Real GDP growth 3.5 2.8 1.8 1.5Real wage growth 3.0 3.2 2.4 1.7Pension increase (real Swiss index)
1.5 1.6 1.2 0.8
Men 6.8 6.4 6.5 6.5Women 6.1 5.8 5.9 5.9
Unemployment rate
Source: Hungarian Quarterly Projection Model, MNB
III. 2. Simulation results
III. 2. 1. The long-term deficit profile of the pension system
In this section we present the future balances of the Hungarian pension system on a 100-year horizon as projected by our model. Figure 6 shows the future balances of the existing multi-pillar system and also, as a “thought experiment”, the balance of a hypothetical full PAYG system had the second pillar not been introduced.5 The changes in the pension formula and the taxation of pensions envisaged by the pension law to take effect in 2013 would in their present form lead to sharp differences between pensions from one year to the other, so we did not take these changes into account in our baseline simulations. In our view, such an event is politically unfeasible and therefore highly unlikely. Appendix 2 presents the future balances of the pension system and old-age replacement ratios assuming these changes take effect. Our results also support the view that this is a severe shortcoming of the present legislation and, as this date is approaching fast, regulations for 2013 should be revised urgently.
Figure 6 shows that in the single-pillar case the deficit of the system falls until 2010, and it even turns into a slight surplus in the 2010’s. This development is clearly a result of the favourable expected short-term demographic trends as shown in Figure 4. Later on, the balance turns negative again and drops markedly around 2040, when the generation born in the 1970’s (the so-called “first echo” of the baby-boom generation born after World War II) begins to retire. As the ageing of the population continues, the deterioration of the balance of the pension fund is never reversed and by 2105 the deficit rises close to 4.5% of GDP.
5 Technically this is done by not allowing any individual to “opt-out” from the pay-as-you-go system.
13
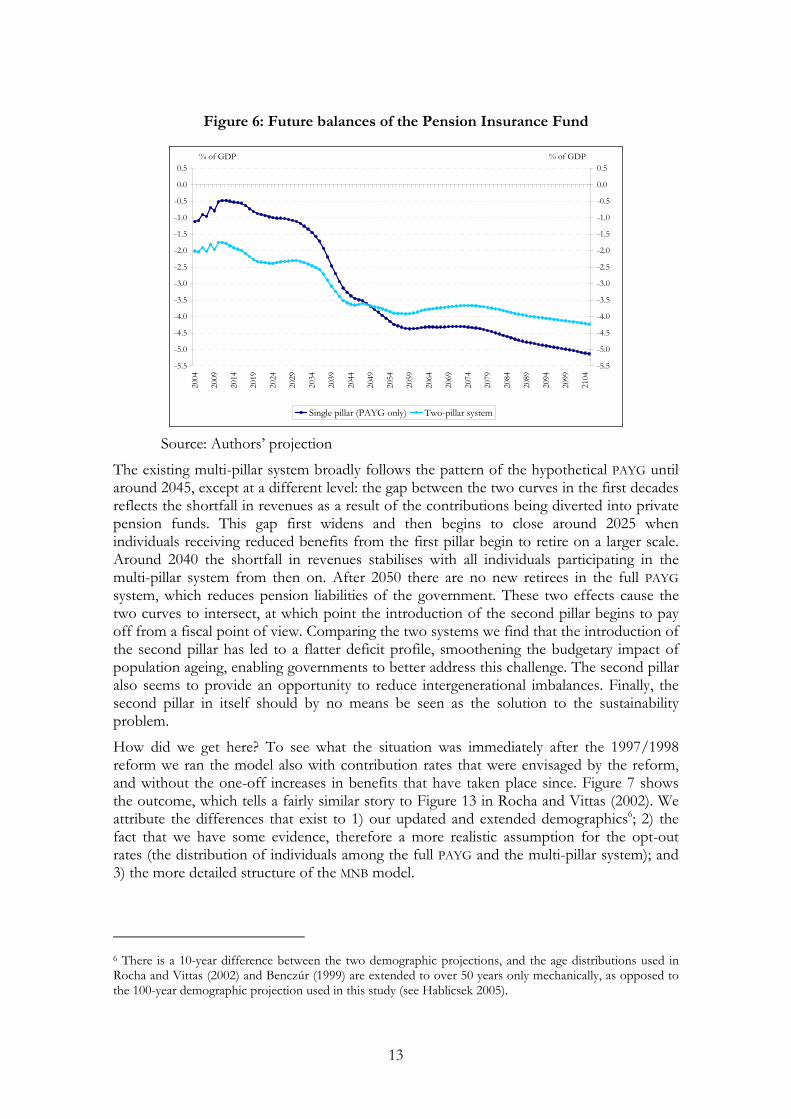
Figure 6: Future balances of the Pension Insurance Fund
-5.5
-5.0
-4.5
-4.0
-3.5
-3.0
-2.5
-2.0
-1.5
-1.0
-0.5
0.0
0.5
2004
2009
2014
2019
2024
2029
2034
2039
2044
2049
2054
2059
2064
2069
2074
2079
2084
2089
2094
2099
2104
% of GDP
-5.5
-5.0
-4.5
-4.0
-3.5
-3.0
-2.5
-2.0
-1.5
-1.0
-0.5
0.0
0.5% of GDP
Single pillar (PAYG only) Two-pillar system
Source: Authors’ projection
The existing multi-pillar system broadly follows the pattern of the hypothetical PAYG until around 2045, except at a different level: the gap between the two curves in the first decades reflects the shortfall in revenues as a result of the contributions being diverted into private pension funds. This gap first widens and then begins to close around 2025 when individuals receiving reduced benefits from the first pillar begin to retire on a larger scale. Around 2040 the shortfall in revenues stabilises with all individuals participating in the multi-pillar system from then on. After 2050 there are no new retirees in the full PAYG system, which reduces pension liabilities of the government. These two effects cause the two curves to intersect, at which point the introduction of the second pillar begins to pay off from a fiscal point of view. Comparing the two systems we find that the introduction of the second pillar has led to a flatter deficit profile, smoothening the budgetary impact of population ageing, enabling governments to better address this challenge. The second pillar also seems to provide an opportunity to reduce intergenerational imbalances. Finally, the second pillar in itself should by no means be seen as the solution to the sustainability problem.
How did we get here? To see what the situation was immediately after the 1997/1998 reform we ran the model also with contribution rates that were envisaged by the reform, and without the one-off increases in benefits that have taken place since. Figure 7 shows the outcome, which tells a fairly similar story to Figure 13 in Rocha and Vittas (2002). We attribute the differences that exist to 1) our updated and extended demographics6; 2) the fact that we have some evidence, therefore a more realistic assumption for the opt-out rates (the distribution of individuals among the full PAYG and the multi-pillar system); and 3) the more detailed structure of the MNB model.
6 There is a 10-year difference between the two demographic projections, and the age distributions used in Rocha and Vittas (2002) and Benczúr (1999) are extended to over 50 years only mechanically, as opposed to the 100-year demographic projection used in this study (see Hablicsek 2005).

14
Figure 7: Future balances of the Pension Insurance Fund (with a 31% contribution rate, without 13th month pensions)
-3.0
-2.5
-2.0
-1.5
-1.0
-0.5
0.0
0.5
1.0
1.5
2.020
04
2009
2014
2019
2024
2029
2034
2039
2044
2049
2054
2059
2064
2069
2074
2079
2084
2089
2094
2099
2104
% of GDP
-3.0
-2.5
-2.0
-1.5
-1.0
-0.5
0.0
0.5
1.0
1.5
2.0% of GDP
Single pillar (PAYG only) Two-pillar system
Source: Authors’ projection
Figure 7 leads to another interesting insight. It suggests that the parametric reform made room for the systemic one: surpluses that would have occurred in the pure PAYG system would have enabled the introduction of the second pillar without sacrifices other than the parametric reforms themselves (i.e. the tax financing of the shortfall in revenues in the early decades after the reform). As Palacios and Rocha (1998) argued, without the second pillar, the accumulation of surpluses in the PAYG would have provided an opportunity to reverse the reforms through politically-motivated benefit increases. Second, it would have created a new role for the public pension fund as an asset manager, which is unlikely to lead to efficient investment allocation or good corporate governance.
In the next section we discuss the issue of how each of the measures taken since 1998 have affected the intertemporal position of the government (i.e. the implicit liabilities in the pension system) and how the sustainability of the pension system is affected by the introduction of the second pillar.
III. 2. 2. The uncovered implicit liabilities of the system
The (uncovered) implicit public liabilities indicator of the system is constructed as the present value of the future balances on an infinite time horizon. We may use different rates to discount future flows. The choice of discount rate is subject to controversy, and is seen as one of the ambiguities of analytical framework of generational accounting (see CBO, 1995). Although most papers either refer to the long-term average of real interest rates in developed countries or try to find a link between the long-run potential growth rate and the real interest rate, the chosen rate is usually rather arbitrary. In this study we do not attempt to tackle the issue of putting our choice of the discount rate on sound theoretical footing, and present results using rates between 2% and 5%. We note that the European Commission uses a 3% real discount rate, therefore in the text we refer to the figures using this discount rate.
15
We have quantified the present value of the deficits in the existing system and in the hypothetical single-pillar system using the assumption that deficits remain flat after 2105 in both cases. We approximate the present value of deficits after 2105 as a geometric series beginning in 2106 and discount that figure to base year. We have calculated the impact of the introduction of the second pillar in the case where the transition is financed from additional deficits and also in the case where budgetary adjustment takes place (tax-financing). In the former case we take the simple difference in implicit liabilities, while in the latter we take the minimum of the deficits in each year (we consider the benefits as reduced spending and the costs as being covered through taxes, therefore unchanged revenues). Our results are summarized in Table 3.
Table 3 shows that using 3% as the real discount rate, the implicit liabilities of the Hungarian pension system is near 250% of 2004’s GDP in our baseline scenario. This means that if the rest of the budget is in balance and this system of entitlements is sustained forever, taxes equivalent to 250% in present value need to be collected over an infinite horizon. This scheme is clearly unsustainable, in the sense that it is not self-financing. In other words, it may only be sustained if society is willing to allocate additional and growing resources to this system forever.
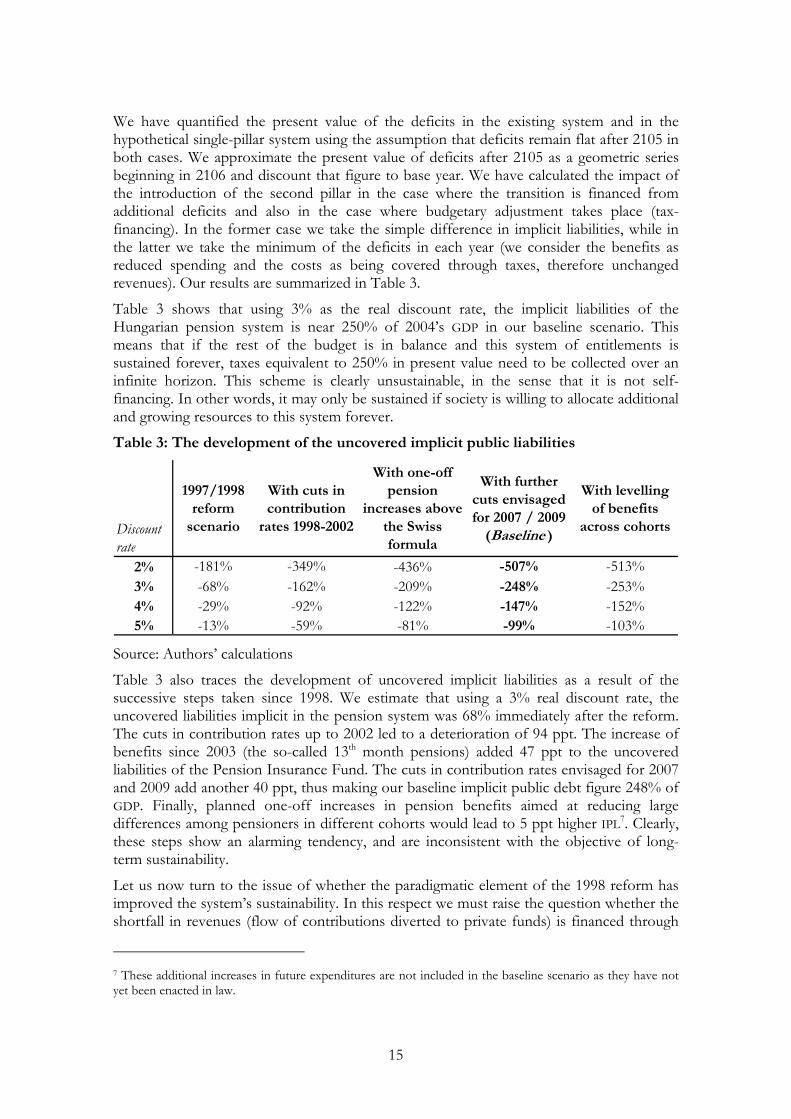
Table 3: The development of the uncovered implicit public liabilities
Discount rate
1997/1998 reform
scenario
With cuts in contribution
rates 1998-2002
With one-off pension
increases above the Swiss formula
With further cuts envisaged for 2007 / 2009
(Baseline )
With levelling of benefits
across cohorts
2% -181% -349% -436% -507% -513%3% -68% -162% -209% -248% -253%4% -29% -92% -122% -147% -152%5% -13% -59% -81% -99% -103%
Source: Authors’ calculations
Table 3 also traces the development of uncovered implicit liabilities as a result of the successive steps taken since 1998. We estimate that using a 3% real discount rate, the uncovered liabilities implicit in the pension system was 68% immediately after the reform. The cuts in contribution rates up to 2002 led to a deterioration of 94 ppt. The increase of benefits since 2003 (the so-called 13th month pensions) added 47 ppt to the uncovered liabilities of the Pension Insurance Fund. The cuts in contribution rates envisaged for 2007 and 2009 add another 40 ppt, thus making our baseline implicit public debt figure 248% of GDP. Finally, planned one-off increases in pension benefits aimed at reducing large differences among pensioners in different cohorts would lead to 5 ppt higher IPL7. Clearly, these steps show an alarming tendency, and are inconsistent with the objective of long-term sustainability.
Let us now turn to the issue of whether the paradigmatic element of the 1998 reform has improved the system’s sustainability. In this respect we must raise the question whether the shortfall in revenues (flow of contributions diverted to private funds) is financed through
7 These additional increases in future expenditures are not included in the baseline scenario as they have not yet been enacted in law.

16
higher deficits or higher taxes (lower spending). The revised Stability and Growth Pact provides some room for governments to resort to the deficit financing of the transition costs involved in such a reform. The new Pact allows the deduction of a gradually decreasing share of these “costs” from the deficit figure which is taken into consideration in the excessive deficit procedure. The costs may be deducted over a period of five years in a linear fashion, with 100% deductibility in the first year of the reform (or 2005 for earlier reforms), 80% in the following year etc. The results on the change in implicit liabilities in case of the full deficit financing of the reform are presented in the third column and those in case of full tax-financing are in the fifth column of Table 4.
Table 4: The impact of the funded pillar on the implicit public liabilities
Discount rate
Single-pillar
system
Actual multi-pillar system
(Baseline)
Change (debt-financing
i.e. simple difference)
Budget adjusted for shortfall in
contributions (tax-financing)
Change (tax-financing)
2% -525% -507% 18% -455% 70%3% -229% -248% -19% -204% 25%4% -120% -147% -27% -110% 10%5% -72% -99% -27% -67% 5%
Source: Authors’ calculations
As it turns out, budgetary adjustment is crucial from the point of view of whether the reform improves the sustainability of the system or not. Assessing the improvement in sustainability in case of the full deficit financing of the reform, i.e. simply comparing the implicit liabilities in the multi-pillar system and in the hypothetical single-pillar system (third column of Table 4) we find that the implicit debt in the single-pillar system is somewhat lower, therefore, sustainability has worsened as opposed to improving.
In theory a deficit-financed reform only transforms long-term deficits into short-term ones (or, in other words, makes implicit liabilities explicit)8, and thus provides an opportunity for governments to (at least partially) address the long-term sustainability problem today through budgetary adjustment. In line with this, our results suggest that the introduction of the second pillar does not improve the sustainability of the system if transition costs are financed entirely through deficits. In fact the sustainability problem is exacerbated as future deficits are traded for present ones, and savings in the far future cannot cover the shortfall in revenues in the near future in present value. If, however, the government adjusts the budget to compensate for the revenue shortfall in the transitory period as assumed in the tax-financing case, sustainability is improved by 25 percentage points of GDP relative to the single-pillar case, which makes the introduction of the funded pillar worthwhile.
8 Simonovits (2002) argues that „[i]f the society does not want to put a double burden on the shoulders of cohorts of the transition, then only very little change can be achieved with such a transition.”
17
IV. Expected pension benefits from the second pillar
In Section 2 we explained the large number of opt-outs (the high share of the active population moving voluntarily to the multi-pillar system) by individuals’ perception of the policy risk of participating in a full PAYG with potential cuts and tightening measures in the defined benefit scheme outweighing the market risk involved in accumulating savings in a private pension fund at a given expected rate of return. Since the reform in 1998 this type of negative policy shock has not materialised: policy measures modifying the parameters of the PAYG have only contributed to higher uncovered liabilities in the system as contribution rates were lowered and benefits have been raised.
In this section we assess the relative position of these two types of risks from the point of view of the average future worker/pensioner. To achieve this we assess the performance of the pension fund sector by asking the question whether pension benefits expected from the second pillar, under the condition that present rates of return are sustained, make up for 1) the difference between the amount of pension benefit the individual would receive from a full PAYG system and the reduced PAYG (the first pillar of the multi-pillar system), both with the present policies and benefit formula and 2) the difference between pensions provided by these two systems with parametric measures taken (benefits reduced) to make the systems sustainable. The second benchmark may be viewed as the worst outcome of the policy risk referred to above.
Our calculations also take into account the additional risks and costs that are expected to emerge in the payout phase (after 2013) in relation to the provision of annuities. This market is not yet developed in Hungary and there is a risk that the provision of annuities can be excessively costly for pensioners, especially because of the required Swiss-indexation of annuities. This requirement poses difficulties for the providers of this service because of the lack of hedging instruments against the risks in the nominal wage growth path (Augusztinovics et al. 2002). These factors could reduce old-age benefits received from the fully funded pillar even further. Orszag (1999) estimates that the costs incurred by the typical individual in converting an account to a lifetime annuity upon retirement reduce the value of the account by approximately 10%.
IV. 1. The break-even return in the existing system
In Figure 8 we compare pension benefits9 that a typical old-age pensioner in a full PAYG system would receive from the government Pension Insurance Fund with that received by the same individual in the multi-pillar system from the government (a reduced PAYG-benefit) and the private pension fund together. First, we assume the net real rate of return in this sector to be 2.2% from 2005 onwards. As explained in Section 2, this rate of return reflects the average performance of the pension fund sector since its creation in 1998. In our calculations we use an additional administration cost of 6.5% charged on contributions in 2004 (as was the case) and we assume that this continues to decline gradually to 4.5% over a period of 10 years and remains there throughout the projection period. We stress that this is strictly a thought experiment since all new labour market entrants join the new multi-pillar system and there can be no new old-age retirees in the full PAYG after 2050.
9 Pension benefits are expressed as a proportion to the average net wage (replacement ratios).

18
The exercise compares the long-term projection of benefits paid by a hypothetical pension system without a second pillar (with everybody staying in the full PAYG) to benefits paid in the current setup.
Figure 8: Old-age entry replacement ratios
40
45
50
55
60
65
70
75
80
2004
2009
2014
2019
2024
2029
2034
2039
2044
2049
2054
2059
2064
2069
2074
2079
2084
2089
2094
2099
2104
%
40
45
50
55
60
65
70
75
80%
Two-pillar system (with net real return of 3.6%) Single pillar (PAYG only)Two-pillar system (with net real return of 2.2%)
Source: Authors’ projection
Figure 8 shows that assuming that the performance of the pension fund sector does not improve in the future we can expect pension benefits drawn by future members of the multi-pillar system to be well below to what they would have received in the full PAYG. The staggered line in Figure 8 shows that a net real return of 3.6% would, after 2048, lead to approximately the same pension level as provided by the full PAYG pension formula currently in place. If we do not take into account annuity costs (estimated to be 10%), the break-even return edges down to 3.3%.
The break-even return in gross terms is a little over 2 percentage points higher than our assumption for the real wage growth rate. As it turns out, our result on the break-even return matches some more conservative expectations on the performance of the pension fund sector. Rocha and Vittas (2002) report that very conservative estimates of this gap can be 2 ppt, and even countries with portfolio restrictions and very conservative portfolio strategies such as Denmark and Switzerland achieved higher returns over the 1980’s and 1990’s.
For some members of the new system, joining was not an obligation but an option. In this regard, Figure 8 provides another interesting insight. Even assuming 3.6% net real returns, the replacement ratios received by members of the multi-pillar system in the first three decades are still much lower than what they would have been eligible for in the full PAYG. A 3% return on funds accumulated in the second pillar breaks even only after 2048, i.e. for those who had contributed to the second pillar over their entire lifetime. This implies that for those who moved to the multi-pillar system at a later stage of their professional life, only much higher returns could break even.10
10 This suggests furthermore, that the findings presented in this section are valid only for the mature phase of the multi-pillar system with no members of the full pay-as-you go in the active population.
19
This finding is important because in the first year after the reform, a large number of people moved to the new multi-pillar system, losing 25% of their accumulated pension claims after paying contributions to the full PAYG for a considerable period (see Section 2). Some observers expected or still expect that some of these losses can be recovered in the form of higher annuities from a well-performing pension fund sector. Our calculations show that for an average old-age pensioner, the private pension fund sector would have to provide net real rates of return well over 3.6% to recover even part of those losses. Looking at the past performance of this sector this seems to be very optimistic. The “cut-off age” (the age below which it pays off to move to the multi-pillar system in the terminology of Rocha and Vittas, 2002) with the past performance of the pension fund sector projected into the future, is below 18 years, that is, nobody would be better-off in the multi-pillar system.
IV. 2. The break-even return in a sustainable system
In the above discussion we compared a defined contribution system to a subsidised defined benefit system. This is not a fair comparison, because we expect the DC system to provide rates of return that compensate for the rate of return of the DB plus the amount of subsidy.11 In this case we would actually require that the second pillar reflects all the parametric changes that may ever take place in the first pillar. In other words, in the previous exercise we assumed that the DB system is going to run deficits forever and those who remain in that system do not run the “policy risk” of a reduction in benefits in order to make the system sustainable. To control for this, we present replacement ratios that are consistent with balanced pension budgets below.12 One could also think of this as a choice given to society of either accepting a less generous pension formula which makes the single-pillar system sustainable, or privatising 25% of the system (as it was actually done) and making the first pillar sustainable.
The discussion above boils down to the conclusion that a defined contribution system such as the funded pillar should not be required to trace all the modifications in the PAYG benefit formula or indexation. In practice this can be illustrated by looking at the impact of the introduction 13th month pensions on the break-even return as this measure raises full PAYG benefits by more than reduced PAYG benefits, widening the difference between the two sums that the funded pillar is supposed to make up for. Without the 13th month pensions, the break-even return drops to 3.3% (3% without annuity costs).
Figure 9 compares these alternatives with the assumption that the private pillar performs at its historical average of 2.2%. Clearly, this net real rate of return is insufficient to make the second option more attractive. This implies that members of the multi-pillar system are worse off than they would have been if the paradigmatic reform had not taken place, even if benefits from the public pillar were reduced to make the systems sustainable.
11 In an extreme case, to replicate a DB system collecting zero revenues and providing some positive benefits financed entirely out of deficits, a DC system would have to achieve infinite returns. 12 Technically, we achieve this by multiplying replacement ratios in each year by total revenues of the public pension fund and divide them by total expenditures. Making the systems sustainable by linking benefits to the amount of contributions collected, they are no longer defined benefit but defined contribution systems, which allows comparison with the second pillar.

20
The figure also shows that the break-even rate of return in the sustainable case is around 2.75% (2.4% without annuity costs). This is the rate of return where both the government and society are indifferent to the introduction of a second pillar. Below this rate of return, government gains nothing, but pensioners fare worse by introducing the second pillar.
The break-even return in gross terms for the sustainable case is 1.5 percentage points higher than our assumption for the real wage growth rate: clearly a very undemanding benchmark in the light of the discussion in Rocha and Vittas (2002).
Figure 9: Old-age entry replacement ratios (sustainable case)
30
35
40
45
50
55
60
65
70
2004
2009
2014
2019
2024
2029
2034
2039
2044
2049
2054
2059
2064
2069
2074
2079
2084
2089
2094
2099
2104
%
30
35
40
45
50
55
60
65
70%
Sustainable PAYGSustainable two-pillar system (With net real return of 2.75%) Sustainable two-pillar system (With net real return of 2.2%)
Source: Authors’ projection
IV. 3. Contingent liabilities due to low returns?
The findings discussed above point to the conclusion that the performance of the pension fund sector in Hungary can be regarded as unsatisfactory by some reasonable standards. As a result, entry (new) pensioners of the multi-pillar system are projected to receive significantly lower benefits than members of the full pay-as-you go system with an identical wage-profile and service years. Besides this most striking comparison, there may also be a sizeable difference between pensions provided by the certain funds. And, last but not least, a major tension could arise from pensions being below any social minimum.
Although at present the government does provide a guarantee for a minimum rate of return, the natural question arises: what would happen to uncovered implicit liabilities, if the government were pressed by pensioners, an already large and growing proportion of the voting population, to compensate for the shortfall in benefits?
If we believe that there is a positive probability that future governments offset the loss suffered by multi-pillar pensioners to some extent, then this represents a contingent liability in the pension system in addition to the existing stock of implicit liabilities. Based on model simulations, we calculated the maximum amount of possible compensation as the difference between all future multi-pillar pensions (i.e. benefits received from the Pension Insurance Fund plus the annuity provided by private funds) and pensions that the single-pillar system provides. In the baseline case this contingent liability amounts to 105% of GDP using a 3%

21
real discount rate, it would thus increase the overall IPL of the pension system to over 350% of GDP. Without 13th month pensions, the former figure would drop to 85%.
As noted above, however, the relevant benchmark for a defined contribution system as the funded pillar is a sustainable PAYG. In this case, 13th month pensions do not play a role, because the system is sustainable by definition. Compensating multi-pillar pensioners of a sustainable system would increase liabilities from 0 to 54% of GDP over time.
Table 5: Break-even returns and contingent liabilities
With 13th month pensions
Without 13th month pensions
With 13th month pensions
Without 13th month pensions
With 10% annuity cost
3.6% 3.3% 2.75% 2.75%
Without annuity costs
3.3% 3.0% 2.4% 2.4%
Contingent liabilities 105% 85% 54% 54%
Unsustainable PAYG Sustainable PAYG
Source: Author’s calculations
Our results on the break-even returns and contingent liabilities are summarised in Table 5. The table suggest that if future governments are pressed to compensate pensioners for low returns, then the rationale of the introduction of the private pillar, i.e. improving the system’s sustainability could not be achieved, even if we assume that the budget is adjusted by financing the costs of the reform entirely by taxes.
Finally, we also note that implicit liabilities are affected by the rate of return in another, indirect and very subtle way, as they lower the sum transferred to the Pension Insurance Fund whenever an individual is handicapped and moves back to the full pay-as-you-go system. For instance, increasing the rate of return to 3.6% would reduce the implicit pension debt by 4 ppt.

22
V. Conclusion
In this study we investigated the impact of the introduction of the fully funded pillar and the parametric measures taken since 1998 on the sustainability of the Hungarian pension system. Furthermore, we analysed the implications of the performance of the private pension fund sector on future old-age pension benefits. Our results are summarised below.
1. The existing multi-pillar pension system is financially unsustainable, with uncovered implicit liabilities in the system reaching 248% of 2004’s GDP. This value had been 68% immediately after the reform. A whole year’s GDP was added to this since then by cutting contribution rates and increasing pensions above the Swiss index. Envisaged further cuts account for the rest of the uncovered liabilities. Planned levelling of benefits across pensioners who retired in different years would raise implicit liabilities close to 253% of GDP.
2. If the second pillar had not been introduced, the balance of the government pension fund would be closer to zero until around 2050 and after that the system would become even more unsustainable in the very long term. If the shortfall in revenues that accompanies the transition to the multi-pillar system is financed entirely by issuing debt, the present system turns out to be more unsustainable than a pure pay-as-you-go, as lower deficits in the far future cannot make up for the larger deficits (i.e. the transition costs) before 2050. Notwithstanding, the second pillar provides an opportunity for the government to (partially) address long-term financing issues today. In particular, if the government adjusts the budget to make room for the shortfall in contribution revenues involved in the reform (tax-financing), the improvement in sustainability could be as much as 25 percentage points.
3. If the second pillar continues to provide net real rates of return of 2.2% on average (including asset management fees but excluding administrative fees on contributions), as it did in the first seven years of its existence, then an average old-age pensioner retiring in 2050 in the full pay-as-you-go system would receive higher benefits than if the same person retired from the multi-pillar system (having accumulated funds in the second pillar over a lifetime). A real rate of return of 3.6% would break even. The average individual who did not contribute to the second pillar over his/her entire professional life but moved to the multi-pillar system at a later stage would need to have even higher returns to receive equal benefits with an average full pay-as-you-go pensioner.
4. Surely, the government would be worse off with more people in the full pay-as-you-go, because it is a subsidised scheme. Controlling for this factor, the break-even return drops to 2.75%. This is the rate of return required to make an individual retiring in 2050 indifferent to receiving a 100% of the public pension or 75% of the public pension plus the annuities from the private fund, knowing already today that by the time he/she retires, there will have been a cut in the public scheme to make the defined benefit system sustainable.
5. The contingent liability arising from potential pressures on government to compensate pensioners for the losses they suffer as a result of the poorly performing pension fund sector is 105% of GDP (54% in the sustainable case). If this contingent liability turns explicit, then the rationale of the introduction of the private pillar cannot be achieved, even if we assume that the budget is adjusted by the full tax-financing of the reform.

23
References
Augusztinovics, M., Gál, R. I., Matits, Á., Máté, L., Simonovits, A., Stahl, J. (2002): „The Hungarian Pension System before and after the 1998 Reform”, Fultz eds. 25–93.
Augusztinovics, M. (2005): “Népesség, foglalkoztatottság, nyugdíj”, Közgazdasági Szemle, LII. évf., 2005. május (429–447. o.)
Benczúr, Péter (1999): “Changes in the Implicit Debt Burden of the Hungarian Social Security”, MNB Working Paper 1999/8.
CBO (1995): “Who pays and when? An assessment of generational accounting”, The Congress of the United States, Congressional Budget Office, November 1995.
FSAP (2005): “Financial Sector Assessment Program Update, Hungary, Aide-Mémoire”, World Bank – International Monetary Fund, March 2005.
Hablicsek, László (2005): “Demográfiai forgatókönyvek és a gazdasági aktivitás előrebecslése hosszú távú nyugdíjmodellezéshez”, manuscript, Budapest, 2005. június
Orszag, Peter R. (1999): “Administrative Costs in Individual Accounts in the United Kingdom, Center on Budget and Policy Priorities”, March 1999.
Palacios, Robert – Rocha, Roberto (1998): “The Hungarian Pension System in Transition”, Social Protection Discussion Paper Series No. 9805, Social Protection Unit, Human Development Network, World Bank
Rocha, Roberto – Vittas, Dimitri (2002): “The Hungarian Pension Reform: A Preliminary Assessment”, Feldstein and Sibert, eds. 365-400.
Simonovits, András (2002): “The Hungarian Pension System: The Permanent Reform”, Hitotsubashi University.
World Bank, Human Development Sector Unit, Europe and Central Asia Region (2002): “Pension reform in Russia: Design and implementation”

24
Appendix 1 – The MNB pension model
A program for modelling the Hungarian Pension Insurance Fund was initially developed by the World Bank prior to the Hungarian pension reform to enhance the decision-making process. It was aimed to help evaluate the effects of the reform and give estimates on the order of magnitude of measures that needed to be undertaken to balance the Government Pension Insurance Fund.
The Ministry of Finance has a legal obligation to produce a 50-year projection of the main trends in the Hungarian pension system each year. The Ministry of Finance therefore adopted the model created by the World Bank and developed it further to reflect the specific features of the Hungarian system.
General description
The MNB pension model is a revised, updated and upgraded version of the Ministry of Finance’s model, so that it is now capable of performing the simulations and calculations the results of which are presented in this paper. In particular, the program now produces consistent outputs and it is able to run also in single-pillar mode, which enables us to calculate the break-even return and the impact of the introduction of the second pillar on the sustainability of the system. An additional new feature is that the simulation horizon can be extended to up to 100 years, which is crucial from the point of view of the accuracy of estimation. In order to increase model transparency and allow for recalibration using expert judgment, we extended the range of parameters that can be inputted instead of being hard coded in the program at a given value. Input data have been updated and, in several cases, estimated inputs and data generated by the program have been replaced by factual data. A prime example of this is the exogenously inputted demographics by Hablicsek (2005), instead of a population projection calculated by ad-hoc formulae within the code.
The model is based on VBA for Excel. Excel spreadsheets are used to store input and output data, as well as provide a user-friendly interface with control buttons and toggle switches to allow running simulations according to user preferences in making certain assumptions. We could not agree more with the following remark by the World Bank (2002): „these programs are highly overloaded with calculations traditionally based on VBA for Excel. In this connection it is very difficult to follow, check and control calculations. Program code resembles “black box”. Calculations and analysis turn into time consuming job and often bring head ache.”
The main controls include the choice of system design. We can run the model in single-pillar mode, in which case we treat all people as if they belonged to the first pillar (pay-as-you-go). This option allows the user to run simulations of a hypothetical pension system, in which the second pillar is not introduced. Alternatively, we can choose to model the actual pension system and run the simulation in multi-pillar mode, by taking into account the so-called “opt-out rates”. This is the share of pensioners and employees in each cohort receiving part of their benefits from and paying contributions to the second pillar. Opt-out rates have proved to be a crucial factor in determining the impact of the introduction of the second pillar on the balance of the Pension Insurance Fund. The “opt-out rate” for base year is read from an input sheet, for future years, however, we have to use judgment. We assume that all entrants to the labour market at the age of 18 become members of the

25
mixed system, as regulated by law. However, we cannot exclude that individuals in older cohorts may also join the second pillar as they enter the labour market after years spent in higher education etc. Regarding these cohorts, we offer a choice to the user what assumptions he makes on future entrants to the second pillar. Either we may choose to divert all new labour market entrants in these cohorts (calculated as the change in the activity rate of the given cohort) to the mixed system or opt for a technical solution that increases the “opt-out rate” in a way that generates a smooth and credible pattern among cohorts in time.
A third option for system design is needed to compare the hypothetical single-pillar system with the existing multi-pillar one, including the calculation of the break-even return of the second pillar and the improvement in sustainability (the change in IPL) as a result of the introduction of the second pillar. In this case, the program runs twice: in the first run it calculates and saves the required variables in single-pillar mode then it runs again in multi-pillar mode. Finally, it produces outputs showing the difference between the two simulations.
On the main screen, the user may choose among five different demographic scenarios (see Hablicsek, 2005), that include different assumptions for migration effects and are backed by corresponding survival tables.
The user also has to make a choice among activity scenarios (baseline or optimistic). A third activity scenario built into the model is the one used by the European Commission’s Ageing Working Group, which, if selected, also uses the European Commission’s projection on employment, real GDP and labour productivity growth rates.
The time horizon for the simulation is also a variable determined by the user. The “base year” (the first year of the simulation), however, cannot be varied arbitrarily, because we need to provide extensive factual data on initial conditions on a separate worksheet. The final year of the simulation can be entered with the only limitation that all input time series have to be given values on the input sheets.
Major calculations
The program performs deterministic calculations. Values for a number of variables are read from an input worksheet for base year, which is currently 2004. Calculations are done in a loop and the main loop is executed from the base year to the final year (specified by user). In each year, the program calculates a wide range of variables, based on the value of the given variable in the previous year and/or according to other rules or projections.
In the remaining part of Appendix 1 we briefly describe the major calculations that are done in any given year. We will discuss the various operations in 3 groups, starting with calculations done in the base year only (i). Most interestingly, we give a general idea of the calculations done in the future years but not in base year (ii). Finally, we discuss the aggregations across generations, which are carried out in all years (iii).
i) In the base year the program reads the number of each type of pensioners detailed by cohorts, their nominal benefits and some other data on the pension system necessary for further calculations. It also reads projected paths for regulatory parameters, macro and other variables. Demographic developments (population and survival tables) are inputted exogenously, according to the user’s choice of the five different scenarios.

26
ii) In all years after base year the program basically performs two operations. First, it “advances” each type on pensioner in each cohort who had already been a pensioner of the same type in the previous year, in a younger cohort. Pension benefits of these “continued” pensioners are also advanced; i.e. raised according to the Swiss formula. Second, it calculates the number of new (“entry”) pensioners based on detailed eligibility criteria and computes their benefits. Concerning new old-age pensioners, we will go into further details below. All other (disability, survivor) entry pensioners are calculated according to simple rules and their pensions are indexed to the change in old-age entry pensions.
New old-age pensioners in any given year are calculated in a loop for all cohorts. We begin by calculating the cohort’s average number of service years using past activity and employment rates. Given the service years and additional data on people’s willingness to work longer than the statutory retirement age or retire earlier by accepting a penalty, we calculate their pension benefits. Pension computations cover all regulations13 currently effective in Hungary, including pension multipliers and adjustment factors for service years (maternity leave), valorisation of past earnings to the second year before retirement and degressive income brackets.
iii) For each year, the program aggregates the total revenue of the pension system. The aggregation is done across cohorts. We receive the aggregates detailed as revenues from employers and employees, both for the first and the second pillar, then we sum them up. We then move on to accumulate benefits for each type of entitlement which sum up to all the benefits the pension system is due to pay out. Finally, outputs are generated according to the user’s choice.
Issues for further research
Although we have addressed most of the shortcomings of the old model14, some unresolved issues remain. One is the financing of the disability scheme. As noted in Section 2, not all of the disabled below retirement age receive benefits from the Pension Insurance Fund, but the majority is financed by the Health Insurance Fund. Our dataset cannot differentiate between these two types of entry disability pensioners, so in our baseline scenario we use a switch to take a certain rate (see below) of new handicapped out of the pension system every year. As long as they are below retirement age, we keep track of them and their benefits, and consider them as active and paying both employer and employee contributions. As soon as they reach the retirement age, they are transferred to the Pension Insurance Fund. There are two points where we need to use judgement: we assume that 25% of the new disabled are so severely handicapped that they will receive their benefits from the Pension Insurance Fund (and become inactive for the rest of their lives). Second, we have a broad average of entry disability benefits, which, as benefits are lower in the Health Insurance Fund, is below the average of continued disability benefits drawn from the Pension Insurance Fund. We multiply the average entry disability pensions in base year by an adjustment factor of 1.35 to get a plausible (steady) time profile for disability benefits. This problem can be resolved more reassuringly if we obtain data for new disability pensioners drawing benefits from the Pension Insurance Fund.
13 A comprehensive and detailed discussion of the current legislation can be found in Augusztinovics et al. (2002). 14 A full list of changes is available with the authors.

27
Another issue is the treatment of service years and pension contributions of the unemployed and the inactive. We do not have data on the number of unemployed and inactive contributors and we also lack information on the income base on which they pay their contributions. In order to maintain consistency, we chose not to include their contributions in our calculations; neither do we give cohorts any service years for the unemployed or inactive years.

28
Appendix 2 – Simulation of legislated changes in 2013
A major policy question arises regarding the changes in the benefit formula and the introduction of taxation of pension income that are to take place in 2013. These changes currently envisaged by the pension law would on the one hand involve a new pension formula based on past gross (as opposed to net) earnings and a different multiplier. On the other hand pensions are supposed to be taxed. For simulation purposes we set up a toggle switch that, if selected, disregards the above changes in the calculation and taxation of pensions.
The “no policy change” assumption in its original sense implies that current legislation remains in place, meaning that pensions will fall by a considerable amount. As a number of issues are left open in the legislation (this is also noted in Augusztinovics et al., 2005) and the taxation of pensions without further corrections does not seem feasible politically, in our baseline scenario we interpret “no policy change” as a scenario in which no change occurs in the policy environment from 2012 to 2013. Below we show simulation results of the impact of the changes in the legislation on the balance of the Pension Insurance Fund and on entry replacement ratios.
Figure A2.1: Entry old-age replacement ratios (with and without adjustments in 2013)
40
45
50
55
60
65
70
75
80
2004
2009
2014
2019
2024
2029
2034
2039
2044
2049
2054
2059
2064
2069
2074
2079
2084
2089
2094
2099
2104
%
40
45
50
55
60
65
70
75
80%
Single pillar (not adjusted) Single pillar Two-pillar system (not adjusted) Two-pillar system
Source: Authors’ projection
From the model simulations shown in Figure A2.1 we may conclude that if all pension benefits are taxed by standard personal income tax rates, then from 2012 to 2013 the new formula would lead to a one-off drop in entry pensions of 7-9 percentage points.15 Moreover, there would be an even larger decline in continued pensions (as taxation would not even partially be offset by larger multipliers used when calculating entry pensions).
15 We used a 2.2% net real rate of return in the second pillar.
29
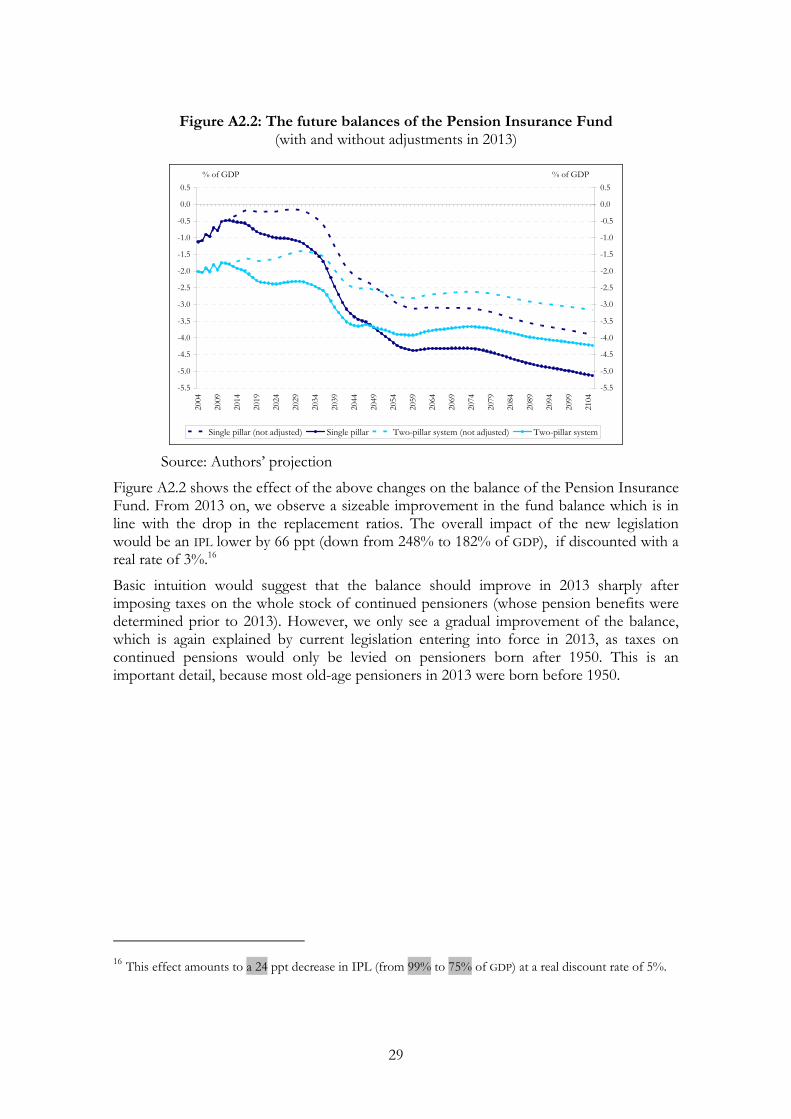
Figure A2.2: The future balances of the Pension Insurance Fund (with and without adjustments in 2013)
-5.5
-5.0
-4.5
-4.0
-3.5
-3.0
-2.5
-2.0
-1.5
-1.0
-0.5
0.0
0.520
04
2009
2014
2019
2024
2029
2034
2039
2044
2049
2054
2059
2064
2069
2074
2079
2084
2089
2094
2099
2104
% of GDP
-5.5
-5.0
-4.5
-4.0
-3.5
-3.0
-2.5
-2.0
-1.5
-1.0
-0.5
0.0
0.5% of GDP
Single pillar (not adjusted) Single pillar Two-pillar system (not adjusted) Two-pillar system
Source: Authors’ projection
Figure A2.2 shows the effect of the above changes on the balance of the Pension Insurance Fund. From 2013 on, we observe a sizeable improvement in the fund balance which is in line with the drop in the replacement ratios. The overall impact of the new legislation would be an IPL lower by 66 ppt (down from 248% to 182% of GDP), if discounted with a real rate of 3%.16
Basic intuition would suggest that the balance should improve in 2013 sharply after imposing taxes on the whole stock of continued pensioners (whose pension benefits were determined prior to 2013). However, we only see a gradual improvement of the balance, which is again explained by current legislation entering into force in 2013, as taxes on continued pensions would only be levied on pensioners born after 1950. This is an important detail, because most old-age pensioners in 2013 were born before 1950.
16 This effect amounts to a 24 ppt decrease in IPL (from 99% to 75% of GDP) at a real discount rate of 5%.

30
Appendix 3 – Simulations of different scenarios
In this section we show simulation results with various assumptions on demographic trends and activity rate developments.
Figure A3.1 shows the results with the younger demographic scenario. The chart suggests that the sustainability of the single-pillar PAYG is considerably better than in the baseline case with an implicit debt of 94% of GDP (see Table A3.1 for IPLs). Privatising that scheme leads to higher deficits over the entire projection horizon and sustainability is not improved in the multi-pillar system. The reason why the reform pays off after 2050 in the baseline scenario is that expenditures are so much higher than revenues in absolute terms that even a reduction of expenditures by a smaller proportion than of revenues results in a narrowing of the deficit. With the younger demography this is not the case, which explains why we cannot capture the pay-off phase of the systemic reform, and only see the two curves meet at the very end of the projection period.
Figure A3.1: Future balances of the Pension Insurance Fund (younger population and baseline activity rate assumptions)
-5.5
-5.0
-4.5
-4.0
-3.5
-3.0
-2.5
-2.0
-1.5
-1.0
-0.5
0.0
0.5
2004
2009
2014
2019
2024
2029
2034
2039
2044
2049
2054
2059
2064
2069
2074
2079
2084
2089
2094
2099
2104
% of GDP
-5.5
-5.0
-4.5
-4.0
-3.5
-3.0
-2.5
-2.0
-1.5
-1.0
-0.5
0.0
0.5% of GDP
Single pillar (PAYG only) Two-pillar system
Source: Authors’ projection
The older scenario presented in the next Figure shows a very dismal future: deficits of the Pension Insurance Fund are projected to reach 6% of GDP by 2050 and remain there indefinitely. Implicit public debt in the system reaches 350% of GDP and the reform seems much more effective than in the baseline case. Furthermore, simulations with younger and older demographic scenarios also demonstrate the major role that demography plays in the future of the pension system.
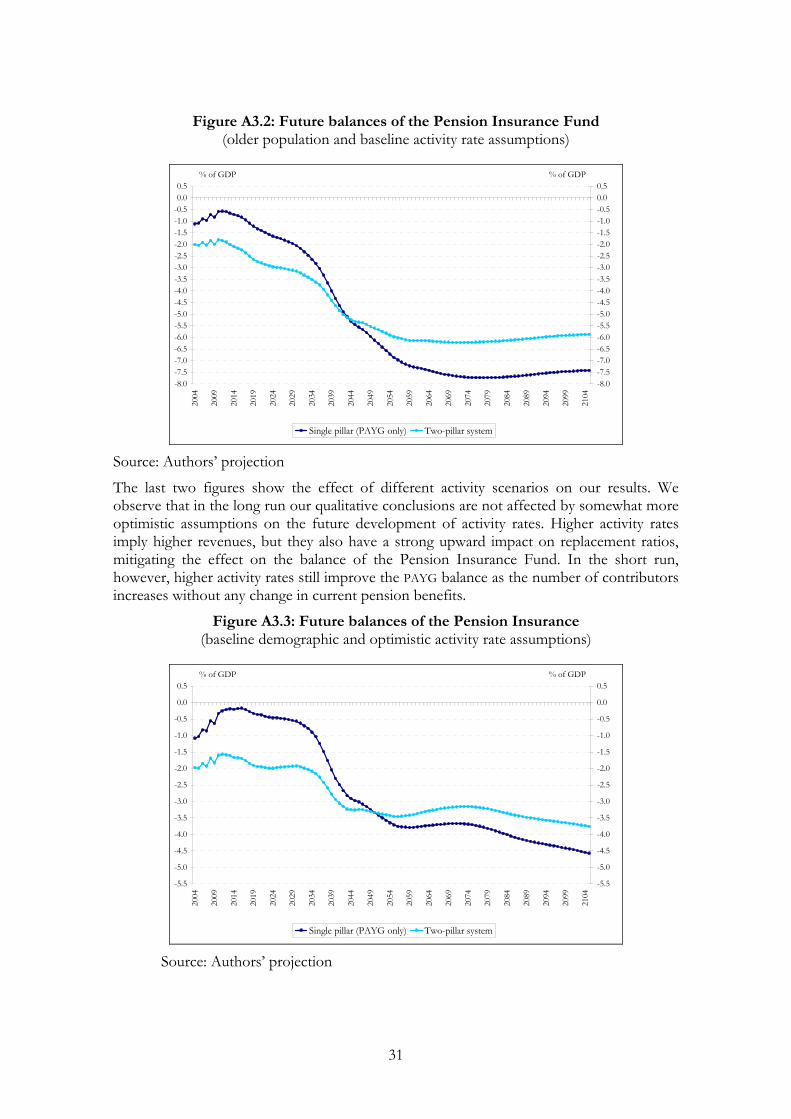
31
Figure A3.2: Future balances of the Pension Insurance Fund (older population and baseline activity rate assumptions)
-8.0-7.5-7.0-6.5-6.0-5.5-5.0-4.5-4.0-3.5-3.0-2.5-2.0-1.5-1.0-0.50.00.5
2004
2009
2014
2019
2024
2029
2034
2039
2044
2049
2054
2059
2064
2069
2074
2079
2084
2089
2094
2099
2104
% of GDP
-8.0-7.5-7.0-6.5-6.0-5.5-5.0-4.5-4.0-3.5-3.0-2.5-2.0-1.5-1.0-0.50.00.5
% of GDP
Single pillar (PAYG only) Two-pillar system
Source: Authors’ projection
The last two figures show the effect of different activity scenarios on our results. We observe that in the long run our qualitative conclusions are not affected by somewhat more optimistic assumptions on the future development of activity rates. Higher activity rates imply higher revenues, but they also have a strong upward impact on replacement ratios, mitigating the effect on the balance of the Pension Insurance Fund. In the short run, however, higher activity rates still improve the PAYG balance as the number of contributors increases without any change in current pension benefits.
Figure A3.3: Future balances of the Pension Insurance (baseline demographic and optimistic activity rate assumptions)
-5.5
-5.0
-4.5
-4.0
-3.5
-3.0
-2.5
-2.0
-1.5
-1.0
-0.5
0.0
0.5
2004
2009
2014
2019
2024
2029
2034
2039
2044
2049
2054
2059
2064
2069
2074
2079
2084
2089
2094
2099
2104
% of GDP
-5.5
-5.0
-4.5
-4.0
-3.5
-3.0
-2.5
-2.0
-1.5
-1.0
-0.5
0.0
0.5% of GDP
Single pillar (PAYG only) Two-pillar system
Source: Authors’ projection
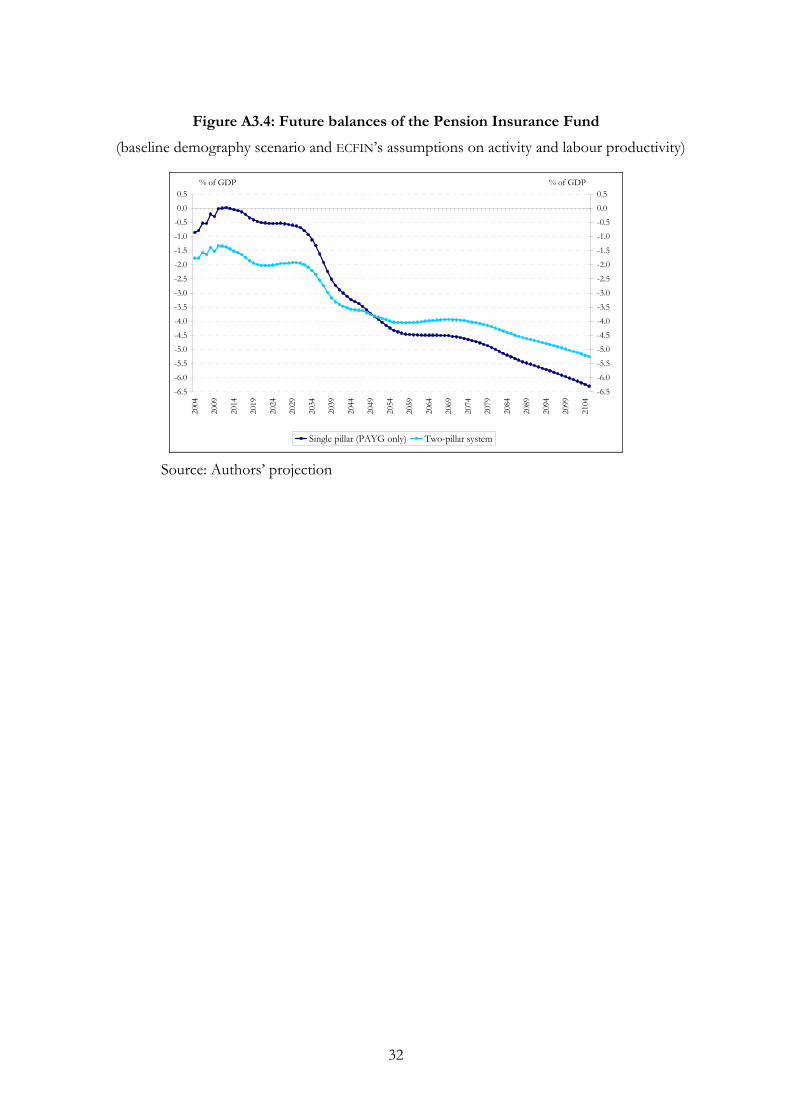
32
Figure A3.4: Future balances of the Pension Insurance Fund
(baseline demography scenario and ECFIN’s assumptions on activity and labour productivity)
-6.5
-6.0
-5.5
-5.0-4.5
-4.0
-3.5
-3.0
-2.5
-2.0
-1.5
-1.0
-0.5
0.0
0.520
04
2009
2014
2019
2024
2029
2034
2039
2044
2049
2054
2059
2064
2069
2074
2079
2084
2089
2094
2099
2104
% of GDP
-6.5
-6.0
-5.5
-5.0-4.5
-4.0
-3.5
-3.0
-2.5
-2.0
-1.5
-1.0
-0.5
0.0
0.5% of GDP
Single pillar (PAYG only) Two-pillar system
Source: Authors’ projection

33
Table A3.1 summarises the IPLs in the various scenarios and also shows the effect of the introduction of the second pillar on the IPL, in case of debt financing and tax financing as well. Baseline+ and baseline- refer to baseline demographic trends with positive and negative migration balances compared to baseline, respectively.17 We may conclude that reasonable migration effects do not alter our results significantly.
Table A3.1: Implicit public liabilities
Baseline Baseline -525% -507% 18% -455% 70%Baseline + Baseline -539% -523% 16% -469% 70%Baseline - Baseline -510% -491% 19% -441% 70%Younger Baseline -204% -268% -64% -204% 0%
Older Baseline -817% -729% 88% -681% 135%Baseline Optimistic -450% -446% 3% -389% 61%Baseline ECFIN -484% -479% 5% -422% 62%
Baseline Baseline -229% -248% -19% -204% 25%
Baseline + Baseline -231% -252% -21% -207% 25%Baseline - Baseline -227% -244% -17% -202% 25%Younger Baseline -94% -145% -51% -94% 0%
Older Baseline -363% -352% 11% -312% 51%Baseline Optimistic -191% -218% -27% -170% 21%Baseline ECFIN -205% -231% -26% -183% 22%
Baseline Baseline -72% -99% -27% -67% 5%Baseline + Baseline -71% -99% -28% -66% 4%Baseline - Baseline -73% -99% -26% -68% 5%Younger Baseline -33% -69% -35% -33% 0%
Older Baseline -114% -133% -19% -103% 11%Baseline Optimistic -56% -87% -31% -52% 4%Baseline ECFIN -59% -90% -31% -55% 4%
Using a 5% real discount rate
Budget adjusted for shortfall in
contributions (tax-financing)
Demography Activity
Using a 3% real discount rate
Actual multi-pillar system
(Baseline)
Change (debt-
financing i.e. simple
difference)
Change (tax-financing)
Single-pillar system
Using a 2% real discount rate
Source: Authors’ calculations
17 Migration balance is in the baseline scenario +12.000, while it is +4.000 in the baseline- and +20.000 in the baseline+ scenario. For further details see Hablicsek (2005).