the temperature-pulse rate curve of the ...the temperature-pulse rate curve of the isolated...
TRANSCRIPT

THE TEMPERATURE-PULSE RATE CURVE OF THEISOLATED FROG'S HEART {RANA TEMPORARIA)
BY C. L. SMITHFrom the Zoological Department, University of Liverpool
(Received 6 September 1950)
(With Eleven Text-figures)
A seasonal difference in the temperature-pulse rate curve of the isolated frog's heartwas described by Barcroft & Izquierdo (1931). In the summer they found an almostlinear relation between temperature and frequency of pulsation from 5 to 200 C,while in the winter the relation was exponential over the same temperature range.Carter (1933) investigated the effects of various endocrine and related substances onthe form of the temperature-pulse rate curve. He found that the addition ofthyroxine to the medium perfusing the heart transformed the curve given by thewinter heart into the summer form, but had no effect on that of the summer heart.He concluded that the seasonal change in the temperature effect on heart rate wascontrolled by the endocrine system, and that the thyroid by increase in its activityin the summer was the effective agent.
Although the change of frequency with temperature shows this seasonal difference,no experiments have been made to determine the transition periods between the twotypes of heart curve. Histological studies of the variations in the secretory appearanceof the frog's thyroid have been made by Sklower (1925) and Meisenheimer (1936)and, if the agency effecting the alteration in the relation between heart rate andtemperature is the thyroid hormone, it might be expected that seasonal data wouldprovide physiological confirmation of the earlier histological observations. FromSeptember 1946, the form of the temperature-pulse rate curve of the isolated heartwas determined on samples of frogs collected at monthly intervals throughout theyear. In the course of this work it soon became apparent that the curves obtainedcould not be simply classified into the two types described by Barcroft & Izquierdo(1931), but that other types were also appearing.-This rendered interpretation oftheir seasonal distribution in terms of thyroid activity impossible, as the factorsleading to the appearance of the new types were not known. One of these new typesof curve was assumed to be due to the uncomplicated action of temperature on thepulse rate, and was selected for further experimental work. Various endocrinepreparations were added to the media perfusing such hearts, and it was foundpossible to reproduce the other types of curve which had been obtained fromnormal hearts. This paper presents a description of the various types of curveobtained in the seasonal survey, and their possible analysis in the light of theseexperimental results. Finally their seasonal distribution, particularly with referenceto thyroid activity, is considered.
jEB.28,2 10
142 C. L. SMITH
MATERIAL AND METHODSThe frogs used in the seasonal survey were all obtained from a collector in Shropshire,and on arrival in the laboratory were kept in a well-lit and ventilated room wherethe temperature was approximately atmospheric. In view of the time involved insetting up the heart preparation and the determination of the temperature-pulserate curve it was not possible to carry out more than one experiment a day. It wasdesirable to work with a minimum sample number of twelve animals, so that it wasinevitable that the later observations in each month were made on frogs which hadbeen in captivity and unfed for periods as long as 14 days. With a view to minimizingthis delay the perfusion apparatus was duplicated so that two hearts could be set upside by side and their beat recorded on the same drum. This arrangement was alsofound to be very convenient in the later experimental work, as it enabled parallelexperiments to be made. In general, from the beginning of 1947 onwards twoslightly smaller samples were obtained each month, so that the delay in completingthe observations rarely exceeded 1 week after capture, and also the total monthlysample number was increased to between fifteen and twenty animals.
The heart was isolated from the frog, after pithing, by ligaturing the anterior venaecavae and tying a cannula into the inferior vena cava. The heart was then removed toa perfusion apparatus essentially similar to that described in detail by Carter (1933).In the present work no aortic cannula was used, so that the heart discharged freelyinto the beaker in which it was suspended. Adequate aeration of the medium wasensured by bubbling air into the beaker containing the heart, and by using an air-lift system to return the fluid, after perfusion, to the upper reservoir. One litre ofRinger solution was used for perfusing each heart. A venous pressure of 2-3 cm. ofwater was sufficient to ensure filling of the heart without auricular distension. Thevenous cannula was made from drawn-out § in. tubing, and the upper part of thecannula served as a reservoir in which temperature equilibration of the Ringer withthat in the surrounding beaker took place before it entered the heart. In view of thevolume of this part of the cannula, and the depth to which it was immersed in thebeaker, it is not thought that there was any significant difference in the temperatureof the Ringer in contact with the two sides of the heart. The temperature of theRinger was kept constant at any particular value for 5 min. before the rate of beatwas recorded, and no experiments were started until the heart had been isolated andunder perfusion for approximately 2 hr. The rate of beat was usually recorded at 2°intervals over the range 7-170 C. This range was adequate to show the differencebetween the two types of curve described by Barcroft & Izquierdo (1931), and therewas no danger of exposing the heart to too high a temperature. In the later work,where the effect of various extracts on the heart curve was under investigation, thetemperature range was often extended to 210 C.
The perfusion fluid used was a Ringer solution of the composition given byCarter (1933), and the pH was adjusted to 7-6 by phosphate buffers before thecommencement of each set of observations. All the seasonal curves were obtainedby perfusing this Ringer after the addition of adrenaline, whereas Carter usedunmodified Ringer. The concentration of adrenaline used varied from 1 in 5 x io6
Temperature-pulse rate curve ofisolated frog's heart 143
1 in 2 x io7, the greater part of the observations being made with a concentrationof 1 in io7. The heart was perfused with adrenaline-Ringer immediately afterisolation, the adrenaline being renewed at the same concentration 20 min. beforefrequency observations were started. The order of temperature change used in thispart of the work was 13, 15, 17, 13, n , 9-and 7° C, and the experiments werecompleted in about 1J hr. from the second adrenaline addition.
TYPES OF TEMPERATURE-PULSE RATE CURVE
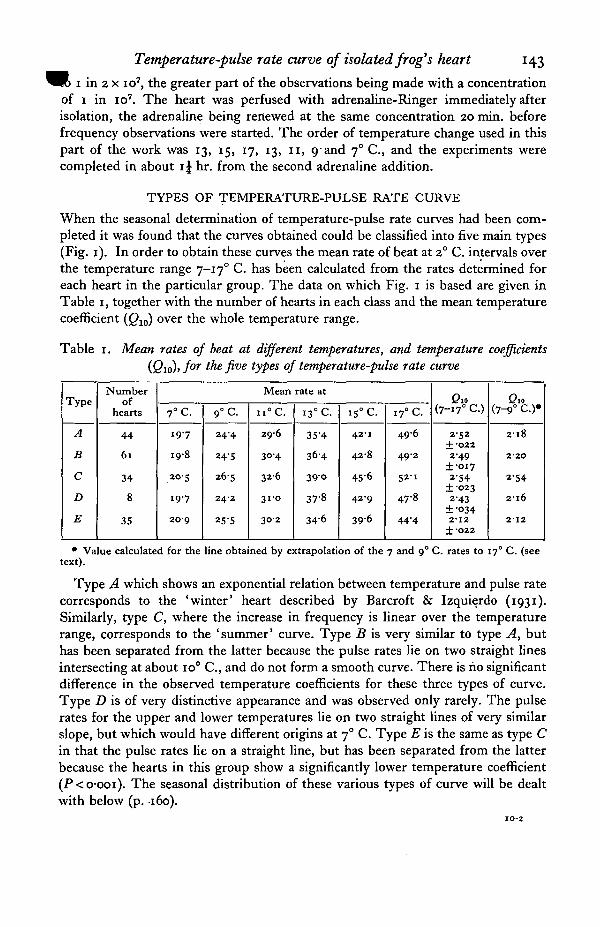
When the seasonal determination of temperature-pulse rate curves had been com-pleted it was found that the curves obtained could be classified into five main types(Fig. 1). In order to obtain these curves the mean rate of beat at 2° C. intervals overthe temperature range 7-170 C. has been calculated from the rates determined foreach heart in the particular group. The data on which Fig. 1 is based are given inTable 1, together with the number of hearts in each class and the mean temperaturecoefficient (Q10) over the whole temperature range.
Table 1. Mean rates of beat at different temperatures, and temperature coefficients(Qio)> for the five types of temperature-pulse rate curve
Type
A
B
C
D
E
Numberof
hearts
44
61
34
8
35
Mean rate at
7°C.
197
198
20-5
19-7
20-9
9°C.
24-4
24'5
26s
242
25-5
n° C.
29-6
30-4
32-6
31-0
30-2
13° C.
35'4
364
390
37-8
34-6
15° C.
42-1
42-8
45'6
42-9
396
17° C.
49-6
49-2
52-1
47-8
44"4
010(7-i7° C.)
2-52±•0222-49
±•0172-54
±•0232-43
±•0342-I2
+ -O22
010(7-9° C.)*
2 1 8
2-2O
2-54
2-16
2-12
• Value calculated for the line obtained by extrapolation of the 7 and 9° C. rates to 17° C. (seetext).
Type A which shows an exponential relation between temperature and pulse ratecorresponds to the 'winter' heart described by Barcroft & Izquierdo (1931).Similarly, type C, where the increase in frequency is linear over the temperaturerange, corresponds to the 'summer' curve. Type B is very similar to type A, buthas been separated from the latter because the pulse rates lie on two straight linesintersecting at about io° C , and do not form a smooth curve. There is no significantdifference in the observed temperature coefficients for these three types of curve.Type D is of very distinctive appearance and was observed only rarely. The pulserates for the upper and lower temperatures lie on two straight lines of very similarslope, but which would have different origins at 70 C. Type E is the same as type Cin that the pulse rates lie on a straight line, but has been separated from the latterbecause the hearts in this group show a significantly lower temperature coefficient(P<o-ooi). The seasonal distribution of these various types of curve will be dealtwith below (p. 160).
144 L. SMITH
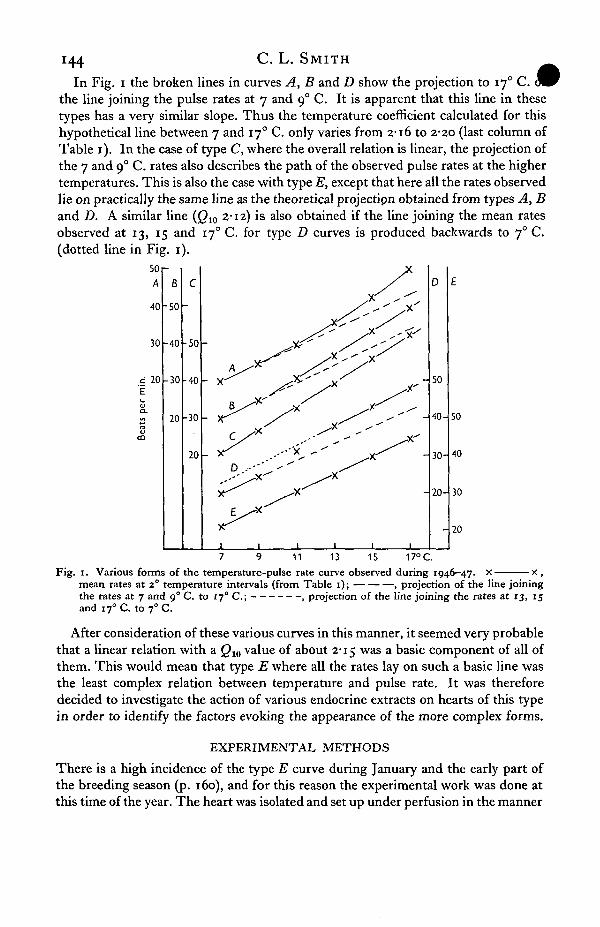
In Fig. i the broken lines in curves A, B and D show the projection to 170 C.the line joining the pulse rates at 7 and 90 C. It is apparent that this line in thesetypes has a very similar slope. Thus the temperature coefficient calculated for thishypothetical line between 7 and 170 C. only varies from 2-16 to 2-20 (last column ofTable 1). In the case of type C, where the overall relation is linear, the projection ofthe 7 and 90 C. rates also describes the path of the observed pulse rates at the highertemperatures. This is also the case with type E, except that here all the rates observedlie on practically the same line as the theoretical projectipn obtained from types A, Band D. A similar line (Q10 2-12) is also obtained if the line joining the mean ratesobserved at 13, 15 and 170 C. for type D curves is produced backwards to 70 C.(dotted line in Fig. 1).
so r
40 -50 -
30 -40
20 -30
•50
•40
20 -30
20
50
40-
30-
20-
50
40
30
20
x .7 9 11 13 15 17° C.
Fig. 1. Various forms of the temperature-pulse rate curve observed during 1946-47. x —mean rates at 2° temperature intervals (from Table 1); , projection of the line joiningthe rates at 7 and 9° C. to 170 C ; , projection of the line joining the rates at 13, 15and 170 C. to 70 C.
After consideration of these various curves in this manner, it seemed very probablethat a linear relation with a Q10 value of about 2-15 was a basic component of all ofthem. This would mean that type E where all the rates lay on such a basic line wasthe least complex relation between temperature and pulse rate. It was thereforedecided to investigate the action of various endocrine extracts on hearts of this typein order to identify the factors evoking the appearance of the more complex forms.
EXPERIMENTAL METHODS
There is a high incidence of the type E curve during January and the early part ofthe breeding season (p. 160), and for this reason the experimental work was done atthis time of the year. The heart was isolated and set up under perfusion in the manner

^ ^ Temperature-pulse rate curve of isolated frog's heart 145
^previously described. When testing the action of endocrine extracts on the heart thegeneral procedure was as follows. After the isolated heart had been beating underperfusion for approximately 2 hr. the Ringer was removed from the apparatus, and,unless the effect of adrenaline was the specific object of the experiment, adrenalinein a concentration of 1 in io7 or 1 in 2 x io7 was added. The Ringer was then re-adjusted to pH 7-6 by adding phosphate buffer (NagHPO,,), and perfusion startedagain. Records of the rate of beat at 2° C. intervals over the temperature range 7-170 C.or 7-21 ° C. were started 20 min. after the adrenaline addition. The usual practicewas to start the observations at 70 C. and raise the temperature progressively to theupper limit. This was done for experimental convenience, as it was found thatraising the temperature of the heart vessel could be effected more rapidly thantemperature reduction. In general, a full set of observations could be completedwithin 70 min. from the adrenaline addition.
At the end of the preliminary control experiment the particular endocrine extractunder investigation was added to the Ringer in appropriate concentration, and theheart left under perfusion for 1 -̂2 hr. At the end of this time the Ringer was re-buffered, adrenaline added at the same concentration as before, and another set ofobservations made. The direction of temperature change, time between observations,and total time taken for the experiment, were, as far as possible, the same in bothexperiments. In some cases it was necessary to make a third set of observations afterfurther alteration of the medium. The third experiment was carried out in the sameway as the second, and, although in such cases the heart had been isolated forapproximately 9 hr., the rate and amplitude of beat were usually well maintained.Occasionally hearts were kept under perfusion for 24 hr. after isolation, whena definite change to the hypodynamic state showing reduction in both rate andamplitude was generally apparent (Clark, Eggleton, Eggleton, Gaddie & Stewart,1938).
EXPERIMENTAL RESULTSCarter (1933) found that pituitrin, thymus extract, and extracts of non-endocrineorgans such as muscle and salivary glands, did not affect the form of the temperature-pulse rate curve. In the present work preliminary experiments were made toinvestigate the action of acetylcholine, eserine, atropine, pitressin, and oxytocinon the type E curve. While some of these agents materially changed the rate of beatof the heart, none of them produced any significant change in the relation betweentemperature and frequency. Treatment of the heart with an extract of anteriorpituitary gland, with thyroxine or with adrenaline was, however, found to lead toalteration in the temperature-pulse rate curve.
(i) Anterior pituitary extract
Through the courtesy of Organon Ltd. a supply of a general extract of the anteriorpituitary was made available. This extract was prepared by the method described byYoung (1941), and will be referred to as Young's Pituitary Extract (Y.P.E.). Theaddition of 0-5 ml. of Y.P.E. (=125 mg. of fresh gland) to the litre of Ringer perfusingthe heart led to a marked and reproducible alteration of the type E temperature-

146 C. L. SMITH
pulse rate curve. The record of a typical experiment is shown in Fig. 2. The contr™experiment with adrenaline 1 in 107 gave the linear, low Q10, relation characteristicof the E type. The second experiment, however, after the addition of 0-5 ml. Y.P.E.per litre shows that, although the rates of beat at 7 and 90 C. were identical in bothcases, there has been an increase in rate at the higher temperatures. Not only hasthere been an increase in rate, but also the rates at 13, 15 and 17° C. lie on a line ofsimilar slope to that found in the first experiment, but which would have a higherorigin at 70 C. (broken line in Fig. 2). Thus the type E relation has been changed totype D (Fig. 1) by the anterior pituitary extract. The observed Q10 between 7 and170 C. for the second experiment is 2-38 compared with 2-15 for the first experiment,while the upper line in the second experiment would have given Q1Q 2-13 over thewhole range. This characteristic change in the temperature-pulse rate curve afterthe addition of Y.P.E. to the medium was confirmed by many experiments.
50 -
40
30
20
10
13 15 17°C.
Kig. 2. Action of anterior pituitary extract (Young, 1941) on type E heart. Frog no. 305, ?, 30 April1948. x x , perfused with Ringer containing adrenaline 1 in 10'; O O, perfusedwith same solution containing 0-5 ml. Y.P.E. per litre; , projection of line joining 13,15 and 17° C. rates to 70 C.
An almost identical response was obtained after adding 0-5 ml. of Antoxylin(Oxoid Ltd/) to the Ringer. This preparation is stated to be equivalent to 65 mg.of desiccated anterior pituitary per 0-5 ml. The response with Antoxylin differedslightly from that with Y.P.E. in that the change-over from the lower to the higherlinear relation was not as abrupt. In some cases it was only above 170 C. thatstabilization of the frequency acceleration on a second straight line was indicated.The basic nature of the response, however, was the same, and minor discrepanciesmay perhaps be attributed to quantitative differences between the extracts.
Experiments have also been made to test the action of crude extracts of froganterior pituitary on type E hearts. These extracts were made by grinding up eightto ten anterior pituitaries, from freshly killed frogs, in Ringer with a little sand, andleaving them to extract for a few hours at room temperature and pH 85. The extractwas then added to the perfusing Ringer, the volume of which in view of the dilutenature of the extract, was reduced to 500 ml. in these experiments.
Temperature-pulse rate curve ofisolated frog's heart 147
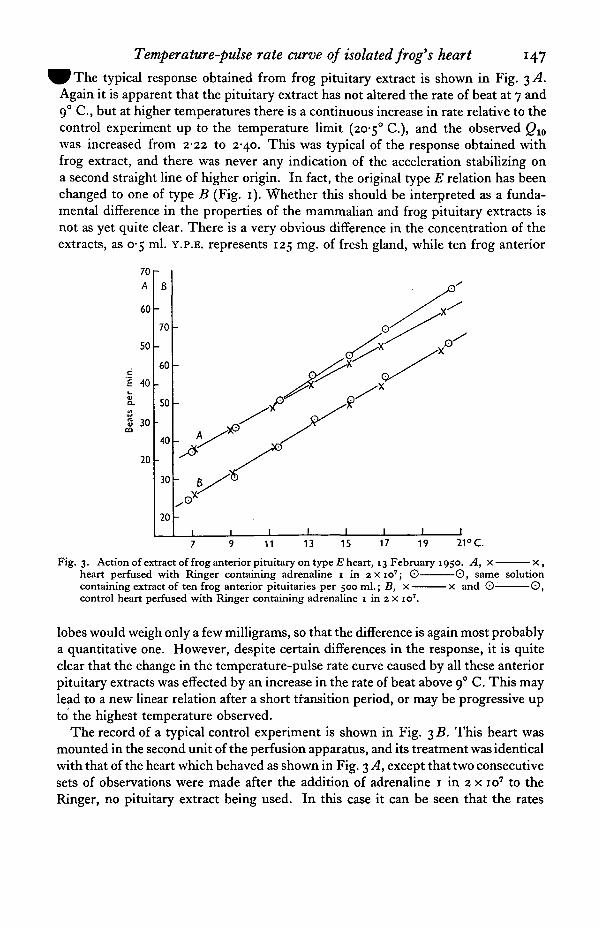
typical response obtained from frog pituitary extract is shown in Fig. 3 AAgain it is apparent that the pituitary extract has not altered the rate of beat at 7 and90 C, but at higher temperatures there is a continuous increase in rate relative to thecontrol experiment up to the temperature limit (20-5° C), and the observed Q10
was increased from 2-22 to 2-40. This was typical of the response obtained withfrog extract, and there was never any indication of the acceleration stabilizing ona second straight line of higher origin. In fact, the original type E relation has beenchanged to one of type B (Fig. 1). Whether this should be interpreted as a funda-mental difference in the properties of the mammalian and frog pituitary extracts isnot as yet quite clear. There is a very obvious difference in the concentration of theextracts, as 0-5 ml. Y.P.E. represents 125 mg. of fresh gland, while ten frog anterior
70
60
50
c£ 40L.Va.
S 30ca
20
70
60
50
40
30
201
11 13 15 17 19 21° C.
Fig. 3. Action of extract of frog anterior pituitary on type E heart, 13 February 1950. A, x x ,heart perfused with Ringer containing adrenaline 1 in 2x10' ; © 0 , same solutioncontaining extract of ten frog anterior pituitaries per 500 ml.; B, x x and 0- ©,control heart perfused with Ringer containing adrenaline 1 in 2 x io7.
lobes would weigh only a few milligrams, so that the difference is again most probablya quantitative one. However, despite certain differences in the response, it is quiteclear that the change in the temperature-pulse rate curve caused by all these anteriorpituitary extracts was effected by an increase in the rate of beat above 9° C. This maylead to a new linear relation after a short transition period, or may be progressive upto the highest temperature observed.
The record of a typical control experiment is shown in Fig. 3 B. This heart wasmounted in the second unit of the perfusion apparatus, and its treatment was identicalwith that of the heart which behaved as shown in Fig. 3 A, except that two consecutivesets of observations were made after the addition of adrenaline 1 in 2 x io7 to theRinger, no pituitary extract being used. In this case it can be seen that the rates
148 C. L. SMITH
observed in both experiments show no significant departure from the typicalrelationship. The experimental addition of anterior pituitary extract has in no caseresulted in the production of the 'winter' or type A exponential relation. Even aftertreatment with frog pituitary extract (Fig. 3) the temperature-pulse rate curveconsists of two straight lines intersecting at about n ° C. Again this is perhapsa quantitative effect. All the extracts used in these experiments would be expected tocontain a higher concentration of the active principle than that occurring naturallyin the frog. With the most effective extract used (Y.P.E.) the full effect of the pituitaryprinciple is produced between 9 and 130 C. (Fig. 2), but with a weaker preparationthe action has not developed fully even at 200 C. It, therefore, seems very probablethat in the presence of even lower concentrations of the pituitary hormone, thedevelopment of .the synergistic action at intermediate temperatures might be de-pressed, while still being quite marked at the higher temperatures. This would leadto the appearance of an exponential relation, instead of the type shown in Fig. 3.
60 r
50
40c1g. 30
CO
20
10
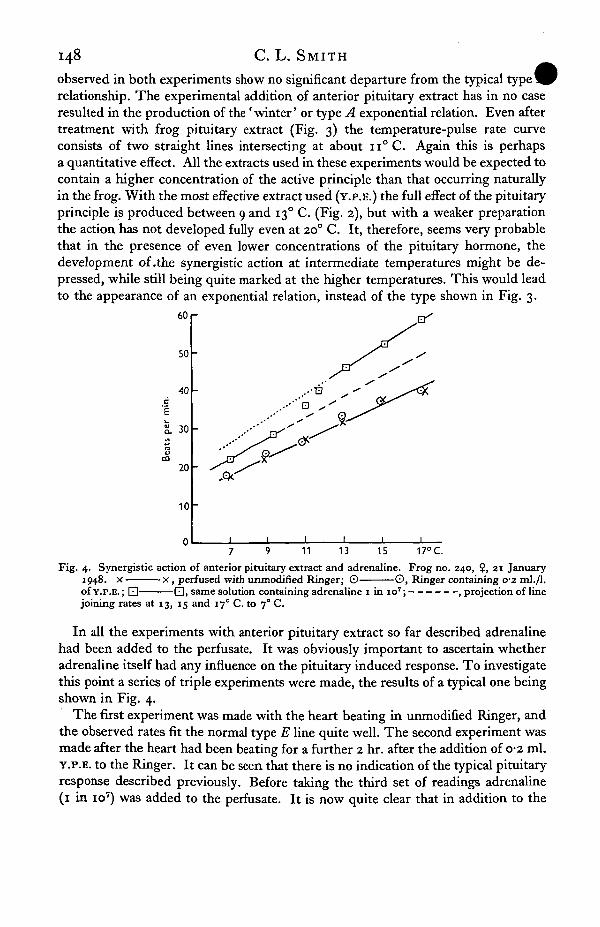
11 13 15 17°C.Fig. 4. Synergistic action of anterior pituitary extract and adrenaline. Frog no. 240, $, 21 January
1948. x x , perfused with unmodified Ringer; O ©, Ringer containing 0-2 ml./l.of Y.P.E. ; • Q, same solution containing adrenaline 1 in 10'; , projection of linejoining rates at 13, 15 and 17° C. to 70 C.
In all the experiments with anterior pituitary extract so far described adrenalinehad been added to the perfusate. It was obviously important to ascertain whetheradrenaline itself had any influence on the pituitary induced response. To investigatethis point a series of triple experiments were made, the results of a typical one beingshown in Fig. 4.
The first experiment was made with the heart beating in unmodified Ringer, andthe observed rates fit the normal type E line quite well. The second experiment wasmade after the heart had been beating for a further 2 hr. after the addition of 0-2 ml.Y.P.E. to the Ringer. It can be seen that there is no indication of the typical pituitaryresponse described previously. Before taking the third set of readings adrenaline(1 in io7) was added to the perfusate. It is now quite clear that in addition to the

Temperature-pulse rate curve of isolated frog's heart 149
spected chronotropic action of adrenaline shown at the lower temperatures, thereis also the typical anterior pituitary induced effect at the higher temperatures(cf. Fig. 2). Experiments such as this plainly indicate that the action of anteriorpituitary extract on the temperature-pulse rate curve is only produced in the presenceof adrenaline. This phenomenon can be most readily explained by assuming thatthere is a synergistic action between adrenaline and an anterior pituitary factor atthe higher temperatures. This synergism results in the positive chronotropic actionof adrenaline being facilitated so that there is a relatively greater increase in rate atthe higher temperatures, and the observed temperature coefficient between 7° and170 C. is increased. The above experiments also enable the temperature threshold,above which this synergistic action appears, to be denned. In all cases the extraincrease in frequency is absent at 9° C, while it is plainly manifest at n ° C. Thusthe threshold lies in the region of io° C. When mammalian pituitary extract wasused the adrenaline facilitation was apparently complete at 130 C, above whichtemperature the normal acceleration was again observed (Figs. 2 and 4). The frogextract did not lead to such an abrupt facilitation of adrenergic action, and the extraincrease in frequency continued over the experimental temperature range. Theextent of the frequency increase caused by this anterior pituitary-adrenaline syner-gism may be quite considerable. For example, in the experiment shown in Fig. 4 thecontinuation of the line joining the rates observed at 7 and 90 C. in the third experi-ment (broken line in Fig. 4) shows that a frequency of 38-5 beats per min. would havebeen obtained at 13° C. if the action of adrenaline had been the same at all tempera-tures. This would represent an increase of 7 beats per min. above the mean rate atthis temperature for the first two experiments. The observed rate at 130 C. wasactually 45-5 per min., so that the frequency response to adrenaline has been increasedtwo-fold by the presence of the anterior pituitary principle.
A facilitation of the action of adrenaline by a secretion of the pituitary, similar tothat postulated above, was suggested by Kepinov (1938, 1949). Kepinov found thatadrenaline had no glycogenolytic action on the perfused liver of the hypophy-sectomized frog, but the typical action of adrenaline appeared if an extract of normalfrog liver or pituitary were added to the perfusion medium. The pituitary extractalone had no glycogenolytic action on the frog liver. Kepinov therefore attributed themarked glycogenolytic action of adrenaline on the frog liver to synergism betweenadrenaline and a substance of anterior pituitary origin. A reduction of the glyco-genolytic action of adrenaline in various hypophysectomized animals, including thefrog, was also found by Bodo, Bloch & Gross (1942) and by Fluch, Greiner & Loewi(1935). Cohen (1947) showed that previous hypophysectomy inhibited the decreasein anaerobic glycolysis of rat diaphragm produced by adrenaline injection, and hesuggested that a pituitary influence on the action of adrenaline might possibly beinvolved.
Search of the literature has not revealed any previous work which suggests thatthe intensity of this anterior pituitary-adrenaline synergism is affected by temperature.All the experiments on the perfusion of the isolated frog's liver mentioned aboveappear to have been made at room temperature, so that the inhibition of pituitary

150 C. L. SMITH
action at temperatures below io° C. found in the present work would not be observed^PThere does not, at present, seem to be any reason why the inhibitory action of lowtemperatures might not also be a feature of the facilitation of the glycogenolyticaction of adrenaline by an anterior pituitary hormone.
Confirmation of the hypothesis that the most commonly observed relation betweenthe frequency of the isolated frog's heart and temperature is attributable in part toa secretion of the anterior pituitary gland, should be forthcoming from experimentson hearts isolated from hypophysectomized frogs. Such experiments have beenmade and rather complex results obtained. Removal of the anterior pituitary waseffected by Hogben's (1923) method, and the temperature-pulse rate curve deter-mined at varying post-operative intervals. Orias (1934) found that about 2 weeks afterhypophysectomy a marked reduction in pulse rate occurred in Bufo arenarum and
60
50
. 40
20
60
50
40
30
20
11 13 15 17°C.
Fig. 5. Effect of hypophysectomy on the temperature-pulse rate curve. A, control heart from frogkept in captivity and unfed for 5 weeks. Beating in Ringer containing adrenaline 1 in 2 x io7
(28 February 1950); B, heart from frog hypophysectomized (anterior lobe only) 5 weeks pre-viously; x— x , beating in Ringer containing adrenaline 1 in 2X10⁷; O 0 , samesolution containing extract of ten frog anterior pituitaries (3 March 1950).
this has been confirmed in the present work for Rana temporaria. Frogs which werehypophysectomized in September 1948 showed a very uniform, low pulse rate whenthe heart was isolated from 15 to 40 days after operation. The mean frequency at70 C. for six hearts perfused with Ringer containing adrenaline (1 in 2 x io7) was14-1 ±0-13 beats per min. These hearts showed a linear relation between temperatureand pulse rate up to 150 C , but a slight extra acceleration occurred at higher tem-peratures. Another series of similar experiments was started in January 1950, whenit was found that up to 5 weeks after operation no bradycardia had developed.A typical experiment made with one of these hearts is shown in Fig. 5.B. Thetemperature-pulse rate curve is obviously linear over the whole range (Q10 222).Curve A in this figure is the record of a parallel experiment on a heart isolated froman unoperated frog which had been in captivity for a similar length of time and

Temperature-pulse rate curve of isolated frog's heart 151
Inder the same conditions as the operated animals. In those cases, where hypo-physectomy was uncomplicated by bradycardia, the appearance of the type E heart,which is to be expected on the basis of the above theory, has in fact occurred.
The action of anterior pituitary extract, in the presence of adrenaline, on heartsfrom hypophysectomized animals was also investigated in some experiments, but inno case was any effect obtained (Fig. 5). This failure of pituitary extract to produceits usual action may perhaps be due to the decreased activity of other endocrineglands as a consequence of hypophysectomy.
Three frogs from the group hypophysectomized at the end of January were keptuntil the end of March before examination, that is from 7 to 8 weeks after operation.These hearts all exhibited the typical bradycardia found in September 1948, andalso the relation between temperature and pulse rate was linear over the range 7-17° C.It may perhaps be of some significance that bradycardia did not develop during theJanuary-February period when a high incidence of type E hearts is normally found.At present it certainly seems that the effects of hypophysectomy on the pulse rateare complex, and may be subject to seasonal influences. It is hoped that further workon this problem will be possible in the near future.
(ii) Thyroxine
Several experiments were made to test the action of thyroxine alone on heartsshowing the type E temperature-pulse rate relation. At the end of the controlexperiment with adrenaline, thyroxine-sodium (B.D.H.) was dissolved in the per-fusate at a final concentration of 1 in io6. It was found that thyroxine alone did notlead to any significant change in the type E curve. The record of a typical experimentis shown in Fig. 6, where the pulse rates after thyroxine addition do not differmaterially from those observed in the control experiment.
The action of thyroxine after previous treatment of the heart with anteriorpituitary extract was also investigated. Fig. 7 is the record of a triple experimentdesigned for this purpose. With adrenaline only added to the Ringer the temperature-pulse rate relation is typical of type E, and the addition of 0-5 ml. per litre of anteriorpituitary extract (Y.P.E.) causes a change-over to type D (Fig. 1). In the thirdexperiment, which was made after the heart had been in the same solution plusthyroxine-sodium (1 in io7) for a further 1 \ hr., another change is apparent. All theobserved rates over the experimental temperature range now fall on a straight lineof steeper slope than that for the first experiment, that is a type C (Fig. 1) curve hasbeen produced. Examination of Fig. 7 shows that this linear relation has resultedfrom the smoothing out of the sharp discontinuity between the two similar linesobtained with adrenaline and pituitary extract. In addition, in the presence ofthyroxine the increased acceleration is maintained at the higher temperatures, sothat there is no indication of stabilization on a second line of low-temperaturecoefficient.
The effect of thyroxine shown in Fig. 7 corresponds to the conversion of thenormal winter heart curve into the summer type described by Carter (1933). Carterstates that ' the rate of increase of beat begins to fall off towards the upper limit of

C. L. SMITH
the range of temperature at a lower point' in the winter heart, so that 'the wintHcurve is often S-shaped within the temperature range and the summer curve is not'.Re-examination of some of Carter's published data indicates that this change in the
60 r-
50
cE 40
8.30
20
1011 13 15 17 19 21°C.
Fig. 6. Action of thyroxine on the type E heart, 14 February 1950. x x , beating in Ringercontaining adrenaline 1 in io7; 0 0 , same solution containing thyroxine-sodium (B.D.H.)1 in io8.
60 r
50
. 40cE
£-30t_i
VCO
20
10 -
11 13 15 17°C.
Fig. 7. Action of anterior pituitary extract and thyroxine on the type E heart. Frog no. 254, $,4 February 1948. x x , beating in Ringer containing adrenaline 1 in2Xio7 ; O O,same solution containing 0-5 ml. of Y.P.E. per litre; Q-experiment, plus thyroxine-sodium 1 in io7.
- Q , same solution as in second
shape of the curve at the higher temperatures in the case of the winter heart is pro-bably due to the acceleration of pulse-rate stabilizing on a straight line with a relativelylow-temperature coefficient. In the normal winter heart, however, such stabilizationonly appears at about 200 C, so that this interpretation is only possible by analogywith the experimental results after anterior pituitary treatment. The present work,therefore, clearly confirms Carter's finding that addition of thyroxine to the medium
Temperature-pulse rate curve of isolated frog's heart 153
the frog heart can change the exponential temperature-pulse rate curve toa linear form. Further, it is only necessary to expose the heart to such a mediumfor 1 \-z hr. to obtain a positive result.
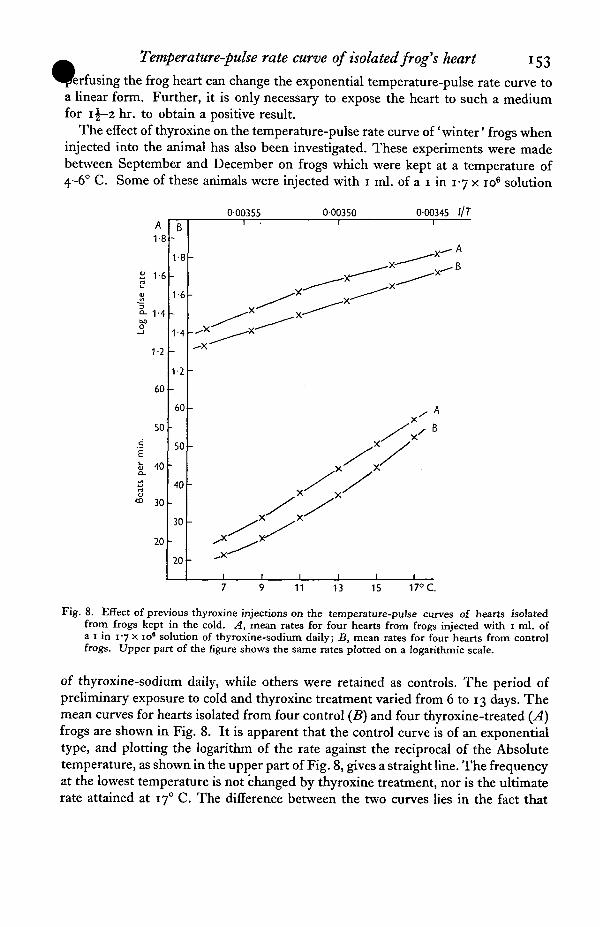
The effect of thyroxine on the temperature-pulse rate curve of 'winter' frogs wheninjected into the animal has also been investigated. These experiments were madebetween September and December on frogs which were kept at a temperature of4-6° C. Some of these animals were injected with 1 ml. of a 1 in 17 x io6 solution
000355 000350 000345 l/TA1-8
2 1-6
1-4
1-2
60
50
t 40
30
20
B
1-8
1-6
1-4
1-2
60
50
40
30 -
20 -
11 13 15 17° C.
Fig. 8. Effect of previous thyroxine injections on the temperature-pulse curves of hearts isolatedfrom frogs kept in the cold. A, mean rates for four hearts from frogs injected with i ml. ofa 1 in 1-7 x io6 solution of thyroxine-sodium daily; B, mean rates for four hearts from controlfrogs. Upper part of the figure shows the same rates plotted on a logarithmic scale.
of thyroxine-sodium daily, while others were retained as controls. The period ofpreliminary exposure to cold and thyroxine treatment varied from 6 to 13 days. Themean curves for hearts isolated from four control (B) and four thyroxine-treated (̂ 4)frogs are shown in Fig. 8. It is apparent that the control curve is of an exponentialtype, and plotting the logarithm of the rate against the reciprocal of the Absolutetemperature, as shown in the upper part of Fig. 8, gives a straight line. The frequencyat the lowest temperature is not changed by thyroxine treatment, nor is the ultimaterate attained at 170 C. The difference between the two curves lies in the fact that

154 C. L. SMITH
the increase in rate is greater at the intermediate temperatures aftertreatment, so that the curve approaches a linear form, and logarithmic plotting nowshows two intersecting straight lines. The effect of thyroxine injected into frogs keptin the cold is therefore essentially similar to that produced by the addition ofthyroxine to the medium perfusing the isolated heart.
It is well known that the thyroid hormone increases sensitivity to adrenaline (Best &Taylor, 1950; Bacq, 1936; Ring, 1942). Schaeffer & Thibault (1945) have shown thatthis synergistic action of thyroxine with adrenaline is independent of its normalmetabolic action. They found that injection of adrenaline into white rats 10 hr. aftera previous thyroxine injection led to a 45 % increase in metabolic rate, although theeffect of the thyroxine injection itself was either very weak or not detectable aftersuch an interval. Similarly, the facilitation of adrenergic action persisted fora considerable time after the decay of the metabolic action of the injected thyroxine.In both Carter's (1933) and my own experiments it has been found that the action ofthyroxine on the temperature-pulse rate curve is apparent within i | hr. of itsaddition to the perfusing medium. In view of this short latent period it seems veryprobable that thyroxine alters the form of the curve by virtue of its synergistic actionwith adrenaline. The present experiments have also shown, however, that the changein form of the temperature-pulse rate curve caused by this interaction betweenthyroxine and adrenaline is conditional on the presence of an anterior pituitaryprinciple (Figs. 6, 7).
(iii) Adrenaline
There is some conflict in the literature regarding the effect of adrenaline on thetemperature coefficient of the isolated frog's heart. Carter (1933) found a generalincrease in the rate of beat after adrenaline addition, but no change in the shape ofthe temperature-pulse rate curve. Gellhorn (1924) found that the temperaturecoefficient of strips of frog's heart muscle was increased after adrenaline. It has beenshown in the preceding sections that both the anterior pituitary factor and thyroxineappear to change the form of the temperature-pulse rate curve by virtue of a syner-gistic action with adrenaline. These experiments do not, however, give any indicationof the action of adrenaline itself on curves other than type E. In the autumn andearly winter of 1947 a set of observations was made with the heart beating inunmodified Ringer, before making the usual records after the addition of adrenaline.A total of thirty-three experiments with and without adrenaline was made in thisseries. Examination of the records showed that adrenaline could either increase,decrease, or have no effect on the temperature coefficient. The records were sub-divided into three groups according to the change in Q10, and the mean rates at eachtemperature calculated for each group. The means of the observed rates, with andwithout adrenaline, at 7 and 17° C , together with the mean value for Q10 over therange 7-170 C. are given in Table 2. As the linear projection of the rates at 7 and90 C. was found to be a basic feature of the temperature-pulse rate curvein the presence of adrenaline (Fig. 1), the value of Q10 for this projection has beenincluded in the last column of Table 2. The data are shown graphically in Fig. 9,

Temperature-pulse rate curve ofisolated frog's heart 155
" h e r e the broken lines indicate the projection of the line joining the frequenciesat 7 and 90 C.
Table 2. The effect of adrenaline (1 in 10") on the rate of beat, and temperaturecoefficient (Qw), of the isolated frog's heart
Group
I
II
I I I
No.of
hearts
8
17
8
Adrenaline
+
Rate at
7°C.
17-419-8
17018717-5216
17° C.
43148-139-848-144-848-7
Increase in rateat 70 C. with
adrenaline
2-4 ±0-429
I-7±O-I85
4-1 +o-6o
0.0(7-170 C.)
2-482-482342-57251225
0.0(7-9° C.)«
2252-23
2 l 82-20
2-442-13
• Value calculated for the line obtained by extrapolation of the 7 and 9° C. rates to 170 C. (see text).
50
40
30
20
50
40
30
20
1
50
40
30
20
11 13 15 17°C.Fig. 9. The effect of adrenaline on the temperature-pulse rate curve. Data from Table 2. x x ,
mean rates for hearts beating in unmodified Ringer; 0 O, mean rates in Ringer con-taining adrenaline 1 in 10'; , projection of the line joining the rates at 7 and 90 C. to170 C.; , suggested course of true curve for group III (see text).
It is evident that the hearts in group III are of a different type from those in thetwo other groups. The observed rates without adrenaline in group III nearly all lieon the straight line of Q10 2-44 which has been drawn in Fig. 9. This indicates thatthese hearts probably correspond to the usual type C (Fig. 1). The mean increase ofrate after addition of adrenaline shown by these hearts is practically twice that foundin groups I and II (Table 2). Statistical tests of significance applied to the increasesin frequency with adrenaline at 70 C. in groups II and III show that P is less than

156 C. L. SMITH
O-OOI, and in groups I and III that P is 0-04, so that the greater increase in group I I Mis probably significantly different from that found in the other groups. The means ofthe observed rates with adrenaline for the group III hearts lie on a slight curve witha Qw value of 2-25. Close inspection of Fig. 9 shows that the rates at 13,15 and 170 C.in the presence of adrenaline lie on a straight line, and if this line is produced back-wards (dotted line in Fig. 9) its origin at 70 C. would give a pulse-rate of 19-5 per min.Such a rate is 2 beats per min. faster than the mean rate without adrenaline atthe same temperature. It is therefore suggested that the decrease in temperaturecoefficient caused by the addition of adrenaline to this type of heart is due toan abnormally high frequency response at the lower temperatures. Owing to theupward temperature gradient used in these experiments the rate at 70 C. was thefirst observation to be made after the adrenaline was added, and the abnormally highvalue obtained is very probably a direct result of this procedure. It would seem thatthis phenomenon only occurred with type C hearts, that is those isolated from frogswith active thyroid glands. Experiments with type E hearts have shown thatthyroxine may act synergistically with adrenaline even at low temperatures (Fig. 7).Further, Bacq (1936) has shown that thyroxine inhibits, in vitro, the destruction ofadrenaline in solution. He attributed the greater sensitivity to adrenaline found inhyperthyroid subjects, and in animals injected with thyroxine, to a more rapid andlonger lasting reaction of the tissues in the presence of a greater amount of thethyroid hormone. It is quite possible, then, that adrenaline added to hearts con-taining the thyroid hormone leads to a transient increase in pulse-rate which outlaststhe 20 min. stabilization period observed in this work. The decrease in temperaturecoefficient after adrenaline observed in these hearts is, therefore, attributed to anexperimental artefact caused by the technique employed. It is suggested that thetrue rates after the addition of adrenaline should lie along the dotted line drawn inFig. 9. If this is accepted, then there is no real change in temperature coefficientcaused by adrenaline, and the pulse-rate change is linear over the whole range.
This abnormal response at the lower temperatures did not occur in the normalseasonal observations because the heart had been perfused with adrenaline-Ringerfor i|—2 hr. after isolation, and the observations were not started at the lower endof the temperature range. With the procedure used throughout the seasonal worknormal type C or 'summer' curves were observed in the presence of adrenaline.
Comparison of the curves obtained with and without adrenaline for groups I and IIshows that the increased temperature coefficient after the addition of adrenaline ingroup II is due to a greater acceleration in rate over the upper part of the temperaturerange. The difference in reaction toward adrenaline found in these two groups iscapable of explanation if it is assumed that the isolated heart beating in unmodifiedRinger is subject to the influence of an endogenous adrenergic substance. There isconsiderable evidence supporting the view that adrenergic compounds are present atsympathetic nerve endings (Bacq, 1949). Raeb & Maes (1947) found a marked diminu-tion in the concentration of an epinephrine-like substance in the cat's heart 7 daysafter total sympathectomy and adrenal inactivation, but even then there remaineda certain amount of residual material which seemed to be chemically identical with

Temperature-pulse rate curve of isolated frog's heart 157
linephrine, though'they suggested that it might differ physiologically. Hoffman, Hoff-man, Middleton & Talesnik (1945) found that injection of acetylcholine or nicotineinto the isolated, atropinized hearts of dogs, cats, rabbits and guinea-pigs, led tothe release of an epinephrine-like substance into the perfusion medium. On the otherhand, they also found that the addition of acetylcholine or nicotine to the atropinizedperfusion fluid had no epinephrine-like action on the isolated heart of Rana pipiens.McDowall (1946), however, showed that acetylcholine under certain circumstancescould stimulate the isolated frog's heart. This action was enhanced by treatment ofthe heart with eserine after atropine, but was abolished by ergotoxine. It seems,therefore, quite probable that the frog's heart may show symptoms of an adrenergicinfluence for several hours after isolation. If this indeed be the case, then it issuggested that curves of the group I type are obtained because the heart beating inRinger contains enough of an active adrenergic principle for the synergistic actionof the anterior pituitary factor to be fully developed. Therefore addition of adrenalineto the perfusate only leads to a proportionate increase in frequency at all temperatures,with no change in the observed temperature coefficient. In the case of the group IIhearts, however, it may be that the heart beating in unmodified Ringer contains lessof the adrenergic material so that the full potentiality of anterior pituitary action athigher temperatures cannot be developed. In this case it would be expected thataddition of adrenaline would lead to a disproportionate increase in frequency at thehigher temperatures, and hence to an increase in the observed temperaturecoefficient. It must also not be forgotten that variations in the amount of the anteriorpituitary factor contained in the heart might possibly contribute to a difference inbehaviour when extra adrenaline is added to the medium.
The hypothesis that the isolated heart may be subject to a persistent adrenergicinfluence is also supported by several incidental experimental observations. Whenthe heart was perfused with Ringer for periods of 24 hr. it frequently went into thehypodynamic state, characterized by a 50 % reduction in frequency and considerabledecrease in amplitude. Hearts which, when first isolated, gave temperature-pulserate curves of type A or B changed to a linear form over the whole temperaturerange when they became hypodynamic.
Secondly, on a few occasions when the temperature-pulse rate curve was beingdetermined for hearts beating in unmodified Ringer, results were obtained whichmight be regarded as indicative of the disappearance of an adrenergic factor. Sucha case is illustrated in Fig. 10. The frequency observations at the lower temperaturesin the first experiment, which was started if hr. after isolation, show a high rate ofbeat. Above 120 C. there was an obvious decrease in acceleration with further risein temperature. After the 200 C. rate was recorded the temperature was reduced bystages to 7° C. again. The rates observed on this falling temperature gradientformed a straight line (Q10 222) which passed through the 200 C. observation. Theobserved rates at 70 C. differed by 4-5 beats per min. Adrenaline (1 in io7) was nowadded to the Ringer and it can be seen that the reduction in pulse-rate was morethan overcome. The acceleration over the lower part of the range as the temperaturewas raised, was identical with that found for the falling temperature gradient in the
jEB.28,2 11

158 C. L. SMITH
absence of adrenaline. In the presence of adrenaline, however, instead of the l ^form being maintained, the increase in frequency became much greater at thehigher temperatures and a typical type A curve was obtained. It seems possiblethat this effect at the higher temperatures was not observed in the first experimentbecause of the exhaustion of the endogenous adrenergic material.
Gellhorn (1924) classified frogs' hearts into two types according to the magnitudeof the temperature coefficient of the heart muscle strips. Both types showed anexponential relation between temperature and rate of beat, but one gave temperaturecoefficients varying from 2-0 to 2-4, while the other gave values up to 3-1. The lowtemperature coefficient of the first type was associated with a significant fall inamplitude at higher temperatures, while in the second type the change in amplitude
70
60
5 0
30
20
10 1
11 13 15 17 19 21° C.
Fig. 10. Disappearance of a sympathetico-mimetic effect in unmodified Ringer, xbeating in unmodified Ringer i j hr after isolation with temperature increasing;
heart•©, in
. 10. Disappearance of a sympathetico-mimetic effect in unmodified Ringer, xbeating in unmodified Ringer i j hr. after isolation, with temperature increasing; 0same solution but temperature falling; • E], in Ringer containing adrenaline i in io
, projection of line joining 7 and 90 C. rates to 17° C.
was small. In view of the positive chronotropic and inotropic action of adrenaline,it is possible that Gellhorn was dealing with hearts subjected to intrinsic adrenergicinfluences of varying intensities, as was suggested for the groups I and II heartsshown in Fig. 9. Gellhorn, however, found that both types of heart gave an increasedtemperature coefficient with adrenaline (1 in io6), so that his results are not strictlyparallel to mine. In my experiments it was very frequently observed, in bothnormal hearts and in those treated with anterior pituitary extract, that the dis-proportionate increase in frequency at the higher temperatures was accompanied bya distinct increase in the height of the mechanical record. Barlow & Sollmann (1926)also found that not only the actual but even the percentage rate-response to adrena-line (1 in io7) of the isolated heart of Rana pipiens increased with warming, up toa fairly high temperature (300 C). Their data also indicate that the frequency-

Temperature-pulse rate curve of isolated frog's heart 159
to adrenaline is almost constant below 8° C , the disproportionate increasein rate being confined to the higher temperatures.
With a view to obtaining more direct evidence for the existence of a persistentadrenergic action, experiments have been made to test the action of adrenergicblocking agents on the form of the temperature-pulse rate curve of the heart beatingin unmodified Ringer. As yet, only a few preliminary experiments have been madewith ergotamine tartrate (1 in io5). The results have been equivocal, but there iscertainly an indication that curves of type B may be changed to type E by suchtreatment. It is hoped to extend these experiments in the near future.
If the theory that the isolated heart may still be under the influence of sym-pathetico-mimetic substances be accepted, then it will also explain the fact thatBarcroft & Izquierdo (1931) obtained their summer and winter type curves withoutadding adrenaline to the medium. Similarly, Carter (1933) demonstrated the actionof thyroxine on the winter type of curve when using adrenaline-free Ringer. If thereis sufficient adrenergic material in the recently isolated heart for the synergisticaction of the anterior pituitary and thyroid hormones to be effective, then there isno conflict between the previous observations and those reported in this paper.
Lichtneckert & Straub (1949) have shown that the frog's heart rendered hypo-dynamic by treatment with quinine resumes normal activity if either adenosine-triphosphate (ATP) or adrenaline is added to the medium. They suggested thatATP is either identical with, or a precursor of, a substance necessary for theinitiation of muscle contraction, and that adrenaline catalytically influences theformation of this substance. In view of this suggestion, investigation of the action ofATP on the form of the temperature-pulse rate curve might prove to be of con-siderable interest.
(iv) Conclusions
As a result of these experiments involving the addition of various endocrinepreparations to type E hearts the following general conclusions may be drawn.
(a) The uncomplicated action of temperature on the frequency of the isolatedheart shows a linear relation over the temperature range 7-170 C. The meantemperature coefficient (<2io) ft>r this line is 2-10 (type E curve).
(b) The exponential relation between frequency and temperature described byBarcroft & Izquierdo (1931) is the result of a synergistic action between an anteriorpituitary hormone and adrenaline, which is not operative below io° C. The linear,summer, temperature-pulse rate curve is a result of the additional facilitation ofadrenaline action by thyroxine, which is not limited by a temperature threshold. The
. presence of the anterior pituitary factor increases the value of the observed tem-perature coefficient {Qio) to about 2-50.
(c) The fact that the addition of adrenaline to the perfusate may either have noeffect on, or may increase the temperature coefficient has been attributed to thepersistence of active adrenergic material in the isolated heart. If there is an in-adequate concentration of this material in the heart then the addition of adrenalineleads to an increase in the temperature coefficient.
i 6 o C. L. SMITH
SEASONAL DISTRIBUTION OF THE VARIOUS TYPES OFTEMPERATURE-PULSE RATE CURVE
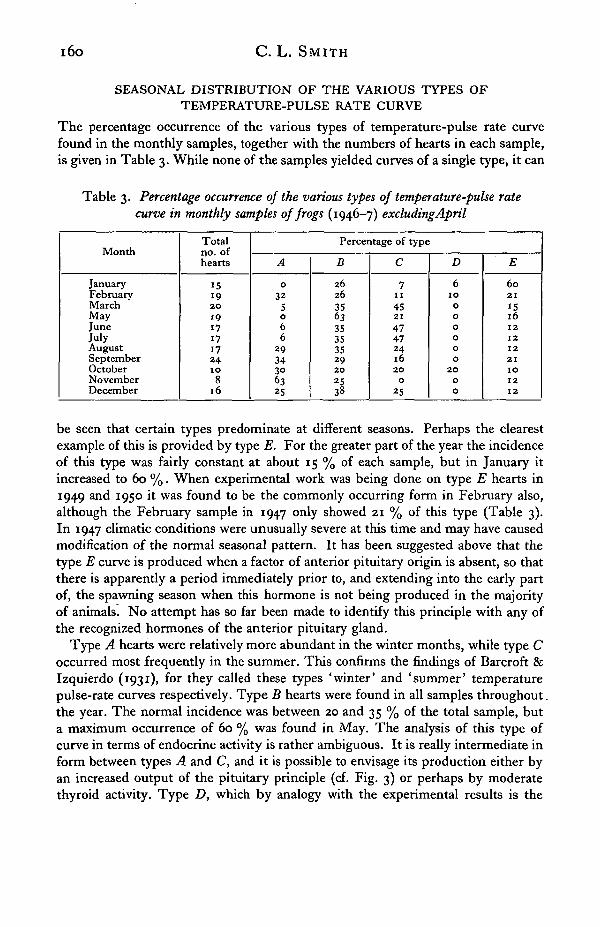
The percentage occurrence of the various types of temperature-pulse rate curvefound in the monthly samples, together with the numbers of hearts in each sample,is given in Table 3. While none of the samples yielded curves of a single type, it can
Table 3. Percentage occurrence of the various types of temperature-pulse ratecurve in monthly samples of frogs (1946-7) excluding April
Month
JanuaryFebruaryMarchMayJuneJulyAugustSeptemberOctoberNovemberDecember
Totalno. ofhearts
1519201917171724108
16
Percentage of type
A
032
5066
2934306325
B
2626356335353529202538
C
711
45214747241620
025
D
610
000000
2000
E
6021151612121221101212
be seen that certain types predominate at different seasons. Perhaps the clearestexample of this is provided by type E. For the greater part of the year the incidenceof this type was fairly constant at about 15 % of each sample, but in January itincreased to 60 %. When experimental work was being done on type E hearts in1949 and 1950 it was found to be the commonly occurring form in February also,although the February sample in 1947 only showed 21 % of this type (Table 3).In 1947 climatic conditions were unusually severe at this time and may have causedmodification of the normal seasonal pattern. It has been suggested above that thetype E curve is produced when a factor of anterior pituitary origin is absent, so thatthere is apparently a period immediately prior to, and extending into the early partof, the spawning season when this hormone is not being produced in the majorityof animals. No attempt has so far been made to identify this principle with any ofthe recognized hormones of the anterior pituitary gland.
Type A hearts were relatively more abundant in the winter months, while type Coccurred most frequently in the summer. This confirms the findings of Barcroft &Izquierdo (1931), for they called these types 'winter' and 'summer' temperaturepulse-rate curves respectively. Type B hearts were found in all samples throughout.the year. The normal incidence was between 20 and 35 % of the total sample, buta maximum occurrence of 60 % was found in May. The analysis of this type ofcurve in terms of endocrine activity is rather ambiguous. It is really intermediate inform between types A and C, and it is possible to envisage its production either byan increased output of the pituitary principle (cf. Fig. 3) or perhaps by moderatethyroid activity. Type D, which by analogy with the experimental results is the

Temperature-pulse rate curve of isolated frog's heart 161
t of greater production of the pituitary factor, was only observed six timesduring the year, and was confined to the winter samples.
Bearing in mind the experimental analysis of these various curves discussedearlier, it is possible to follow the seasonal changes in thyroid activity. The onlytype of curve which can definitely be attributed to the presence of the thyroidhormone is type C. There is a certain amount of doubt about type E curves, for, ifthe pituitary principle is lacking it seems that thyroxine is unable to produce itstypical action. It is, therefore, possible that such a relation could be obtained fromfrogs with active thyroid glands. However, many hearts of this type have sub-sequently been used for experiments with anterior pituitary extracts, and they havealways changed over to types D or B, but never to type C as might be expected if thethyroid hormone were already present. For this reason the type E hearts have been
60 -
S 50
•Z 40co
"u 30
g,20
10
J. F. M. A. M. J. J. A. S. O. N. D.
Fig. 11. Percentage occurrence of type C temperature-pulse rate curvesin monthly samples of frogs (1946-7).
regarded as indicative of thyroid inactivity. In Fig. 11 the percentage of frogs ineach sample which gave a type C temperature-pulse curve has been plotted for eachmonth. The number of frogs with active thyroids varied from zero in November toabout 50 % in June and July. Two well-defined peaks of activity are revealed, inMarch and in mid-summer, which are separated by a marked decrease in activityin May. From August to November there is a steady fall in thyroid activity, which,with the exception of the December sample, remains relatively low throughout thewinter.
Sklower (1925) followed the seasonal changes in thyroid activity in the frog bymeans of a histological method. He found a low level of activity throughout thewinter, followed by a sharp increase in March. The level was high throughout thesummer but began to decrease at the end of August, reaching the winter level inOctober.
Meisenheimer (1936), after more detailed seasonal histological study, summarizes

162 C. L. SMITH
the changes in thyroid activity as follows. From November to Februaryfunction is at a low level, but at the end of February or the beginning of March theactivity of the gland rises rapidly and remains high until the end of March or thebeginning of April. In April and May there is a pronounced reduction in activity,which may reach the winter level. From June to September there is another veryactive period, but about the middle of September there begins a phase of decreasingactivity which extends into October. This leads to the low, winter level of activity.It is evident that Meisenheimer's description of the thyroid cycle closely parallelsthat shown in Fig. 11. The fact that even at the summer maximum only 50 % of thesamples showed thyroid activity may perhaps be regarded as remarkable. Meisen-heimer (1936), however, also stresses the heterogeneous nature of her samples, andstates that very different thyroid conditions may be found in frogs caught in thesame place on the same day, or even in the two members of a copulating pair. Shealso showed that the high level of thyroid activity in the mid-summer period isinterrupted periodically by the occurrence of moulting. No records of skin conditionwere made in the present survey and the possible inclusion of moulting animals inthe samples would reduce the number showing thyroid activity. The appearance ofa slight wave of thyroid activity in December is unexpected, but Meisenheimer alsofound some glands at this time which in many respects appeared active, although,on the ground of the small number of vacuoles in the colloid, she regarded them asbeing inactive. It is possible, as Meisenheimer suggests, that mild weather at thistime of year may lead to a certain amount of thyroid activity. Meisenheimer furtherobserved that there was no correlation between the high thyroid activity in Marchand the spawning process. This has been confirmed in the present work, as in theearly part of the breeding season hearts isolated from frogs in amplexus usuallygave temperature-pulse rate curves of type E, which showed no indication of thyroidactivity when treated with anterior pituitary extract.
The clear indication of a regression of thyroid activity in April and May found byboth histological and physiological methods is of interest in connexion with otherwork. Morton & Rosen (1949) investigated the seasonal changes in the carotenoidcontent of frogs. They noted that although frogs feed soon after spawning, carotenoidstorage does not occur until the end of May. Cama & Goodwin (1949) found that thethyroid played a part in the metabolism of Vitamin A. Administration of desiccatedthyroid stimulated the absorption of B-carotene from the intestinal tract of rats.The failure of carotene storage in frogs in April and May might, therefore, be due tothe low level of thyroid activity at this time. Smith (1950) has also shown that overthis same period the blood-sugar level is low and there is no appreciable storage ofglycogen in the liver, or of fat in the fat-bodies.
Lichtneckert & Straub (1949) found that the action of ATP on the hypodynamicfrog's heart was completely absent in the winter season, while there were transitionperiods in September-November and in March-April when incomplete recoverieswere obtained. Again this is a type of seasonal distribution which follows thegeneral lines of the thyroid cycle, and suggests that the possible participation ofthyroxine in the action of ATP on heart muscle might merit investigation.

Temperature-pulse rate curve ofisolated frog's heart 163
SUMMARY
1. The form of the temperature-pulse rate curve of the isolated frog's heart, whenperfused with Ringer solution containing adrenaline, has been determined over therange 7-170 C. for monthly samples of frogs over a whole year. Five different typesof curve were obtained during this seasonal survey, namely types A, B, C, D and E.Of these types, A and C respectively correspond to the winter and summer tem-perature-pulse rate curves described by Barcroft & Izquierdo (1931), while theremaining three have not previously been described. Type E, which is a linearrelation with a mean temperature coefficient (Q10) of 2-12, has been interpreted asbeing the least complex form, in which the action of temperature on the pulse-rateis not complicated by the action of other factors.
2. The addition of various extracts of the anterior pituitary gland to the mediumperfusing type E hearts led to a disproportionate increase in pulse rate above io° C ,so that the observed temperature coefficient was increased and curves of type B or Dwere produced. The variation in the response obtained by various pituitary extractshas been attributed to quantitative differences.
3. The typical action of anterior pituitary extract was only obtained when theheart was perfused with Ringer solution containing adrenaline. This phenomenonhas been explained by assuming that there is a synergistic action between adrenalineand an anterior pituitary hormone which is inhibited at temperatures below aboutio°C.
4. Thyroxine was found to have no action on the type E heart perfused withRinger containing adrenaline, but if an extract of anterior pituitary were also present,then the type E curve was changed into type C. This is in agreement with the workof Carter (1933). Experiments were also made which showed that previous injectionof thyroxine into frogs kept in the cold changed type A (winter) into type C (summer)curves.
5. It was found that adrenaline could either increase, decrease, or have no effecton, the temperature coefficient of the isolated heart. A decrease in the temperaturecoefficient was only observed in cases where the hearts had been isolated from frogswith active thyroids and has been attributed to the experimental technique employed.The fact that an increase in temperature coefficient may or may not be caused byadrenaline, as well as the fact that type A or C curves have been obtained whenhearts were perfused with adrenaline-free Ringer has been attributed to the per-sistence, in varying degree, of an active sympathetico-mimetic substance in theheart for at least several hours after isolation.
6. It has been shown that the type C temperature-pulse rate curve is the only onewhich can definitely be attributed to the presence of the thyroid hormone. Theseasonal occurrence of this type of curve closely parallels the cycle of thyroidactivity described by Sklower (1925) and Meisenheimer (1936).
164 C. L. SMITH
REFERENCESBACQ, Z. M. (1936). Arch. Int. Physiol. 42, 340.BACQ, Z. M. (1949). J. Pharmacol. Part 11, 95, 1.BARCROFT, J. & IZQUIERDO, J. J. (1931). J. Physiol. 71, 145.BARLOW, O. W. & SOLLMANN, T. (1926). J. Pharmacol. 28, 325.BEST, C. H. & TAYLOR, N. B. (1950). The Physiological Basis of Medical Practice. London: Bailliere,
Tindall and Cox.BODO, R. C , BLOCH, H. I. & GROSS, I. H. (1942). Amer. J. Physiol. 137, 124.CAMA, H. R. & GOODWIN, T. W. (1949). Biochem. J. 45, 236.CARTER, G. S. (1933). J. Exp. Biol. 10, 256.CLARK, A. J., EGGLETON, M. G., EGGLETON, P., GADDIE, R. & STEWART, C. P. (1938). The Metabolism
of the Frog's Heart. Edinburgh: Oliver and Boyd.COHEN, J. A. (1947). Nature, Lond., 160, 871.FLUCH, M., GREINER, H. & LOEWI, O. (1935). Arch. Exp. Path. Pharmak. 177, 167.GELLHORN, E. (1924). Pfliig. Arch. ges. Physiol. 203, 163.HOFFMAN, F., HOFFMAN, E. J., MIDDLETON, S. & TALESNIK, J. (1945). Amer. J. Physiol. 144, 189.HOGBEN, L. (1923). Quart. J. Exp. Physiol. 13, 177.KEPINOV, L. (1938). Arch. Int. Physiol. 46, 265.KEPINOV, L. (1949). Arch. Int. Physiol. 56, 346.LICHTNECKERT, I. & STRAUB, F. B. (1949). Hungarica Acta Physiol. 2, 50.MCDOWALL, R. J. S. (1946). J. Physiol. 104, 392.MEISENHEIMER, M. (1936). Z. wiss. Zool. 148, 261.MORTON, R. A. & ROSEN, D. G. (1949). Biochem. J. 45, 612.ORIAS, O. (1934). C.R. Soc. Biol., Paris, 117, 59.RAEB, W. & MAES, J. P. (1947). Amer.J. Physiol. 148, 470.RING, C. C. (1942). Amer. j . Physiol. 137, 582.SCHAEFFER, G. & THIBAULT, O. (194s). C.R. SOC. Biol., Paris, 139, 857.SKLOWER, A. (1925). Z. vergl. Physiol. 2, 474.SMITH, C. L. (1950). J. Exp. Biol. 26, 412.YOUNG, F. G. (1941). Brit. Med. J. 2, 897.