the time to act is now - campaign 2000 to original 2008 prs goal: reduce child poverty 25% in 5...
TRANSCRIPT
THETIME TO ACT IS NOWOntario ChildrenCan’t Wait
2016 Report Card on Child and Family Poverty in Ontario
CAMPAIGN 2000 IS HOSTED BY FAMILY SERVICE
TORONTO, A MEMBER AGENCY OF UNITED WAY
TORONTO & YORK REGION

The Time to Act is NowOntario Children Can’t Wait2016 Report Card on Child and Family Poverty in Ontario
2016 marks the half-way point of the Ontario government’s second Poverty Reduction Strategy (PRS). Although small steps have been taken to address child and family poverty in the province, much more action is needed. If the province is committed to achieving the goals set out in the PRS and, moreover, truly committed to addressing the realities of child and family poverty in the province, it must act now.
Children and families have been waiting far too long for significant changes in funding and policies aimed at ending child and family poverty throughout the province. As the cost of housing, hydro, food, school supplies, health costs and other basic needs continue to rise, families across the province struggle to make ends meet. These rising costs are further exacerbated by the increasing precarity of employment in Ontario with the growth of part-time, contract, temporary, and shift work with low wages and few or no benefits. Children and families have been patient for long enough. The time for bold and significant action to end child and family poverty is now.
2016 has seen some positive steps taken by both the federal and provincial governments to address the needs of children and families living on low incomes. In July, the federal government implemented the Canada Child Benefit (CCB). This was a positive step forward, but the federal government has decided not to index the CCB until 2020 which will significantly diminish the impact of the benefit for families over time and continue to leave families struggling.
Provincially, the Ontario government agreed not to claw back any of the CCB from families on social assistance and also committed to allowing families on social assistance to keep all child support payments they receive starting in 2017. This will positively impact some of the families in Ontario who are struggling the most; however much more needs to be done to address the structural forces that trap families in poverty across Ontario.
With bold targets, timelines, and a strong commitment from all provincial parties, Ontario can eliminate child and family poverty in our province. With both the federal and provincial governments willing to work together and with poverty as a top priority, families and children need the government to step up and stay firm on their commitments. Children and families across Ontario can’t wait any longer. The Time to Act is NOW!
2 THE TIME TO ACT IS NOW
THE TIME TO ACT IS NOW | 2016 REPORT CARD ON CHILD AND FAMILY POVERTY

3
Ontario Poverty Reduction StrategyIssue
Reduce Child Poverty
Employment and Income Security
2014/2015 Provincial CommitmentsRecommit to original 2008 PRS goal: reduce child poverty 25% in 5 years
Index Ontario Child Benefit (OCB) and income threshold to CPI by July 2015
Improve income security and labour protections
Move towards employment and income security for vulnerable groups(including women, single parents, people with disabilities, youth, newcomers, ‘visible minorities’, seniors, and Indigenous people)
Enhance earnings
Status As Of November 2016
Ontario 2015 Annual Report states child poverty rate is at 17.1%.[1] This is an increase from the 2008 rate of 15.2%.[2]
OCB increased to maximum $1,356/child under 18/year July 1, 2016 (after indexation). Previously increased to $1,336/child under 18/year, July 1, 2015 and indexed to CPI in 2016.
Province committed not to claw back CCB from families on social assistance. Child support payments fully exempted in Jan/Feb 2017.
Current review of income security began June 2016, and is expected to be completed summer 2017. Basic Income Pilot will begin in 2017.
Rates for single people on OW increased 3.6% ($25 month). Rates for others on OW and singles on ODSP increased 1.5%. Rates for families on ODSP increased $18/month, less than 1.5%.
In 2015, Ontario Ministry of Labour appointed two Special Advisors to conduct review of Ontario Labour Relations Act and Employment Standards Act with lens to address precarious employment. The Changing Workplace Review’s final recommendations expected early 2017.
Committed to developing employment strategy for people with disabilities by 2017 and outlining steps to close gender wage gap by 2016.
Minimum wage indexed to CPI in 2015. In 2016 minimum wage increased to $11.40 for adults, wages for liquor servers raised to $9.90, student rate raised to $10.70.
ONTARIO POVERTY REDUCTION STRATEGY
THE TIME TO ACT IS NOW | 2016 REPORT CARD ON CHILD AND FAMILY POVERTY

Issue
Housing and Homelessness
Youth and Education
Child Care and Early Learning
Health
Marginalized Groups
Build PRS EvidenceBase
2014/2015 Provincial CommitmentsEnd homelessness in Ontario and end chronic homelessness in 10 yearsUpdate Long-Term Affordable Housing Strategy (LTAHS) by 2015-16
Create 1,000 new supportive units in 3 years
Youth unemployment focus and integration of employment and training services
Create Ontario Student Grant starting in 2017-2018 school year
Child Care and Early Years Act
Invest $33.6 million to protect licensed spaces and provide subsidiesCreate Ontario Early Years Child and Family Centres by 2018
Full-day kindergarten
Introduce additional health benefits for low income children. (such as: rescription drugs, assistive devices, vision care and mental health services. Explore options to extend coverage to all low income Ontarians. Commit to provide public dental services to low income adults by 2025)
Healthy Smiles Ontario
Student Nutrition Program
Closely track poverty rates of vulnerable populations (including ‘Aboriginal’ people living off-reserve, new-comers, persons with disabilities, unattached individuals aged 45-64, female lone parents)
$50 million for Local Poverty Reduction Fund and build evidence base to guide effective poverty reduction policies and programs
Status As Of November 2016
Convened Expert Advisory Panel on Homelessness in 2015
Updated LTAHS March 2016 with focus on flexible and portable benefits.
Invested in 620 new supportive housing units in 2015.
Youth Job Connection launched in 2015 and continued support of Ontario Youth Entrepreneurship Fund.
To commence in 2017-2018. Will cover average tuition cost for full-time undergraduate arts and science programs.
Bill passed and Act was created.
Funding amount was allocated.
Announced in early 2016, and implementation by 2018.
Implemented in 2014-2015 school year.
The progress of the low income health benefit for children is not clear. No public announcements regarding implementation.
45,000 children and youth enrolled in Healthy Smiles by endof 2015.
Expanded Student Nutrition Program.
Most current statistics reported from 2013, and does not include people with disabilities. Rate between 2012-2013 measured by LIM-50 did not change.
Launched Local Poverty Reduction Fund of $50M over 6 years. 41 projects funded with $12.6M in first year. $16M for 30 projects announced Oct 2016.
4 ONTARIO POVERTY REDUCTION STRATEGY
THE TIME TO ACT IS NOW | 2016 REPORT CARD ON CHILD AND FAMILY POVERTY
IssueEnd Child and Family Poverty
Make Paid Work a Path Out of Poverty
Lift People Out of Poverty
Equal Health Opportunities for Everyone
Early Learning and Child Care for All
Ensure Appropriate Housing for All
Support Opportunities for Youth
Address Inequities faced by Marginalized Groups
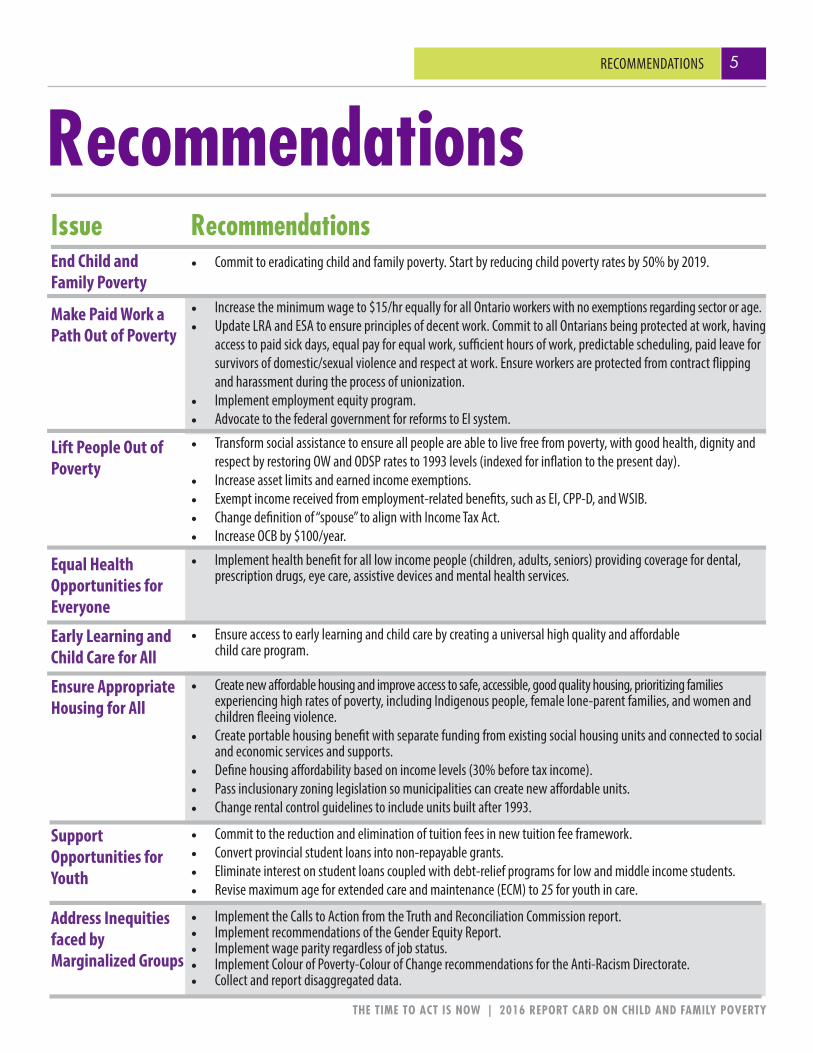
Recommendations• Commit to eradicating child and family poverty. Start by reducing child poverty rates by 50% by 2019.
• Increase the minimum wage to $15/hr equally for all Ontario workers with no exemptions regarding sector or age. • Update LRA and ESA to ensure principles of decent work. Commit to all Ontarians being protected at work, having
access to paid sick days, equal pay for equal work, sufficient hours of work, predictable scheduling, paid leave for survivors of domestic/sexual violence and respect at work. Ensure workers are protected from contract flipping and harassment during the process of unionization.
• Implement employment equity program.• Advocate to the federal government for reforms to EI system.
• Transform social assistance to ensure all people are able to live free from poverty, with good health, dignity and respect by restoring OW and ODSP rates to 1993 levels (indexed for inflation to the present day).
• Increase asset limits and earned income exemptions.• Exempt income received from employment-related benefits, such as EI, CPP-D, and WSIB. • Change definition of “spouse” to align with Income Tax Act. • Increase OCB by $100/year.
• Implement health benefit for all low income people (children, adults, seniors) providing coverage for dental, prescription drugs, eye care, assistive devices and mental health services.
• Ensure access to early learning and child care by creating a universal high quality and affordable child care program.
• Create new affordable housing and improve access to safe, accessible, good quality housing, prioritizing families experiencing high rates of poverty, including Indigenous people, female lone-parent families, and women and children fleeing violence.
• Create portable housing benefit with separate funding from existing social housing units and connected to social and economic services and supports.
• Define housing affordability based on income levels (30% before tax income).• Pass inclusionary zoning legislation so municipalities can create new affordable units.• Change rental control guidelines to include units built after 1993.
• Commit to the reduction and elimination of tuition fees in new tuition fee framework.• Convert provincial student loans into non-repayable grants.• Eliminate interest on student loans coupled with debt-relief programs for low and middle income students.• Revise maximum age for extended care and maintenance (ECM) to 25 for youth in care.
• Implement the Calls to Action from the Truth and Reconciliation Commission report.• Implement recommendations of the Gender Equity Report. • Implement wage parity regardless of job status.• Implement Colour of Poverty-Colour of Change recommendations for the Anti-Racism Directorate. • Collect and report disaggregated data.
5
RecommendationsRECOMMENDATIONS
THE TIME TO ACT IS NOW | 2016 REPORT CARD ON CHILD AND FAMILY POVERTY

Fig 1: Low Income Measure, After-Tax 2014
*Includes parents/spouses, children 16 years of age and over and the first child in lone-parent families regardless of age.Source: Statistics Canada. Income Statistics Division (2016 July). Annual Income Estimates for Census Families and Individuals (T1 Family File) Family Data User’s Guide 2016
6 MEASURING POVERTY
This report tracks changes on a number of indicators to provide a broad picture of child and family poverty in Ontario and to monitor poverty reduction within the province.
This report uses Statistics Canada’s T1 Family File (T1FF) to report on low income statistics according to the Low Income Measure-After Tax (LIM-AT), unless otherwise indicated. The T1FF is based on Taxfiler data collected from income tax returns and Canada Child Tax Benefit (CCTB) records. There is a two-year lag in the low income data that are available from Statistics Canada and thus the low income rates presented here are based on 2014 data.
The LIM identifies families with income below 50% of median income adjusted for family size. Statistics Canada constructs households and family income levels by matching individual tax files through family income calculations and does not include income from other relatives living in the same household. LIM-AT 2014 for one parent with one child 16 years or younger is $24,954.[3] Figure 1 shows the LIM-AT 2014 for various family sizes.[4]
Methodological differences inhibit comparisons between data derived from T1FF and data calculated from the National Household Survey (NHS), Survey of Labour and Income Dynamics (SLID) and the Canadian Income Survey (CIS).
The Ontario government uses a fixed CIS LIM-AT to track the rate of child poverty. According to that measure the 2015 Poverty Reduction Strategy (PRS) Annual Report states the child poverty rate at 17.1% (Fixed LIM-50, 2013).[5] The use of a fixed CIS LIM-AT by the Ontario government in their reporting results in differences in child poverty rates reported in this report. Raw CIS data (used by the province) is not publicly available for analysis.
In addition to the LIM Before and After Tax, Statistics Canada also produces other low income statistics including the Low Income Cut-Off (LICO) Before and After Tax and the Market Basket Measure (MBM).
Child Poverty In OntarioChild poverty continues to be a serious problem in Ontario - it is now time to eradicate it. The most recent Taxfiler data show that 513,850 (18.8%) Ontario children under the age of 18 live in poverty (LIM-AT).[6] Although this is a decline of 1.2% from the 2013 rate of 20% (Figure 2), Ontario’s work is far from over: more than 1 in 6 children continue to live in poverty across the province. Today, the child poverty rate continues to be above the 2010 rate of 18.3% (the lowest rate it has been since 2008).[7] Further, children from families who are Indigenous, racialized, newcomers, have disabilities, and/or led by female lone parents experience poverty at much higher and disproportionate rates.
The rate of child poverty for children under 6 in Ontario remains worse than it was in 1989 - the year all federal parties resolved to eliminate poverty by the year 2000. Today, 174,250 children (20.4%) under the age of 6 are living in poverty (Figure 3).[8]
Although the rate fell slightly from 21.6% (2013), one in five children under the age of 6 continues to live in poverty.
Measuring Poverty
THE TIME TO ACT IS NOW | 2016 REPORT CARD ON CHILD AND FAMILY POVERTY
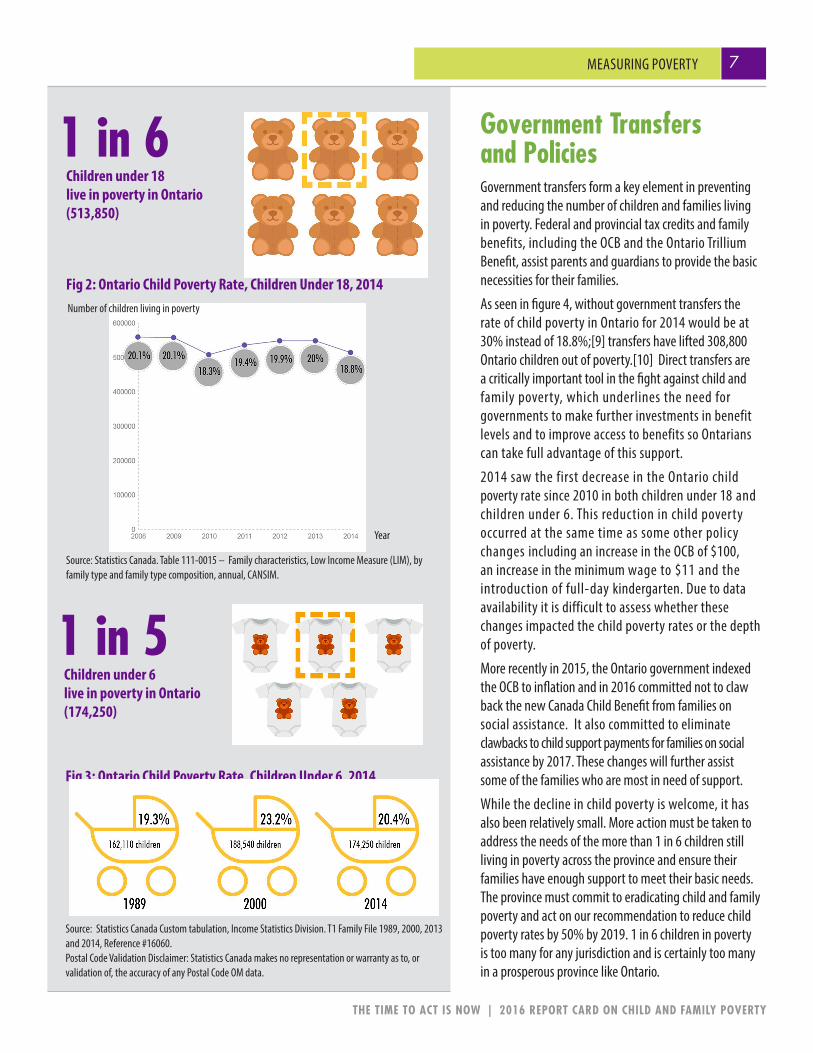
Government Transfers and PoliciesGovernment transfers form a key element in preventing and reducing the number of children and families living in poverty. Federal and provincial tax credits and family benefits, including the OCB and the Ontario Trillium Benefit, assist parents and guardians to provide the basic necessities for their families.
As seen in figure 4, without government transfers the rate of child poverty in Ontario for 2014 would be at 30% instead of 18.8%;[9] transfers have lifted 308,800 Ontario children out of poverty.[10] Direct transfers are a critically important tool in the fight against child and family poverty, which underlines the need for governments to make further investments in benefit levels and to improve access to benefits so Ontarians can take full advantage of this support.
2014 saw the first decrease in the Ontario child poverty rate since 2010 in both children under 18 and children under 6. This reduction in child poverty occurred at the same time as some other policy changes including an increase in the OCB of $100, an increase in the minimum wage to $11 and the introduction of full-day kindergarten. Due to data availability it is difficult to assess whether these changes impacted the child poverty rates or the depth of poverty.
More recently in 2015, the Ontario government indexed the OCB to inflation and in 2016 committed not to claw back the new Canada Child Benefit from families on social assistance. It also committed to eliminate clawbacks to child support payments for families on social assistance by 2017. These changes will further assist some of the families who are most in need of support.
While the decline in child poverty is welcome, it has also been relatively small. More action must be taken to address the needs of the more than 1 in 6 children still living in poverty across the province and ensure their families have enough support to meet their basic needs. The province must commit to eradicating child and family poverty and act on our recommendation to reduce child poverty rates by 50% by 2019. 1 in 6 children in poverty is too many for any jurisdiction and is certainly too many in a prosperous province like Ontario.
1 in 6Children under 18 live in poverty in Ontario (513,850)
1 in 5Children under 6 live in poverty in Ontario (174,250)
Fig 2: Ontario Child Poverty Rate, Children Under 18, 2014
Fig 3: Ontario Child Poverty Rate, Children Under 6, 2014
Source: Statistics Canada. Table 111-0015 – Family characteristics, Low Income Measure (LIM), by family type and family type composition, annual, CANSIM.
Source: Statistics Canada Custom tabulation, Income Statistics Division. T1 Family File 1989, 2000, 2013 and 2014, Reference #16060.Postal Code Validation Disclaimer: Statistics Canada makes no representation or warranty as to, or validation of, the accuracy of any Postal Code OM data.
Number of children living in poverty
Year
7MEASURING POVERTY
THE TIME TO ACT IS NOW | 2016 REPORT CARD ON CHILD AND FAMILY POVERTY

Fig 4: Reductions in Child Poverty as a Result of Government Transfers
Fig 5: Ontario Families with Children Living in Poverty, 2014
Fig 6: Gender of Lone Parents Families in Ontario, 2014
Source: Statistics Canada. Custom tabulation, Income Statistics Division. T1 Family File, 1989, 2000, 2014, Reference #16060. Postal Code Validation Disclaimer: Statistics Canada makes no representation or warranty as to, or validation of, the accuracy of any Postal Code OM data.
Source: Statistics Canada. Table 111-0015 – Family characteristics, Low Income Measure (LIM), by family type and family type composition, annual CANSIM
Source: CANSIM 111-0011 Family characteristics, by family type, family composition and characteristics of parents, annual CANSIM
Family Poverty In OntarioFamilies in low income continue to struggle to afford basic needs such as housing, food, school supplies and health expenses. In 2014, 326,550 (14.4%) Ontario families with children were living in poverty (Figure 5)[11]. Although there has been a drop of 1% from the 2013 rate, nearly 1 in 7 seven families with children in Ontario continue to live in poverty.
Poverty rates differ greatly amongst different types of families. Among couples with children, 9.2% (157,470) live in poverty, [12] while the rate of lone parent families living in poverty is at a staggering 30.4% (169,080).[13] This stark difference can be partially attributed to the gender pay wage gap in Ontario. As seen in figure 6 lone parent families are primarily led by women and female median total income was significantly lower than male median total income, a difference of $18,030.[14] This gender wage gap places female-led households at a greater risk of living in poverty and demonstrates the need for policies and programs both to close the gender wage gap and provide more direct support for female lone-parent families.
Number of families living in poverty
Year
8 MEASURING POVERTY
THE TIME TO ACT IS NOW | 2016 REPORT CARD ON CHILD AND FAMILY POVERTY
Year
Percentage

Fig 7: Depth of Low Income for Families in Ontario, 2014 LIM-AT 2014 (T1FF)
Fig 8: Average Income* for Lowest, Average and Highest Decile Families
Source: Statistics Canada., Small Area Administrative Data, 2014 Tax File Family Series, Table 18
*Using 2014 Constant dollarsSource: Statistics Canada. Table 206-0031 – Upper income limit, income share and average market, totaland after-tax income by economic family type and income decile, Ontario
Year
Income
Income
Depth of PovertyMedian incomes among low income families continue to be far below the low income threshold as measured by the LIM-AT. As seen in figure 7, the poverty gap differs amongst different family types ranging from a gap of $8,904 for a lone parent with one child to the largest gap of $10,461 for a couple with one child.[15]
Income InequalityThe great divide between the lowest and highest income earners in Ontario is an important marker depicting the need to address poverty in Ontario. The most recent data shows that a family in the highest decile earned on average $262,000 more than a family in the lowest decile (Figure 8). This is equivalent to 11 years of work for a family in the lowest decile. Income inequality within a population is increasingly seen to result in negative health outcomes including decreased life expectancy, higher infant deaths, and higher risks of people experiencing mental health issues.[16] The wide gap between the wealthy and poor in Ontario must be closed to ensure all Ontarians can prosper.
Type of family
Year
9DEPTH OF POVERTY | INCOME INEQUALITY
THE TIME TO ACT IS NOW | 2016 REPORT CARD ON CHILD AND FAMILY POVERTY

Marginalized Groups
10 MARGINALIZED GROUPS
The time is now to address the systemic conditions creating poverty. Systemic inequities create conditions that result in certain groups of people experiencing higher rates of poverty. Discrimination in finding work, housing, or being paid equitably significantly impacts people’s lives and creates conditions that place particular groups of people more at risk of experiencing poverty.
The importance of disaggregated data cannot be overstated. Identity can greatly impact people’s experiences and rates of poverty due to systemic discrimination. And in order for policies to be effective in eradicating poverty we must have a more in-depth understanding of who is most impacted. Unfortunately, the T1FF data set does not collect information on people’s identity, including whether tax filers are Indigenous, racialized, living with a disability or their gender identity. Further, due to the lack of disaggregated census data since 2006, it is difficult to compare poverty rates of specific groups of people. We await the release of the 2016 census data which will enable a more nuanced discussion of who is impacted by poverty both in the province of Ontario and nationally.
To address the inequities that cause poverty amongst marginalized groups, we call for the province to implement the Calls to Action from the Truth and Reconciliation Commission, the Colour of Poverty – Colour of Change recommendations for the Anti-Racism Directorate, and the recommendations of the Gender Wage Gap Report. We urge the province also to take action on wage parity regardless of job status, an employment equity legislative framework and to collect and report on disaggregated data.
Indigenous Children Indigenous people across Ontario and particularly Indigenous children live in poverty in higher numbers. Indigenous children who live on reserves have the highest child poverty rates in Ontario at close to 50%.[17] Poverty rates of Indigenous children who live off reserve are lower at almost 30%, while the rate of poverty amongst non-Indigenous children is less than 20%.[18] The stark contrast in rates of poverty between Indigenous and non-Indigenous children clearly depicts the inequalities that exist.
There is an urgent need to address the needs of Indigenous children across Ontario, as further witnessed by the crisis levels of youth suicides and suicide attempts in Indigenous communities, particularly on reserves. In 2016, mandate letters issued to provincial ministers all referenced the Truth and Reconciliation Commission and the need for all ministers to prioritize reconciliation within their respective portfolios. For change to occur, a deep commitment to working with Indigenous groups must be made to address the ongoing structural issues contributing to Indigenous children facing higher rates of poverty. This includes the need for regularly collected disaggregated data, specific income security programs for Indigenous families, increased access to jobs and education and implementation of long term solutions.
THE TIME TO ACT IS NOW | 2016 REPORT CARD ON CHILD AND FAMILY POVERTY

11MARGINALIZED GROUPS
People Living with DisabilitiesPeople living with disabilities (PWD) face a greater risk of living in poverty. The major contributing factors are the discrimination PWD face in obtaining employment and the major disparity in the salaries. Only 30% of PWD who work earn an income of more than $40,000 whereas over 45% of working people without disabilities earn $40,000 and over.[19]
These differences are more pronounced for women living with disabilities. A woman with a disability earns 16% less than a man with a disability and 48% less than a man without a disability.[20] These income discrepancies put women living with disabilities at a greater risk of experiencing poverty. Recent statistics show that 32.6% of Ontario food bank users’ primary income is from disability-related income supports.[21] The province must address the systemic conditions which deny PWD the ability to engage fully in society. Employment opportunities and/or assistance must be available to meet all people’s varied needs and abilities to ensure that PWD are able to live lives with dignity and respect, free from poverty.
Racialized PeoplePeople who are racialized face higher rates of poverty. Many racialized people continue to face discrimination in obtaining employment, have lower wages, are engaged in higher rates of precarious employment and face difficulties in being promoted to higher positions. Recent research has identified how economic and social inequities keep racialized immigrant women in particular trapped in a cycle of precarious work and, as a result, poverty.
In February of 2016, Ontario created the Anti-Racism Directorate to address and prevent systemic racism within government policy, legislation, programs and services. The Directorate has since begun to host public community meetings across the province. The province must allocate sufficient funding and resources and have anti-racism as a core value within all provincial departments in order to address adequately the systemic issues that exist and result in increased rates of poverty among racialized people in the province.[22]
WomenWomen within the province continue to face increased rates of poverty, particularly female lone parent households. Lone-parent families led by women are more at risk of living in poverty and experience higher rates of food insecurity. This is directly related to the continued gender wage gap in Ontario which in 2015 was 13.6%.[23] This not only impacts woman’s yearly salaries and family earnings, but also over the long term creates a large pension gap which places women at a great risk of living in poverty after retirement as they have less money saved. This gap is even larger for groups who experience employment discrimination, including Indigenous women, racialized women and women with disabilities.
2016 saw the release of the Gender Wage Gap report which laid out 19 recommendations for the provincial government to address the discrimination women experience as a result of the wage gap. As the report states, changes “will require sustained political will, commitment, and resources.”[24] Women will continue to experience the impacts of poverty as a result of not being equally paid for equal work until government takes action.
THE TIME TO ACT IS NOW | 2016 REPORT CARD ON CHILD AND FAMILY POVERTY
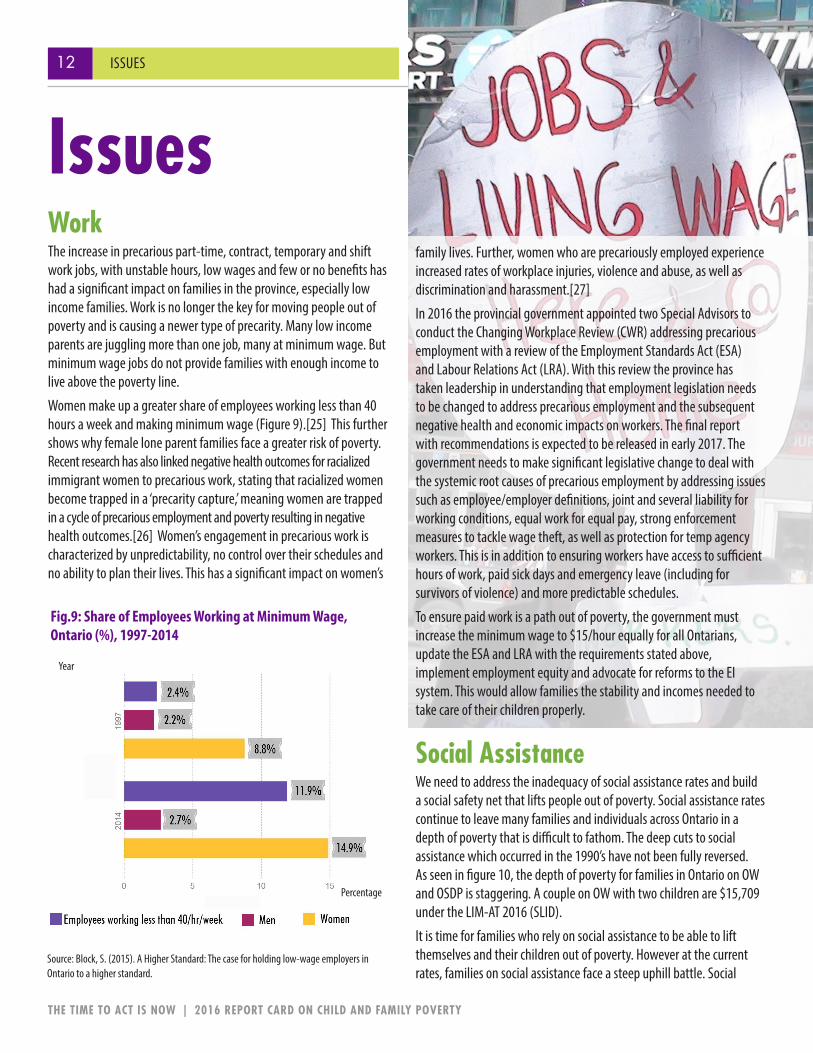
WorkThe increase in precarious part-time, contract, temporary and shift work jobs, with unstable hours, low wages and few or no benefits has had a significant impact on families in the province, especially low income families. Work is no longer the key for moving people out of poverty and is causing a newer type of precarity. Many low income parents are juggling more than one job, many at minimum wage. But minimum wage jobs do not provide families with enough income to live above the poverty line.
Women make up a greater share of employees working less than 40 hours a week and making minimum wage (Figure 9).[25] This further shows why female lone parent families face a greater risk of poverty. Recent research has also linked negative health outcomes for racialized immigrant women to precarious work, stating that racialized women become trapped in a ‘precarity capture,’ meaning women are trapped in a cycle of precarious employment and poverty resulting in negative health outcomes.[26] Women’s engagement in precarious work is characterized by unpredictability, no control over their schedules and no ability to plan their lives. This has a significant impact on women’s
Issues
Fig.9: Share of Employees Working at Minimum Wage, Ontario (%), 1997-2014
Source: Block, S. (2015). A Higher Standard: The case for holding low-wage employers in Ontario to a higher standard.
Year
Percentage
12 ISSUES
family lives. Further, women who are precariously employed experience increased rates of workplace injuries, violence and abuse, as well as discrimination and harassment.[27]
In 2016 the provincial government appointed two Special Advisors to conduct the Changing Workplace Review (CWR) addressing precarious employment with a review of the Employment Standards Act (ESA) and Labour Relations Act (LRA). With this review the province has taken leadership in understanding that employment legislation needs to be changed to address precarious employment and the subsequent negative health and economic impacts on workers. The final report with recommendations is expected to be released in early 2017. The government needs to make significant legislative change to deal with the systemic root causes of precarious employment by addressing issues such as employee/employer definitions, joint and several liability for working conditions, equal work for equal pay, strong enforcement measures to tackle wage theft, as well as protection for temp agency workers. This is in addition to ensuring workers have access to sufficient hours of work, paid sick days and emergency leave (including for survivors of violence) and more predictable schedules.
To ensure paid work is a path out of poverty, the government must increase the minimum wage to $15/hour equally for all Ontarians, update the ESA and LRA with the requirements stated above, implement employment equity and advocate for reforms to the EI system. This would allow families the stability and incomes needed to take care of their children properly.
Social AssistanceWe need to address the inadequacy of social assistance rates and build a social safety net that lifts people out of poverty. Social assistance rates continue to leave many families and individuals across Ontario in a depth of poverty that is difficult to fathom. The deep cuts to social assistance which occurred in the 1990’s have not been fully reversed. As seen in figure 10, the depth of poverty for families in Ontario on OW and OSDP is staggering. A couple on OW with two children are $15,709 under the LIM-AT 2016 (SLID).
It is time for families who rely on social assistance to be able to lift themselves and their children out of poverty. However at the current rates, families on social assistance face a steep uphill battle. Social
THE TIME TO ACT IS NOW | 2016 REPORT CARD ON CHILD AND FAMILY POVERTY
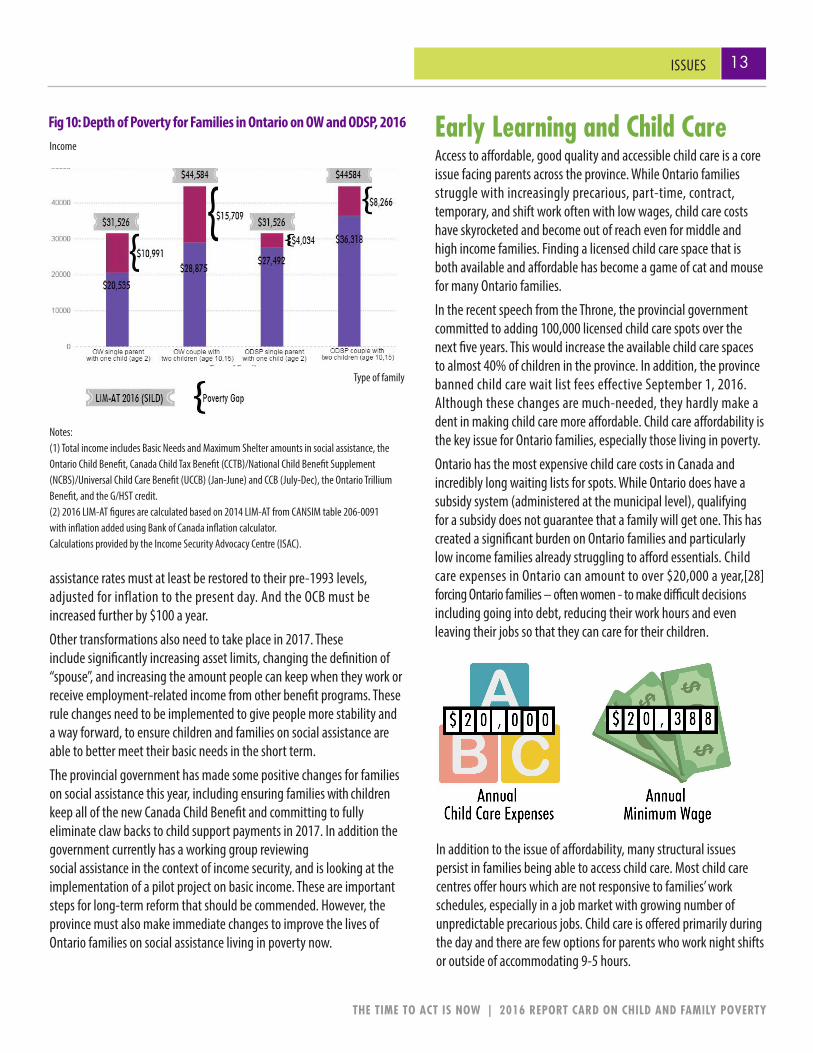
Fig 10: Depth of Poverty for Families in Ontario on OW and ODSP, 2016
Notes: (1) Total income includes Basic Needs and Maximum Shelter amounts in social assistance, the Ontario Child Benefit, Canada Child Tax Benefit (CCTB)/National Child Benefit Supplement (NCBS)/Universal Child Care Benefit (UCCB) (Jan-June) and CCB (July-Dec), the Ontario Trillium Benefit, and the G/HST credit. (2) 2016 LIM-AT figures are calculated based on 2014 LIM-AT from CANSIM table 206-0091 with inflation added using Bank of Canada inflation calculator.Calculations provided by the Income Security Advocacy Centre (ISAC).
Income
Type of family
assistance rates must at least be restored to their pre-1993 levels, adjusted for inflation to the present day. And the OCB must be increased further by $100 a year.
Other transformations also need to take place in 2017. These include significantly increasing asset limits, changing the definition of “spouse”, and increasing the amount people can keep when they work or receive employment-related income from other benefit programs. These rule changes need to be implemented to give people more stability and a way forward, to ensure children and families on social assistance are able to better meet their basic needs in the short term.
The provincial government has made some positive changes for families on social assistance this year, including ensuring families with children keep all of the new Canada Child Benefit and committing to fully eliminate claw backs to child support payments in 2017. In addition the government currently has a working group reviewing social assistance in the context of income security, and is looking at the implementation of a pilot project on basic income. These are important steps for long-term reform that should be commended. However, the province must also make immediate changes to improve the lives of Ontario families on social assistance living in poverty now.
Early Learning and Child CareAccess to affordable, good quality and accessible child care is a core issue facing parents across the province. While Ontario families struggle with increasingly precarious, part-time, contract, temporary, and shift work often with low wages, child care costs have skyrocketed and become out of reach even for middle and high income families. Finding a licensed child care space that is both available and affordable has become a game of cat and mouse for many Ontario families.
In the recent speech from the Throne, the provincial government committed to adding 100,000 licensed child care spots over the next five years. This would increase the available child care spaces to almost 40% of children in the province. In addition, the province banned child care wait list fees effective September 1, 2016. Although these changes are much-needed, they hardly make a dent in making child care more affordable. Child care affordability is the key issue for Ontario families, especially those living in poverty.
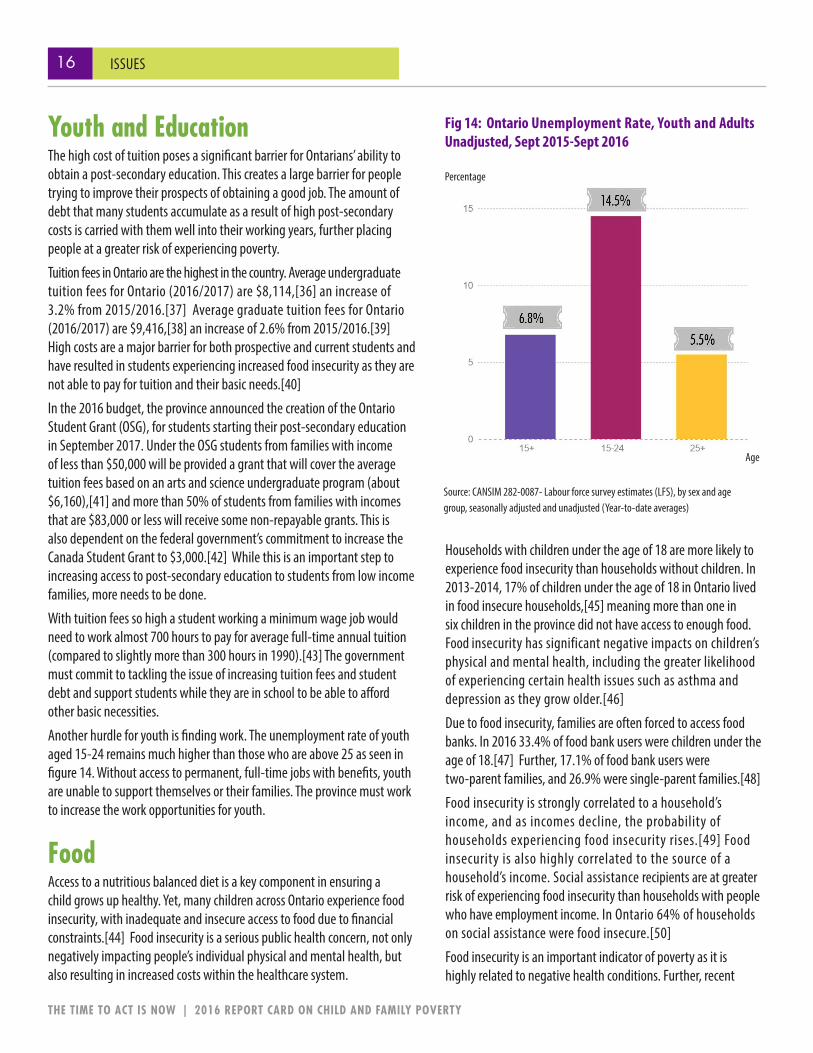
Ontario has the most expensive child care costs in Canada and incredibly long waiting lists for spots. While Ontario does have a subsidy system (administered at the municipal level), qualifying for a subsidy does not guarantee that a family will get one. This has created a significant burden on Ontario families and particularly low income families already struggling to afford essentials. Child care expenses in Ontario can amount to over $20,000 a year,[28] forcing Ontario families – often women - to make difficult decisions including going into debt, reducing their work hours and even leaving their jobs so that they can care for their children.
In addition to the issue of affordability, many structural issues persist in families being able to access child care. Most child care centres offer hours which are not responsive to families’ work schedules, especially in a job market with growing number of unpredictable precarious jobs. Child care is offered primarily during the day and there are few options for parents who work night shifts or outside of accommodating 9-5 hours.
13ISSUES
THE TIME TO ACT IS NOW | 2016 REPORT CARD ON CHILD AND FAMILY POVERTY

Fig. 11: Proportion (%) of Renter Households in Core Housing Need, 2011
Source: CHMC (census-based and NHS-based housing indicators and data)
Source: 2016 Waiting Lists Survey Report
Type of Household
Percentage
Fig 12: Proportion (%) of Total Active Households on Waiting List for RGI by Household Type, 2015
14
The lack of an accessible and affordable child care system creates a gap in care for Ontario’s children at one of the most important times in their lives. It is widely known that the first 2000 days of a child’s life are a key building block for their health and development for the rest of their lives. By not addressing the affordability gap of child care in Ontario we are effectively turning our backs on Ontario’s children whom need our collective support.
The time has come for Ontario’s children to be given the supports they need within the first 2000 days of their lives. As the report on the gender wage gap recommends, within a clearly defined time frame, there needs to be put in place an affordable, accessible, high quality, publicly funded and geared to income child care system in Ontario with enough spaces to meet the needs of all Ontarians.[29] In addition this needs to be implemented in coordination with core funding from the federal government and ensure that the program addresses all of the current systemic gaps.[30]
HousingThe right to safe, affordable, good quality and accessible housing is a key social determinant of health. Housing provides the foundation for families and children to move out of poverty. However, many families across the province struggle to access housing and are in Core Housing Need.[31] This is particularly evident in renter households, where 30% of renters in Ontario are in housing that is unaffordable, requires major repair or is overcrowded, compared to 7% of home owners.[32] This number increases by almost 10% when looking at renter households with children.[33]
The number of renter families in core housing need also increases considerably when looking at different family compositions, specifically female lone parent renters, recent immigrants (landed 2006-2011) and Indigenous households (Figure 11). This illustrates not only the differing level of need of diverse family types but also the importance of disaggregating data to ensure a clear picture of who is affected by housing precarity and the need for targeted interventions and policies to ensure different families are assisted by policies equitably.
Inadequate access to housing is also seen in the number of families on waiting lists for rent-geared to income (RGI) housing. In 2015, there were 171,360 Ontario families, seniors and single adults and couples on the RGI waiting list.[34] Families with children make up 31% of those on the waiting list for RGI housing (Figure 12). The average wait time for families for a unit is 3.7 years (Figure 13).[35] There is a drastic need for a more affordable supply of housing to ensure children and families who struggle to make ends meet can afford basic needs. A concerted effort must be made to ensure there is enough supply of housing and that units are affordable based on families’ incomes.
ISSUES
THE TIME TO ACT IS NOW | 2016 REPORT CARD ON CHILD AND FAMILY POVERTY

Source: 2016 Waiting Lists Survey Report
Fig. 13: Average Wait Times for RGI Chronological Applicants, 2015
Type of Household
Years
In the 2014 PRS, the province committed to ending homelessness by 2019. The province has taken small steps to address the housing crisis by re-introducing the Inclusionary Zoning Bill and introducing a pilot portable housing benefit for survivors fleeing domestic violence. However much more is needed to address the precarious housing circumstances families and children are living within.
The province must address the inequities within the rent control guidelines that have placed renters in precarious rental situations by including units built after 1993 and providing assistance to low income families particularly in rural areas to pay for housing repairs. The time is now to address the different needs of different households and to ensure all children in the province have not just a house but a home.
15ISSUES
THE TIME TO ACT IS NOW | 2016 REPORT CARD ON CHILD AND FAMILY POVERTY
Youth and EducationThe high cost of tuition poses a significant barrier for Ontarians’ ability to obtain a post-secondary education. This creates a large barrier for people trying to improve their prospects of obtaining a good job. The amount of debt that many students accumulate as a result of high post-secondary costs is carried with them well into their working years, further placing people at a greater risk of experiencing poverty.
Tuition fees in Ontario are the highest in the country. Average undergraduate tuition fees for Ontario (2016/2017) are $8,114,[36] an increase of 3.2% from 2015/2016.[37] Average graduate tuition fees for Ontario (2016/2017) are $9,416,[38] an increase of 2.6% from 2015/2016.[39] High costs are a major barrier for both prospective and current students and have resulted in students experiencing increased food insecurity as they are not able to pay for tuition and their basic needs.[40]
In the 2016 budget, the province announced the creation of the Ontario Student Grant (OSG), for students starting their post-secondary education in September 2017. Under the OSG students from families with income of less than $50,000 will be provided a grant that will cover the average tuition fees based on an arts and science undergraduate program (about $6,160),[41] and more than 50% of students from families with incomes that are $83,000 or less will receive some non-repayable grants. This is also dependent on the federal government’s commitment to increase the Canada Student Grant to $3,000.[42] While this is an important step to increasing access to post-secondary education to students from low income families, more needs to be done.
With tuition fees so high a student working a minimum wage job would need to work almost 700 hours to pay for average full-time annual tuition (compared to slightly more than 300 hours in 1990).[43] The government must commit to tackling the issue of increasing tuition fees and student debt and support students while they are in school to be able to afford other basic necessities.
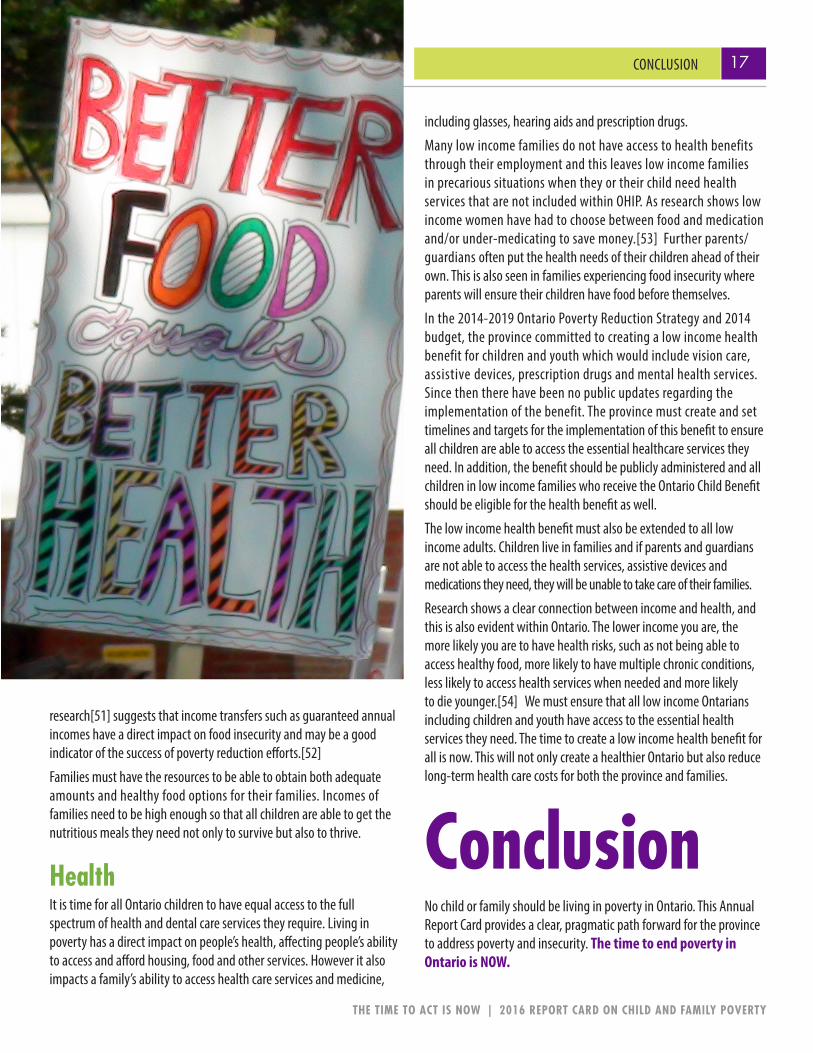
Another hurdle for youth is finding work. The unemployment rate of youth aged 15-24 remains much higher than those who are above 25 as seen in figure 14. Without access to permanent, full-time jobs with benefits, youth are unable to support themselves or their families. The province must work to increase the work opportunities for youth.
FoodAccess to a nutritious balanced diet is a key component in ensuring a child grows up healthy. Yet, many children across Ontario experience food insecurity, with inadequate and insecure access to food due to financial constraints.[44] Food insecurity is a serious public health concern, not only negatively impacting people’s individual physical and mental health, but also resulting in increased costs within the healthcare system.
Fig 14: Ontario Unemployment Rate, Youth and Adults Unadjusted, Sept 2015-Sept 2016
Source: CANSIM 282-0087- Labour force survey estimates (LFS), by sex and age group, seasonally adjusted and unadjusted (Year-to-date averages)
Percentage
Age
Households with children under the age of 18 are more likely to experience food insecurity than households without children. In 2013-2014, 17% of children under the age of 18 in Ontario lived in food insecure households,[45] meaning more than one in six children in the province did not have access to enough food. Food insecurity has significant negative impacts on children’s physical and mental health, including the greater likelihood of experiencing certain health issues such as asthma and depression as they grow older.[46]
Due to food insecurity, families are often forced to access food banks. In 2016 33.4% of food bank users were children under the age of 18.[47] Further, 17.1% of food bank users were two-parent families, and 26.9% were single-parent families.[48]
Food insecurity is strongly correlated to a household’s income, and as incomes decline, the probability of households experiencing food insecurity rises.[49] Food insecurity is also highly correlated to the source of a household’s income. Social assistance recipients are at greater risk of experiencing food insecurity than households with people who have employment income. In Ontario 64% of households on social assistance were food insecure.[50]
Food insecurity is an important indicator of poverty as it is highly related to negative health conditions. Further, recent
16 ISSUES
THE TIME TO ACT IS NOW | 2016 REPORT CARD ON CHILD AND FAMILY POVERTY
Age
research[51] suggests that income transfers such as guaranteed annual incomes have a direct impact on food insecurity and may be a good indicator of the success of poverty reduction efforts.[52]
Families must have the resources to be able to obtain both adequate amounts and healthy food options for their families. Incomes of families need to be high enough so that all children are able to get the nutritious meals they need not only to survive but also to thrive.
HealthIt is time for all Ontario children to have equal access to the full spectrum of health and dental care services they require. Living in poverty has a direct impact on people’s health, affecting people’s ability to access and afford housing, food and other services. However it also impacts a family’s ability to access health care services and medicine,
including glasses, hearing aids and prescription drugs.
Many low income families do not have access to health benefits through their employment and this leaves low income families in precarious situations when they or their child need health services that are not included within OHIP. As research shows low income women have had to choose between food and medication and/or under-medicating to save money.[53] Further parents/guardians often put the health needs of their children ahead of their own. This is also seen in families experiencing food insecurity where parents will ensure their children have food before themselves.
In the 2014-2019 Ontario Poverty Reduction Strategy and 2014 budget, the province committed to creating a low income health benefit for children and youth which would include vision care, assistive devices, prescription drugs and mental health services. Since then there have been no public updates regarding the implementation of the benefit. The province must create and set timelines and targets for the implementation of this benefit to ensure all children are able to access the essential healthcare services they need. In addition, the benefit should be publicly administered and all children in low income families who receive the Ontario Child Benefit should be eligible for the health benefit as well.
The low income health benefit must also be extended to all low income adults. Children live in families and if parents and guardians are not able to access the health services, assistive devices and medications they need, they will be unable to take care of their families.
Research shows a clear connection between income and health, and this is also evident within Ontario. The lower income you are, the more likely you are to have health risks, such as not being able to access healthy food, more likely to have multiple chronic conditions, less likely to access health services when needed and more likely to die younger.[54] We must ensure that all low income Ontarians including children and youth have access to the essential health services they need. The time to create a low income health benefit for all is now. This will not only create a healthier Ontario but also reduce long-term health care costs for both the province and families.
ConclusionNo child or family should be living in poverty in Ontario. This Annual Report Card provides a clear, pragmatic path forward for the province to address poverty and insecurity. The time to end poverty in Ontario is NOW.
17CONCLUSION
THE TIME TO ACT IS NOW | 2016 REPORT CARD ON CHILD AND FAMILY POVERTY
Endnotes[1] Poverty Reduction Strategy (2015 Annual Report) Retrieved from https://www.ontario.ca/page/poverty-reduction-strategy-2015-annual-report
[2] Ontario’s Poverty Reduction Strategy (2014 Annual Report) Retrieved from https://www.ontario.ca/page/ontarios-poverty-reduction-strategy-2014-annual-report
[3] Statistics Canada. Income Statistics Division (2016 July). Annual Income Estimates for Census Families and Individuals (T1 Family File) Family Data User’s Guide 2016
[4] IBID.
[5] Poverty Reduction Strategy (2015 Annual Report) Retrieved from https://www.ontario.ca/page/poverty-reduction-strategy-2015-annual-report
[6] Statistics Canada. Table 111-0015 – Family characteristics, Low Income Measure (LIM), by family type and family type composition, annual, CANSIM
[7] IBID.
[8] IBID.
[9] Statistics Canada, Income Statistics Division, T1FF 2014, Reference 16060
[10] IBID.
[11] Statistics Canada. Table 111-0015 – Family characteristics, Low Income Measure (LIM), by family type and family type composition, annual CANSIM
[12] CANSIM 111-0011 Family characteristics, by family type, family composition and characteristics of parents, annual CANSIM
[13] IBID.
[14] IBID.
[15] Statistics Canada, Small Area Administrative Data, 2014 Tax File Family Series, Table 18
[16] Inequality and Health. Institute for Policy Studies. Retrieved from http://inequality.org/wp-content/uploads/2011/01/health-inequality-charts.pdf
[17] Macdonald, D. & Wilson, D. (2016) Shameful Neglect: Indigenous Child Poverty in Canada. Retrieved from https://www.policyalternatives.ca/publications/reports/shameful-neglect
[18] IBID.
[19] Canada-Ontario Labour Market Agreement For Persons with Disabilities 2014-15 Annual Report (2015)Retrieved from http://www.mcss.gov.on.ca/en/mcss/publications/about/lmapd201415/#introduction
[20] Final Report and Recommendation’s of the Gender Wage Gap Strategy Steering Committee, 2016. Retrieved from https://www.ontario.ca/page/final-report-and-recommendations-gender-wage-gap-strategy-steering-committee
[21] Food Banks Canada (2016). HungerCount 2016. Toronto: Food Banks Canada.
[22] Ng, W. et. al. (2016). “Working so hard and still so poor!” A Public Health Crisis in the Making: The Health Impacts of Precarious Work on Racialized Refugee and Immigrant Women. Retrieved from http://www.ryerson.ca/content/dam/clmr/publications/Final%20Report%20(Precarious%20Work).pdf
[23] Final Report and Recommendations of the Gender Wage Gap Strategy Steering Committee, 2016. Retrieved from https://www.ontario.ca/page/final-report-and-recommendations-gender-wage-gap-strategy-steering-committee
[24] IBID., p.20
[25] Block, S. (2015). A Higher Standard: The case for holding low-wage employers in Ontario to a higher standard. Retrieved from https://www.policyalternatives.ca/sites/default/files/uploads/publications/Ontario%20Office/2015/06/Higher_Standard.pdf
[26] Ng, W. et. al. (2016). “Working so hard and still so poor!” A Public Health Crisis in the Making: The Health Impacts of Precarious Work on Racialized Refugee and Immigrant Women. Retrieved from http://www.ryerson.ca/content/dam/clmr/publications/Final%20Report%20(Precarious%20Work).pdf
[27] IBID.
[28] http://globalnews.ca/news/2974609/how-child-care-costs-compare-in-canada-hint-theyre-way-more-than-tuition/
ENDNOTES18 ENDNOTES
THE TIME TO ACT IS NOW | 2016 REPORT CARD ON CHILD AND FAMILY POVERTY

[29] Final Report and Recommendations of the Gender Wage Gap Strategy Steering Committee, 2016. Retrieved from https://www.ontario.ca/page/final-report-and-recommendations-gender-wage-gap-strategy-steering-committee
[30] Macdonald, D. & Klinger, T. (2015). They Go Up So Fast: 2015 Child Care Fees in Canadian Cities. Retrieved from https://www.policyalternatives.ca/publications/reports/they-go-so-fast
[31] A household is in core housing need if their housing does not meet one or more of the affordability, adequacy or suitability standards and it spends 30% or more of its before-tax income to access local housing that is acceptable.
[32] CHMC (NHS-based housing indicators and data) 2011
[33] IBID.
[34] ONPhA (2016). 2016 Waiting Lists Survey Report: ONPHA’s final Report on Waiting Lists Statistics for Ontario. Retrieved from https://www.onpha.on.ca/onpha/web/Policy-andresearch/2016_Waiting_List_Survey/Content/PolicyAndResearch/Waiting_Lists_2016/2016_Waiting_Lists_Survey.aspx?hkey=08cff4ce-7f97-4af4-910c-c64954d28a4a
[35] IBID.
[36] Statistics Canada. Tuition fees for degree programs, 2016/2017. Retrieved from http://www.statcan.gc.ca/daily-quotidien/160907/dq160907a-eng.htm
[37] Statistics Canada. Table 477-0077 Canadian and international tuition fees by level of study (Percentage Change (year-to-year)) annual (dollars)
[38] Statistics Canada. Tuition fees for degree programs, 2016/2017. Retrieved from http://www.statcan.gc.ca/daily-quotidien/160907/dq160907a-eng.htm
[39] Statistics Canada. Table 477-0077 Canadian and international tuition fees by level of study (Percentage Change (year-to-year)) annual (dollars)
[40] https://www.thestar.com/news/gta/2016/11/02/nearly-40-per-cent-of-canadian-post-secondary-students-experience-food-insecurity-study.html
[41] Canadian Federation of Students – Ontario. The first step toward more affordable and accessible education: The Ontario Student Grant. Retrieved from personal correspon-dence.
[42] IBID.
[43] Tiessen, K. (2014). Should an Ontario university degree be a debt sentence? Retrieved from http://behindthenumbers.ca/2014/04/23/should-an-ontario-university-degree-be-a-debt-sentence/
[44] Tarasuk, V. Mitchell, A. Dachner, N. (2016). Household food insecurity in Canada, 2014. Toronto: Research to identify policy options to reduce food insecurity (PROOF). Retrieved from http://proof.utoronto.ca/wp-content/uploads/2016/04/Household-Food-Insecurity-in-Canada-2014.pdf
[45] IBID.
[46] IBID.
[47] Food Banks Canada (2016). HungerCount 2016. Toronto: Food Banks Canada.
[48] IBID.
[49] IBID.
[50] IBID.
[51] McIntyre, L., Dutton, D., & Emery, J.C. (2016). Reduction of Food Insecurity among Low-Income Canadian Seniors as a Likely Impact of a Guaranteed Annual Income. Retrieved from http://www.utpjournals.press/doi/pdf/10.3138/cpp.2015-069
[52] IBID.
[53] Ng, W. et. al. (2016). “Working so hard and still so poor!” A Public Health Crisis in the Making: The Health Impacts of Precarious Work on Racialized Refugee and Immigrant Women. Retrieved from http://www.ryerson.ca/content/dam/clmr/publications/Final%20Report%20(Precarious%20Work).pdf
[54] Health Quality Ontario (2016). Income and Health: Opportunities to achieve health and equity in Ontario. Retrieved from http://www.hqontario.ca/Portals/0/documents/system-performance/health-equity-report-en.pdf
19ENDNOTES
THE TIME TO ACT IS NOW | 2016 REPORT CARD ON CHILD AND FAMILY POVERTY
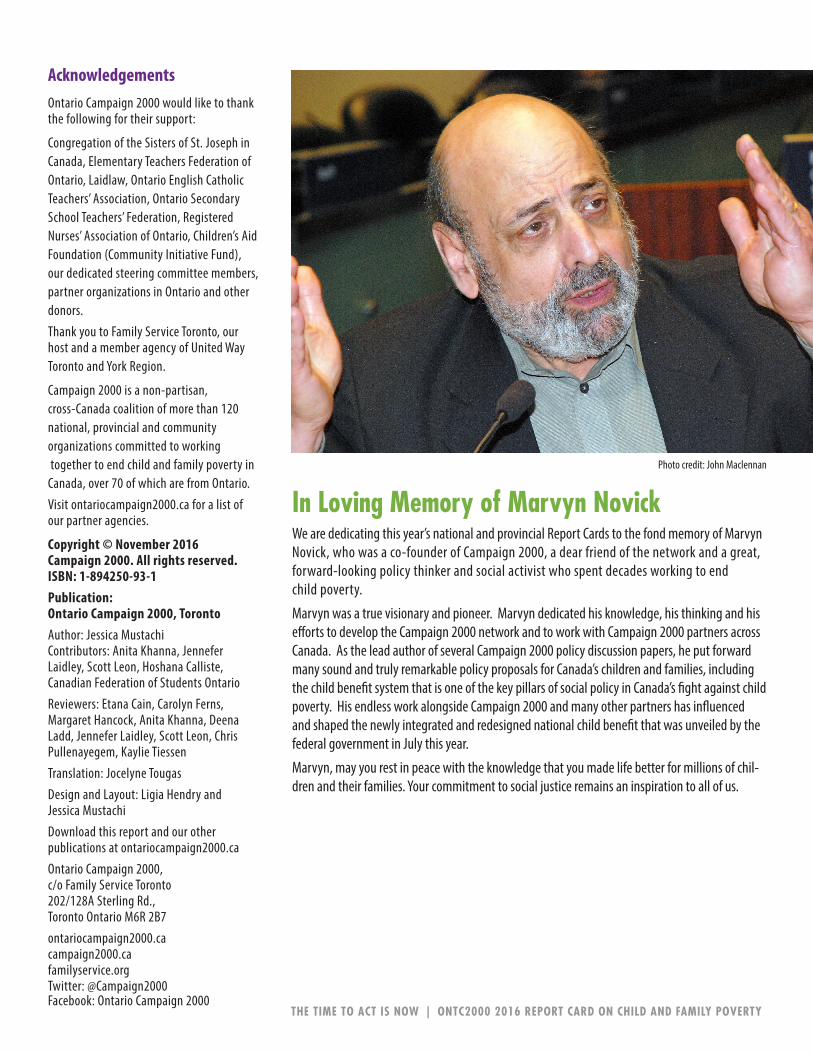
In Loving Memory of Marvyn NovickWe are dedicating this year’s national and provincial Report Cards to the fond memory of Marvyn Novick, who was a co-founder of Campaign 2000, a dear friend of the network and a great, forward-looking policy thinker and social activist who spent decades working to end child poverty.
Marvyn was a true visionary and pioneer. Marvyn dedicated his knowledge, his thinking and his efforts to develop the Campaign 2000 network and to work with Campaign 2000 partners across Canada. As the lead author of several Campaign 2000 policy discussion papers, he put forward many sound and truly remarkable policy proposals for Canada’s children and families, including the child benefit system that is one of the key pillars of social policy in Canada’s fight against child poverty. His endless work alongside Campaign 2000 and many other partners has influenced and shaped the newly integrated and redesigned national child benefit that was unveiled by the federal government in July this year.
Marvyn, may you rest in peace with the knowledge that you made life better for millions of chil-dren and their families. Your commitment to social justice remains an inspiration to all of us.
AcknowledgementsOntario Campaign 2000 would like to thank the following for their support:
Congregation of the Sisters of St. Joseph in Canada, Elementary Teachers Federation of Ontario, Laidlaw, Ontario English Catholic Teachers’ Association, Ontario Secondary School Teachers’ Federation, Registered Nurses’ Association of Ontario, Children’s Aid Foundation (Community Initiative Fund), our dedicated steering committee members, partner organizations in Ontario and other donors.Thank you to Family Service Toronto, our host and a member agency of United Way Toronto and York Region.
Campaign 2000 is a non-partisan, cross-Canada coalition of more than 120 national, provincial and community organizations committed to working together to end child and family poverty in Canada, over 70 of which are from Ontario.Visit ontariocampaign2000.ca for a list of our partner agencies.
Copyright © November 2016 Campaign 2000. All rights reserved. ISBN: 1-894250-93-1Publication: Ontario Campaign 2000, TorontoAuthor: Jessica Mustachi Contributors: Anita Khanna, Jennefer Laidley, Scott Leon, Hoshana Calliste, Canadian Federation of Students OntarioReviewers: Etana Cain, Carolyn Ferns, Margaret Hancock, Anita Khanna, Deena Ladd, Jennefer Laidley, Scott Leon, Chris Pullenayegem, Kaylie TiessenTranslation: Jocelyne TougasDesign and Layout: Ligia Hendry and Jessica MustachiDownload this report and our other publications at ontariocampaign2000.caOntario Campaign 2000, c/o Family Service Toronto 202/128A Sterling Rd., Toronto Ontario M6R 2B7ontariocampaign2000.ca campaign2000.cafamilyservice.org Twitter: @Campaign2000Facebook: Ontario Campaign 2000
Photo credit: John Maclennan
THE TIME TO ACT IS NOW | ONTC2000 2016 REPORT CARD ON CHILD AND FAMILY POVERTY