the uk bio-energy resource base to 2050: estimates - workspace
TRANSCRIPT

U K E N E R G Y R E S E A R C H C E N T R E
The UK bio-energy resource
base to 2050: estimates, assumptions, and
uncertainties
Working Paper
31st March 2010: REF UKERC/WP/TPA/2010/002
Raphael Slade
Ausilio Bauen
Rob Gross
Imperial Centre for Energy Policy and Technology
UK Energy Research Centre UKERC/WP/TPA/2010/002
T H E U K E N E R G Y R E S E A R C H C E N T R E
The UK Energy Research Centre is the focal point for UK research on sustainable energy. It
takes a whole systems approach to energy research, drawing on engineering, economics
and the physical, environmental and social sciences. The Centre's role is to promote
cohesion within the overall UK energy research effort, acting as a bridge between the UK
energy research community and the wider world, including business, policymakers and the
international energy research community.
Preface This report has been produced by the UK Energy Research Centre‟s Technology and Policy
Assessment (TPA) function. The TPA was set up to address key controversies in the energy
field through comprehensive assessments of the current state of knowledge. It aims to
provide authoritative reports that set high standards for rigour and transparency, while
explaining results in a way that is useful to policymakers.
This report precedes a TPA study of some of the key issues which face the deployment of
bio-energy resources in the period to 2050. The objective of this report was to review
existing estimates of the UK resource base and identify the most important assumptions
and uncertainties affecting estimates of the domestic resource potential. It was envisaged
that this would inform the scope of the subsequent bio-energy TPA. A secondary objective
was to assist DECC develop bio-energy route maps, promised under the UK‟s 2009 Low
Carbon Transition Plan.
Acknowledgements This work was co-financed by the UK Energy Research Centre (UKERC) and the Department
of Energy and Climate Change (DECC).
This report was reviewed by Dr David Turley (National Non-food Crops Centre), and Dr
Patricia Thornley (Tyndall Centre for Climate Change Research, University of Manchester).
We gratefully acknowledge their comments and insights. The content of this work and its
conclusions remain the responsibility of the authors.

UK Energy Research Centre UKERC/WP/TPA/2010/002
Contents
Preface ..................................................................................................................... ii
Acknowledgements ..................................................................................................... ii
Acronyms and abbreviations ........................................................................................ 1
Introduction .............................................................................................................. 1
Estimating the biomass resource potential – an overview of biomass resource assessment .. 2
The current contribution of domestically produced biomass to primary energy supply in the
UK ............................................................................................................................ 6
Estimates of the future contribution of different biomass resources to primary energy supply
in the UK ................................................................................................................... 7
Approach and overview of reviewed studies ............................................................... 7
Estimates of future bio-energy potential .................................................................... 9
Review of assumptions, methods and data sources ....................................................... 14
Agricultural residues .............................................................................................. 14
Forestry and forestry residues ................................................................................ 15
Perennial energy crops .......................................................................................... 16
Conventional energy crops (grain/oil seed) .............................................................. 18
Wastes ................................................................................................................ 19
Other assumptions / cross-cutting issues ................................................................. 19
Conclusions ............................................................................................................. 20
Recommendations .................................................................................................... 21
References .............................................................................................................. 22
Appendix 1 .............................................................................................................. 27
Appendix 2 .............................................................................................................. 28

UK Energy Research Centre UKERC/WP/TPA/2010/002
Acronyms and abbreviations
BEE Biomass Energy Europe (an FP7 project)
CAP Common agricultural policy
CHP Combined heat and power
FP7 The 7th European framework programme for
research and development
GHG Greenhouse gas
LHV Lower heating value
MSW Municipal solid waste
RTFO Renewable Transport Fuel Obligation
SRC Short rotation coppice
SRF Short rotation forestry
WRAP Waste resource action project

1
UK Energy Research Centre UKERC/WP/TPA/2010/002
Introduction
The British Government has aspirations to increase the use of renewable energy for the
provision of heat, power and transport energy services in the UK. In an effort to realise
these aspirations it has included bio-energy in its energy and climate policies, as have the
Governments of every other country in Europe (Faaij, 2006). Increasing the use of bio-
energy appears to be an attractive option because it has the potential to substitute for fossil
fuels, reduce greenhouse gas (GHG) emissions, and contribute to other policy objectives
such as rural development. There are also many options for providing high value energy
services (and energy vectors) from biomass feedstocks using commercially available
technologies.
Biomass, however, is a diverse and complex resource. Potential feedstocks include
conventional crops and forestry products, residues, waste materials, and specially cultivated
energy crops such as coppiced wood and perennial grasses. The availability of these
materials tends to be intertwined with activity in other major economic sectors: agriculture,
forestry, food processing, paper and pulp, building materials etc., (Faaij, 2006). They may
also be produced domestically or imported. Supply-chains for biomass feedstocks are
correspondingly complex. This complexity is accentuated by the fact that the composition of
the biomass – its chemical structure, moisture content, etc. – is highly variable, and
different grades of biomass may have restricted applications or may need to be blended to
meet the specifications of a particular conversion technology.
The role that bio-energy may play in the future energy system is thus fundamentally
constrained, not only by the availability of biomass, but by the suitability of the biomass
that is available to meet a portfolio of competing demands. If bio-energy is to make a
meaningful contribution to the UK energy mix, significant and sustained investment will also
be needed. In this context, estimates of the current, and future, biomass resource potential
underpin many of the strategic investment and policy decisions that must be made. A
project developer, for example, must be able to secure a feedstock supply contracts that are
acceptable to financiers; for a large facility, this may mean taking a view on how the
demand and availability of feedstocks might change over a twenty year period. From a
governmental perspective, knowledge of how much biomass is available might be expected
to inform the policy process and the development of appropriate interventions.
Yet, addressing the question “how much biomass is available for bio-energy purposes?” is a
challenging task, not least because the definition of availability is, itself, somewhat
ambiguous. There are also many alternative methodologies that can be applied to the
problem. Most have some merit, but all have limitations. This paper aims to review existing
estimates of the UK resource base and identify the most important assumptions and
uncertainties that affect estimates of resource potential. The focus of the paper is limited to
the domestically produced feedstocks expected to make a contribution to the 2050 bio-
energy resource base. These are: forest materials, agricultural residues and energy crops.
Although not the primary focus of this report, wastes materials are also considered.

2
UK Energy Research Centre UKERC/WP/TPA/2010/002
The paper is presented in 5 parts:
An overview of biomass resource assessment
The current contribution from domestically produced biomass to primary energy
supply in the UK
A review of estimates of the UK biomass resource base
A review of assumptions, data sources, and uncertainties
Conclusions and recommendations
Estimating the biomass resource potential – an overview of biomass resource assessment The availability of biomass for energy purposes has been the subject of a great many
studies1. Assessments have been undertaken at global, regional, and sub-regional scales,
and there is general agreement about the most important parameters affecting the
contribution that bio-energy might make to primary energy supply. These are: the
availability of land, the productivity of the biomass grown upon it, and competition for
alternate uses of the land, the biomass, and for the waste materials derived from the
biomass (Berndes, et al., 2003). The range of estimates that can be found in Governmental
reports and the academic literature, however, is strikingly diverse. At the global level, for
example, estimates for the amount of primary energy that might be provided by biomass in
2050 vary from less than 100EJ.yr-1, to over 1100EJ.yr-1(Hoogwijk, et al., 2003, Berndes, et
al., 2003). These figures compare with an estimated global primary energy supply of
~503EJ.yr-1 in 20072 (IEA, 2009).
Reasons for the large range in estimates include the wide variety of methodologies,
datasets, and assumptions used to estimate the availability of land, the yield of biomass,
and the availability of residues from existing industries. Generally speaking, existing studies
may be classified according to the methodologies they employ. The clearest distinction is
between estimates of potential that are resource focussed, and those that are demand
driven. Resource focussed studies seek to compile an inventory of biomass resources, based
upon assumptions about the availability of supply side resources (principally land) and
competition between different uses and markets. Demand-driven studies, on the other
hand, focus on the competitiveness of bio-energy compared to conventional energy sources
or estimate the amount of biomass required to meet specific, exogenously imposed, targets
(Berndes, et al., 2003); this may be accomplished without necessarily specifying the
sources of bio-energy used. A distinction may also be drawn between studies based on their
1 Estimates of potential have been carried out at a global scale by, amongst others, the IPCC, US EPA, World Energy Council, Shell, IASA, and Stockholm Environmental Institute. These reports are
reviewed in detail in Berndes et al. (2003).
2 Of this 503EJ, the IEA estimate that ~9.8% was provided from combustible renewable energy
sources and waste.

3
UK Energy Research Centre UKERC/WP/TPA/2010/002
complexity (Smeets, et al., 2007). The least complex approaches involve the use of expert
judgment to estimate the future share of cropland, grassland, forests, and residue streams
available for bio-energy. The most complex involves the use of integrated models which
allow multiple variables, trade-offs and scenarios to be analysed3.
A generic approach to assessing the bio-energy resource potential is shown in Figure 1.
Crucially, the results of the assessment are highly dependent on the boundary conditions
identified at the outset. One of the most important boundary conditions is the definition
used for the availability of biomass, and some commonly used definitions are listed in Table
1. Another important boundary condition is the range of biomass materials included in the
assessment. A distinction is often made between crops and different types of residues, as
outlined in Table 2, but here also, methodologies differ and there is no single classification
scheme4.
Figure 1: A typical workflow for a bio-energy resource-potential assessment
Source: adapted from (Lauer, 2009)
3 Smeets et al. (2007) identify three integrated models that have been used to estimate the future potential of bioenergy: the Global Land Use and Energy Model (GLUE) (Yamamoto, et al., 1999), the Integrated Model to Assess the Global Environment (IMAGE) (Leemans, et al., 1996) and the Basic-
Linked System (BLS) model of the world food system (Fischer and Schrattenholzer, 2001a).
4 Although it should be noted that the European Committee for Standardisation is working on a
classification scheme for solid biofuels based on the biomass source (CEN/TC-335) (BEC, 2010).
Define boundary conditions
Identify possible land use changes
Identify possible changes in production systems
Information about land availability and productivity(soil quality, water availability, management practices , etc.)
Information about biomass production and use(forest inventories, crop statistics, descriptions of existing markets, etc.)
Calculatebio-energy potential
Apply expert
judgement

4
UK Energy Research Centre UKERC/WP/TPA/2010/002
Table 1: Definitions of biomass resource potential
Name Definition
Theoretical potential
/ Ultimate potential
Describes the amount of biomass that could grow annually, limited
by fundamental physical and biological barriers. The Theoretical
potential may change if conditions change, for example, due to
climate change.
Technical potential
All you can collect from the theoretical potential (taking into account
ecological constraints, agro technological restraints, topographic
problems etc. The technical potential may change as technology
advances. The technical potential may also be defined as the
proportion of the theoretical potential that is not limited by the
demand for land for food, housing, etc.
Economic potential
All biomass available up to a specified price level (taking into
account the price elasticity of competitors on the market). I.e. the
potential at a given price is determined by where the supply and
demand curves intersect. This is highly variable as economic
conditions may change dramatically over time. Moreover, markets
may not exist for many biomass feedstocks, or they may be
imperfect.
Realistic potential /
Implementation
potential
All biomass available without inducing negative social or social
economic impacts and respecting technology and market
development issues. May be estimated using recoverability fraction
or accessibility factor multipliers, reflecting what is considered the
realistic maximum rates of energy use of biomass residues. Deciding
what is the most appropriate multiplier to use in any particular
instance is often a matter of expert judgement.
Sources: (Smeets, et al., 2007, Fischer and Schrattenholzer, 2001b) (Lauer, 2009)

5
UK Energy Research Centre UKERC/WP/TPA/2010/002
Table 2: Classification schemes for biomass feedstocks
Energy crops a
Conventional crops Annual crops: cereals, Oil seed rape, sugar beet
Perennial energy crops Short rotation coppice willow or poplar, and
miscanthus
Forestryf and forestry
residues
Short rotation forestry h
Primary
residues b, c
Wood chips from branches, tips and poor
quality stemwood
Agricultural crop residues Straw from cereals and oil seed rape
Wastes
Secondary
residues b,d
Sawmill co-
product
Wood chips, sawdust and bark from sawmill
operations
Arboricultural
arisings
Stemwood, wood chips, branches and foliage
from municipal tree surgery operations
Tertiary
residues b,e
Waste wood g Clean and contaminated waste wood
Organic waste Paper/card, food/kitchen, garden/plant and
textiles wastes
Sewage
sludge From Waste Water Treatment Works
Animal
manures
Manures and slurries from cattle, pigs, sheep
and poultry
Landfill gas Captured gases from decomposing
biodegradable waste in landfill sites
a Availability depends on the amount of land dedicated to the crop, and the crop yield b Availability is dependent on activity in other economic sectors. c Harvest residues: typically available „in the field‟ and need to be collected to be available for further
use. d Processing residues: produced during production of food or biomass materials; typically available in
the food and beverage industry. e Post consumption residues: materials that become available after a biomass derived commodity has
been used. f Timber from mature forests is generally considered to be too valuable to use for energy purposes g This category may, or may not, be taken to include a fraction of municipal solid waste (MSW) h short rotation forestry may also be considered an energy crop in some schemes
Source: adapted from (Faaij, 2006, Hoogwijk, et al., 2003, E4tech, 2009)
It is important to recognise that bio-energy potential assessments are only comparable if
they are based on the same boundary conditions, and the general lack of consistency
between estimates has been identified as a cause for concern. In response, the EU FP7
Research Programme is currently sponsoring two projects that seek to harmonize
assessment methods and understand the reasons for discrepancies: Biomass Energy Europe
(BEE) (www.eu-bee.com), and Classification of European Biomass Potential for Bioenergy
Using Terrestrial and Earth Observations (CEUBIOM) (www.ceubiom.org). Initial results

6
UK Energy Research Centre UKERC/WP/TPA/2010/002
from the BEE project include a review of studies that have sought to estimate the potential
for bio-energy in the EU5. Analysing the studies in detail, the BEE project team found that
the vast majority (>95%) of assessments could be classified as resource focussed, and that
the disparities in estimates could be attributed to four key factors:
Ambiguous and inconsistent definitions of resource potential.
A lack of consistent and detailed data on (current) biomass production and land
productivity.
Ambiguous and varying methods for estimating (future) biomass production and
availability.
Ambiguous and varying assumptions used to estimate factors external to the
modeled system (such as land use and biomass production for food and fiber
purposes) that might influence potentials. (BEE, 2008)
It may be anticipated that these same factors will underlie discrepancies in estimates of the
UK resource potential.
The current contribution of domestically produced biomass to primary energy supply in the UK In order to put estimates of the future UK bio-energy potential in context, it is useful to
consider the current contribution of renewable and bio-energy to UK primary energy. UK
Government statistics estimate that UK consumption of primary energy was 9805PJ in 2008.
Renewables contributed 222PJ to this total, of which ~207PJ were obtained from imported
and domestically produced biomass. The contribution from domestically produced biomass is
somewhat harder to ascertain, but is estimated to be in the region of ~116-170PJ,
depending whether municipal solid waste and tyres are included, see Table 3.
5 The BEE project identified 136 studies that have sought to estimate the potential for bio-energy, of
which 66 were considered to be directly applicable to the EU27 (or a subset of Member States), and 7 considered all biomass categories. Those studies which explicitly identified the resource potential in
the UK have been included in this review.

7
UK Energy Research Centre UKERC/WP/TPA/2010/002
Table 3: The contribution of domestically produced biomass to UK primary energy
consumption 2008
Resource Current Use
(PJ)
Landfill methane 65.9
Wood 15.0
Sewage gas 10.2
Poultry litter 5.9 a
Other Meat, bone & farm
waste 6.5 b
Wood waste 4.5
Straw 3.0 c
Perennial Energy Crops 2.2 d
Biodiesel from oilseed rape,
tallow and used cooking oil 2.2 e
Bio-ethanol from sugar beet 0.8 e
MSW, Tyres and "other"
plant based biomass 54.6 f
TOTAL 170.0
a 670,000t annual consumption from 3 plants operated by EPR Ltd. (EPR, 2009). b From UK Energy
Statistics, less consumption of poultry litter. c Consumption from Ely Power Station (Copeland and
Turley, 2008). d Based on Booth et al. (2009) and Kilpatrick (2008). e derived from Renewable Fuels
Agency (RFA) Quarterly Report (NB – there is a discrepancy between the RFA figure used here and the
figure for domestically produced liquid fuels (12PJ) included in UK energy statistics 2008)(RFA, 2009). f Includes MSW, tyres and “plant based biomass” included in 2008 energy statistics, less other
categories, assumed to be a waste fraction.
Source: UK Energy Statistics 2008 commodity balances unless otherwise stated (DECC, 2009).
Estimates of the future contribution of different biomass resources to primary energy supply in the
UK
Approach and overview of reviewed studies
A short, systematic review of the literature was undertaken to identify reports and papers
that estimated the contribution that biomass may make to UK primary energy, or presented
sufficient information to allow the contribution to primary energy to be derived. The search
focussed on both the academic and grey literature; the search terms used and databases
examined are listed in Appendix 1. As discussed above, biomass can sub divided into many
different categories each of which could be the subject of a systematic review in its own

8
UK Energy Research Centre UKERC/WP/TPA/2010/002
right. To prevent the number of reports from becoming unmanageable, reports that sought
to estimate the potential for a single biomass category were not included in this first phase
of the analysis, (key reports are discussed in the following section). Reports more than 10
years old were also excluded. Each report was then examined to in detail to identify the
following attributes:
Scope
Definition of bio-energy potential used
Results given for future UK bio-energy potential
Methodology and assumptions
Main input data
The review identified 14 reports which met the criteria outlined above; these are listed in
Table 4. Where estimates were quantified in terms of delivered electricity or heat, these
figures were converted back to primary energy using the conversion ratios used in the
original report, or 30% for electricity if no conversion ratio was stated (as noted in the
text). For liquid biofuels the contribution to primary energy was taken to be the energy
content (lower heating value6 (LHV)) of the liquid fuel. For anaerobic digestion, the
contribution to primary energy was taken to be the LHV value of the gas. For reports where
figures were given in oven dry tonnes of biomass an average calorific value of 17GJ.odt-1
was used unless otherwise stated. Following the classification scheme presented in Table 2,
the categories used to describe biomass resources in this report are: conventional crops,
perennial energy crops, forestry residues, agricultural crop residues, and wastes. Short
rotation forestry (SRF) has been grouped with perennial energy crops. Where reports
provided sufficient detail, the biomass potential for each resource category is described.
6 The lower heating value (also known as net calorific value) of a fuel is defined as the amount of heat
released by combusting a specified quantity (initially at 25°C) and returning the temperature of the combustion products to 150°C; i.e. the latent heat of vaporization of water in the reaction products is
not recovered.

9
UK Energy Research Centre UKERC/WP/TPA/2010/002
Table 4: Studies included in this review
Study Label Title Geographic
focus
Main
reference
Oxera02 Regional renewable energy assessments: a
report to the DTI and DTLR UK
(Oxera,
2002)
E4Tech03
Biomass for heat and power in the UK: a
technoeconomic assessment of long term
potential - a report to the renewables
innovation review
UK (E4Tech,
2003)
RCEP04 Royal Commission for Environmental
Pollution: Biomass as a renewable resource UK (RCEP, 2004)
CT05 Biomass sector review for the Carbon Trust UK (Carbon
Trust, 2005)
Taskforce05 Biomass Taskforce 2005 UK
(Biomass
Taskforce,
2005)
AEA05 Renewable heat and heat from combined
heat and power plant - study and analysis UK (AEA, 2005)
EEA07 How much bioenergy can Europe produce
without harming the environment EU (EEA, 2007)
UKBioStrat07 UK Biomass strategy 2007 UK (DEFRA,
2007)
E&Y07 Renewable heat initial business case UK (Ernst &
Young, 2007)
Fischer07
Assessment of biomass potentials for
biofuel feedstock production in Europe:
Methodology and results
EU (Fischer, et
al., 2007)
Kilpatrick08
Addressing the land use issues for non-food
crops, in response to increasing fuel and
energy generation opportunities.
UK (Kilpatrick,
2008)
E4tech09 Biomass supply curves for the UK: a report
for DECC UK
(E4tech,
2009)
Thornley09 Sustainability constraints on UK bioenergy
development UK
(Thornley, et
al., 2009)
deWit09 European biomass resource potential and
costs EU
(de Wit and
Faaij, 2009)
Estimates of future bio-energy potential
The approach, timeframe, and definition of potential used in each study is summarised in
Appendix 2, along with a summary of the estimates obtained. The focus of the reports
ranges from studies that have sought to address the potential of biomass in a particular UK
sector – e.g. electricity or heat – to studies that consider the aggregate UK potential in
comparison with other EU Member States. It is important to note that although all the

10
UK Energy Research Centre UKERC/WP/TPA/2010/002
reports contain estimates for the UK bio-energy potential, calculating this potential was not
necessarily the main objective of each report. The Carbon Trust report (CT05), for example,
sought to examine which supply-chains would deliver the most cost effective carbon savings
primarily as a means of directing its own research and investment strategy. The report by
Ernst and Young (2007) provides another example: here the main objective was to examine
the business case for renewable for heat; biomass was just one of the options considered.
All the reports can be considered to be resource focussed, rather than demand driven. They
either compile resource inventories from land availability projections and existing statistics,
or re-interpret earlier resource inventories with additional assumptions and scenarios. Direct
comparison between estimates is hindered by the use of different boundary conditions, the
inclusion of different resource categories, and consideration of different time periods.
Definitions of potential also range from illustrative scenarios and estimates of the un-
constrained technical potential to assessments of realistic and market potential. Yet the
overlap between reports is also considerable in terms of data sources used. The estimated
resource potentials described in the Ernst and Young (2007) report, for example, are
derived from the report by AEA (2005). Likewise, the data, underpinning the UK Biomass
Strategy (DEFRA, 2007) appears more-or-less identical to the data collated by the Biomass
Taskforce two years earlier (Biomass Taskforce, 2005). (Interestingly, in this last case, the
main change appears to be the re-definition of municipal solid waste (MSW) as paper and
card and waste wood. It may be speculated that this change was made because the use of
MSW for energy purposes is controversial.)
With the exception of the paper by Thornley (2009) and the two academic papers that
consider the EU biomass potential (Fischer, et al., 2007) (de Wit and Faaij, 2009), the
reports which provide aggregate estimates of UK bio-energy potential take the form of
consultancy reports, or reports to Government. It is unsurprising, therefore, that the focus
of these reports has changed as policy has evolved. The earliest studies (Oxera02 and
E4Tech03) – which were conducted around the time that the Renewables Obligation for
electricity was introduced – focus exclusively on biomass (and other renewables) for
electricity. Later studies consider biomass for heat and biofuel applications. It is reasonable
to assume that this shift in focus follows the introduction of EU directives on transport fuels
(the biofuels directive, (2003/30/EC)) and renewable energy more generally (the renewable
energy directive, (COM(2008)19) PROV(2008)0609)). Another reason for the shift, worth
considering, is the continued refinement of the tools and methods used to assess bio-energy
pathways over the last decade. Refinements include improved methodologies to deal with
co-products and the selection of appropriate reference systems, refinement of basic data,
and an improved understanding of consequential impacts (Turley, 2010).
Figure 2 illustrates that diversity of estimates contained in (or readily derived from) the
reports, grouped by time period. Again, it needs to be emphasised that because the
boundary conditions and definitions of potential used in each of the report differ, the
estimates cannot be compared directly. With this caveat in mind, a number of observations
can be made:

11
UK Energy Research Centre UKERC/WP/TPA/2010/002
Estimates of the future potential are greater than estimates of the existing potential
All estimates include a contribution from agricultural residues, and (with one
exception) from forestry residues
Only two reports include a contribution from conventional energy crops
All estimates from 2020 onwards include contributions from perennial energy crops
and wastes
Figure 2: Estimates for the potential contribution from biomass to UK primary
energy derived from individual studies. Estimates have been grouped by time period.
Studies include different resources categories and encompass many definitions of the
potential.
(a) Electricity only – Agricultural residues and forestry not differentiated; (b) wastes and agricultural
residues not differentiated; (c) Market potential / Constrained potential; (d) Technical potential /
unconstrained potential; (e) No date for future forecast - assumed to be 2020
For 2005, the most significant outlier is the Fischer07 estimate for agricultural residues. This
can be attributed to the top-down methodology used by Fischer and in particular the
assumption that 50% of residues could be available without considering other markets. It is
also notable that the Carbon Trust‟s estimate excludes municipal solid waste (MSW)
whereas the Taskforce05 report includes a modest contribution from this source.

12
UK Energy Research Centre UKERC/WP/TPA/2010/002
For 2010, all estimates include contributions from forestry, agricultural residues and wastes,
but these are not presented as distinct categories in all the reports. Kilpatrick‟s estimate for
agricultural residues (~8Modt.yr-1 / 138PJ.yr-1) is notably higher than the UK Biomass
Strategy, but this estimate is an upper limit that assumes all harvestable straw is collected.
The Biomass Strategy in contrast assumes that only ~3Modt.yr-1 tonnes (52PJ.yr-1) could be
made available without disrupting livestock use/buying costs. The difference between the
Kilpatrick08 estimate and the earlier Fischer07 estimate appears to be due to different
assumptions about the fraction of straw available: Fischer assumes total straw, whereas
Kilpatrick assumes that only 60% of total straw would actually be harvestable. Other
discrepancies seem likely to be attributable to differences in the databases used.
Five of the seven estimates for this period include a contribution from energy crops, but the
only sizable contributions appear in the Oxera02-high estimate, and the EEA07 report. It is
worth considering that in 2002, when the Oxera report was finalised, 2010 was sufficiently
distant that the development of an energy crops sector was at least feasible. The EEA07
report considers land availability only, and does not take into account the time taken to
establish perennial crops. The difference between estimates for wastes can be attributed to
the inclusion of MSW in some reports but not others, and also to some reports being more
ambitious about the fraction of total waste that can be converted to energy.
For 2020, in comparison with earlier years, the greatest change envisaged is the growth in
dedicated energy crops and the proportion of wastes materials that are diverted to energy
use. The EEA07 estimate for 2020, for example, considers that all growth compared to 2010
comes from increase deployment of perennial energy crops. Looking at waste materials, the
CT05 report excludes MSW, and hence gives a far lower contribution from wastes that the
AEA05, E4tech09, and EEA07 reports. The estimates for the use of agricultural and forest
residues are comparable with estimates for the earlier periods.
Two estimates for 2020 consider the contribution from conventional crops to liquid biofuels:
The UK Biomass Strategy assumes that 0.74Mha might be made available, and if it is
assumed that this area is used to grow wheat which is then used to produce ethanol,
then this area translates to roughly 50PJ.yr-1 of liquid fuel7
Thornley09 identifies a proportion of the UK‟s surplus 2.4Mt of wheat as suitable for
conversion to transport fuels and proposes that the existing rape crop (400-600kha
~ 27PJ) represents the upper bound on the available resource
For 2030, the three estimates clustered around 400PJ exclude MSW. (The Kilpatrick08
estimate includes residues from verges and urban green areas, here classified as waste.)
The two high estimates, E4tech09 and EEA07, both include MSW and represent the
unconstrained technical potential. It is notable that none of the estimates for 2030 include
7 This estimate only considers ethanol produced from the grain, and ignores the possible use of the straw for energy purposes; our calculation assumes a wheat yield of 8tonnes.ha-1, an ethanol yield of
400l.tonne-1, and a calorific value of ethanol of 21MJ.l-1

13
UK Energy Research Centre UKERC/WP/TPA/2010/002
transport fuels produced from conventional crops, but this appears to be because transport
fuels were defined out of scope, rather than because they were considered and rejected.
For 2050 there is only one estimate, provided in the RCEP report. This estimate is an
illustrative scenario that considers the how much land might be required to meet a target of
16GW electrical and thermal capacity from biomass combined heat and power (CHP).
The ranges of predictions for the total contribution to UK primary energy are summarised in
Figure 3 and compared with the estimated contribution from biomass in 2008. The
conservative estimate is that the contribution of biomass will quadruple by 2030 to around
400PJ.yr-1 (about 4% of UK primary energy in 2008). It can also be seen that no studies
consider that the contribution will exceed 1100PJ.yr-1 even with all constraints removed
(about 11% of UK primary energy in 2008). It is also notable that the progress that the UK
is predicted to make by 2020 varies from none, to the maximum conceivable 1100PJ.yr-1.
Figure 3: Range of predictions for the total contribution to UK primary energy from
domestically sourced biomass feedstocks. Estimates have been grouped by time
period. Studies include different resources categories and encompass many definitions of
resource potential.

14
UK Energy Research Centre UKERC/WP/TPA/2010/002
Review of assumptions, methods and data sources The range of predictions for each of the biomass categories is shown in Figure 4. It can be
seen that the categories predicted to experience the greatest growth are perennial energy
crops and wastes. The nature of the growth envisaged, however, is quite different. For
wastes, growth comes from diverting existing material streams (e.g. MSW) to energy
purposes and collecting and utilising a wide range of residual waste streams (e.g.
arboricultual arisings). For energy crops, growth comes from the allocation of land to a
variety of perennial crops. In the case of forest residues, growth comes from collecting and
utilising the existing resource more effectively but no increase in the fundamental resource
is envisaged. Lastly, for agricultural residues, growth comes from increased utilisation, but
the fundamental resource does not change markedly; interestingly, Fischer07 predicts that
the total for this resource will decrease as perennial crops encroach onto agricultural land.
The remainder of this section looks at each of the categories in turn, examining the key
methodologies and assumptions. The section ends with a summary of the overarching
assumptions.
Figure 4: Range of predictions for the contribution to UK primary energy from
domestically sourced biomass feedstocks
Agricultural residues
Good data about the production of crops in the UK exist and is published regularly in UK
Government statistics. From this data it is possible to estimate the total amount of straw
15
UK Energy Research Centre UKERC/WP/TPA/2010/002
produced annually for different crops, and this represents almost the entirety of agricultural
residues. For each of the main combinable crops, the basic calculation is:
Resource = Total crop * Harvest index * Recoverability – Straw dedicated to existing uses
This basic method is the same for all reports, although there are differences in the
databases used: deWit09, Fischer07 and EEA07 use FAO statistics, whereas the other
reports use UK Government statistics. The greatest variation comes in deciding what
proportion of the total straw produced is recoverable and how much should be dedicated to
existing uses. Fischer07 assumes 100 % of the straw is recoverable and that half of the
total is dedicated to existing uses. Kilpatrick08 assumes that 60% is recoverable and that
half of this lower figure is dedicated to animal bedding and other markets. The UK Biomass
Strategy assumes a greater proportion is dedicated to existing uses.
The harvest index is the fraction of the above ground biomass that is the primary crop. In
the case of wheat and barley this is ~51%, and for rapeseed it is about 30% (Kilpatrick,
2008). It is worth considering that past genetic improvements in the major food crop
species have largely resulted from increases in the harvest index, with more biomass
partitioned to the harvested product and less to vegetative parts of the plant, rather than
increases in the total biomass produced by each plant (Hay, 1995). Following this logic, it
cannot be taken for granted that future increases in grain yield will simultaneously increase
the yield of straw8.
Forestry and forestry residues
With one exception, all estimates of the UK forestry and forest residue resource base can be
traced back to Forestry Commission statistics and in particular a 2003 report: Woodfuel
Resource in Britain (McKay, 2003). The source data for this report is the National Inventory
of Woodland and Trees – a periodic survey undertaken by the UK Forestry Commission
(Forestry Commission, 2001) – and a database held by the Commission that describes the
forested areas they manage. The latest inventory (conducted from 1994 – 2000) can be
considered the definitive dataset for estimates of the forested area in the UK. The
exceptional report, which does not directly or indirectly reference Forestry Commission
statistics, is deWit09. This report has a European focus and extrapolates data from Poland,
Finland, France and Netherlands to the UK; interestingly, the estimate arrived at from this
extrapolation (25PJ.yr-1 in 2030) is similar to the value estimated in the UK Biomass
Strategy for 2010 (23-27 PJ.yr-1).
Given the limited underlying dataset, it is unsurprising that estimates for this resource
category are similar. The variation in estimates can be attributed to the fraction of the
existing resource that is considered to be available, and this is most often determined by
8 Empirical functions to describe straw yields as a function of grain yield have also been developed and
applied to GIS land cover maps by (Edwards, et al., 2006, Edwards, et al., 2005). Using this methodology, Edwards et al. estimate that up to 51PJ of energy might be obtained from straw in the
UK, comparable with the CT05 and UKBioStrat07 reports.

16
UK Energy Research Centre UKERC/WP/TPA/2010/002
expert judgement. The E4tech09 report, for example, considers a range of scenarios where
use of the forest resource increases on the following trajectory: 10% in 2010, 50-75% in
2015 and 100% in 2020. Other more general assumptions that appear to guide estimates of
potential include:
That the long growth times in the forest sector effectively mean that the maximum
available resource in the forest sector is static
Mature stem wood is too valuable to be used for energy purposes.
Stumps and roots are not harvested9
Only the Kilpatrick08 report considers an increase in the forest resource: this comprises
short rotation forestry10 (SRF) on 586kha and 1230kha of permanent pasture and rough
grazing respectively. Some variation also occurs because categories are merged. The UK
Biomass Strategy, for example, combines forestry residues with arboricultural arisings.
Perennial energy crops
Energy crops require land. How much land is needed to meet renewable energy goals
depends upon the quality of the land used and the crop yields that can be achieved. How
much land is available depends upon competing uses.
The greatest competing use for land arises from the demand for food, feed and pasture. If
technological improvements increased crop yields, or population decreased, or diets
changed and the consumption of meat was reduced, then at least in theory, surplus land
would become available. How much land is released can be determined by models or
judgement. Here there is a clear distinction between the studies with a European focus and
those with a UK focus. The EU focussed studies (deWit09, EEA07, Fischer07) all use top-
down models to estimate the availability of land, whereas the UK focussed studies all use
expert judgement. The EEA07 report evaluates land availability using a partial equilibrium
land-use model (CAPSIM11) to derive an estimate that between 0.824Mha in 2010 to
3.4Mha12 in 2030 could be released as a result of reform to the common agricultural policy
(CAP). Approximately half of the land released would be former grassland. The Fischer07
report uses assumptions about the rate of technical advances in crop yields, food demand
(considered to be a function of population and diet) and livestock intensity to estimate land
available for energy crops in Member States. Stipulating that maintaining the current level
of self-sufficiency for food should be a fundamental constraint, this report estimates that up
to 1.1Mha could be made available for energy crops, split between different land classes.
The deWit09 report adopts a similar approach, calculating that the area freed up in the UK
will be 0-6.5% in East England, 6.5-17% across most of the rest of the UK, and up to 31%
9 This contrasts with the situation in Scandinavia where a proportion of stumps are now harvested for energy purposes.
10 In this review SRF is categorised as a perennial energy crop.
11 CAPSIM is an established model for projecting agricultural activity in the EU.
12 Around 1.5Mha of which would be arable, the remainder would be grassland.

17
UK Energy Research Centre UKERC/WP/TPA/2010/002
in South West England. From the data given in the report it is not possible to translate these
proportions into estimates of the actual area (although the authors must have done so).
In the UK focussed reports, consideration of the amount of land available for energy crops
has been dominated by the existence of set aside, a feature of the CAP that has been a part
of UK agriculture since the early 1990s (Kilpatrick, 2008). The Carbon Trust report, for
example, roughly equates its estimation of available land (680k ha) with the area of set-
aside available in 2003. The UK biomass strategy also considers that up to 350kha of
perennial energy crops could be grown “on arable and set aside [...] and used for energy
purposes without affecting existing markets”. This 350kha figure can be traced back to a
submission to the 2004 Department of Trade and Industry (DTI) Renewables Innovation
Review by the consultancy LEK (DTI, 2004) (LEK, 2004). Although not entirely transparent,
it appears that this estimate is also based on the 2003 set-aside area, but this time with the
assumption that ~50% could be economically developed. The 350kHa figure is also
remarkably close to a ballpark estimate of 300kha proposed in the Oxera02 report, although
there is no evidence that the estimates are related. Most recently, retrospective analysis of
the 350kHa estimate by Lovett et al. (2009) concluded that UK food security would not be
greatly impacted if this area comprised grade 3/4 agricultural land and was planted with
miscanthus.
Although this review is limited to the last ten years, attempts to predict the proportion of
agricultural land that could be dedicated to energy crops go back much further than this. In
1999, for example, analysis conducted by the Energy Technology Support Unit (ETSU) for
the DTI, included an analysis of land availability13 (ETSU, 1999). This report observed that
“early predictions”14 that 1.0 to 1.5 Mha of land may become surplus to requirements for
food production by year 2000 (rising to 5.5 Mha by 2010) were “proving to be an
overestimate”, and concluded that a more realistic figure might be closer to a maximum of
1Mha by 2010. To put these figures in context, it is useful to bear in mind that the total
agricultural area of the UK is in the region of ~18.6Mha15, that set-aside was withdrawn in
2008 (IATC, 2009), and that in 2009 the deployment of energy crops in the UK was
negligible.
The amount of land required to grow energy crops can be reduced if yields can be
increased. Crop yields are a function of the incident solar radiation, the proportion of that
radiation intercepted by the crop, the efficiency with which the intercepted radiation is
converted to biomass by photosynthesis and the proportion of that biomass partitioned to
the harvested product (Monteith, 1977, Hay and Walker, 1989). At any given location, the
yield achieved will be determined by complex interactions between plant physiology, local
13 This analysis was a contribution to the public consultation for the Renewables Obligation introduced in 2002. ETSU was subsequently incorporated into the consultancy AEA technology.
14 Attributed to the Department of Land Economy at the University of Cambridge.
15 All in all, the total area of the United Kingdom of Great Britain and Northern Ireland covers some
24.5 million hectares, divided as follows: grazing land (14 Mha); arable land (4.6 Mha); forest and woodland (2.5 Mha); buildings/roads etc. (2.4 Mha) (IATC, 2009). Maximum set-aside was in 2001
when ~800kha was withdrawn from production (www.ukagriculture.com).

18
UK Energy Research Centre UKERC/WP/TPA/2010/002
ecology and climate, and management practices. Yields that can be achieved on poor quality
soil, or in areas where water is scarce, may be far less than those achieved under optimum
conditions. For the purposes of estimating the future contribution from energy crops, there
are two approaches to estimating the productive yield:
Model based yields – where empirical crop models are developed to predict crop
growth on different soils, and using different agronomic practice etc
Extrapolation from case-studies and sample plots
It is important to recognise that uncertainty about how model parameters will change, and
limitations on the number of sample plots available means that both methods are ultimately
speculative (Berndes, et al., 2003).
The approach to yield estimates used in the reviewed reports ranges from assuming
conservative average yields (~10odt.ha-1.yr-1; Oxera02, RCEP04) to modelling yields
according to crop, land class and location (Fischer07, deWit09). One recent advance in UK
research has been the combination of simulation models with experimental data to generate
spatially resolved yield maps. Such maps are better able to predict the productive yield of
perennial species in different areas, on different soils, and in different ecological zones (G.
M. Richter, et al., 2008, Aylott, 2008). This modelling suggests spatial distribution
preferences for different perennial crop species in order to achieve maximum yields.
Generally, willow is the preferred crop in the wetter western climate and Miscanthus is
preferred in the dryer eastern climate. In closely related work, and applying an arable land
availability constraint of up to about 1.5 million hectares (the EEA07 estimate for 2030),
Bauen et al. (In press) estimate that SRC and miscanthus could contribute around 270PJ.yr-
1.
Conventional energy crops (grain/oil seed)
Only two of the reviewed reports include estimates for the production of transport fuels
from conventional crops (cereals, oil seed rape and sugar beet), and, analogous to the case
of perennial energy crops, estimates of the domestic resource based cannot be divorced
from land availability considerations. The estimate included in the UK Biomass Strategy, for
example, is simply an illustration that around half the renewable transport fuel obligation
(RTFO) target (5% of transport fuels biofuels by 2010) could be met from 0.74 Mha (~12%)
of arable land. The estimate included in the Thornley09 paper is similar, equating to around
0.15Mha of wheat and 0.60Mha of rapeseed. Thornley et al. justify the sustainable use of
cereals on the basis that the UK has produced an annual wheat surplus of 2.4Mtonnes.yr-1 in
recent years. Converting cereals to ethanol also gives rise to co-products which can displace
existing demand for cereals (e.g. protein rich co-products may be used for animal feed
instead of wheat). The rule of thumb used by the ethanol analyst group F.O Licht‟s is that
converting 1tonne of cereals to ethanol translates into only ~0.66tonnes of additional
demand for cereals when co-products are taken into account (Keller, 2010). Other
interpretations are also possible. For example, Ensus, a project development company
building a wheat-to-ethanol plant in Wilton, UK, estimate that converting 1.2Mtonnes of
wheat to ethanol will result in the co-production of 350Ktonnes of animal feed. They assert

19
UK Energy Research Centre UKERC/WP/TPA/2010/002
that this feed will displace imports of Brazilian soy, thereby leading to minimal additional
demand overall.
The use of food crops to produce transport fuels is controversial, and a detailed examination
of the many reports which seek to influence the debate falls outside the scope of this
review. Nevertheless, it seems inescapable that producing biofuels from conventional crops
will require a significant area of land.
Wastes
Sources of waste biomass that may be used for energy purposes include a diverse
assortment of materials ranging from livestock manure to municipal solid waste. Data about
the fate of individual waste streams is patchy16 but Government statistics provide good data
about the economic activity of the principle sectors that are responsible for producing the
waste. From this data, top-down estimates of the quantity of waste likely to be produced
per unit of existing activity may be derived. These estimates may then be projected into the
future, moderated by judgements about the effect of new legislation or other anticipated
changes. This approach is generic to all the reviewed reports, although the details of the
calculation change for each waste sub-category. The EEA07 report, for example, assumes
that the production of MSW will be driven by GDP growth at national and sectoral level17,
moderated by the anticipated impact of household waste reduction measures (estimated to
be 25% in 2030). Similarly, the E4tech09 report calculates the MSW resource as a function
of the existing resource, moderated by growth rates, recycling rates, and availability
fractions, but derives values for each of these values from the literature.
One of the principal sources of variation between reports is the inclusion / exclusion of
waste sub-categories in the resource inventory. Differences occur because certain
categories are merged or defined out of scope (e.g. Fischer07 and deWit09 consider
agricultural residues as waste) or for other reasons: the CT05 report, for example, excluded
MSW because the Carbon Trust had no remit in this area. More detailed inventories will also
obtain higher figures than less detailed inventories. An example of this is identified in the
E4Tech09 report, which observes that the UK Biomass strategy obtains a lower estimate for
the resource potential of livestock manures because fewer categories of animals are
included in the inventory.
Other assumptions / cross-cutting issues
Looking across all the reports, the following assumptions and issues stand out.
Competition. It is universally assumed that expanding the use of biomass will have no
impact, or negligible impact, on other economic sectors. Different reports express this in
different ways: deWit09 describes this constraint as a “food first paradigm”, the UK Biomass
16 Like the forestry sector, there appear to be relatively few source documents for detailed information about the waste sector in the UK. Notable reports that are directly or indirectly cited in multiple
reports include: (Biffa, 2002) (ERM, 2006) (DETR, 2000) (WRAP, 2005) 17 Estimated using PRIMES, an established partial equilibrium model of energy supply and demand in
EU member states.
20
UK Energy Research Centre UKERC/WP/TPA/2010/002
Strategy asserts that the development of bio-energy should have “no effect on existing
markets”, and the EEA07 study explicitly disregards the effect of competition between bio-
energy and food production for domestic supply. This assumption greatly simplifies the
analysis, effectively limiting the area of land available for energy crop production to the un-
used agricultural area. More generally, limited consideration has been given to possible
competition for biomass resources between energy and other markets (e.g. biomaterials),
for providing environmental services such as soil organic carbon (Wilhelm, et al., 2007)
(Watts, et al., 2006), and between alternative energy uses (heat, power, transport fuels).
The anticipated profitability of bio-energy crops relative to conventional crops has, however,
been considered as a constraint to development.
Scheduling. Little consideration is given to the time taken to ramp up production of the
different biomass resources. Kilpatrick08 considers that it would take ~10 years to bring
SRC and miscanthus production on stream and around 20 years for short rotation forestry.
E4Tech09 uses expert judgement to develop ramp-up scenarios for different resources.
Improvements in yields. It is assumed that increasing yields in conventional crops will free
up agricultural land for perennial energy crops. Only two of the studies consider potential
increases in perennial crop yields: EEA07 and E4Tech09. Although it should be noted that
potential increases in crop yields has been considered elsewhere in the academic literature
(Tuck, et al., 2006) (Aylott, et al., 2008).
Conclusions From the studies reviewed, and the analysis presented in this report, the following insights
can be drawn.
Forecasts for the total contribution of bio-energy to UK primary energy in ~2030
range from 400 to 1100 PJ.yr-1 (4-11% of UK primary energy cf. 2008). It is
important to note that the higher estimates require that all constraints are removed
or overcome.
All assessments adopt a resource focused approach, either compiling an inventory of
existing feedstocks and rationalising about how that inventory may change over time
or overlaying an existing inventory with combinations of cost and sustainability
constraints.
Consistent with the findings of reviews undertaken at EU level (the BEE project),
differences between estimates can be ascribed to:
o Varying definitions of resource potential
o Differences in the scope of, and extent of, resource inventories
o Varying assumptions about the proportion of existing resources that may be
captured

21
UK Energy Research Centre UKERC/WP/TPA/2010/002
High level assumptions are remarkably consistent, conservative, and normative. In
summary these are:
o That expanding the use of bio-energy should not impinge upon other resource
or land uses
o That protected forest areas should be excluded from wood production and
deforestation for bio-energy production should not be allowed
o That competition between the use of forest biomass for energy production
and wood-fuel or industrial round-wood production should be avoided
(Thornley, et al., 2009).
There is considerable overlap between reports. Later reports are often derivative of
earlier work. Estimates of the land available for energy crops, in particular, have
remarkable longevity: early estimates are quoted and re-quoted without the original
assumptions necessarily being revisited or stated.
There is also considerable overlap between reports in terms of the data sources on
which they draw. Ultimately, resource inventories are dependent upon a restricted
dataset: for wastes, residues and forestry resources there are a small number of key
documents and custodians of statistical data. Prominent custodians include the UK
Government, the Forestry Commission, and the Waste Resource Action Project
(WRAP). Although reliance on a limited number of data sources is not inherently
problematic. It is clearly preferable that the data be of high quality, publically
available, and open to scrutiny.
Recommendations The following recommendations are proposed for future work:
Existing studies of UK energy potential are imperfect, but they pretty much exhaust
the availability, and the quality, of the underlying data sets. Efforts are being made
to harmonise assessment methods at a European level and in the future this may
have an impact on consistency, but while it is laudable to have a consistent basis for
speculation, it remains speculation. Irrespective of methodological consistency, there
is a clear need for open assessments with well documented data sources and
assumptions.
Estimating the bio-energy resource potential is a highly interdisciplinary task. A mix
of approaches needs to be applied to different biomass resources in order to tease
out the interactions with existing markets, the technical and agronomic constraints
and the potential opportunities. There is also a need for expert judgement when
compiling and combining multiple biomass resource estimates as no one organisation
is likely to have the necessary breadth of expertise in all sectors.

22
UK Energy Research Centre UKERC/WP/TPA/2010/002
The dominant assumption that bio-energy can only proceed with negligible impact on
other markets seems untenable and is worthy of further investigation. If this
assumption proves not to be the case, what sort of impacts and interactions might
occur as the resource base is expanded? Which existing sectors would suffer most?
This is touched upon in the reports which postulate sustainability constraints, but
otherwise is given limited consideration. In this context the role of biomass imports
might also be investigated.
The need for precision in resource estimates needs to be considered in relation to the
policy decisions that they are intended to inform. If a high level of precision is
required then need a fundamental reassessment of methodologies and datasets is
needed and this would be no small undertaking. Given the rapid expansion in the use
of biomass envisaged, a pragmatic course of action might be to start developing the
most attractive supply-chains, carefully monitor how they perform, and then revise
estimates of future potential accordingly.
References AEA (2005) Renewable heat and heat from combined heat and power plants- study and
analysis: A report for DTI and DEFRA. AEA Technology, Future Energy Solutions.
AYLOTT, M., G. TAYLOR and E. CASELLA (2008) Productivity of C3 bioenergy crops grown as
short rotation coppice under current and future climates. Journal of Comparative
Biochemistry and Physiology- part A.
AYLOTT, M. J. (2008) Yield and spatial supply of bioenergy poplar and willow short-rotation
coppice in the UK. The New Phytologist, 178, 358.
BAUEN, A. W., A. J. DUNNETT, G. M. RICHTER, A. G. DAILEY, M. AYLOTT, E. CASELLA and
G.TAYLOR (In press) Modelling supply and demand of bioenergy from short rotation coppice
and miscanthus in the UK. In press: submitted to Bioresource Technology on 25 August
2009.
BEC (2010) CEN/TC 335 biomass standards [Internet], Biomass Energy Centre (BEC),
available from:
<http://www.biomassenergycentre.org.uk/portal/page?_pageid=77,19836&_dad=portal&_s
chema=PORTAL> [Accessed: 23rd February 2010].
BEE (2008) Status of biomass resource assessments - version 1. IFEU. [Available from: < <www.eu-bee.com>].
BERNDES, G., M. HOOGWIJN and R. VAN DEN BROEK (2003) The contribution of biomass in
the future global energy supply: a review of 17 studies. Biomass & Bioenergy, 25, 1.
BIFFA (2002) Future Perfect, An analysis of Britain’s waste production and disposal account,
with implications for industry and government of the next twenty years. Biffa. [Available
from: <http://www.biffa-environmental.com/files/FuturePerfect-Chapter1.pdf>].

23
UK Energy Research Centre UKERC/WP/TPA/2010/002
BIOMASS TASKFORCE (2005) Biomass Taskforce: Report to the Government. DEPARTMENT
FOR ENVIRONMENT FOOD AND RURAL AFFAIRS. [Available from:
<http://www.defra.gov.uk/farm/crops/industrial/energy/biomass-taskforce/pdf/btf-
finalreport.pdf>].
BOOTH, E., R. WALKER, J. BELL, D. M. D, J. CURRY, B. KNIGHT, J. SMITH, P. GOTTSCHALK
and A. BIDDLE (2009) An assessment of the potential impact on UK agriculture and the
environment of meeting renewable feedstock demands: a report to the NNFCC. [Available
from: <
http://www.nnfcc.co.uk/metadot/index.pl?id=9645&isa=DBRow&field_name=file&op=downl
oad_file.>].
CARBON TRUST (2005) Biomass sector review for the Carbon Trust: a report for the Carbon
Trust by Paul Arwas Associates and Black & Veatch,. The Carbon Trust.
COPELAND, J. and D. TURLEY (2008) National and regional supply/demand balance for
agricultural straw in Great Britain: a report to the NNFCC. Central Science Laboratory: Agri-
Environment and Land Use Strategy Team [Available from:
<http://www.nnfcc.co.uk/metadot/index.pl?id=8331;isa=DBRow;op=show;dbview_id=253
9.>].
DE WIT, M. and A. FAAIJ (2009) European biomass resource potential and costs. Biomass
and Bioenergy.
DECC (2009) UK Statistics by Energy Source. DEPARTMENT OF ENERGY AND CLIMATE
CHANGE (DECC). [Available from: <
http://www.decc.gov.uk/en/content/cms/statistics/statistics.aspx.>].
DEFRA (2007) UK biomass strategy. DEPARTMENT FOR ENVIRONMENT FOOD AND RURAL
AFFAIRS, DEPARTMENT FOR TRANSPORT and DEPARTMENT FOR TRADE AND INDUSTRY.
HMSO. [Available from:
<http://www.defra.gov.uk/Environment/climatechange/uk/energy/renewablefuel/pdf/ukbio
massstrategy-0507.pdf>].
DETR (2000) Waste Strategy 2000. The Stationery Office.
2003/30/EC. Directive 2003/30/EC of the European Parliament and of the Council of 8 May
2003 on the promotion of the use of biofuels or other renewable fuels for transport.
[Directive 2003/30/EC]. OJ L123/42, 17.5.2003.
DTI (2004) Renewables Innovation Review. [Available from:
<http://www.decc.gov.uk/en/content/cms/what_we_do/uk_supply/energy_mix/renewable/
policy/policy.aspx>].
E4TECH (2003) Biomass for heat and power in the UK a techno-economic assessment of
long term potential. A report commissioned by the DTI for the Renewables Innovation
Review. [Available from:
<http://www.decc.gov.uk/en/content/cms/what_we_do/uk_supply/energy_mix/renewable/
policy/policy.aspx>].
E4TECH (2009) Biomass supply curves for the UK: a report for DECC. E4tech.

24
UK Energy Research Centre UKERC/WP/TPA/2010/002
EDWARDS, R. A. H., M. ŠÚRI, T. A. HULD and J. F. DALLEMAND (2005) GIS-based
assessment of cereal straw energy resource in the European Union. European Commission,
DG Joint Research Centre, Institute for Environment and Sustainability, Renewable Energies
Unit,
Via E. Fermi, TP 450, I-21020 Ispra (VA), Italy.
EDWARDS, R. A. H., M. ŠÚRI, T. A. HULD and J. F. DALLEMAND (2006) GIS-based
assessment of cereal straw energy in the European Union. Cereals Straw Resources for
Bioenergy in the European Union. Pamplona.
EEA (2007) European Environment Agency technical report #12/2007: estimating the
environmentally compatible bioenergy potential from agriculture. European Environment
Agency (EEA).
EPR (2009) [Internet], EPR Ltd., Company website, available from:
<http://www.eprl.co.uk/> [Accessed: 22/06/2009,
ERM (2006) Carbon balances and energy impacts of the management of UK wastes. ERM
(with Golder associates). [Available from:
<http://randd.defra.gov.uk/Document.aspx?Document=WR0602_4743_EXE.pdf>].
ERNST & YOUNG (2007) Renewable heat support mechanisms: a report for DEFRA/BERR.
Ernst &Young, .
ERNST AND YOUNG (2007) Renewable heat initial business case: a report to DEFRA / BERR.
Ernst and Young. [Available from: <http://www.berr.gov.uk/files/file41432.pdf>].
ETSU (1999) New and Renewable Energy: Prospects in the UK for the 21st Century:
Supporting Analysis to The Renewables Obligation
Preliminary Consultation. Energy Technology Support Unit (ETSU). [Available from:
<http://www.ukagriculture.com/crops/setaside.cfm>].
FAAIJ, A. P. C. (2006) Bio-energy in Europe: changing technology choices. Energy Policy,
34, 322.
FISCHER, G., E. HIZSNYIK, S. PRIELER and H. VAN VELTHUIZEN (2007) Assessment of
biomass potentials for biofuel feedstock production in Europe: Methodology and results.
IIASA [Available from: <http://www.refuel.eu/fileadmin/refuel/user/docs/Refuel-D6-
Jul2007-final6.pdf>].
FISCHER, G. and L. SCHRATTENHOLZER (2001a) Global bioenergy potentials through 2050.
Biomass Bioenergy, 20, 151–9.
FISCHER, G. and L. SCHRATTENHOLZER (2001b) Global bioenergy potentials through 2050.
Biomass and Bioenergy, 20, 151-159.
FORESTRY COMMISSION (2001) National inventory of woodland and trees. UK Forestry
Commission.
G. M. RICHTER, A. B. RICHE, A. G. DAILEY, S. A. GEZAN and D. S. POWLSON (2008) Is UK
fuel supply from miscanthus water- limited? Soil Use and Management, 24, 235-245.
25
UK Energy Research Centre UKERC/WP/TPA/2010/002
HAY, R. K. M. (1995) Harvest index: a review of its use in plant breeding and crop
physiology. Annals of Applied Biology, 126, 197.
HAY, R. K. M. and A. J. WALKER (1989) An introduction to the physiology of crop yield.
Longman Scientific and Technical.
HOOGWIJK, M., A. FAAIJ, R. VAN DEN BROEKA, G. BERNDES, D. GIELEN and W.
TURKENBURG (2003) Exploration of the ranges of the global potential of biomass for
energy. Biomass and Bioenergy, 25, 119 - 133.
IATC (2009) Introduction to UK agriculture [Internet], The International Agri-Technology
Centre Ltd, available from:
<http://www.theiatc.org/page.asp?section=43§ionTitle=UK+Agriculture> [Accessed:
19th February, 2009].
IEA (2009) Key world energy statistics. International Energy Agency (IEA). [Available from:
<www.iea.org>].
KELLER, C. (2010) Personal communication to R. Slade (February 2010). Claus Keller:
deputy editor F.O. Lichts.
KILPATRICK, J. (2008) Addressing the land use issues for non-food crops, in response to
increasing fuel and energy generation opportunities. ADAS Rosemaund Ltd. [Available from:
<http://www.nnfcc.co.uk/metadot/index.pl?id=8253;isa=DBRow;op=show;dbview_id=253
9.>].
LAUER, M. (2009) Curent terrestrial methods and activities for biomass potential
assessment in Europe. 17th European Biomass Conference and Exhibition. Hamburg,
Joanneum research, institute of energy research
LEEMANS, R., A. VAN AMSTEL, E. BATTJES, E. KREILEMAN and S. TOET (1996) The land
cover and carbon cycle consequences of large-scale utilisations of biomass as an energy
source. Global Environental Change, 6, 335-57.
LEK (2004) Review of the economic case for energy crops in the UK: a report to the
Department of Trade and Industry. L.E.K Consulting. [Available from:
<http://www.decc.gov.uk/en/content/cms/what_we_do/uk_supply/energy_mix/renewable/
policy/policy.aspx>].
LOVETT, A., G. M. SÜNNENBERG, G. RICHTER, G. DAILEY, A. B. RICHE and A. KARP (2009)
Land use implications of increased biomass production identified by GIS-based suitability
and yield mapping for miscanthus in england. Bioenerg. Res., 2, 17-28.
MCKAY (2003) Woodfuel resource in Britain. Forestry Commission. [Available from:
<http://www.eforestry.gov.uk/woodfuel/assets/document/WoodfuelSummary.pdf>].
MONTEITH, J. L. (1977) Climate and the efficiency of crop production in Britain [and
discussion]. Philosophical Transactions of the Royal Society of London, 281, 277.
OXERA (2002) Regional renewable energy assessments: a report to the DTI and DTLR.
Oxera Consulting. [Available from: <http://www.berr.gov.uk/files/file30589.pdf>].

26
UK Energy Research Centre UKERC/WP/TPA/2010/002
COM(2008)19. Proposal for a directive of the European Parliament and of the Council on the
promotion of the use of energy from renewable sources. [COM(2008) 19 final].
RCEP (2004) Biomass as a renewable energy source. Royal Commission on Environmental
Pollution. [Available from: <http://www.rcep.org.uk/bioreport.htm>].
RFA (2009) RTFO Quarterly Report 4, 15 April 2008 - 14 April 2009. Renewable Fuels
Agency (RFA). [Available from:
<http://www.renewablefuelsagency.org/reportsandpublications/rtforeports.cfm>].
SMEETS, E., A. FAAIJ, I. LEWANDOWSKI and W. TURKENBURG (2007) A bottom-up
assessment and review of global bio-energy potentials to 2050. Progress in Energy and
Combustion Science, 33 56-106.
THORNLEY, P., P. UPHAM and J. TOMEI (2009) Sustainability constraints on UK bioenergy
development. Energy Policy, 37, 5623-5635.
TUCK, G., M. J. GLENDININGA, P. SMITH, J. I. HOUSE and M. WATTENBACH (2006) The
potential distribution of bioenergy crops in Europe under present and future climate.
Biomass and Bioenergy, 30.
TURLEY, D. (2010) Personal communication to Raphael Slade. National Non-food Crops
Centre.
WATTS, C., L. CLARK, P. POULTON, D. POWLSON and A. WHITMORE (2006) The role of
clay, organic carbon and long-term management on mouldboard plough draught measured
on the Broadbalk wheat experiment at Rothamsted. Soil Use and Management, 22, 334-
341.
WILHELM, W., J. JOHNSON, D. KARLEN and D. LIGHTLE (2007) Corn stover to sustain soil
organic carbon further contrains biomass supply. Agronomy Journal, 99, 1665-1667.
WRAP (2005) Review of wood waste arisings and management in the UK. The Waste &
Resources Action Programme (WRAP).
YAMAMOTO, H., K. YAMAJI and F. J (1999) Evaluation of bioenergy resources with a global
land use and energy model formulated with SD technique. Applied Energy, 63, 101-13.

27
UK Energy Research Centre UKERC/WP/TPA/2010/002
Appendix 1 Table A1.1: Search terms included in the systematic review
Bioenergy
Biomass
Short rotation
coppice
Energy crops
Miscanthus
Energy from waste
Resource
assessment
Potential
Resource potential
How much
Land availability
Supply
Production
Methods
Yield
Constraints
Estimates
UK
World
Europe
Table A1.2: Databases and other information sources included in the search
Databases / search engines
Elsevier „Science Direct‟
Google Scholar
Ongoing research projects
TSEC Biosys
Supergen Bioenergy
RELU
Foresight Land Use Futures
Foresight Global Food and Farming Futures
Biomass Bioenergy Europe
Biomass futures
Governmental and related organisations
DECC
BERR
DEFRA
DTI archive
Carbon Trust
WRAP
EEA
NNFCC
Biomass Energy Centre
Forestry commission

28
UK Energy Research Centre UKERC/WP/TPA/2010/002
Appendix 2
Table A.2.1: Approach, timeframe and definition of potential used in the reviewed studies
Label Definition of potential Focus and approach Time-
frame
Oxera02 Constrained technical
potential
UK electricity only - a summary of regional assessments. Biomass figures
estimated using a bottom up resource inventory informed by GIS mapping 2010
E4 Tech03a
Technical potential
(constrained /
unconstrained)
UK electricity only - bioenergy fuel chain analysis. Report develops fuel chains
populated with literature data, these are used to estimate the % contribution to
UK electricity
2020
RCEP04
Theoretical potential
based on land use
scenarios
UK electricity and heat. Resource inventory combined with a top down estimate
of land requirement for energy crops to meet a 16GW by 2050 target.
2005 and
2050
CT05
Existing potential plus
estimate of land
availability
Inventory of all major UK biomass sources excluding MSW. Resource inventory
from literature sources. Top down estimates for each resource type moderated by
expert judgement
2005 and
"future"
Taskforce05 Existing potential UK biomass for energy (excl. biofuels). Resource inventory with simple
availability assumptions, includes MSW 2005
AEA05 Technical potential UK biomass for heat. Resource inventory based on previous literature, includes
MSW 2020
UKBioStrat0
7 Technical potential
UK Biomass. Resource inventory estimate assuming no impact on existing
markets. Based on same dataset as Taskforce05, MSW included but not explicit.
2010 and
“future”
E&Y07 Technical and market
potential
Renewables for heat, including UK biomass. Biomass figures are derivative of
AEA05 and CT05. I.e. a resource inventory based on previous literature.
Inventory includes MSW.
2020
EEA07 Potential not leading to
environmental harm
EU Focus, UK is included as one datapoint. Resource focussed assessment
predicated on modelled land availability and top-down estimates of residue
availability overlaid with sustainability criteria
2010,
2020,
2030

29
UK Energy Research Centre UKERC/WP/TPA/2010/002
Label Definition of potential Focus and approach Time-
frame
Fischer07 b Technical potential based
on land use scenarios
EU Focus, report estimates bio-mass for biofuels potential. Resource focussed
assessment, land availability and productivity estimated using GIS databases.
Self sufficiency ratios used to subtract land required for food and fodder crops.
Inventory includes woody crops and residues.
2000,
2030
Kilpatrick08c Existing potential plus
future land use scenarios
UK Biomass for energy. Detailed UK resource inventory. Estimates of Land
availability and the potential availability of materials from existing sectors based
on expert judgement
2010,
2030
E4tech09 Market potential and
technical potential
UK biomass supply curves. Supply curves estimated using existing resource
inventory literature and scenarios. Notable inputs include EEA07, Kilpatrick08.
2010,
2020,
2030
Thornley09 Sustainable potential Sustainable UK bio-energy resource potential. Literature based resource
inventory overlaid with sustainability criteria and constraints. Includes MSW No date
deWit09
Technical potential based
on land availability
scenarios
EU cost and supply potential, UK included as a single data point. Bottom up cost
and resource assessment from detailed spatial yield modelling driven by top-
down estimations of land availability assuming productivity gains and a "food
first" paradigm.
2030
a To derive a figure for total UK biomass potential it was assumed that that total UK electricity use was 234 TWh.yr-1 The conversion
efficiency to electricity given in the report was 40%. b 2030 figure is a rough estimate for the UK based on Fischer's land suitability distribution, suggested average yield for biofuel crops and
assumed planted area of 1.1Mha c Results converted from oven dry tonnes to PJ using a conversion factor of 17GJ.odt-1.

30
UK Energy Research Centre UKERC/WP/TPA/2010/002
Table A.2.2: Summary of estimates of potential included in the reviewed studies. Estimates are grouped into five
categories: agricultural residues, forestry and forest residues, perennial energy crops, conventional energy crops and wastes.
Report Year of
estimate
Agricultural
residues
PJ.yr-1
Forestry
and
forestry
residues
PJ.yr-1
Perennial
energy
crops
PJ.yr-1
Conventional
energy crops
(grain/oil
seed)
PJ.yr-1
Wastes
PJ.yr-1
Total -
Primary
energy
PJ.yr-1
Notes
Oxera02 2010
42.0
64.8 106.8
2010 low - electricity
only - Agricultural
residues and forestry
not differentiated
Oxera02 2010
42.0 36.0
93.6 171.6
2010 high - electricity
only - Agricultural
residues and forestry
not differentiated
E4Tech03a 2020 52.7 0.0 126.4 0.0 92.7 271.7
Constrained potential -
figure shown here is
derived from %
contribution of biomass
to UK electricity supply
presented in original
report
E4Tech03a 2020 61.1 0.0 252.7 0.0 139.0 452.8 Future unconstrained
tech potential
RCEP04 2005 75.0 13.0 0.2
88.2
RCEP04 2050 75.0 25.0 550.0
650.0
CT05 2005 46.8 21.6 0.7
79.2 266.4 2005
CT05 2020 46.8 21.6 118.8
79.2 299.8 Future Low (no date -
assumed 2020)
CT05 2020 46.8 21.6 151.2
80.2 191.3 Future High (no date

31
UK Energy Research Centre UKERC/WP/TPA/2010/002
Report Year of
estimate
Agricultural
residues
PJ.yr-1
Forestry
and
forestry
residues
PJ.yr-1
Perennial
energy
crops
PJ.yr-1
Conventional
energy crops
(grain/oil
seed)
PJ.yr-1
Wastes
PJ.yr-1
Total -
Primary
energy
PJ.yr-1
Notes
- assumed 2020)
Taskforce05 2005 40.5 21.9 3.9 0.0 135.5 201.8
Taskforce05 2005 49.5 26.0 6.7 0.0 156.5 238.7
AEA05 2020 60.5 22.2 69.4
625.0 777.0
Technical potential -
assumes Calorific value
of AD gas is primary
energy
UKBioStrat07 2010 40.5 23.6 2.8
166.8 233.7 2010 low
UKBioStrat07 2010 49.5 27.6 4.0
201.0 282.0 2010 high
UKBioStrat07 2020 128.7 70.4 64.7 0.0 316.2 580.0 Future Low (no date -
assumed 2020)
UKBioStrat07 2030 137.7 74.4 65.9 50.0 350.4 678.3 Future High (no date
- assumed 2030)
E&Y07 2020
225.0 Technical potential -
low
E&Y07 2020
1073.0 Technical potential -
high
E&Y07 2020
96.0 Market potential - low
E&Y07 2020
180.0 Market potential - High
EEA07 2010
62.8 142.4
360.1 565.2 Wastes includes
agricultural residues
EEA07 2020
62.8 368.5
364.3 795.5 Wastes includes
agricultural residues
EEA07 2030
46.1 615.5
360.1 1021.6 Wastes includes
agricultural residues
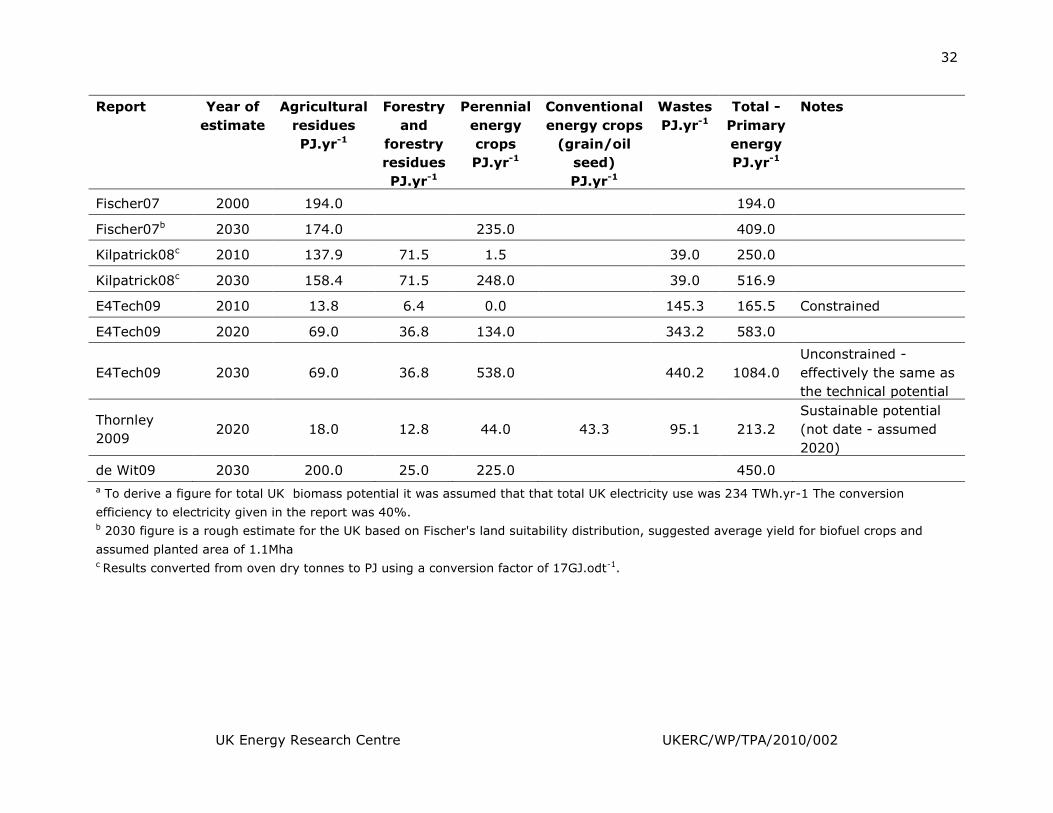
32
UK Energy Research Centre UKERC/WP/TPA/2010/002
Report Year of
estimate
Agricultural
residues
PJ.yr-1
Forestry
and
forestry
residues
PJ.yr-1
Perennial
energy
crops
PJ.yr-1
Conventional
energy crops
(grain/oil
seed)
PJ.yr-1
Wastes
PJ.yr-1
Total -
Primary
energy
PJ.yr-1
Notes
Fischer07 2000 194.0
194.0
Fischer07b 2030 174.0
235.0
409.0
Kilpatrick08c 2010 137.9 71.5 1.5
39.0 250.0
Kilpatrick08c 2030 158.4 71.5 248.0
39.0 516.9
E4Tech09 2010 13.8 6.4 0.0
145.3 165.5 Constrained
E4Tech09 2020 69.0 36.8 134.0
343.2 583.0
E4Tech09 2030 69.0 36.8 538.0
440.2 1084.0
Unconstrained -
effectively the same as
the technical potential
Thornley
2009 2020 18.0 12.8 44.0 43.3 95.1 213.2
Sustainable potential
(not date - assumed
2020)
de Wit09 2030 200.0 25.0 225.0
450.0
a To derive a figure for total UK biomass potential it was assumed that that total UK electricity use was 234 TWh.yr-1 The conversion
efficiency to electricity given in the report was 40%. b 2030 figure is a rough estimate for the UK based on Fischer's land suitability distribution, suggested average yield for biofuel crops and
assumed planted area of 1.1Mha c Results converted from oven dry tonnes to PJ using a conversion factor of 17GJ.odt-1.
U K E N E R G Y R E S E A R C H C E N T R E
58 Prince‟s Gate
Exhibition Road London SW7 2PG
Email: [email protected]
www.ukerc.ac.uk