the uncertainty of crop yield projections is reduced by improved...
TRANSCRIPT
This is a repository copy of The uncertainty of crop yield projections is reduced by improved temperature response functions.
White Rose Research Online URL for this paper:http://eprints.whiterose.ac.uk/119376/
Version: Supplemental Material
Article:
Wang, E, Martre, P, Zhao, Z et al. (53 more authors) (2017) The uncertainty of crop yield projections is reduced by improved temperature response functions. Nature Plants, 3. 17102. ISSN 2055-026X
https://doi.org/10.1038/nplants.2017.102
(c) 2017 Macmillan Publishers Limited, part of Springer Nature. All rights reserved. This is an author produced version of a paper published in Nature Plants. Uploaded in accordance with the publisher's self-archiving policy.
[email protected]://eprints.whiterose.ac.uk/
Reuse
Unless indicated otherwise, fulltext items are protected by copyright with all rights reserved. The copyright exception in section 29 of the Copyright, Designs and Patents Act 1988 allows the making of a single copy solely for the purpose of non-commercial research or private study within the limits of fair dealing. The publisher or other rights-holder may allow further reproduction and re-use of this version - refer to the White Rose Research Online record for this item. Where records identify the publisher as the copyright holder, users can verify any specific terms of use on the publisher’s website.
Takedown
If you consider content in White Rose Research Online to be in breach of UK law, please notify us by emailing [email protected] including the URL of the record and the reason for the withdrawal request.

1
Supplementary Information
Supplementary Table 1 | The 29 wheat crop models used in the AgMIP Wheat project and analyzed in
this study.
Model (version) Reference Documentation
APSIM-Wheat-E 1-4 http://www.apsim.info/Wiki/
APSIM-Nwheat (V.1.55) 2,5,6 http://www.apsim.info
APSIM-Wheat (V.7.3) 2 http://www.apsim.info/Wiki/
AQUACROP (V.4.0) 7 http://www.fao.org/nr/water/aquacrop.html
CropSyst (V.3.04.08) 8 http://www.bsyse.wsu.edu/CS_Suite/CropSyst/index.html
DAISY (V.5.24) 9,10 http://daisy.ku.dk/
DSSAT-CERES (V.4.0.1.0) 11-13 http://www.icasa.net/dssat/
DSSAT-CROPSIM
(V4.5.1.013)
12,14 http://www.icasa.net/dssat/
EPIC (V1102) 15-17 http://epicapex.brc.tamus.edu/
Expert-N (V3.0.10) - CERES
(V2.0)
18-21 http://www.helmholtz-muenchen.de/en/iboe/expertn/
Expert-N (V3.0.10) に
GECROS (V1.0)
20,21 http://www.helmholtz-muenchen.de/en/iboe/expertn/
Expert-N (V3.0.10) に SPASS
(2.0)
18,20-23 http://www.helmholtz-muenchen.de/en/iboe/expertn/
Expert-N (V3.0.10) -
SUCROS (V2)
18,20,21,24 http://www.helmholtz-muenchen.de/en/iboe/expertn/
FASSET (V.2.0) 25,26 http://www.fasset.dk
GLAM (V.2) 27,28 http://www.see.leeds.ac.uk/research/icas/climate-
impacts-group/research/glam/
HERMES (V.4.26) 29,30 http://www.zalf.de/en/forschung/institute/lsa/forschung/
oekomod/hermes
INFOCROP (V.1) 31 http://www.iari.res.in
LINTUL (V.1) 32,33 http://models.pps.wur.nl/models
LPJmL (V3.2) 34-39 http://www.pik-potsdam.de/research/projects/lpjweb
MCWLA-Wheat (V.2.0) 40-43 Request from [email protected]
MONICA (V.1.0) 44 http://monica.agrosystem-models.com
OLEARY (V.7) 45-48 Request from [email protected]
SALUS (V.1.0) 49,50 http://www.salusmodel.net
SIMPLACEаLINTULヲどCCどHEAT> (V.1)
51 Request from [email protected]
SIRIUS (V2010) 52-55 http://www.rothamsted.ac.uk/mas-models/sirius.php
SiriusQuality (V.2.0) 56-58 http://www1.clermont.inra.fr/siriusquality/
STICS (V.1.1) 59,60 http://www6.paca.inra.fr/stics_eng/
WHEATGROW 61-67 Request from [email protected]
WOFOST (V.7.1) 68 http://www.wofost.wur.nl
2
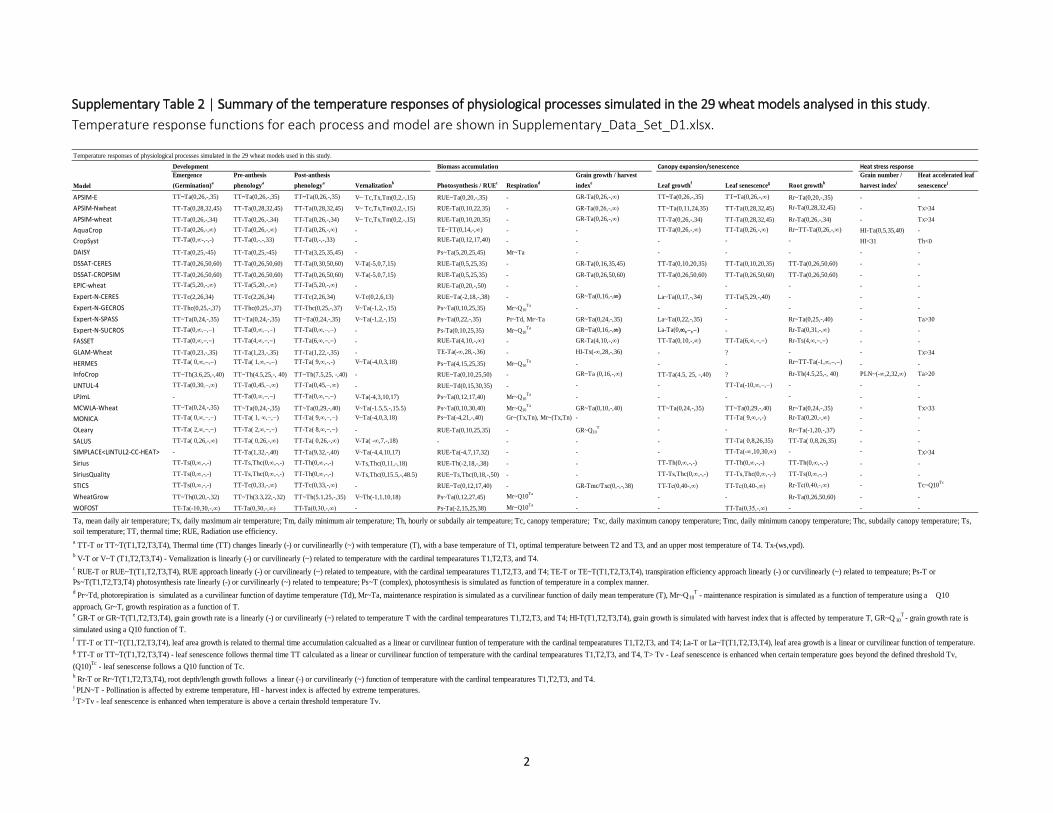
Supplementary Table 2 | Summary of the temperature responses of physiological processes simulated in the 29 wheat models analysed in this study.
Temperature response functions for each process and model are shown in Supplementary_Data_Set_D1.xlsx.
Emergence
(Germination)a
Pre-anthesis
phenologya
Post-anthesis
phenologya Vernalizationb Photosynthesis / RUEc Respirationd
Grain growth / harvest
indexe Leaf growthf Leaf senescenceg Root growthh
Grain number /
harvest indexi
Heat accelerated leaf
senescencej
APSIM-E TT~Ta(0,26,-,35) TT~Ta(0,26,-,35) TT~Ta(0,26,-,35) V~ Tc,Tx,Tm(0,2,-,15) RUE~Ta(0,20,-,35) - GR-Ta(0,26,-,) TT~Ta(0,26,-,35) TT~Ta(0,26,-,) Rr~Ta(0,20,-,35) - -
APSIM-Nwheat TT-Ta(0,28,32,45) TT-Ta(0,28,32,45) TT-Ta(0,28,32,45) V~ Tc,Tx,Tm(0,2,-,15) RUE-Ta(0,10,22,35) - GR-Ta(0,26,-,∞) TT~Ta(0,11,24,35) TT-Ta(0,28,32,45) Rr-Ta(0,28,32,45) - Tx>34
APSIM-wheat TT-Ta(0,26,-,34) TT-Ta(0,26,-,34) TT-Ta(0,26,-,34) V~ Tc,Tx,Tm(0,2,-,15) RUE-Ta(0,10,20,35) - GR-Ta(0,26,-,) TT-Ta(0,26,-,34) TT-Ta(0,28,32,45) Rr-Ta(0,26,-,34) - Tx>34
AquaCrop TT-Ta(0,26,-,) TT-Ta(0,26,-,) TT-Ta(0,26,-,) - TE~TT(0,14,-,) - - TT-Ta(0,26,-,) TT-Ta(0,26,-,) Rr~TT-Ta(0,26,-,) HI-Ta(0,5,35,40) -
CropSyst TT-Ta(0,-,-,-) TT-Ta(0,-,-,33) TT-Ta(0,-,-,33) - RUE-Ta(0,12,17,40) - - - - - HI<31 Th<0
DAISY TT-Ta(0,25,-45) TT-Ta(0,25,-45) TT-Ta(3,25,35,45) - Ps~Ta(5,20,25,45) Mr~Ta - - - - - -
DSSAT-CERES TT-Ta(0,26,50,60) TT-Ta(0,26,50,60) TT-Ta(0,30,50,60) V-Ta(-5,0,7,15) RUE-Ta(0,5,25,35) - GR-Ta(0,16,35,45) TT-Ta(0,10,20,35) TT-Ta(0,10,20,35) TT-Ta(0,26,50,60) - -
DSSAT-CROPSIM TT-Ta(0,26,50,60) TT-Ta(0,26,50,60) TT-Ta(0,26,50,60) V-Ta(-5,0,7,15) RUE-Ta(0,5,25,35) - GR-Ta(0,26,50,60) TT-Ta(0,26,50,60) TT-Ta(0,26,50,60) TT-Ta(0,26,50,60) - -
EPIC-wheat TT-Ta(5,20,-,) TT-Ta(5,20,-,) TT-Ta(5,20,-,) - RUE-Ta(0,20,-,50) - - - - - - -
Expert-N-CERES TT-Tc(2,26,34) TT-Tc(2,26,34) TT-Tc(2,26,34) V-Tc(0,2,6,13) RUE~Ta(-2,18,-,38) - GR~Ta(0,16,-, La~Ta(0,17,-,34) TT-Ta(5,29,-,40) - - -
Expert-N-GECROS TT-Thc(0,25,-,37) TT-Thc(0,25,-,37) TT-Thc(0,25,-,37) V~Ta(-1,2,-,15) Ps~Ta(0,10,25,35) Mr~Q10Ta - - - - - -
Expert-N-SPASS TT~Ta(0,24,-,35) TT~Ta(0,24,-,35) TT~Ta(0,24,-,35) V~Ta(-1,2,-,15) Ps~Ta(0,22,-,35) Pr~Td, Mr~Ta GR~Ta(0,24,-,35) La~Ta(0,22,-,35) - Rr~Ta(0,25,-,40) - Ta>30
Expert-N-SUCROS TT-Ta(0,) TT-Ta(0,) TT-Ta(0,) - Ps-Ta(0,10,25,35) Mr~Q10Ta GR~Ta(0,16,-, La-Ta(0,) - Rr-Ta(0,31,-,) - -
FASSET TT-Ta(0,) TT-Ta(4,) TT-Ta(6,) - RUE-Ta(4,10,-,) - GR-Ta(410,-,) TT-Ta(010,-,) TT-Ta(6,) Rr-Ts(4,) - -
GLAM-Wheat TT-Ta(0,23,-,35) TT-Ta(1,23,-,35) TT-Ta(1,22,-,35) - TE-Ta(-28,-,36) - HI-Tx(-,28,-,36) - ? - - Tx>34
HERMES TT-Ta( 0,) TT-Ta( 1,) TT-Ta( 9,,-,-) V~Ta(-4,0,3,18) Ps~Ta(4,15,25,35) Mr~Q10Ta - - - Rr~TT-Ta(-1,) - -
InfoCrop TT~Th(3.6,25,-,40) TT~Th(4.5,25,-, 40) TT~Th(7.5,25, -,40) - RUE~Ta(0,10,25,50) - GR~Ta (0,16,-,) TT-Ta(4.5, 25, -,40) ? Rr-Th(4.5,25,-, 40) PLN~(-,2,32,) Ta>20
LINTUL-4 TT-Ta(0,30) TT-Ta(0,45) TT-Ta(0,45) - RUE~Td(0,15,30,35) - - - TT-Ta(-10,) - - -
LPJmL - TT-Ta(0) TT-Ta(0) V-Ta(-4,3,10,17) Ps~Ta(0,12,17,40) Mr~Q10Ta - - - - - -
MCWLA-Wheat TT~Ta(0,24,-,35) TT~Ta(0,24,-,35) TT~Ta(0,29,-,40) V~Ta(-1.5,5,-,15.5) Ps~Ta(0,10,30,40) Mr~Q10Ta GR~Ta(0,10,-,40) TT~Ta(0,24,-,35) TT~Ta(0,29,-,40) Rr~Ta(0,24,-,35) - Tx>33
MONICA TT-Ta( 0,) TT-Ta( 1, ) TT-Ta( 9,) V~Ta(-4,0,3,18) Ps~Ta(-4,21,-,40) Gr~(Tx,Tn), Mr~(Tx,Tn) - - TT-Ta( 9,,-,-) Rr-Ta(0,20,-,) - -
OLeary TT-Ta( 2,) TT-Ta( 2,) TT-Ta( 8) - RUE-Ta(0,10,25,35) - GR~Q10T - - Rr~Ta(-1,20,-,37) - -
SALUS TT-Ta( 0,26,-,) TT-Ta( 0,26,-,) TT-Ta( 0,26,-,) V-Ta( -,7,-,18) - - - - TT-Ta( 0,8,26,35) TT-Ta( 0,8,26,35) - -
SIMPLACEаLINTULヲどCCどHEATб - TT-Ta(1,32,-,40) TT-Ta(9,32,-,40) V~Ta(-4,4,10,17) RUE-Ta(-4,7,17,32) - - - TT-Ta(-,10,30,) - - Tx>34
Sirius TT-Ts(0,,-,-) TT-Ts,Thc(0,,-,-) TT-Th(0,,-,-) V-Ts,Thc(0,11,-,18) RUE-Th(-2,18,-,38) - - TT-Th(0,,-,-) TT-Th(0,,-,-) TT-Th(0,,-,-) - -
SiriusQuality TT-Ts(0,,-,-) TT-Ts,Thc(0,,-,-) TT-Th(0,,-,-) V-Ts,Thc(0,15.5,-,48.5) RUE~Ts,Thc(0,18,-,50) - - TT-Ts,Thc(0,,-,-) TT-Ts,Thc(0,,-,-) TT-Ts(0,,-,-) - -
STICS TT-Ts(0,,-,-) TT-Tc(0,33,-,) TT-Tc(0,33,-,) - RUE~Tc(0,12,17,40) - GR-Tmc/Txc(0,-,-,38) TT-Tc(0,40-,∞) TT-Tc(0,40-,∞) Rr-Tc(0,40,-,∞) - Tc~Q10Tc
WheatGrow TT~Th(0,20,-,32) TT~Th(3.3,22,-,32) TT~Th(5.1,25,-,35) V~Th(-1,1,10,18) Ps~Ta(0,12,27,45) Mr~Q10Ta- - - Rr-Ta(0,26,50,60) - -
WOFOST TT-Ta(-10,30,-,∞) TT-Ta(0,30,-,∞) TT-Ta(0,30,-,∞) - Ps-Ta(-2,15,25,38) Mr~Q10Ta- - TT-Ta(0,35,-,∞) - - -
e GR-T or GR~T(T1,T2,T3,T4), grain growth rate is a linearly (-) or curvilinearly (~) related to temperature T with the cardinal tempearatures T1,T2,T3, and T4; HI-T(T1,T2,T3,T4), grain growth is simulated with harvest index that is affected by temperature T, GR~Q 10T - grain growth rate is
simulated using a Q10 function of T.
Temperature responses of physiological processes simulated in the 29 wheat models used in this study.
Model
Development Biomass accumulation Canopy expansion/senescence Heat stress response
Ta, mean daily air temperature; Tx, daily maximum air temperature; Tm, daily minimum air temperature; Th, hourly or subdaily air tempeature; Tc, canopy temperature; Txc, daily maximum canopy temperature; Tmc, daily minimum canopy temperature; Thc, subdaily canopy temperature; Ts, soil temperature; TT, thermal time; RUE, Radiation use efficiency.a TT-T or TT~T(T1,T2,T3,T4), Thermal time (TT) changes linearly (-) or curvilinearlly (~) with temperature (T), with a base temperature of T1, optimal temperature between T2 and T3, and an upper most temperature of T4. Tx-(ws,vpd).b V-T or V~T (T1,T2,T3,T4) - Vernalization is linearly (-) or curvilinearly (~) related to temperature with the cardinal tempearatures T1,T2,T3, and T4.c RUE-T or RUE~T(T1,T2,T3,T4), RUE approach linearly (-) or curvilinearly (~) related to tempeature, with the cardinal tempearatures T1,T2,T3, and T4; TE-T or TE~T(T1,T2,T3,T4), transpiration efficiency approach linearly (-) or curvilinearly (~) related to tempeature; Ps-T or Ps~T(T1,T2,T3,T4) photosynthesis rate linearly (-) or curvilinearly (~) related to tempeature; Ps~T (complex), photosynthesis is simulated as function of temperature in a complex manner.d Pr~Td, photorepiration is simulated as a curvilinear function of daytime temperature (Td), Mr~Ta, maintenance respiration is simulated as a curvilinear function of daily mean temperature (T), Mr~Q10
T - maintenance respiration is simulated as a function of temperature using a Q10
approach, Gr~T, growth respiration as a function of T.
f TT-T or TT~T(T1,T2,T3,T4), leaf area growth is related to thermal time accumulation calcualted as a linear or curvilinear funtion of temperature with the cardinal tempearatures T1,T2,T3, and T4; La-T or La~T(T1,T2,T3,T4), leaf area growth is a linear or curvilinear function of temperature.g TT-T or TT~T(T1,T2,T3,T4) - leaf senescence follows thermal time TT calculated as a linear or curvilinear function of temperature with the cardinal tempearatures T1,T2,T3, and T4, T> Tv - Leaf senescence is enhanced when certain temperature goes beyond the defined threshold Tv,
(Q10)Tc - leaf senescense follows a Q10 function of Tc.h Rr-T or Rr~T(T1,T2,T3,T4), root depth/length growth follows a linear (-) or curvilinearly (~) function of temperature with the cardinal tempearatures T1,T2,T3, and T4.i PLN~T - Pollination is affected by extreme temperature, HI - harvest index is affected by extreme temperatures.j T>Tv - leaf senescence is enhanced when temperature is above a certain threshold temperature Tv.

3
Supplementary Table 3 | The four main temperature response types for pre-anthesis phenological
development and radiation use efficiency (RUE) used in the wheat models analysed in this study. For the
models that explicitly simulate photosynthesis and respiration, they are grouped based on the temperature
response types used for phenological development. The numbers in brackets indicate the cardinal temperatures
implemented in APSIM and SiriusQuality models to test the impact on simulated phenology, biomass and grain
yield. The models in which the new temperature response function were evaluated are highlighted in bold font.
RUE
Pre-anthesis
phenological
development
Type 1 に
No reduction
towards base
temperature
ふзが зが ヲヵェCが ンヵェCぶ
Type 2 に
No maximum
temperature
ふヰェCが ヲヰェCが зが зぶ
Type 3 に
A range of
optimal
temperatures
(0°C, 15°C, 20, 35)
Type 4 -
Minimum,
optimum and
maximum
temperatures
(0°C, 20°C, 35°C)
Phosynthesis and
Respiration
Type 1 - No optimum and
maximum
ふヰェCが зが зが зぶ
FASSET
OげLW;ヴ┞ SIRIUS
SiriusQuality
HERMES
LPJmL
MONICA
Expert-N-SUCROS
Type 2 - No maximum
temperature
ふヰェCが ヲヵェCが зが зぶ
Aquacrop
EPIC-Wheat
SALUS
DSSAT-CERES
DSSAT-CROPSIM
LINTUL-4
STICS
WOFOST
Type 3 - A range of
optimum temperatures
(0°C, 25°C, 35°C, 45°C)
GLAM-Wheat
APSIM-Nwheat
Cropsyst
Expert-N-CERES
Type 4- Min, optimum &
max temperature
(0°C, 25°C, 35°C)
APSIM-Wheat
InfoCrop
MCWLA-Wheat
APSIM-Wheat-E
Expert-N-CERES
Expert-N-SPASS
Expert-N-GECROS
DAISY
SIMPLACE
WheatGrow
4
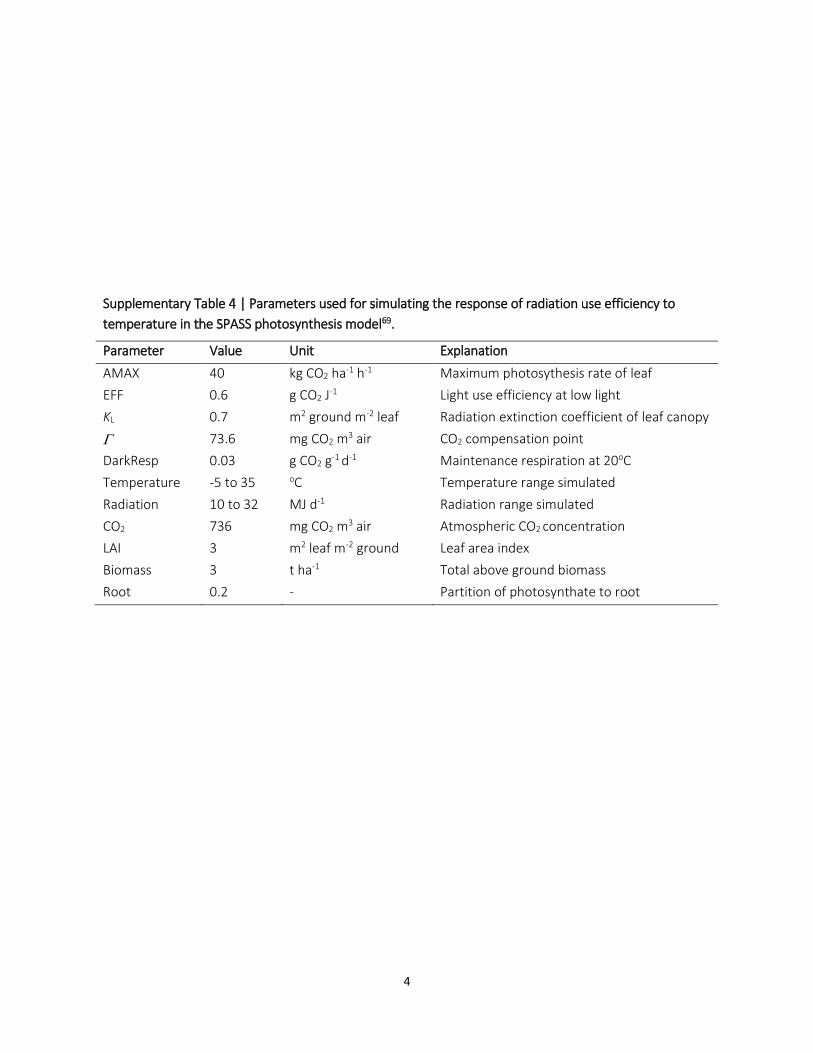
Supplementary Table 4 | Parameters used for simulating the response of radiation use efficiency to
temperature in the SPASS photosynthesis model .
Parameter Value Unit Explanation
AMAX 40 kg CO2 ha-1 h-1 Maximum photosythesis rate of leaf
EFF 0.6 g CO2 J-1 Light use efficiency at low light
KL 0.7 m2 ground m-2 leaf Radiation extinction coefficient of leaf canopy
73.6 mg CO2 m3 air CO2 compensation point
DarkResp 0.03 g CO2 g-1 d-1 Maintenance respiration at 20oC
Temperature -5 to 35 oC Temperature range simulated
Radiation 10 to 32 MJ d-1 Radiation range simulated
CO2 736 mg CO2 m3 air Atmospheric CO2 concentration
LAI 3 m2 leaf m-2 ground Leaf area index
Biomass 3 t ha-1 Total above ground biomass
Root 0.2 - Partition of photosynthate to root

5
Supplementary Figure 1 | Temperature
response functions in 29 wheat simulation
models. (a and b) photosynthesis. (c and d)
respiration. (e and f) leaf area growth. (g
and senescence) senescence.Grain growth
(i and j). Models are listed in
Supplementary Table 1. (b, d, f, h, and j)
Summaries of temperature responses
from all models with red lines representing
the median and shaded areas the 10% and
90% quantiles.
6
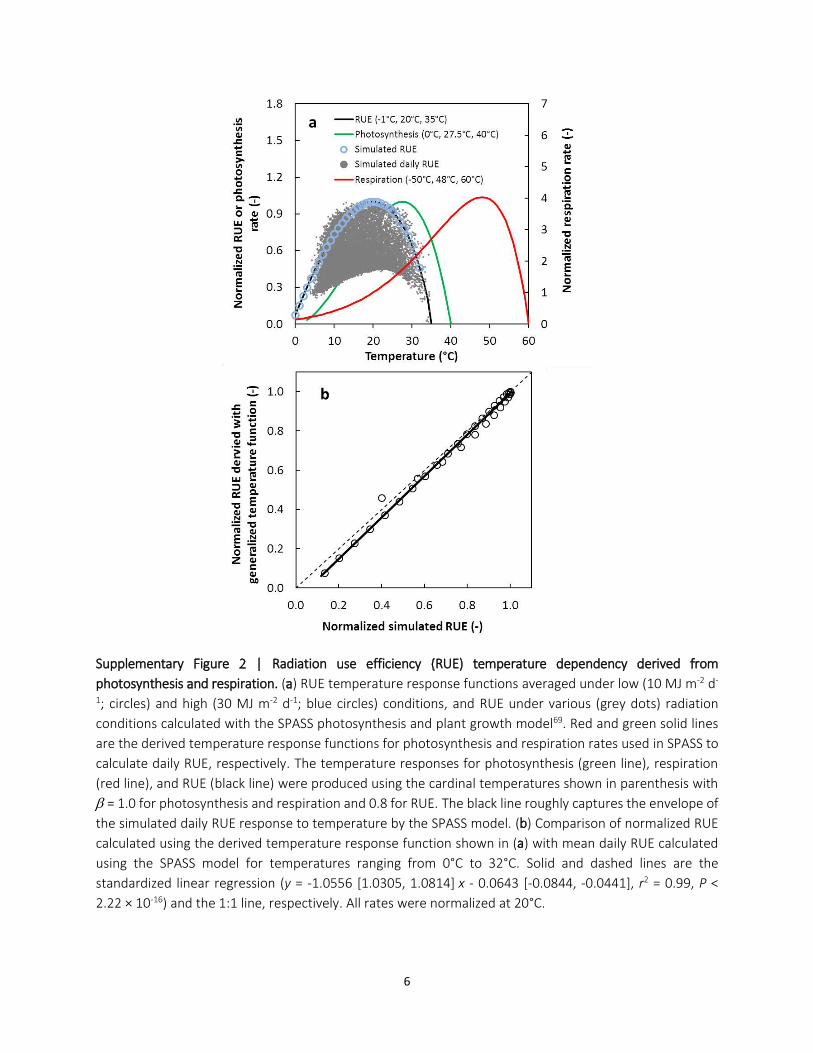
Supplementary Figure Radiation use efficiency (RUE) temperature dependency derived from
photosynthesis and respiration. (a) RUE temperature response functions averaged under low (10 MJ m-2 d-
1; circles) and high (30 MJ m-2 d-1; blue circles) conditions, and RUE under various (grey dots) radiation
conditions calculated with the SPASS photosynthesis and plant growth model69. Red and green solid lines
are the derived temperature response functions for photosynthesis and respiration rates used in SPASS to
calculate daily RUE, respectively. The temperature responses for photosynthesis (green line), respiration
(red line), and RUE (black line) were produced using the cardinal temperatures shown in parenthesis with
= 1.0 for photosynthesis and respiration and 0.8 for RUE. The black line roughly captures the envelope of
the simulated daily RUE response to temperature by the SPASS model. (b) Comparison of normalized RUE
calculated using the derived temperature response function shown in (a) with mean daily RUE calculated
using the SPASS model for temperatures ranging from 0°C to 32°C. Solid and dashed lines are the
standardized linear regression (y = -1.0556 [1.0305, 1.0814] x - 0.0643 [-0.0844, -0.0441], r2 = 0.99, P <
2.22 × 10⁻¹⁶) and the 1:1 line, respectively. All rates were normalized at 20°C.
7
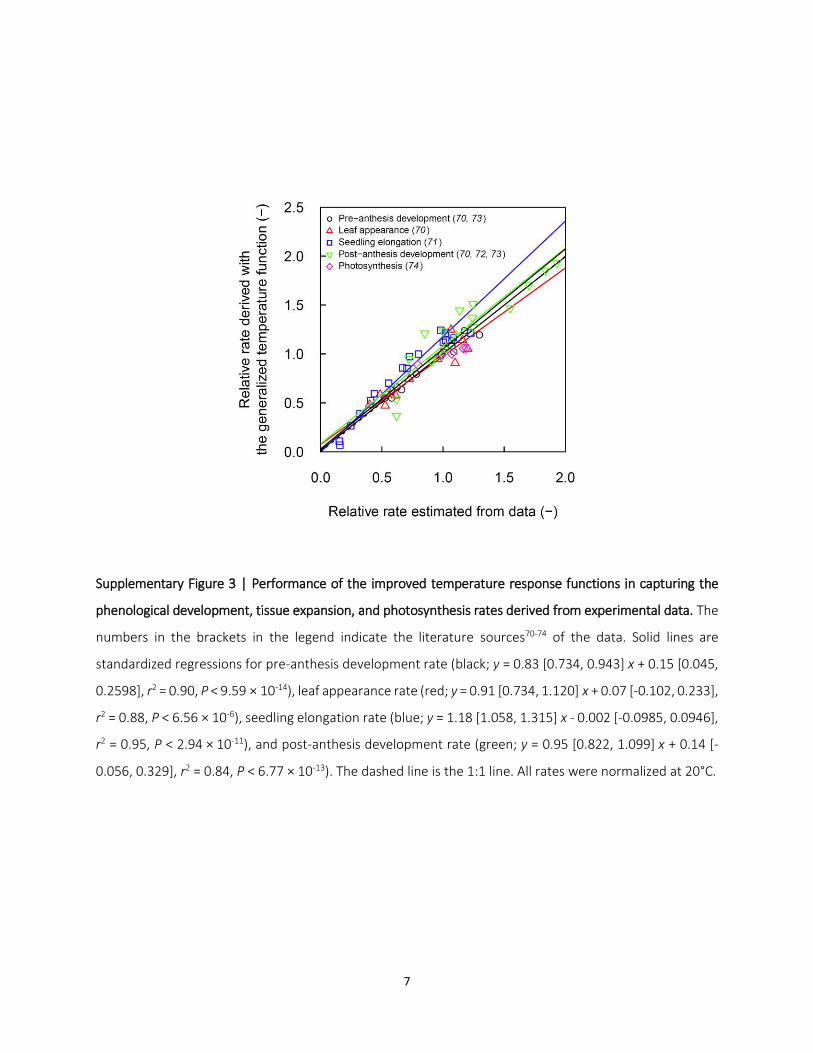
Supplementary Figure Performance of the improved temperature response functions in capturing the
phenological development, tissue expansion, and photosynthesis rates derived from experimental data. The
numbers in the brackets in the legend indicate the literature sources70-74 of the data. Solid lines are
standardized regressions for pre-anthesis development rate (black; y = 0.83 [0.734, 0.943] x + 0.15 [0.045,
0.2598], r2 = 0.90, P < 9.59 × 10⁻¹⁴), leaf appearance rate (red; y = 0.91 [0.734, 1.120] x + 0.07 [-0.102, 0.233],
r2 = 0.88, P < 6.56 × 10⁻⁶), seedling elongation rate (blue; y = 1.18 [1.058, 1.315] x - 0.002 [-0.0985, 0.0946],
r2 = 0.95, P < 2.94 × 10⁻¹¹), and post-anthesis development rate (green; y = 0.95 [0.822, 1.099] x + 0.14 [-
0.056, 0.329], r2 = 0.84, P < 6.77 × 10⁻¹³). The dashed line is the 1:1 line. All rates were normalized at 20°C.

8
Supplementary Figure Relationship between net biomass growth rate and radiation use efficiency. Data
are from the NCP75 (black circles) and outdoor semi-controlled environment72 (red triangle) experiments.
There was no difference in the slope (P = 0.20) and intercept (P = 0.97) among datasets, therefore, a single
standardized regression was fitted to all data (solid line; y = 0.8934 [0.7814, 1.0214] x + 0.0958 -0.0078,
0.1837], r2 = 0.65, P = 4.42 × 10⁻⁸). Dashed line is the 1:1 lines. All rates were normalized at 20°C.

9
Supplementary Literature Cited 1 Zhao, Z. et al. Modelling to increase the eco-efficiency of a wheatにmaize double cropping
system. Agriculture, Ecosystems & Environment 210, 36-46 (2015).
2 Keating, B. A. et al. An overview of APSIM, a model designed for farming systems simulation.
European Journal of Agronomy 18, 267-288 (2003).
3 Wang, E. et al. Development of a generic crop model template in the cropping system model
APSIM. European Journal of Agronomy 18, 121-140 (2002).
4 Chen, C., Wang, E. & Yu, Q. Modeling Wheat and Maize Productivity as Affected by Climate
Variation and Irrigation Supply in North China Plain. Agronomy Journal 102, 1037-1049 (2010).
5 Asseng, S. et al. Performance of the APSIM-wheat model in Western Australia. Field Crops Res.
57, 163-179 (1998).
6 Asseng, S. et al. Simulated wheat growth affected by rising temperature, increased water deficit
and elevated atmospheric CO2. Field Crops Research 85, 85-102 (2004).
7 Steduto, P., Hsiao, T., Raes, D. & Fereres, E. AquaCrop-The FAO Crop Model to Simulate Yield
Response to Water: I. Concepts and Underlying Principles. Agronomy Journal 101, 426-437
(2009).
8 Stockle, C., Donatelli, M. & Nelson, R. CropSyst, a cropping systems simulation model. European
Journal of Agronomy 18, 289-307 (2003).
9 Hansen, S., Jensen, H., Nielsen, N. & Svendsen, H. Simulation of nitrogen dynamics and biomass
production in winter-wheat using the Danish simulation model DAISY. Fertilizer Research 27,
245-259 (1991).
10 Hansen, S., Abrahamsen, P., Petersen, C. T. & Styczen, M. DAISY: model use, calibration, and
validation. Transaction of the ASABE 55, 1317-1335 (2012).
11 Hoogenboom, G. & White, J. Improving physiological assumptions of simulation models by using
gene-based approaches. Agronomy Journal 95, 82-89 (2003).
12 Jones, J. et al. The DSSAT cropping system model. European Journal of Agronomy 18, 235-265
(2003).
13 Ritchie, J. T., Godwin, D. C. & Otter-Nacke, S. CERES-wheat: A user-oriented wheat yield model.
Preliminary documentation. 252 (1985).
14 Hunt, L. A. & Pararajasingham, S. CROPSIM-wheat - a model describing the growth and
development of wheat. Canadian Journal of Plant Science 75, 619-632 (1995).
15 Kiniry, J. et al. EPIC model parameters for cereal, oilseed, and forage crops in the northern great-
plains region. Canadian Journal of Plant Science 75, 679-688 (1995).
16 Williams, J., Jones, C., Kiniry, J. & Spanel, D. The EPIC crop growth-model. Transactions of the
ASAE 32, 497-511 (1989).
17 Izaurralde, R. C., McGill, W. B. & Williams, J. R. in Managing agricultural greenhouse gases:
Coordinated agricultural research through GRACEnet to address our changing climate (eds M.A.
Liebig, A.J. Franzluebbers, & R.F. Follett) 409-429 (Elsevier, 2012).
18 Priesack, E., Gayler, S. & Hartmann, H. The impact of crop growth sub-model choice on
simulated water and nitrogen balances. Nutrient Cycling in Agroecosystems 75, 1-13 (2006).
19 Ritchie, S., Nguyen, H. & Holaday, A. Genetic diversity in photosynthesis and water-use
efficiency of wheat and wheat relatives. Journal of Cellular Biochemistry, 43-43 (1987).
20 Biernath, C. et al. Evaluating the ability of four crop models to predict different environmental
impacts on spring wheat grown in open-top chambers. European Journal of Agronomy 35, 71-82
(2011).
21 Stenger, R., Priesack, E., Barkle, G. & Sperr, C. (Land Treatment collective proceedings
Technical Session, New Zealand, 1999).
10
22 Wang, E. & Engel, T. SPASS: a generic process-oriented crop model with versatile windows
interfaces. Environmental Modelling & Software 15, 179-188 (2000).
23 Yin, X. & van Laar, H. H. Crop systems dynamics: an ecophysiological simulation model of
genotype-by-environment interactions. 115 (Wageningen Academic Publishers, 2005).
24 Goudriaan, J. & Van Laar, H. H. in Current Issues in Production Ecology 238 (Kluwer Academic
Publishers, Dordrecht, The Netherlands, 1994).
25 Berntsen, J., Petersen, B., Jacobsen, B., Olesen, J. & Hutchings, N. Evaluating nitrogen taxation
scenarios using the dynamic whole farm simulation model FASSET. Agricultural Systems 76, 817-
839 (2003).
26 Olesen, J. et al. Comparison of methods for simulating effects of nitrogen on green area index
and dry matter growth in winter wheat. Field Crops Research 74, 131-149 (2002).
27 Challinor, A., Wheeler, T., Craufurd, P., Slingo, J. & Grimes, D. Design and optimisation of a large-
area process-based model for annual crops. Agricultural and Forest Meteorology 124, 99-120
(2004).
28 Li, S. et al. Simulating the Impacts of Global Warming on Wheat in China Using a Large Area Crop
Model. Acta Meteorologica Sinica 24, 123-135 (2010).
29 Kersebaum, K. Modelling nitrogen dynamics in soil-crop systems with HERMES. Nutrient Cycling
in Agroecosystems 77, 39-52 (2007).
30 Kersebaum, K. C. Special features of the HERMES model and additional procedures for
parameterization, calibration, validation, and applications. Ahuja, L.R. and Ma, L. (eds.).
Methods of introducing system models into agricultural research. Advances in Agricultural
Systems Modeling Series 2, Madison (ASA-CSSA-SSSA), 65-94 (2011).
31 Aggarwal, P. et al. InfoCrop: A dynamic simulation model for the assessment of crop yields,
losses due to pests, and environmental impact of agro-ecosystems in tropical environments. II.
Performance of the model. Agricultural Systems 89, 47-67 (2006).
32 Spitters, C. J. T. & Schapendonk, A. H. C. M. Evaluation of breeding strategies for drought
tolerance in potato by means of crop growth simulation. Plant and Soil 123, 193-203 (1990).
33 Shibu, M., Leffelaar, P., van Keulen, H. & Aggarwal, P. LINTUL3, a simulation model for nitrogen-
limited situations: Application to rice. European Journal of Agronomy 32, 255-271 (2010).
34 Bondeau, A. et al. Modelling the role of agriculture for the 20th century global terrestrial carbon
balance. Global Change Biology 13, 679-706 (2007).
35 Beringer, T., Lucht, W. & Schaphoff, S. Bioenergy production potential of global biomass
plantations under environmental and agricultural constraints. Global Change Biology Bioenergy
3, 299-312 (2011).
36 Fader, M., Rost, S., Muller, C., Bondeau, A. & Gerten, D. Virtual water content of temperate
cereals and maize: Present and potential future patterns. Journal of Hydrology 384, 218-231
(2010).
37 Gerten, D., Schaphoff, S., Haberlandt, U., Lucht, W. & Sitch, S. Terrestrial vegetation and water
balance - hydrological evaluation of a dynamic global vegetation model. Journal of Hydrology
286, 249-270 (2004).
38 Rost, S. et al. Agricultural green and blue water consumption and its influence on the global
water system. Water Resources Research 44 (2008).
39 Müller, C. et al. Effects of changes in CO2, climate, and land use on the carbon balance of the
land biosphere during the 21st century. Journal of Geophysical Research-Biogeosciences 112
(2007).
40 Tao, F., Yokozawa, M. & Zhang, Z. Modelling the impacts of weather and climate variability on
crop productivity over a large area: A new process-based model development, optimization, and
uncertainties analysis. Agricultural and Forest Meteorology 149, 831-850 (2009).
11
41 Tao, F., Zhang, Z., Liu, J. & Yokozawa, M. Modelling the impacts of weather and climate
variability on crop productivity over a large area: A new super-ensemble-based probabilistic
projection. Agricultural and Forest Meteorology 149, 1266-1278 (2009).
42 Tao, F. & Zhang, Z. Adaptation of maize production to climate change in North China Plain:
Quantify the relative contributions of adaptation options. European Journal of Agronomy 33,
103-116 (2010).
43 Tao, F. & Zhang, Z. Climate change, wheat productivity and water use in the North China Plain: A
new super-ensemble-based probabilistic projection. Agricultural and Forest Meteorology 170,
146-165 (2013).
44 Nendel, C. et al. The MONICA model: Testing predictability for crop growth, soil moisture and
nitrogen dynamics. Ecological Modelling 222, 1614-1625 (2011).
45 Oleary, G., Connor, D. & White, D. A simulation-model of the development, growth and yield of
the wheat crop. Agricultural Systems 17, 1-26 (1985).
46 OLeary, G. & Connor, D. A simulation model of the wheat crop in response to water and
nitrogen supply .1. Model construction. Agricultural Systems 52, 1-29 (1996).
47 OLeary, G. & Connor, D. A simulation model of the wheat crop in response to water and
nitrogen supply .2. Model validation. Agricultural Systems 52, 31-55 (1996).
48 Latta, J. & O'Leary, G. Long-term comparison of rotation and fallow tillage systems of wheat in
Australia. Field Crops Research 83, 173-190 (2003).
49 Basso, B., Cammarano, D., Troccoli, A., Chen, D. & Ritchie, J. Long-term wheat response to
nitrogen in a rainfed Mediterranean environment: Field data and simulation analysis. European
Journal of Agronomy 33, 132-138 (2010).
50 Senthilkumar, S., Basso, B., Kravchenko, A. N. & Robertson, G. P. Contemporary evidence of soil
carbon loss in the US corn belt. Soil Sci. Soc. Am. J. 73, 2078-2086 (2009).
51 Angulo, C. et al. Implication of crop model calibration strategies for assessing regional impacts of
climate change in Europe. Agricultural and Forest Meteorology 170, 32-46 (2013).
52 Jamieson, P., Semenov, M., Brooking, I. & Francis, G. Sirius: a mechanistic model of wheat
response to environmental variation. European Journal of Agronomy 8, 161-179 (1998).
53 Jamieson, P. & Semenov, M. Modelling nitrogen uptake and redistribution in wheat. Field Crops
Research 68, 21-29 (2000).
54 Lawless, C., Semenov, M. & Jamieson, P. A wheat canopy model linking leaf area and phenology.
European Journal of Agronomy 22, 19-32 (2005).
55 Semenov, M. & Shewry, P. Modelling predicts that heat stress, not drought, will increase
vulnerability of wheat in Europe. Scientific Reports 1 (2011).
56 Martre, P. et al. Modelling protein content and composition in relation to crop nitrogen
dynamics for wheat. Eur J Agron 25, 138-154 (2006).
57 Ferrise, R., Triossi, A., Stratonovitch, P., Bindi, M. & Martre, P. Sowing date and nitrogen
fertilisation effects on dry matter and nitrogen dynamics for durum wheat: An experimental and
simulation study. Field Crops Res. 117, 245-257 (2010).
58 He, J., Stratonovitch, P., Allard, V., Semenov, M. A. & Martre, P. Global sensitivity analysis of the
process-based wheat simulation model SiriusQuality1 identifies key genotypic parameters and
unravels parameters interactions. Procedia - Social and Behavioral Sciences 2, 7676-7677 (2010).
59 Brisson, N. et al. STICS: a generic model for the simulation of crops and their water and nitrogen
balances. I. Theory and parameterization applied to wheat and corn. Agronomie 18, 311-346
(1998).
60 Brisson, N. et al. An overview of the crop model STICS. European Journal of Agronomy 18, 309-
332 (2003).

12
61 Cao, W. & Moss, D. N. Modelling phasic development in wheat: a conceptual integration of
physiological components. Journal of Agricultural Science 129, 163-172 (1997).
62 Cao, W. et al. Simulating organic growth in wheat based on the organ-weight fraction concept.
Plant Production Science 5, 248-256 (2002).
63 Yan, M., Cao, W. & C. Li, Z. W. Validation and evaluation of a mechanistic model of phasic and
phenological development in wheat. Chinese Agricultural Science 1, 77-82 (2001).
64 Li, C., Cao, W. & Zhang, Y. Comprehensive Pattern of Primordium Initiation in Shoot Apex of
Wheat. ACTA Botanica Sinica, 273-278 (2002).
65 Hu, J., Cao, W., Zhang, J., Jiang, D. & Feng, J. Quantifying responses of winter wheat
physiological processes to soil water stress for use in growth simulation modeling. Pedosphere
14, 509-518 (2004).
66 Pan, J., Zhu, Y. & Cao, W. Modeling plant carbon flow and grain starch accumulation in wheat.
Field Crops Research 101, 276-284 (2007).
67 Pan, J. et al. Modeling plant nitrogen uptake and grain nitrogen accumulation in wheat. Field
Crops Research 97, 322-336 (2006).
68 Boogaard, H. & Kroes, J. Leaching of nitrogen and phosphorus from rural areas to surface waters
in the Netherlands. Nutrient Cycling in Agroecosystems 50, 321-324 (1998).
69 Wang, E. & Engel, T. Simulation of growth, water and nitrogen uptake of a wheat crop using the
SPASS model. Environmental Modelling and Software 17, 387-402 (2002).
70 White, J. W., Kimball, B. A., Wall, G. W., Ottman, M. J. & Hunt, L. A. Responses of time of
anthesis and maturity to sowing dates and infrared warming in spring wheat. Field Crops
Research 124, 213-222 (2011).
71 Parent, B. & Tardieu, F. Temperature responses of developmental processes have not been
affected by breeding in different ecological areas for 17 crop species. New Phytologist 194, 760-
774 (2012).
72 Triboï, E., Martre, P. & Triboï-Blondel, A.-M. Environmentally-induced changes in protein
composition in developing grains of wheat are related to changes in total protein content.
Journal of Experimental Botany 54, 1731-1742 (2003).
73 Reynolds, M., Balota, M., Delgado, M., Amani, I. & Fischer, R. Physiological and morphological
traits associated with spring wheat yield under hot, irrigated conditions. Functional Plant Biology
21, 717-730 (1994).
74 Nagai, T. & Makino, A. Differences between rice and wheat in temperature responses of
photosynthesis and plant growth. Plant and Cell Physiology 50, 744-755 (2009).
75 Zhao, Z. et al. Accuracy of root modelling and its impact on simulated wheat yield and carbon
cycling in soil. Field Crops Research 165, 99-110 (2014).