the unintended impact of pretrial detention on case ...pope/pretrial_paper.pdf · the unintended...
TRANSCRIPT

The Unintended Impact of Pretrial Detention on Case
Outcomes: Evidence from NYC Arraignments
Emily Leslie
∗and Nolan G. Pope
†
November 9, 2016
Abstract
In the United States, over 400,000 individuals are in jail each day waiting for their criminalcases to be resolved. The majority of these individuals are detained pretrial due tothe inability to post low levels of bail (less than $3,000). We estimate the impact ofbeing detained pretrial on the likelihood of an individual being convicted or pleadingguilty, and their sentence length, using data on nearly a million misdemeanor and felonycases in New York City from 2009 to 2013. Causal e↵ects are identified using variationacross arraignment judges in their propensities to detain defendants. We find that beingdetained increases the probability of conviction by over seven percentage points by causingindividuals to plead guilty more often. Because pretrial detention is driven by failure topost bail, these adverse e↵ect disproportionately hurt low-income individuals.
∗University of Iowa†The University of Chicago
We would like to thank David Frisvold, Lars Lefgren, Steven Levitt, Jens Ludwig, Justine Olderman, NathanPetek, Mary Phillips, Joseph Price, Michael Riley, and John Whiston for helpful comments and discussion. Weare also grateful for the data provided by the New York State Division of Criminal Justice Services (DCJS).The opinions, findings, and conclusions expressed in this publication are those of the authors and not thoseof DCJS. Neither New York State nor DCJS assumes liability for its contents or use thereof.

Excessive bail shall not be required, nor excessive fines imposed, nor cruel and
unusual punishments inflicted.
–United States Constitution, Amendment VIII
1 Introduction
On any given day in the United States, over 400,000 individuals (or 1 out of every 550 adults)
are in jail awaiting the resolution of their criminal case (Wagner and Sakala, 2014) at a cost of
$9 billion per year (Holder, 2011). The number of individuals detained pretrial is also growing,
with over a 20% increase between 2000 and 2014 (Wagner, 2015). A large majority of these
detainees are prevented from returning home while their cases are adjudicated, because they
do not have access to the financial resources to post bail. Of the 38% of felony defendants
who are detained, 9 out of 10 of these fail to post bail.1 (Reaves, 2013) Of those held on bail,
81% have bail set at less than $5,000 and 44% have bail set at less than $1,000 (Phillips,
2012). Given that the high levels of pretrial detention are driven by failure to post bail, even
at low levels of bail, low-income individuals are particularly vulnerable to the adverse e↵ects
of pretrial detention.
The law allows a judge to set bail or detain a defendant to ensure appearance at court or
in the interests of public safety. Pretrial detention is intended to play no further role in legal
proceedings. However, detained individuals may face stronger incentives to plead guilty, even
if they are innocent. Detainees might miss work and therefore forego income or even lose
employment, and they are unable to attend to family responsibilities or access their social
support network. For defendants charged with minor o↵enses, pleading guilty often results in
immediate release. Because time spent in jail awaiting the resolution of the case is counted
against sentence length, the cost of pleading guilty is lower for detained defendants because
they have e↵ectively paid part of the price of conviction in advance.
1The BJS does not complies national statistics on pretrial detainees in misdemeanor cases.
2
Empirical exploration of the link between detention and case outcomes began in the early
1960s as part of Vera’s Manhattan Bail Project. Ares et al. (1963) compared defendants after
controlling for charge type, and found that detention was associated with a higher probability
of conviction for all charge types. This relationship was found to be robust to the inclusion
of other controls, including criminal record and bail amount (Rankin, 1964). More recently,
evidence using multivariate analysis has consistently found a relationship between pretrial
detention and case outcomes (Kellough and Wortley (2002); Leiber and Fox (2005); Phillips
(2008); Williams (2003)). Although these results are certainly consistent with a causal e↵ect
of detention on conviction, they cannot rule out the possibility that systematic, unobserved
di↵erences are responsible for part or all of the relationship.
In this paper, we instrument for pretrial detention status using the degree to which in-
dividual judge-specific detention rates deviate from the average detention rate for the full
sample by crime type, allowing us to isolate the causal e↵ect of detention on conviction and
other case outcomes. We use data from nearly a million felony and misdemeanor criminal
cases in New York City from 2009 to 2013, including information linking defendants with
arraignment judges. Once we confirm the conditional random assignment of judges, we esti-
mate how an increase in the probability of pretrial detention, driven solely by the arraignment
judge, a↵ects the probability of pleading guilty, being convicted, and sentence length.
We find that pretrial detention increases the probability that a felony defendant will be
convicted by at least 13 percentage points; e↵ects for misdemeanor defendants are larger than
seven percentage points. The increase in conviction rates is driven by detainees accepting
plea deals more frequently. We also find evidence that detention increases minimum sentence
length. Detention a↵ects case outcomes for defendants in both misdemeanor and felony cases.
In addition, individuals who are detained pretrial are less likely to obtain a reduction in the
severity of the crime they are charged with. Our estimates are robust to adding a variety of
demographic, criminal history, and most serious o↵ense charge controls. Relaxing the mono-
tonicity assumption associated with standard instrumental variables (IV) also yields similar
results. Although e↵ects do not vary noticeably across racial and ethnic lines, minorities
3

are overrepresented in the sample and are therefore disproportionately a↵ected by pretrial
detention.
The adverse e↵ects of detention on case outcomes could operate through a variety of
mechanisms. Conventional wisdom among those employed in the criminal justice system is
that detainees plead guilty to return home quickly. Large e↵ects for people charged with
minor crimes support this hypothesis, because many of these individuals have access to plea
deals that do not require any additional time incarcerated. Defendants with dependents
may be especially prone to pleading guilty quickly so they can be with their children. We
find evidence that women are more likely than men to plead guilty when they are facing
less serious charges; we find no di↵erence in e↵ects for men and women facing more serious
charges. However, even individuals who will almost certainly spend more time behind bars
after pleading guilty tend to do so more often if detained. This group has already served part
of their time in advance, making accepting a plea deal relatively less costly.
One existing branch of literature uses judge assignment to analyze post-sentence outcomes
for convicted criminals: Kling (2006) finds no consistent evidence of adverse e↵ects from serv-
ing a longer sentence on employment and earnings. Aizer and Doyle (2015) find that juvenile
incarceration decreases the likelihood of high school completion and increases the likelihood
of adult recidivism. Mueller-Smith (2014) finds that a one-year prison term generates $56,200
to $66,800 in social costs through increased recidivism, decreased employment and wages, and
increased dependence on public assistance.
Concurrent work has taken a similar approach to exploring the impact of pretrial deten-
tion. Stevenson (2016) uses variation in the bail-setting patterns of arraignment magistrates
in Philadelphia to find that defendants who fail to make bail are more likely to be convicted.
Gupta et al. (2016) also use data from Pennsylvania, and estimate that being assigned money
bail increases the probability of both pleading guilty and reo↵ending. By contrast, our data
from New York City, which has the second-largest jail system in the country, allows us to
estimate e↵ects with greater precision using a much larger sample of arraignments and ar-
raignment judges.
4

The paper proceeds as follows. Section 2 describes the institutional setting of the New
York City arraignment process. Section 3 describes the two data sets used in the analysis.
Section 4 describes the IV methodology and discusses potential concerns with it. Section 5
presents the main results from our analysis along with suggestive evidence for the underlying
mechanism and robustness checks. Section 6 concludes.
2 Background on New York City Arraignment Process
In New York City, after an individual is arrested, he is taken to the local police precinct
to be booked and fingerprinted. Prosecutors are assigned immediately after arrest, and are
responsible for the case until disposition by trial or plea. The fingerprints and booking
information are processed by the state and are used to provide a criminal history of the
defendant for the arraignment judge. Individuals are then moved to a holding cell in the
county courthouse corresponding to the county of arrest (Bronx, Kings, New York, Queens,
or Richmond) to await their arraignment. A small subset of misdemeanor arrestees are
given desk-appearance tickets and are not held prior to arraignment. At the courthouse, the
Criminal Justice Agency will interview the defendant and will provide a bail recommendation
for the arraignment judge. The defendant is then allowed to meet with his defense attorney,
which may be private or assigned, before the arraignment.
The process of judge assignment is central to our identification strategy. If individuals
are sorted among arraignment judges based on unobservables that are correlated with case
outcomes (e.g. the strength of evidence against them), then judge-level variation in propen-
sity to detain (through denial of bail or systematically setting higher bail amounts) will not
be a valid instrument. Arraignments in New York City happen every day of the year in
two sessions: day (9am to 5pm) and night (5pm to 1am). In a session, judges only have an
average of 6 minutes per arraignment. Most felony defendants are arraigned within one to
two days of their arrest, during which time they are kept in a holding cell.2 Starting before
our sample period, the New York City criminal courts received a mandate from the Court
2Individuals facing a charge in the least serious category, nonviolent class E felonies, may be releasedawaiting an arraignment. In this situation, the arraignment is scheduled weeks or months ahead of time.
5

of Appeals to arraign within 24 hours. The average time from arrest to arraignment in our
sample period fell from 25.39 hours in 2009 to 21.44 hours in 2013 (Barry, 2014). Given
the short window between arrest and arraignment, police o�cers are unlikely to manipulate
which judge a defendant will see at arraignment. Arraignments are scheduled by Arraignment
Coordinators, whose primary objective if multiple courtrooms are operating is maintaining
balance in the workloads across courtrooms. Some intentional sorting across arraignment
shifts does occur. For example, defendants with desk-appearance tickets, who are generally
charged with relatively minor o↵enses, are grouped together. Thus, there is no institutional
reason to expect troublesome sorting of defendants among judges conditional on the court-
house, time of year, and arraignment session. Below, we present further statistical evidence
that judge assignment is conditionally random.
The arraignment is the first time the defendant will appear before a judge. Here, he is
formally informed of the charges being brought against him. In felony cases, the judge will
release the defendant on his own recognizance, set a bail amount, or order the defendant
held without bail (Phillips, 2012).3 Misdemeanor cases may be adjudicated at arraignment
if the defendant pleads guilty or the case is dismissed. In practice, defendants are generally
not allowed to plead guilty at arraignment if there is a complaining witness (e.g., the assault
victim in an assault case). In determining the terms of a guilty plea at arraignment, the judge
may not o↵er reduced charges, but can o↵er specific punishments for the existing charges.
There is less room for judicial discretion in determining whether a case will be dismissed,
because judges may dismiss a case at arraignment only when a specific legal defect exists.
Because some misdemeanor cases are disposed of at arraignment, and we do not observe
which of these defendants would have been detained if their cases had not been immediately
resolved, we interpret estimates from the misdemeanor subsample with more caution than
those from the felony subsample.
In New York county courts, aside from being prohibited from denying bail in misdemeanor
cases or for the sake of public safety, the judge has complete discretion in the bail decision
3With the exception of Queens, supervised release is not available in New York City.
6
(CPL §530.20). Judges may set di↵erent amounts for di↵erent types of bail; for example, a
defendant could be required to post either $1000 in cash, or secure a $2000 bond. Following
Phillips (2012), we use the amount of cash required for release. If the cash alternative is not
set, we use the bond amount. Defendants who fail to make bail are detained until their cases
are adjudicated. In New York City, almost all pretrial detainees are housed in jails on Rikers
Island, with the remainder kept in county jails throughout the city. Cases may be resolved
at trial, with a conviction or acquittal, but they may also be resolved through plea deals and
dismissals. Trials are far less common than plea deals; only 0.7% of cases in our sample go to
trial, whereas 64.3% are disposed of through plea deals. A large majority of the remaining
cases have the charges dismissed. The trial judge is assigned separately from the arraignment
judge. A di↵erent judge is randomly assigned to the case after the arraignment, so that
the arraignment judge can only influence case outcomes through pretrial-status assignment
(Uniform Rules for Trial Courts [22 NYCRR] §200.11(c)). We are interested in how the
detention status resulting from the arraignment hearing a↵ects case outcomes, including
guilty verdicts, guilty pleas, the relationship between arraignment charges and disposition
charges, and sentencing.
3 Data
The data come from two sources: the State Court Processing Statistics (SCPS) and the New
York City Criminal Courts (NYC). The SCPS data include a random sample of felony cases
in 40 of the 75 most populous counties in the United States for even years from 1990 to
2006. In addition to information on pretrial status and case outcomes, we take advantage of
demographic (age, race, and sex) and criminal history (prior arrests and convictions) details.
We supplement the SCPS data with county-level data from the Census Bureau on crimes
reported per capita and median income. The sample is restricted to individuals for whom we
observe both pretrial status and the final case outcome. This eliminates 3,121 cases with no
pretrial-status information, 12,980 cases that were still pending at the time of data reporting,
6,629 cases that were diverted or deferred, and 237 cases with no case-outcome information.
7

An additional 168 observations are missing criminal-history information (prior arrests and/or
convictions), and 13,336 have no information about race/origin.4 This leaves us with a final
sample size of 82,114 Table 1 presents summary statistics for the SCPS data. The disparity
in outcomes by pretrial status is stark: 79% of detained individuals are convicted, compared
to 65% of those who are released. However, the systematic di↵erences in other observables
are just as extreme; in particular, detained individuals have many more prior arrests and
convictions. Although controlling for observable characteristics may yield a more believable
estimate of the e↵ect of detention on conviction, it cannot address the obvious concern that
two groups that are systematically di↵erent in observable ways are likely to be di↵erent
in unobserved ways as well. Thus, without a quasi-experimental approach, using exogenous
variation in the probability of pretrial detention, there is good reason to believe our estimates
will be biased.
The NYC data include additional arraignment details that allow us to take advantage of
exactly this kind of natural experiment. Our data cover all felony and misdemeanor criminal
cases between 2009 and 2013. To have a precise measure of judge severity, we restrict cases to
those in which the arraignment was brought before a judge who saw at least 500 arraignments
in our sample. This eliminates 24,679 cases (2.5% of the original sample). Along with
pretrial status, bail amount, demographics, criminal history, and case outcomes, the data
include the arraignment shift, courthouse, and judge ID. Arraignments in our sample were
presided over by 212 unique judges, all of whom presided over arraignments for both felony
and misdemeanor cases. The average number of arraignments per judge per year is 1,523.
Of these, 291 are felony cases. We treat a defendant as detained pretrial if he was remanded
without bail, or bail was set and never posted.5 As a result, individuals who posted bail after
spending some time in jail are counted as released, which could bias our results toward zero.
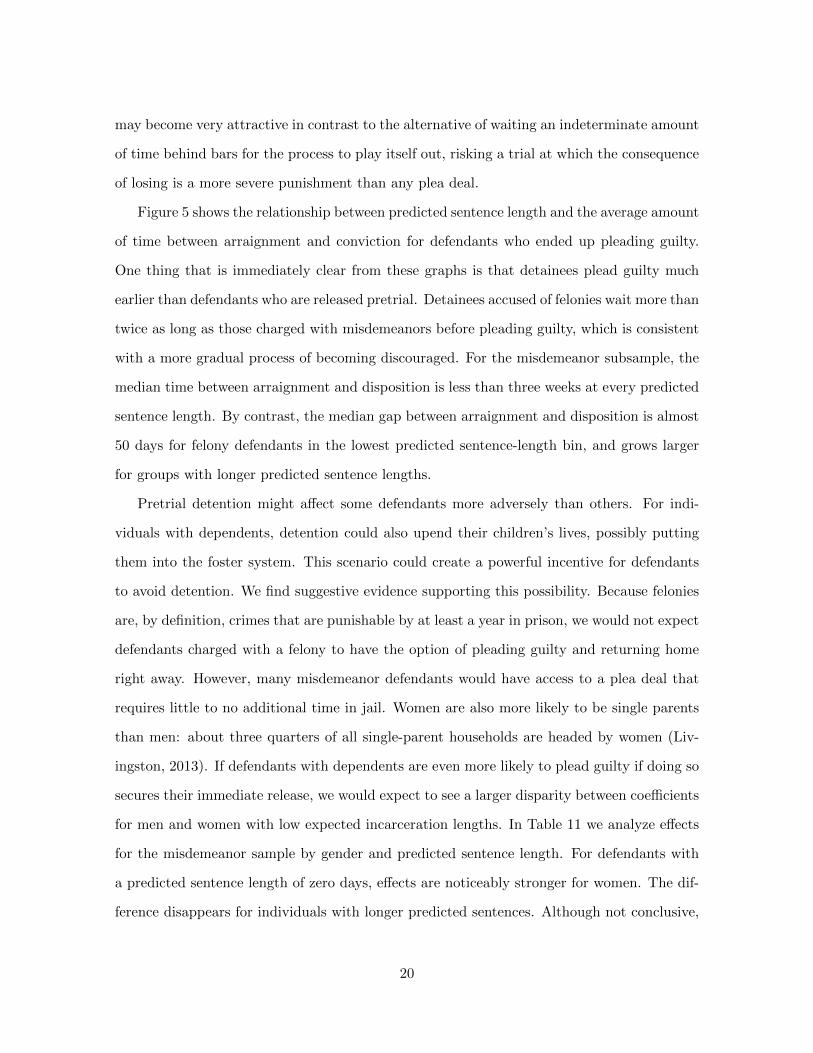
Figure 1 presents graphically the distribution of pretrial detention length. The bumps in the
distributions around 180 days for felonies and 90 days for misdemeanors are a result of laws
4The results are not sensitive to omitting race/origin controls from the analysis and including theseobservations
5We do not have information on when bail was posted, and therefore have no way of determining howmany defendants in our sample are detained for the full period between arraignment and case disposition.
8

meant to protect the right to a speedy trial: the state is generally required to bring cases to
trial within six months for felony cases or 90 day for misdemeanor cases, although prosecutors
can successfully move for an extension in a variety of circumstances (CPL §30.30). Figure
A.1 shows how the sample is distributed across the most common types of o↵enses. Table 2
displays summary statistics for the NYC sample. In many ways, the NYC felony sample and
national SCPS sample are comparable. In terms of pretrial treatment, the fraction released
pretrial is similar, but being released on bail is much less common in the NYC data than it is
in the SCPS data (27% of those released vs. 49%). This suggests the margin between being
released on one’s own recognizance and having bail set at all is more important in New York
City than nationally, whereas, at least for the period of our SCPS data, a larger fraction of
individuals facing bail are able to come up with enough money to secure their release. Figure
2 shows the distribution of bail amounts and illustrates that, regardless of the bail amount,
defendants are more likely to be held on bail than to post bail.
4 Methodology
Our baseline OLS results come from estimating the following equation:
yi
= �o
+ �1detainedi + �2Xi
+ �3Ci
+ �4Ti
+ ✏i
,
where yi
is a dummy for whether or not defendant i was convicted, a dummy for whether
or not he pled guilty, or the minimum sentence length. The variable detained is a dummy
for being detained pretrial. Xi
is a vector of demographic characteristics, including race, a
cubic in age, gender, and a police precinct fixed e↵ect. Ci
is a vector of criminal-history
features, including dummies for first-time o↵ender, sex-o↵ender status, whether the current
charge is an attempt charge, whether it is a violent felony, whether a firearm was involved,
whether a weapon was involved, whether a child was involved, whether it is a hate crime,
whether it is a drug crime, the class of the most serious o↵ense charge (e.g., class B felony),
Uniform Crime Reporting crime-type code for the most serious o↵ense charge (e.g., aggravated
assault, DUI), and cubics in the number of prior felony arrests, misdemeanor arrests, felony
9

convictions, misdemeanor convictions, and the number of counts in the current case. Ti
is a
vector of fixed e↵ects for year, month, day of week, and courtroom/shift (e.g., Tuesday night
shift in courtroom A of the Bronx courthouse in July 2012). Standard errors are clustered
at the arraignment-shift level, which is more conservative than clustering at the judge-year
or courthouse-month level.
Our objective is to estimate the causal e↵ect of being detained on case outcomes, which we
do by instrumenting for detained in the above regression equation using judge-level variation
in the propensity to detain pretrial for a given crime type.6 Specifically, we calculate a leave-
out mean measuring the degree to which each judge deviates from the full-sample average
detention rate for each Uniform Crime Reporting crime type code:
zijc
= 1njc�1(⌃k
\detainedk
� \detainedi
)� 1nc�1(⌃m
\detainedm
� \detainedi
),
where the first term divides the total number of people charged with crime type c and detained
by judge j (indexed by k and excluding individual i) by the total number of defendants
charged with crime type c and who appeared before judge j (njc
), excluding individual i; and
the second term is the total number of people in our sample who were charged with crime
type c and detained (indexed by m and excluding individual i), divided by the total number
of people charged with crime type c in the sample (nc
), excluding individual i. To control for
systematic di↵erences across shifts, we use \detained, the residual from regressing detained
on courtroom/shift fixed e↵ects. Positive values of zijc
correspond with judges that detain
more than average for the sample, and negative values indicate lower-than-average detention
rates.
One concern with standard IV in this case is that the monotonicity assumption may
be violated. This assumption requires that, if defendants on average are more likely to be
detained by judge A than judge B, anyone who would be detained by judge B would also
be detained by judge A (Imbens and Angrist, 1994). This assumption could be violated if
arraignment judges vary their treatment based on defendant characteristics.7 To relax the
6In theory, using judge fixed e↵ects as our instruments would introduce bias. In practice, we find theresults are qualitatively similar in our context (see Tables A.4 and A.5 in the appendix).
7See the online appendix of Mueller-Smith (2014)for a detailed discussion of how the monotonicity as-
10

monotonicity assumption, we follow Mueller-Smith (2014) in constructing a set of candidate
instruments that measure the degree to which judges deviate from average trends across
the full sample in their tendency to detain people within certain groups. These groups are
defined by criminal-history features (a dummy for first-time o↵ender and sex o↵ender, and
the number of prior felony arrests, prior misdemeanor arrests, prior felony convictions, prior
misdemeanor convictions, and the number of counts in the current case), most serious charge
(Uniform Crime Reporting crime-type code), race, and gender, as well as interactions between
every pairwise combination of these characteristics. We use a Lasso procedure described in
Belloni et al. (2012) to reduce noise and avoid the many-instruments problem by selecting only
the most informative of these instruments. This process leaves us with 27 instruments for the
felony subsample and 23 for the misdemeanor subsample; the five most powerful instruments
for each sample are listed in Appendix Table A.1. The new, less restrictive, monotonicity
assumption for these specifications is that judge detention decisions are monotonic within
groups of defendants sharing similar characteristics.
As mentioned above, analysis based on misdemeanor defendants should be viewed with
some caution. Unlike felony cases, misdemeanor cases may be disposed of at the arraignment,
if the case is either dismissed or the defendant chooses to plead guilty. The fraction adjudi-
cated at arraignment by crime type is shown in Figure 3. As discussed in more detail below,
the results are somewhat sensitive to the inclusion or exclusion of cases that are adjudicated
at arraignment.
The randomness of arraignment-judge assignment is essential to the validity of our esti-
mation strategy. To test for conditionally random judge assignment, we first estimate the
ex ante probability that each defendant would be detained based on his demographic and
criminal-history characteristics, as well as courthouse by time of year (year, month, and day
of the week) by arraignment-shift fixed e↵ects (hereafter referred to as time by arraignment-
shift fixed e↵ects). We then regress these predicted probabilities on a full set of judge dummy
variables controlling for courthouse by time of year by arraignment-shift fixed e↵ects, and
sumption could be violated, and an example illustrating how this violation could bias the results in a similarcontext.
11
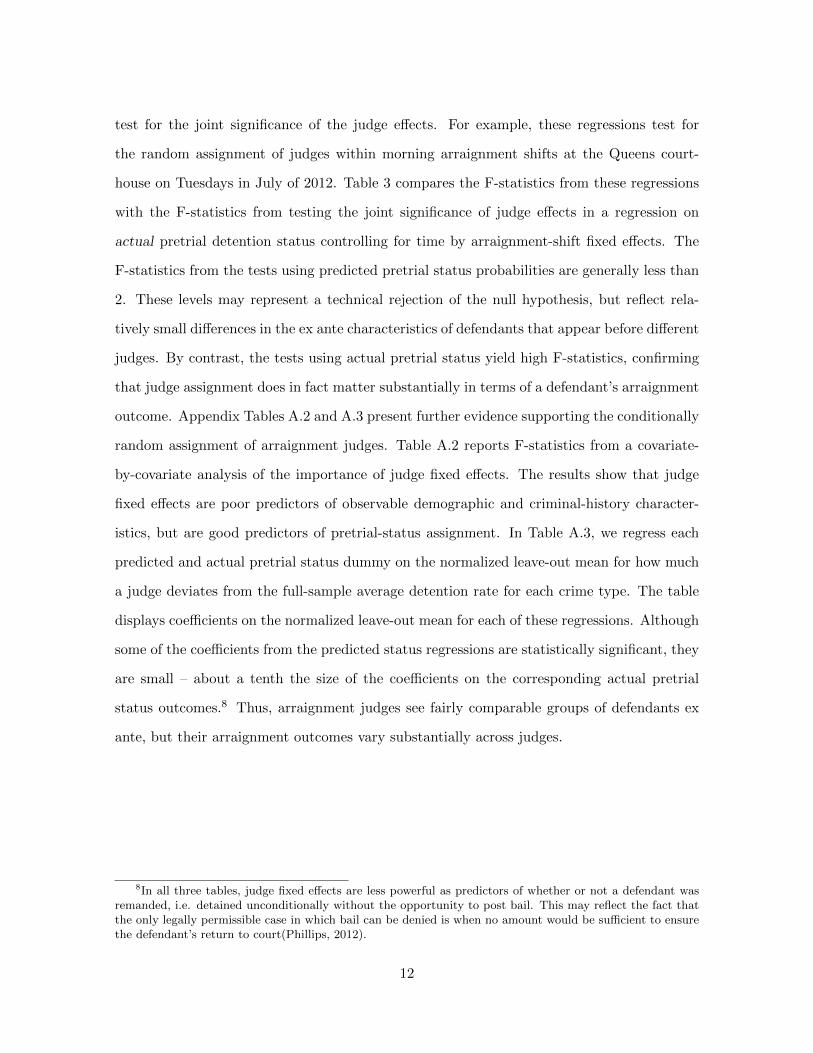
test for the joint significance of the judge e↵ects. For example, these regressions test for
the random assignment of judges within morning arraignment shifts at the Queens court-
house on Tuesdays in July of 2012. Table 3 compares the F-statistics from these regressions
with the F-statistics from testing the joint significance of judge e↵ects in a regression on
actual pretrial detention status controlling for time by arraignment-shift fixed e↵ects. The
F-statistics from the tests using predicted pretrial status probabilities are generally less than
2. These levels may represent a technical rejection of the null hypothesis, but reflect rela-
tively small di↵erences in the ex ante characteristics of defendants that appear before di↵erent
judges. By contrast, the tests using actual pretrial status yield high F-statistics, confirming
that judge assignment does in fact matter substantially in terms of a defendant’s arraignment
outcome. Appendix Tables A.2 and A.3 present further evidence supporting the conditionally
random assignment of arraignment judges. Table A.2 reports F-statistics from a covariate-
by-covariate analysis of the importance of judge fixed e↵ects. The results show that judge
fixed e↵ects are poor predictors of observable demographic and criminal-history character-
istics, but are good predictors of pretrial-status assignment. In Table A.3, we regress each
predicted and actual pretrial status dummy on the normalized leave-out mean for how much
a judge deviates from the full-sample average detention rate for each crime type. The table
displays coe�cients on the normalized leave-out mean for each of these regressions. Although
some of the coe�cients from the predicted status regressions are statistically significant, they
are small – about a tenth the size of the coe�cients on the corresponding actual pretrial
status outcomes.8 Thus, arraignment judges see fairly comparable groups of defendants ex
ante, but their arraignment outcomes vary substantially across judges.
8In all three tables, judge fixed e↵ects are less powerful as predictors of whether or not a defendant wasremanded, i.e. detained unconditionally without the opportunity to post bail. This may reflect the fact thatthe only legally permissible case in which bail can be denied is when no amount would be su�cient to ensurethe defendant’s return to court(Phillips, 2012).
12
5 Results
5.1 OLS on a National Sample
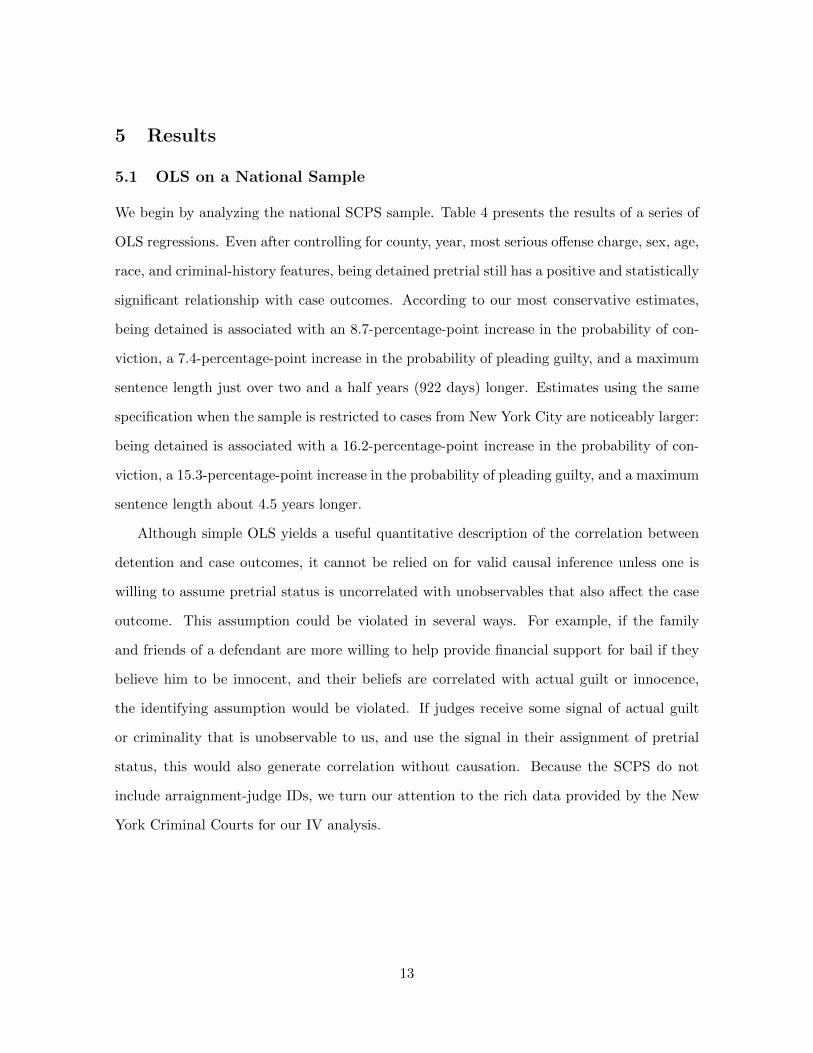
We begin by analyzing the national SCPS sample. Table 4 presents the results of a series of
OLS regressions. Even after controlling for county, year, most serious o↵ense charge, sex, age,
race, and criminal-history features, being detained pretrial still has a positive and statistically
significant relationship with case outcomes. According to our most conservative estimates,
being detained is associated with an 8.7-percentage-point increase in the probability of con-
viction, a 7.4-percentage-point increase in the probability of pleading guilty, and a maximum
sentence length just over two and a half years (922 days) longer. Estimates using the same
specification when the sample is restricted to cases from New York City are noticeably larger:
being detained is associated with a 16.2-percentage-point increase in the probability of con-
viction, a 15.3-percentage-point increase in the probability of pleading guilty, and a maximum
sentence length about 4.5 years longer.
Although simple OLS yields a useful quantitative description of the correlation between
detention and case outcomes, it cannot be relied on for valid causal inference unless one is
willing to assume pretrial status is uncorrelated with unobservables that also a↵ect the case
outcome. This assumption could be violated in several ways. For example, if the family
and friends of a defendant are more willing to help provide financial support for bail if they
believe him to be innocent, and their beliefs are correlated with actual guilt or innocence,
the identifying assumption would be violated. If judges receive some signal of actual guilt
or criminality that is unobservable to us, and use the signal in their assignment of pretrial
status, this would also generate correlation without causation. Because the SCPS do not
include arraignment-judge IDs, we turn our attention to the rich data provided by the New
York Criminal Courts for our IV analysis.
13

5.2 IV Results
Figure 4 displays graphical evidence of the causal relationship between detention and case
outcomes. These graphs plot judge-specific outcome residuals by judge-specific detention
residuals. Each point represents the average outcome residual and detention residual for
an individual judge. Average outcome residuals reflect the ultimate outcomes of cases that
appeared before the judge at arraignment (not those over which the judge presided at trial).
The slope of the fitted linear regression lines confirms that simply appearing before a harsher
arraignment judge increases a defendant’s likelihood of being convicted and pleading guilty.
These e↵ects are estimated formally for our sample of felony defendants in the first three
columns of Table 6, which show the results from a traditional IV specification using the de-
gree to which each judge deviates from the full-sample detention rate by crime type as an
instrument for whether an individual was detained at arraignment. Table 5 presents the cor-
responding OLS estimates for comparison. These estimates are larger than the coe�cients
from the national sample, but comparable to OLS results using only the subset of SCPS
observations from counties in New York City. The IV estimates on the felony subsample in
Panel A are slightly smaller than the OLS estimates, although adding more controls attenu-
ates this di↵erence. The estimated e↵ects are significant, both statistically and economically:
pretrial detention increases the probability of conviction by over 10 percentage points. The
estimated e↵ect of detention on pleading guilty is only about 20% smaller than the e↵ect on
conviction (11 percentage points vs. 14 percentage points, using the full set of controls), sug-
gesting that detention primarily a↵ects conviction by inducing some individuals who would
not have pled guilty if released to plead guilty after they are detained.
The marginal defendant in this context is one who does not have access to the resources
required to make bail. Although judges may di↵er in both the frequency with which they
set bail and the level at which they set it, the decision to set it or not appears to be more
important in this setting. In our sample, 71% of felony defendants and 68% of misdemeanor
defendants for whom bail is set are unable to post bail to secure their release. Most of
the bail amounts standing between these defendants and their release are quite low: around
14

15% of defendants in felony cases that are held on bail would need less than $2000, and the
majority have bail set at less than $5000. For the misdemeanor sample, well over half of
individuals held on bail need less than $2000, and over a fourth need only a few hundred
dollars. These statistics highlight the unfortunate reality that the unintended adverse e↵ects
of pretrial detention on case outcomes fall most heavily on the shoulders of the poor and
disadvantaged.
We also present estimates from specifications relaxing the monotonicity assumption for the
felony subsample in columns 4-6 of Table 6 (labeled “IVNM” for IV non-monotonicity). This
correction produces coe�cients that are quite similar to the standard IV estimates. Across all
the specifications in Table 6, we see consistent evidence that being detained pretrial causes the
probability of conviction to increase substantially, and that most–if not all–of this increase
comes through detainees’ guilty pleas. This finding is robust to a variety of estimation
methods and controls. In our preferred specification, in which we relax the monotonicity
assumption and include the full set of controls, being detained increases the probability of
conviction by 13 percentage points and the probability of pleading guilty by 10 percentage
points.
Panel C shows evidence that the impact of detention extends to minimum sentence
length9. The coe�cients are less stable, but all suggest a strong, positive e↵ect of being
detained. Because we are estimating e↵ects for the full sample, including people who were
not convicted, these estimates reflect the combined e↵ect on conviction (a precondition to
receiving a sentence) and sentence length once convicted. Our preferred specification suggests
that being detained pretrial increases minimum sentence length for felony defendants by over
150 days.
5.3 Misdemeanor Cases
Because of the larger variety of outcomes possible at a misdemeanor arraignment, we are
more cautious about our analysis of this subsample. Columns 5-8 of Table 5 show OLS
9These estimates are not directly comparable to the sentence-length results on the national SCPS samplein Table 4, because the SCPS data only include information on maximum sentence length.
15

estimates of the e↵ect of detention on conviction for people charged with misdemeanors.
Overall, the estimates are similar to those from the felony subsample. The IV estimates
for this group are more responsive to additional controls, but the standard IV and IVNM
specifications yield similar results (see Table 7). Our preferred specification indicates that
being detained increases the probability of conviction by 7.4 percentage points, and the
probability of pleading guilty by 7.1 percentage points. In Table A.6, we show results from
a subset of our specifications using various sample constructions that include or exclude
cases that were dismissed or in which the defendant pled guilty at arraignment. Both the
IV and the IVNM coe�cients are sensitive to the sample construction, though in di↵erent
ways. Despite this sensitivity, almost all specifications indicate a positive and statistically
significant e↵ect of detention on the probability of conviction and pleading guilty. As an
additional check, we analyze a subset of misdemeanor cases that are the least likely to be
adjudicated at arraignment. Figure 3 shows the fraction of cases adjudicated at arraignment
by most serious o↵ense charge. Simple assault, aggravated assault, and DUI cases are the least
likely to be disposed of at the arraignment hearing, especially through a guilty plea. Table
A.7 shows results from running our analysis on this subset of misdemeanor cases. Coe�cients
for crimes with low levels of adjudication at arraignment are substantially higher than for
the full misdemeanor sample. Of course, the defendants in this group are a nonrandom
sample, but the large e↵ects do provide evidence that the sample-selection issues created by
arraignment adjudications are not generating the large and statistically significant e↵ects we
estimate for the misdemeanor sample. Thus, although we are less confident in magnitude of
the e↵ect for misdemeanors, we find strong evidence that pretrial detention influences case
outcomes unfavorably for misdemeanor cases.
5.4 E↵ects on Charge Reduction
Not only are detainees more likely to plead guilty, but the plea deals they accept are less
favorable. Using information on both crimes with which an individual is charged at arraign-
ment (arraignment charges) and the crimes of which he is ultimately convicted (disposition
16

charges), we determine whether the most serious disposition charge belongs to a lower class
than the most serious arraignment charge. Crimes are organized into ordered classes based
on seriousness. The crimes in our sample fall into eight di↵erent classes (class A-E felonies
and class A, class B, or classless misdemeanors). Table 8 reports estimates of the e↵ect of
detention on charge reduction conditional on being convicted. We find evidence of large
negative e↵ects on charge reduction, meaning detainees are less likely to be convicted of less
serious crimes than the one with which they were charged at arraignment. This e↵ect could
translate into more severe punishments for individuals who are subsequently arrested and
charged again, because criminal history is an important dimension of sentencing guidelines.
Many people who interact with the criminal justice system do so multiple times during the
course of their lives. In our sample, only 59% of defendants are first-time o↵enders, with de-
fendants averaging 3.5 prior felony and misdemeanor convictions. As individuals repeatedly
face criminal charges, the negative consequences of being detained even once will continue to
accrue.
5.5 E↵ects by Race and Ethnicity
In Tables 9 and 10, we test for di↵erences in e↵ects across racial and ethnic groups using the
IV specification with the relaxed monotonicity assumption. Overall, e↵ects for blacks, whites,
and Hispanics are relatively comparable. In both the felony and misdemeanor subsamples,
whites have the smallest estimated e↵ects on both conviction and pleading guilty, and His-
panics have the largest e↵ects. However, whites have the largest estimated e↵ects on sentence
length. Although we don’t see consistent evidence that e↵ects are larger for minorities, blacks
and Hispanics are overrepresented in the population of defendants in criminal cases. At the
time of the 2010 Census, blacks and Hispanics made up about 23% and 29%, respectively,
of the population of New York City in 2010, but 49% and 33% of our sample. Even condi-
tional on being charged with a crime, minorities are overrepresented among detainees (see
Figure A.2 and A.3). As a result, they bear a relatively larger share of the impact of pretrial
detention on case outcomes.
17

5.6 Possible Mechanisms
In all specifications, the estimated e↵ect of detention on pleading guilty is similar to the e↵ect
on conviction. This finding supports the hypothesis that detention influences case outcomes
primarily by causing detainees to accept plea bargains more often. Detainees might be more
likely to plead guilty for a variety of reasons.
First, some defendants may be o↵ered plea deals that would allow them to go home
sooner, potentially without serving any additional time. This is widely accepted among
people who work in and write about pretrial detention as a central channel through which
detention induces guilty pleas. To investigate whether defendants are pleading guilty to
get home sooner, we estimate e↵ects by predicted incarceration length if convicted. To
predict incarceration lengths, we first restrict the sample to cases that ended in conviction.
Then we regress sentence length on the vector of observable characteristics described in the
methodology section. Using the coe�cients from this regression, we predict sentence length
conditional on conviction for the entire sample. Tables A.8 and A.9 present estimated e↵ects
of detention on conviction by predicted incarceration length. The coe�cients on the group
with an expected sentence length of zero days are no larger than for groups with positive
predicted incarceration lengths.
Thus, although eagerness to get home sooner is a compelling story, it cannot fully explain
our findings. Whether we analyze e↵ects by predicted sentence length or by most serious
o↵ense charge (Tables A.10 and A.11), we find strong e↵ects for individuals who would almost
certainly face additional time in jail or prison as part of any plea deal. If an individual is
not presented with a plea bargain that allows him to go home, why would being detained
increase his incentive to accept it? One relevant feature of the criminal justice system is that
detainees who are ultimately convicted and sentenced to serve time have the time they spent
awaiting adjudication counted against their sentences. This policy lowers the cost of pleading
guilty for detainees relative to released defendants, because detainees have paid part of the
price of conviction already.
Another possible motivation could be to get moved to a di↵erent facility. Pretrial detainees
18

are kept in jail, along with convicts serving relatively short sentences (generally no longer
than one year). Prisons are reserved for convicts serving longer sentences, and are designed
with long-term residence in mind. Some jails have no yard, no inmate employment, and
more limited visiting opportunities. In New York City, the majority of detainees are kept in
jails located on Rikers Island, the site of 10 separate jails with a combined capacity of up to
15,00010. Rikers has gained notoriety in recent years for abuse and neglect of prisoners. If
defendants perceive their detention facility to be worse than wherever they might serve out
their sentences, they might opt to plead guilty rather than stay where they are longer than
necessary.
This option only increases in its relative appeal if detainees whose cases go to trial are
disadvantaged once they get there. Collecting evidence or recruiting witnesses to support
one’s defense might be more challenging from behind bars. Relatively more detainees end up
taking their cases to trial, but the fraction of cases that go to trial is tiny for both groups:
only about 1% of cases in the entire sample were adjudicated at trial. By contrast, 34% of
released defendants’ cases are dismissed, compared to 19% of detainees. These statististics
suggest that being detained a↵ects outcomes by causing people whose cases would ultimately
have been dismissed to plead guilty, rather than through causing people to plead guilty
who would have gone on to be acquitted at trial if they had been released. It does not
follow that expectations about trial outcomes are irrelevant to strategic decision making by
defendants (or their attorneys). The criminal justice system moves slowly and unpredictably:
for detainees whose cases go to trial, the median time between arraignment and sentencing
is 513 days for felonies and 138 days for misdemeanors, with the middle 80% ranging from
226 to 971 days for felonies and 45 to 428 days for misdemeanors. Dismissals often take
months: conditional on being dismissed, the median time to dismissal is 188 days for felony
cases and 196 days for misdemeanor cases. By comparison, for detainees who plead guilty,
the median time between arraignment and sentencing is 80 days for felonies and 15 days for
misdemeanors. Over time, the prospect of attaching an end date to the period of incarceration
10Brooklyn, the Bronx, Queens, and Manhattan each have a smaller borough jail, but all together thesefacilities can only hold up to 3,000 inmates.
19
may become very attractive in contrast to the alternative of waiting an indeterminate amount
of time behind bars for the process to play itself out, risking a trial at which the consequence
of losing is a more severe punishment than any plea deal.
Figure 5 shows the relationship between predicted sentence length and the average amount
of time between arraignment and conviction for defendants who ended up pleading guilty.
One thing that is immediately clear from these graphs is that detainees plead guilty much
earlier than defendants who are released pretrial. Detainees accused of felonies wait more than
twice as long as those charged with misdemeanors before pleading guilty, which is consistent
with a more gradual process of becoming discouraged. For the misdemeanor subsample, the
median time between arraignment and disposition is less than three weeks at every predicted
sentence length. By contrast, the median gap between arraignment and disposition is almost
50 days for felony defendants in the lowest predicted sentence-length bin, and grows larger
for groups with longer predicted sentence lengths.
Pretrial detention might a↵ect some defendants more adversely than others. For indi-
viduals with dependents, detention could also upend their children’s lives, possibly putting
them into the foster system. This scenario could create a powerful incentive for defendants
to avoid detention. We find suggestive evidence supporting this possibility. Because felonies
are, by definition, crimes that are punishable by at least a year in prison, we would not expect
defendants charged with a felony to have the option of pleading guilty and returning home
right away. However, many misdemeanor defendants would have access to a plea deal that
requires little to no additional time in jail. Women are also more likely to be single parents
than men: about three quarters of all single-parent households are headed by women (Liv-
ingston, 2013). If defendants with dependents are even more likely to plead guilty if doing so
secures their immediate release, we would expect to see a larger disparity between coe�cients
for men and women with low expected incarceration lengths. In Table 11 we analyze e↵ects
for the misdemeanor sample by gender and predicted sentence length. For defendants with
a predicted sentence length of zero days, e↵ects are noticeably stronger for women. The dif-
ference disappears for individuals with longer predicted sentences. Although not conclusive,
20

these estimates are consistent with the hypothesis that low-income defendants with children
are especially disadvantaged by the bail system.
6 Conclusion
Taken together, our results indicate a strong causal relationship between pretrial detention
and case outcomes. Across specifications and subgroups, we see consistent evidence that
detainees plead guilty more often to more serious o↵enses, and some evidence that they serve
longer sentences. The financially disadvantaged bear the brunt of these e↵ects, because the
majority of detainees are held after failing to post bail at relatively low levels. Our findings
suggest several policy avenues for improving the criminal justice system. Getting rid of money
bail entirely would eliminate the unfair disadvantage to individuals with limited financial
resources. This reform could, in theory, be implemented without changing the fraction of
defendants that are detained pretrial, but policymakers should seriously consider whether
the costs of the current detention rate outweigh the benefits. The main legal motivations for
pretrial detention are to ensure appearance at court and public safety. The optimal detention
rate is unlikely to be zero, but may be much lower than the status quo. Some parts of the
country have already implemented bail-reform measures. For example, D.C. has completely
eliminated money bail in favor of an “in or out” court system and enhanced pretrial services.
Only about 15% of accused persons are detained. Of those released, about 12% are re-
arrested pretrial, but fewer than 1% of these persons are alleged to have committed a violent
crime. About 88% return to court (Keenan, 2013). Avoiding costs associated with re-arrests
and failures to appear is an important benefit of pretrial detention, particularly for high-risk
individuals, but our analysis suggests policymakers will severely underestimate the costs of
detention if they do not figure in the e↵ect on case outcomes.
Although we explore the mechanism behind the e↵ects, additional work is needed to more
accurately pinpoint the relative importance of the di↵erent channels. Another open question
is how the e↵ects of pretrial detention on case outcomes vary as the marginal defendant
changes. Our results are local e↵ects based on current detention practices in New York City. If
21

the criminal justice system were to relax or tighten its criteria for pretrial detention, estimated
coe�cients would pick up e↵ects for a di↵erent set of marginal defendants. Understanding
how e↵ects vary across the distribution of defendants would be an important component in
determining optimal detention practices.
22

References
Aizer, A. and Doyle, J. J. (2015). Juvenile incarceration, human capital, and future crime:Evidence from randomly assigned judges. The Quarterly Journal of Economics, 130(2):759–803.
Ares, C. E., Rankin, A., and Sturz, H. (1963). Manhattan bail project: An interim reporton the use of pre-trial parole, the. NYUL rev., 38:67.
Barry, J. (2014). Criminal court of the city of new york: 2014 annual report. Technicalreport, O�ce of the Chief Clerk of New York City Criminal Court.
Belloni, A., Chen, D., Chernozhukov, V., and Hansen, C. (2012). Sparse models and methodsfor optimal instruments with an application to eminent domain. Econometrica, 80(6):2369–2429.
Gupta, A., Hansman, C., and Frenchman, E. (2016). The heavy costs of high bail: Evidencefrom judge randomization. Columbia Law and Economics Working Paper, (531).
Holder, E. (2011). Attorney general eric holder speaks at the national symposium on pretrialjustice.
Imbens, G. W. and Angrist, J. D. (1994). Identification and estimation of local averagetreatment e↵ects. Econometrica, 62(2):467–475.
Keenan, C. T. (2013). We ned more bail reform. Technical report, Pretrial Services Agencyfor the District of Columbia.
Kellough, G. and Wortley, S. (2002). Remand for plea. bail decisions and plea bargaining ascommensurate decisions. British Journal of Criminology, 42(1):186–210.
Kling, J. R. (2006). Incarceration length, employment, and earnings. The American Economic
Review, 96(3):863.
Leiber, M. J. and Fox, K. C. (2005). Race and the impact of detention on juvenile justicedecision making. Crime & Delinquency, 51(4):470–497.
Livingston, G. (2013). The rise of single fathers: A ninefold increase since 1960. PewResearch Center.
Mueller-Smith, M. (2014). The criminal and labor market impacts of incarceration. Septem-
ber). URL: http://www. columbia. edu/mgm2146/incar. pdf.
Phillips, M. T. (2008). Pretrial detention and case outcomes, part 2: Felony cases. CJA,New York City Criminal Justice Agency, Incorporated.
Phillips, M. T. (2012). Decade of bail research in new york city.
Rankin, A. (1964). E↵ect of pretrial detention, the. NYUL Rev., 39:641.
Reaves, B. A. (2013). Felony defendants in large urban counties, 2009 - statistical tables.Technical Report NCJ 243777, Bureau of Justice Statistics.
23

Stevenson, M. (2016). Distortion of justice. Working Paper.
Wagner, P. (2015). Jails matter. but who is listening?
Wagner, P. and Sakala, L. (2014). Mass incarceration: the whole pie. Northampton, MA:
Prison Policy Initiative.
Williams, M. R. (2003). The e↵ect of pretrial detention on imprisonment decisions. Criminal
Justice Review, 28(2):299–316.
24
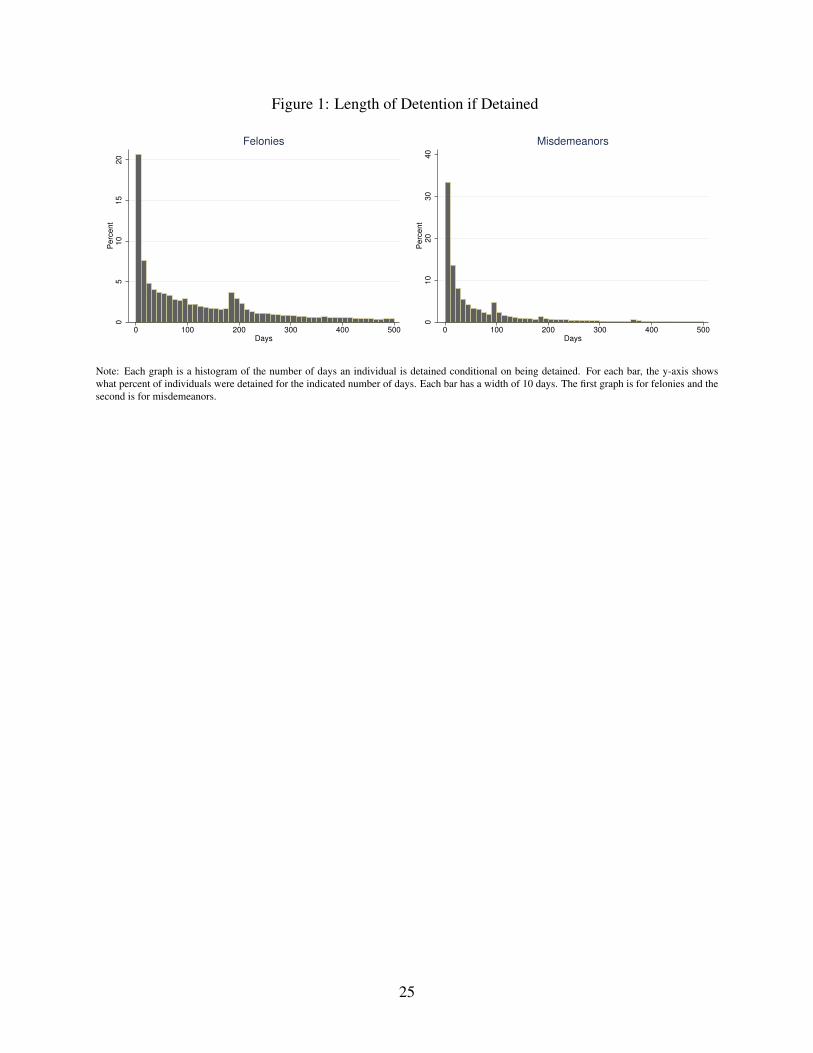
Figure 1: Length of Detention if Detained0
51
01
52
0P
erc
en
t
0 100 200 300 400 500Days
Felonies
01
02
03
04
0P
erc
en
t
0 100 200 300 400 500Days
Misdemeanors
Note: Each graph is a histogram of the number of days an individual is detained conditional on being detained. For each bar, the y-axis showswhat percent of individuals were detained for the indicated number of days. Each bar has a width of 10 days. The first graph is for felonies and thesecond is for misdemeanors.
25
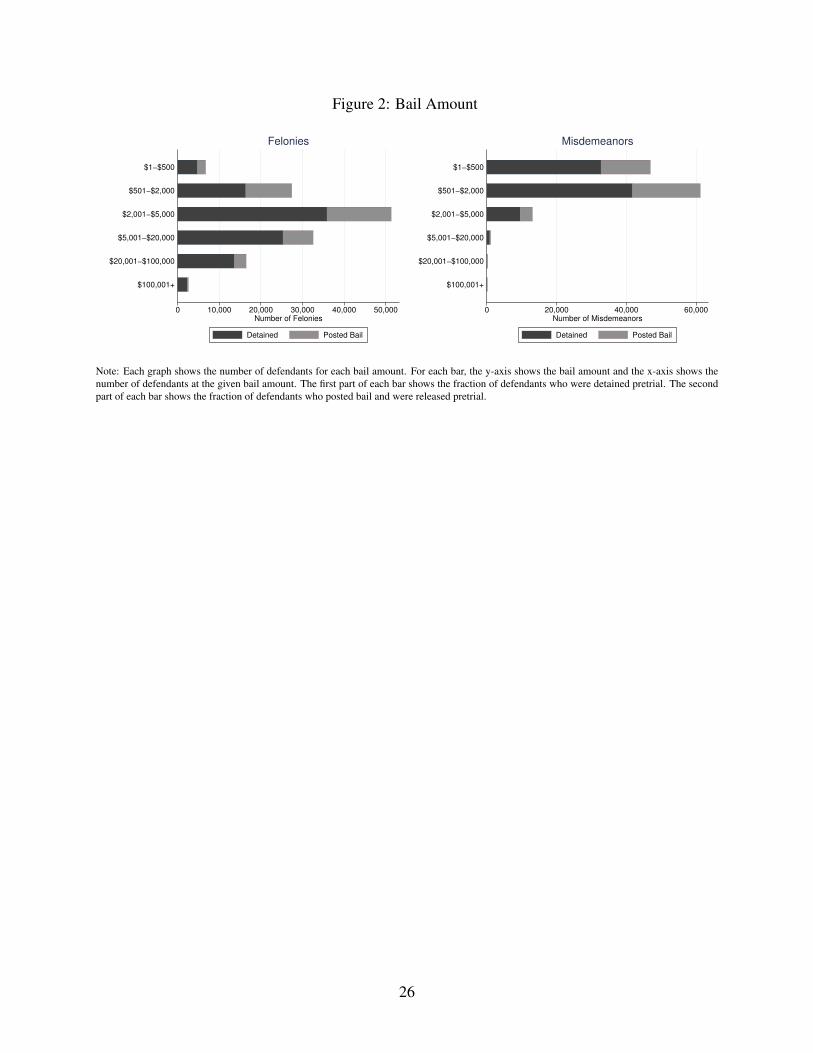
Figure 2: Bail Amount
0 10,000 20,000 30,000 40,000 50,000Number of Felonies
$100,001+
$20,001−$100,000
$5,001−$20,000
$2,001−$5,000
$501−$2,000
$1−$500
Felonies
Detained Posted Bail
0 20,000 40,000 60,000Number of Misdemeanors
$100,001+
$20,001−$100,000
$5,001−$20,000
$2,001−$5,000
$501−$2,000
$1−$500
Misdemeanors
Detained Posted Bail
Note: Each graph shows the number of defendants for each bail amount. For each bar, the y-axis shows the bail amount and the x-axis shows thenumber of defendants at the given bail amount. The first part of each bar shows the fraction of defendants who were detained pretrial. The secondpart of each bar shows the fraction of defendants who posted bail and were released pretrial.
26

Figure 3: Fraction Who Plead Guilty and Dismissed at Arraignment by Crime Type
0 20 40 60 80 100Percent of Felonies
Fraud
DUI
Theft
Forgery
Simple Assault
Weapon
Burglary
Larceny
Aggravated Assault
Drug Possession
Robbery
Drug Sales
Felonies
Plead Guilty Dismissed
Not Adjudicated
0 20 40 60 80 100Percent of Misdemeanors
Forgery
Drug Sales
Aggravated Assault
Criminal Mischief
DUI
Weapon
Larceny
Fraud
Other
Simple Assault
Drug Possession
Misdemeanors
Plead Guilty Dismissed
Not Adjudicated
Note: Each graph shows the percent of defendants who plead guilty, had their case dismissed, or did not have their case adjudicated at thearraignment for different crime types. For each bar, the x-axis shows the percent of arraignments that were adjudicated and the y-axis shows thecrime type. The first part of each bar shows the percent of arraignments in which the defendant plead guilty at the arraignment. The second partof each bar shows the percent of arraignments in which the case was dismissed at the arraignment. The third part of each bar shows the percent ofarraignments that were not adjudicated at the arraignment.
27

Figure 4: IV Scatterplots−
.2−
.10
.1.2
Co
nvic
ted
Re
sid
ua
ls
−.2 −.1 0 .1 .2
Detained Residuals
Felonies: Convicted
−.2
−.1
0.1
.2P
lea
d G
uilt
y R
esi
du
als
−.2 −.1 0 .1 .2Detained Residuals
Felonies: Plead Guilty
−.1
−.0
50
.05
.1
Co
nvic
ted
Re
sid
ua
ls
−.1 −.05 0 .05 .1
Detained Residuals
Misdemeanors: Convicted
−.1
−.0
50
.05
.1P
lea
d G
uilt
y R
esi
du
als
−.1 −.05 0 .05 .1Detained Residuals
Misdemeanors: Plead Guilty
Note: Each graph plots judge-specific outcome residuals by judge-specific detention residuals. The y-axis represents conviction or plead guiltyresiduals created by regressing the indicated outcome variable on demographic, criminal history, and time and courtroom fixed effects controls.Similarly, the x-axis represents detention residuals created by regressing the detained variable on demographic, criminal history, and time andcourtroom fixed effects controls. Each point of the graph represents the average outcome residual and detention residual for a given judge. Theblack line is the fitted linear regression through these points.
28
Figure 5: Time to Conviction for Plead Guilty Cases by Detainment Status0
50
10
01
50
20
02
50
30
03
50
Me
dia
n A
rra
ign
me
nt
to C
on
vict
ion
in D
ays
0 500 1000 1500Predicted Sentence Length in Days
Detained Not Detained
Felonies
05
01
00
15
02
00
25
03
00
35
0M
ed
ian
Arr
aig
nm
en
t to
Co
nvi
ctio
n in
Da
ys
0 10 20 30 40Predicted Sentence Length in Days
Detained Not Detained
Misdemeanors
Note: Each graph shows the median number of days from arraignment to conviction for cases in which the defendant pleads guilty. Each pointsrepresents the median for the corresponding bin.
29
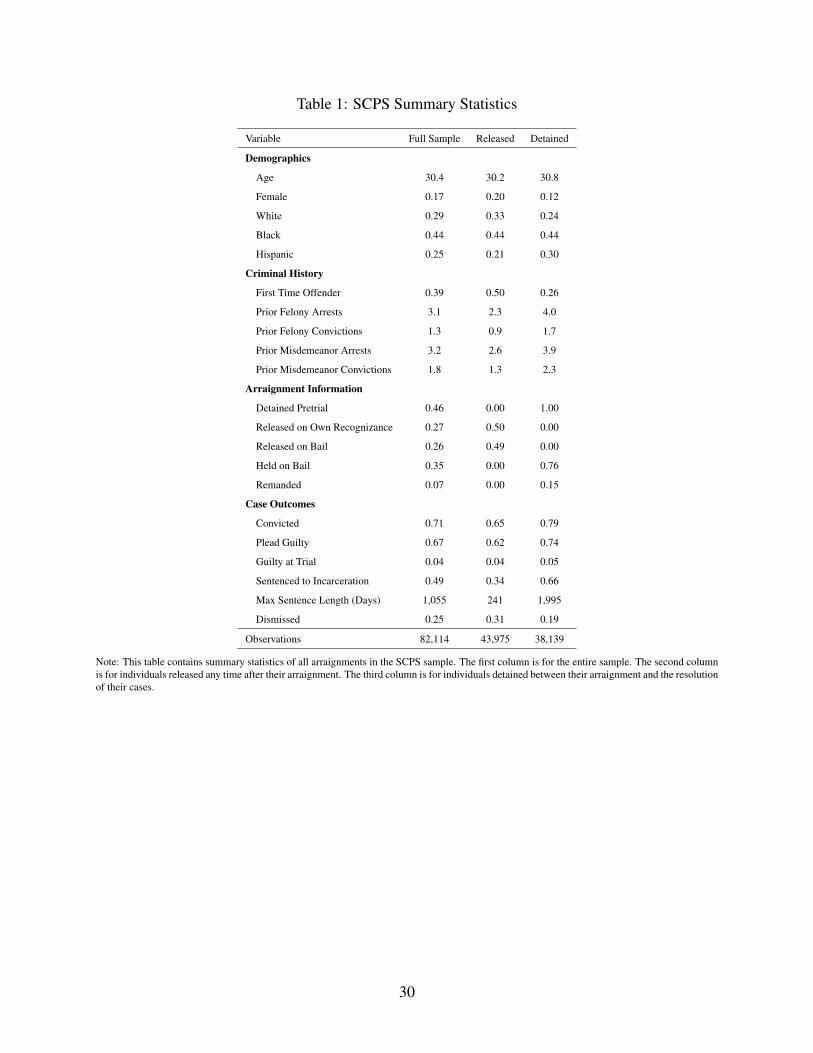
Table 1: SCPS Summary Statistics
Variable Full Sample Released Detained
Demographics
Age 30.4 30.2 30.8
Female 0.17 0.20 0.12
White 0.29 0.33 0.24
Black 0.44 0.44 0.44
Hispanic 0.25 0.21 0.30
Criminal History
First Time Offender 0.39 0.50 0.26
Prior Felony Arrests 3.1 2.3 4.0
Prior Felony Convictions 1.3 0.9 1.7
Prior Misdemeanor Arrests 3.2 2.6 3.9
Prior Misdemeanor Convictions 1.8 1.3 2.3
Arraignment Information
Detained Pretrial 0.46 0.00 1.00
Released on Own Recognizance 0.27 0.50 0.00
Released on Bail 0.26 0.49 0.00
Held on Bail 0.35 0.00 0.76
Remanded 0.07 0.00 0.15
Case Outcomes
Convicted 0.71 0.65 0.79
Plead Guilty 0.67 0.62 0.74
Guilty at Trial 0.04 0.04 0.05
Sentenced to Incarceration 0.49 0.34 0.66
Max Sentence Length (Days) 1,055 241 1,995
Dismissed 0.25 0.31 0.19
Observations 82,114 43,975 38,139
Note: This table contains summary statistics of all arraignments in the SCPS sample. The first column is for the entire sample. The second columnis for individuals released any time after their arraignment. The third column is for individuals detained between their arraignment and the resolutionof their cases.
30

Table 2: NYC Summary Statistics
Felonies MisdemeanorsAll
Arraignments
Variable Released Detained Released Detained
Demographics
Age 31.0 32.5 31.6 35.4 31.9
Female 0.20 0.10 0.19 0.13 0.17
White 0.13 0.08 0.14 0.10 0.13
Black 0.46 0.56 0.46 0.59 0.48
Hispanic 0.35 0.34 0.34 0.29 0.34
Criminal History
First Time Offender 0.68 0.36 0.66 0.24 0.59
Prior Felony Arrests 2.2 5.5 2.2 6.8 2.9
Prior Misdemeanor Arrests 3.0 7.6 3.8 13.2 5.0
Prior Felony Convictions 0.4 1.2 0.4 1.3 0.6
Prior Misdemeanor Convictions 1.4 5.2 1.8 10.1 2.9
Sex Offender 0.01 0.02 0.01 0.02 0.01
Arraignment Information
Detained Pretrial 0.00 1.00 0.00 1.00 0.20
Released on Own Recognizance 0.72 0.00 0.94 0.00 0.72
Released on Bail 0.28 0.00 0.06 0.00 0.08
Held on Bail 0.00 0.93 0.00 0.95 0.19
Remanded 0.00 0.07 0.00 0.05 0.01
Number of Counts 1.4 1.2 1.1 1.1 1.1
Case Outcomes
Convicted 0.64 0.79 0.65 0.81 0.68
Plead Guilty 0.59 0.70 0.63 0.77 0.64
Dismissed 0.33 0.18 0.34 0.19 0.31
Went to Trial 0.01 0.02 0.00 0.00 0.01
Sentenced to Incarceration 0.11 0.53 0.04 0.50 0.15
Charge Reduction 0.84 0.72 0.79 0.33 0.74
Min Sentence Length (Days) 71 400 15 35 66
Max Sentence Length (Days) 85 532 15 37 83
Observations 139,801 105,259 639,141 89,614 973,815
Note: This table contains summary statistics of all arraignments in the NYC DCJS sample. The first two columns are for felonies, the third andfourth columns are for misdemeanors, and the last column is for the entire sample. The first and third columns are for individuals released any timeafter their arraignment. The second and fourth columns are for individuals detained between their arraignment and the resolution of their cases.
31

Table 3: Test for Judge Random Assignment
Felonies Misdemeanors
Variable Predicted Actual Predicted Actual
Detained 1.44 10.36 1.26 19.29
Released on Own Recognizance 1.39 19.80 5.46 18.35
Set Bail 1.39 19.18 1.54 30.90
Remanded 1.46 3.22 1.49 6.63
Note: Each cell in the table reports the F statistic when testing for the joint significance of the judge binary variables for the indicated outcomevariable conditional on courthouse by time of year by arraignment shift fixed effects. For the first and third columns, the outcome variables are thepredicted values for the indicated variables in the variable column that are obtained from a regression of the indicated variable on demographic,criminal history, and courthouse by time of year by arraignment shift fixed effects controls. The second and fourth columns test for the jointsignificance of the judge binary variables when the actual (not predicted) indicated variables are the outcome variables.
32

Table 4: OLS Specifications for SCPS Data
Felonies
Variables (1) (2) (3) (4)
Panel A: Conviction
Detained 0.136*** 0.097*** 0.097*** 0.086***
(0.003) (0.003) (0.003) (0.003)
Panel B: Plead Guilty
Detained 0.121*** 0.082*** 0.083*** 0.073***
(0.003) (0.003) (0.003) (0.003)
Panel C: Maximum Sentence Length (Days)
Detained 1769*** 1083*** 1018*** 903***
(118.3) (93.4) (92.3) (96.9)
County, Year, Offense FE X X X
Demographics X X
Criminal History X
Observations 81,332 81,332 81,332 81,332
Note: Table 4 shows estimates of the coefficient on the binary variable detained when the indicated outcome variable is regressed on detained andthe indicated controls for the SCPS data. Column 1 contains no controls. Column 2 includes county, year, and offense fixed effects. Column 3 addsdemographic controls. Column 4 adds criminal history controls. *** Significant at the 1% level. ** Significant at the 5% level. * Significant at the10% level.
33

Table 5: OLS Specifications for NYC Data
Felonies Misdemeanors
Variables (1) (2) (3) (4) (5) (6) (7) (8)
Panel A: Conviction
Detained 0.144*** 0.150*** 0.149*** 0.149*** 0.152*** 0.161*** 0.143*** 0.100***
(0.002) (0.002) (0.002) (0.002) (0.002) (0.002) (0.002) (0.002)
Panel B: Plead Guilty
Detained 0.115*** 0.120*** 0.118*** 0.126*** 0.147*** 0.159*** 0.139*** 0.096***
(0.003) (0.003) (0.003) (0.003) (0.002) (0.002) (0.002) (0.002)
Panel C: Minimum Sentence Length (Days)
Detained 330*** 330*** 315*** 159*** 19*** 18*** 17*** 11***
(3.738) (3.900) (3.848) (3.060) (0.376) (0.384) (0.386) (0.427)
Time and Courtroom FE X X X X X X
Demographics X X X X
Criminal History X X
Observations 245,060 728,755
Note: Table 5 shows estimates of the coefficient on the binary variable detained when the indicated outcome variable is regressed on detained andthe indicated controls. Columns 1 and 5 contain no controls. Columns 2 and 6 include time and courtroom fixed effects. Columns 3 and 7 adddemographic controls. Columns 4 and 8 add criminal history controls. Standard errors clustered at the shift level are reported. *** Significant atthe 1% level. ** Significant at the 5% level. * Significant at the 10% level.
34
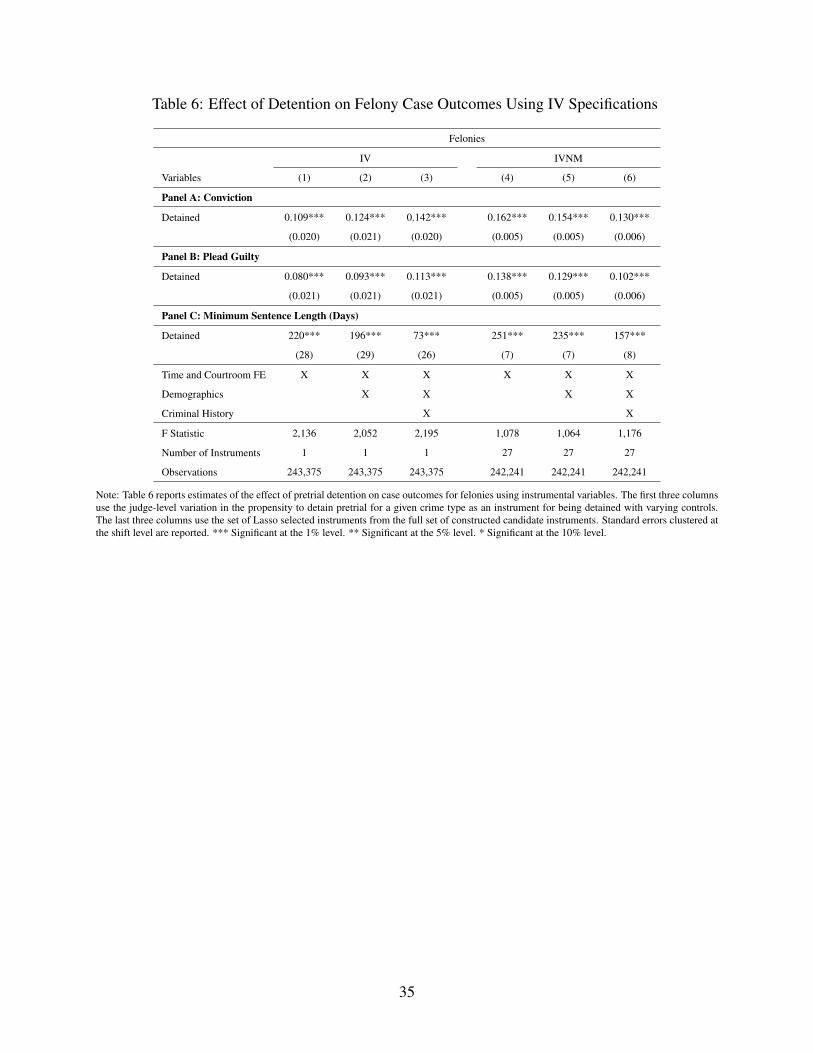
Table 6: Effect of Detention on Felony Case Outcomes Using IV Specifications
Felonies
IV IVNM
Variables (1) (2) (3) (4) (5) (6)
Panel A: Conviction
Detained 0.109*** 0.124*** 0.142*** 0.162*** 0.154*** 0.130***
(0.020) (0.021) (0.020) (0.005) (0.005) (0.006)
Panel B: Plead Guilty
Detained 0.080*** 0.093*** 0.113*** 0.138*** 0.129*** 0.102***
(0.021) (0.021) (0.021) (0.005) (0.005) (0.006)
Panel C: Minimum Sentence Length (Days)
Detained 220*** 196*** 73*** 251*** 235*** 157***
(28) (29) (26) (7) (7) (8)
Time and Courtroom FE X X X X X X
Demographics X X X X
Criminal History X X
F Statistic 2,136 2,052 2,195 1,078 1,064 1,176
Number of Instruments 1 1 1 27 27 27
Observations 243,375 243,375 243,375 242,241 242,241 242,241
Note: Table 6 reports estimates of the effect of pretrial detention on case outcomes for felonies using instrumental variables. The first three columnsuse the judge-level variation in the propensity to detain pretrial for a given crime type as an instrument for being detained with varying controls.The last three columns use the set of Lasso selected instruments from the full set of constructed candidate instruments. Standard errors clustered atthe shift level are reported. *** Significant at the 1% level. ** Significant at the 5% level. * Significant at the 10% level.
35

Table 7: Effect of Detention on Misdemeanor Case Outcomes Using IV Specifications
Misdemeanors
IV IVNM
Variables (1) (2) (3) (4) (5) (6)
Panel A: Conviction
Detained 0.192*** 0.179*** 0.077*** 0.198*** 0.166*** 0.074***
(0.027) (0.028) (0.020) (0.006) (0.006) (0.005)
Panel B: Plead Guilty
Detained 0.176*** 0.162*** 0.058*** 0.199*** 0.165*** 0.071***
(0.027) (0.028) (0.020) (0.006) (0.006) (0.005)
Panel C: Minimum Sentence Length (Days)
Detained 40*** 38*** 35*** 28*** 26*** 17***
(3) (3) (4) (1) (1) (1)
Time and Courtroom FE X X X X X X
Demographics X X X X
Criminal History X X
F Statistic 2,848 2,987 3,215 1,009 1,080 1,388
Number of Instruments 1 1 1 23 23 23
Observations 726,172 726,167 726,167 725,480 725,480 725,480
Note: Table 7 reports estimates of the effect of pretrial detention on case outcomes for misdemeanors using instrumental variables. The first threecolumns use the judge-level variation in the propensity to detain pretrial for a given crime type as an instrument for being detained with varyingcontrols. The last three columns use the set of Lasso selected instruments from the full set of constructed candidate instruments. Standard errorsclustered at the shift level are reported. *** Significant at the 1% level. ** Significant at the 5% level. * Significant at the 10% level.
36

Table 8: Effect of Detention on Charge Class Reduction
Felonies Misdemeanors
Predicted Incarceration Length OLS IV IVNM OLS IV IVNM
Detained -0.090*** -0.143*** -0.113*** -0.214*** -0.241*** -0.206***
(0.003) (0.022) (0.006) (0.002) (0.017) (0.006)
F Statistic - 1,438 848 - 2,824 1,130
Number of Instruments - 1 27 - 1 23
Observations 167,906 166,467 165,652 486,600 484,212 483,717
Note: Table 8 reports estimates of the effect of pretrial detention on a binary variable equal to 1 if the disposition charge level is lower than thearraignment charge level if convicted (e.g., moving from a class B felony to a class D felony). Columns 1 and 4 use the same specification ascolumns 4 and 8 of Table 5 and reports estimates from an OLS specification with all the baseline controls included. Columns 2 and 5 use the samespecification as column 3 of Tables 6 and 7 and reports estimates from an IV estimation that uses judge-level variation in the propensity to detainpretrial for a given crime type as an instrument. Columns 3 and 6 use the same specification as column 6 of Tables 6 and 7 and report estimatesfrom an IV estimation that uses the set of Lasso-selected instruments. Standard errors clustered at the shift level are reported. *** Significant at the1% level. ** Significant at the 5% level. * Significant at the 10% level.
37
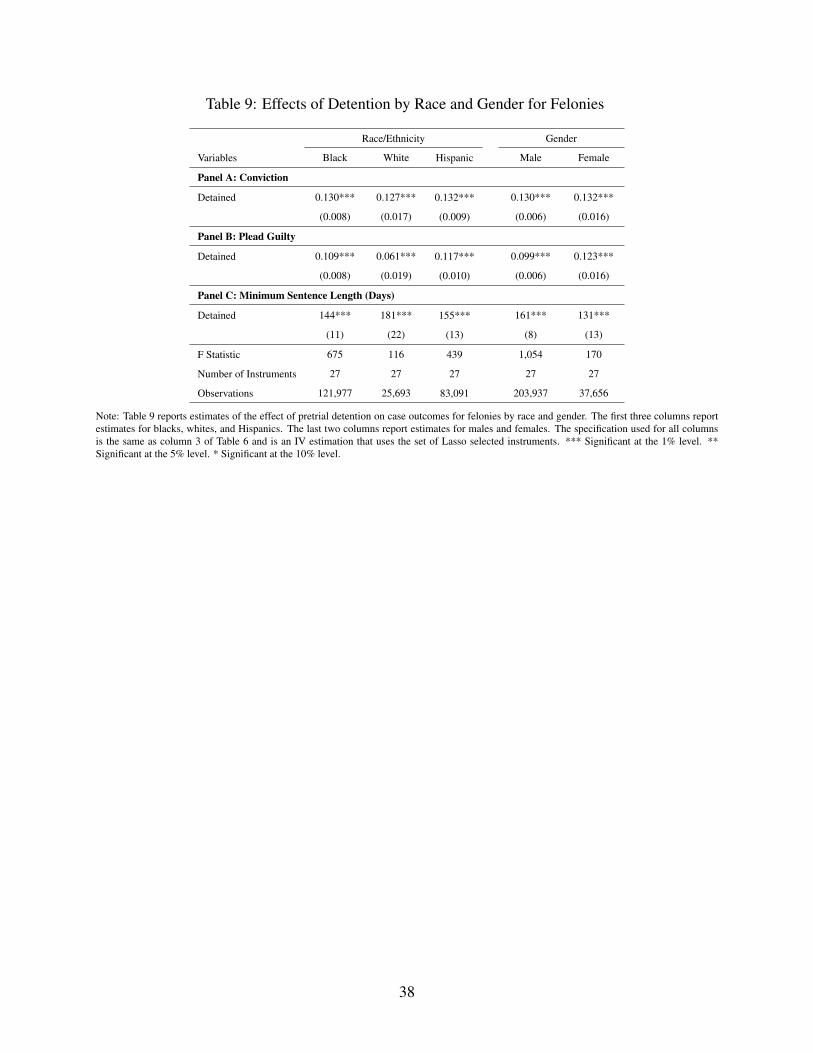
Table 9: Effects of Detention by Race and Gender for Felonies
Race/Ethnicity Gender
Variables Black White Hispanic Male Female
Panel A: Conviction
Detained 0.130*** 0.127*** 0.132*** 0.130*** 0.132***
(0.008) (0.017) (0.009) (0.006) (0.016)
Panel B: Plead Guilty
Detained 0.109*** 0.061*** 0.117*** 0.099*** 0.123***
(0.008) (0.019) (0.010) (0.006) (0.016)
Panel C: Minimum Sentence Length (Days)
Detained 144*** 181*** 155*** 161*** 131***
(11) (22) (13) (8) (13)
F Statistic 675 116 439 1,054 170
Number of Instruments 27 27 27 27 27
Observations 121,977 25,693 83,091 203,937 37,656
Note: Table 9 reports estimates of the effect of pretrial detention on case outcomes for felonies by race and gender. The first three columns reportestimates for blacks, whites, and Hispanics. The last two columns report estimates for males and females. The specification used for all columnsis the same as column 3 of Table 6 and is an IV estimation that uses the set of Lasso selected instruments. *** Significant at the 1% level. **Significant at the 5% level. * Significant at the 10% level.
38

Table 10: Effects of Detention by Race and Gender for Misdemeanor
Race/Ethnicity Gender
Variables Black White Hispanic Male Female
Panel A: Conviction
Detained 0.070*** 0.058*** 0.088*** 0.077*** 0.090***
(0.007) (0.018) (0.009) (0.005) (0.013)
Panel B: Plead Guilty
Detained 0.068*** 0.055*** 0.084*** 0.074*** 0.093***
(0.007) (0.019) (0.010) (0.006) (0.014)
Panel C: Minimum Sentence Length (Days)
Detained 13*** 20*** 23*** 17*** 14***
(2) (4) (2) (1) (4)
F Statistic 876 161 483 1,178 257
Number of Instruments 23 23 23 23 23
Observations 345,422 95,648 240,220 595,059 128,693
Note: Table 10 reports estimates of the effect of pretrial detention on case outcomes for misdemeanors by race and gender. The first three columnsreport estimates for blacks, whites, and Hispanics. The last two columns report estimates for males and females. The specification used for allcolumns is the same as column 3 of Table 7 and is an IV estimation that uses the set of Lasso selected instruments. *** Significant at the 1% level.** Significant at the 5% level. * Significant at the 10% level.
39

Table 11: Effects by Predicted Incarceration Length and Gender for Misdemeanors
Men Women
Predicted Incarceration Length OLS IV IVNM OLS IV IVNM
0 Days 0.016** -0.483* 0.023 0.118*** -0.819* 0.108*
(0.008) (0.253) (0.033) (0.014) (0.479) (0.058)
1-11 Days 0.103*** 0.173** 0.053*** 0.148*** 0.279** 0.058
(0.004) (0.078) (0.017) (0.010) (0.126) (0.037)
11+ Days 0.104*** 0.083*** 0.084*** 0.106*** 0.150*** 0.051***
(0.002) (0.019) (0.006) (0.007) (0.048) (0.016)
Note: Table 11 reports estimates of the effect of pretrial detention on conviction for misdemeanors by the predicted length of incarceration ifconvicted and by gender. Columns 1 and 4 use the same specification as column 8 of Table 5 and reports estimates from an OLS specification withall the baseline controls included. Columns 2 and 5 use the same specification as column 3 of Table 7 and reports estimates from an IV estimationthat uses judge-level variation in the propensity to detain pretrial for a given crime type as an instrument. Columns 3 and 6 use the same specificationas column 6 of Table 7 and reports estimates from an IV estimation that uses the set of Lasso selected instruments. Corresponding estimates forfelonies are shown in Table A.11. Standard errors clustered at the shift level are reported. *** Significant at the 1% level. ** Significant at the 5%level. * Significant at the 10% level.
40

Figure A.1: Most Common Types of Offenses0
51
01
5P
erc
en
t o
f F
elo
nie
s
Drug Sales
Robbery
Drug Possession
Aggravated Assault
Larceny
Burglary
Weapon
Simple Assault
Forgery
Theft
Felonies
01
02
03
0P
erc
en
t o
f M
isd
em
ea
no
rs
Drug Possession
Simple Assault
Fraud
Larceny
Weapon
DUI
Crim
inal Mischief
Aggravated Assault
Drug Sales
Forgery
Misdemeanors
Note: Each graph shows the most common types of offenses. For each bar, the y-axis shows what percent of offenses were of the indicated type.The first graph is for felonies and the second is for misdemeanors.
41
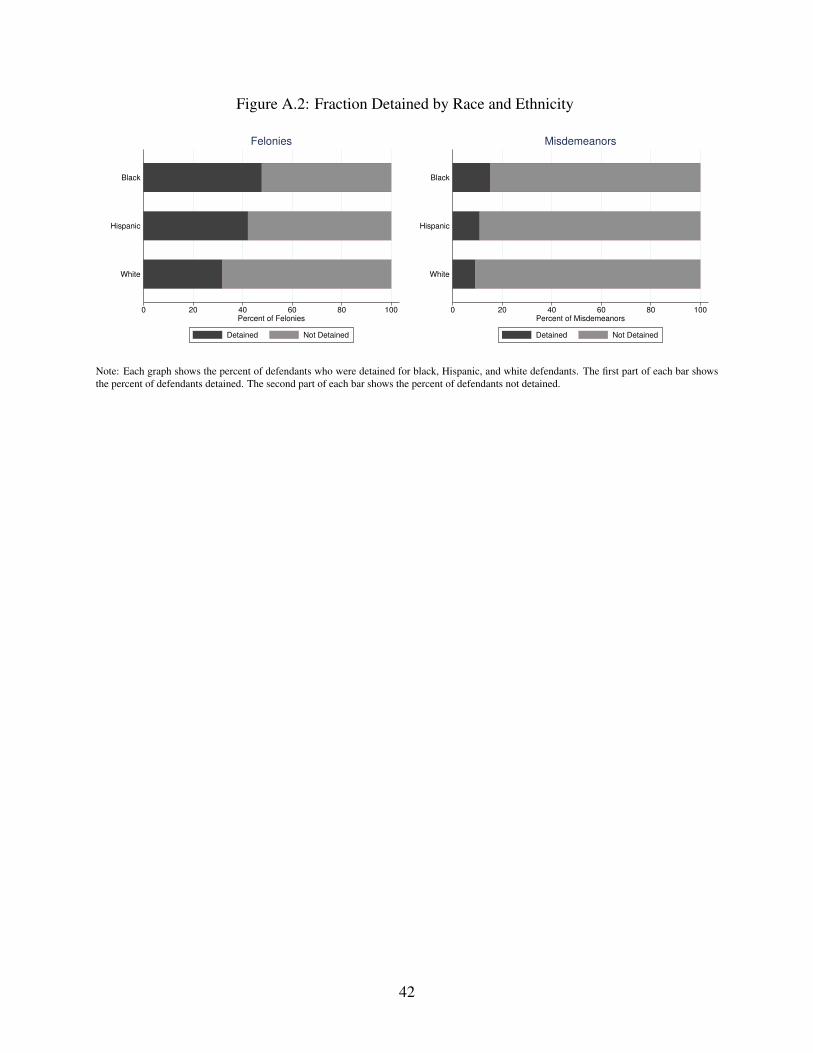
Figure A.2: Fraction Detained by Race and Ethnicity
0 20 40 60 80 100Percent of Felonies
White
Hispanic
Black
Felonies
Detained Not Detained
0 20 40 60 80 100Percent of Misdemeanors
White
Hispanic
Black
Misdemeanors
Detained Not Detained
Note: Each graph shows the percent of defendants who were detained for black, Hispanic, and white defendants. The first part of each bar showsthe percent of defendants detained. The second part of each bar shows the percent of defendants not detained.
42
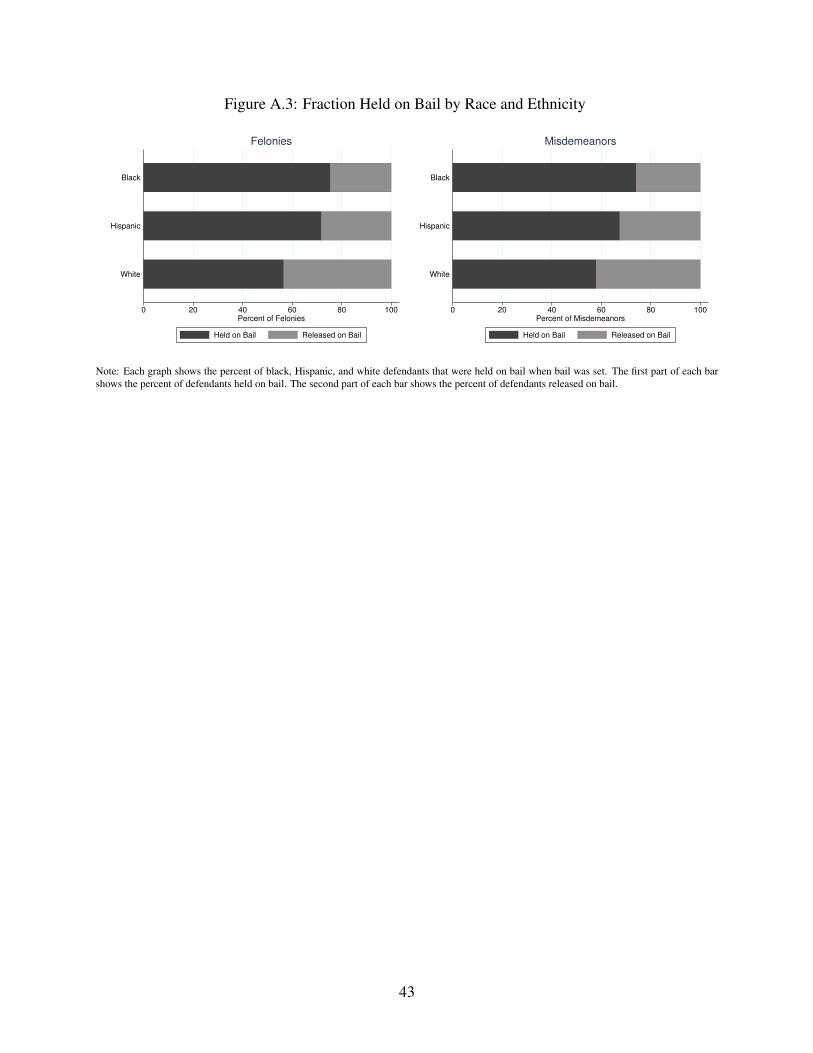
Figure A.3: Fraction Held on Bail by Race and Ethnicity
0 20 40 60 80 100Percent of Felonies
White
Hispanic
Black
Felonies
Held on Bail Released on Bail
0 20 40 60 80 100Percent of Misdemeanors
White
Hispanic
Black
Misdemeanors
Held on Bail Released on Bail
Note: Each graph shows the percent of black, Hispanic, and white defendants that were held on bail when bail was set. The first part of each barshows the percent of defendants held on bail. The second part of each bar shows the percent of defendants released on bail.
43

Table A.1: Five Strongest Selected Instruments for IVNM Specification
Variable Weight
Panel A: Felonies
Crime Type 0.111
Crime Type " Number of Counts 0.076
Crime Type " Prior Felony Convictions 0.062
Crime Type " First Time Offender 0.052
Crime Type " Prior Felony Arrests 0.045
Panel A: Misdemeanors
Crime Type 0.067
Crime Type " Number of Counts 0.052
Crime Type " Prior Misdemeanor Convictions 0.042
Crime Type " First Time Offender 0.036
Crime Type " Prior Felony Convictions 0.035
Note: This tables reports the five strongest predictors of pretrial detention selected by Lasso from the set of all candidate interactions. Due to thediffering degree of variance for each interaction, the instruments are each normalized to mean zero and standard deviation one (Mueller-Smith,2014). Crime type interacted with a defendant’s criminal history are the characteristics over which judges tend to exhibit the largest differences.
44

Table A.2: Test for Judge Random Assignment by Covariate
Variable Felonies Misdemeanors
Outcomes
Detained Pretrial 10.36 19.29
Released on Own Recognizance 19.80 18.35
Set Bail 19.18 30.90
Remanded 3.22 6.63
Demographics
Age 1.47 1.30
Female 1.18 2.73
White 1.19 1.20
Black 1.45 1.58
Hispanic 1.56 1.39
Criminal History
Sex Offender 0.96 1.07
First Time Offender 1.45 1.19
Prior Felony Arrests 1.38 1.18
Prior Misdemeanor Arrests 1.63 1.24
Prior Felony Convictions 1.30 1.05
Prior Misdemeanor Convictions 1.58 1.17
Number of Counts 1.62 0.82
Note: Each cell in the table reports the F statistic when testing for the joint significance of the judge binary variables for the indicated outcomevariable conditional on courthouse by time of year by arraignment shift fixed effects. The first column is for felonies and the second column is formisdemeanors.
45
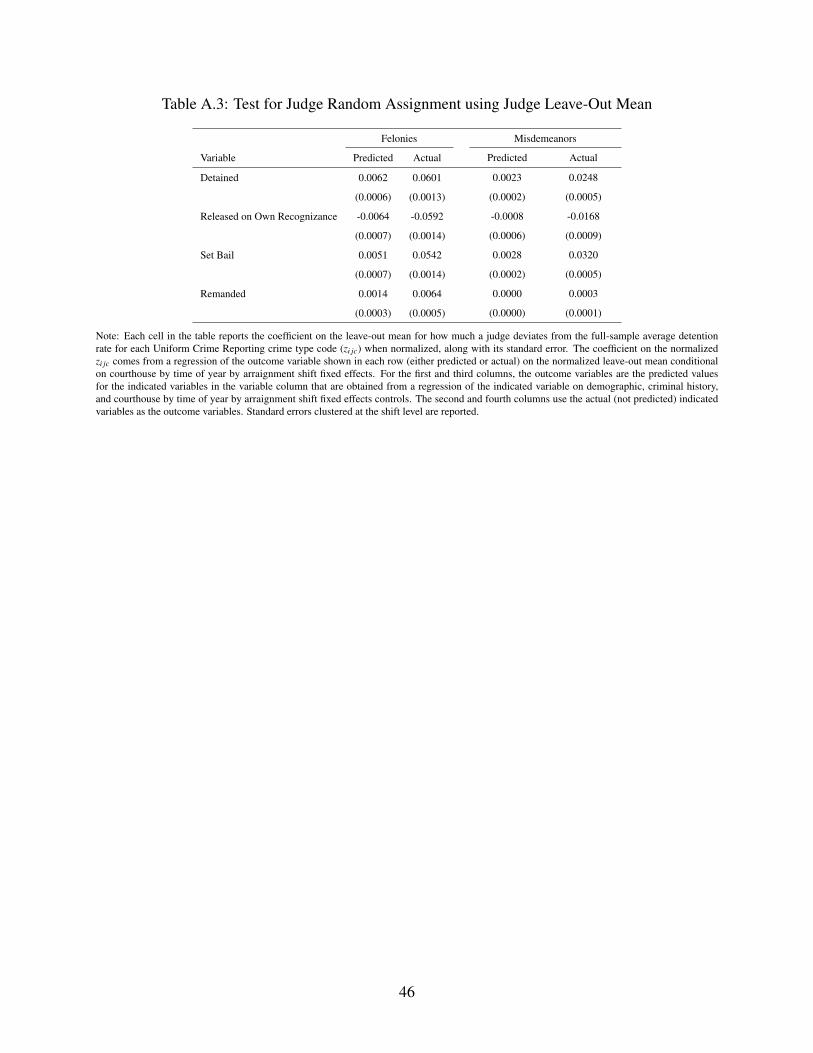
Table A.3: Test for Judge Random Assignment using Judge Leave-Out Mean
Felonies Misdemeanors
Variable Predicted Actual Predicted Actual
Detained 0.0062 0.0601 0.0023 0.0248
(0.0006) (0.0013) (0.0002) (0.0005)
Released on Own Recognizance -0.0064 -0.0592 -0.0008 -0.0168
(0.0007) (0.0014) (0.0006) (0.0009)
Set Bail 0.0051 0.0542 0.0028 0.0320
(0.0007) (0.0014) (0.0002) (0.0005)
Remanded 0.0014 0.0064 0.0000 0.0003
(0.0003) (0.0005) (0.0000) (0.0001)
Note: Each cell in the table reports the coefficient on the leave-out mean for how much a judge deviates from the full-sample average detentionrate for each Uniform Crime Reporting crime type code (zi jc) when normalized, along with its standard error. The coefficient on the normalizedzi jc comes from a regression of the outcome variable shown in each row (either predicted or actual) on the normalized leave-out mean conditionalon courthouse by time of year by arraignment shift fixed effects. For the first and third columns, the outcome variables are the predicted valuesfor the indicated variables in the variable column that are obtained from a regression of the indicated variable on demographic, criminal history,and courthouse by time of year by arraignment shift fixed effects controls. The second and fourth columns use the actual (not predicted) indicatedvariables as the outcome variables. Standard errors clustered at the shift level are reported.
46

Table A.4: Effect of Detention on Felony Case Outcomes Using Judge FE IV
Felonies
Variables (1) (2) (3) (4) (5) (6)
Panel A: Conviction
Detained 0.098*** 0.100*** 0.101*** 0.116*** 0.148*** 0.143***
(0.024) (0.024) (0.023) (0.014) (0.011) (0.011)
Panel B: Plead Guilty
Detained 0.111*** 0.112*** 0.118*** 0.122*** 0.179*** 0.164***
(0.025) (0.025) (0.024) (0.015) (0.012) (0.011)
Panel C: Minimum Sentence Length (Days)
Detained 28 19 -3 110*** 109*** 114***
(31) (31) (27) (20) (15) (14)
Time and Courtroom FE X X X X X X
Demographics X X X X X
Criminal History X X X X
Judge by Criminal History X X X
Judge by Top 5 Crimes X X
Judge by Race and Gender X
F Statistic 9.96 11.27 11.28 5.98 4.49 3.54
Number of Instruments 212 212 212 843 1,891 2,728
Observations 244,221 244,221 244,221 244,221 244,221 244,221
Note: Table A.4 reports estimates of the effect of pretrial detention on case outcomes for felonies using instrumental variables. The first threecolumns use the judge binary variables as instruments for being detained with varying controls. The instruments used for column 4 are judge binaryvariables interacted with the number of prior felony convictions, prior misdemeanor convictions, and a binary variable for being a first time offender.Column 5 adds the interactions of the judge binary variables and the binary variables for the top five crime types as instruments. Column 6 adds theinteractions of the judge binary variables and the binary variables for black, white, Hispanic, and female as instruments. Standard errors clusteredat the shift level are reported. *** Significant at the 1% level. ** Significant at the 5% level. * Significant at the 10% level.
47

Table A.5: Effect of Detention on Misdemeanor Case Outcomes Using Judge FE IV
Misdemeanors
Variables (1) (2) (3) (4) (5) (6)
Panel A: Conviction
Detained 0.174*** 0.165*** 0.152*** 0.091*** 0.086*** 0.080***
(0.028) (0.027) (0.025) (0.010) (0.009) (0.009)
Panel B: Plead Guilty
Detained 0.203*** 0.195*** 0.184*** 0.099*** 0.088*** 0.080***
(0.028) (0.028) (0.025) (0.010) (0.009) (0.009)
Panel C: Minimum Sentence Length (Days)
Detained -6 -7 -8* 21*** 23*** 22***
(5) (5) (5) (2) (2) (2)
Time and Courtroom FE X X X X X X
Demographics X X X X X
Criminal History X X X X
Judge by Criminal History X X X
Judge by Top 5 Crimes X X
Judge by Race and Gender X
F Statistic 14.20 14.35 15.34 26.98 14.01 10.23
Number of Instruments 212 212 212 845 1,900 2,744
Observations 726,785 726,780 726,780 726,780 726,780 726,780
Note: Table A.5 reports estimates of the effect of pretrial detention on case outcomes for misdemeanors using instrumental variables. The firstthree columns use the judge binary variables as instruments for being detained with varying controls. The instruments used for column 4 are judgebinary variables interacted with the number of prior felony convictions, prior misdemeanor convictions, and a binary variable for being a first-timeoffender. Column 5 adds the interactions of the judge binary variables and the binary variables for the top five crime types as instruments. Column6 adds the interactions of the judge binary variables and the binary variables for black, white, Hispanic, and female as instruments. Standard errorsclustered at the shift level are reported. *** Significant at the 1% level. ** Significant at the 5% level. * Significant at the 10% level.
48
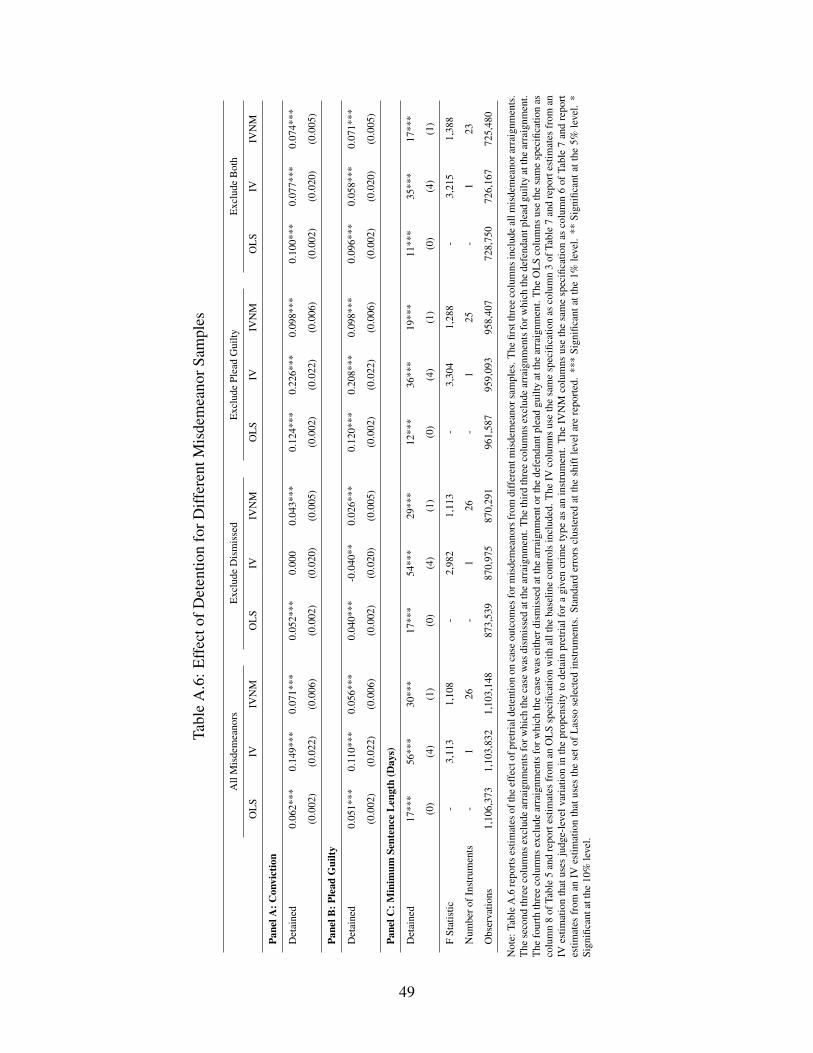
Tabl
eA
.6:E
ffec
tofD
eten
tion
forD
iffer
entM
isde
mea
norS
ampl
es
All
Mis
dem
eano
rsEx
clud
eD
ism
isse
dEx
clud
ePl
ead
Gui
ltyEx
clud
eB
oth
OLS
IVIV
NM
OLS
IVIV
NM
OLS
IVIV
NM
OLS
IVIV
NM
Pane
lA:C
onvi
ctio
n
Det
aine
d0.
062*
**0.
149*
**0.
071*
**0.
052*
**0.
000
0.04
3***
0.12
4***
0.22
6***
0.09
8***
0.10
0***
0.07
7***
0.07
4***
(0.0
02)
(0.0
22)
(0.0
06)
(0.0
02)
(0.0
20)
(0.0
05)
(0.0
02)
(0.0
22)
(0.0
06)
(0.0
02)
(0.0
20)
(0.0
05)
Pane
lB:P
lead
Gui
lty
Det
aine
d0.
051*
**0.
110*
**0.
056*
**0.
040*
**-0
.040
**0.
026*
**0.
120*
**0.
208*
**0.
098*
**0.
096*
**0.
058*
**0.
071*
**
(0.0
02)
(0.0
22)
(0.0
06)
(0.0
02)
(0.0
20)
(0.0
05)
(0.0
02)
(0.0
22)
(0.0
06)
(0.0
02)
(0.0
20)
(0.0
05)
Pane
lC:M
inim
umSe
nten
ceLe
ngth
(Day
s)
Det
aine
d17
***
56**
*30
***
17**
*54
***
29**
*12
***
36**
*19
***
11**
*35
***
17**
*
(0)
(4)
(1)
(0)
(4)
(1)
(0)
(4)
(1)
(0)
(4)
(1)
FSt
atis
tic-
3,11
31,
108
-2,
982
1,11
3-
3,30
41,
288
-3,
215
1,38
8
Num
bero
fIns
trum
ents
-1
26-
126
-1
25-
123
Obs
erva
tions
1,10
6,37
31,
103,
832
1,10
3,14
887
3,53
987
0,97
587
0,29
196
1,58
795
9,09
395
8,40
772
8,75
072
6,16
772
5,48
0
Not
e:Ta
ble
A.6
repo
rtses
timat
esof
the
effe
ctof
pret
riald
eten
tion
onca
seou
tcom
esfo
rmis
dem
eano
rsfr
omdi
ffer
entm
isde
mea
nors
ampl
es.T
hefir
stth
ree
colu
mns
incl
ude
allm
isde
mea
nora
rrai
gnm
ents
.Th
ese
cond
thre
eco
lum
nsex
clud
ear
raig
nmen
tsfo
rwhi
chth
eca
sew
asdi
smis
sed
atth
ear
raig
nmen
t.Th
eth
irdth
ree
colu
mns
excl
ude
arra
ignm
ents
forw
hich
the
defe
ndan
tple
adgu
ilty
atth
ear
raig
nmen
t.Th
efo
urth
thre
eco
lum
nsex
clud
ear
raig
nmen
tsfo
rwhi
chth
eca
sew
asei
ther
dism
isse
dat
the
arra
ignm
ento
rthe
defe
ndan
tple
adgu
ilty
atth
ear
raig
nmen
t.Th
eO
LSco
lum
nsus
eth
esa
me
spec
ifica
tion
asco
lum
n8
ofTa
ble
5an
dre
port
estim
ates
from
anO
LSsp
ecifi
catio
nw
ithal
lthe
base
line
cont
rols
incl
uded
.The
IVco
lum
nsus
eth
esa
me
spec
ifica
tion
asco
lum
n3
ofTa
ble
7an
dre
port
estim
ates
from
anIV
estim
atio
nth
atus
esju
dge-
leve
lvar
iatio
nin
the
prop
ensi
tyto
deta
inpr
etria
lfor
agi
ven
crim
ety
peas
anin
stru
men
t.Th
eIV
NM
colu
mns
use
the
sam
esp
ecifi
catio
nas
colu
mn
6of
Tabl
e7
and
repo
rtes
timat
esfr
oman
IVes
timat
ion
that
uses
the
seto
fLas
sose
lect
edin
stru
men
ts.
Stan
dard
erro
rscl
uste
red
atth
esh
iftle
vela
rere
porte
d.**
*Si
gnifi
cant
atth
e1%
leve
l.**
Sign
ifica
ntat
the
5%le
vel.
*Si
gnifi
cant
atth
e10
%le
vel.
49

Table A.7: Misdemeanor IV Estimates for Cases Types with Low Levels of Adjudication
Misdemeanors
IV IVNM
Variables (1) (2) (3) (4) (5) (6)
Panel A: Conviction
Detained 0.227*** 0.306*** 0.259*** 0.214*** 0.204*** 0.142***
(0.079) (0.080) (0.080) (0.012) (0.012) (0.014)
Panel B: Plead Guilty
Detained 0.238*** 0.315*** 0.272*** 0.217*** 0.206*** 0.142***
(0.079) (0.079) (0.079) (0.012) (0.012) (0.014)
Panel C: Minimum Sentence Length (Days)
Detained 6 4 0 25*** 24*** 15***
(15) (15) (16) (2) (2) (3)
Time and Courtroom FE X X X X X X
Demographics X X X X
Criminal History X X
F Statistic 380 360 379 201 213 237
Number of Instruments 1 1 1 23 23 23
Observations 215,755 215,751 215,751 215,727 215,727 215,727
Note: Table A.7 reports estimates of the effect of pretrial detention on case outcomes for DUI, simple assault, and aggravated assault misdemeanorsusing instrumental variables. The first three columns use the judge-level variation in the propensity to detain pretrial for a given crime type as aninstrument for being detained with varying controls. The last three columns use the set of Lasso selected instruments from the full set of constructedcandidate instruments. Standard errors clustered at the shift level are reported. *** Significant at the 1% level. ** Significant at the 5% level. *Significant at the 10% level.
50

Table A.8: Effects on Conviction by Predicted Incarceration Length for Felonies
Felonies
Predicted Incarceration Length OLS IV IVNM
0 Days 0.108*** 0.125** 0.102***
(0.006) (0.060) (0.014)
1-290 Days 0.142*** 0.119*** 0.114***
(0.004) (0.030) (0.008)
290+ Days 0.168*** 0.183*** 0.155***
(0.004) (0.028) (0.008)
Note: Table A.8 reports estimates of the effect of pretrial detention on conviction for felonies by the predicted length of incarceration if convicted.Column 1 uses the same specification as column 4 of Table 5 and reports estimates from an OLS specification with all the baseline controlsincluded. Column 2 uses the same specification as column 3 of Table 6 and reports estimates from an IV estimation that uses judge-level variationin the propensity to detain pretrial for a given crime type as an instrument. Column 3 uses the same specification as column 6 of Table 6 andreports estimates from an IV estimation that uses the set of Lasso selected instruments. Standard errors clustered at the shift level are reported. ***Significant at the 1% level. ** Significant at the 5% level. * Significant at the 10% level.
51
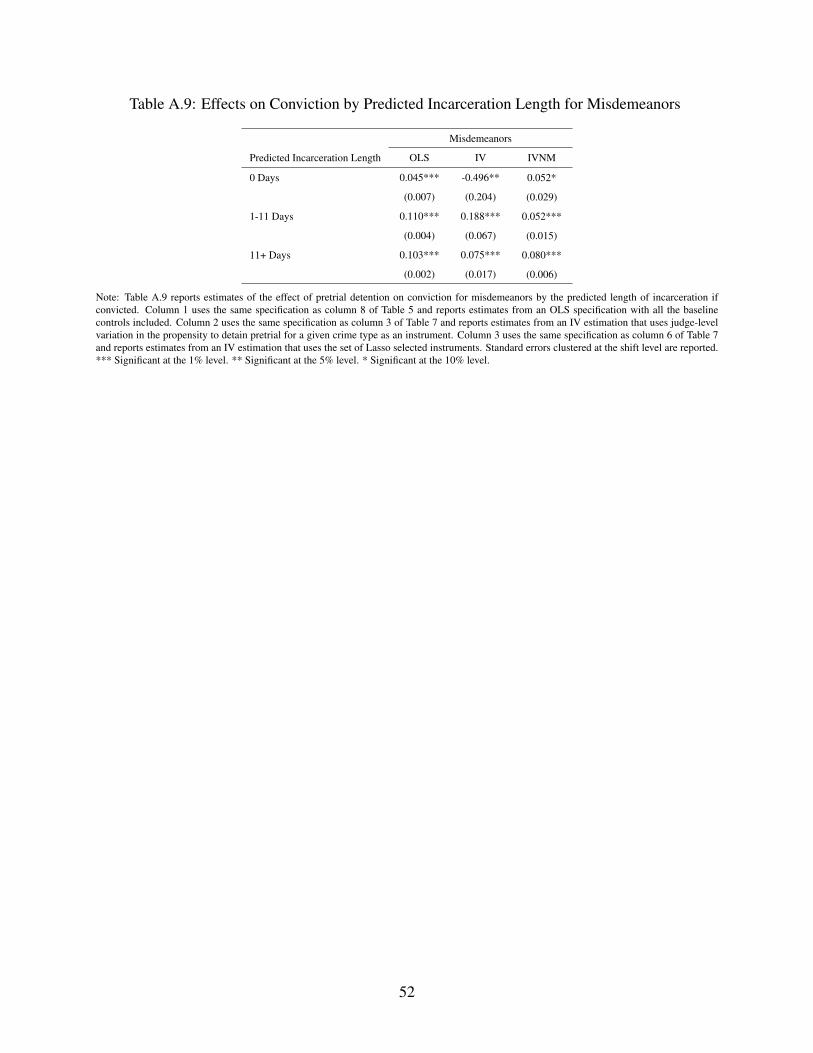
Table A.9: Effects on Conviction by Predicted Incarceration Length for Misdemeanors
Misdemeanors
Predicted Incarceration Length OLS IV IVNM
0 Days 0.045*** -0.496** 0.052*
(0.007) (0.204) (0.029)
1-11 Days 0.110*** 0.188*** 0.052***
(0.004) (0.067) (0.015)
11+ Days 0.103*** 0.075*** 0.080***
(0.002) (0.017) (0.006)
Note: Table A.9 reports estimates of the effect of pretrial detention on conviction for misdemeanors by the predicted length of incarceration ifconvicted. Column 1 uses the same specification as column 8 of Table 5 and reports estimates from an OLS specification with all the baselinecontrols included. Column 2 uses the same specification as column 3 of Table 7 and reports estimates from an IV estimation that uses judge-levelvariation in the propensity to detain pretrial for a given crime type as an instrument. Column 3 uses the same specification as column 6 of Table 7and reports estimates from an IV estimation that uses the set of Lasso selected instruments. Standard errors clustered at the shift level are reported.*** Significant at the 1% level. ** Significant at the 5% level. * Significant at the 10% level.
52
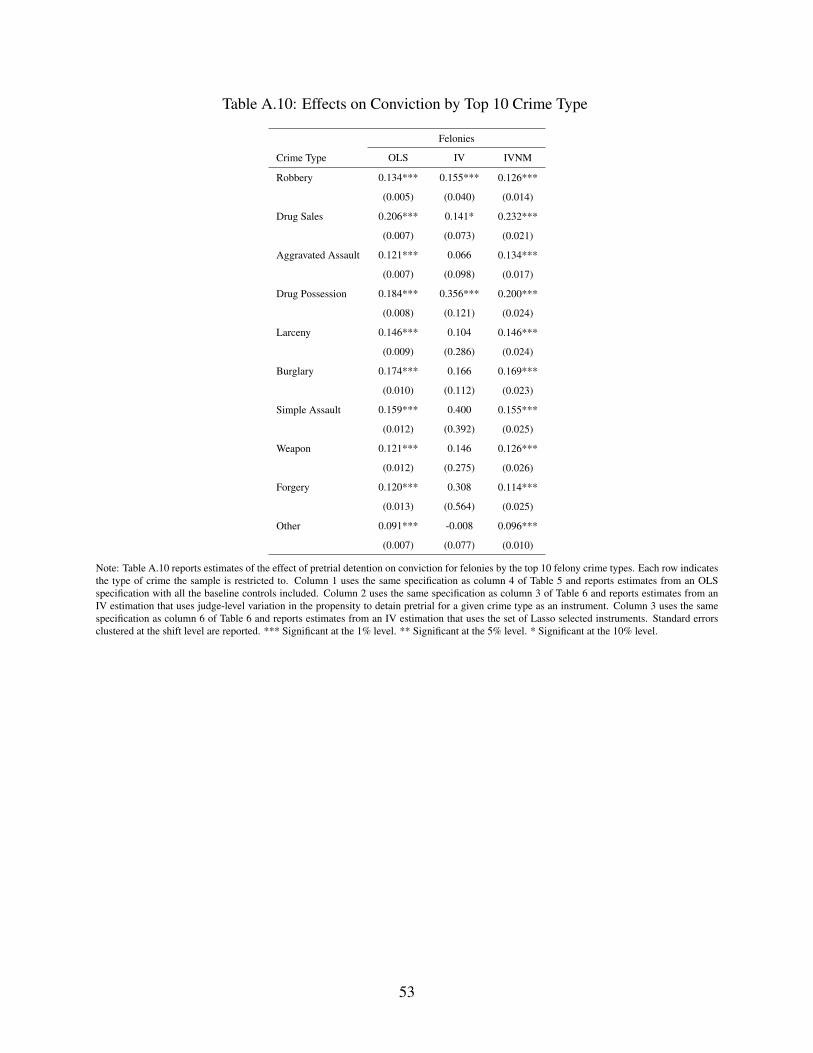
Table A.10: Effects on Conviction by Top 10 Crime Type
Felonies
Crime Type OLS IV IVNM
Robbery 0.134*** 0.155*** 0.126***
(0.005) (0.040) (0.014)
Drug Sales 0.206*** 0.141* 0.232***
(0.007) (0.073) (0.021)
Aggravated Assault 0.121*** 0.066 0.134***
(0.007) (0.098) (0.017)
Drug Possession 0.184*** 0.356*** 0.200***
(0.008) (0.121) (0.024)
Larceny 0.146*** 0.104 0.146***
(0.009) (0.286) (0.024)
Burglary 0.174*** 0.166 0.169***
(0.010) (0.112) (0.023)
Simple Assault 0.159*** 0.400 0.155***
(0.012) (0.392) (0.025)
Weapon 0.121*** 0.146 0.126***
(0.012) (0.275) (0.026)
Forgery 0.120*** 0.308 0.114***
(0.013) (0.564) (0.025)
Other 0.091*** -0.008 0.096***
(0.007) (0.077) (0.010)
Note: Table A.10 reports estimates of the effect of pretrial detention on conviction for felonies by the top 10 felony crime types. Each row indicatesthe type of crime the sample is restricted to. Column 1 uses the same specification as column 4 of Table 5 and reports estimates from an OLSspecification with all the baseline controls included. Column 2 uses the same specification as column 3 of Table 6 and reports estimates from anIV estimation that uses judge-level variation in the propensity to detain pretrial for a given crime type as an instrument. Column 3 uses the samespecification as column 6 of Table 6 and reports estimates from an IV estimation that uses the set of Lasso selected instruments. Standard errorsclustered at the shift level are reported. *** Significant at the 1% level. ** Significant at the 5% level. * Significant at the 10% level.
53
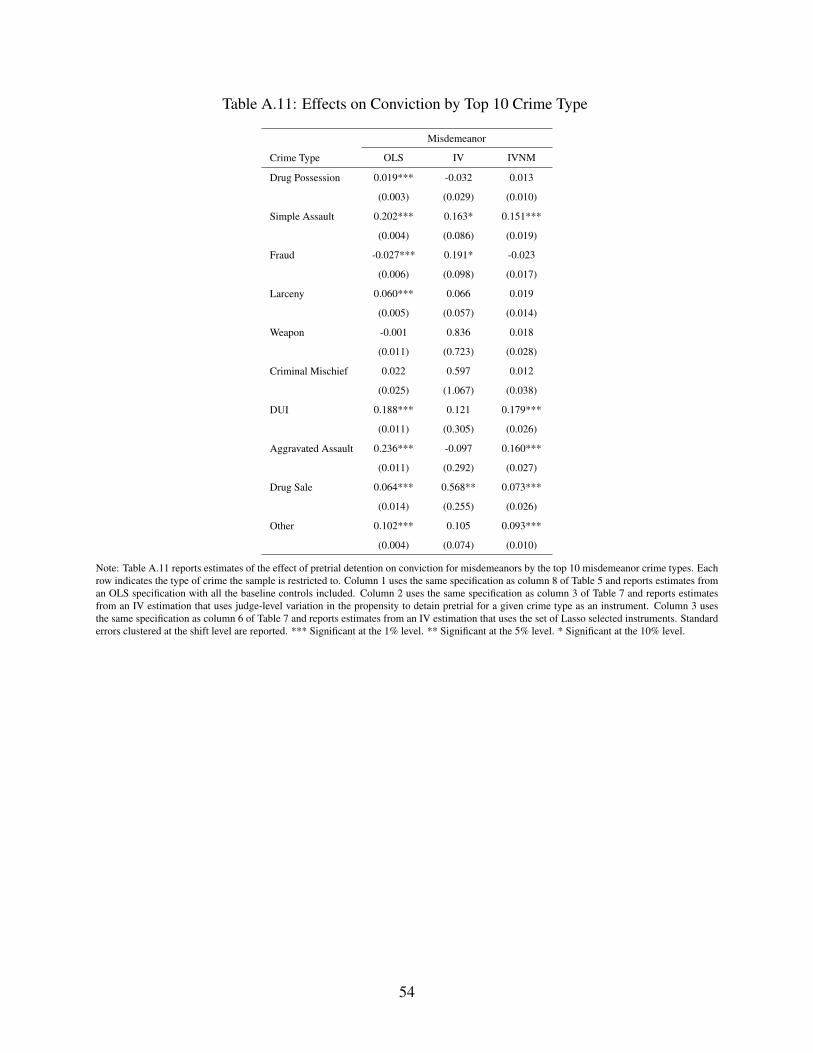
Table A.11: Effects on Conviction by Top 10 Crime Type
Misdemeanor
Crime Type OLS IV IVNM
Drug Possession 0.019*** -0.032 0.013
(0.003) (0.029) (0.010)
Simple Assault 0.202*** 0.163* 0.151***
(0.004) (0.086) (0.019)
Fraud -0.027*** 0.191* -0.023
(0.006) (0.098) (0.017)
Larceny 0.060*** 0.066 0.019
(0.005) (0.057) (0.014)
Weapon -0.001 0.836 0.018
(0.011) (0.723) (0.028)
Criminal Mischief 0.022 0.597 0.012
(0.025) (1.067) (0.038)
DUI 0.188*** 0.121 0.179***
(0.011) (0.305) (0.026)
Aggravated Assault 0.236*** -0.097 0.160***
(0.011) (0.292) (0.027)
Drug Sale 0.064*** 0.568** 0.073***
(0.014) (0.255) (0.026)
Other 0.102*** 0.105 0.093***
(0.004) (0.074) (0.010)
Note: Table A.11 reports estimates of the effect of pretrial detention on conviction for misdemeanors by the top 10 misdemeanor crime types. Eachrow indicates the type of crime the sample is restricted to. Column 1 uses the same specification as column 8 of Table 5 and reports estimates froman OLS specification with all the baseline controls included. Column 2 uses the same specification as column 3 of Table 7 and reports estimatesfrom an IV estimation that uses judge-level variation in the propensity to detain pretrial for a given crime type as an instrument. Column 3 usesthe same specification as column 6 of Table 7 and reports estimates from an IV estimation that uses the set of Lasso selected instruments. Standarderrors clustered at the shift level are reported. *** Significant at the 1% level. ** Significant at the 5% level. * Significant at the 10% level.
54

Table A.12: Effects by Predicted Incarceration Length and Gender for Felonies
Men Women
Predicted Incarceration Length OLS IV IVNM OLS IV IVNM
0 Days 0.100*** 0.133* 0.107*** 0.122*** 0.149 0.067**
(0.007) (0.068) (0.016) (0.014) (0.153) (0.032)
1-290 Days 0.139*** 0.113*** 0.113*** 0.151*** 0.142** 0.130***
(0.004) (0.034) (0.009) (0.012) (0.071) (0.026)
290+ Days 0.163*** 0.182*** 0.153*** 0.194*** 0.123 0.133***
(0.004) (0.030) (0.009) (0.022) (0.127) (0.039)
Note: Table A.12 reports estimates of the effect of pretrial detention on conviction for felonies by the predicted length of incarceration if convictedand by gender. Columns 1 and 4 use the same specification as column 4 of Table 5 and report estimates from an OLS specification with all thebaseline controls included. Columns 2 and 5 use the same specification as column 3 of Table 6 and report estimates from an IV estimation thatuses judge-level variation in the propensity to detain pretrial for a given crime type as an instrument. Columns 3 and 6 use the same specificationas column 6 of Table 6 and report estimates from an IV estimation that uses the set of Lasso selected instruments. Standard errors clustered at theshift level are reported. *** Significant at the 1% level. ** Significant at the 5% level. * Significant at the 10% level.
55