the united republic of tanzania annual survey of ... · the united republic of tanzania annual...
TRANSCRIPT
The United Republic of Tanzania
ANNUAL SURVEY OF INDUSTRIAL PRODUCTION
2016
STATISTICAL REPORT
October 2018
The United Republic of Tanzania
Ministry of Industry, Trade and Investment
National Bureau of Statistics
Annual Survey of Industrial Production, 2016
Statistical Report
November, 2018.
Annual Survey of Industrial Production -2016 i
TABLE OF CONTENTS
LIST OF FIGURES ..................................................................................................................................................................................................... v
LIST OF TEXT TABLES ............................................................................................................................................................................................ v
LIST OF ANNEX TABLES ....................................................................................................................................................................................... vi
ABBREVIATIONS .................................................................................................................................................................................................... xi
ACKNOWLEDGEMENTS ....................................................................................................................................................................................... xii
EXECUTIVE SUMMARY ...................................................................................................................................................................................... xiii
1.0 OVERVIEW ..................................................................................................................................................................................................... 1
1.1 Introduction ...................................................................................................................................................................................................... 1
1.2 Objectives ........................................................................................................................................................................................................ 1
1.3 Scope and Coverage ......................................................................................................................................................................................... 1
1.3.1 Mining and quarrying .......................................................................................................................................................................... 2
1.3.2 Manufacturing ...................................................................................................................................................................................... 2
1.3.3 Electricity, Gas, Steam and Air Conditioning Supply ......................................................................................................................... 3
1.3.4 Water Supply; Sewerage, Waste Management and Remediation Activities ....................................................................................... 3
2.0 TERMS AND DEFINITIONS .......................................................................................................................................................................... 4
2.1 Industrial Activity ............................................................................................................................................................................................ 4
2.2 Number of Persons Engaged ............................................................................................................................................................................ 4
2.3 Working Proprietors and Partners .................................................................................................................................................................... 4
Annual Survey of Industrial Production -2016 ii
2.4 Unpaid Workers ............................................................................................................................................................................................... 4
2.5 Employees ........................................................................................................................................................................................................ 4
2.6 Managerial and Professional Staff ................................................................................................................................................................... 4
2.7 Operatives- Skilled........................................................................................................................................................................................... 5
2.8 Operatives, Non-Skilled ................................................................................................................................................................................... 5
2.9 Other Employees .............................................................................................................................................................................................. 5
2.10 Labour Costs .................................................................................................................................................................................................... 5
2.11 Gross Wages and Salaries Paid to Employees ................................................................................................................................................. 5
2.12 Overtime Payments .......................................................................................................................................................................................... 5
2.13 Reimbursement of Travel Expenses ................................................................................................................................................................ 5
2.14 Payments in Kind ............................................................................................................................................................................................. 5
2.15 Intermediate Consumption or Production Costs .............................................................................................................................................. 6
2.16 Gross Output .................................................................................................................................................................................................... 6
2.17 Gross Value Added .......................................................................................................................................................................................... 6
2.18 Net Value Added.............................................................................................................................................................................................. 6
2.19 Gross Operating Surplus .................................................................................................................................................................................. 6
2.20 Depreciation ..................................................................................................................................................................................................... 6
2.21 Expenditure on Fixed Assets ........................................................................................................................................................................... 6
2.22 Gross Additions to Fixed Assets ...................................................................................................................................................................... 7
2.23 Value of Inventories (stocks) ........................................................................................................................................................................... 7
Annual Survey of Industrial Production -2016 iii
2.24 Basic Price ....................................................................................................................................................................................................... 7
2.25 Purchasers’ Price .............................................................................................................................................................................................. 7
2.26 Employment Size ............................................................................................................................................................................................. 7
2.27 Ownership ........................................................................................................................................................................................................ 7
3.0 METHODOLOGY ........................................................................................................................................................................................... 8
3.1 Reference Period .............................................................................................................................................................................................. 8
3.2 Industrial Classification ................................................................................................................................................................................... 8
3.3 Unit of Enquiry ................................................................................................................................................................................................ 8
3.4 Scope and Coverage ......................................................................................................................................................................................... 8
3.5 The Questionnaire ............................................................................................................................................................................................ 8
3.5.1 General Information ............................................................................................................................................................................. 9
3.5.2 Employment ......................................................................................................................................................................................... 9
3.5.3 Labour Costs ........................................................................................................................................................................................ 9
3.5.4 Production Costs .................................................................................................................................................................................. 9
3.5.5 Output .................................................................................................................................................................................................. 9
3.5.6 Value of Inventory ............................................................................................................................................................................... 9
3.5.7 Value of Fixed Assets .......................................................................................................................................................................... 9
3.6 Response Rate ................................................................................................................................................................................................ 10
3.7 Data Processing .............................................................................................................................................................................................. 10
3.8 Organisation of the Report ............................................................................................................................................................................. 10
Annual Survey of Industrial Production -2016 iv
4.0 MAJOR FINDINGS ....................................................................................................................................................................................... 11
4.1 Limitations of the Presented statistics............................................................................................................................................................ 11
4.2 Findings.......................................................................................................................................................................................................... 12
4.2.1 Number of Establishments ................................................................................................................................................................. 12
4.2.2 Number of Persons Engaged .............................................................................................................................................................. 13
4.2.3 Labour Costs by Industrial Sub-Sector-, (10+) Establishments ....................................................................................................... 14
4.2.4 Gross Output ...................................................................................................................................................................................... 15
4.2.5 Cost of Production ............................................................................................................................................................................. 15
4.2.6 Qualitative Data ................................................................................................................................................................................. 16
4.2.6.1 Membership to Associations ............................................................................................................................................. 16
4.2.6.2 Establishments Business Licensing ................................................................................................................................... 17
4.2.6.3 Tenure ................................................................................................................................................................................ 17
4.2.6.4 Quality Assurance ............................................................................................................................................................. 18
4.2.6.5 Medium of Exports ............................................................................................................................................................ 18
4.2.6.6 Importance of Trade Agreements ...................................................................................................................................... 19
4.2.6.7 Environmental Management Plan,Treatment Facilities for Wastes and Certificate of Environmental Impact
Assessment (EIA) .............................................................................................................................................................. 19
4.2.6.8 Investment Plan ................................................................................................................................................................. 20
4.2.6.9 Establishments Information Technology Infrastructure Status ......................................................................................... 20
Annual Survey of Industrial Production -2016 v
LIST OF FIGURES
Figure 4. 1: Labour Costs by Industrial Sub-Sector, ASIP 2016 .......................................................................................................................... 15
Figure 4. 2: Percentage Distribution of the Tenure of Buildings Owned by Establishments ............................................................................... 17
LIST OF TEXT TABLES
Table 4. 1: Labour Costs by Item, ASIP 2016 ..................................................................................................................................................... 14
Table 4. 2: Establishments Membership to Associations, by Industrial Sub-Sector, ASIP 2016 ........................................................................ 16
Table 4. 3: Frequency Distribution for Establishments Registration by Industrial Sub-Sector, ASIP 2016 ....................................................... 17
Table 4. 4: Distribution of Respondents on Certification of Products by Industrial Sub-Sector, ASIP 2016 ..................................................... 18
Table 4. 5: Media of Exports by Industrial Sub-Sector, ASIP 2016 .................................................................................................................... 18
Table 4. 6: Ranking the Importance of Trade Agreements by Industrial Sub-Sector, ASIP 2016 ...................................................................... 19
Table 4. 7: Environmental Management Plan by Industrial Sub-Sector, ASIP 2016 .......................................................................................... 19
Table 4. 8: Establishment Investment Plan by Industrial Sub-Sector, ASIP 2016 .............................................................................................. 20
Table 4. 9: Establishments Information Technology Infrastructure Status, by Type, ASIP 2016 ....................................................................... 20
Annual Survey of Industrial Production -2016 vi
LIST OF ANNEX TABLES
Table 1: Number of Establishments by Industrial Activity and Region, Tanzania Mainland, ASIP-2016 ..................................................... 22
Table 2: Number of Establishments by Industrial Activity and Form of Ownership, Tanzania Mainland, ASIP-2016 ................................. 23
Table 3: Number of Establishments by Industrial Activity and Origin of Ownership, Tanzania Mainland, ASIP-2016 ............................... 24
Table 4: Number of Establishments by Industrial Activity and Employment Size, Tanzania Mainland, ASIP-2016 .................................... 25
Table 5: Number of Establishments by Region and Employment Size, Tanzania Mainland, ASIP-2016 ...................................................... 26
Table 6: Number of Establishments by Industrial Activity and Type of Legal Organization, Tanzania Mainland, ASIP-2016 .................... 27
Table 7: Number of Establishments by Industrial Activity and Year Operation Started, Tanzania Mainland, ASIP-2016 ............................ 28
Table 8: Number of Establishments by Region and Year Operation Started, Tanzania Mainland, ASIP-2016 ............................................. 29
Table 9: Number of Persons Engaged by Industrial Activity and Region, Tanzania Mainland, ASIP-2016 .................................................. 30
Table 10: Number of Persons Engaged by Industrial Activity and Form of Ownership, Tanzania Mainland, ASIP-2016 .............................. 31
Table 11: Number of Persons Engaged by Industrial Activity and Origin of Ownership, Tanzania Mainland, ASIP-2016 ............................ 32
Table 12: Number of Persons Engaged by Industrial Activity and Employment Size, Tanzania Mainland, ASIP-2016 ................................. 33
Table 13: Number of Persons Engaged by Region and Employment Size, Tanzania Mainland, ASIP-2016 ................................................... 34
Table 14: Number of person Engaged by Industrial Activity and Type of Legal Organisation, Tanzania Mainland, ASIP-2016 ................... 35
Table 15: Number of Persons Engaged by Industrial Activity and Year Operation Started, Tanzania Mainland, ASIP-2016 ........................ 36
Table 16: Number of Persons Engaged by Region and Year Operation Started, Tanzania Mainland, ASIP-2016 .......................................... 37
Annual Survey of Industrial Production -2016 vii
Table 17: Evolution in Persons Engaged by Industrial Activity and Sex, June to December 2016, Tanzania Mainland, ASIP-2016 ............. 38
Table 18: Evolution in Persons Engaged by Region and Sex, June to December 2016, Tanzania Mainland, ASIP-2016 ............................... 39
Table 19: Number of Persons Engaged by Industrial Activity, Employment Status and Sex, Tanzania Mainland, ASIP-2016 ...................... 40
Table 20: Number of Persons Engaged by Industrial Activity, Nationality and Sex, Tanzania Mainland, ASIP-2016 ................................... 44
Table 21: Compensation of Employees and Labour Costs by Industrial Activity, Tanzania Mainland, ASIP-2016 ........................................ 46
Table 22: Intermediate Consumption by Industrial Activity, Tanzania Mainland, ASIP-2016 ........................................................................ 49
Table 23: Electricity, Water and Fuels Consumed by Industrial Activity, Tanzania Mainland, ASIP-2016 .................................................... 51
Table 24: Services Consumed by Industrial Activity, Tanzania Mainland, ASIP-2016 ................................................................................... 53
Table 25: Raw Materials Purchased by Product Category and Origin, Tanzania Mainland, ASIP-2016 ......................................................... 56
Table 26: Component of Gross Output by Industrial Activity, Tanzania Mainland, ASIP-2016 ...................................................................... 57
Table 27: Production Account by Industrial Activity, Tanzania Mainland, ASIP-2016 ................................................................................... 59
Table 28: Sales of Products by Category and Destination, Tanzania Mainland, ASIP-2016 ............................................................................ 60
Table 29: Value of Inventories/Stocks by Industrial Activity, Tanzania Mainland, ASIP-2016 ...................................................................... 61
Table 30: Value of Fixed Assets at the end of 2015 by Industrial Activity and Type of Assets, Tanzania Mainland, ASIP-2016 .................. 63
Table 31: Net Investment by Industrial Activity and Type of Asset, Tanzania Mainland, ASIP-2016 ............................................................ 65
Table 32: Number of Establishments and Persons Engaged by Industrial Activity, Tanzania Mainland, ASIP-2016 ..................................... 67
Table 33: Remuneration by Industrial Activity, Tanzania Mainland, ASIP-2016 ............................................................................................ 69
Annual Survey of Industrial Production -2016 viii
Table 34: Value Added by Industrial Activity, Tanzania Mainland, ASIP-2016 .............................................................................................. 71
Table 35(a): Stocks held at the begin by Industrial Activity, Tanzania Mainland, ASIP-2016 ............................................................................. 73
Table 35(b): Stocks held at the end by Industrial Activity, Tanzania Mainland, ASIP-2016 ................................................................................ 75
Table 36: Expenditure on Fixed Assets by Industrial Activity, Tanzania Mainland, ASIP-2016 ..................................................................... 77
Table 37: Number of Establishments by Industrial Activity and Region, Tanzania Mainland, ASIP-2016 ..................................................... 80
Table 38: Number of Establishments, Employees, Total Persons Engaged, Total Labour Cost, Gross Output, Intermediate
Consumption and Value Added by Region, Tanzania Mainland, ASIP-2016 .................................................................................. 82
Table 39: Number of Persons Engaged in Industry by Ownership, Tanzania Mainland, ASIP-2016 ............................................................... 83
Table 40: Total Labour Costs in Industry by Ownership, Tanzania Mainland, ASIP-2016 .............................................................................. 84
Table 41: Number of Establishments, Gross Output, Intermediate Consumption and Value Added in Industry by Ownership, Tanzania
Mainland, ASIP-2016 ........................................................................................................................................................................ 86
Table 42: Number of Establishments in Industry by Size of Establishment, Tanzania Mainland, ASIP-2016 ................................................. 87
Table 43: Number of Employees by Employment Size, Tanzania Mainland, ASIP-2016 ................................................................................ 89
Table 44: Number of Persons Engaged by Employment Size, Tanzania Mainland, ASIP-2016 ...................................................................... 91
Table 45: Total Labour Cost in Industry by Employment Size, Tanzania Mainland, ASIP-2016 .................................................................... 92
Table 46: Wages and Salaries in Industry by Employment Size, Tanzania Mainland, ASIP-2016 .................................................................. 93
Table 47: Gross Output in Industry by Employment Size, Tanzania Mainland, ASIP-2016 ............................................................................ 94
Table 48: Total Intermediate Consumption in Industry by Employment Size, Tanzania Mainland, ASIP-2016 ............................................. 95
Annual Survey of Industrial Production -2016 ix
Table 49: Value Added in Industry by Employment Size, Tanzania Mainland, ASIP-2016 ............................................................................ 96
Table 50: Value of Energy Consumed by Industrial Activity and Type, Tanzania Mainland, ASIP-2016 ....................................................... 97
Table 51: Frequency Distribution for Establishments Membership, Tanzania Mainland, ASIP-2016 ............................................................. 98
Table 52: Frequency Distribution for Awareness of Services/Functions Provided by Institutions, Tanzania Mainland, ASIP-2016 .............. 99
Table 53: Frequency Distribution for Establishments Registration, Tanzania Mainland, ASIP-2016 ............................................................ 100
Table 55: Frequency Distribution of Tenure of Buildings Occupied for Own Business, Tanzania Mainland, ASIP-2016 ............................ 101
Table 56: Frequency Distribution of Establishment Products Certified by Government Institutions /Authorities, Tanzania Mainland,
ASIP-2016........................................................................................................................................................................................ 102
Table 57: Frequency Distribution of Establishments Quality Management Aspects, Tanzania Mainland, ASIP-2016 ................................. 103
Table 61: Frequency Distribution of Marketing for the Produced Products, Tanzania Mainland, ASIP-2016 ............................................... 104
Table 62: Frequency Distribution of Major Media for Export, Tanzania Mainland, ASIP-2016 ................................................................... 105
Table 63: Frequency Distribution on the Importance of Trade Agreements, Tanzania Mainland, ASIP-2016 .............................................. 106
Table 64(a): Frequency Distribution of Barriers for Expanding Establishments Exports (Regional Markets), Tanzania Mainland, ASIP-
2016.................................................................................................................................................................................................. 107
Table 64(b): Frequency Distribution of Barriers for Expanding Establishments Exports (Preferential Markets), Tanzania Mainland,
ASIP-2016........................................................................................................................................................................................ 109
Table 64(c): Frequency Distribution of Barriers for Expanding Establishments Exports (International Markets), Tanzania Mainland,
ASIP-2016........................................................................................................................................................................................ 111
Table 65: Frequency Distribution of Establishment Environmental Management, Tanzania Mainland, ASIP-2016 ..................................... 113
Annual Survey of Industrial Production -2016 x
Table 67: Frequency Distribution of Establishments Investment Plan, Tanzania Mainland, ASIP-2016 ....................................................... 114
Table 68(a): Frequency Distribution of Establishments Information Technology Infrastructure and Related Services, Tanzania Mainland,
ASIP-2016........................................................................................................................................................................................ 115
Table 68(b): Frequency Distribution of Establishments Information Technology Infrastructure and Related Services, Tanzania Mainland,
ASIP-2016........................................................................................................................................................................................ 115
Table 69: Frequency Distribution of Major Challenges Facing the Establishments, Tanzania Mainland, ASIP-2016 .................................. 116
Table 70(a): Average Utilization of Production Capacity by Products, Tanzania Mainland, ASIP-2016 ........................................................... 117
Table 70(b): Average Utilization of Production Capacity by Products, Tanzania Mainland, ASIP-2016 ........................................................... 118
Table 71: Number of Establishments by Major Countries of Export, Tanzania Mainland, ASIP-2016 ......................................................... 119
Annual Survey of Industrial Production -2016 xi
ABBREVIATIONS
ASIP Annual Survey of Industrial Production
() In the table means Negative
- Means zero
000 Thousand
CIP Census of Industrial Production
CTI Confederation of Tanzania Industries
GOS Gross Operating Surplus
GDP Gross Domestic Product
ISIC International Standard Industrial Classification
IT Information Technology
MIT Ministry of Industry and Trade
MoU Memorandum of Understanding
n.e.c Not elsewhere classified
NBS National Bureau of Statistics
NDV National Development Vision
NSGRP National Strategy for Growth and Reduction of Poverty
Parties MIT, NBS and CTI
TZS Tanzanian shillings
UN United Nations
UNIDO United Nations Industrial Development Organization
Annual Survey of Industrial Production -2016 xii
ACKNOWLEDGEMENTS
The National Bureau of Statistics (NBS) in collaboration with the Ministry
of Industry, Trade and Investment (MITI); Confederation of Tanzania
Industries (CTI) and UNIDO would like to express their appreciation and
gratitude to the survey management team and staff members of the
collaborating organizations who have been involved in the design and
implementation of this important project.
The Survey Executive Committee comprised of Hon. Charles Mwijage,
Minister for Industry, Trade and Investment; Prof. Joseph
BuchweishaijaThe Permanent Secretary Ministry of Industry, Trade and
Investments. Dr. Edwin Mhede, Deputy Permanent Secretary (Trade and
Investments) and LudovickNduhiye,Deputy Permanent Secretary
(Industry).
The Survey Management Team was comprised of Daniel Masolwa, Acting
Director of Economics Statistics (NBS); Dr.IsackLegonda, Director of
Industry Development (MITI); and Eng. Elli Pallangyo, Assistant Director
Research and Investment and JumaMwambapa, Assistant Director
Industrial Support and Promotions; Ms. Joy Sawe, Manager for Industrial
and Construction Statistics Department and Mr.FadhiliKhalfani, the ASIP
Desk Officer
I am grateful to the ASIP Technical team and authors of this report,
especially personnel involved in producing this report; Ms. Veronica C.
Mwangoka, Mr. Philemon Mahimbo, Mr.ChildaHamis, Mr. Julius
Mwambeso, Mr. George Mockray, Ms.AsteriaKamara,Ms. Esther V.
Mkenda and Anorld Fyataga for their commitments in compiling this
report.
I also recognize field work enumerators, Regional Statistical Managers,
Regional and District Commissioners in all Regions of Tanzania Mainland
for their effort at different stages of the Survey. Moreover, the cooperation
of establishment managers/owners throughout the country was very
instrumental to the success of this project; my greatest thanks are due to all
of them.
Dr.AlbinaChuwa
Statistician General
National Bureau of Statistics
Annual Survey of Industrial Production -2016 xiii
EXECUTIVE SUMMARY
The 2016 Annual Survey of Industrial Production covered a total of
2,462 establishments engaged ten or more (10+) persons/workers.
Out of the total establishments, Manufacturing sub-sector had the
largest number of (1,931 or 78.4 percent); followed by Mining and
quarrying (385 or 15.6 percent); Water supply, sewerage, waste
management and remediation activities (110 or 4.5 percent); and
Electricity, gas, steam and air conditioning supply with 36
establishments or 1.5 percent.
Regional wise, Dar es Salaam had the highest number of
establishments (542 or 22.0 percent); followed by Manyara (352 or
14.3 percent) andMorogoro (245 or 10.0percent).
Out of 2,462 establishments, 2,236 (90.8 percent) were owned by
nationals; 199 (8.1 percent) by foreigners; and 27 (1.1 percent) were
jointly owned.
Most of establishments (87.9 percent) were privately owned;
followed by public ownership (8.7 percent); and only 3.4 percent
had a mixed ownership.
The total number of persons engaged in establishments within the
four industrial sub-sectors was 221,688. However, majority of the
workers (177,173 or 79.9 percent) were in the Manufacturing sub-
sector.
Gender wise, out of the total number of persons engaged in
establishments, 158,618 (71.5 percent) were males; and 63,070 (28.5
percent) were females.
Regional wise, Dar es Salaam had the largest number of workers
(57,797 or 26.1percent); followed by Morogoro (26,956 or 12.2
percent); Manyara (19,919 or 9.0 percent); Arusha (15,328 or
6.1percent) and Kilimanjaro (12,824 or 5.8percent).
The total labour costs for establishments was TZS 2,123,142
million, of which, wages and salaries accounted for the largest
amount (TZS 1,471,052 million or 69.3 percent). The results also
show that, manufacturing sub-sector had the largest amount of TZS
Annual Survey of Industrial Production -2016 xiv
1,569,805 million or 73.9 percent of the total labour costs; followed
by mining and quarrying with TZS 368,274 million or 17.3 percent.
The gross Output of goods and services produced by establishments
amounted to TZS 21,877,042 million, of which; manufacturing sub-
sector contributed TZS 15,813,217 million or 72.3percent of the
total gross output; followed by mining and quarrying with TZS
3,699,993 million or 16.9percent. The remaining two sub-sectors
contributed a total of 10.8percent. Majority of the goods produced
by establishments were sold locally (TZS 16,949,515 million or
77.5percent); while TZS 4,777,939 million or 21.8percent were
exported.
Total cost of production (Intermediate Consumption) for large
establishments was TZS 10,733,124 million; of which, TZS
3,225,378 million or 30.1 percent was used in raw materials-local.
The raw material-imports consumed a total of TZS 3,151,177
million or 29.4percent of the total production costs.
Analysis of Value Added by industrial sub-sector for establishments
shows that, total value added produced by establishments were
TZS.11,143,918 million of which TZS. 7,576,681 million or
68.0percent was produced by manufacturing sub-sector; followed by
mining and quarrying with TZS 2,592,680 million or 23.3percent
while the remaining two industrial sub-sector produced a total of
value added amounted to TZS.974,557 million or 8.7percent.
Annual Survey of Industrial Production -2016 1
1.0 OVERVIEW
1.1 Introduction
The Government of the United Republic of Tanzania through
Tanzania Statistical Master Plan (TSMP) has been working on the
improvement of the quality of statistics in the country by putting in
place a better infrastructure of statistical production. This involves
up-dating of basic data from different household and establishment
based surveys including the 2016 Annual Survey of Industrial
Production.
The Survey provides statistics on both formal and informal
industries which will be used as bench-mark information for the
improvement of the sector performance. The survey results will be
used to review the industrial sector’s GDP as well as the
construction of Supply and Use tables. Moreover, the survey results
will help in assessing changes in the structure and composition of
the sector.
1.2 Objectives
The main objective of the 2016 Annual Survey of Industrial
Production was to collect information from individual
establishments that will be useful in providing economic variables
and indicators necessary for planning and policy formulation of the
industrial sector. Specifically, the survey aimed at up-dating:
1. The structure, composition and activities of the industrial
sector in the economy;
2. The contribution of the industrial sector to GDP;
3. The list of commodities to be used to construct Indices of
Industrial Production (IIP), Producer Price Index (PPI) and
National Account of Tanzania;
4. Information for evidence-based formulation of the sector
policy;
5. Factors influencing the growth and structural changes in the
sector;
6. Marketing information; and
7. The list of establishments or a sampling frame for
establishment based surveys.
Furthermore, the 2016 ASIP provides statistical information that
facilitates the current government policy of development by
devolution which needs disaggregated information to capture
regional requirements.
1.3 Scope and Coverage
The 2016 Annual survey of Industrial Production used the
Annual Survey of Industrial Production -2016 2
International Standard Industrial Classification of All Industrial
Activities (ISIC) Revision 4 to capture all economic activities under
study. The Survey covered all establishments which engaged 10
persons or more (10+) It included establishments that were active in
2016 and engaged in any of the following activities; Mining and
quarrying, Manufacturing, Electricity, gas, steam and air
conditioning supply, and Water supply, sewerage, waste
management and remediation activities. Details of these activities
are as described below.
1.3.1 Mining and quarrying
Mining and quarrying includes; activities relating to extraction of
minerals occurring naturally as solids (coal and ores), liquids
(petroleum) or gases (natural gas). Extraction can be achieved by
different methods such as; under-ground or surface mining, well
operation, seabed mining, etc. Also, included are; supplementary
activities aimed at preparing the crude materials for marketing, for
example; crushing and grinding, cleaning, drying, sorting,
concentrating ores, liquefaction of natural gas and agglomeration of
solid fuels. These operations are often carried out by the units that
extracted the resource and/or others located nearby.
It excludes the processing of the extracted materials, which also
covers the bottling of natural spring and mineral waters at springs
and wells or the crushing, grinding or otherwise treating certain
earths, rocks and minerals not carried out in conjunction with
mining and quarrying. It also excludes the usage of the extracted
materials without a further transformation for construction purposes,
the collection, purification and distribution of water, separate site
preparation activities for mining and geophysical, geologic and
seismic surveying activities.
1.3.2 Manufacturing
Manufacturing includes the physical or chemical transformation of
materials, substances, or components into new products, although
this cannot be used as the single universal criterion for defining
manufacturing. The materials, substances, or components
transformed are raw materials that are products of agriculture,
forestry, fishing, mining or quarrying as well as products of other
manufacturing activities. Substantial alteration, renovation or
reconstruction of goods is generally considered to be manufacturing.
Assembly of the component parts of manufactured products is
considered as manufacturing. This includes the assembly of
manufactured products from either self-produced or purchased
components.
Specialized maintenance and repair of industrial, commercial and
similar machinery and equipment is included in manufacturing.
However, the repair of computers and personal and household goods
Annual Survey of Industrial Production -2016 3
and the repair of motor vehicles are not included in this section. The
boundaries of manufacturing and other activities can be somewhat
blurry. As a general rule, the activities in the manufacturing section
involve the transformation of materials into new products.
1.3.3 Electricity, Gas, Steam and Air Conditioning Supply
Economic activities included under this section are the activities of
providing electric power, natural gas, steam, hot water and the like
through a permanent infrastructure (network) of lines, mains and
pipes. The dimension of the network is not decisive; also included
are; the distribution of electricity, gas, steam, hot water and the like
in industrial parks or residential buildings. This section therefore
includes; the operation of electric and gas utilities, which generate,
control and distribute electric power or gas. Also included is the
provision of steam and air-conditioning supply. This section
excludes the operation of water and sewerage utilities, (typically
long-distance) and transportation of gas through pipelines.
1.3.4 Water Supply; Sewerage, Waste Management and
Remediation Activities
This section includes activities related to the management (including
collection, treatment and disposal) of various forms of waste, such
as solid or non-solid industrial or household waste, as well as
contaminated sites. The output of the waste or sewage treatment
process can either be disposed-off or become an input into other
production processes. Activities of water supply are also grouped in
this section, since they are often carried out in connection with, or
by units also engaged in the treatment of sewerage.
Annual Survey of Industrial Production -2016 4
2.0 TERMS AND DEFINITIONS
2.1 Industrial Activity
This means the four major divisions (sub-sectors) of the
International Standard Industrial Classification (ISIC) Revision 4 of
All Economic Activities, that is: Mining and quarrying;
Manufacturing; Electricity, gas, steam and air conditioning supply
and Water supply; sewerage, waste management and remediation
activities.
2.2 Number of Persons Engaged
Refers to all persons who during a specified period, worked in or for
the establishment including part time workers. It includes working
proprietors and partners, unpaid family workers and employees
(operatives, managerial and professional staff). It includes even
those who during the specified period were temporarily absent from
work e.g. on sick leave, casual leave or vacation leave. It excludes
persons on military leave, pension and other forms of unlimited
leave.
2.3 Working Proprietors and Partners
Persons who control the establishment and share in its profits i.e.
those who own the establishment. It may be a single individual or
many persons as in partnership. Working proprietors are those who
are actually engaged in the work of the establishment. However, in
corporations, there are no working proprietors while the salaried
directors are considered to be employees.
2.4 Unpaid Workers
Persons like members of religious, prisoners, J.K.T. militia, family
members and the like who work for at least 1/3 of the normal
working time of the establishment. They work without regular pay
or any agreed amount to be paid for the work done.
2.5 Employees
These are persons who during a specified period, they worked for an
agreed amount of pay, either in cash or in kind, under the direction
of the establishment. This includes managerial and professional
staff, operatives and other employees.
2.6 Managerial and Professional Staff
This category includes administrative, technical and clerical
personnel such as salaried managers and directors, clerks, typists
and the like.
Annual Survey of Industrial Production -2016 5
2.7 Operatives- Skilled
Operatives are persons who are directly engaged in the production or
related activities of the establishment and who receive pay, in cash
or in kind, at regular intervals. Therefore, operative-skilled are
persons with specialized skills, for example; persons engaged in
fabricating, processing or assembling, fitters, packers, repairmen,
record-keeping personnel, foremen and inspectors.
2.8 Operatives, Non-Skilled
Workers in this group perform routine tasks, either manually or
using hand tools and appliances. The group includes such
occupations as machine operators, cleaners, constructors, foremen
and mining labourers, etc.
2.9 Other Employees
These are persons who do not fall in the above categories, i.e.
administration, accounts, sales departments including working
directors, managers, supervisors, technicians, engineers clerical
staff, office cleaners, attendants, messengers and watchmen.
2.10 Labour Costs
Are comprised of gross wages and salaries, overtime payments,
reimbursement of travel expenses, payments in kind, employers
contributions to social security schemes, training expenses and other
labour costs related to employees.
2.11 Gross Wages and Salaries Paid to Employees
Refers to payments made to workers (employees and part-time
workers) for wage. The payments may be in cash or in kind. Wages
and salaries in cash include all cash payments such as direct wages
and salaries, overtime payments, bonuses, commission pay to sales
personnel, gratuities, housing, transport, cost of living and family
allowances when paid direct to the employee by the employer.
2.12 Overtime Payments
These are extra payments entitled to employee(s) after normal
working hours.
2.13 Reimbursement of Travel Expenses
These are re-payment expenses to employees who used their own
funds when transferred to other working stations.
2.14 Payments in Kind
These are benefits given to employees in forms other than cash, is
the net cost to the employer of those goods and services (which are
clearly and primarily of benefit to the employees as consumers)
furnished to the employees free of charge or at markedly reduced
Annual Survey of Industrial Production -2016 6
cost. It includes food, beverages, tobacco, housing, clothing (not
uniforms) and medical expenses. Excluded are recreational facilities.
2.15 Intermediate Consumption or Production Costs
Intermediate Consumption/Production Costs of industries cover
durable and non-durable goods and services used up in production,
including repairs and maintenance of the capital stock, research and
direct outlays in the financing of capital formation such as transfer
costs involved in purchases of land and intangible assets. The
consumption of materials and supplies is the total cost of purchases
adjusted by change in stocks of raw materials.
2.16 Gross Output
Gross Output covers the value in the market of industrial goods and
services produced including work in progress and products for own
use. Value of goods sold is adjusted by the change in stocks of
finished goods and work in progress.
2.17 Gross Value Added
Gross value added is equal to Gross Output less the value of the
Intermediate Consumption/Production Cost. The sum of the value
added of all domestic producers gives the contribution to the Gross
Domestic Product (GDP). Gross Value Added may be at factor cost,
basic prices or at producer’s prices depending on the treatment of
taxes on production and subsidies. Value added at basic prices is
obtained as the difference between Gross Output and Intermediate
Consumption whereby, output is valued at basic prices and
intermediate consumption at purchaser’s prices.
2.18 Net Value Added
This represents the difference between gross Value Added and the
Depreciation. Annual Survey of Industrial Production 2009
2.19 Gross Operating Surplus
Gross Operating Surplus is defined as the excess of Value Added
over the cost of Workers’ Compensation.
2.20 Depreciation
Represenst the estimated allowance for wear and tear of fixed assets
during the respective accounting year. Throughout this report, the
unit of value is the Tanzania shilling.
2.21 Expenditure on Fixed Assets
This is the sum of the cost of new or old capital equipment acquired
and value of assets produced on own account construction.
Improvements and major alterations to existing fixed assets are also
included.
Annual Survey of Industrial Production -2016 7
2.22 Gross Additions to Fixed Assets
This is the expenditure on fixed assets (additions) less total disposals
of fixed assets
2.23 Value of Inventories (stocks)
This item is comprised of the value of all materials and supplies,
fuels, finished and semi-finished products and goods for resale, held
by, or under the control of the establishment (at the establishment or
in ancillary or other warehouses).
2.24 Basic Price
The Basic Price is the amount receivable by the producer exclusive
of taxes on products and inclusive of subsidies on products. It
includes taxes on production.
2.25 Purchasers’ Price
The Purchasers¶ Price is the amount payable by the purchaser
exclusive of deductible taxes on products (e.g. deductible value
added tax).
2.26 Employment Size
In the tables, which show results by size, the following descriptions
are used:
10 – 19 Establishments with 10 to 19 persons engaged;
20 – 49 Establishments with 20 to 49 persons engaged;
50 – 99 Establishments with 50 to 99 persons engaged;
100 - 499 Establishments with 100 to 499 persons engaged;
500+ Establishments with 500 or more persons engaged.
2.27 Ownership
In the tables, which show results by ownership, the following
descriptions are used:
Public: All establishments owned by the government and all
companies in which government has 50 percent or more shares
capital.
Private: All establishments owned by private, all companies in
which government has less than 50 percent share capital, companies
under Regional or District Cooperative Unions, companies under
Cooperative Societies and other companies not stated above.
Annual Survey of Industrial Production -2016 8
3.0 METHODOLOGY
The Methodology adopted in this survey intended to collect quality
data that would facilitate better understanding the status of the
industrial sector and provide instruments that will enable appropriate
follow ups.
3.1 Reference Period
The survey involved establishments that were active in 2016, that is,
the information requested for and supplied was based on financial
year covering January to December 2016. Those establishments that
could not supply data according to the stated reference period were
advised to supply data according to their financial years that covered
larger part of the reference 2016 calendar year.
3.2 Industrial Classification
Establishments were classified into industries on the basis of major
activity in conformity with the International Standard Industrial
Classification (ISIC) Revision 4. Each industry is basically defined
in terms of its principal products or services, these being similar in
nature or commonly associated in production.
3.3 Unit of Enquiry
The statistical unit used in this census is an establishment, which is
defined as an economic unit, under a single ownership or control,
engaging one or predominantly one kind of economic activity at a
single physical location, for example; an individual firm, mining,
factory or workshop. However, due to record keeping practices, it
was not always possible to strictly follow the definition of an
establishment as stated above. In some cases, the restrictions
especially on location were relaxed.
3.4 Scope and Coverage
The 2016 Annual Survey of Industrial Production used the
International Standard Industrial Classification (ISIC) Revision 4 to
capture all economic activities surveyed. The Survey covered all
establishments that engaged ten persons or more (10+) in the
following four industrial sub-sectors; Mining and quarrying,
Manufacturing, Electricity, gas, steam and air conditioning supply,
and Water supply, sewerage, waste management and remediation
activities.
3.5 The Questionnaire
The questionnaires conformed to the InternationalRecommendations
for Industrial Statistics of the United Nations and incorporated the
stakeholders’ requirements. The questionnaires were designed to
ensure that, the information to be collected satisfied the needs of
national accounts, the government, researchers and the business
Annual Survey of Industrial Production -2016 9
community. Questionnaire was divided into eightmajor parts. This
includes general information, employment, labour cost, production
cost, output, inventory, fixed asset and qualitative part.
3.5.1 General Information
This includes; name of the establishment, physical location of the
establishment, contact address, type of the establishment, main and
auxiliary activities, main products and secondary products, origin of
ownership, form of ownership, type of legal organization,
establishment’s source of finance and other related information.
3.5.2 Employment
This section includes the number of persons engaged in production
as of 1st January 2016 and 31st December 2016. Additionally, the
average number of persons engaged was collected, that is; working
proprietors and partners, unpaid family workers, employees and the
number of out-sourced workers as at 31st December, 2016.
3.5.3 Labour Costs
These are costs incurred by owners of the establishments for
furnished labour. It includes wages and salaries, overtime payments,
reimbursement of travel expenses, payments in kind, employers’
contribution to social security schemes, training expenses and other
related labour costs.
3.5.4 Production Costs
This includes costs for inputs used during production, namely;
electricity, water, gas and fuels, goods purchased for re-sale, raw
materials and components, expenses on industrial and non-industrial
services consumed and other related expenses. According to National
Accounts, these costs are known as Intermediate Consumption.
3.5.5 Output
This section gathered information on the utilization of production
capacity and problems associated with it, quantities and values of
principal and secondary products manufactured, income from
industrial and non-industrial services done for others and other
income received, including interests and dividends, subsidies and the
like.
3.5.6 Value of Inventory
This includes value of stocks at the beginning and at the end of the
accounting year for materials and supplies (raw materials and
chemicals), fuel, work in progress, finished products and goods
purchased for re-sale.
3.5.7 Value of Fixed Assets
This section includes value of capital expenditure on land, buildings
and other construction works, transport equipment, machinery and
other equipment, computer and other data processing equipment; and
Annual Survey of Industrial Production -2016 10
other fixed assets during the accounting year. The value of additions,
disposals and depreciation charged for the respective items was also
captured.
3.6 Response Rate
The 2016 ASIP involved 2,462 establishments of which 2,367
establishments responded during the survey, making a total response
rate of 96.2 percent. This was a satisfactory response rate capable of
producing reliable statistics.
3.7 Data Processing
Completed questionnaires were pre-edited before sending them to
NBS headquarters where they were further edited and coded by
trained editors under the supervision of staff from NBS and MITI.
The data entry system used was based on CSPro and micro data was
transferred to Microsoft Access for generation of tables.
3.8 Organisation of the Report
The report presents the industrial statistics according to the latest
International Recommendations for Industrial Statistics, 2008 (IRIS
2008) of the United Nations. Main findings relating to both
qualitative and quantitative information are presented. Tables and
figures referring to such information are integrated within the
sections and detailed information is attached as annex tables.
Annual Survey of Industrial Production -2016 11
4.0 MAJOR FINDINGS
The industrial sector of Tanzania Mainland is relatively small but
growing quite rapidly. According to the Economic survey compiled
by NBS, percentage shares of Gross Domestic Product(GDP) by
kind of Economic activity, construction industry shares to GDP was
14.0 percent, followed by manufacturing 4.9 percent, Mining and
quarrying 4.8 percent, electricity supply 0.8 percent while the share
of water supply sewerage, waste management to GDP was 0.4
percent during the year 2016.
4.1 Limitations of the Presented statistics
Since the survey was jointly conducted by different parties, the
survey contents and results have taken into account the needs of the
parties as well as other users. However, the users are hereby
cautioned that; the survey had the following limitations.
1. The survey was conducted according to the International
Recommendations for Industrial Statistics. The tendency
among establishments to hide information relating mainly to
outputs and to over-report on inputs due to the belief that
information supplied would reach Income Tax Authorities.
The regular conduct of such surveys would help in
dissipating this fear and at the same time, improve the
quality and reliability of the supplied information.
2. A number of establishments were sometimes engaged in
several important but dissimilar activities. Because of non-
availability of separate records, these establishments have
been classified according to the activity with the highest
output. Information relating to a particular ISIC group might,
therefore, include data of other secondary activities as well.
3. Some establishments could not provide detailed information
for certain items such as:
a. Consumption of electricity, water and fuels separately;
b. Purchase of raw materials and sales from own
production by main product;
c. Values of stocks as well as values of fixed assets
by type; and
d. Level of stocks and assets.
These and other missing data had to be estimated through
the laid down Estimation Procedures/techniques.
4. Some establishments did not have books of accounts.
5. The report includes tables on sales and purchases by product
category. These should, however, be used with caution since
Annual Survey of Industrial Production -2016 12
some establishments did not report such details. The above
limitations, however, have no serious effect on the overall
quality and reliability of the survey results. The government,
business community and other users can make good use of
these results, which constitute the only available survey
information based on International Recommendations for
Industrial Statistics.
4.2 Findings
4.2.1 Number of Establishments
The total number of industrial establishments covered in the 2016
Annual Survey of Industrial Production was 2,462. Dar es Salaam
region had the highest number of establishments (542 or 22.0
percent); followed by Manyara (352 or 14.3 percent); Morogoro
(245 or 10.0 percent); and Arusha (143 or 5.8 percent) Annex Table
1.
There were 44 establishments engaging 500 or more (500+) persons,
out of which, 13 were in Dar es Salaam, 7 in Morogoro, 3 in Tanga
and, shinyanga each. The number of establishments engaging 10 to
49 workers was 1,954. The number of establishments that engaged
50 to 99 persons was 219 while those which engaged 100 to 499
persons were 245Annex Table 5
Among the four sub-sectors, manufacturing had the largest number
of establishments (1,931 or 78.4 percent); followed by mining and
quarrying (385 or 15.6 percent); Water supply, sewerage, waste
management and remediation activities (110 or 4.5 percent); and
electricity, gas, steam and air conditioning supply with 36
establishments or 1.5 percent of the total number of establishments.
For all industrial activities covered in manufacturing sub-sector,
manufacturing of food products constituted the largest number of
establishments (803 or 41.6 percent); followed by manufacture of
other non-metallic mineral products with 222 establishments or 11.5
percent and manufacture of furniture with 195 or 10.5 percentAnnex
Table 2
Out of 2,462 establishments, 2,163 (87.9 percent) were owned by
nationals, 215 (8.7 percent) by foreigners and 84 (3.4 percent) were
jointly owned; .For manufacturing sub-sector, 1,654 establishments
(88.6 percent) were owned by nationals, 198 (10.3 percent) by
foreigners and 79 (4.1 percent) were jointly ownedAnnex Table 3
Majority of the establishments in the four industrial sub-sectors were
privately owned firms, the results shows that , 2,236 establishments
or 90.8 percent were privately owned; 199 or 8.1 percent were
publicly owned; and only 27 or 1.1percent had a mixed
ownershipAnnex Table 2
Annual Survey of Industrial Production -2016 13
On types of legal organization, 1,022 (41.5 percent) of the
establishments were sole proprietorship; 596 (24.2 percent) were
private company limited; 386 (15.7 percent) were partnership; 155
(6.3 percent) were public; 144 (5.8 percent) were private company;
120 (4.9 percent) were cooperative; 26 (1.1 percent) were had other
legal organisation while only 13 or (0.5 percent) were
parastatalAnnex Tables 6
Most of the establishments 1,131 or 45.9 started their operation
during the year (2005-2013) .On the other hand 434 or 17.6
establishments started their operation between the year 2014 and
2015, while 345 establishments or 14.0 percent started their
operation in the year 2000 to 2004Annex Table 7.
4.2.2 Number of Persons Engaged
The total number of persons engaged in the four industrial sub-
sectors was 221,688, of which, 177.173 or 79.9 percent were
engaged in Manufacturing sub-sector; followed by Mining and
quarrying (30,472 or 13.8 percent), Water supply, sewerage, waste
management and remediation activities (9,511 or 4.3 percent) and
Electricity, gas, steam and air conditioning supply (4,532 or 2.0
percent). Among the total number of persons engaged in
establishments which was 221,688, 158,618 (71.5 percent) were
males and 63,093 (28.5 percent) were females.
The survey reveals that, nationality of person engaged in
establishments 217,147 (98.0 percent) were Tanzanians and 4,541
(2.0 percent) were foreigners.
Out of the total 221,688 workers engaged in all the four industrial
sub-sectors, 78,746 (35.5percent) were in the manufacture of food
products; and 17,835 (8.0percent) were engaged in the manufacture
of beverages. The remaining economic activities had a total of
125,107 persons or 56.5percent of the total number of
workersAnnex Table 20.
Regional wise, the largest number of persons engaged were in Dar
es Salaam region with 57,797 (26.1percent); followed by Morogoro
with 26,956 (12.2percent); Manyara with 19,919 (9.0percent);
Arusha with 15,328 (6.9percent); Kilimanjaro with 12,824
(5.8percent); Mwanza with 10,207 (4.6percent); and
Tangawith9,670 persons or 4.4percentAnnex Table 9.
A total number of 127,614 were engaged in establishment as
operatives, of which, 57,057 (44.7 percent) were skilled, and 70,557
(55.3 percent) were non-skilled. The Manufacturing sub-sector had
the largest number of operatives (99,983 or 78.3percent)Annex
Table 19.
Annual Survey of Industrial Production -2016 14
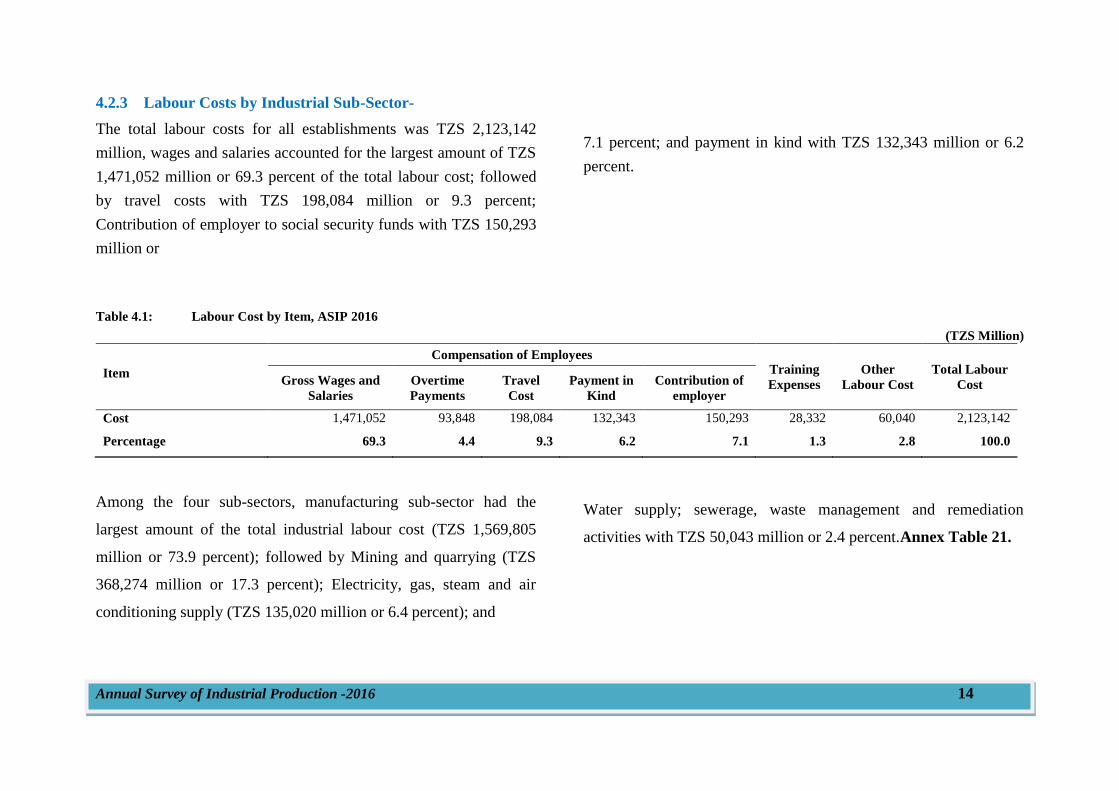
4.2.3 Labour Costs by Industrial Sub-Sector-
The total labour costs for all establishments was TZS 2,123,142
million, wages and salaries accounted for the largest amount of TZS
1,471,052 million or 69.3 percent of the total labour cost; followed
by travel costs with TZS 198,084 million or 9.3 percent;
Contribution of employer to social security funds with TZS 150,293
million or
7.1 percent; and payment in kind with TZS 132,343 million or 6.2
percent.
Table 4.1: Labour Cost by Item, ASIP 2016
(TZS Million)
Item
Compensation of Employees Training
Expenses
Other
Labour Cost
Total Labour
Cost Gross Wages and
Salaries
Overtime
Payments
Travel
Cost
Payment in
Kind
Contribution of
employer
Cost 1,471,052 93,848 198,084 132,343 150,293 28,332 60,040 2,123,142
Percentage 69.3 4.4 9.3 6.2 7.1 1.3 2.8 100.0
Among the four sub-sectors, manufacturing sub-sector had the
largest amount of the total industrial labour cost (TZS 1,569,805
million or 73.9 percent); followed by Mining and quarrying (TZS
368,274 million or 17.3 percent); Electricity, gas, steam and air
conditioning supply (TZS 135,020 million or 6.4 percent); and
Water supply; sewerage, waste management and remediation
activities with TZS 50,043 million or 2.4 percent.Annex Table 21.
Annual Survry of Industrial Production -2016 15
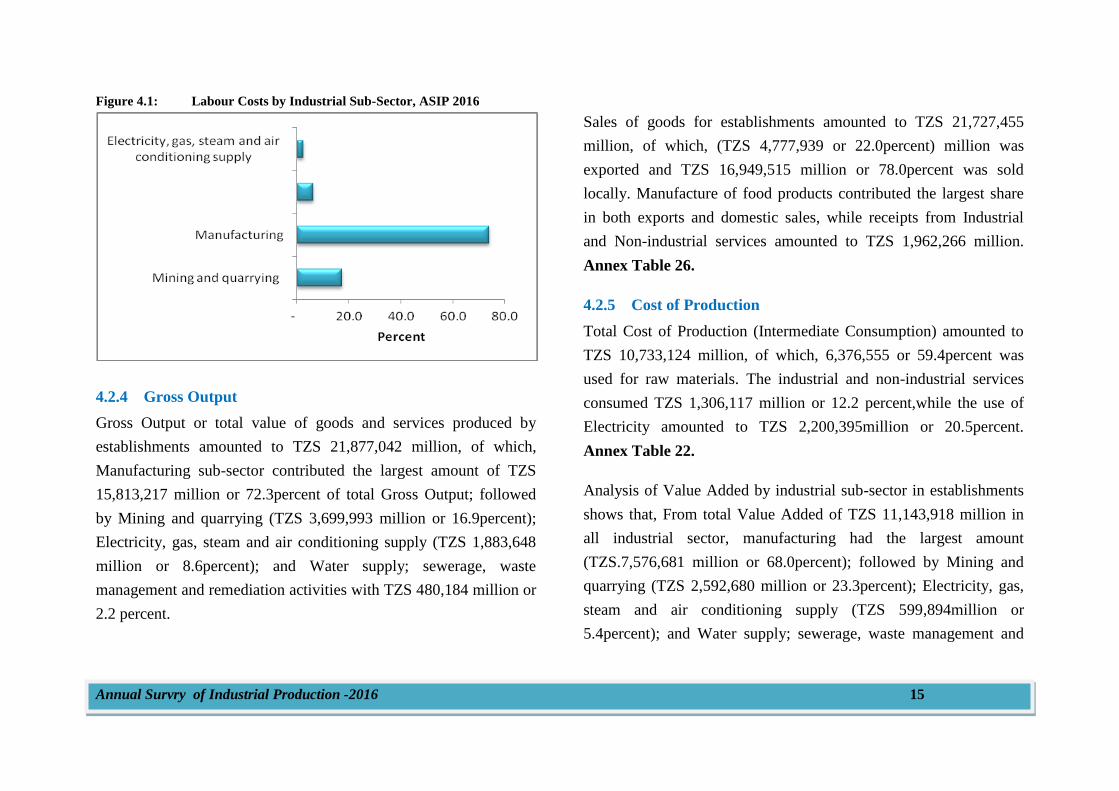
Figure 4.1: Labour Costs by Industrial Sub-Sector, ASIP 2016
4.2.4 Gross Output
Gross Output or total value of goods and services produced by
establishments amounted to TZS 21,877,042 million, of which,
Manufacturing sub-sector contributed the largest amount of TZS
15,813,217 million or 72.3percent of total Gross Output; followed
by Mining and quarrying (TZS 3,699,993 million or 16.9percent);
Electricity, gas, steam and air conditioning supply (TZS 1,883,648
million or 8.6percent); and Water supply; sewerage, waste
management and remediation activities with TZS 480,184 million or
2.2 percent.
Sales of goods for establishments amounted to TZS 21,727,455
million, of which, (TZS 4,777,939 or 22.0percent) million was
exported and TZS 16,949,515 million or 78.0percent was sold
locally. Manufacture of food products contributed the largest share
in both exports and domestic sales, while receipts from Industrial
and Non-industrial services amounted to TZS 1,962,266 million.
Annex Table 26.
4.2.5 Cost of Production
Total Cost of Production (Intermediate Consumption) amounted to
TZS 10,733,124 million, of which, 6,376,555 or 59.4percent was
used for raw materials. The industrial and non-industrial services
consumed TZS 1,306,117 million or 12.2 percent,while the use of
Electricity amounted to TZS 2,200,395million or 20.5percent.
Annex Table 22.
Analysis of Value Added by industrial sub-sector in establishments
shows that, From total Value Added of TZS 11,143,918 million in
all industrial sector, manufacturing had the largest amount
(TZS.7,576,681 million or 68.0percent); followed by Mining and
quarrying (TZS 2,592,680 million or 23.3percent); Electricity, gas,
steam and air conditioning supply (TZS 599,894million or
5.4percent); and Water supply; sewerage, waste management and
Annual Survry of Industrial Production -2016 16
remediation activities with TZS 374,663 million or 3.4percent of the
total industrial Value Added. Annex Table 27.
4.2.6 Qualitative Data
This section presents main findings as well as questions collected
from establishments covering respondents and non-respondents.
The section also captures data from the following areas:
Membership to Associations, Licensing status, Tenure, Quality
Assurance, Media of Exports, Importance of Trade Agreements,
Barriers to expand Exports, Sources of Water, Environmental
Management,Current Technology status,Investment Plan,IT
facilities and HIV/AIDS.
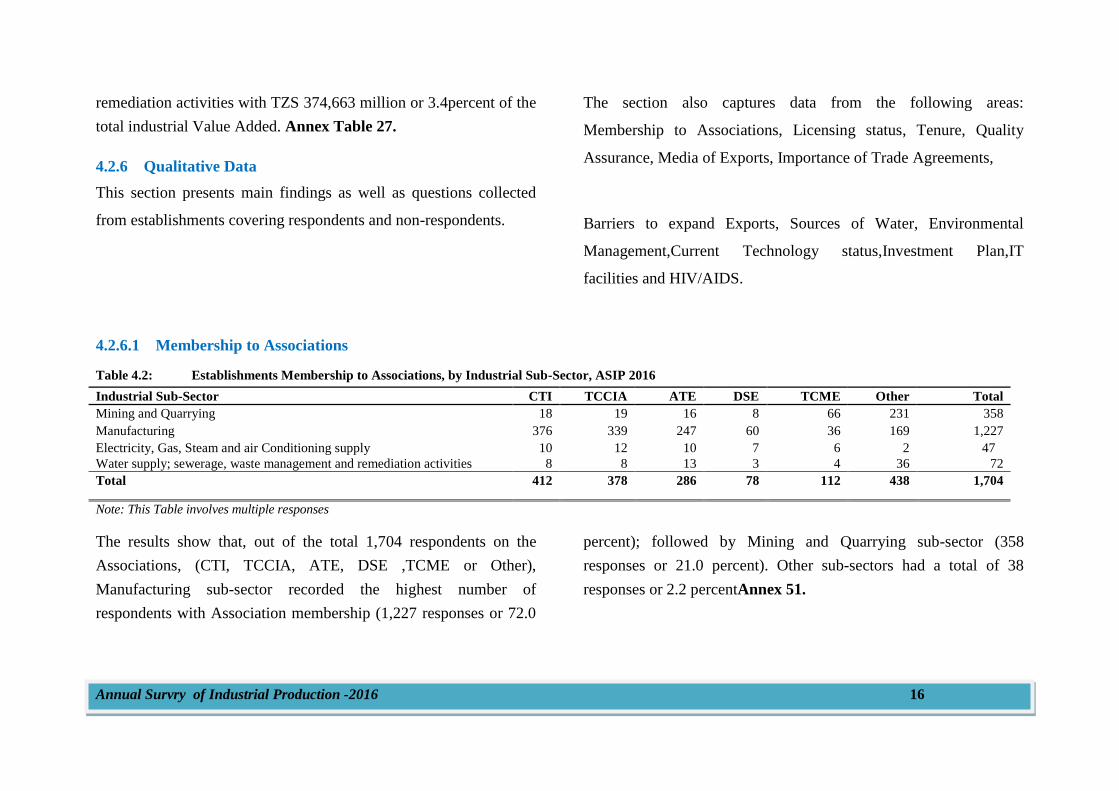
4.2.6.1 Membership to Associations
Table 4.2: Establishments Membership to Associations, by Industrial Sub-Sector, ASIP 2016
Industrial Sub-Sector CTI TCCIA ATE DSE TCME Other Total
Mining and Quarrying 18 19 16 8 66 231 358
Manufacturing 376 339 247 60 36 169 1,227
Electricity, Gas, Steam and air Conditioning supply 10 12 10 7 6 2 47
Water supply; sewerage, waste management and remediation activities 8 8 13 3 4 36 72
Total 412 378 286 78 112 438 1,704
Note: This Table involves multiple responses
The results show that, out of the total 1,704 respondents on the
Associations, (CTI, TCCIA, ATE, DSE ,TCME or Other),
Manufacturing sub-sector recorded the highest number of
respondents with Association membership (1,227 responses or 72.0
percent); followed by Mining and Quarrying sub-sector (358
responses or 21.0 percent). Other sub-sectors had a total of 38
responses or 2.2 percentAnnex 51.
Annual Survey of Industrial Production -2016 17
0.0 10.0 20.0 30.0 40.0 50.0 60.0
wholly owned
wholly rented
partly rented
Percent
4.2.6.2 Establishments Business Licensing
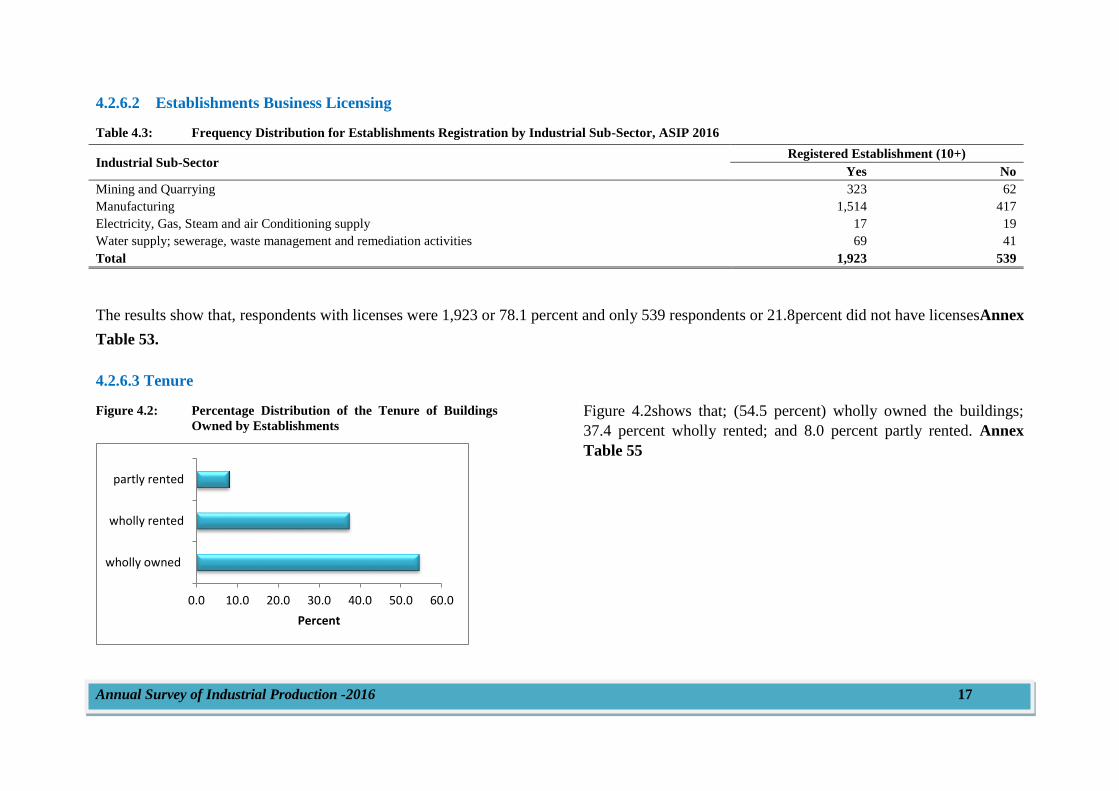
Table 4.3: Frequency Distribution for Establishments Registration by Industrial Sub-Sector, ASIP 2016
Industrial Sub-Sector Registered Establishment (10+)
Yes No
Mining and Quarrying 323 62
Manufacturing 1,514 417
Electricity, Gas, Steam and air Conditioning supply 17 19
Water supply; sewerage, waste management and remediation activities 69 41
Total 1,923 539
The results show that, respondents with licenses were 1,923 or 78.1 percent and only 539 respondents or 21.8percent did not have licensesAnnex
Table 53.
4.2.6.3 Tenure
Figure 4.2: Percentage Distribution of the Tenure of Buildings
Owned by Establishments
Figure 4.2shows that; (54.5 percent) wholly owned the buildings;
37.4 percent wholly rented; and 8.0 percent partly rented. Annex
Table 55
Annual Survey of Industrial Production -2016 18
4.2.6.4 Quality Assurance
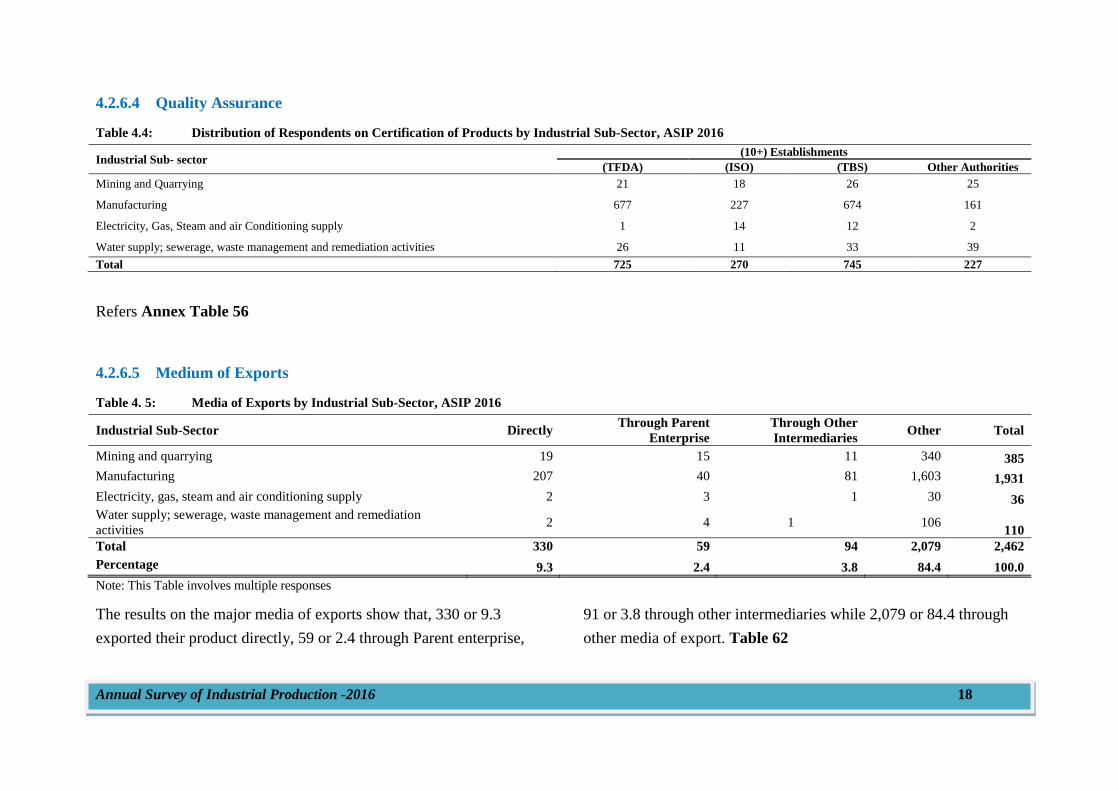
Table 4.4: Distribution of Respondents on Certification of Products by Industrial Sub-Sector, ASIP 2016
Industrial Sub- sector (10+) Establishments
(TFDA) (ISO) (TBS) Other Authorities
Mining and Quarrying 21 18 26 25
Manufacturing 677 227 674 161
Electricity, Gas, Steam and air Conditioning supply 1 14 12 2
Water supply; sewerage, waste management and remediation activities 26 11 33 39
Total 725 270 745 227
Refers Annex Table 56
4.2.6.5 Medium of Exports
Table 4. 5: Media of Exports by Industrial Sub-Sector, ASIP 2016
Industrial Sub-Sector Directly Through Parent
Enterprise
Through Other
Intermediaries Other Total
Mining and quarrying 19 15 11 340 385
Manufacturing 207 40 81 1,603 1,931
Electricity, gas, steam and air conditioning supply 2 3 1 30 36
Water supply; sewerage, waste management and remediation
activities 2 4 1 106
110
Total 330 59 94 2,079 2,462
Percentage 9.3 2.4 3.8 84.4 100.0
Note: This Table involves multiple responses
The results on the major media of exports show that, 330 or 9.3
exported their product directly, 59 or 2.4 through Parent enterprise,
91 or 3.8 through other intermediaries while 2,079 or 84.4 through
other media of export. Table 62
Annual Survey of Industrial Production -2015 19
4.2.6.6 Importance of Trade Agreements
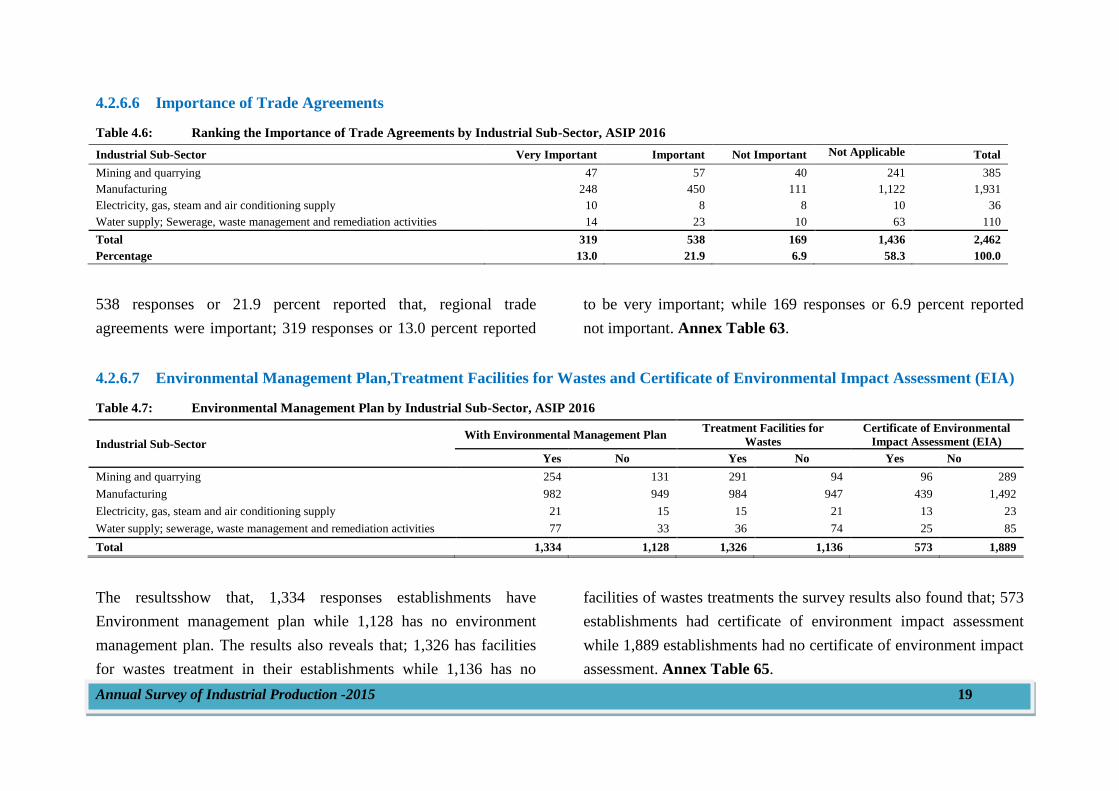
Table 4.6: Ranking the Importance of Trade Agreements by Industrial Sub-Sector, ASIP 2016
Industrial Sub-Sector Very Important Important Not Important Not Applicable Total
Mining and quarrying 47 57 40 241 385
Manufacturing 248 450 111 1,122 1,931
Electricity, gas, steam and air conditioning supply 10 8 8 10 36
Water supply; Sewerage, waste management and remediation activities 14 23 10 63 110
Total 319 538 169 1,436 2,462
Percentage 13.0 21.9 6.9 58.3 100.0
538 responses or 21.9 percent reported that, regional trade
agreements were important; 319 responses or 13.0 percent reported
to be very important; while 169 responses or 6.9 percent reported
not important. Annex Table 63.
4.2.6.7 Environmental Management Plan,Treatment Facilities for Wastes and Certificate of Environmental Impact Assessment (EIA)
Table 4.7: Environmental Management Plan by Industrial Sub-Sector, ASIP 2016
Industrial Sub-Sector With Environmental Management Plan
Treatment Facilities for
Wastes
Certificate of Environmental
Impact Assessment (EIA)
Yes No Yes No Yes No
Mining and quarrying 254 131 291 94 96 289
Manufacturing 982 949 984 947 439 1,492
Electricity, gas, steam and air conditioning supply 21 15 15 21 13 23
Water supply; sewerage, waste management and remediation activities 77 33 36 74 25 85
Total 1,334 1,128 1,326 1,136 573 1,889
The resultsshow that, 1,334 responses establishments have
Environment management plan while 1,128 has no environment
management plan. The results also reveals that; 1,326 has facilities
for wastes treatment in their establishments while 1,136 has no
facilities of wastes treatments the survey results also found that; 573
establishments had certificate of environment impact assessment
while 1,889 establishments had no certificate of environment impact
assessment. Annex Table 65.
Annual Survey of Industrial Production -2016 20
4.2.6.8 Investment Plan
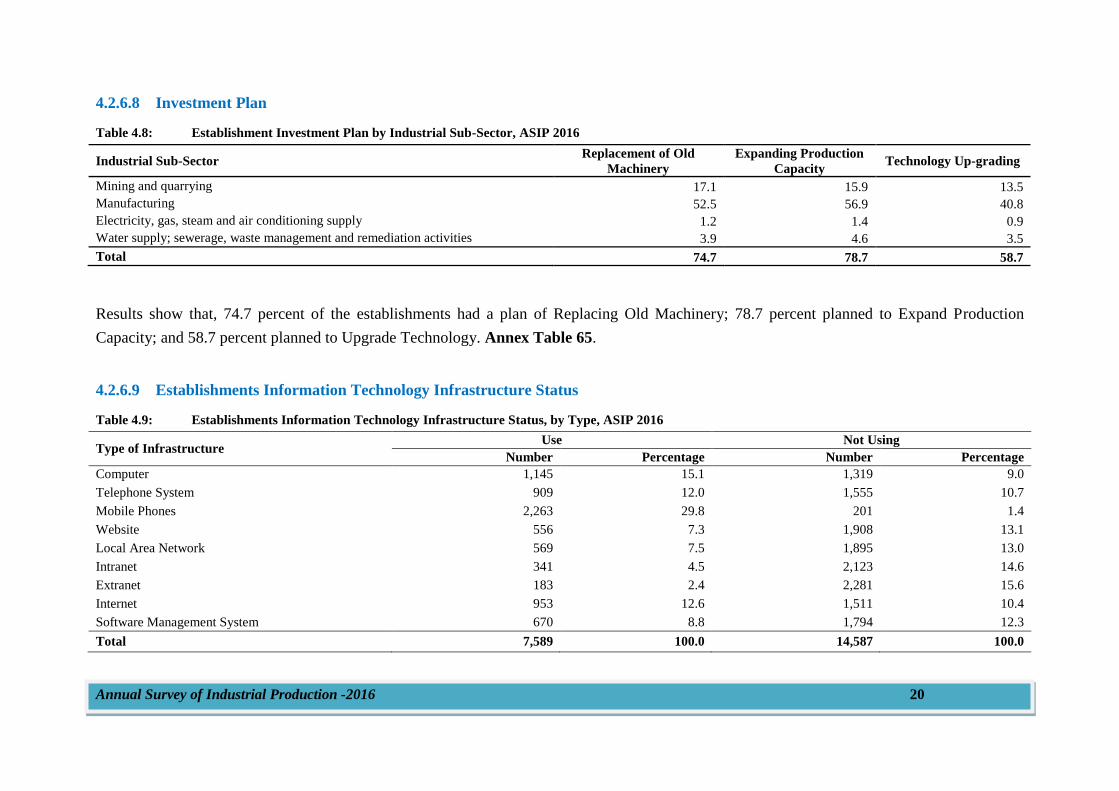
Table 4.8: Establishment Investment Plan by Industrial Sub-Sector, ASIP 2016
Industrial Sub-Sector Replacement of Old
Machinery
Expanding Production
Capacity Technology Up-grading
Mining and quarrying 17.1 15.9 13.5
Manufacturing 52.5 56.9 40.8
Electricity, gas, steam and air conditioning supply 1.2 1.4 0.9
Water supply; sewerage, waste management and remediation activities 3.9 4.6 3.5
Total 74.7 78.7 58.7
Results show that, 74.7 percent of the establishments had a plan of Replacing Old Machinery; 78.7 percent planned to Expand Production
Capacity; and 58.7 percent planned to Upgrade Technology. Annex Table 65.
4.2.6.9 Establishments Information Technology Infrastructure Status
Table 4.9: Establishments Information Technology Infrastructure Status, by Type, ASIP 2016
Type of Infrastructure Use Not Using
Number Percentage Number Percentage
Computer 1,145 15.1 1,319 9.0
Telephone System 909 12.0 1,555 10.7
Mobile Phones 2,263 29.8 201 1.4
Website 556 7.3 1,908 13.1
Local Area Network 569 7.5 1,895 13.0
Intranet 341 4.5 2,123 14.6
Extranet 183 2.4 2,281 15.6
Internet 953 12.6 1,511 10.4
Software Management System 670 8.8 1,794 12.3
Total 7,589 100.0 14,587 100.0
Annual Survey of Industrial Production -2016 21
The use of Information Technology Infrastructures was led by
Mobile Phones with 2,263 responses or 29.8 percent; followed by
Computer with 1,145 responses or 15.1 percent; Internet with 953
responses or 12.6 percent; and telephone system with 909 responses
or 12.0 percent. There were also establishments that did not use
Information Technology Infrastructures, in which; Extranet was
leading with 2,281 responses or 15.6 percent; followed by Intranet
with 2,123 responses or 14.6 percent; website with 1,908 or 13.1
percent and Local Area Network with 1,895 or 13.0 percent. Annex
Table 68.
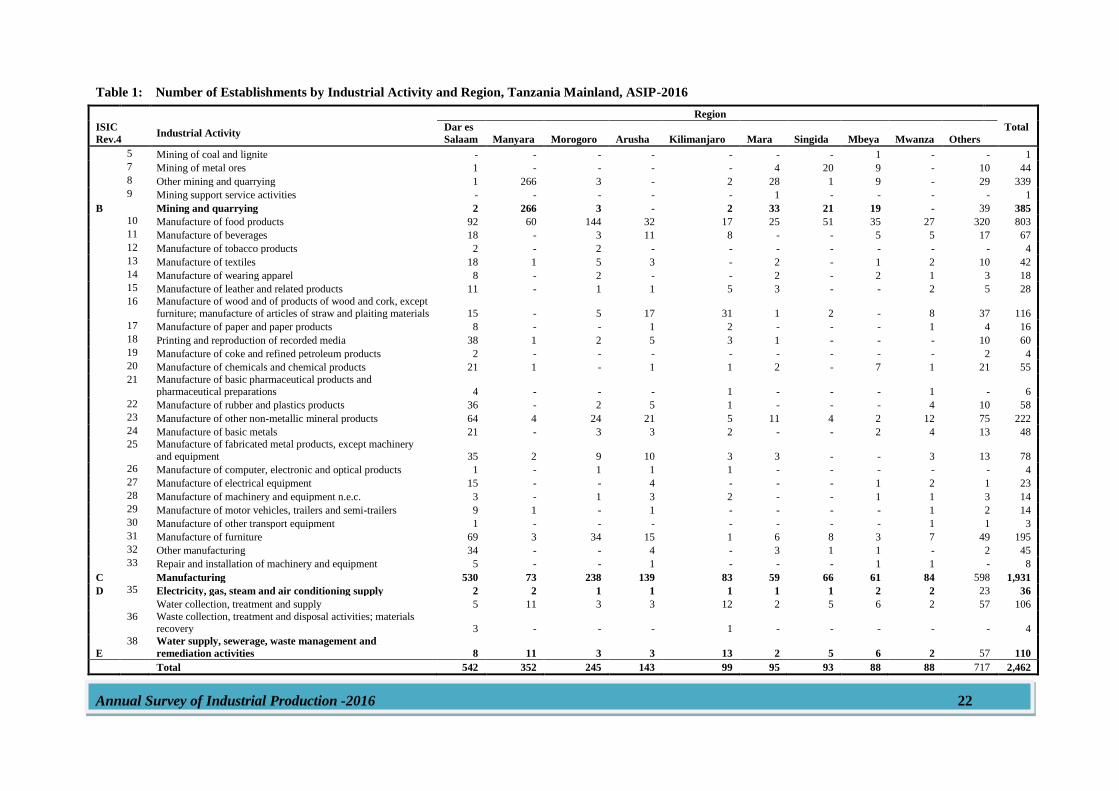
Annual Survey of Industrial Production -2016 22
Table 1: Number of Establishments by Industrial Activity and Region, Tanzania Mainland, ASIP-2016
Region
ISIC
Rev.4 Industrial Activity
Dar es
Salaam Manyara Morogoro Arusha Kilimanjaro Mara Singida Mbeya Mwanza Others
Total
5 Mining of coal and lignite - - - - - - - 1 - - 1
7 Mining of metal ores 1 - - - - 4 20 9 - 10 44
8 Other mining and quarrying 1 266 3 - 2 28 1 9 - 29 339
9 Mining support service activities - - - - - 1 - - - - 1
B Mining and quarrying 2 266 3 - 2 33 21 19 - 39 385
10 Manufacture of food products 92 60 144 32 17 25 51 35 27 320 803
11 Manufacture of beverages 18 - 3 11 8 - - 5 5 17 67
12 Manufacture of tobacco products 2 - 2 - - - - - - - 4
13 Manufacture of textiles 18 1 5 3 - 2 - 1 2 10 42
14 Manufacture of wearing apparel 8 - 2 - - 2 - 2 1 3 18
15 Manufacture of leather and related products 11 - 1 1 5 3 - - 2 5 28
16 Manufacture of wood and of products of wood and cork, except furniture; manufacture of articles of straw and plaiting materials 15 - 5 17 31 1 2 - 8 37 116
17 Manufacture of paper and paper products 8 - - 1 2 - - - 1 4 16
18 Printing and reproduction of recorded media 38 1 2 5 3 1 - - - 10 60
19 Manufacture of coke and refined petroleum products 2 - - - - - - - - 2 4
20 Manufacture of chemicals and chemical products 21 1 - 1 1 2 - 7 1 21 55
21 Manufacture of basic pharmaceutical products and pharmaceutical preparations 4 - - - 1 - - - 1 - 6
22 Manufacture of rubber and plastics products 36 - 2 5 1 - - - 4 10 58
23 Manufacture of other non-metallic mineral products 64 4 24 21 5 11 4 2 12 75 222
24 Manufacture of basic metals 21 - 3 3 2 - - 2 4 13 48
25 Manufacture of fabricated metal products, except machinery
and equipment 35 2 9 10 3 3 - - 3 13 78
26 Manufacture of computer, electronic and optical products 1 - 1 1 1 - - - - - 4
27 Manufacture of electrical equipment 15 - - 4 - - - 1 2 1 23
28 Manufacture of machinery and equipment n.e.c. 3 - 1 3 2 - - 1 1 3 14
29 Manufacture of motor vehicles, trailers and semi-trailers 9 1 - 1 - - - - 1 2 14
30 Manufacture of other transport equipment 1 - - - - - - - 1 1 3
31 Manufacture of furniture 69 3 34 15 1 6 8 3 7 49 195
32 Other manufacturing 34 - - 4 - 3 1 1 - 2 45
33 Repair and installation of machinery and equipment 5 - - 1 - - - 1 1 - 8
C Manufacturing 530 73 238 139 83 59 66 61 84 598 1,931
D 35 Electricity, gas, steam and air conditioning supply 2 2 1 1 1 1 1 2 2 23 36
Water collection, treatment and supply 5 11 3 3 12 2 5 6 2 57 106
36 Waste collection, treatment and disposal activities; materials recovery 3 - - - 1 - - - - - 4
E
38 Water supply, sewerage, waste management and
remediation activities 8 11 3 3 13 2 5 6 2 57 110
Total 542 352 245 143 99 95 93 88 88 717 2,462
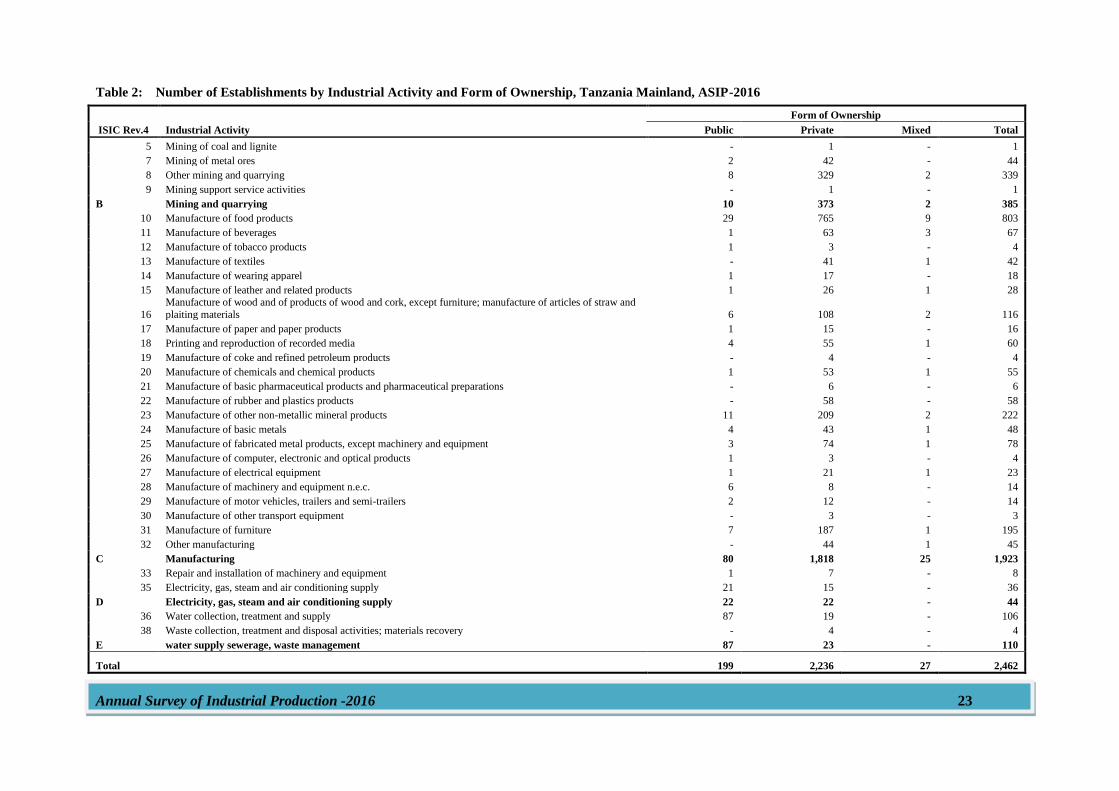
Annual Survey of Industrial Production -2016 23
Table 2: Number of Establishments by Industrial Activity and Form of Ownership, Tanzania Mainland, ASIP-2016
ISIC Rev.4 Industrial Activity
Form of Ownership
Public Private Mixed Total
5 Mining of coal and lignite - 1 - 1
7 Mining of metal ores 2 42 - 44
8 Other mining and quarrying 8 329 2 339
9 Mining support service activities - 1 - 1
B Mining and quarrying 10 373 2 385
10 Manufacture of food products 29 765 9 803
11 Manufacture of beverages 1 63 3 67
12 Manufacture of tobacco products 1 3 - 4
13 Manufacture of textiles - 41 1 42
14 Manufacture of wearing apparel 1 17 - 18
15 Manufacture of leather and related products 1 26 1 28
16
Manufacture of wood and of products of wood and cork, except furniture; manufacture of articles of straw and
plaiting materials 6 108 2 116
17 Manufacture of paper and paper products 1 15 - 16
18 Printing and reproduction of recorded media 4 55 1 60
19 Manufacture of coke and refined petroleum products - 4 - 4
20 Manufacture of chemicals and chemical products 1 53 1 55
21 Manufacture of basic pharmaceutical products and pharmaceutical preparations - 6 - 6
22 Manufacture of rubber and plastics products - 58 - 58
23 Manufacture of other non-metallic mineral products 11 209 2 222
24 Manufacture of basic metals 4 43 1 48
25 Manufacture of fabricated metal products, except machinery and equipment 3 74 1 78
26 Manufacture of computer, electronic and optical products 1 3 - 4
27 Manufacture of electrical equipment 1 21 1 23
28 Manufacture of machinery and equipment n.e.c. 6 8 - 14
29 Manufacture of motor vehicles, trailers and semi-trailers 2 12 - 14
30 Manufacture of other transport equipment - 3 - 3
31 Manufacture of furniture 7 187 1 195
32 Other manufacturing - 44 1 45
C Manufacturing 80 1,818 25 1,923
33 Repair and installation of machinery and equipment 1 7 - 8
35 Electricity, gas, steam and air conditioning supply 21 15 - 36
D Electricity, gas, steam and air conditioning supply 22 22 - 44
36 Water collection, treatment and supply 87 19 - 106
38 Waste collection, treatment and disposal activities; materials recovery - 4 - 4
E water supply sewerage, waste management 87 23 - 110
Total 199 2,236 27 2,462
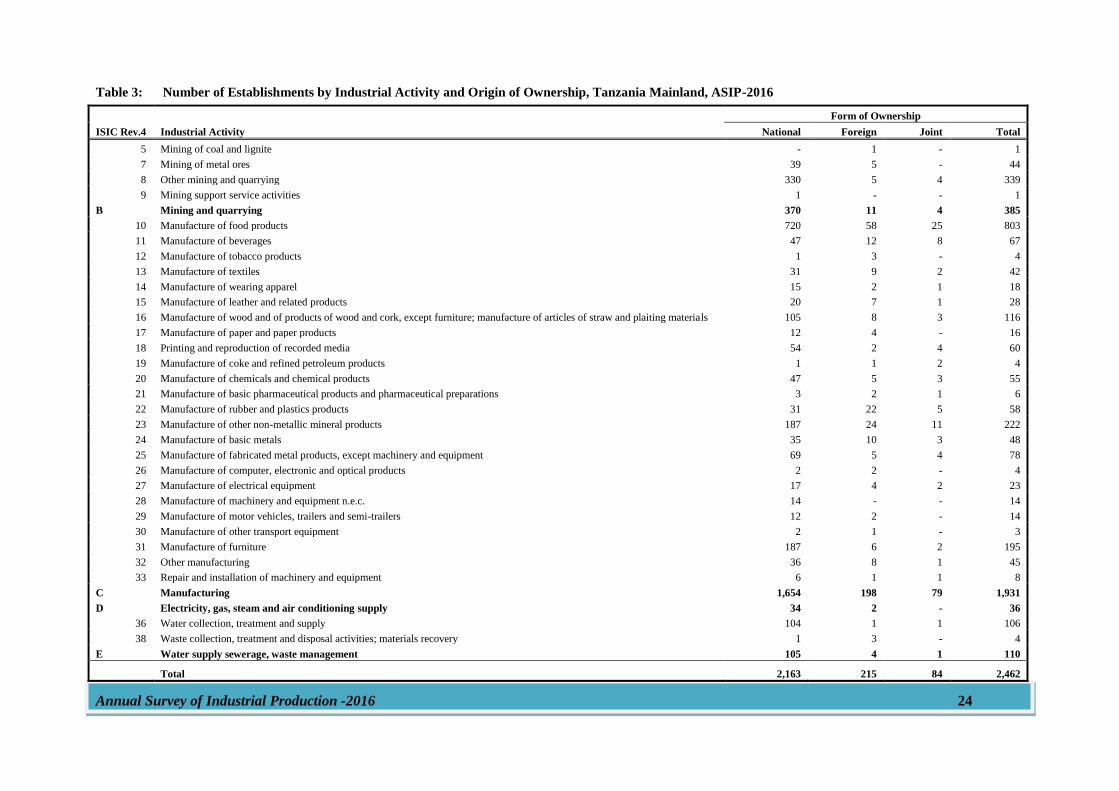
Annual Survey of Industrial Production -2016 24
Table 3: Number of Establishments by Industrial Activity and Origin of Ownership, Tanzania Mainland, ASIP-2016
ISIC Rev.4 Industrial Activity
Form of Ownership
National Foreign Joint Total
5 Mining of coal and lignite - 1 - 1
7 Mining of metal ores 39 5 - 44
8 Other mining and quarrying 330 5 4 339
9 Mining support service activities 1 - - 1
B Mining and quarrying 370 11 4 385
10 Manufacture of food products 720 58 25 803
11 Manufacture of beverages 47 12 8 67
12 Manufacture of tobacco products 1 3 - 4
13 Manufacture of textiles 31 9 2 42
14 Manufacture of wearing apparel 15 2 1 18
15 Manufacture of leather and related products 20 7 1 28
16 Manufacture of wood and of products of wood and cork, except furniture; manufacture of articles of straw and plaiting materials 105 8 3 116
17 Manufacture of paper and paper products 12 4 - 16
18 Printing and reproduction of recorded media 54 2 4 60
19 Manufacture of coke and refined petroleum products 1 1 2 4
20 Manufacture of chemicals and chemical products 47 5 3 55
21 Manufacture of basic pharmaceutical products and pharmaceutical preparations 3 2 1 6
22 Manufacture of rubber and plastics products 31 22 5 58
23 Manufacture of other non-metallic mineral products 187 24 11 222
24 Manufacture of basic metals 35 10 3 48
25 Manufacture of fabricated metal products, except machinery and equipment 69 5 4 78
26 Manufacture of computer, electronic and optical products 2 2 - 4
27 Manufacture of electrical equipment 17 4 2 23
28 Manufacture of machinery and equipment n.e.c. 14 - - 14
29 Manufacture of motor vehicles, trailers and semi-trailers 12 2 - 14
30 Manufacture of other transport equipment 2 1 - 3
31 Manufacture of furniture 187 6 2 195
32 Other manufacturing 36 8 1 45
33 Repair and installation of machinery and equipment 6 1 1 8
C Manufacturing 1,654 198 79 1,931
D Electricity, gas, steam and air conditioning supply 34 2 - 36
36 Water collection, treatment and supply 104 1 1 106
38 Waste collection, treatment and disposal activities; materials recovery 1 3 - 4
E Water supply sewerage, waste management 105 4 1 110
Total 2,163 215 84 2,462
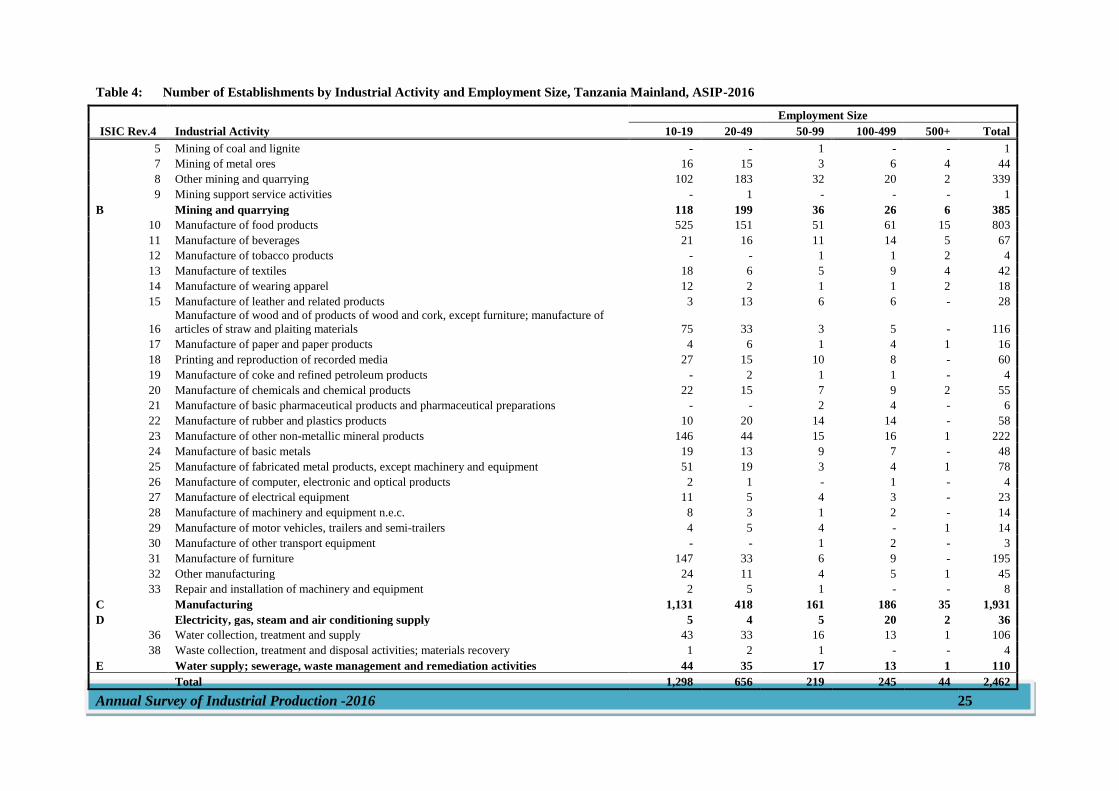
Annual Survey of Industrial Production -2016 25
Table 4: Number of Establishments by Industrial Activity and Employment Size, Tanzania Mainland, ASIP-2016
ISIC Rev.4 Industrial Activity
Employment Size
10-19 20-49 50-99 100-499 500+ Total
5 Mining of coal and lignite - - 1 - - 1
7 Mining of metal ores 16 15 3 6 4 44
8 Other mining and quarrying 102 183 32 20 2 339
9 Mining support service activities - 1 - - - 1
B Mining and quarrying 118 199 36 26 6 385
10 Manufacture of food products 525 151 51 61 15 803
11 Manufacture of beverages 21 16 11 14 5 67
12 Manufacture of tobacco products - - 1 1 2 4
13 Manufacture of textiles 18 6 5 9 4 42
14 Manufacture of wearing apparel 12 2 1 1 2 18
15 Manufacture of leather and related products 3 13 6 6 - 28
16
Manufacture of wood and of products of wood and cork, except furniture; manufacture of
articles of straw and plaiting materials 75 33 3 5 - 116
17 Manufacture of paper and paper products 4 6 1 4 1 16
18 Printing and reproduction of recorded media 27 15 10 8 - 60
19 Manufacture of coke and refined petroleum products - 2 1 1 - 4
20 Manufacture of chemicals and chemical products 22 15 7 9 2 55
21 Manufacture of basic pharmaceutical products and pharmaceutical preparations - - 2 4 - 6
22 Manufacture of rubber and plastics products 10 20 14 14 - 58
23 Manufacture of other non-metallic mineral products 146 44 15 16 1 222
24 Manufacture of basic metals 19 13 9 7 - 48
25 Manufacture of fabricated metal products, except machinery and equipment 51 19 3 4 1 78
26 Manufacture of computer, electronic and optical products 2 1 - 1 - 4
27 Manufacture of electrical equipment 11 5 4 3 - 23
28 Manufacture of machinery and equipment n.e.c. 8 3 1 2 - 14
29 Manufacture of motor vehicles, trailers and semi-trailers 4 5 4 - 1 14
30 Manufacture of other transport equipment - - 1 2 - 3
31 Manufacture of furniture 147 33 6 9 - 195
32 Other manufacturing 24 11 4 5 1 45
33 Repair and installation of machinery and equipment 2 5 1 - - 8
C Manufacturing 1,131 418 161 186 35 1,931
D Electricity, gas, steam and air conditioning supply 5 4 5 20 2 36
36 Water collection, treatment and supply 43 33 16 13 1 106
38 Waste collection, treatment and disposal activities; materials recovery 1 2 1 - - 4
E Water supply; sewerage, waste management and remediation activities 44 35 17 13 1 110
Total 1,298 656 219 245 44 2,462
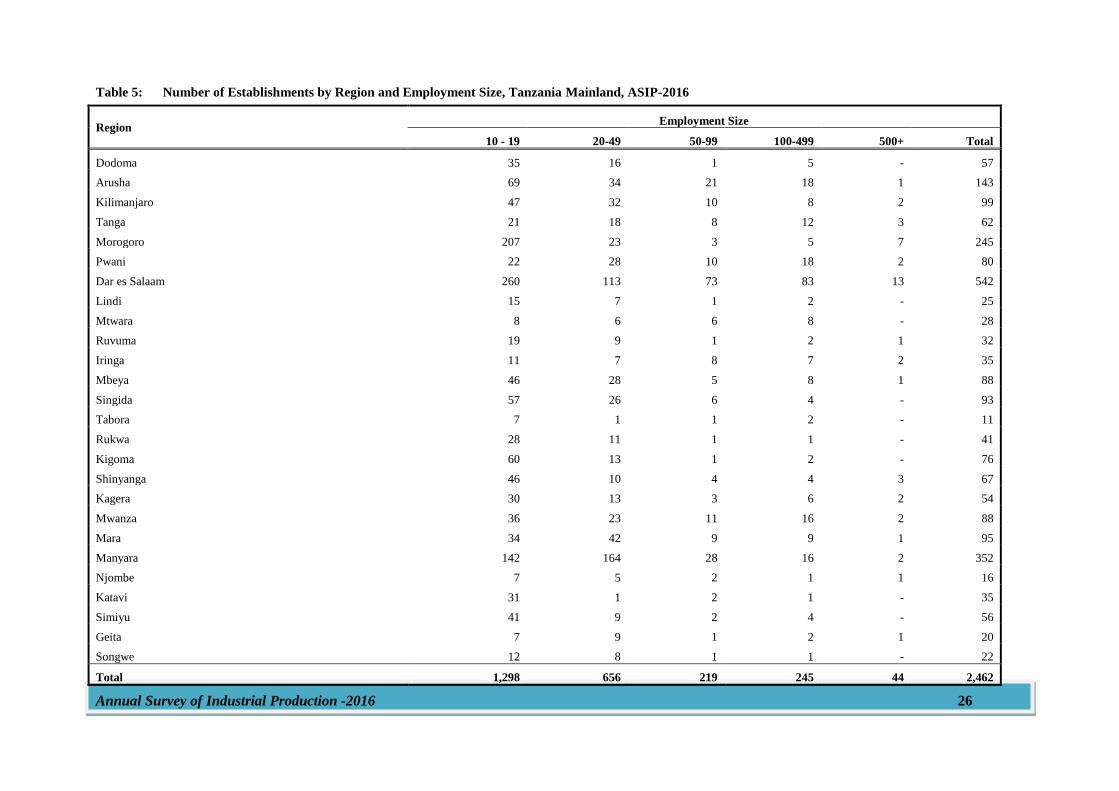
Annual Survey of Industrial Production -2016 26
Table 5: Number of Establishments by Region and Employment Size, Tanzania Mainland, ASIP-2016
Region Employment Size
10 - 19 20-49 50-99 100-499 500+ Total
Dodoma 35 16 1 5 - 57
Arusha 69 34 21 18 1 143
Kilimanjaro 47 32 10 8 2 99
Tanga 21 18 8 12 3 62
Morogoro 207 23 3 5 7 245
Pwani 22 28 10 18 2 80
Dar es Salaam 260 113 73 83 13 542
Lindi 15 7 1 2 - 25
Mtwara 8 6 6 8 - 28
Ruvuma 19 9 1 2 1 32
Iringa 11 7 8 7 2 35
Mbeya 46 28 5 8 1 88
Singida 57 26 6 4 - 93
Tabora 7 1 1 2 - 11
Rukwa 28 11 1 1 - 41
Kigoma 60 13 1 2 - 76
Shinyanga 46 10 4 4 3 67
Kagera 30 13 3 6 2 54
Mwanza 36 23 11 16 2 88
Mara 34 42 9 9 1 95
Manyara 142 164 28 16 2 352
Njombe 7 5 2 1 1 16
Katavi 31 1 2 1 - 35
Simiyu 41 9 2 4 - 56
Geita 7 9 1 2 1 20
Songwe 12 8 1 1 - 22
Total 1,298 656 219 245 44 2,462
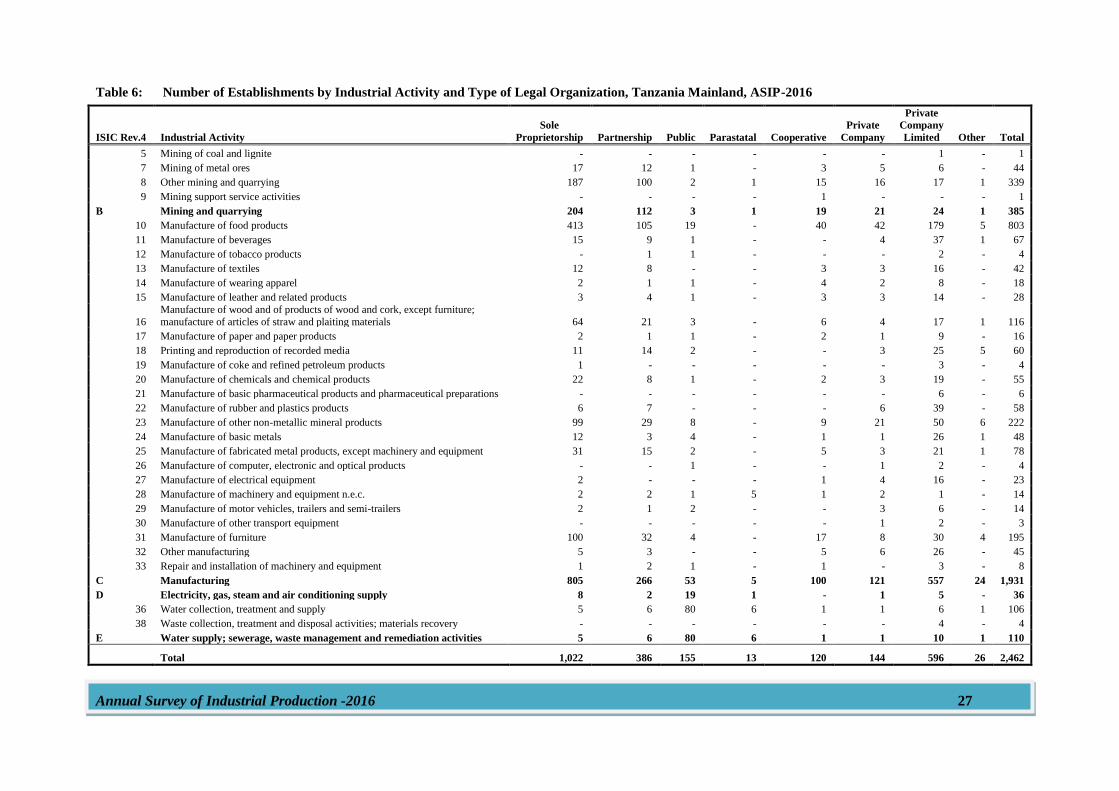
Annual Survey of Industrial Production -2016 27
Table 6: Number of Establishments by Industrial Activity and Type of Legal Organization, Tanzania Mainland, ASIP-2016
ISIC Rev.4 Industrial Activity
Sole
Proprietorship Partnership Public Parastatal Cooperative
Private
Company
Private
Company
Limited Other Total
5 Mining of coal and lignite - - - - - - 1 - 1
7 Mining of metal ores 17 12 1 - 3 5 6 - 44
8 Other mining and quarrying 187 100 2 1 15 16 17 1 339
9 Mining support service activities - - - - 1 - - - 1
B Mining and quarrying 204 112 3 1 19 21 24 1 385
10 Manufacture of food products 413 105 19 - 40 42 179 5 803
11 Manufacture of beverages 15 9 1 - - 4 37 1 67
12 Manufacture of tobacco products - 1 1 - - - 2 - 4
13 Manufacture of textiles 12 8 - - 3 3 16 - 42
14 Manufacture of wearing apparel 2 1 1 - 4 2 8 - 18
15 Manufacture of leather and related products 3 4 1 - 3 3 14 - 28
16
Manufacture of wood and of products of wood and cork, except furniture;
manufacture of articles of straw and plaiting materials 64 21 3 - 6 4 17 1 116
17 Manufacture of paper and paper products 2 1 1 - 2 1 9 - 16
18 Printing and reproduction of recorded media 11 14 2 - - 3 25 5 60
19 Manufacture of coke and refined petroleum products 1 - - - - - 3 - 4
20 Manufacture of chemicals and chemical products 22 8 1 - 2 3 19 - 55
21 Manufacture of basic pharmaceutical products and pharmaceutical preparations - - - - - - 6 - 6
22 Manufacture of rubber and plastics products 6 7 - - - 6 39 - 58
23 Manufacture of other non-metallic mineral products 99 29 8 - 9 21 50 6 222
24 Manufacture of basic metals 12 3 4 - 1 1 26 1 48
25 Manufacture of fabricated metal products, except machinery and equipment 31 15 2 - 5 3 21 1 78
26 Manufacture of computer, electronic and optical products - - 1 - - 1 2 - 4
27 Manufacture of electrical equipment 2 - - - 1 4 16 - 23
28 Manufacture of machinery and equipment n.e.c. 2 2 1 5 1 2 1 - 14
29 Manufacture of motor vehicles, trailers and semi-trailers 2 1 2 - - 3 6 - 14
30 Manufacture of other transport equipment - - - - - 1 2 - 3
31 Manufacture of furniture 100 32 4 - 17 8 30 4 195
32 Other manufacturing 5 3 - - 5 6 26 - 45
33 Repair and installation of machinery and equipment 1 2 1 - 1 - 3 - 8
C Manufacturing 805 266 53 5 100 121 557 24 1,931
D Electricity, gas, steam and air conditioning supply 8 2 19 1 - 1 5 - 36
36 Water collection, treatment and supply 5 6 80 6 1 1 6 1 106
38 Waste collection, treatment and disposal activities; materials recovery - - - - - - 4 - 4
E Water supply; sewerage, waste management and remediation activities 5 6 80 6 1 1 10 1 110
Total 1,022 386 155 13 120 144 596 26 2,462
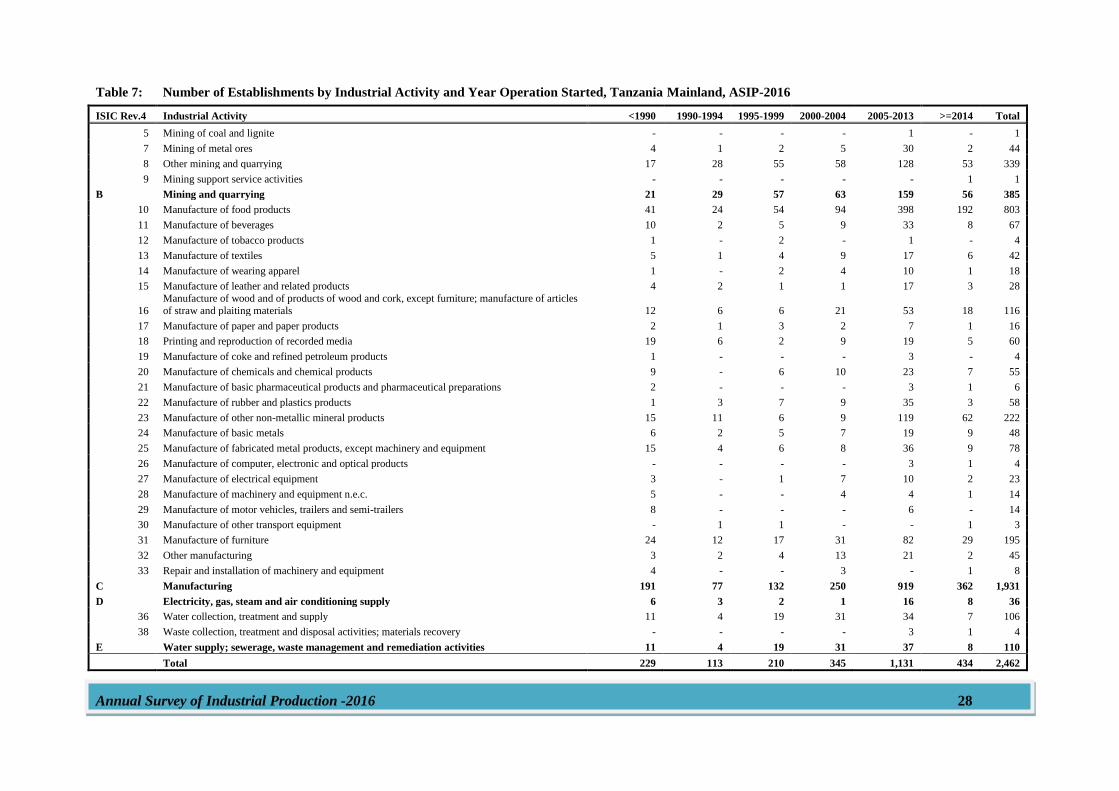
Annual Survey of Industrial Production -2016 28
Table 7: Number of Establishments by Industrial Activity and Year Operation Started, Tanzania Mainland, ASIP-2016
ISIC Rev.4 Industrial Activity <1990 1990-1994 1995-1999 2000-2004 2005-2013 >=2014 Total
5 Mining of coal and lignite - - - - 1 - 1
7 Mining of metal ores 4 1 2 5 30 2 44
8 Other mining and quarrying 17 28 55 58 128 53 339
9 Mining support service activities - - - - - 1 1
B Mining and quarrying 21 29 57 63 159 56 385
10 Manufacture of food products 41 24 54 94 398 192 803
11 Manufacture of beverages 10 2 5 9 33 8 67
12 Manufacture of tobacco products 1 - 2 - 1 - 4
13 Manufacture of textiles 5 1 4 9 17 6 42
14 Manufacture of wearing apparel 1 - 2 4 10 1 18
15 Manufacture of leather and related products 4 2 1 1 17 3 28
16
Manufacture of wood and of products of wood and cork, except furniture; manufacture of articles
of straw and plaiting materials 12 6 6 21 53 18 116
17 Manufacture of paper and paper products 2 1 3 2 7 1 16
18 Printing and reproduction of recorded media 19 6 2 9 19 5 60
19 Manufacture of coke and refined petroleum products 1 - - - 3 - 4
20 Manufacture of chemicals and chemical products 9 - 6 10 23 7 55
21 Manufacture of basic pharmaceutical products and pharmaceutical preparations 2 - - - 3 1 6
22 Manufacture of rubber and plastics products 1 3 7 9 35 3 58
23 Manufacture of other non-metallic mineral products 15 11 6 9 119 62 222
24 Manufacture of basic metals 6 2 5 7 19 9 48
25 Manufacture of fabricated metal products, except machinery and equipment 15 4 6 8 36 9 78
26 Manufacture of computer, electronic and optical products - - - - 3 1 4
27 Manufacture of electrical equipment 3 - 1 7 10 2 23
28 Manufacture of machinery and equipment n.e.c. 5 - - 4 4 1 14
29 Manufacture of motor vehicles, trailers and semi-trailers 8 - - - 6 - 14
30 Manufacture of other transport equipment - 1 1 - - 1 3
31 Manufacture of furniture 24 12 17 31 82 29 195
32 Other manufacturing 3 2 4 13 21 2 45
33 Repair and installation of machinery and equipment 4 - - 3 - 1 8
C Manufacturing 191 77 132 250 919 362 1,931
D Electricity, gas, steam and air conditioning supply 6 3 2 1 16 8 36
36 Water collection, treatment and supply 11 4 19 31 34 7 106
38 Waste collection, treatment and disposal activities; materials recovery - - - - 3 1 4
E Water supply; sewerage, waste management and remediation activities 11 4 19 31 37 8 110
Total 229 113 210 345 1,131 434 2,462
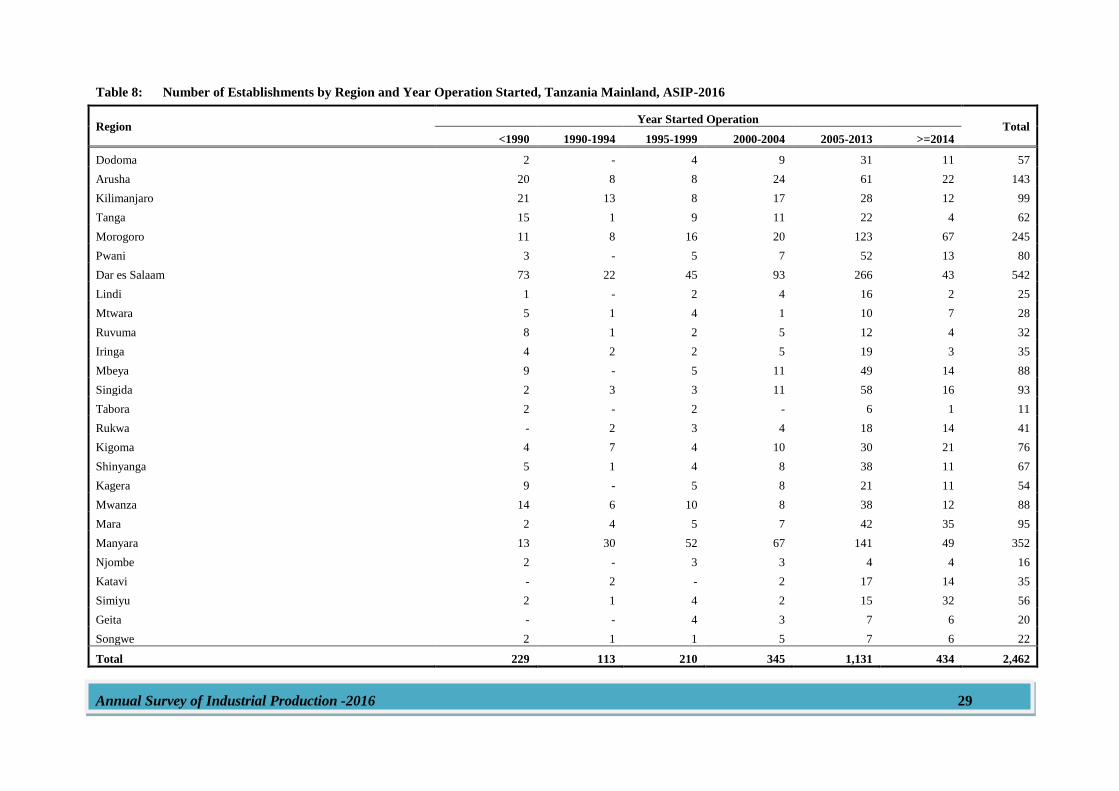
Annual Survey of Industrial Production -2016 29
Table 8: Number of Establishments by Region and Year Operation Started, Tanzania Mainland, ASIP-2016
Region Year Started Operation
Total <1990 1990-1994 1995-1999 2000-2004 2005-2013 >=2014
Dodoma 2 - 4 9 31 11 57
Arusha 20 8 8 24 61 22 143
Kilimanjaro 21 13 8 17 28 12 99
Tanga 15 1 9 11 22 4 62
Morogoro 11 8 16 20 123 67 245
Pwani 3 - 5 7 52 13 80
Dar es Salaam 73 22 45 93 266 43 542
Lindi 1 - 2 4 16 2 25
Mtwara 5 1 4 1 10 7 28
Ruvuma 8 1 2 5 12 4 32
Iringa 4 2 2 5 19 3 35
Mbeya 9 - 5 11 49 14 88
Singida 2 3 3 11 58 16 93
Tabora 2 - 2 - 6 1 11
Rukwa - 2 3 4 18 14 41
Kigoma 4 7 4 10 30 21 76
Shinyanga 5 1 4 8 38 11 67
Kagera 9 - 5 8 21 11 54
Mwanza 14 6 10 8 38 12 88
Mara 2 4 5 7 42 35 95
Manyara 13 30 52 67 141 49 352
Njombe 2 - 3 3 4 4 16
Katavi - 2 - 2 17 14 35
Simiyu 2 1 4 2 15 32 56
Geita - - 4 3 7 6 20
Songwe 2 1 1 5 7 6 22
Total 229 113 210 345 1,131 434 2,462
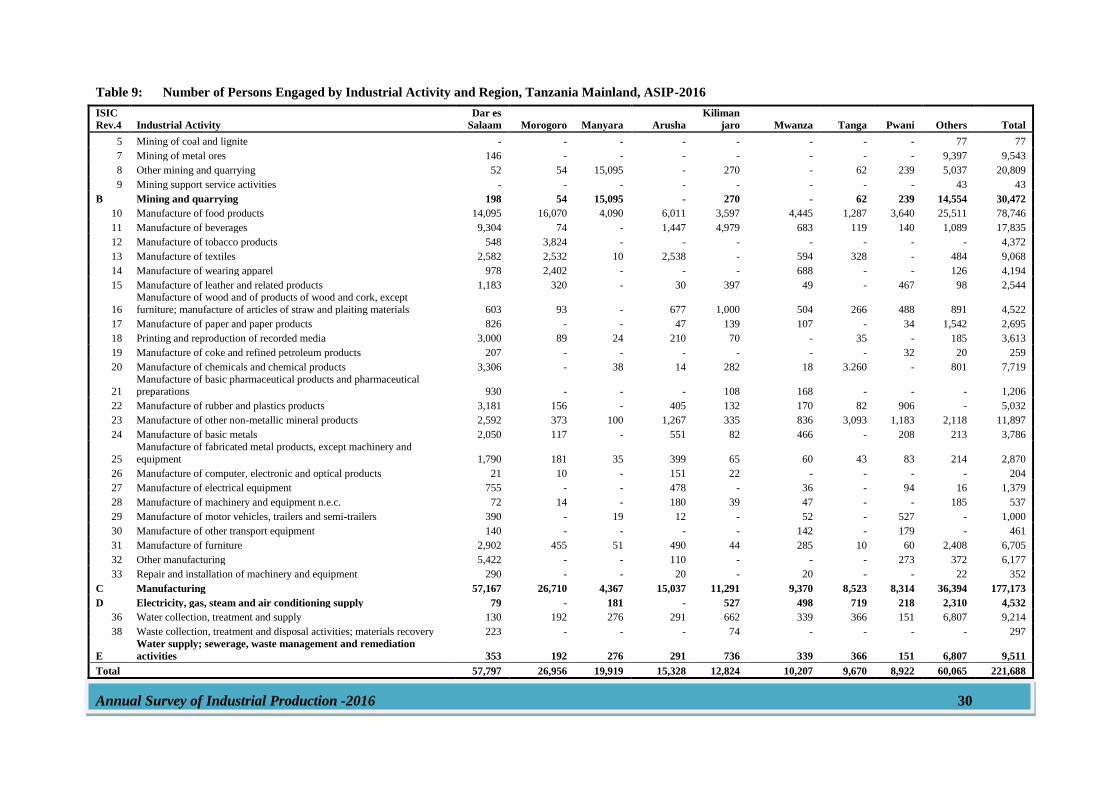
Annual Survey of Industrial Production -2016 30
Table 9: Number of Persons Engaged by Industrial Activity and Region, Tanzania Mainland, ASIP-2016
ISIC
Rev.4 Industrial Activity
Dar es
Salaam Morogoro Manyara Arusha
Kiliman
jaro Mwanza Tanga Pwani Others Total
5 Mining of coal and lignite - - - - - - - - 77 77
7 Mining of metal ores 146 - - - - - - - 9,397 9,543
8 Other mining and quarrying 52 54 15,095 - 270 - 62 239 5,037 20,809
9 Mining support service activities - - - - - - - - 43 43
B Mining and quarrying 198 54 15,095 - 270 - 62 239 14,554 30,472
10 Manufacture of food products 14,095 16,070 4,090 6,011 3,597 4,445 1,287 3,640 25,511 78,746
11 Manufacture of beverages 9,304 74 - 1,447 4,979 683 119 140 1,089 17,835
12 Manufacture of tobacco products 548 3,824 - - - - - - - 4,372
13 Manufacture of textiles 2,582 2,532 10 2,538 - 594 328 - 484 9,068
14 Manufacture of wearing apparel 978 2,402 - - - 688 - - 126 4,194
15 Manufacture of leather and related products 1,183 320 - 30 397 49 - 467 98 2,544
16
Manufacture of wood and of products of wood and cork, except
furniture; manufacture of articles of straw and plaiting materials 603 93 - 677 1,000 504 266 488 891 4,522
17 Manufacture of paper and paper products 826 - - 47 139 107 - 34 1,542 2,695
18 Printing and reproduction of recorded media 3,000 89 24 210 70 - 35 - 185 3,613
19 Manufacture of coke and refined petroleum products 207 - - - - - - 32 20 259
20 Manufacture of chemicals and chemical products 3,306 - 38 14 282 18 3.260 - 801 7,719
21 Manufacture of basic pharmaceutical products and pharmaceutical preparations 930 - - - 108 168 - - - 1,206
22 Manufacture of rubber and plastics products 3,181 156 - 405 132 170 82 906 - 5,032
23 Manufacture of other non-metallic mineral products 2,592 373 100 1,267 335 836 3,093 1,183 2,118 11,897
24 Manufacture of basic metals 2,050 117 - 551 82 466 - 208 213 3,786
25
Manufacture of fabricated metal products, except machinery and
equipment 1,790 181 35 399 65 60 43 83 214 2,870
26 Manufacture of computer, electronic and optical products 21 10 - 151 22 - - - - 204
27 Manufacture of electrical equipment 755 - - 478 - 36 - 94 16 1,379
28 Manufacture of machinery and equipment n.e.c. 72 14 - 180 39 47 - - 185 537
29 Manufacture of motor vehicles, trailers and semi-trailers 390 - 19 12 - 52 - 527 - 1,000
30 Manufacture of other transport equipment 140 - - - - 142 - 179 - 461
31 Manufacture of furniture 2,902 455 51 490 44 285 10 60 2,408 6,705
32 Other manufacturing 5,422 - - 110 - - - 273 372 6,177
33 Repair and installation of machinery and equipment 290 - - 20 - 20 - - 22 352
C Manufacturing 57,167 26,710 4,367 15,037 11,291 9,370 8,523 8,314 36,394 177,173
D Electricity, gas, steam and air conditioning supply 79 - 181 - 527 498 719 218 2,310 4,532
36 Water collection, treatment and supply 130 192 276 291 662 339 366 151 6,807 9,214
38 Waste collection, treatment and disposal activities; materials recovery 223 - - - 74 - - - - 297
E
Water supply; sewerage, waste management and remediation
activities 353 192 276 291 736 339 366 151 6,807 9,511
Total 57,797 26,956 19,919 15,328 12,824 10,207 9,670 8,922 60,065 221,688
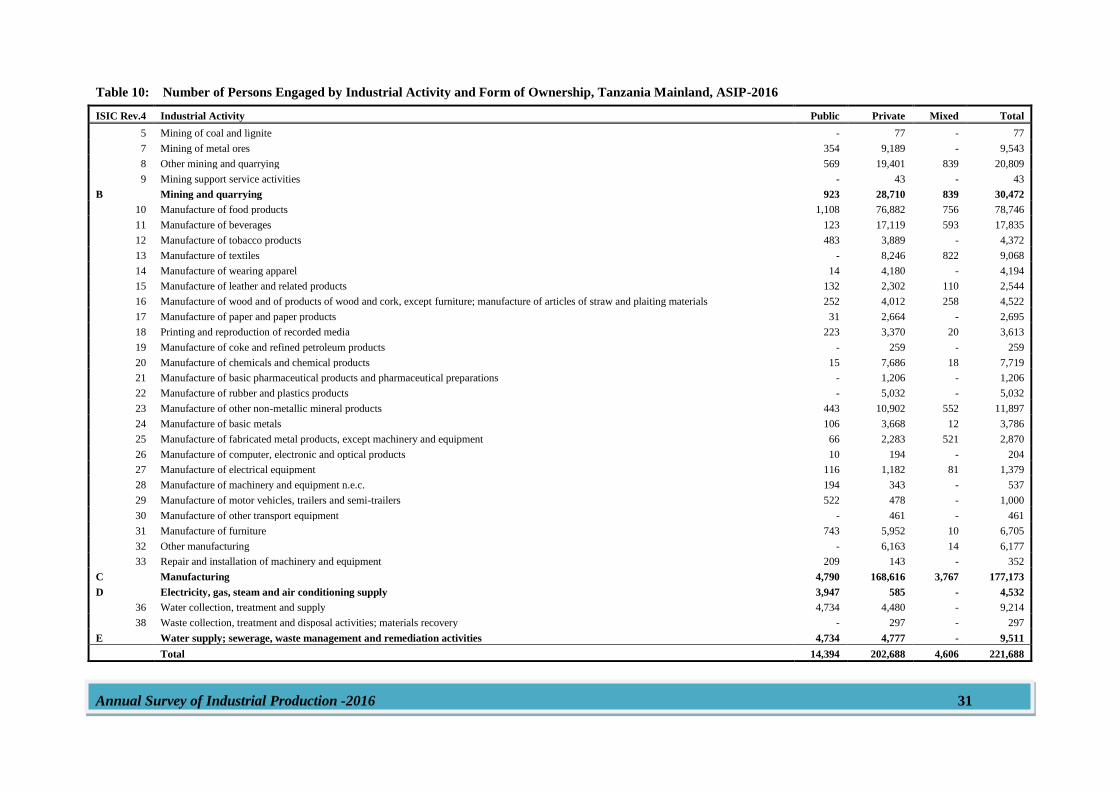
Annual Survey of Industrial Production -2016 31
Table 10: Number of Persons Engaged by Industrial Activity and Form of Ownership, Tanzania Mainland, ASIP-2016
ISIC Rev.4 Industrial Activity Public Private Mixed Total
5 Mining of coal and lignite - 77 - 77
7 Mining of metal ores 354 9,189 - 9,543
8 Other mining and quarrying 569 19,401 839 20,809
9 Mining support service activities - 43 - 43
B Mining and quarrying 923 28,710 839 30,472
10 Manufacture of food products 1,108 76,882 756 78,746
11 Manufacture of beverages 123 17,119 593 17,835
12 Manufacture of tobacco products 483 3,889 - 4,372
13 Manufacture of textiles - 8,246 822 9,068
14 Manufacture of wearing apparel 14 4,180 - 4,194
15 Manufacture of leather and related products 132 2,302 110 2,544
16 Manufacture of wood and of products of wood and cork, except furniture; manufacture of articles of straw and plaiting materials 252 4,012 258 4,522
17 Manufacture of paper and paper products 31 2,664 - 2,695
18 Printing and reproduction of recorded media 223 3,370 20 3,613
19 Manufacture of coke and refined petroleum products - 259 - 259
20 Manufacture of chemicals and chemical products 15 7,686 18 7,719
21 Manufacture of basic pharmaceutical products and pharmaceutical preparations - 1,206 - 1,206
22 Manufacture of rubber and plastics products - 5,032 - 5,032
23 Manufacture of other non-metallic mineral products 443 10,902 552 11,897
24 Manufacture of basic metals 106 3,668 12 3,786
25 Manufacture of fabricated metal products, except machinery and equipment 66 2,283 521 2,870
26 Manufacture of computer, electronic and optical products 10 194 - 204
27 Manufacture of electrical equipment 116 1,182 81 1,379
28 Manufacture of machinery and equipment n.e.c. 194 343 - 537
29 Manufacture of motor vehicles, trailers and semi-trailers 522 478 - 1,000
30 Manufacture of other transport equipment - 461 - 461
31 Manufacture of furniture 743 5,952 10 6,705
32 Other manufacturing - 6,163 14 6,177
33 Repair and installation of machinery and equipment 209 143 - 352
C Manufacturing 4,790 168,616 3,767 177,173
D Electricity, gas, steam and air conditioning supply 3,947 585 - 4,532
36 Water collection, treatment and supply 4,734 4,480 - 9,214
38 Waste collection, treatment and disposal activities; materials recovery - 297 - 297
E Water supply; sewerage, waste management and remediation activities 4,734 4,777 - 9,511
Total 14,394 202,688 4,606 221,688
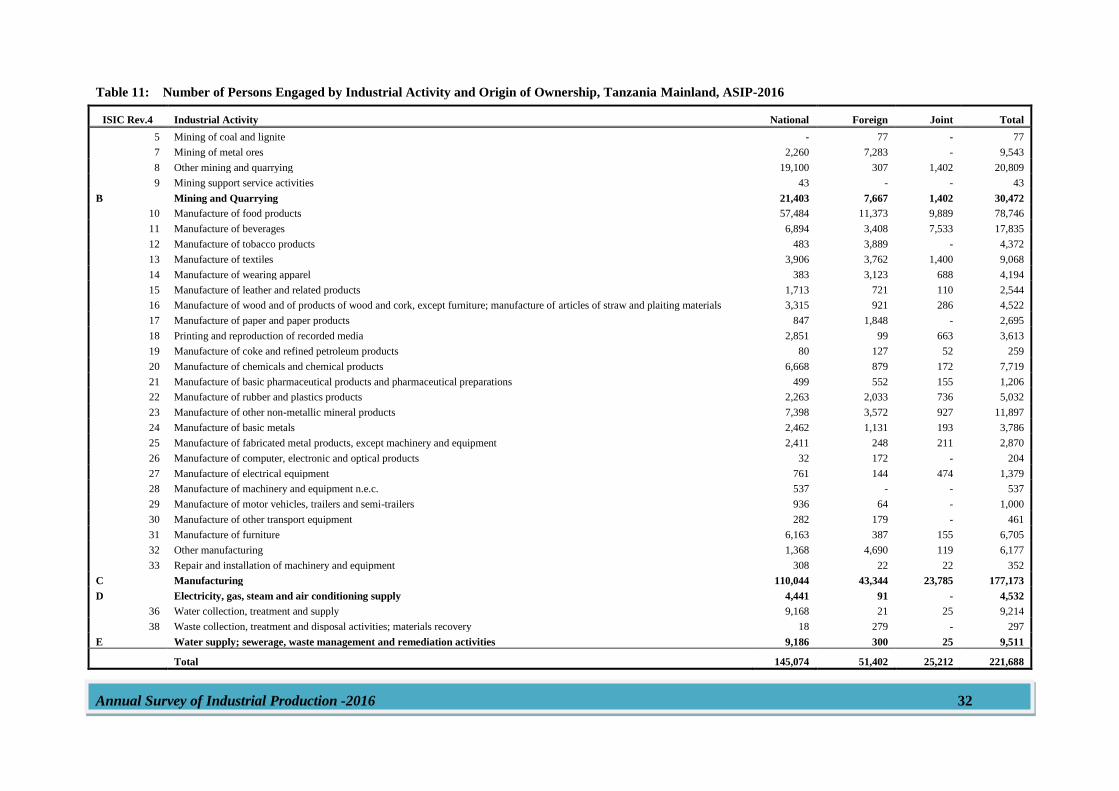
Annual Survey of Industrial Production -2016 32
Table 11: Number of Persons Engaged by Industrial Activity and Origin of Ownership, Tanzania Mainland, ASIP-2016
ISIC Rev.4 Industrial Activity National Foreign Joint Total
5 Mining of coal and lignite - 77 - 77
7 Mining of metal ores 2,260 7,283 - 9,543
8 Other mining and quarrying 19,100 307 1,402 20,809
9 Mining support service activities 43 - - 43
B Mining and Quarrying 21,403 7,667 1,402 30,472
10 Manufacture of food products 57,484 11,373 9,889 78,746
11 Manufacture of beverages 6,894 3,408 7,533 17,835
12 Manufacture of tobacco products 483 3,889 - 4,372
13 Manufacture of textiles 3,906 3,762 1,400 9,068
14 Manufacture of wearing apparel 383 3,123 688 4,194
15 Manufacture of leather and related products 1,713 721 110 2,544
16 Manufacture of wood and of products of wood and cork, except furniture; manufacture of articles of straw and plaiting materials 3,315 921 286 4,522
17 Manufacture of paper and paper products 847 1,848 - 2,695
18 Printing and reproduction of recorded media 2,851 99 663 3,613
19 Manufacture of coke and refined petroleum products 80 127 52 259
20 Manufacture of chemicals and chemical products 6,668 879 172 7,719
21 Manufacture of basic pharmaceutical products and pharmaceutical preparations 499 552 155 1,206
22 Manufacture of rubber and plastics products 2,263 2,033 736 5,032
23 Manufacture of other non-metallic mineral products 7,398 3,572 927 11,897
24 Manufacture of basic metals 2,462 1,131 193 3,786
25 Manufacture of fabricated metal products, except machinery and equipment 2,411 248 211 2,870
26 Manufacture of computer, electronic and optical products 32 172 - 204
27 Manufacture of electrical equipment 761 144 474 1,379
28 Manufacture of machinery and equipment n.e.c. 537 - - 537
29 Manufacture of motor vehicles, trailers and semi-trailers 936 64 - 1,000
30 Manufacture of other transport equipment 282 179 - 461
31 Manufacture of furniture 6,163 387 155 6,705
32 Other manufacturing 1,368 4,690 119 6,177
33 Repair and installation of machinery and equipment 308 22 22 352
C Manufacturing 110,044 43,344 23,785 177,173
D Electricity, gas, steam and air conditioning supply 4,441 91 - 4,532
36 Water collection, treatment and supply 9,168 21 25 9,214
38 Waste collection, treatment and disposal activities; materials recovery 18 279 - 297
E Water supply; sewerage, waste management and remediation activities 9,186 300 25 9,511
Total 145,074 51,402 25,212 221,688
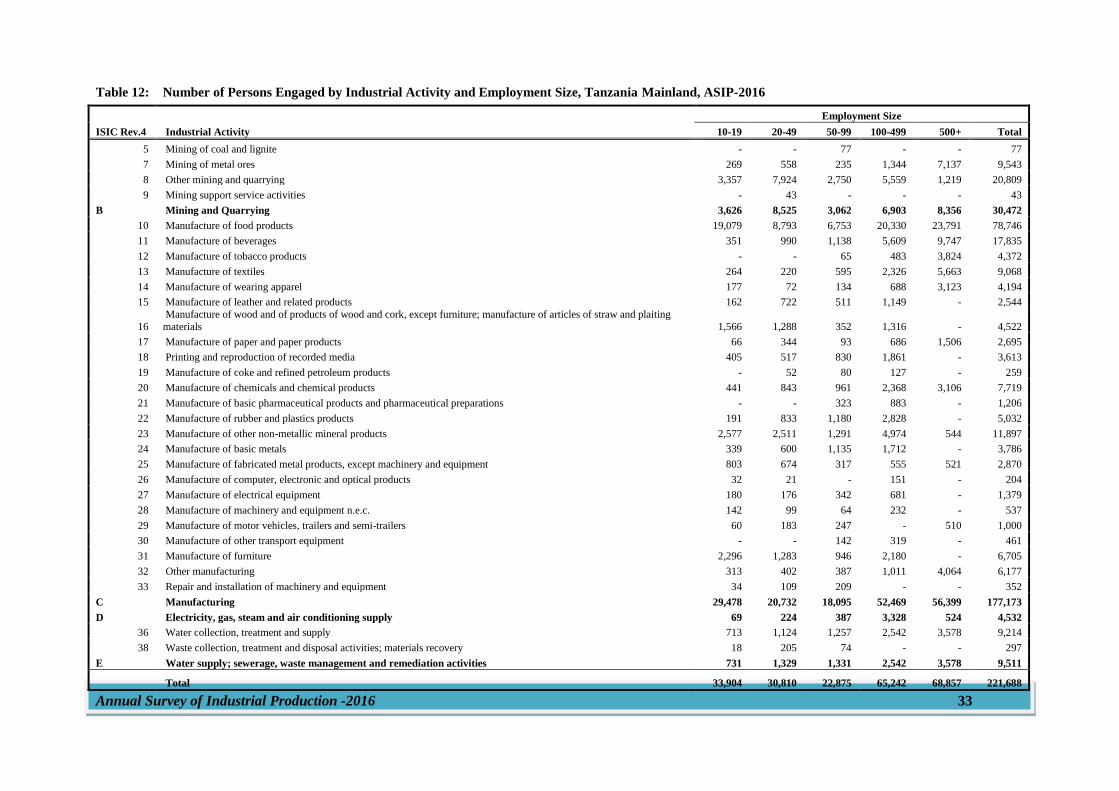
Annual Survey of Industrial Production -2016 33
Table 12: Number of Persons Engaged by Industrial Activity and Employment Size, Tanzania Mainland, ASIP-2016
ISIC Rev.4 Industrial Activity
Employment Size
10-19 20-49 50-99 100-499 500+ Total
5 Mining of coal and lignite - - 77 - - 77
7 Mining of metal ores 269 558 235 1,344 7,137 9,543
8 Other mining and quarrying 3,357 7,924 2,750 5,559 1,219 20,809
9 Mining support service activities - 43 - - - 43
B Mining and Quarrying 3,626 8,525 3,062 6,903 8,356 30,472
10 Manufacture of food products 19,079 8,793 6,753 20,330 23,791 78,746
11 Manufacture of beverages 351 990 1,138 5,609 9,747 17,835
12 Manufacture of tobacco products - - 65 483 3,824 4,372
13 Manufacture of textiles 264 220 595 2,326 5,663 9,068
14 Manufacture of wearing apparel 177 72 134 688 3,123 4,194
15 Manufacture of leather and related products 162 722 511 1,149 - 2,544
16
Manufacture of wood and of products of wood and cork, except furniture; manufacture of articles of straw and plaiting
materials 1,566 1,288 352 1,316 - 4,522
17 Manufacture of paper and paper products 66 344 93 686 1,506 2,695
18 Printing and reproduction of recorded media 405 517 830 1,861 - 3,613
19 Manufacture of coke and refined petroleum products - 52 80 127 - 259
20 Manufacture of chemicals and chemical products 441 843 961 2,368 3,106 7,719
21 Manufacture of basic pharmaceutical products and pharmaceutical preparations - - 323 883 - 1,206
22 Manufacture of rubber and plastics products 191 833 1,180 2,828 - 5,032
23 Manufacture of other non-metallic mineral products 2,577 2,511 1,291 4,974 544 11,897
24 Manufacture of basic metals 339 600 1,135 1,712 - 3,786
25 Manufacture of fabricated metal products, except machinery and equipment 803 674 317 555 521 2,870
26 Manufacture of computer, electronic and optical products 32 21 - 151 - 204
27 Manufacture of electrical equipment 180 176 342 681 - 1,379
28 Manufacture of machinery and equipment n.e.c. 142 99 64 232 - 537
29 Manufacture of motor vehicles, trailers and semi-trailers 60 183 247 - 510 1,000
30 Manufacture of other transport equipment - - 142 319 - 461
31 Manufacture of furniture 2,296 1,283 946 2,180 - 6,705
32 Other manufacturing 313 402 387 1,011 4,064 6,177
33 Repair and installation of machinery and equipment 34 109 209 - - 352
C Manufacturing 29,478 20,732 18,095 52,469 56,399 177,173
D Electricity, gas, steam and air conditioning supply 69 224 387 3,328 524 4,532
36 Water collection, treatment and supply 713 1,124 1,257 2,542 3,578 9,214
38 Waste collection, treatment and disposal activities; materials recovery 18 205 74 - - 297
E Water supply; sewerage, waste management and remediation activities 731 1,329 1,331 2,542 3,578 9,511
Total 33,904 30,810 22,875 65,242 68,857 221,688
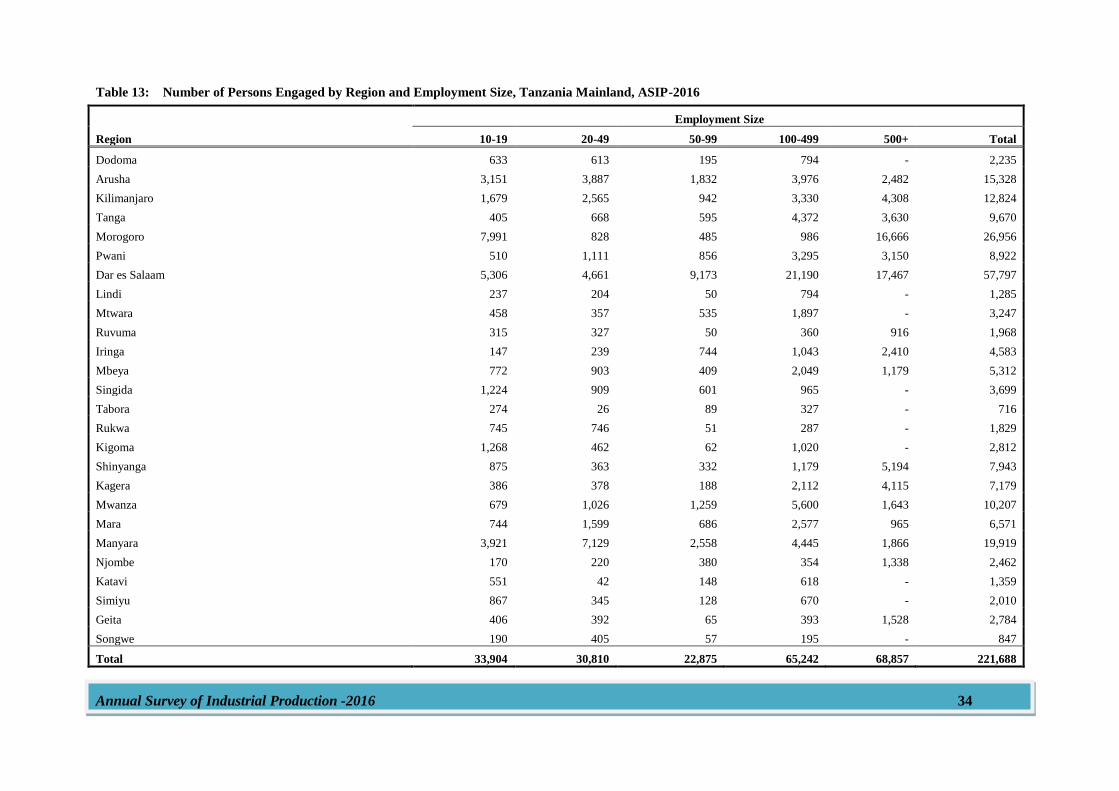
Annual Survey of Industrial Production -2016 34
Table 13: Number of Persons Engaged by Region and Employment Size, Tanzania Mainland, ASIP-2016
Region
Employment Size
10-19 20-49 50-99 100-499 500+ Total
Dodoma 633 613 195 794 - 2,235
Arusha 3,151 3,887 1,832 3,976 2,482 15,328
Kilimanjaro 1,679 2,565 942 3,330 4,308 12,824
Tanga 405 668 595 4,372 3,630 9,670
Morogoro 7,991 828 485 986 16,666 26,956
Pwani 510 1,111 856 3,295 3,150 8,922
Dar es Salaam 5,306 4,661 9,173 21,190 17,467 57,797
Lindi 237 204 50 794 - 1,285
Mtwara 458 357 535 1,897 - 3,247
Ruvuma 315 327 50 360 916 1,968
Iringa 147 239 744 1,043 2,410 4,583
Mbeya 772 903 409 2,049 1,179 5,312
Singida 1,224 909 601 965 - 3,699
Tabora 274 26 89 327 - 716
Rukwa 745 746 51 287 - 1,829
Kigoma 1,268 462 62 1,020 - 2,812
Shinyanga 875 363 332 1,179 5,194 7,943
Kagera 386 378 188 2,112 4,115 7,179
Mwanza 679 1,026 1,259 5,600 1,643 10,207
Mara 744 1,599 686 2,577 965 6,571
Manyara 3,921 7,129 2,558 4,445 1,866 19,919
Njombe 170 220 380 354 1,338 2,462
Katavi 551 42 148 618 - 1,359
Simiyu 867 345 128 670 - 2,010
Geita 406 392 65 393 1,528 2,784
Songwe 190 405 57 195 - 847
Total 33,904 30,810 22,875 65,242 68,857 221,688
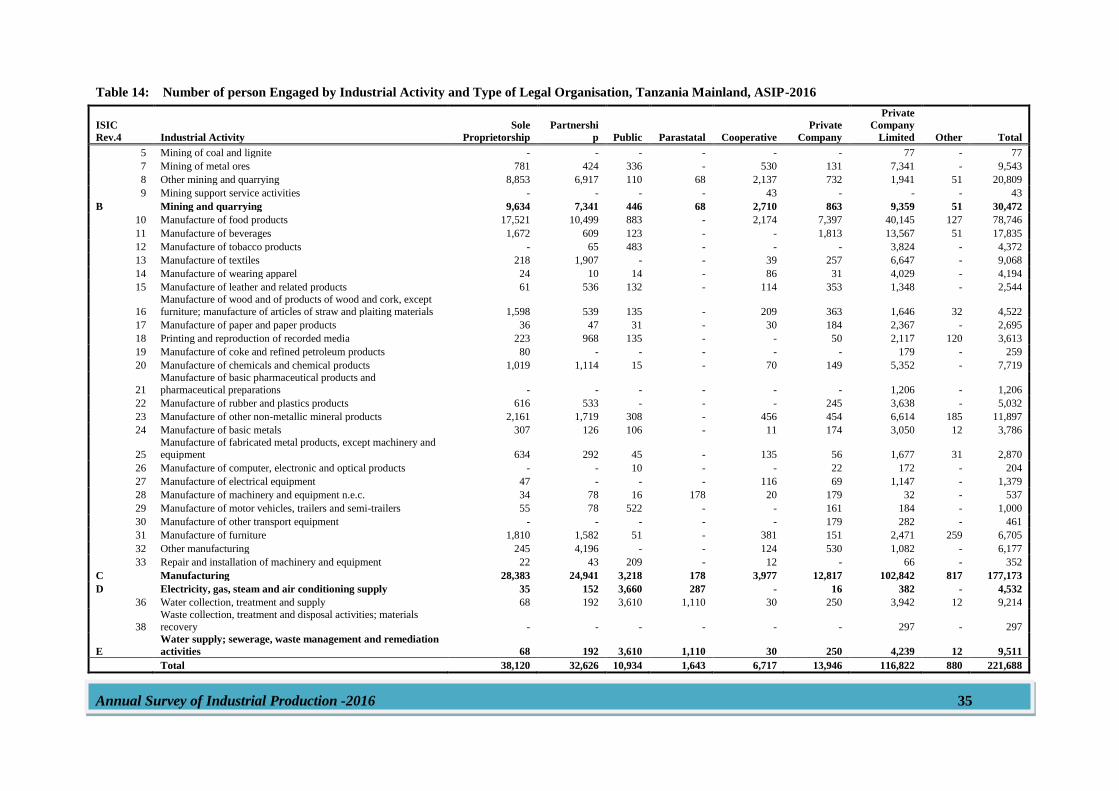
Annual Survey of Industrial Production -2016 35
Table 14: Number of person Engaged by Industrial Activity and Type of Legal Organisation, Tanzania Mainland, ASIP-2016
ISIC
Rev.4 Industrial Activity
Sole
Proprietorship
Partnershi
p Public Parastatal Cooperative
Private
Company
Private
Company
Limited Other Total
5 Mining of coal and lignite - - - - - - 77 - 77
7 Mining of metal ores 781 424 336 - 530 131 7,341 - 9,543
8 Other mining and quarrying 8,853 6,917 110 68 2,137 732 1,941 51 20,809
9 Mining support service activities - - - - 43 - - - 43
B Mining and quarrying 9,634 7,341 446 68 2,710 863 9,359 51 30,472
10 Manufacture of food products 17,521 10,499 883 - 2,174 7,397 40,145 127 78,746
11 Manufacture of beverages 1,672 609 123 - - 1,813 13,567 51 17,835
12 Manufacture of tobacco products - 65 483 - - - 3,824 - 4,372
13 Manufacture of textiles 218 1,907 - - 39 257 6,647 - 9,068
14 Manufacture of wearing apparel 24 10 14 - 86 31 4,029 - 4,194
15 Manufacture of leather and related products 61 536 132 - 114 353 1,348 - 2,544
16
Manufacture of wood and of products of wood and cork, except
furniture; manufacture of articles of straw and plaiting materials 1,598 539 135 - 209 363 1,646 32 4,522
17 Manufacture of paper and paper products 36 47 31 - 30 184 2,367 - 2,695
18 Printing and reproduction of recorded media 223 968 135 - - 50 2,117 120 3,613
19 Manufacture of coke and refined petroleum products 80 - - - - - 179 - 259
20 Manufacture of chemicals and chemical products 1,019 1,114 15 - 70 149 5,352 - 7,719
21
Manufacture of basic pharmaceutical products and
pharmaceutical preparations - - - - - - 1,206 - 1,206
22 Manufacture of rubber and plastics products 616 533 - - - 245 3,638 - 5,032
23 Manufacture of other non-metallic mineral products 2,161 1,719 308 - 456 454 6,614 185 11,897
24 Manufacture of basic metals 307 126 106 - 11 174 3,050 12 3,786
25 Manufacture of fabricated metal products, except machinery and equipment 634 292 45 - 135 56 1,677 31 2,870
26 Manufacture of computer, electronic and optical products - - 10 - - 22 172 - 204
27 Manufacture of electrical equipment 47 - - - 116 69 1,147 - 1,379
28 Manufacture of machinery and equipment n.e.c. 34 78 16 178 20 179 32 - 537
29 Manufacture of motor vehicles, trailers and semi-trailers 55 78 522 - - 161 184 - 1,000
30 Manufacture of other transport equipment - - - - - 179 282 - 461
31 Manufacture of furniture 1,810 1,582 51 - 381 151 2,471 259 6,705
32 Other manufacturing 245 4,196 - - 124 530 1,082 - 6,177
33 Repair and installation of machinery and equipment 22 43 209 - 12 - 66 - 352
C Manufacturing 28,383 24,941 3,218 178 3,977 12,817 102,842 817 177,173
D Electricity, gas, steam and air conditioning supply 35 152 3,660 287 - 16 382 - 4,532
36 Water collection, treatment and supply 68 192 3,610 1,110 30 250 3,942 12 9,214
38
Waste collection, treatment and disposal activities; materials
recovery - - - - - - 297 - 297
E
Water supply; sewerage, waste management and remediation
activities 68 192 3,610 1,110 30 250 4,239 12 9,511
Total 38,120 32,626 10,934 1,643 6,717 13,946 116,822 880 221,688
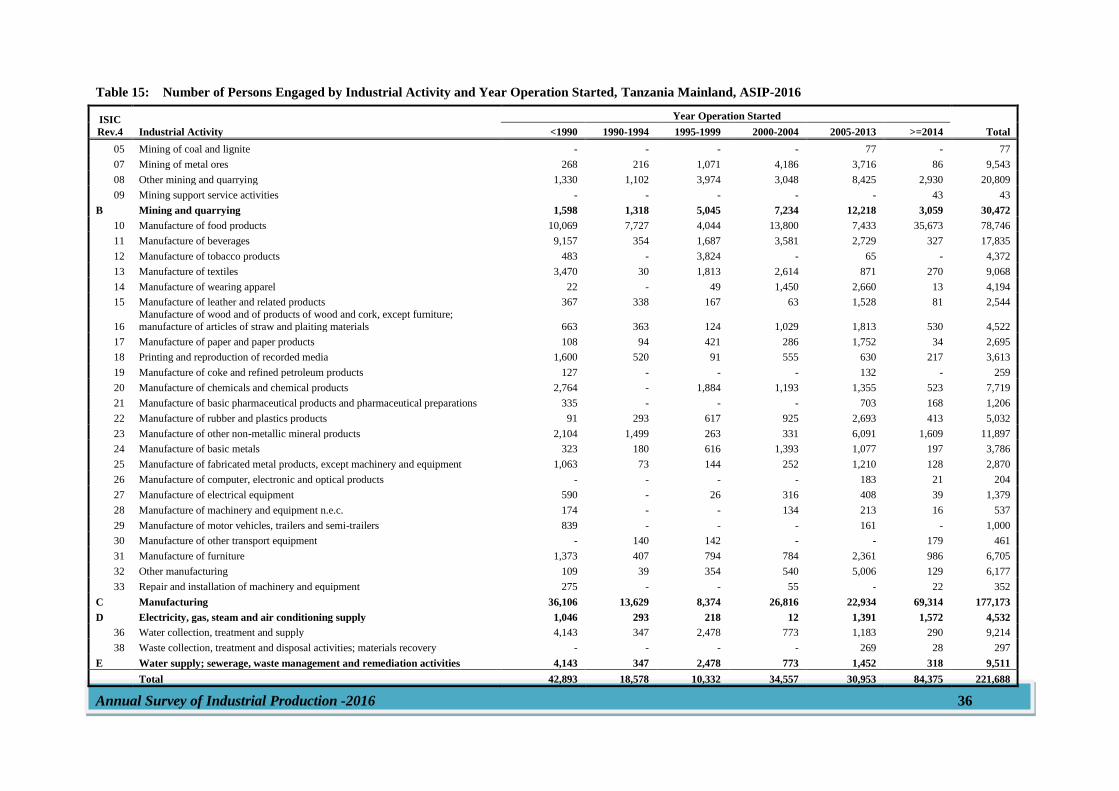
Annual Survey of Industrial Production -2016 36
Table 15: Number of Persons Engaged by Industrial Activity and Year Operation Started, Tanzania Mainland, ASIP-2016
ISIC
Rev.4 Industrial Activity
Year Operation Started
Total <1990 1990-1994 1995-1999 2000-2004 2005-2013 >=2014
05 Mining of coal and lignite - - - - 77 - 77
07 Mining of metal ores 268 216 1,071 4,186 3,716 86 9,543
08 Other mining and quarrying 1,330 1,102 3,974 3,048 8,425 2,930 20,809
09 Mining support service activities - - - - - 43 43
B Mining and quarrying 1,598 1,318 5,045 7,234 12,218 3,059 30,472
10 Manufacture of food products 10,069 7,727 4,044 13,800 7,433 35,673 78,746
11 Manufacture of beverages 9,157 354 1,687 3,581 2,729 327 17,835
12 Manufacture of tobacco products 483 - 3,824 - 65 - 4,372
13 Manufacture of textiles 3,470 30 1,813 2,614 871 270 9,068
14 Manufacture of wearing apparel 22 - 49 1,450 2,660 13 4,194
15 Manufacture of leather and related products 367 338 167 63 1,528 81 2,544
16
Manufacture of wood and of products of wood and cork, except furniture;
manufacture of articles of straw and plaiting materials 663 363 124 1,029 1,813 530 4,522
17 Manufacture of paper and paper products 108 94 421 286 1,752 34 2,695
18 Printing and reproduction of recorded media 1,600 520 91 555 630 217 3,613
19 Manufacture of coke and refined petroleum products 127 - - - 132 - 259
20 Manufacture of chemicals and chemical products 2,764 - 1,884 1,193 1,355 523 7,719
21 Manufacture of basic pharmaceutical products and pharmaceutical preparations 335 - - - 703 168 1,206
22 Manufacture of rubber and plastics products 91 293 617 925 2,693 413 5,032
23 Manufacture of other non-metallic mineral products 2,104 1,499 263 331 6,091 1,609 11,897
24 Manufacture of basic metals 323 180 616 1,393 1,077 197 3,786
25 Manufacture of fabricated metal products, except machinery and equipment 1,063 73 144 252 1,210 128 2,870
26 Manufacture of computer, electronic and optical products - - - - 183 21 204
27 Manufacture of electrical equipment 590 - 26 316 408 39 1,379
28 Manufacture of machinery and equipment n.e.c. 174 - - 134 213 16 537
29 Manufacture of motor vehicles, trailers and semi-trailers 839 - - - 161 - 1,000
30 Manufacture of other transport equipment - 140 142 - - 179 461
31 Manufacture of furniture 1,373 407 794 784 2,361 986 6,705
32 Other manufacturing 109 39 354 540 5,006 129 6,177
33 Repair and installation of machinery and equipment 275 - - 55 - 22 352
C Manufacturing 36,106 13,629 8,374 26,816 22,934 69,314 177,173
D Electricity, gas, steam and air conditioning supply 1,046 293 218 12 1,391 1,572 4,532
36 Water collection, treatment and supply 4,143 347 2,478 773 1,183 290 9,214
38 Waste collection, treatment and disposal activities; materials recovery - - - - 269 28 297
E Water supply; sewerage, waste management and remediation activities 4,143 347 2,478 773 1,452 318 9,511
Total 42,893 18,578 10,332 34,557 30,953 84,375 221,688
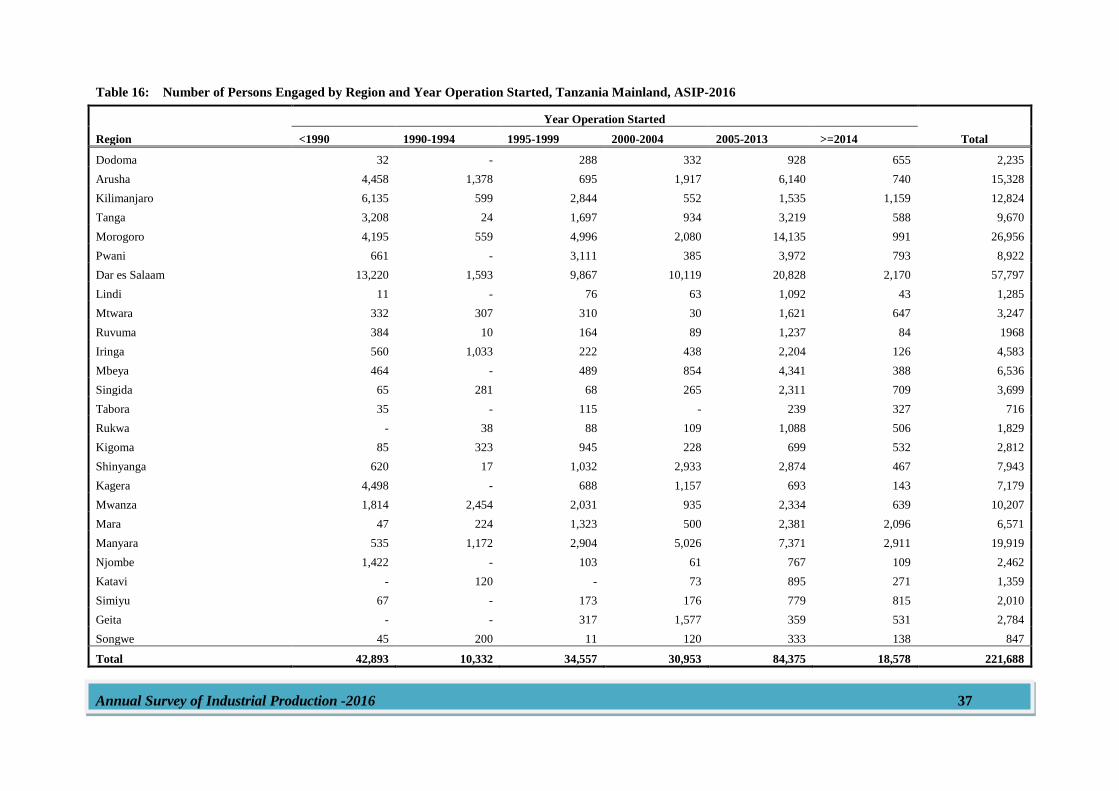
Annual Survey of Industrial Production -2016 37
Table 16: Number of Persons Engaged by Region and Year Operation Started, Tanzania Mainland, ASIP-2016
Region
Year Operation Started
Total <1990 1990-1994 1995-1999 2000-2004 2005-2013 >=2014
Dodoma 32 - 288 332 928 655 2,235
Arusha 4,458 1,378 695 1,917 6,140 740 15,328
Kilimanjaro 6,135 599 2,844 552 1,535 1,159 12,824
Tanga 3,208 24 1,697 934 3,219 588 9,670
Morogoro 4,195 559 4,996 2,080 14,135 991 26,956
Pwani 661 - 3,111 385 3,972 793 8,922
Dar es Salaam 13,220 1,593 9,867 10,119 20,828 2,170 57,797
Lindi 11 - 76 63 1,092 43 1,285
Mtwara 332 307 310 30 1,621 647 3,247
Ruvuma 384 10 164 89 1,237 84 1968
Iringa 560 1,033 222 438 2,204 126 4,583
Mbeya 464 - 489 854 4,341 388 6,536
Singida 65 281 68 265 2,311 709 3,699
Tabora 35 - 115 - 239 327 716
Rukwa - 38 88 109 1,088 506 1,829
Kigoma 85 323 945 228 699 532 2,812
Shinyanga 620 17 1,032 2,933 2,874 467 7,943
Kagera 4,498 - 688 1,157 693 143 7,179
Mwanza 1,814 2,454 2,031 935 2,334 639 10,207
Mara 47 224 1,323 500 2,381 2,096 6,571
Manyara 535 1,172 2,904 5,026 7,371 2,911 19,919
Njombe 1,422 - 103 61 767 109 2,462
Katavi - 120 - 73 895 271 1,359
Simiyu 67 - 173 176 779 815 2,010
Geita - - 317 1,577 359 531 2,784
Songwe 45 200 11 120 333 138 847
Total 42,893 10,332 34,557 30,953 84,375 18,578 221,688
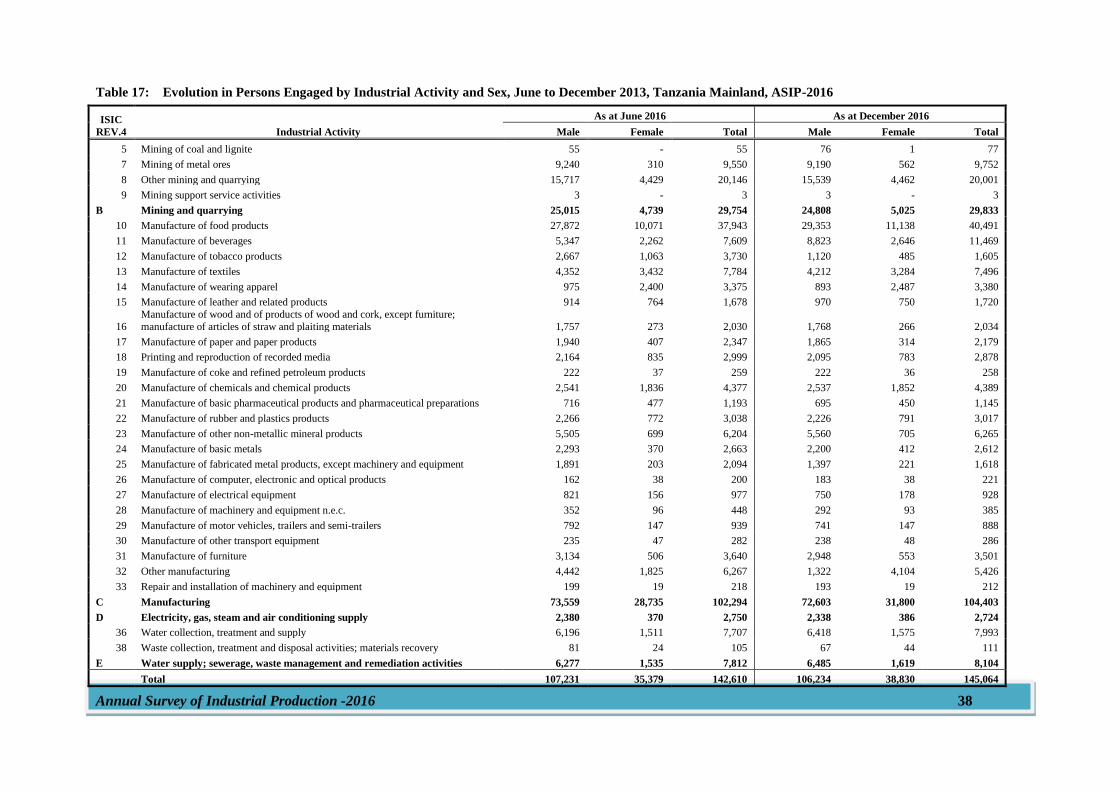
Annual Survey of Industrial Production -2016 38
Table 17: Evolution in Persons Engaged by Industrial Activity and Sex, June to December 2013, Tanzania Mainland, ASIP-2016
ISIC
REV.4 Industrial Activity
As at June 2016 As at December 2016
Male Female Total Male Female Total
5 Mining of coal and lignite 55 - 55 76 1 77
7 Mining of metal ores 9,240 310 9,550 9,190 562 9,752
8 Other mining and quarrying 15,717 4,429 20,146 15,539 4,462 20,001
9 Mining support service activities 3 - 3 3 - 3
B Mining and quarrying 25,015 4,739 29,754 24,808 5,025 29,833
10 Manufacture of food products 27,872 10,071 37,943 29,353 11,138 40,491
11 Manufacture of beverages 5,347 2,262 7,609 8,823 2,646 11,469
12 Manufacture of tobacco products 2,667 1,063 3,730 1,120 485 1,605
13 Manufacture of textiles 4,352 3,432 7,784 4,212 3,284 7,496
14 Manufacture of wearing apparel 975 2,400 3,375 893 2,487 3,380
15 Manufacture of leather and related products 914 764 1,678 970 750 1,720
16
Manufacture of wood and of products of wood and cork, except furniture;
manufacture of articles of straw and plaiting materials 1,757 273 2,030 1,768 266 2,034
17 Manufacture of paper and paper products 1,940 407 2,347 1,865 314 2,179
18 Printing and reproduction of recorded media 2,164 835 2,999 2,095 783 2,878
19 Manufacture of coke and refined petroleum products 222 37 259 222 36 258
20 Manufacture of chemicals and chemical products 2,541 1,836 4,377 2,537 1,852 4,389
21 Manufacture of basic pharmaceutical products and pharmaceutical preparations 716 477 1,193 695 450 1,145
22 Manufacture of rubber and plastics products 2,266 772 3,038 2,226 791 3,017
23 Manufacture of other non-metallic mineral products 5,505 699 6,204 5,560 705 6,265
24 Manufacture of basic metals 2,293 370 2,663 2,200 412 2,612
25 Manufacture of fabricated metal products, except machinery and equipment 1,891 203 2,094 1,397 221 1,618
26 Manufacture of computer, electronic and optical products 162 38 200 183 38 221
27 Manufacture of electrical equipment 821 156 977 750 178 928
28 Manufacture of machinery and equipment n.e.c. 352 96 448 292 93 385
29 Manufacture of motor vehicles, trailers and semi-trailers 792 147 939 741 147 888
30 Manufacture of other transport equipment 235 47 282 238 48 286
31 Manufacture of furniture 3,134 506 3,640 2,948 553 3,501
32 Other manufacturing 4,442 1,825 6,267 1,322 4,104 5,426
33 Repair and installation of machinery and equipment 199 19 218 193 19 212
C Manufacturing 73,559 28,735 102,294 72,603 31,800 104,403
D Electricity, gas, steam and air conditioning supply 2,380 370 2,750 2,338 386 2,724
36 Water collection, treatment and supply 6,196 1,511 7,707 6,418 1,575 7,993
38 Waste collection, treatment and disposal activities; materials recovery 81 24 105 67 44 111
E Water supply; sewerage, waste management and remediation activities 6,277 1,535 7,812 6,485 1,619 8,104
Total 107,231 35,379 142,610 106,234 38,830 145,064
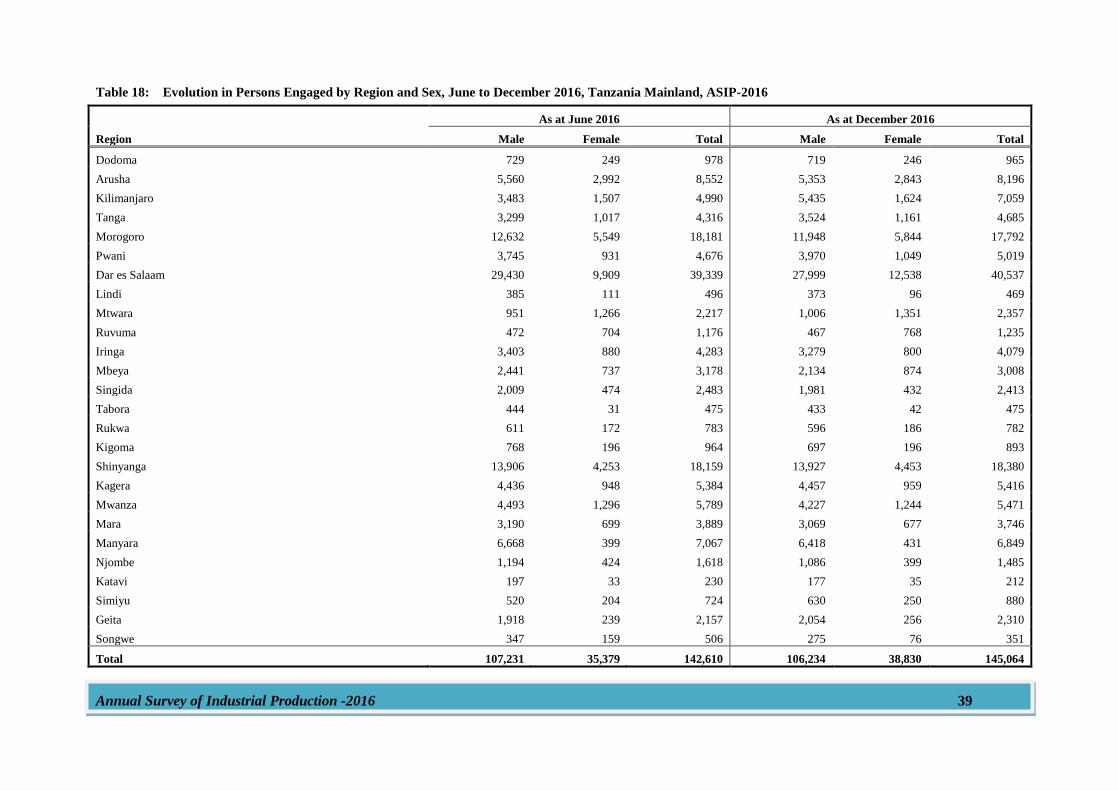
Annual Survey of Industrial Production -2016 39
Table 18: Evolution in Persons Engaged by Region and Sex, June to December 2016, Tanzania Mainland, ASIP-2016
Region
As at June 2016 As at December 2016
Male Female Total Male Female Total
Dodoma 729 249 978 719 246 965
Arusha 5,560 2,992 8,552 5,353 2,843 8,196
Kilimanjaro 3,483 1,507 4,990 5,435 1,624 7,059
Tanga 3,299 1,017 4,316 3,524 1,161 4,685
Morogoro 12,632 5,549 18,181 11,948 5,844 17,792
Pwani 3,745 931 4,676 3,970 1,049 5,019
Dar es Salaam 29,430 9,909 39,339 27,999 12,538 40,537
Lindi 385 111 496 373 96 469
Mtwara 951 1,266 2,217 1,006 1,351 2,357
Ruvuma 472 704 1,176 467 768 1,235
Iringa 3,403 880 4,283 3,279 800 4,079
Mbeya 2,441 737 3,178 2,134 874 3,008
Singida 2,009 474 2,483 1,981 432 2,413
Tabora 444 31 475 433 42 475
Rukwa 611 172 783 596 186 782
Kigoma 768 196 964 697 196 893
Shinyanga 13,906 4,253 18,159 13,927 4,453 18,380
Kagera 4,436 948 5,384 4,457 959 5,416
Mwanza 4,493 1,296 5,789 4,227 1,244 5,471
Mara 3,190 699 3,889 3,069 677 3,746
Manyara 6,668 399 7,067 6,418 431 6,849
Njombe 1,194 424 1,618 1,086 399 1,485
Katavi 197 33 230 177 35 212
Simiyu 520 204 724 630 250 880
Geita 1,918 239 2,157 2,054 256 2,310
Songwe 347 159 506 275 76 351
Total 107,231 35,379 142,610 106,234 38,830 145,064
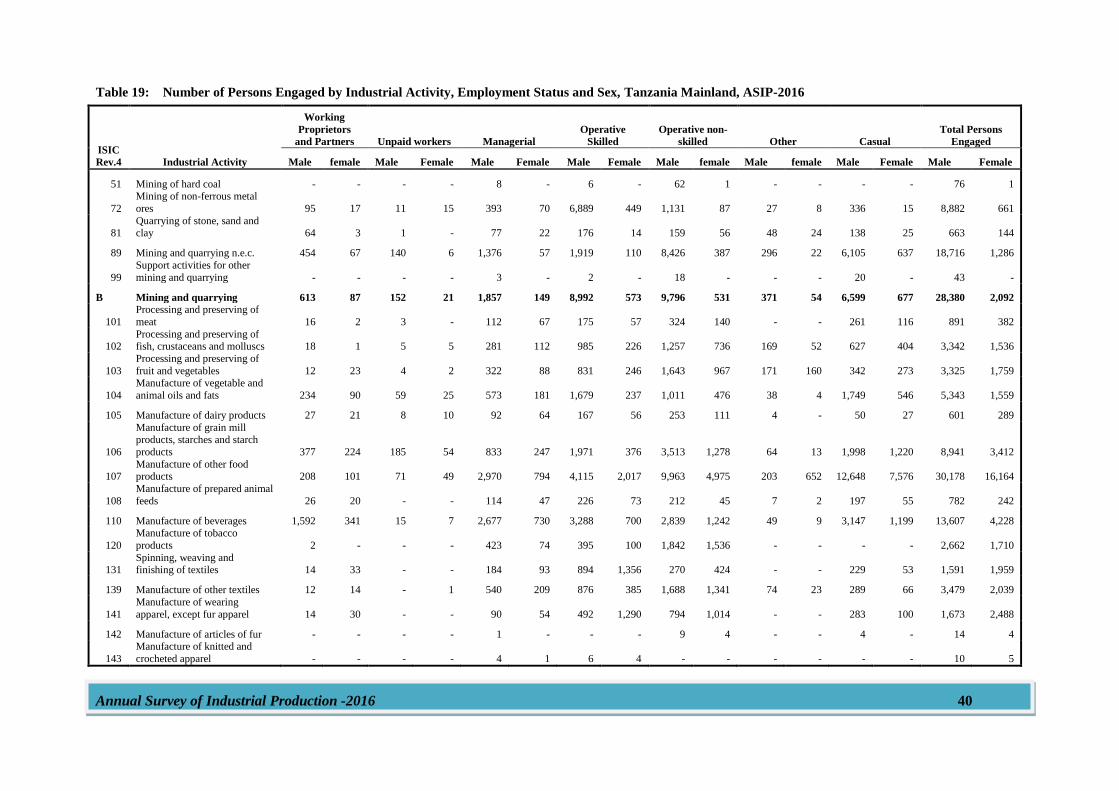
Annual Survey of Industrial Production -2016 40
Table 19: Number of Persons Engaged by Industrial Activity, Employment Status and Sex, Tanzania Mainland, ASIP-2016
ISIC
Rev.4 Industrial Activity
Working
Proprietors
and Partners Unpaid workers Managerial
Operative
Skilled
Operative non-
skilled Other Casual
Total Persons
Engaged
Male female Male Female Male Female Male Female Male female Male female Male Female Male Female
51 Mining of hard coal - - - - 8 - 6 - 62 1 - - - - 76 1
72
Mining of non-ferrous metal
ores 95 17 11 15 393 70 6,889 449 1,131 87 27 8 336 15 8,882 661
81 Quarrying of stone, sand and clay 64 3 1 - 77 22 176 14 159 56 48 24 138 25 663 144
89 Mining and quarrying n.e.c. 454 67 140 6 1,376 57 1,919 110 8,426 387 296 22 6,105 637 18,716 1,286
99
Support activities for other
mining and quarrying - - - - 3 - 2 - 18 - - - 20 - 43 -
B Mining and quarrying 613 87 152 21 1,857 149 8,992 573 9,796 531 371 54 6,599 677 28,380 2,092
101
Processing and preserving of
meat 16 2 3 - 112 67 175 57 324 140 - - 261 116 891 382
102 Processing and preserving of fish, crustaceans and molluscs 18 1 5 5 281 112 985 226 1,257 736 169 52 627 404 3,342 1,536
103
Processing and preserving of
fruit and vegetables 12 23 4 2 322 88 831 246 1,643 967 171 160 342 273 3,325 1,759
104
Manufacture of vegetable and
animal oils and fats 234 90 59 25 573 181 1,679 237 1,011 476 38 4 1,749 546 5,343 1,559
105 Manufacture of dairy products 27 21 8 10 92 64 167 56 253 111 4 - 50 27 601 289
106
Manufacture of grain mill products, starches and starch
products 377 224 185 54 833 247 1,971 376 3,513 1,278 64 13 1,998 1,220 8,941 3,412
107 Manufacture of other food products 208 101 71 49 2,970 794 4,115 2,017 9,963 4,975 203 652 12,648 7,576 30,178 16,164
108
Manufacture of prepared animal
feeds 26 20 - - 114 47 226 73 212 45 7 2 197 55 782 242
110 Manufacture of beverages 1,592 341 15 7 2,677 730 3,288 700 2,839 1,242 49 9 3,147 1,199 13,607 4,228
120
Manufacture of tobacco
products 2 - - - 423 74 395 100 1,842 1,536 - - - - 2,662 1,710
131 Spinning, weaving and finishing of textiles 14 33 - - 184 93 894 1,356 270 424 - - 229 53 1,591 1,959
139 Manufacture of other textiles 12 14 - 1 540 209 876 385 1,688 1,341 74 23 289 66 3,479 2,039
141
Manufacture of wearing
apparel, except fur apparel 14 30 - - 90 54 492 1,290 794 1,014 - - 283 100 1,673 2,488
142 Manufacture of articles of fur - - - - 1 - - - 9 4 - - 4 - 14 4
143
Manufacture of knitted and
crocheted apparel - - - - 4 1 6 4 - - - - - - 10 5
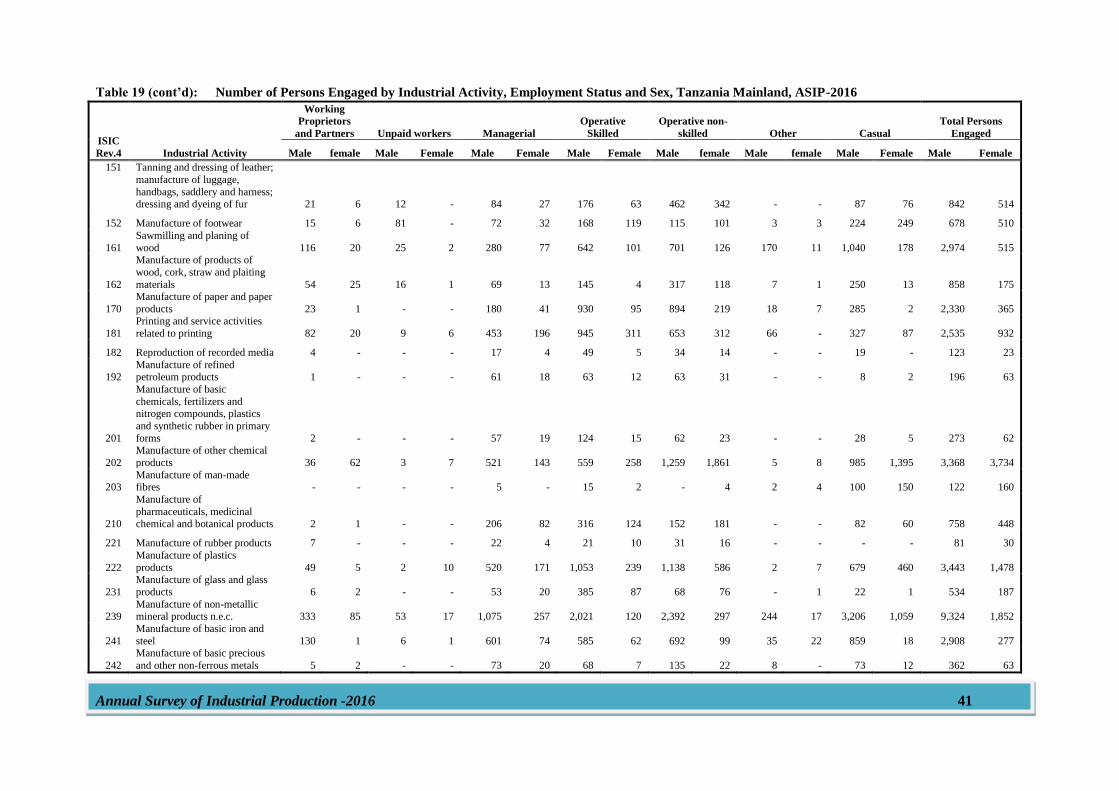
Annual Survey of Industrial Production -2016 41
Table 19 (cont’d): Number of Persons Engaged by Industrial Activity, Employment Status and Sex, Tanzania Mainland, ASIP-2016
ISIC
Rev.4 Industrial Activity
Working
Proprietors
and Partners Unpaid workers Managerial
Operative
Skilled
Operative non-
skilled Other Casual
Total Persons
Engaged
Male female Male Female Male Female Male Female Male female Male female Male Female Male Female
151 Tanning and dressing of leather;
manufacture of luggage,
handbags, saddlery and harness; dressing and dyeing of fur 21 6 12 - 84 27 176 63 462 342 - - 87 76 842 514
152 Manufacture of footwear 15 6 81 - 72 32 168 119 115 101 3 3 224 249 678 510
161
Sawmilling and planing of
wood 116 20 25 2 280 77 642 101 701 126 170 11 1,040 178 2,974 515
162
Manufacture of products of
wood, cork, straw and plaiting
materials 54 25 16 1 69 13 145 4 317 118 7 1 250 13 858 175
170
Manufacture of paper and paper
products 23 1 - - 180 41 930 95 894 219 18 7 285 2 2,330 365
181
Printing and service activities
related to printing 82 20 9 6 453 196 945 311 653 312 66 - 327 87 2,535 932
182 Reproduction of recorded media 4 - - - 17 4 49 5 34 14 - - 19 - 123 23
192 Manufacture of refined petroleum products 1 - - - 61 18 63 12 63 31 - - 8 2 196 63
201
Manufacture of basic
chemicals, fertilizers and nitrogen compounds, plastics
and synthetic rubber in primary
forms 2 - - - 57 19 124 15 62 23 - - 28 5 273 62
202
Manufacture of other chemical
products 36 62 3 7 521 143 559 258 1,259 1,861 5 8 985 1,395 3,368 3,734
203 Manufacture of man-made fibres - - - - 5 - 15 2 - 4 2 4 100 150 122 160
210
Manufacture of
pharmaceuticals, medicinal chemical and botanical products 2 1 - - 206 82 316 124 152 181 - - 82 60 758 448
221 Manufacture of rubber products 7 - - - 22 4 21 10 31 16 - - - - 81 30
222
Manufacture of plastics
products 49 5 2 10 520 171 1,053 239 1,138 586 2 7 679 460 3,443 1,478
231
Manufacture of glass and glass
products 6 2 - - 53 20 385 87 68 76 - 1 22 1 534 187
239 Manufacture of non-metallic mineral products n.e.c. 333 85 53 17 1,075 257 2,021 120 2,392 297 244 17 3,206 1,059 9,324 1,852
241
Manufacture of basic iron and
steel 130 1 6 1 601 74 585 62 692 99 35 22 859 18 2,908 277
242
Manufacture of basic precious
and other non-ferrous metals 5 2 - - 73 20 68 7 135 22 8 - 73 12 362 63
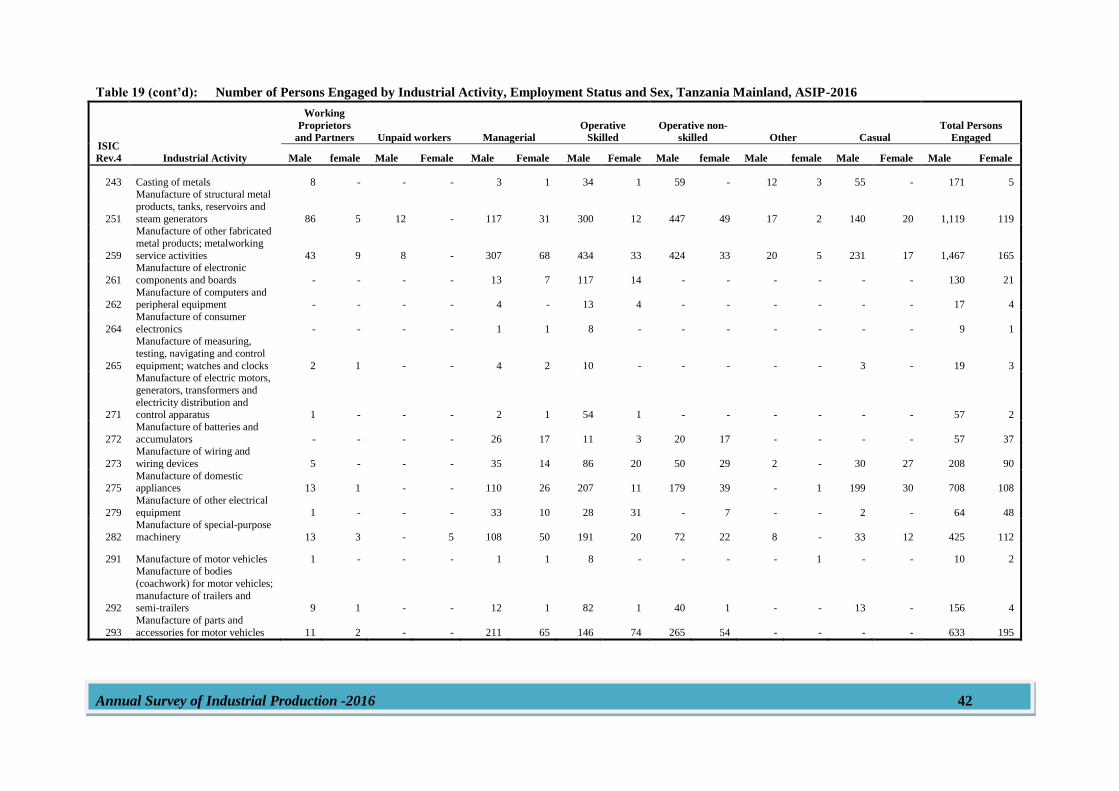
Annual Survey of Industrial Production -2016 42
Table 19 (cont’d): Number of Persons Engaged by Industrial Activity, Employment Status and Sex, Tanzania Mainland, ASIP-2016
ISIC
Rev.4 Industrial Activity
Working
Proprietors
and Partners Unpaid workers Managerial
Operative
Skilled
Operative non-
skilled Other Casual
Total Persons
Engaged
Male female Male Female Male Female Male Female Male female Male female Male Female Male Female
243 Casting of metals 8 - - - 3 1 34 1 59 - 12 3 55 - 171 5
251
Manufacture of structural metal
products, tanks, reservoirs and
steam generators 86 5 12 - 117 31 300 12 447 49 17 2 140 20 1,119 119
259
Manufacture of other fabricated
metal products; metalworking
service activities 43 9 8 - 307 68 434 33 424 33 20 5 231 17 1,467 165
261
Manufacture of electronic
components and boards - - - - 13 7 117 14 - - - - - - 130 21
262 Manufacture of computers and peripheral equipment - - - - 4 - 13 4 - - - - - - 17 4
264
Manufacture of consumer
electronics - - - - 1 1 8 - - - - - - - 9 1
265
Manufacture of measuring,
testing, navigating and control
equipment; watches and clocks 2 1 - - 4 2 10 - - - - - 3 - 19 3
271
Manufacture of electric motors,
generators, transformers and
electricity distribution and control apparatus 1 - - - 2 1 54 1 - - - - - - 57 2
272
Manufacture of batteries and
accumulators - - - - 26 17 11 3 20 17 - - - - 57 37
273
Manufacture of wiring and
wiring devices 5 - - - 35 14 86 20 50 29 2 - 30 27 208 90
275 Manufacture of domestic appliances 13 1 - - 110 26 207 11 179 39 - 1 199 30 708 108
279
Manufacture of other electrical
equipment 1 - - - 33 10 28 31 - 7 - - 2 - 64 48
282
Manufacture of special-purpose
machinery 13 3 - 5 108 50 191 20 72 22 8 - 33 12 425 112
291 Manufacture of motor vehicles 1 - - - 1 1 8 - - - - 1 - - 10 2
292
Manufacture of bodies
(coachwork) for motor vehicles;
manufacture of trailers and semi-trailers 9 1 - - 12 1 82 1 40 1 - - 13 - 156 4
293
Manufacture of parts and
accessories for motor vehicles 11 2 - - 211 65 146 74 265 54 - - - - 633 195
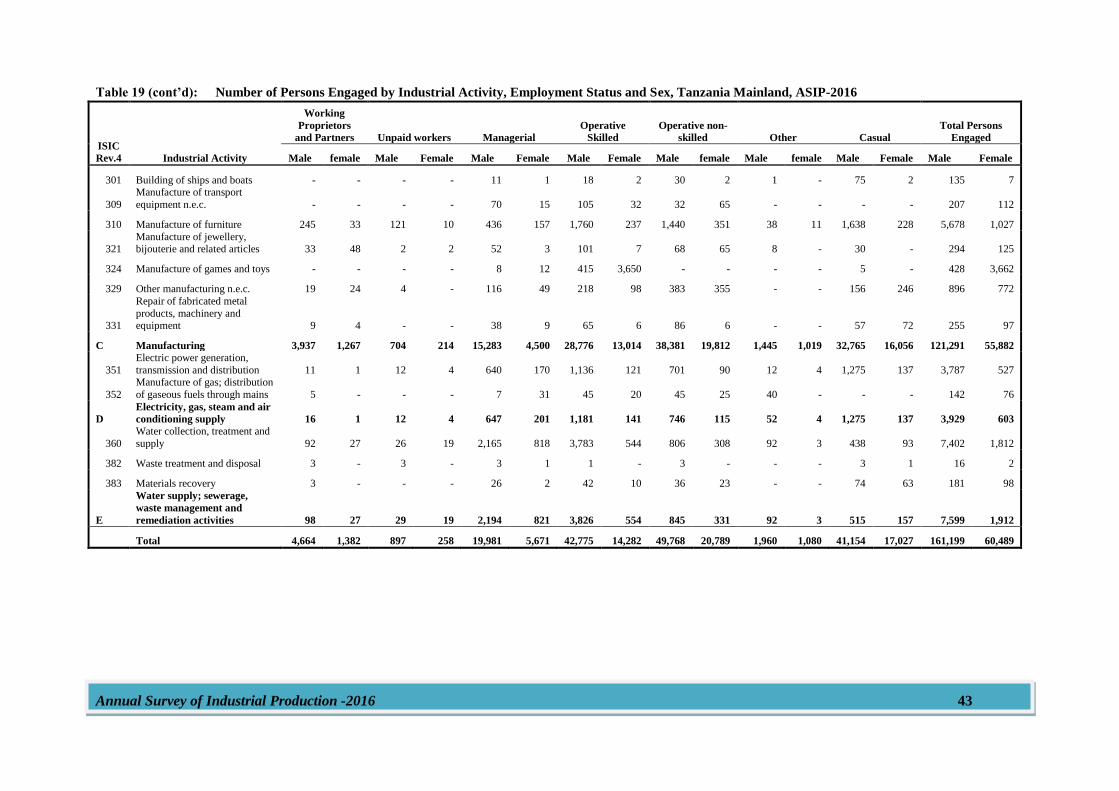
Annual Survey of Industrial Production -2016 43
Table 19 (cont’d): Number of Persons Engaged by Industrial Activity, Employment Status and Sex, Tanzania Mainland, ASIP-2016
ISIC
Rev.4 Industrial Activity
Working
Proprietors
and Partners Unpaid workers Managerial
Operative
Skilled
Operative non-
skilled Other Casual
Total Persons
Engaged
Male female Male Female Male Female Male Female Male female Male female Male Female Male Female
301 Building of ships and boats - - - - 11 1 18 2 30 2 1 - 75 2 135 7
309
Manufacture of transport
equipment n.e.c. - - - - 70 15 105 32 32 65 - - - - 207 112
310 Manufacture of furniture 245 33 121 10 436 157 1,760 237 1,440 351 38 11 1,638 228 5,678 1,027
321 Manufacture of jewellery, bijouterie and related articles 33 48 2 2 52 3 101 7 68 65 8 - 30 - 294 125
324 Manufacture of games and toys - - - - 8 12 415 3,650 - - - - 5 - 428 3,662
329 Other manufacturing n.e.c. 19 24 4 - 116 49 218 98 383 355 - - 156 246 896 772
331
Repair of fabricated metal
products, machinery and equipment 9 4 - - 38 9 65 6 86 6 - - 57 72 255 97
C Manufacturing 3,937 1,267 704 214 15,283 4,500 28,776 13,014 38,381 19,812 1,445 1,019 32,765 16,056 121,291 55,882
351
Electric power generation,
transmission and distribution 11 1 12 4 640 170 1,136 121 701 90 12 4 1,275 137 3,787 527
352
Manufacture of gas; distribution
of gaseous fuels through mains 5 - - - 7 31 45 20 45 25 40 - - - 142 76
D
Electricity, gas, steam and air
conditioning supply 16 1 12 4 647 201 1,181 141 746 115 52 4 1,275 137 3,929 603
360
Water collection, treatment and
supply 92 27 26 19 2,165 818 3,783 544 806 308 92 3 438 93 7,402 1,812
382 Waste treatment and disposal 3 - 3 - 3 1 1 - 3 - - - 3 1 16 2
383 Materials recovery 3 - - - 26 2 42 10 36 23 - - 74 63 181 98
E
Water supply; sewerage,
waste management and
remediation activities 98 27 29 19 2,194 821 3,826 554 845 331 92 3 515 157 7,599 1,912
Total 4,664 1,382 897 258 19,981 5,671 42,775 14,282 49,768 20,789 1,960 1,080 41,154 17,027 161,199 60,489
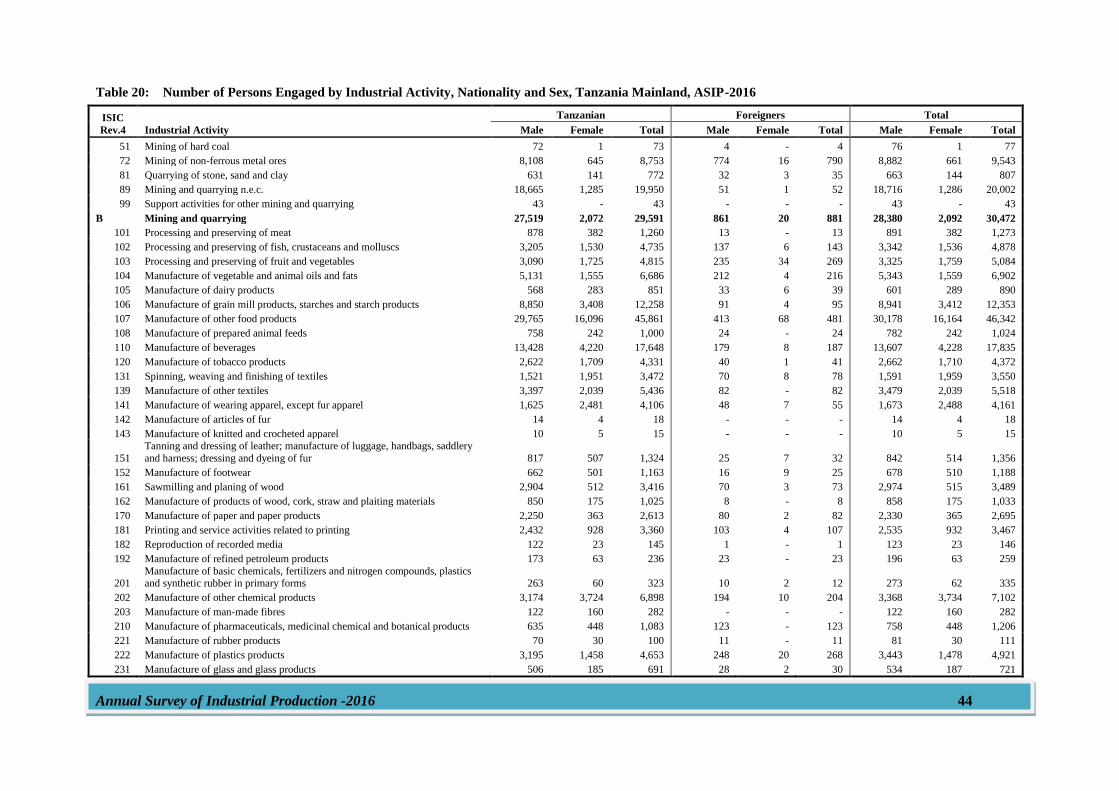
Annual Survey of Industrial Production -2016 44
Table 20: Number of Persons Engaged by Industrial Activity, Nationality and Sex, Tanzania Mainland, ASIP-2016
ISIC
Rev.4 Industrial Activity
Tanzanian Foreigners Total
Male Female Total Male Female Total Male Female Total
51 Mining of hard coal 72 1 73 4 - 4 76 1 77
72 Mining of non-ferrous metal ores 8,108 645 8,753 774 16 790 8,882 661 9,543
81 Quarrying of stone, sand and clay 631 141 772 32 3 35 663 144 807
89 Mining and quarrying n.e.c. 18,665 1,285 19,950 51 1 52 18,716 1,286 20,002
99 Support activities for other mining and quarrying 43 - 43 - - - 43 - 43
B Mining and quarrying 27,519 2,072 29,591 861 20 881 28,380 2,092 30,472
101 Processing and preserving of meat 878 382 1,260 13 - 13 891 382 1,273
102 Processing and preserving of fish, crustaceans and molluscs 3,205 1,530 4,735 137 6 143 3,342 1,536 4,878
103 Processing and preserving of fruit and vegetables 3,090 1,725 4,815 235 34 269 3,325 1,759 5,084
104 Manufacture of vegetable and animal oils and fats 5,131 1,555 6,686 212 4 216 5,343 1,559 6,902
105 Manufacture of dairy products 568 283 851 33 6 39 601 289 890
106 Manufacture of grain mill products, starches and starch products 8,850 3,408 12,258 91 4 95 8,941 3,412 12,353
107 Manufacture of other food products 29,765 16,096 45,861 413 68 481 30,178 16,164 46,342
108 Manufacture of prepared animal feeds 758 242 1,000 24 - 24 782 242 1,024
110 Manufacture of beverages 13,428 4,220 17,648 179 8 187 13,607 4,228 17,835
120 Manufacture of tobacco products 2,622 1,709 4,331 40 1 41 2,662 1,710 4,372
131 Spinning, weaving and finishing of textiles 1,521 1,951 3,472 70 8 78 1,591 1,959 3,550
139 Manufacture of other textiles 3,397 2,039 5,436 82 - 82 3,479 2,039 5,518
141 Manufacture of wearing apparel, except fur apparel 1,625 2,481 4,106 48 7 55 1,673 2,488 4,161
142 Manufacture of articles of fur 14 4 18 - - - 14 4 18
143 Manufacture of knitted and crocheted apparel 10 5 15 - - - 10 5 15
151
Tanning and dressing of leather; manufacture of luggage, handbags, saddlery
and harness; dressing and dyeing of fur 817 507 1,324 25 7 32 842 514 1,356
152 Manufacture of footwear 662 501 1,163 16 9 25 678 510 1,188
161 Sawmilling and planing of wood 2,904 512 3,416 70 3 73 2,974 515 3,489
162 Manufacture of products of wood, cork, straw and plaiting materials 850 175 1,025 8 - 8 858 175 1,033
170 Manufacture of paper and paper products 2,250 363 2,613 80 2 82 2,330 365 2,695
181 Printing and service activities related to printing 2,432 928 3,360 103 4 107 2,535 932 3,467
182 Reproduction of recorded media 122 23 145 1 - 1 123 23 146
192 Manufacture of refined petroleum products 173 63 236 23 - 23 196 63 259
201 Manufacture of basic chemicals, fertilizers and nitrogen compounds, plastics and synthetic rubber in primary forms 263 60 323 10 2 12 273 62 335
202 Manufacture of other chemical products 3,174 3,724 6,898 194 10 204 3,368 3,734 7,102
203 Manufacture of man-made fibres 122 160 282 - - - 122 160 282
210 Manufacture of pharmaceuticals, medicinal chemical and botanical products 635 448 1,083 123 - 123 758 448 1,206
221 Manufacture of rubber products 70 30 100 11 - 11 81 30 111
222 Manufacture of plastics products 3,195 1,458 4,653 248 20 268 3,443 1,478 4,921
231 Manufacture of glass and glass products 506 185 691 28 2 30 534 187 721
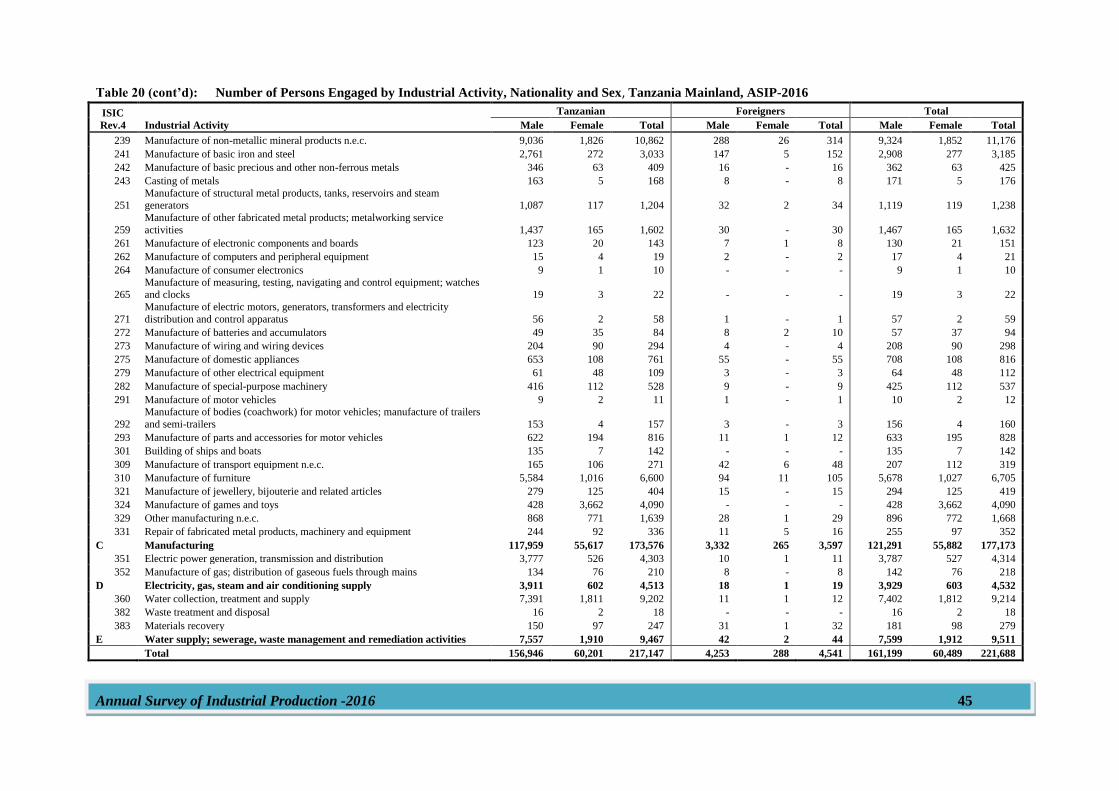
Annual Survey of Industrial Production -2016 45
Table 20 (cont’d): Number of Persons Engaged by Industrial Activity, Nationality and Sex, Tanzania Mainland, ASIP-2016
ISIC
Rev.4 Industrial Activity
Tanzanian Foreigners Total
Male Female Total Male Female Total Male Female Total
239 Manufacture of non-metallic mineral products n.e.c. 9,036 1,826 10,862 288 26 314 9,324 1,852 11,176
241 Manufacture of basic iron and steel 2,761 272 3,033 147 5 152 2,908 277 3,185
242 Manufacture of basic precious and other non-ferrous metals 346 63 409 16 - 16 362 63 425
243 Casting of metals 163 5 168 8 - 8 171 5 176
251 Manufacture of structural metal products, tanks, reservoirs and steam generators 1,087 117 1,204 32 2 34 1,119 119 1,238
259
Manufacture of other fabricated metal products; metalworking service
activities 1,437 165 1,602 30 - 30 1,467 165 1,632
261 Manufacture of electronic components and boards 123 20 143 7 1 8 130 21 151
262 Manufacture of computers and peripheral equipment 15 4 19 2 - 2 17 4 21
264 Manufacture of consumer electronics 9 1 10 - - - 9 1 10
265 Manufacture of measuring, testing, navigating and control equipment; watches and clocks 19 3 22 - - - 19 3 22
271
Manufacture of electric motors, generators, transformers and electricity
distribution and control apparatus 56 2 58 1 - 1 57 2 59
272 Manufacture of batteries and accumulators 49 35 84 8 2 10 57 37 94
273 Manufacture of wiring and wiring devices 204 90 294 4 - 4 208 90 298
275 Manufacture of domestic appliances 653 108 761 55 - 55 708 108 816
279 Manufacture of other electrical equipment 61 48 109 3 - 3 64 48 112
282 Manufacture of special-purpose machinery 416 112 528 9 - 9 425 112 537
291 Manufacture of motor vehicles 9 2 11 1 - 1 10 2 12
292
Manufacture of bodies (coachwork) for motor vehicles; manufacture of trailers
and semi-trailers 153 4 157 3 - 3 156 4 160
293 Manufacture of parts and accessories for motor vehicles 622 194 816 11 1 12 633 195 828
301 Building of ships and boats 135 7 142 - - - 135 7 142
309 Manufacture of transport equipment n.e.c. 165 106 271 42 6 48 207 112 319
310 Manufacture of furniture 5,584 1,016 6,600 94 11 105 5,678 1,027 6,705
321 Manufacture of jewellery, bijouterie and related articles 279 125 404 15 - 15 294 125 419
324 Manufacture of games and toys 428 3,662 4,090 - - - 428 3,662 4,090
329 Other manufacturing n.e.c. 868 771 1,639 28 1 29 896 772 1,668
331 Repair of fabricated metal products, machinery and equipment 244 92 336 11 5 16 255 97 352
C Manufacturing 117,959 55,617 173,576 3,332 265 3,597 121,291 55,882 177,173
351 Electric power generation, transmission and distribution 3,777 526 4,303 10 1 11 3,787 527 4,314
352 Manufacture of gas; distribution of gaseous fuels through mains 134 76 210 8 - 8 142 76 218
D Electricity, gas, steam and air conditioning supply 3,911 602 4,513 18 1 19 3,929 603 4,532
360 Water collection, treatment and supply 7,391 1,811 9,202 11 1 12 7,402 1,812 9,214
382 Waste treatment and disposal 16 2 18 - - - 16 2 18
383 Materials recovery 150 97 247 31 1 32 181 98 279
E Water supply; sewerage, waste management and remediation activities 7,557 1,910 9,467 42 2 44 7,599 1,912 9,511
Total 156,946 60,201 217,147 4,253 288 4,541 161,199 60,489 221,688
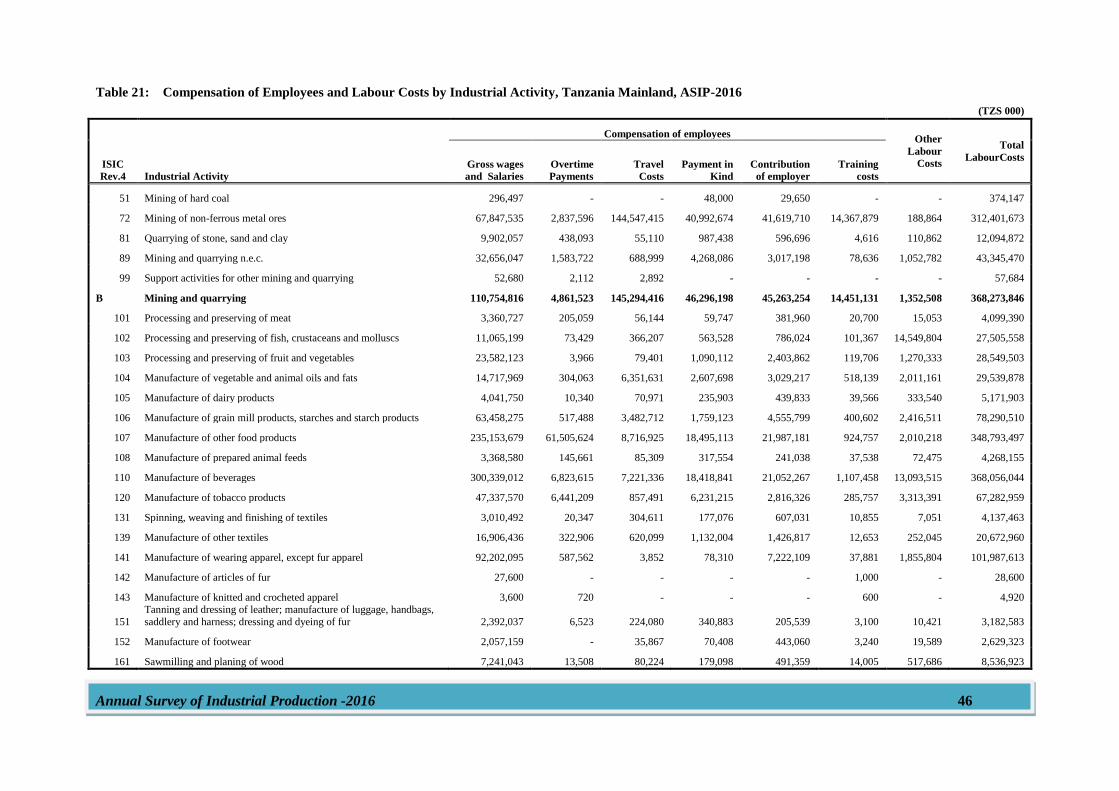
Annual Survey of Industrial Production -2016 46
Table 21: Compensation of Employees and Labour Costs by Industrial Activity, Tanzania Mainland, ASIP-2016
(TZS 000)
ISIC
Rev.4 Industrial Activity
Compensation of employees Other
Labour
Costs
Total
LabourCosts Gross wages
and Salaries
Overtime
Payments
Travel
Costs
Payment in
Kind
Contribution
of employer
Training
costs
51 Mining of hard coal 296,497 - - 48,000 29,650 - - 374,147
72 Mining of non-ferrous metal ores 67,847,535 2,837,596 144,547,415 40,992,674 41,619,710 14,367,879 188,864 312,401,673
81 Quarrying of stone, sand and clay 9,902,057 438,093 55,110 987,438 596,696 4,616 110,862 12,094,872
89 Mining and quarrying n.e.c. 32,656,047 1,583,722 688,999 4,268,086 3,017,198 78,636 1,052,782 43,345,470
99 Support activities for other mining and quarrying 52,680 2,112 2,892 - - - - 57,684
B Mining and quarrying 110,754,816 4,861,523 145,294,416 46,296,198 45,263,254 14,451,131 1,352,508 368,273,846
101 Processing and preserving of meat 3,360,727 205,059 56,144 59,747 381,960 20,700 15,053 4,099,390
102 Processing and preserving of fish, crustaceans and molluscs 11,065,199 73,429 366,207 563,528 786,024 101,367 14,549,804 27,505,558
103 Processing and preserving of fruit and vegetables 23,582,123 3,966 79,401 1,090,112 2,403,862 119,706 1,270,333 28,549,503
104 Manufacture of vegetable and animal oils and fats 14,717,969 304,063 6,351,631 2,607,698 3,029,217 518,139 2,011,161 29,539,878
105 Manufacture of dairy products 4,041,750 10,340 70,971 235,903 439,833 39,566 333,540 5,171,903
106 Manufacture of grain mill products, starches and starch products 63,458,275 517,488 3,482,712 1,759,123 4,555,799 400,602 2,416,511 78,290,510
107 Manufacture of other food products 235,153,679 61,505,624 8,716,925 18,495,113 21,987,181 924,757 2,010,218 348,793,497
108 Manufacture of prepared animal feeds 3,368,580 145,661 85,309 317,554 241,038 37,538 72,475 4,268,155
110 Manufacture of beverages 300,339,012 6,823,615 7,221,336 18,418,841 21,052,267 1,107,458 13,093,515 368,056,044
120 Manufacture of tobacco products 47,337,570 6,441,209 857,491 6,231,215 2,816,326 285,757 3,313,391 67,282,959
131 Spinning, weaving and finishing of textiles 3,010,492 20,347 304,611 177,076 607,031 10,855 7,051 4,137,463
139 Manufacture of other textiles 16,906,436 322,906 620,099 1,132,004 1,426,817 12,653 252,045 20,672,960
141 Manufacture of wearing apparel, except fur apparel 92,202,095 587,562 3,852 78,310 7,222,109 37,881 1,855,804 101,987,613
142 Manufacture of articles of fur 27,600 - - - - 1,000 - 28,600
143 Manufacture of knitted and crocheted apparel 3,600 720 - - - 600 - 4,920
151
Tanning and dressing of leather; manufacture of luggage, handbags,
saddlery and harness; dressing and dyeing of fur 2,392,037 6,523 224,080 340,883 205,539 3,100 10,421 3,182,583
152 Manufacture of footwear 2,057,159 - 35,867 70,408 443,060 3,240 19,589 2,629,323
161 Sawmilling and planing of wood 7,241,043 13,508 80,224 179,098 491,359 14,005 517,686 8,536,923
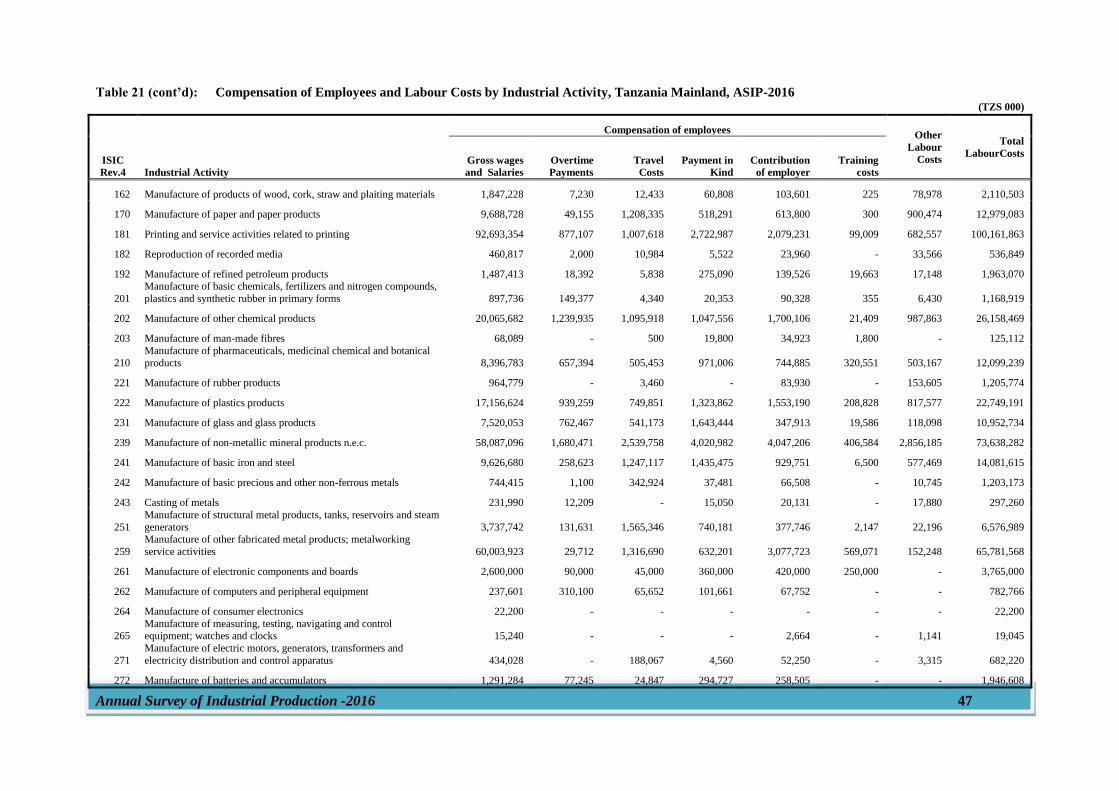
Annual Survey of Industrial Production -2016 47
Table 21 (cont’d): Compensation of Employees and Labour Costs by Industrial Activity, Tanzania Mainland, ASIP-2016 (TZS 000)
ISIC
Rev.4 Industrial Activity
Compensation of employees Other
Labour
Costs
Total
LabourCosts Gross wages
and Salaries
Overtime
Payments
Travel
Costs
Payment in
Kind
Contribution
of employer
Training
costs
162 Manufacture of products of wood, cork, straw and plaiting materials 1,847,228 7,230 12,433 60,808 103,601 225 78,978 2,110,503
170 Manufacture of paper and paper products 9,688,728 49,155 1,208,335 518,291 613,800 300 900,474 12,979,083
181 Printing and service activities related to printing 92,693,354 877,107 1,007,618 2,722,987 2,079,231 99,009 682,557 100,161,863
182 Reproduction of recorded media 460,817 2,000 10,984 5,522 23,960 - 33,566 536,849
192 Manufacture of refined petroleum products 1,487,413 18,392 5,838 275,090 139,526 19,663 17,148 1,963,070
201
Manufacture of basic chemicals, fertilizers and nitrogen compounds,
plastics and synthetic rubber in primary forms 897,736 149,377 4,340 20,353 90,328 355 6,430 1,168,919
202 Manufacture of other chemical products 20,065,682 1,239,935 1,095,918 1,047,556 1,700,106 21,409 987,863 26,158,469
203 Manufacture of man-made fibres 68,089 - 500 19,800 34,923 1,800 - 125,112
210
Manufacture of pharmaceuticals, medicinal chemical and botanical
products 8,396,783 657,394 505,453 971,006 744,885 320,551 503,167 12,099,239
221 Manufacture of rubber products 964,779 - 3,460 - 83,930 - 153,605 1,205,774
222 Manufacture of plastics products 17,156,624 939,259 749,851 1,323,862 1,553,190 208,828 817,577 22,749,191
231 Manufacture of glass and glass products 7,520,053 762,467 541,173 1,643,444 347,913 19,586 118,098 10,952,734
239 Manufacture of non-metallic mineral products n.e.c. 58,087,096 1,680,471 2,539,758 4,020,982 4,047,206 406,584 2,856,185 73,638,282
241 Manufacture of basic iron and steel 9,626,680 258,623 1,247,117 1,435,475 929,751 6,500 577,469 14,081,615
242 Manufacture of basic precious and other non-ferrous metals 744,415 1,100 342,924 37,481 66,508 - 10,745 1,203,173
243 Casting of metals 231,990 12,209 - 15,050 20,131 - 17,880 297,260
251
Manufacture of structural metal products, tanks, reservoirs and steam
generators 3,737,742 131,631 1,565,346 740,181 377,746 2,147 22,196 6,576,989
259
Manufacture of other fabricated metal products; metalworking
service activities 60,003,923 29,712 1,316,690 632,201 3,077,723 569,071 152,248 65,781,568
261 Manufacture of electronic components and boards 2,600,000 90,000 45,000 360,000 420,000 250,000 - 3,765,000
262 Manufacture of computers and peripheral equipment 237,601 310,100 65,652 101,661 67,752 - - 782,766
264 Manufacture of consumer electronics 22,200 - - - - - - 22,200
265 Manufacture of measuring, testing, navigating and control equipment; watches and clocks 15,240 - - - 2,664 - 1,141 19,045
271
Manufacture of electric motors, generators, transformers and
electricity distribution and control apparatus 434,028 - 188,067 4,560 52,250 - 3,315 682,220
272 Manufacture of batteries and accumulators 1,291,284 77,245 24,847 294,727 258,505 - - 1,946,608
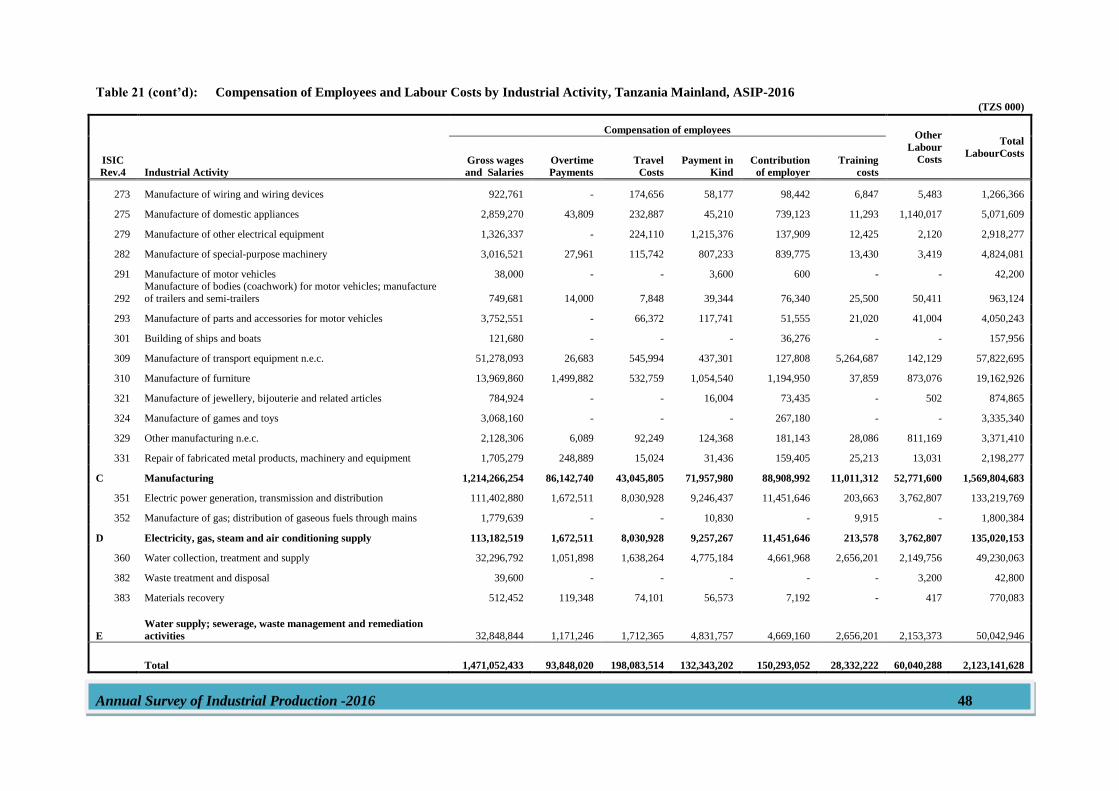
Annual Survey of Industrial Production -2016 48
Table 21 (cont’d): Compensation of Employees and Labour Costs by Industrial Activity, Tanzania Mainland, ASIP-2016 (TZS 000)
ISIC
Rev.4 Industrial Activity
Compensation of employees Other
Labour
Costs
Total
LabourCosts Gross wages
and Salaries
Overtime
Payments
Travel
Costs
Payment in
Kind
Contribution
of employer
Training
costs
273 Manufacture of wiring and wiring devices 922,761 - 174,656 58,177 98,442 6,847 5,483 1,266,366
275 Manufacture of domestic appliances 2,859,270 43,809 232,887 45,210 739,123 11,293 1,140,017 5,071,609
279 Manufacture of other electrical equipment 1,326,337 - 224,110 1,215,376 137,909 12,425 2,120 2,918,277
282 Manufacture of special-purpose machinery 3,016,521 27,961 115,742 807,233 839,775 13,430 3,419 4,824,081
291 Manufacture of motor vehicles 38,000 - - 3,600 600 - - 42,200
292
Manufacture of bodies (coachwork) for motor vehicles; manufacture
of trailers and semi-trailers 749,681 14,000 7,848 39,344 76,340 25,500 50,411 963,124
293 Manufacture of parts and accessories for motor vehicles 3,752,551 - 66,372 117,741 51,555 21,020 41,004 4,050,243
301 Building of ships and boats 121,680 - - - 36,276 - - 157,956
309 Manufacture of transport equipment n.e.c. 51,278,093 26,683 545,994 437,301 127,808 5,264,687 142,129 57,822,695
310 Manufacture of furniture 13,969,860 1,499,882 532,759 1,054,540 1,194,950 37,859 873,076 19,162,926
321 Manufacture of jewellery, bijouterie and related articles 784,924 - - 16,004 73,435 - 502 874,865
324 Manufacture of games and toys 3,068,160 - - - 267,180 - - 3,335,340
329 Other manufacturing n.e.c. 2,128,306 6,089 92,249 124,368 181,143 28,086 811,169 3,371,410
331 Repair of fabricated metal products, machinery and equipment 1,705,279 248,889 15,024 31,436 159,405 25,213 13,031 2,198,277
C Manufacturing 1,214,266,254 86,142,740 43,045,805 71,957,980 88,908,992 11,011,312 52,771,600 1,569,804,683
351 Electric power generation, transmission and distribution 111,402,880 1,672,511 8,030,928 9,246,437 11,451,646 203,663 3,762,807 133,219,769
352 Manufacture of gas; distribution of gaseous fuels through mains 1,779,639 - - 10,830 - 9,915 - 1,800,384
D Electricity, gas, steam and air conditioning supply 113,182,519 1,672,511 8,030,928 9,257,267 11,451,646 213,578 3,762,807 135,020,153
360 Water collection, treatment and supply 32,296,792 1,051,898 1,638,264 4,775,184 4,661,968 2,656,201 2,149,756 49,230,063
382 Waste treatment and disposal 39,600 - - - - - 3,200 42,800
383 Materials recovery 512,452 119,348 74,101 56,573 7,192 - 417 770,083
E
Water supply; sewerage, waste management and remediation
activities 32,848,844 1,171,246 1,712,365 4,831,757 4,669,160 2,656,201 2,153,373 50,042,946
Total 1,471,052,433 93,848,020 198,083,514 132,343,202 150,293,052 28,332,222 60,040,288 2,123,141,628
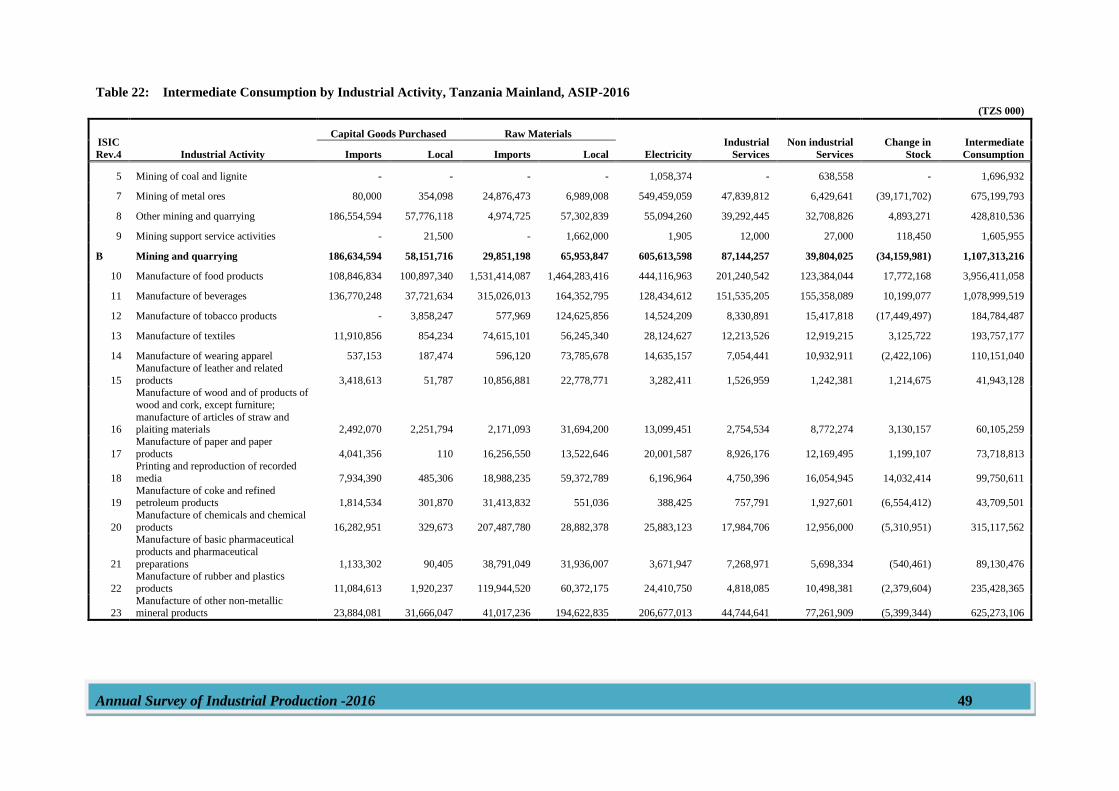
Annual Survey of Industrial Production -2016 49
Table 22: Intermediate Consumption by Industrial Activity, Tanzania Mainland, ASIP-2016
(TZS 000)
ISIC
Rev.4 Industrial Activity
Capital Goods Purchased Raw Materials
Electricity
Industrial
Services
Non industrial
Services
Change in
Stock
Intermediate
Consumption Imports Local Imports Local
5 Mining of coal and lignite - - - - 1,058,374 - 638,558 - 1,696,932
7 Mining of metal ores 80,000 354,098 24,876,473 6,989,008 549,459,059 47,839,812 6,429,641 (39,171,702) 675,199,793
8 Other mining and quarrying 186,554,594 57,776,118 4,974,725 57,302,839 55,094,260 39,292,445 32,708,826 4,893,271 428,810,536
9 Mining support service activities - 21,500 - 1,662,000 1,905 12,000 27,000 118,450 1,605,955
B Mining and quarrying 186,634,594 58,151,716 29,851,198 65,953,847 605,613,598 87,144,257 39,804,025 (34,159,981) 1,107,313,216
10 Manufacture of food products 108,846,834 100,897,340 1,531,414,087 1,464,283,416 444,116,963 201,240,542 123,384,044 17,772,168 3,956,411,058
11 Manufacture of beverages 136,770,248 37,721,634 315,026,013 164,352,795 128,434,612 151,535,205 155,358,089 10,199,077 1,078,999,519
12 Manufacture of tobacco products - 3,858,247 577,969 124,625,856 14,524,209 8,330,891 15,417,818 (17,449,497) 184,784,487
13 Manufacture of textiles 11,910,856 854,234 74,615,101 56,245,340 28,124,627 12,213,526 12,919,215 3,125,722 193,757,177
14 Manufacture of wearing apparel 537,153 187,474 596,120 73,785,678 14,635,157 7,054,441 10,932,911 (2,422,106) 110,151,040
15
Manufacture of leather and related
products 3,418,613 51,787 10,856,881 22,778,771 3,282,411 1,526,959 1,242,381 1,214,675 41,943,128
16
Manufacture of wood and of products of
wood and cork, except furniture;
manufacture of articles of straw and plaiting materials 2,492,070 2,251,794 2,171,093 31,694,200 13,099,451 2,754,534 8,772,274 3,130,157 60,105,259
17
Manufacture of paper and paper
products 4,041,356 110 16,256,550 13,522,646 20,001,587 8,926,176 12,169,495 1,199,107 73,718,813
18
Printing and reproduction of recorded
media 7,934,390 485,306 18,988,235 59,372,789 6,196,964 4,750,396 16,054,945 14,032,414 99,750,611
19 Manufacture of coke and refined petroleum products 1,814,534 301,870 31,413,832 551,036 388,425 757,791 1,927,601 (6,554,412) 43,709,501
20
Manufacture of chemicals and chemical
products 16,282,951 329,673 207,487,780 28,882,378 25,883,123 17,984,706 12,956,000 (5,310,951) 315,117,562
21
Manufacture of basic pharmaceutical
products and pharmaceutical
preparations 1,133,302 90,405 38,791,049 31,936,007 3,671,947 7,268,971 5,698,334 (540,461) 89,130,476
22
Manufacture of rubber and plastics
products 11,084,613 1,920,237 119,944,520 60,372,175 24,410,750 4,818,085 10,498,381 (2,379,604) 235,428,365
23 Manufacture of other non-metallic mineral products 23,884,081 31,666,047 41,017,236 194,622,835 206,677,013 44,744,641 77,261,909 (5,399,344) 625,273,106
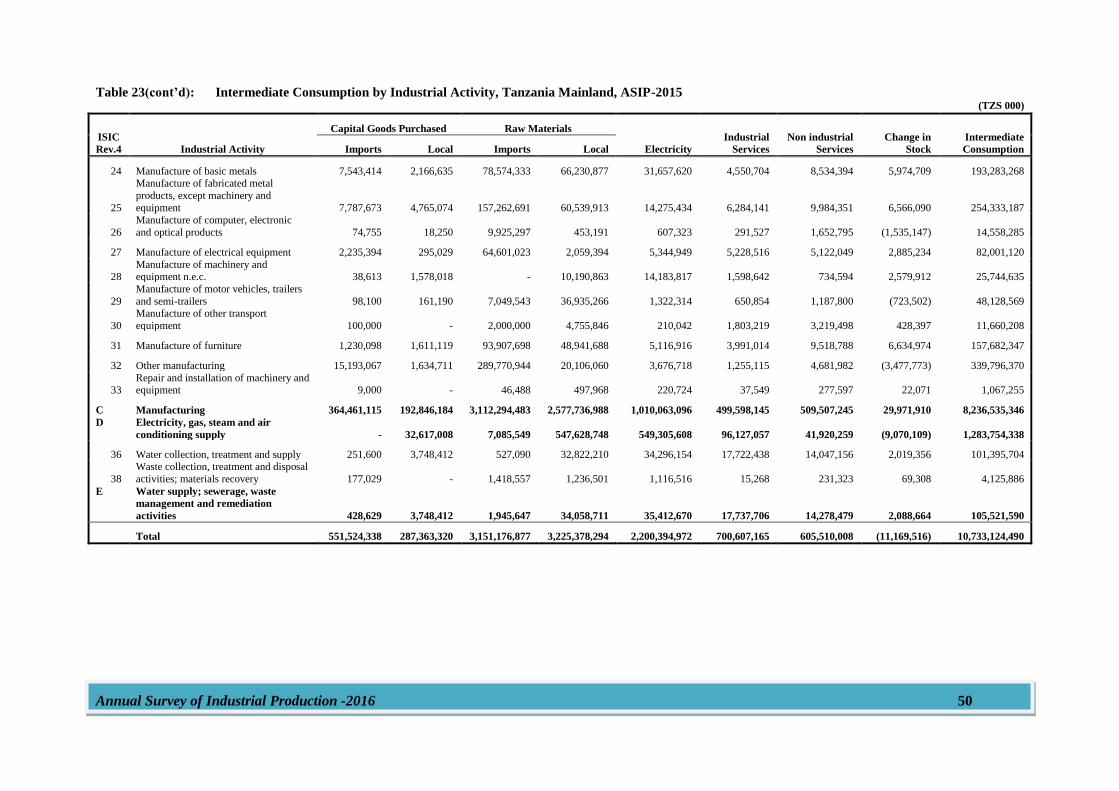
Annual Survey of Industrial Production -2016 50
Table 23(cont’d): Intermediate Consumption by Industrial Activity, Tanzania Mainland, ASIP-2015 (TZS 000)
ISIC
Rev.4 Industrial Activity
Capital Goods Purchased Raw Materials
Electricity
Industrial
Services
Non industrial
Services
Change in
Stock
Intermediate
Consumption Imports Local Imports Local
24 Manufacture of basic metals 7,543,414 2,166,635 78,574,333 66,230,877 31,657,620 4,550,704 8,534,394 5,974,709 193,283,268
25
Manufacture of fabricated metal
products, except machinery and
equipment 7,787,673 4,765,074 157,262,691 60,539,913 14,275,434 6,284,141 9,984,351 6,566,090 254,333,187
26
Manufacture of computer, electronic
and optical products 74,755 18,250 9,925,297 453,191 607,323 291,527 1,652,795 (1,535,147) 14,558,285
27 Manufacture of electrical equipment 2,235,394 295,029 64,601,023 2,059,394 5,344,949 5,228,516 5,122,049 2,885,234 82,001,120
28 Manufacture of machinery and equipment n.e.c. 38,613 1,578,018 - 10,190,863 14,183,817 1,598,642 734,594 2,579,912 25,744,635
29
Manufacture of motor vehicles, trailers
and semi-trailers 98,100 161,190 7,049,543 36,935,266 1,322,314 650,854 1,187,800 (723,502) 48,128,569
30
Manufacture of other transport
equipment 100,000 - 2,000,000 4,755,846 210,042 1,803,219 3,219,498 428,397 11,660,208
31 Manufacture of furniture 1,230,098 1,611,119 93,907,698 48,941,688 5,116,916 3,991,014 9,518,788 6,634,974 157,682,347
32 Other manufacturing 15,193,067 1,634,711 289,770,944 20,106,060 3,676,718 1,255,115 4,681,982 (3,477,773) 339,796,370
33 Repair and installation of machinery and equipment 9,000 - 46,488 497,968 220,724 37,549 277,597 22,071 1,067,255
C Manufacturing 364,461,115 192,846,184 3,112,294,483 2,577,736,988 1,010,063,096 499,598,145 509,507,245 29,971,910 8,236,535,346
D Electricity, gas, steam and air
conditioning supply - 32,617,008 7,085,549 547,628,748 549,305,608 96,127,057 41,920,259 (9,070,109) 1,283,754,338
36 Water collection, treatment and supply 251,600 3,748,412 527,090 32,822,210 34,296,154 17,722,438 14,047,156 2,019,356 101,395,704
38
Waste collection, treatment and disposal
activities; materials recovery 177,029 - 1,418,557 1,236,501 1,116,516 15,268 231,323 69,308 4,125,886
E Water supply; sewerage, waste
management and remediation
activities 428,629 3,748,412 1,945,647 34,058,711 35,412,670 17,737,706 14,278,479 2,088,664 105,521,590
Total 551,524,338 287,363,320 3,151,176,877 3,225,378,294 2,200,394,972 700,607,165 605,510,008 (11,169,516) 10,733,124,490
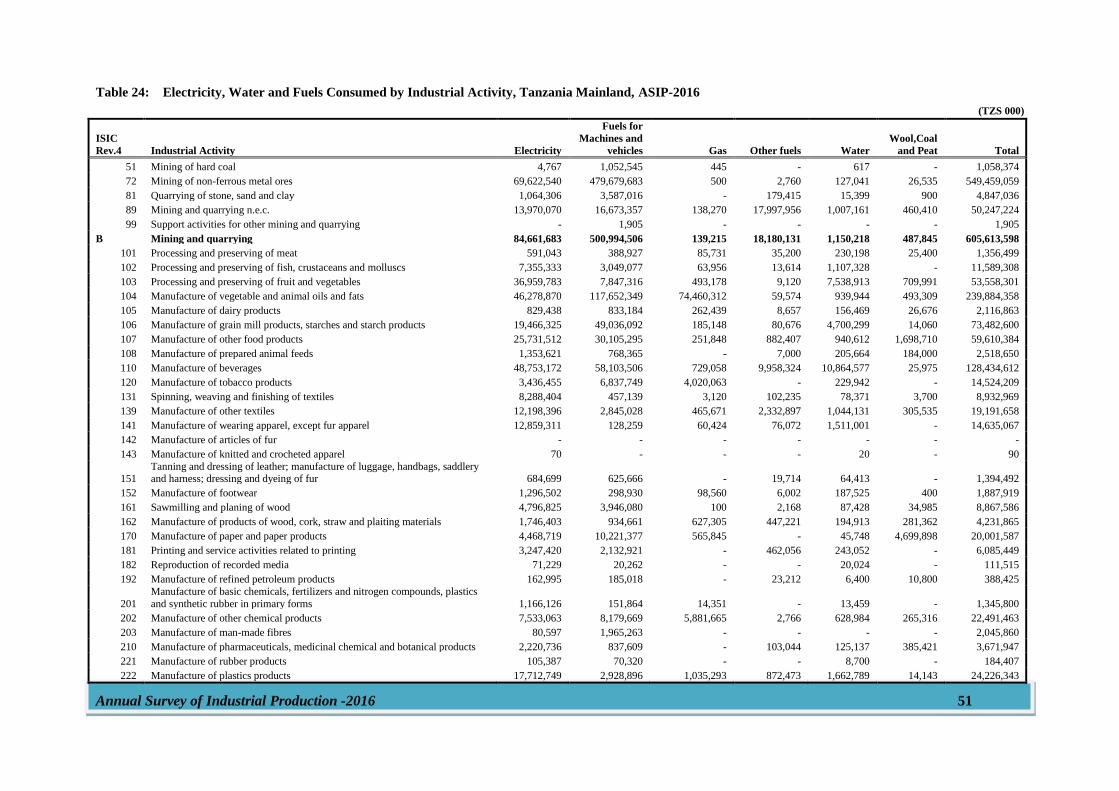
Annual Survey of Industrial Production -2016 51
Table 24: Electricity, Water and Fuels Consumed by Industrial Activity, Tanzania Mainland, ASIP-2016
(TZS 000)
ISIC
Rev.4 Industrial Activity Electricity
Fuels for
Machines and
vehicles Gas Other fuels Water
Wool,Coal
and Peat Total
51 Mining of hard coal 4,767 1,052,545 445 - 617 - 1,058,374
72 Mining of non-ferrous metal ores 69,622,540 479,679,683 500 2,760 127,041 26,535 549,459,059
81 Quarrying of stone, sand and clay 1,064,306 3,587,016 - 179,415 15,399 900 4,847,036
89 Mining and quarrying n.e.c. 13,970,070 16,673,357 138,270 17,997,956 1,007,161 460,410 50,247,224
99 Support activities for other mining and quarrying - 1,905 - - - - 1,905
B Mining and quarrying 84,661,683 500,994,506 139,215 18,180,131 1,150,218 487,845 605,613,598
101 Processing and preserving of meat 591,043 388,927 85,731 35,200 230,198 25,400 1,356,499
102 Processing and preserving of fish, crustaceans and molluscs 7,355,333 3,049,077 63,956 13,614 1,107,328 - 11,589,308
103 Processing and preserving of fruit and vegetables 36,959,783 7,847,316 493,178 9,120 7,538,913 709,991 53,558,301
104 Manufacture of vegetable and animal oils and fats 46,278,870 117,652,349 74,460,312 59,574 939,944 493,309 239,884,358
105 Manufacture of dairy products 829,438 833,184 262,439 8,657 156,469 26,676 2,116,863
106 Manufacture of grain mill products, starches and starch products 19,466,325 49,036,092 185,148 80,676 4,700,299 14,060 73,482,600
107 Manufacture of other food products 25,731,512 30,105,295 251,848 882,407 940,612 1,698,710 59,610,384
108 Manufacture of prepared animal feeds 1,353,621 768,365 - 7,000 205,664 184,000 2,518,650
110 Manufacture of beverages 48,753,172 58,103,506 729,058 9,958,324 10,864,577 25,975 128,434,612
120 Manufacture of tobacco products 3,436,455 6,837,749 4,020,063 - 229,942 - 14,524,209
131 Spinning, weaving and finishing of textiles 8,288,404 457,139 3,120 102,235 78,371 3,700 8,932,969
139 Manufacture of other textiles 12,198,396 2,845,028 465,671 2,332,897 1,044,131 305,535 19,191,658
141 Manufacture of wearing apparel, except fur apparel 12,859,311 128,259 60,424 76,072 1,511,001 - 14,635,067
142 Manufacture of articles of fur - - - - - - -
143 Manufacture of knitted and crocheted apparel 70 - - - 20 - 90
151 Tanning and dressing of leather; manufacture of luggage, handbags, saddlery and harness; dressing and dyeing of fur 684,699 625,666 - 19,714 64,413 - 1,394,492
152 Manufacture of footwear 1,296,502 298,930 98,560 6,002 187,525 400 1,887,919
161 Sawmilling and planing of wood 4,796,825 3,946,080 100 2,168 87,428 34,985 8,867,586
162 Manufacture of products of wood, cork, straw and plaiting materials 1,746,403 934,661 627,305 447,221 194,913 281,362 4,231,865
170 Manufacture of paper and paper products 4,468,719 10,221,377 565,845 - 45,748 4,699,898 20,001,587
181 Printing and service activities related to printing 3,247,420 2,132,921 - 462,056 243,052 - 6,085,449
182 Reproduction of recorded media 71,229 20,262 - - 20,024 - 111,515
192 Manufacture of refined petroleum products 162,995 185,018 - 23,212 6,400 10,800 388,425
201
Manufacture of basic chemicals, fertilizers and nitrogen compounds, plastics
and synthetic rubber in primary forms 1,166,126 151,864 14,351 - 13,459 - 1,345,800
202 Manufacture of other chemical products 7,533,063 8,179,669 5,881,665 2,766 628,984 265,316 22,491,463
203 Manufacture of man-made fibres 80,597 1,965,263 - - - - 2,045,860
210 Manufacture of pharmaceuticals, medicinal chemical and botanical products 2,220,736 837,609 - 103,044 125,137 385,421 3,671,947
221 Manufacture of rubber products 105,387 70,320 - - 8,700 - 184,407
222 Manufacture of plastics products 17,712,749 2,928,896 1,035,293 872,473 1,662,789 14,143 24,226,343
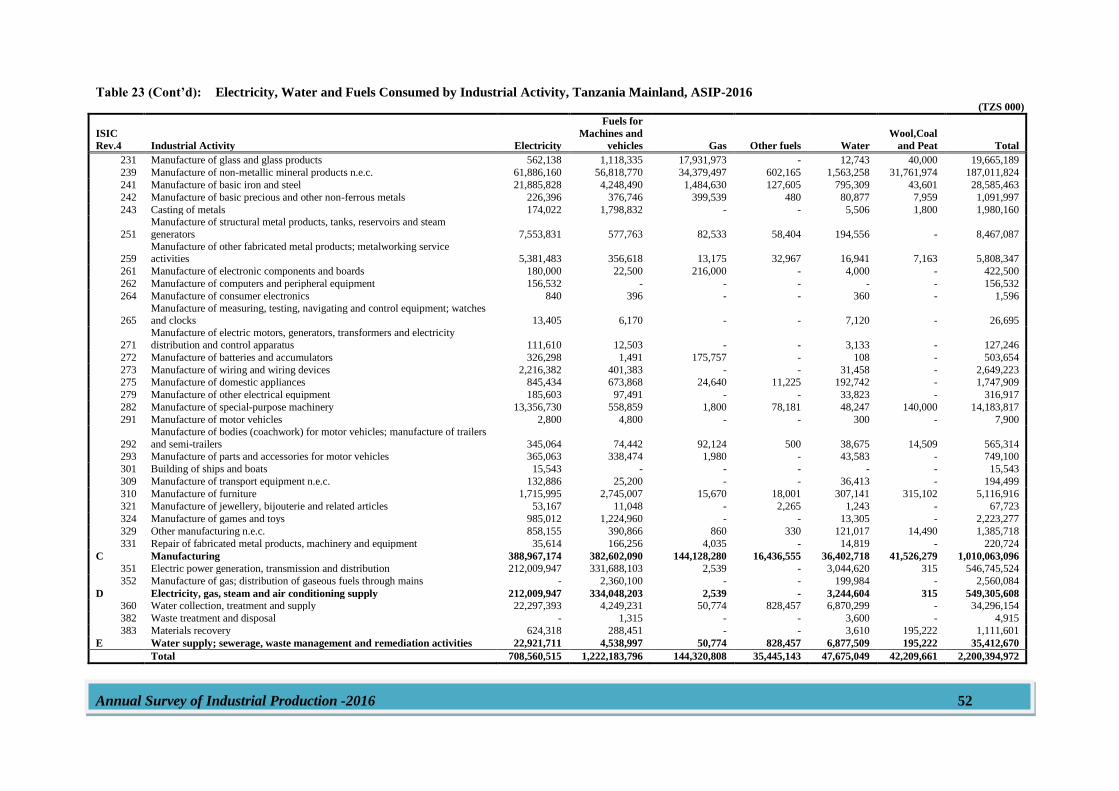
Annual Survey of Industrial Production -2016 52
Table 23 (Cont’d): Electricity, Water and Fuels Consumed by Industrial Activity, Tanzania Mainland, ASIP-2016 (TZS 000)
ISIC
Rev.4 Industrial Activity Electricity
Fuels for
Machines and
vehicles Gas Other fuels Water
Wool,Coal
and Peat Total
231 Manufacture of glass and glass products 562,138 1,118,335 17,931,973 - 12,743 40,000 19,665,189
239 Manufacture of non-metallic mineral products n.e.c. 61,886,160 56,818,770 34,379,497 602,165 1,563,258 31,761,974 187,011,824
241 Manufacture of basic iron and steel 21,885,828 4,248,490 1,484,630 127,605 795,309 43,601 28,585,463
242 Manufacture of basic precious and other non-ferrous metals 226,396 376,746 399,539 480 80,877 7,959 1,091,997
243 Casting of metals 174,022 1,798,832 - - 5,506 1,800 1,980,160
251
Manufacture of structural metal products, tanks, reservoirs and steam
generators 7,553,831 577,763 82,533 58,404 194,556 - 8,467,087
259 Manufacture of other fabricated metal products; metalworking service activities 5,381,483 356,618 13,175 32,967 16,941 7,163 5,808,347
261 Manufacture of electronic components and boards 180,000 22,500 216,000 - 4,000 - 422,500
262 Manufacture of computers and peripheral equipment 156,532 - - - - - 156,532
264 Manufacture of consumer electronics 840 396 - - 360 - 1,596
265 Manufacture of measuring, testing, navigating and control equipment; watches and clocks 13,405 6,170 - - 7,120 - 26,695
271
Manufacture of electric motors, generators, transformers and electricity
distribution and control apparatus 111,610 12,503 - - 3,133 - 127,246
272 Manufacture of batteries and accumulators 326,298 1,491 175,757 - 108 - 503,654
273 Manufacture of wiring and wiring devices 2,216,382 401,383 - - 31,458 - 2,649,223
275 Manufacture of domestic appliances 845,434 673,868 24,640 11,225 192,742 - 1,747,909
279 Manufacture of other electrical equipment 185,603 97,491 - - 33,823 - 316,917
282 Manufacture of special-purpose machinery 13,356,730 558,859 1,800 78,181 48,247 140,000 14,183,817
291 Manufacture of motor vehicles 2,800 4,800 - - 300 - 7,900
292
Manufacture of bodies (coachwork) for motor vehicles; manufacture of trailers
and semi-trailers 345,064 74,442 92,124 500 38,675 14,509 565,314
293 Manufacture of parts and accessories for motor vehicles 365,063 338,474 1,980 - 43,583 - 749,100
301 Building of ships and boats 15,543 - - - - - 15,543
309 Manufacture of transport equipment n.e.c. 132,886 25,200 - - 36,413 - 194,499
310 Manufacture of furniture 1,715,995 2,745,007 15,670 18,001 307,141 315,102 5,116,916
321 Manufacture of jewellery, bijouterie and related articles 53,167 11,048 - 2,265 1,243 - 67,723
324 Manufacture of games and toys 985,012 1,224,960 - - 13,305 - 2,223,277
329 Other manufacturing n.e.c. 858,155 390,866 860 330 121,017 14,490 1,385,718
331 Repair of fabricated metal products, machinery and equipment 35,614 166,256 4,035 - 14,819 - 220,724
C Manufacturing 388,967,174 382,602,090 144,128,280 16,436,555 36,402,718 41,526,279 1,010,063,096
351 Electric power generation, transmission and distribution 212,009,947 331,688,103 2,539 - 3,044,620 315 546,745,524
352 Manufacture of gas; distribution of gaseous fuels through mains - 2,360,100 - - 199,984 - 2,560,084
D Electricity, gas, steam and air conditioning supply 212,009,947 334,048,203 2,539 - 3,244,604 315 549,305,608
360 Water collection, treatment and supply 22,297,393 4,249,231 50,774 828,457 6,870,299 - 34,296,154
382 Waste treatment and disposal - 1,315 - - 3,600 - 4,915
383 Materials recovery 624,318 288,451 - - 3,610 195,222 1,111,601
E Water supply; sewerage, waste management and remediation activities 22,921,711 4,538,997 50,774 828,457 6,877,509 195,222 35,412,670
Total 708,560,515 1,222,183,796 144,320,808 35,445,143 47,675,049 42,209,661 2,200,394,972
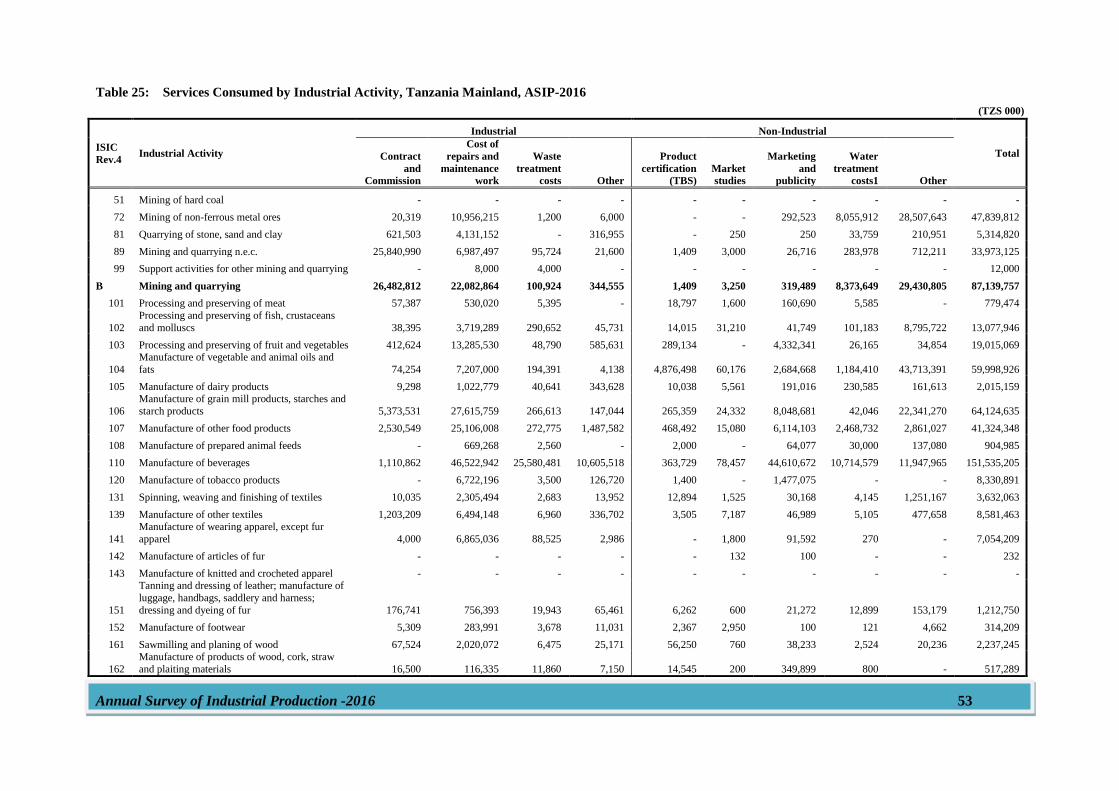
Annual Survey of Industrial Production -2016 53
Table 25: Services Consumed by Industrial Activity, Tanzania Mainland, ASIP-2016
(TZS 000)
ISIC
Rev.4 Industrial Activity
Industrial Non-Industrial
Total Contract
and
Commission
Cost of
repairs and
maintenance
work
Waste
treatment
costs Other
Product
certification
(TBS)
Market
studies
Marketing
and
publicity
Water
treatment
costs1 Other
51 Mining of hard coal - - - - - - - - - -
72 Mining of non-ferrous metal ores 20,319 10,956,215 1,200 6,000 - - 292,523 8,055,912 28,507,643 47,839,812
81 Quarrying of stone, sand and clay 621,503 4,131,152 - 316,955 - 250 250 33,759 210,951 5,314,820
89 Mining and quarrying n.e.c. 25,840,990 6,987,497 95,724 21,600 1,409 3,000 26,716 283,978 712,211 33,973,125
99 Support activities for other mining and quarrying - 8,000 4,000 - - - - - - 12,000
B Mining and quarrying 26,482,812 22,082,864 100,924 344,555 1,409 3,250 319,489 8,373,649 29,430,805 87,139,757
101 Processing and preserving of meat 57,387 530,020 5,395 - 18,797 1,600 160,690 5,585 - 779,474
102
Processing and preserving of fish, crustaceans
and molluscs 38,395 3,719,289 290,652 45,731 14,015 31,210 41,749 101,183 8,795,722 13,077,946
103 Processing and preserving of fruit and vegetables 412,624 13,285,530 48,790 585,631 289,134 - 4,332,341 26,165 34,854 19,015,069
104
Manufacture of vegetable and animal oils and
fats 74,254 7,207,000 194,391 4,138 4,876,498 60,176 2,684,668 1,184,410 43,713,391 59,998,926
105 Manufacture of dairy products 9,298 1,022,779 40,641 343,628 10,038 5,561 191,016 230,585 161,613 2,015,159
106
Manufacture of grain mill products, starches and
starch products 5,373,531 27,615,759 266,613 147,044 265,359 24,332 8,048,681 42,046 22,341,270 64,124,635
107 Manufacture of other food products 2,530,549 25,106,008 272,775 1,487,582 468,492 15,080 6,114,103 2,468,732 2,861,027 41,324,348
108 Manufacture of prepared animal feeds - 669,268 2,560 - 2,000 - 64,077 30,000 137,080 904,985
110 Manufacture of beverages 1,110,862 46,522,942 25,580,481 10,605,518 363,729 78,457 44,610,672 10,714,579 11,947,965 151,535,205
120 Manufacture of tobacco products - 6,722,196 3,500 126,720 1,400 - 1,477,075 - - 8,330,891
131 Spinning, weaving and finishing of textiles 10,035 2,305,494 2,683 13,952 12,894 1,525 30,168 4,145 1,251,167 3,632,063
139 Manufacture of other textiles 1,203,209 6,494,148 6,960 336,702 3,505 7,187 46,989 5,105 477,658 8,581,463
141
Manufacture of wearing apparel, except fur
apparel 4,000 6,865,036 88,525 2,986 - 1,800 91,592 270 - 7,054,209
142 Manufacture of articles of fur - - - - - 132 100 - - 232
143 Manufacture of knitted and crocheted apparel - - - - - - - - - -
151
Tanning and dressing of leather; manufacture of
luggage, handbags, saddlery and harness;
dressing and dyeing of fur 176,741 756,393 19,943 65,461 6,262 600 21,272 12,899 153,179 1,212,750
152 Manufacture of footwear 5,309 283,991 3,678 11,031 2,367 2,950 100 121 4,662 314,209
161 Sawmilling and planing of wood 67,524 2,020,072 6,475 25,171 56,250 760 38,233 2,524 20,236 2,237,245
162
Manufacture of products of wood, cork, straw
and plaiting materials 16,500 116,335 11,860 7,150 14,545 200 349,899 800 - 517,289
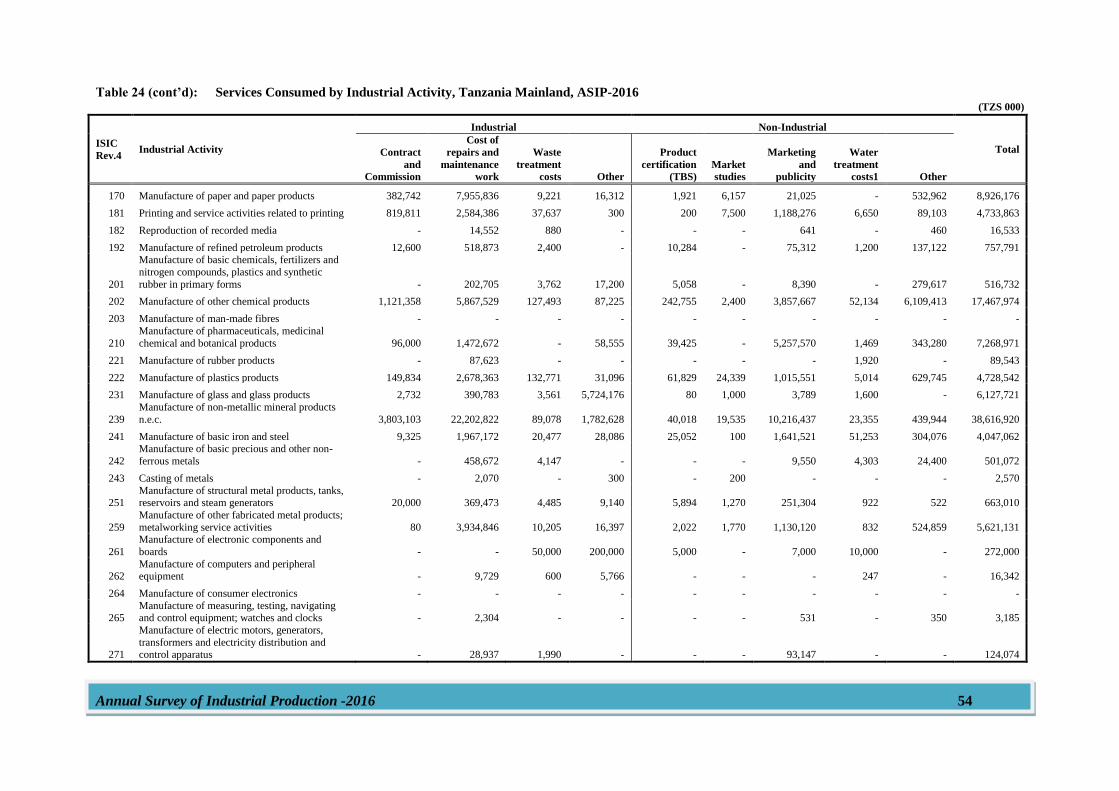
Annual Survey of Industrial Production -2016 54
Table 24 (cont’d): Services Consumed by Industrial Activity, Tanzania Mainland, ASIP-2016 (TZS 000)
ISIC
Rev.4 Industrial Activity
Industrial Non-Industrial
Total Contract
and
Commission
Cost of
repairs and
maintenance
work
Waste
treatment
costs Other
Product
certification
(TBS)
Market
studies
Marketing
and
publicity
Water
treatment
costs1 Other
170 Manufacture of paper and paper products 382,742 7,955,836 9,221 16,312 1,921 6,157 21,025 - 532,962 8,926,176
181 Printing and service activities related to printing 819,811 2,584,386 37,637 300 200 7,500 1,188,276 6,650 89,103 4,733,863
182 Reproduction of recorded media - 14,552 880 - - - 641 - 460 16,533
192 Manufacture of refined petroleum products 12,600 518,873 2,400 - 10,284 - 75,312 1,200 137,122 757,791
201
Manufacture of basic chemicals, fertilizers and
nitrogen compounds, plastics and synthetic
rubber in primary forms - 202,705 3,762 17,200 5,058 - 8,390 - 279,617 516,732
202 Manufacture of other chemical products 1,121,358 5,867,529 127,493 87,225 242,755 2,400 3,857,667 52,134 6,109,413 17,467,974
203 Manufacture of man-made fibres - - - - - - - - - -
210
Manufacture of pharmaceuticals, medicinal
chemical and botanical products 96,000 1,472,672 - 58,555 39,425 - 5,257,570 1,469 343,280 7,268,971
221 Manufacture of rubber products - 87,623 - - - - - 1,920 - 89,543
222 Manufacture of plastics products 149,834 2,678,363 132,771 31,096 61,829 24,339 1,015,551 5,014 629,745 4,728,542
231 Manufacture of glass and glass products 2,732 390,783 3,561 5,724,176 80 1,000 3,789 1,600 - 6,127,721
239
Manufacture of non-metallic mineral products
n.e.c. 3,803,103 22,202,822 89,078 1,782,628 40,018 19,535 10,216,437 23,355 439,944 38,616,920
241 Manufacture of basic iron and steel 9,325 1,967,172 20,477 28,086 25,052 100 1,641,521 51,253 304,076 4,047,062
242
Manufacture of basic precious and other non-
ferrous metals - 458,672 4,147 - - - 9,550 4,303 24,400 501,072
243 Casting of metals - 2,070 - 300 - 200 - - - 2,570
251 Manufacture of structural metal products, tanks, reservoirs and steam generators 20,000 369,473 4,485 9,140 5,894 1,270 251,304 922 522 663,010
259
Manufacture of other fabricated metal products;
metalworking service activities 80 3,934,846 10,205 16,397 2,022 1,770 1,130,120 832 524,859 5,621,131
261
Manufacture of electronic components and
boards - - 50,000 200,000 5,000 - 7,000 10,000 - 272,000
262 Manufacture of computers and peripheral equipment - 9,729 600 5,766 - - - 247 - 16,342
264 Manufacture of consumer electronics - - - - - - - - - -
265 Manufacture of measuring, testing, navigating and control equipment; watches and clocks - 2,304 - - - - 531 - 350 3,185
271
Manufacture of electric motors, generators,
transformers and electricity distribution and control apparatus - 28,937 1,990 - - - 93,147 - - 124,074
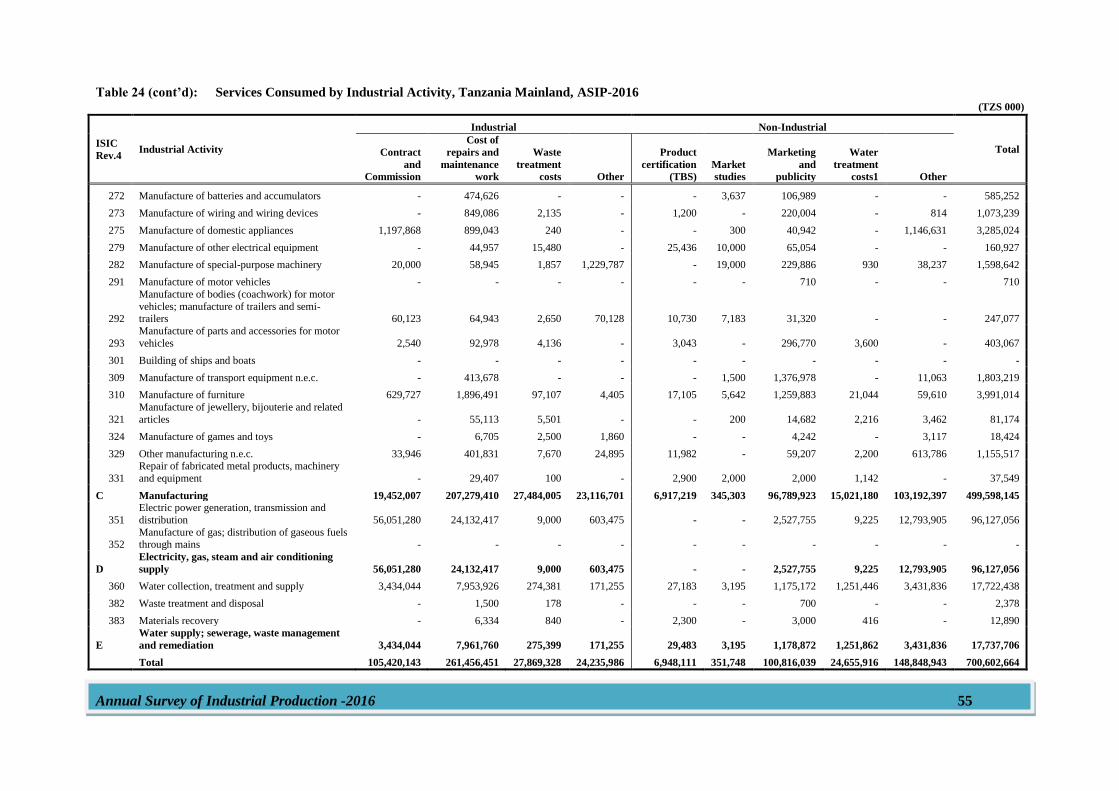
Annual Survey of Industrial Production -2016 55
Table 24 (cont’d): Services Consumed by Industrial Activity, Tanzania Mainland, ASIP-2016 (TZS 000)
ISIC
Rev.4 Industrial Activity
Industrial Non-Industrial
Total Contract
and
Commission
Cost of
repairs and
maintenance
work
Waste
treatment
costs Other
Product
certification
(TBS)
Market
studies
Marketing
and
publicity
Water
treatment
costs1 Other
272 Manufacture of batteries and accumulators - 474,626 - - - 3,637 106,989 - - 585,252
273 Manufacture of wiring and wiring devices - 849,086 2,135 - 1,200 - 220,004 - 814 1,073,239
275 Manufacture of domestic appliances 1,197,868 899,043 240 - - 300 40,942 - 1,146,631 3,285,024
279 Manufacture of other electrical equipment - 44,957 15,480 - 25,436 10,000 65,054 - - 160,927
282 Manufacture of special-purpose machinery 20,000 58,945 1,857 1,229,787 - 19,000 229,886 930 38,237 1,598,642
291 Manufacture of motor vehicles - - - - - - 710 - - 710
292
Manufacture of bodies (coachwork) for motor
vehicles; manufacture of trailers and semi-trailers 60,123 64,943 2,650 70,128 10,730 7,183 31,320 - - 247,077
293
Manufacture of parts and accessories for motor
vehicles 2,540 92,978 4,136 - 3,043 - 296,770 3,600 - 403,067
301 Building of ships and boats - - - - - - - - - -
309 Manufacture of transport equipment n.e.c. - 413,678 - - - 1,500 1,376,978 - 11,063 1,803,219
310 Manufacture of furniture 629,727 1,896,491 97,107 4,405 17,105 5,642 1,259,883 21,044 59,610 3,991,014
321
Manufacture of jewellery, bijouterie and related
articles - 55,113 5,501 - - 200 14,682 2,216 3,462 81,174
324 Manufacture of games and toys - 6,705 2,500 1,860 - - 4,242 - 3,117 18,424
329 Other manufacturing n.e.c. 33,946 401,831 7,670 24,895 11,982 - 59,207 2,200 613,786 1,155,517
331
Repair of fabricated metal products, machinery
and equipment - 29,407 100 - 2,900 2,000 2,000 1,142 - 37,549
C Manufacturing 19,452,007 207,279,410 27,484,005 23,116,701 6,917,219 345,303 96,789,923 15,021,180 103,192,397 499,598,145
351
Electric power generation, transmission and
distribution 56,051,280 24,132,417 9,000 603,475 - - 2,527,755 9,225 12,793,905 96,127,056
352 Manufacture of gas; distribution of gaseous fuels through mains - - - - - - - - - -
D
Electricity, gas, steam and air conditioning
supply 56,051,280 24,132,417 9,000 603,475 - - 2,527,755 9,225 12,793,905 96,127,056
360 Water collection, treatment and supply 3,434,044 7,953,926 274,381 171,255 27,183 3,195 1,175,172 1,251,446 3,431,836 17,722,438
382 Waste treatment and disposal - 1,500 178 - - - 700 - - 2,378
383 Materials recovery - 6,334 840 - 2,300 - 3,000 416 - 12,890
E
Water supply; sewerage, waste management
and remediation 3,434,044 7,961,760 275,399 171,255 29,483 3,195 1,178,872 1,251,862 3,431,836 17,737,706
Total 105,420,143 261,456,451 27,869,328 24,235,986 6,948,111 351,748 100,816,039 24,655,916 148,848,943 700,602,664
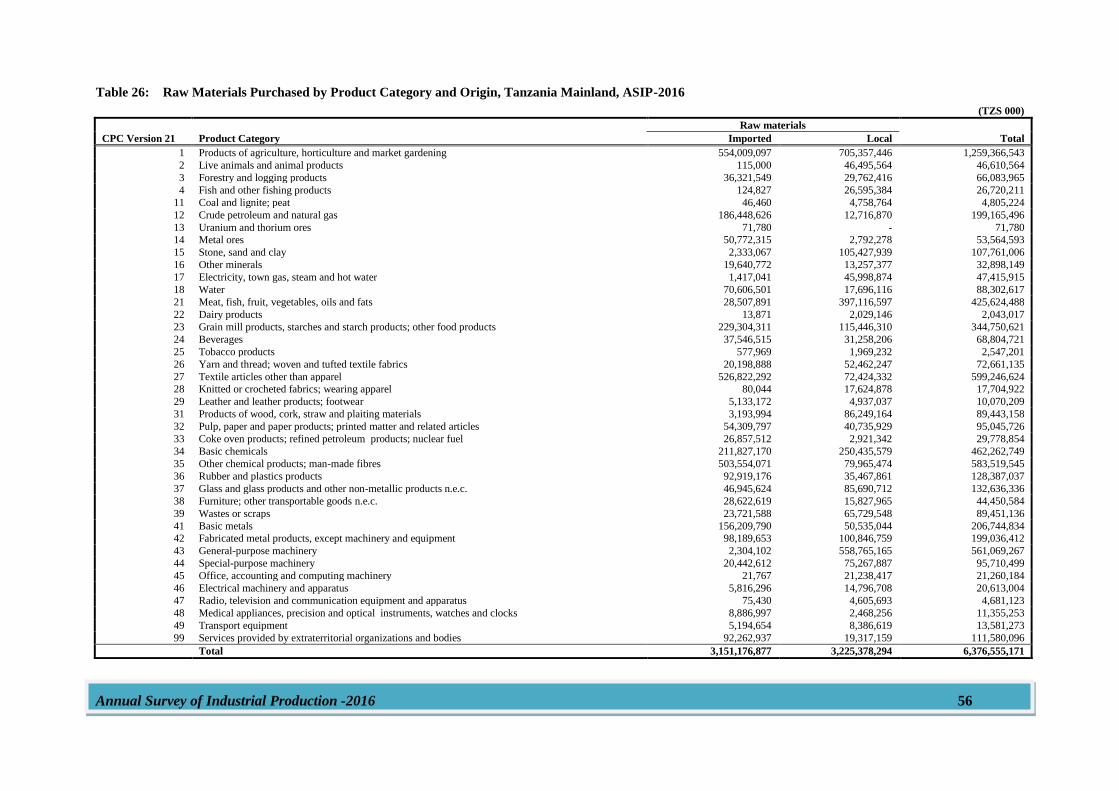
Annual Survey of Industrial Production -2016 56
Table 26: Raw Materials Purchased by Product Category and Origin, Tanzania Mainland, ASIP-2016
(TZS 000)
CPC Version 21 Product Category
Raw materials
Imported Local Total
1 Products of agriculture, horticulture and market gardening 554,009,097 705,357,446 1,259,366,543
2 Live animals and animal products 115,000 46,495,564 46,610,564
3 Forestry and logging products 36,321,549 29,762,416 66,083,965
4 Fish and other fishing products 124,827 26,595,384 26,720,211
11 Coal and lignite; peat 46,460 4,758,764 4,805,224
12 Crude petroleum and natural gas 186,448,626 12,716,870 199,165,496
13 Uranium and thorium ores 71,780 - 71,780
14 Metal ores 50,772,315 2,792,278 53,564,593
15 Stone, sand and clay 2,333,067 105,427,939 107,761,006
16 Other minerals 19,640,772 13,257,377 32,898,149
17 Electricity, town gas, steam and hot water 1,417,041 45,998,874 47,415,915
18 Water 70,606,501 17,696,116 88,302,617
21 Meat, fish, fruit, vegetables, oils and fats 28,507,891 397,116,597 425,624,488
22 Dairy products 13,871 2,029,146 2,043,017
23 Grain mill products, starches and starch products; other food products 229,304,311 115,446,310 344,750,621
24 Beverages 37,546,515 31,258,206 68,804,721
25 Tobacco products 577,969 1,969,232 2,547,201
26 Yarn and thread; woven and tufted textile fabrics 20,198,888 52,462,247 72,661,135
27 Textile articles other than apparel 526,822,292 72,424,332 599,246,624
28 Knitted or crocheted fabrics; wearing apparel 80,044 17,624,878 17,704,922
29 Leather and leather products; footwear 5,133,172 4,937,037 10,070,209
31 Products of wood, cork, straw and plaiting materials 3,193,994 86,249,164 89,443,158
32 Pulp, paper and paper products; printed matter and related articles 54,309,797 40,735,929 95,045,726
33 Coke oven products; refined petroleum products; nuclear fuel 26,857,512 2,921,342 29,778,854
34 Basic chemicals 211,827,170 250,435,579 462,262,749
35 Other chemical products; man-made fibres 503,554,071 79,965,474 583,519,545
36 Rubber and plastics products 92,919,176 35,467,861 128,387,037
37 Glass and glass products and other non-metallic products n.e.c. 46,945,624 85,690,712 132,636,336
38 Furniture; other transportable goods n.e.c. 28,622,619 15,827,965 44,450,584
39 Wastes or scraps 23,721,588 65,729,548 89,451,136
41 Basic metals 156,209,790 50,535,044 206,744,834
42 Fabricated metal products, except machinery and equipment 98,189,653 100,846,759 199,036,412
43 General-purpose machinery 2,304,102 558,765,165 561,069,267
44 Special-purpose machinery 20,442,612 75,267,887 95,710,499
45 Office, accounting and computing machinery 21,767 21,238,417 21,260,184
46 Electrical machinery and apparatus 5,816,296 14,796,708 20,613,004
47 Radio, television and communication equipment and apparatus 75,430 4,605,693 4,681,123
48 Medical appliances, precision and optical instruments, watches and clocks 8,886,997 2,468,256 11,355,253
49 Transport equipment 5,194,654 8,386,619 13,581,273
99 Services provided by extraterritorial organizations and bodies 92,262,937 19,317,159 111,580,096
Total 3,151,176,877 3,225,378,294 6,376,555,171
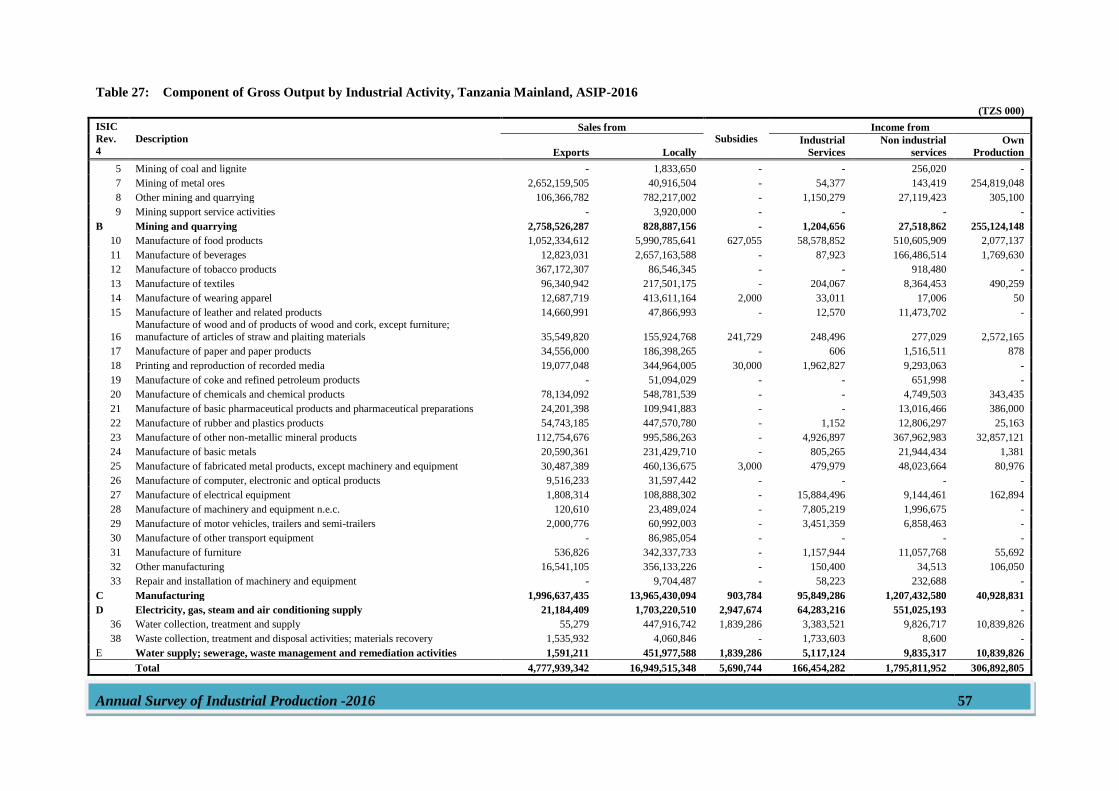
Annual Survey of Industrial Production -2016 57
Table 27: Component of Gross Output by Industrial Activity, Tanzania Mainland, ASIP-2016
(TZS 000) ISIC
Rev.
4
Description Sales from
Subsidies Income from
Exports Locally
Industrial
Services
Non industrial
services
Own
Production
5 Mining of coal and lignite - 1,833,650 - - 256,020 -
7 Mining of metal ores 2,652,159,505 40,916,504 - 54,377 143,419 254,819,048
8 Other mining and quarrying 106,366,782 782,217,002 - 1,150,279 27,119,423 305,100
9 Mining support service activities - 3,920,000 - - - -
B Mining and quarrying 2,758,526,287 828,887,156 - 1,204,656 27,518,862 255,124,148
10 Manufacture of food products 1,052,334,612 5,990,785,641 627,055 58,578,852 510,605,909 2,077,137
11 Manufacture of beverages 12,823,031 2,657,163,588 - 87,923 166,486,514 1,769,630
12 Manufacture of tobacco products 367,172,307 86,546,345 - - 918,480 -
13 Manufacture of textiles 96,340,942 217,501,175 - 204,067 8,364,453 490,259
14 Manufacture of wearing apparel 12,687,719 413,611,164 2,000 33,011 17,006 50
15 Manufacture of leather and related products 14,660,991 47,866,993 - 12,570 11,473,702 -
16
Manufacture of wood and of products of wood and cork, except furniture;
manufacture of articles of straw and plaiting materials 35,549,820 155,924,768 241,729 248,496 277,029 2,572,165
17 Manufacture of paper and paper products 34,556,000 186,398,265 - 606 1,516,511 878
18 Printing and reproduction of recorded media 19,077,048 344,964,005 30,000 1,962,827 9,293,063 -
19 Manufacture of coke and refined petroleum products - 51,094,029 - - 651,998 -
20 Manufacture of chemicals and chemical products 78,134,092 548,781,539 - - 4,749,503 343,435
21 Manufacture of basic pharmaceutical products and pharmaceutical preparations 24,201,398 109,941,883 - - 13,016,466 386,000
22 Manufacture of rubber and plastics products 54,743,185 447,570,780 - 1,152 12,806,297 25,163
23 Manufacture of other non-metallic mineral products 112,754,676 995,586,263 - 4,926,897 367,962,983 32,857,121
24 Manufacture of basic metals 20,590,361 231,429,710 - 805,265 21,944,434 1,381
25 Manufacture of fabricated metal products, except machinery and equipment 30,487,389 460,136,675 3,000 479,979 48,023,664 80,976
26 Manufacture of computer, electronic and optical products 9,516,233 31,597,442 - - - -
27 Manufacture of electrical equipment 1,808,314 108,888,302 - 15,884,496 9,144,461 162,894
28 Manufacture of machinery and equipment n.e.c. 120,610 23,489,024 - 7,805,219 1,996,675 -
29 Manufacture of motor vehicles, trailers and semi-trailers 2,000,776 60,992,003 - 3,451,359 6,858,463 -
30 Manufacture of other transport equipment - 86,985,054 - - - -
31 Manufacture of furniture 536,826 342,337,733 - 1,157,944 11,057,768 55,692
32 Other manufacturing 16,541,105 356,133,226 - 150,400 34,513 106,050
33 Repair and installation of machinery and equipment - 9,704,487 - 58,223 232,688 -
C Manufacturing 1,996,637,435 13,965,430,094 903,784 95,849,286 1,207,432,580 40,928,831
D Electricity, gas, steam and air conditioning supply 21,184,409 1,703,220,510 2,947,674 64,283,216 551,025,193 -
36 Water collection, treatment and supply 55,279 447,916,742 1,839,286 3,383,521 9,826,717 10,839,826
38 Waste collection, treatment and disposal activities; materials recovery 1,535,932 4,060,846 - 1,733,603 8,600 -
E Water supply; sewerage, waste management and remediation activities 1,591,211 451,977,588 1,839,286 5,117,124 9,835,317 10,839,826
Total 4,777,939,342 16,949,515,348 5,690,744 166,454,282 1,795,811,952 306,892,805
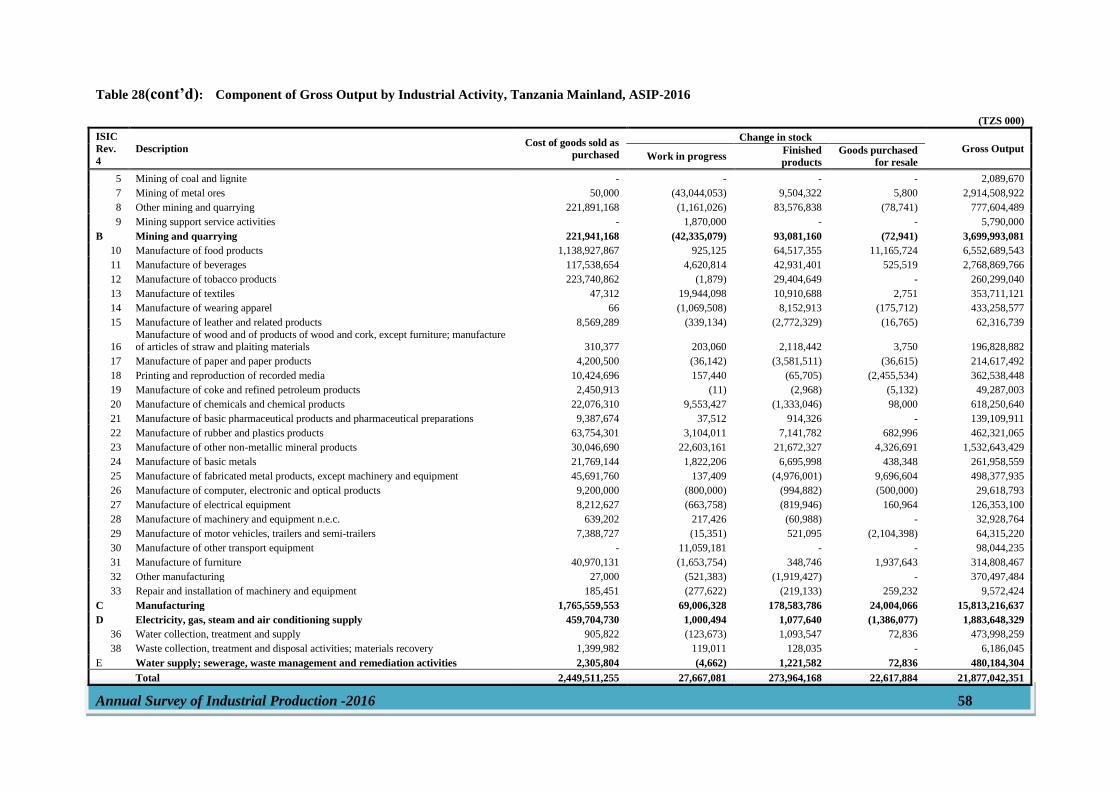
Annual Survey of Industrial Production -2016 58
Table 28(cont’d): Component of Gross Output by Industrial Activity, Tanzania Mainland, ASIP-2016
(TZS 000) ISIC
Rev.
4
Description Cost of goods sold as
purchased
Change in stock Gross Output
Work in progress Finished
products
Goods purchased
for resale
5 Mining of coal and lignite - - - - 2,089,670
7 Mining of metal ores 50,000 (43,044,053) 9,504,322 5,800 2,914,508,922
8 Other mining and quarrying 221,891,168 (1,161,026) 83,576,838 (78,741) 777,604,489
9 Mining support service activities - 1,870,000 - - 5,790,000
B Mining and quarrying 221,941,168 (42,335,079) 93,081,160 (72,941) 3,699,993,081
10 Manufacture of food products 1,138,927,867 925,125 64,517,355 11,165,724 6,552,689,543
11 Manufacture of beverages 117,538,654 4,620,814 42,931,401 525,519 2,768,869,766
12 Manufacture of tobacco products 223,740,862 (1,879) 29,404,649 - 260,299,040
13 Manufacture of textiles 47,312 19,944,098 10,910,688 2,751 353,711,121
14 Manufacture of wearing apparel 66 (1,069,508) 8,152,913 (175,712) 433,258,577
15 Manufacture of leather and related products 8,569,289 (339,134) (2,772,329) (16,765) 62,316,739
16 Manufacture of wood and of products of wood and cork, except furniture; manufacture of articles of straw and plaiting materials 310,377 203,060 2,118,442 3,750 196,828,882
17 Manufacture of paper and paper products 4,200,500 (36,142) (3,581,511) (36,615) 214,617,492
18 Printing and reproduction of recorded media 10,424,696 157,440 (65,705) (2,455,534) 362,538,448
19 Manufacture of coke and refined petroleum products 2,450,913 (11) (2,968) (5,132) 49,287,003
20 Manufacture of chemicals and chemical products 22,076,310 9,553,427 (1,333,046) 98,000 618,250,640
21 Manufacture of basic pharmaceutical products and pharmaceutical preparations 9,387,674 37,512 914,326 - 139,109,911
22 Manufacture of rubber and plastics products 63,754,301 3,104,011 7,141,782 682,996 462,321,065
23 Manufacture of other non-metallic mineral products 30,046,690 22,603,161 21,672,327 4,326,691 1,532,643,429
24 Manufacture of basic metals 21,769,144 1,822,206 6,695,998 438,348 261,958,559
25 Manufacture of fabricated metal products, except machinery and equipment 45,691,760 137,409 (4,976,001) 9,696,604 498,377,935
26 Manufacture of computer, electronic and optical products 9,200,000 (800,000) (994,882) (500,000) 29,618,793
27 Manufacture of electrical equipment 8,212,627 (663,758) (819,946) 160,964 126,353,100
28 Manufacture of machinery and equipment n.e.c. 639,202 217,426 (60,988) - 32,928,764
29 Manufacture of motor vehicles, trailers and semi-trailers 7,388,727 (15,351) 521,095 (2,104,398) 64,315,220
30 Manufacture of other transport equipment - 11,059,181 - - 98,044,235
31 Manufacture of furniture 40,970,131 (1,653,754) 348,746 1,937,643 314,808,467
32 Other manufacturing 27,000 (521,383) (1,919,427) - 370,497,484
33 Repair and installation of machinery and equipment 185,451 (277,622) (219,133) 259,232 9,572,424
C Manufacturing 1,765,559,553 69,006,328 178,583,786 24,004,066 15,813,216,637
D Electricity, gas, steam and air conditioning supply 459,704,730 1,000,494 1,077,640 (1,386,077) 1,883,648,329
36 Water collection, treatment and supply 905,822 (123,673) 1,093,547 72,836 473,998,259
38 Waste collection, treatment and disposal activities; materials recovery 1,399,982 119,011 128,035 - 6,186,045
E Water supply; sewerage, waste management and remediation activities 2,305,804 (4,662) 1,221,582 72,836 480,184,304
Total 2,449,511,255 27,667,081 273,964,168 22,617,884 21,877,042,351
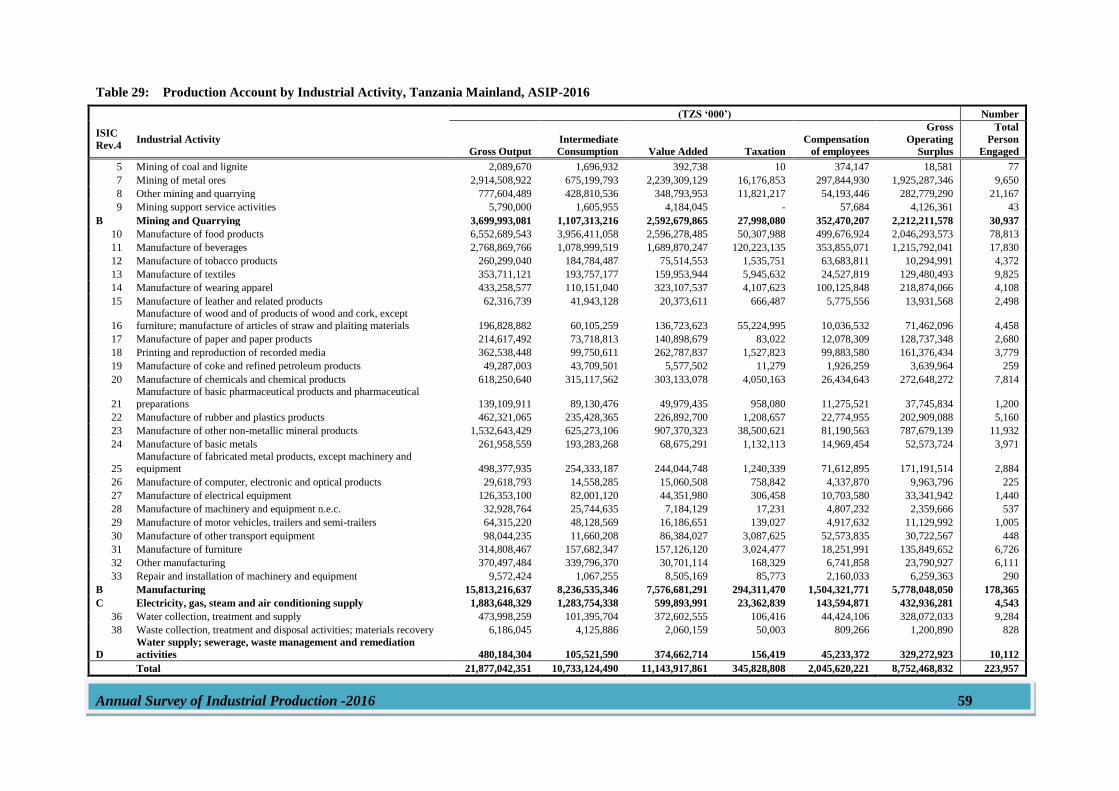
Annual Survey of Industrial Production -2016 59
Table 29: Production Account by Industrial Activity, Tanzania Mainland, ASIP-2016
(TZS ‘000’) Number
ISIC
Rev.4 Industrial Activity
Gross Output
Intermediate
Consumption Value Added Taxation
Compensation
of employees
Gross
Operating
Surplus
Total
Person
Engaged
5 Mining of coal and lignite 2,089,670 1,696,932 392,738 10 374,147 18,581 77
7 Mining of metal ores 2,914,508,922 675,199,793 2,239,309,129 16,176,853 297,844,930 1,925,287,346 9,650
8 Other mining and quarrying 777,604,489 428,810,536 348,793,953 11,821,217 54,193,446 282,779,290 21,167
9 Mining support service activities 5,790,000 1,605,955 4,184,045 - 57,684 4,126,361 43
B Mining and Quarrying 3,699,993,081 1,107,313,216 2,592,679,865 27,998,080 352,470,207 2,212,211,578 30,937
10 Manufacture of food products 6,552,689,543 3,956,411,058 2,596,278,485 50,307,988 499,676,924 2,046,293,573 78,813
11 Manufacture of beverages 2,768,869,766 1,078,999,519 1,689,870,247 120,223,135 353,855,071 1,215,792,041 17,830
12 Manufacture of tobacco products 260,299,040 184,784,487 75,514,553 1,535,751 63,683,811 10,294,991 4,372
13 Manufacture of textiles 353,711,121 193,757,177 159,953,944 5,945,632 24,527,819 129,480,493 9,825
14 Manufacture of wearing apparel 433,258,577 110,151,040 323,107,537 4,107,623 100,125,848 218,874,066 4,108
15 Manufacture of leather and related products 62,316,739 41,943,128 20,373,611 666,487 5,775,556 13,931,568 2,498
16
Manufacture of wood and of products of wood and cork, except
furniture; manufacture of articles of straw and plaiting materials 196,828,882 60,105,259 136,723,623 55,224,995 10,036,532 71,462,096 4,458
17 Manufacture of paper and paper products 214,617,492 73,718,813 140,898,679 83,022 12,078,309 128,737,348 2,680
18 Printing and reproduction of recorded media 362,538,448 99,750,611 262,787,837 1,527,823 99,883,580 161,376,434 3,779
19 Manufacture of coke and refined petroleum products 49,287,003 43,709,501 5,577,502 11,279 1,926,259 3,639,964 259
20 Manufacture of chemicals and chemical products 618,250,640 315,117,562 303,133,078 4,050,163 26,434,643 272,648,272 7,814
21
Manufacture of basic pharmaceutical products and pharmaceutical
preparations 139,109,911 89,130,476 49,979,435 958,080 11,275,521 37,745,834 1,200
22 Manufacture of rubber and plastics products 462,321,065 235,428,365 226,892,700 1,208,657 22,774,955 202,909,088 5,160
23 Manufacture of other non-metallic mineral products 1,532,643,429 625,273,106 907,370,323 38,500,621 81,190,563 787,679,139 11,932
24 Manufacture of basic metals 261,958,559 193,283,268 68,675,291 1,132,113 14,969,454 52,573,724 3,971
25
Manufacture of fabricated metal products, except machinery and
equipment 498,377,935 254,333,187 244,044,748 1,240,339 71,612,895 171,191,514 2,884
26 Manufacture of computer, electronic and optical products 29,618,793 14,558,285 15,060,508 758,842 4,337,870 9,963,796 225
27 Manufacture of electrical equipment 126,353,100 82,001,120 44,351,980 306,458 10,703,580 33,341,942 1,440
28 Manufacture of machinery and equipment n.e.c. 32,928,764 25,744,635 7,184,129 17,231 4,807,232 2,359,666 537
29 Manufacture of motor vehicles, trailers and semi-trailers 64,315,220 48,128,569 16,186,651 139,027 4,917,632 11,129,992 1,005
30 Manufacture of other transport equipment 98,044,235 11,660,208 86,384,027 3,087,625 52,573,835 30,722,567 448
31 Manufacture of furniture 314,808,467 157,682,347 157,126,120 3,024,477 18,251,991 135,849,652 6,726
32 Other manufacturing 370,497,484 339,796,370 30,701,114 168,329 6,741,858 23,790,927 6,111
33 Repair and installation of machinery and equipment 9,572,424 1,067,255 8,505,169 85,773 2,160,033 6,259,363 290
B Manufacturing 15,813,216,637 8,236,535,346 7,576,681,291 294,311,470 1,504,321,771 5,778,048,050 178,365
C Electricity, gas, steam and air conditioning supply 1,883,648,329 1,283,754,338 599,893,991 23,362,839 143,594,871 432,936,281 4,543
36 Water collection, treatment and supply 473,998,259 101,395,704 372,602,555 106,416 44,424,106 328,072,033 9,284
38 Waste collection, treatment and disposal activities; materials recovery 6,186,045 4,125,886 2,060,159 50,003 809,266 1,200,890 828
D
Water supply; sewerage, waste management and remediation
activities 480,184,304 105,521,590 374,662,714 156,419 45,233,372 329,272,923 10,112
Total 21,877,042,351 10,733,124,490 11,143,917,861 345,828,808 2,045,620,221 8,752,468,832 223,957
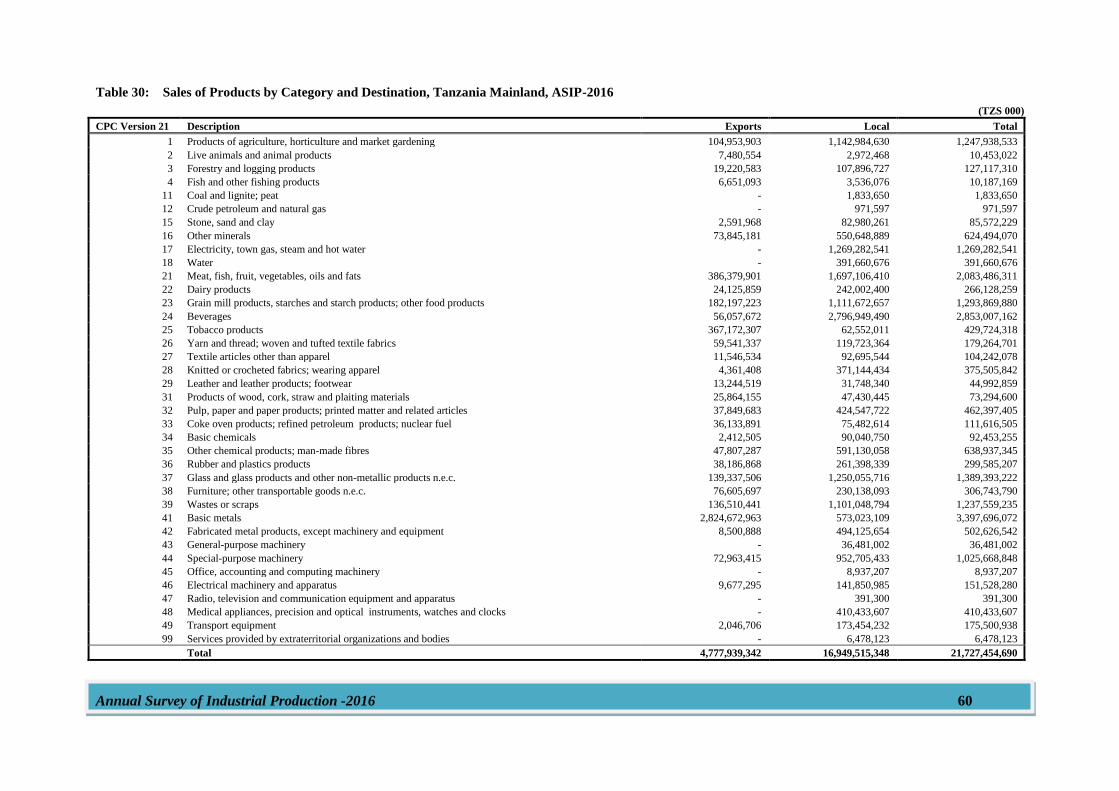
Annual Survey of Industrial Production -2016 60
Table 30: Sales of Products by Category and Destination, Tanzania Mainland, ASIP-2016
(TZS 000) CPC Version 21 Description Exports Local Total
1 Products of agriculture, horticulture and market gardening 104,953,903 1,142,984,630 1,247,938,533
2 Live animals and animal products 7,480,554 2,972,468 10,453,022
3 Forestry and logging products 19,220,583 107,896,727 127,117,310
4 Fish and other fishing products 6,651,093 3,536,076 10,187,169
11 Coal and lignite; peat - 1,833,650 1,833,650
12 Crude petroleum and natural gas - 971,597 971,597
15 Stone, sand and clay 2,591,968 82,980,261 85,572,229
16 Other minerals 73,845,181 550,648,889 624,494,070
17 Electricity, town gas, steam and hot water - 1,269,282,541 1,269,282,541
18 Water - 391,660,676 391,660,676
21 Meat, fish, fruit, vegetables, oils and fats 386,379,901 1,697,106,410 2,083,486,311
22 Dairy products 24,125,859 242,002,400 266,128,259
23 Grain mill products, starches and starch products; other food products 182,197,223 1,111,672,657 1,293,869,880
24 Beverages 56,057,672 2,796,949,490 2,853,007,162
25 Tobacco products 367,172,307 62,552,011 429,724,318
26 Yarn and thread; woven and tufted textile fabrics 59,541,337 119,723,364 179,264,701
27 Textile articles other than apparel 11,546,534 92,695,544 104,242,078
28 Knitted or crocheted fabrics; wearing apparel 4,361,408 371,144,434 375,505,842
29 Leather and leather products; footwear 13,244,519 31,748,340 44,992,859
31 Products of wood, cork, straw and plaiting materials 25,864,155 47,430,445 73,294,600
32 Pulp, paper and paper products; printed matter and related articles 37,849,683 424,547,722 462,397,405
33 Coke oven products; refined petroleum products; nuclear fuel 36,133,891 75,482,614 111,616,505
34 Basic chemicals 2,412,505 90,040,750 92,453,255
35 Other chemical products; man-made fibres 47,807,287 591,130,058 638,937,345
36 Rubber and plastics products 38,186,868 261,398,339 299,585,207
37 Glass and glass products and other non-metallic products n.e.c. 139,337,506 1,250,055,716 1,389,393,222
38 Furniture; other transportable goods n.e.c. 76,605,697 230,138,093 306,743,790
39 Wastes or scraps 136,510,441 1,101,048,794 1,237,559,235
41 Basic metals 2,824,672,963 573,023,109 3,397,696,072
42 Fabricated metal products, except machinery and equipment 8,500,888 494,125,654 502,626,542
43 General-purpose machinery - 36,481,002 36,481,002
44 Special-purpose machinery 72,963,415 952,705,433 1,025,668,848
45 Office, accounting and computing machinery - 8,937,207 8,937,207
46 Electrical machinery and apparatus 9,677,295 141,850,985 151,528,280
47 Radio, television and communication equipment and apparatus - 391,300 391,300
48 Medical appliances, precision and optical instruments, watches and clocks - 410,433,607 410,433,607
49 Transport equipment 2,046,706 173,454,232 175,500,938
99 Services provided by extraterritorial organizations and bodies - 6,478,123 6,478,123
Total 4,777,939,342 16,949,515,348 21,727,454,690
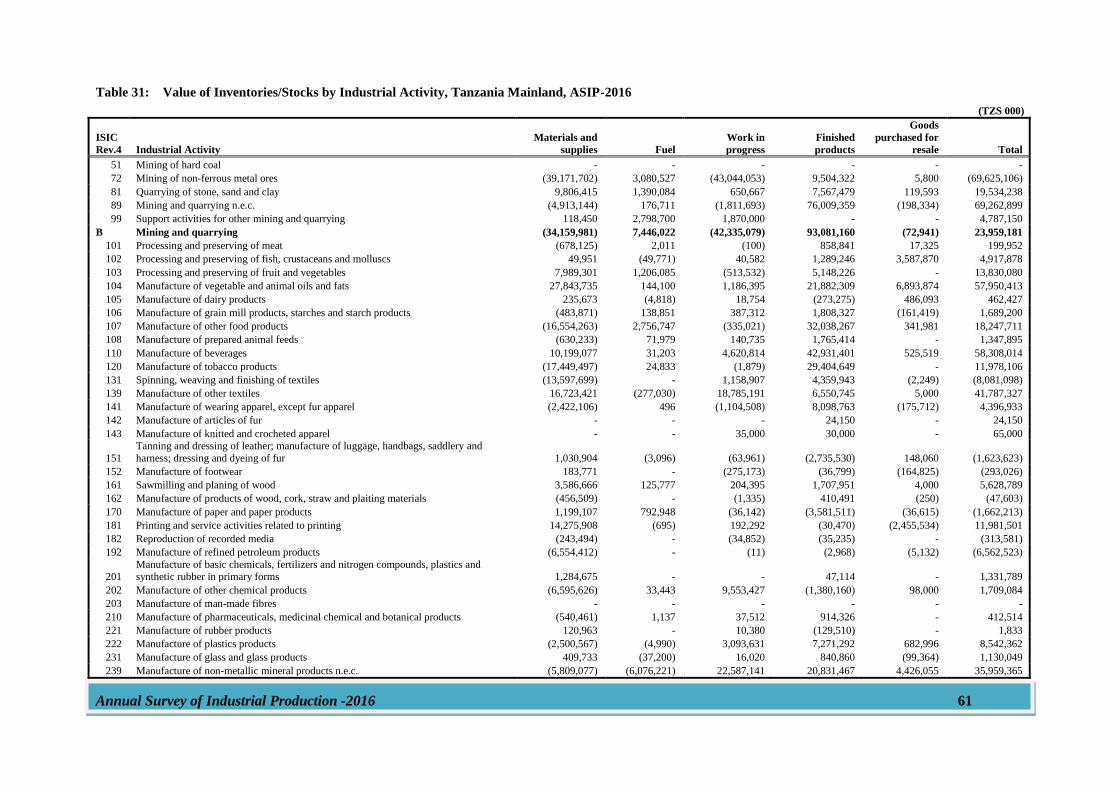
Annual Survey of Industrial Production -2016 61
Table 31: Value of Inventories/Stocks by Industrial Activity, Tanzania Mainland, ASIP-2016
(TZS 000)
ISIC
Rev.4 Industrial Activity
Materials and
supplies Fuel
Work in
progress
Finished
products
Goods
purchased for
resale Total
51 Mining of hard coal - - - - - -
72 Mining of non-ferrous metal ores (39,171,702) 3,080,527 (43,044,053) 9,504,322 5,800 (69,625,106)
81 Quarrying of stone, sand and clay 9,806,415 1,390,084 650,667 7,567,479 119,593 19,534,238
89 Mining and quarrying n.e.c. (4,913,144) 176,711 (1,811,693) 76,009,359 (198,334) 69,262,899
99 Support activities for other mining and quarrying 118,450 2,798,700 1,870,000 - - 4,787,150
B Mining and quarrying (34,159,981) 7,446,022 (42,335,079) 93,081,160 (72,941) 23,959,181
101 Processing and preserving of meat (678,125) 2,011 (100) 858,841 17,325 199,952
102 Processing and preserving of fish, crustaceans and molluscs 49,951 (49,771) 40,582 1,289,246 3,587,870 4,917,878
103 Processing and preserving of fruit and vegetables 7,989,301 1,206,085 (513,532) 5,148,226 - 13,830,080
104 Manufacture of vegetable and animal oils and fats 27,843,735 144,100 1,186,395 21,882,309 6,893,874 57,950,413
105 Manufacture of dairy products 235,673 (4,818) 18,754 (273,275) 486,093 462,427
106 Manufacture of grain mill products, starches and starch products (483,871) 138,851 387,312 1,808,327 (161,419) 1,689,200
107 Manufacture of other food products (16,554,263) 2,756,747 (335,021) 32,038,267 341,981 18,247,711
108 Manufacture of prepared animal feeds (630,233) 71,979 140,735 1,765,414 - 1,347,895
110 Manufacture of beverages 10,199,077 31,203 4,620,814 42,931,401 525,519 58,308,014
120 Manufacture of tobacco products (17,449,497) 24,833 (1,879) 29,404,649 - 11,978,106
131 Spinning, weaving and finishing of textiles (13,597,699) - 1,158,907 4,359,943 (2,249) (8,081,098)
139 Manufacture of other textiles 16,723,421 (277,030) 18,785,191 6,550,745 5,000 41,787,327
141 Manufacture of wearing apparel, except fur apparel (2,422,106) 496 (1,104,508) 8,098,763 (175,712) 4,396,933
142 Manufacture of articles of fur - - - 24,150 - 24,150
143 Manufacture of knitted and crocheted apparel - - 35,000 30,000 - 65,000
151
Tanning and dressing of leather; manufacture of luggage, handbags, saddlery and
harness; dressing and dyeing of fur 1,030,904 (3,096) (63,961) (2,735,530) 148,060 (1,623,623)
152 Manufacture of footwear 183,771 - (275,173) (36,799) (164,825) (293,026)
161 Sawmilling and planing of wood 3,586,666 125,777 204,395 1,707,951 4,000 5,628,789
162 Manufacture of products of wood, cork, straw and plaiting materials (456,509) - (1,335) 410,491 (250) (47,603)
170 Manufacture of paper and paper products 1,199,107 792,948 (36,142) (3,581,511) (36,615) (1,662,213)
181 Printing and service activities related to printing 14,275,908 (695) 192,292 (30,470) (2,455,534) 11,981,501
182 Reproduction of recorded media (243,494) - (34,852) (35,235) - (313,581)
192 Manufacture of refined petroleum products (6,554,412) - (11) (2,968) (5,132) (6,562,523)
201 Manufacture of basic chemicals, fertilizers and nitrogen compounds, plastics and synthetic rubber in primary forms 1,284,675 - - 47,114 - 1,331,789
202 Manufacture of other chemical products (6,595,626) 33,443 9,553,427 (1,380,160) 98,000 1,709,084
203 Manufacture of man-made fibres - - - - - -
210 Manufacture of pharmaceuticals, medicinal chemical and botanical products (540,461) 1,137 37,512 914,326 - 412,514
221 Manufacture of rubber products 120,963 - 10,380 (129,510) - 1,833
222 Manufacture of plastics products (2,500,567) (4,990) 3,093,631 7,271,292 682,996 8,542,362
231 Manufacture of glass and glass products 409,733 (37,200) 16,020 840,860 (99,364) 1,130,049
239 Manufacture of non-metallic mineral products n.e.c. (5,809,077) (6,076,221) 22,587,141 20,831,467 4,426,055 35,959,365
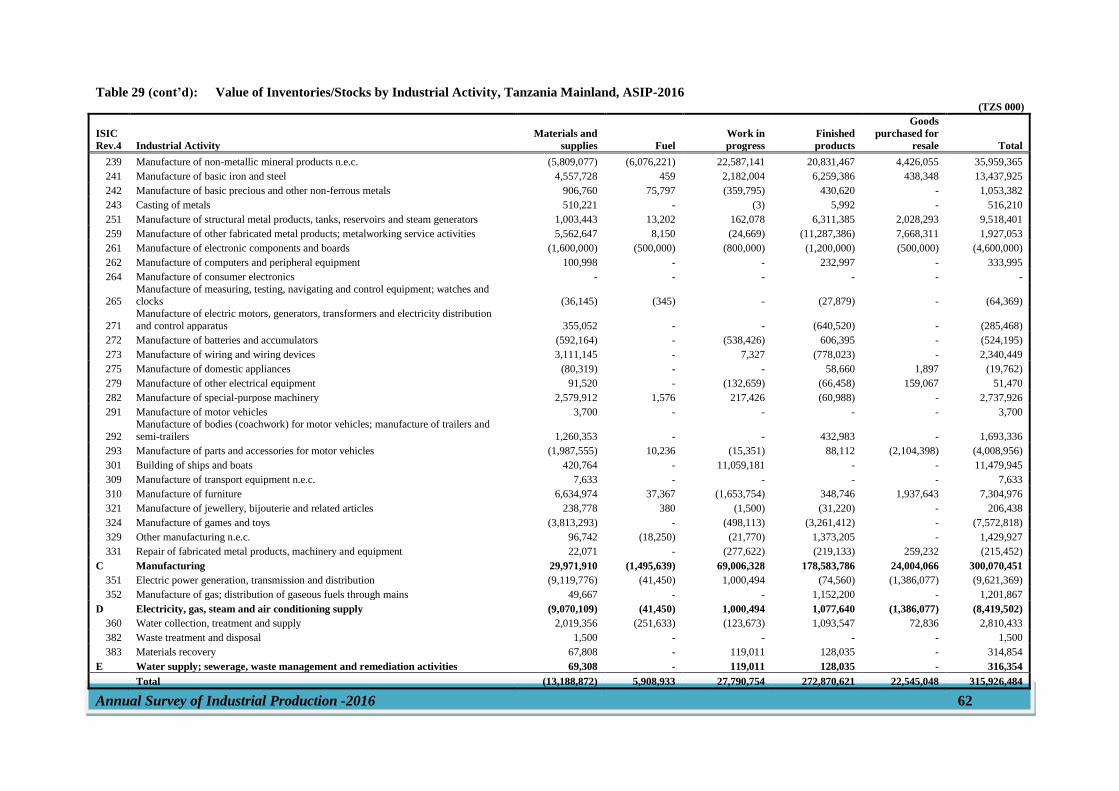
Annual Survey of Industrial Production -2016 62
Table 29 (cont’d): Value of Inventories/Stocks by Industrial Activity, Tanzania Mainland, ASIP-2016 (TZS 000)
ISIC
Rev.4 Industrial Activity
Materials and
supplies Fuel
Work in
progress
Finished
products
Goods
purchased for
resale Total
239 Manufacture of non-metallic mineral products n.e.c. (5,809,077) (6,076,221) 22,587,141 20,831,467 4,426,055 35,959,365
241 Manufacture of basic iron and steel 4,557,728 459 2,182,004 6,259,386 438,348 13,437,925
242 Manufacture of basic precious and other non-ferrous metals 906,760 75,797 (359,795) 430,620 - 1,053,382
243 Casting of metals 510,221 - (3) 5,992 - 516,210
251 Manufacture of structural metal products, tanks, reservoirs and steam generators 1,003,443 13,202 162,078 6,311,385 2,028,293 9,518,401
259 Manufacture of other fabricated metal products; metalworking service activities 5,562,647 8,150 (24,669) (11,287,386) 7,668,311 1,927,053
261 Manufacture of electronic components and boards (1,600,000) (500,000) (800,000) (1,200,000) (500,000) (4,600,000)
262 Manufacture of computers and peripheral equipment 100,998 - - 232,997 - 333,995
264 Manufacture of consumer electronics - - - - - -
265 Manufacture of measuring, testing, navigating and control equipment; watches and clocks (36,145) (345) - (27,879) - (64,369)
271
Manufacture of electric motors, generators, transformers and electricity distribution
and control apparatus 355,052 - - (640,520) - (285,468)
272 Manufacture of batteries and accumulators (592,164) - (538,426) 606,395 - (524,195)
273 Manufacture of wiring and wiring devices 3,111,145 - 7,327 (778,023) - 2,340,449
275 Manufacture of domestic appliances (80,319) - - 58,660 1,897 (19,762)
279 Manufacture of other electrical equipment 91,520 - (132,659) (66,458) 159,067 51,470
282 Manufacture of special-purpose machinery 2,579,912 1,576 217,426 (60,988) - 2,737,926
291 Manufacture of motor vehicles 3,700 - - - - 3,700
292
Manufacture of bodies (coachwork) for motor vehicles; manufacture of trailers and
semi-trailers 1,260,353 - - 432,983 - 1,693,336
293 Manufacture of parts and accessories for motor vehicles (1,987,555) 10,236 (15,351) 88,112 (2,104,398) (4,008,956)
301 Building of ships and boats 420,764 - 11,059,181 - - 11,479,945
309 Manufacture of transport equipment n.e.c. 7,633 - - - - 7,633
310 Manufacture of furniture 6,634,974 37,367 (1,653,754) 348,746 1,937,643 7,304,976
321 Manufacture of jewellery, bijouterie and related articles 238,778 380 (1,500) (31,220) - 206,438
324 Manufacture of games and toys (3,813,293) - (498,113) (3,261,412) - (7,572,818)
329 Other manufacturing n.e.c. 96,742 (18,250) (21,770) 1,373,205 - 1,429,927
331 Repair of fabricated metal products, machinery and equipment 22,071 - (277,622) (219,133) 259,232 (215,452)
C Manufacturing 29,971,910 (1,495,639) 69,006,328 178,583,786 24,004,066 300,070,451
351 Electric power generation, transmission and distribution (9,119,776) (41,450) 1,000,494 (74,560) (1,386,077) (9,621,369)
352 Manufacture of gas; distribution of gaseous fuels through mains 49,667 - - 1,152,200 - 1,201,867
D Electricity, gas, steam and air conditioning supply (9,070,109) (41,450) 1,000,494 1,077,640 (1,386,077) (8,419,502)
360 Water collection, treatment and supply 2,019,356 (251,633) (123,673) 1,093,547 72,836 2,810,433
382 Waste treatment and disposal 1,500 - - - - 1,500
383 Materials recovery 67,808 - 119,011 128,035 - 314,854
E Water supply; sewerage, waste management and remediation activities 69,308 - 119,011 128,035 - 316,354
Total (13,188,872) 5,908,933 27,790,754 272,870,621 22,545,048 315,926,484
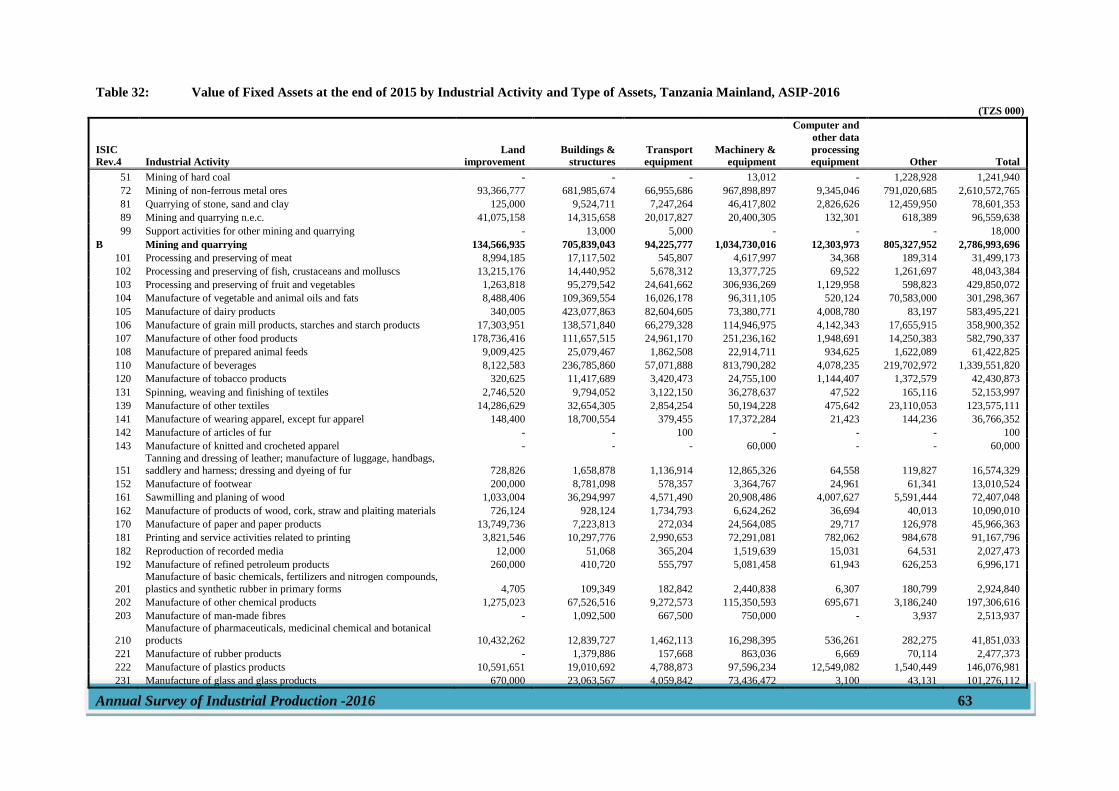
Annual Survey of Industrial Production -2016 63
Table 32: Value of Fixed Assets at the end of 2015 by Industrial Activity and Type of Assets, Tanzania Mainland, ASIP-2016
(TZS 000)
ISIC
Rev.4 Industrial Activity
Land
improvement
Buildings &
structures
Transport
equipment
Machinery &
equipment
Computer and
other data
processing
equipment Other Total
51 Mining of hard coal - - - 13,012 - 1,228,928 1,241,940
72 Mining of non-ferrous metal ores 93,366,777 681,985,674 66,955,686 967,898,897 9,345,046 791,020,685 2,610,572,765
81 Quarrying of stone, sand and clay 125,000 9,524,711 7,247,264 46,417,802 2,826,626 12,459,950 78,601,353
89 Mining and quarrying n.e.c. 41,075,158 14,315,658 20,017,827 20,400,305 132,301 618,389 96,559,638
99 Support activities for other mining and quarrying - 13,000 5,000 - - - 18,000
B Mining and quarrying 134,566,935 705,839,043 94,225,777 1,034,730,016 12,303,973 805,327,952 2,786,993,696
101 Processing and preserving of meat 8,994,185 17,117,502 545,807 4,617,997 34,368 189,314 31,499,173
102 Processing and preserving of fish, crustaceans and molluscs 13,215,176 14,440,952 5,678,312 13,377,725 69,522 1,261,697 48,043,384
103 Processing and preserving of fruit and vegetables 1,263,818 95,279,542 24,641,662 306,936,269 1,129,958 598,823 429,850,072
104 Manufacture of vegetable and animal oils and fats 8,488,406 109,369,554 16,026,178 96,311,105 520,124 70,583,000 301,298,367
105 Manufacture of dairy products 340,005 423,077,863 82,604,605 73,380,771 4,008,780 83,197 583,495,221
106 Manufacture of grain mill products, starches and starch products 17,303,951 138,571,840 66,279,328 114,946,975 4,142,343 17,655,915 358,900,352
107 Manufacture of other food products 178,736,416 111,657,515 24,961,170 251,236,162 1,948,691 14,250,383 582,790,337
108 Manufacture of prepared animal feeds 9,009,425 25,079,467 1,862,508 22,914,711 934,625 1,622,089 61,422,825
110 Manufacture of beverages 8,122,583 236,785,860 57,071,888 813,790,282 4,078,235 219,702,972 1,339,551,820
120 Manufacture of tobacco products 320,625 11,417,689 3,420,473 24,755,100 1,144,407 1,372,579 42,430,873
131 Spinning, weaving and finishing of textiles 2,746,520 9,794,052 3,122,150 36,278,637 47,522 165,116 52,153,997
139 Manufacture of other textiles 14,286,629 32,654,305 2,854,254 50,194,228 475,642 23,110,053 123,575,111
141 Manufacture of wearing apparel, except fur apparel 148,400 18,700,554 379,455 17,372,284 21,423 144,236 36,766,352
142 Manufacture of articles of fur - - 100 - - - 100
143 Manufacture of knitted and crocheted apparel - - - 60,000 - - 60,000
151
Tanning and dressing of leather; manufacture of luggage, handbags,
saddlery and harness; dressing and dyeing of fur 728,826 1,658,878 1,136,914 12,865,326 64,558 119,827 16,574,329
152 Manufacture of footwear 200,000 8,781,098 578,357 3,364,767 24,961 61,341 13,010,524
161 Sawmilling and planing of wood 1,033,004 36,294,997 4,571,490 20,908,486 4,007,627 5,591,444 72,407,048
162 Manufacture of products of wood, cork, straw and plaiting materials 726,124 928,124 1,734,793 6,624,262 36,694 40,013 10,090,010
170 Manufacture of paper and paper products 13,749,736 7,223,813 272,034 24,564,085 29,717 126,978 45,966,363
181 Printing and service activities related to printing 3,821,546 10,297,776 2,990,653 72,291,081 782,062 984,678 91,167,796
182 Reproduction of recorded media 12,000 51,068 365,204 1,519,639 15,031 64,531 2,027,473
192 Manufacture of refined petroleum products 260,000 410,720 555,797 5,081,458 61,943 626,253 6,996,171
201
Manufacture of basic chemicals, fertilizers and nitrogen compounds,
plastics and synthetic rubber in primary forms 4,705 109,349 182,842 2,440,838 6,307 180,799 2,924,840
202 Manufacture of other chemical products 1,275,023 67,526,516 9,272,573 115,350,593 695,671 3,186,240 197,306,616
203 Manufacture of man-made fibres - 1,092,500 667,500 750,000 - 3,937 2,513,937
210
Manufacture of pharmaceuticals, medicinal chemical and botanical
products 10,432,262 12,839,727 1,462,113 16,298,395 536,261 282,275 41,851,033
221 Manufacture of rubber products - 1,379,886 157,668 863,036 6,669 70,114 2,477,373
222 Manufacture of plastics products 10,591,651 19,010,692 4,788,873 97,596,234 12,549,082 1,540,449 146,076,981
231 Manufacture of glass and glass products 670,000 23,063,567 4,059,842 73,436,472 3,100 43,131 101,276,112
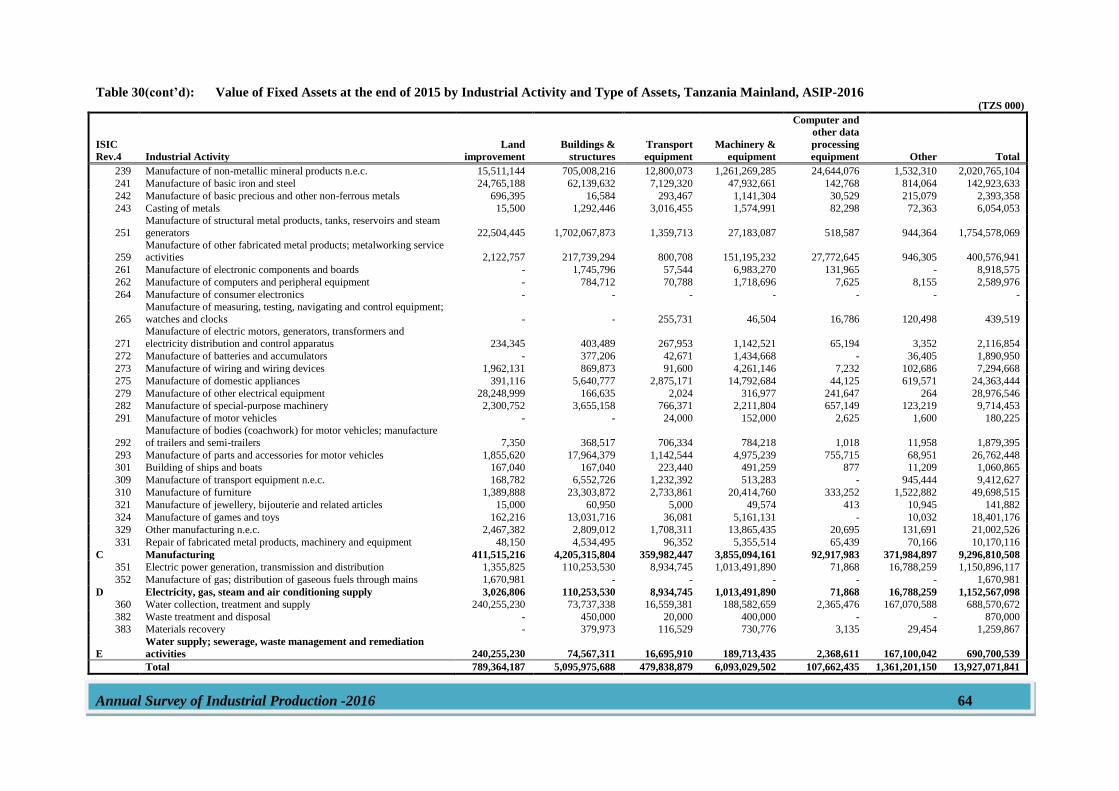
Annual Survey of Industrial Production -2016 64
Table 30(cont’d): Value of Fixed Assets at the end of 2015 by Industrial Activity and Type of Assets, Tanzania Mainland, ASIP-2016 (TZS 000)
ISIC
Rev.4 Industrial Activity
Land
improvement
Buildings &
structures
Transport
equipment
Machinery &
equipment
Computer and
other data
processing
equipment Other Total
239 Manufacture of non-metallic mineral products n.e.c. 15,511,144 705,008,216 12,800,073 1,261,269,285 24,644,076 1,532,310 2,020,765,104
241 Manufacture of basic iron and steel 24,765,188 62,139,632 7,129,320 47,932,661 142,768 814,064 142,923,633
242 Manufacture of basic precious and other non-ferrous metals 696,395 16,584 293,467 1,141,304 30,529 215,079 2,393,358
243 Casting of metals 15,500 1,292,446 3,016,455 1,574,991 82,298 72,363 6,054,053
251
Manufacture of structural metal products, tanks, reservoirs and steam
generators 22,504,445 1,702,067,873 1,359,713 27,183,087 518,587 944,364 1,754,578,069
259 Manufacture of other fabricated metal products; metalworking service activities 2,122,757 217,739,294 800,708 151,195,232 27,772,645 946,305 400,576,941
261 Manufacture of electronic components and boards - 1,745,796 57,544 6,983,270 131,965 - 8,918,575
262 Manufacture of computers and peripheral equipment - 784,712 70,788 1,718,696 7,625 8,155 2,589,976
264 Manufacture of consumer electronics - - - - - - -
265
Manufacture of measuring, testing, navigating and control equipment;
watches and clocks - - 255,731 46,504 16,786 120,498 439,519
271
Manufacture of electric motors, generators, transformers and
electricity distribution and control apparatus 234,345 403,489 267,953 1,142,521 65,194 3,352 2,116,854
272 Manufacture of batteries and accumulators - 377,206 42,671 1,434,668 - 36,405 1,890,950
273 Manufacture of wiring and wiring devices 1,962,131 869,873 91,600 4,261,146 7,232 102,686 7,294,668
275 Manufacture of domestic appliances 391,116 5,640,777 2,875,171 14,792,684 44,125 619,571 24,363,444
279 Manufacture of other electrical equipment 28,248,999 166,635 2,024 316,977 241,647 264 28,976,546
282 Manufacture of special-purpose machinery 2,300,752 3,655,158 766,371 2,211,804 657,149 123,219 9,714,453
291 Manufacture of motor vehicles - - 24,000 152,000 2,625 1,600 180,225
292
Manufacture of bodies (coachwork) for motor vehicles; manufacture
of trailers and semi-trailers 7,350 368,517 706,334 784,218 1,018 11,958 1,879,395
293 Manufacture of parts and accessories for motor vehicles 1,855,620 17,964,379 1,142,544 4,975,239 755,715 68,951 26,762,448
301 Building of ships and boats 167,040 167,040 223,440 491,259 877 11,209 1,060,865
309 Manufacture of transport equipment n.e.c. 168,782 6,552,726 1,232,392 513,283 - 945,444 9,412,627
310 Manufacture of furniture 1,389,888 23,303,872 2,733,861 20,414,760 333,252 1,522,882 49,698,515
321 Manufacture of jewellery, bijouterie and related articles 15,000 60,950 5,000 49,574 413 10,945 141,882
324 Manufacture of games and toys 162,216 13,031,716 36,081 5,161,131 - 10,032 18,401,176
329 Other manufacturing n.e.c. 2,467,382 2,809,012 1,708,311 13,865,435 20,695 131,691 21,002,526
331 Repair of fabricated metal products, machinery and equipment 48,150 4,534,495 96,352 5,355,514 65,439 70,166 10,170,116
C Manufacturing 411,515,216 4,205,315,804 359,982,447 3,855,094,161 92,917,983 371,984,897 9,296,810,508
351 Electric power generation, transmission and distribution 1,355,825 110,253,530 8,934,745 1,013,491,890 71,868 16,788,259 1,150,896,117
352 Manufacture of gas; distribution of gaseous fuels through mains 1,670,981 - - - - - 1,670,981
D Electricity, gas, steam and air conditioning supply 3,026,806 110,253,530 8,934,745 1,013,491,890 71,868 16,788,259 1,152,567,098
360 Water collection, treatment and supply 240,255,230 73,737,338 16,559,381 188,582,659 2,365,476 167,070,588 688,570,672
382 Waste treatment and disposal - 450,000 20,000 400,000 - - 870,000
383 Materials recovery - 379,973 116,529 730,776 3,135 29,454 1,259,867
E
Water supply; sewerage, waste management and remediation
activities 240,255,230 74,567,311 16,695,910 189,713,435 2,368,611 167,100,042 690,700,539
Total 789,364,187 5,095,975,688 479,838,879 6,093,029,502 107,662,435 1,361,201,150 13,927,071,841
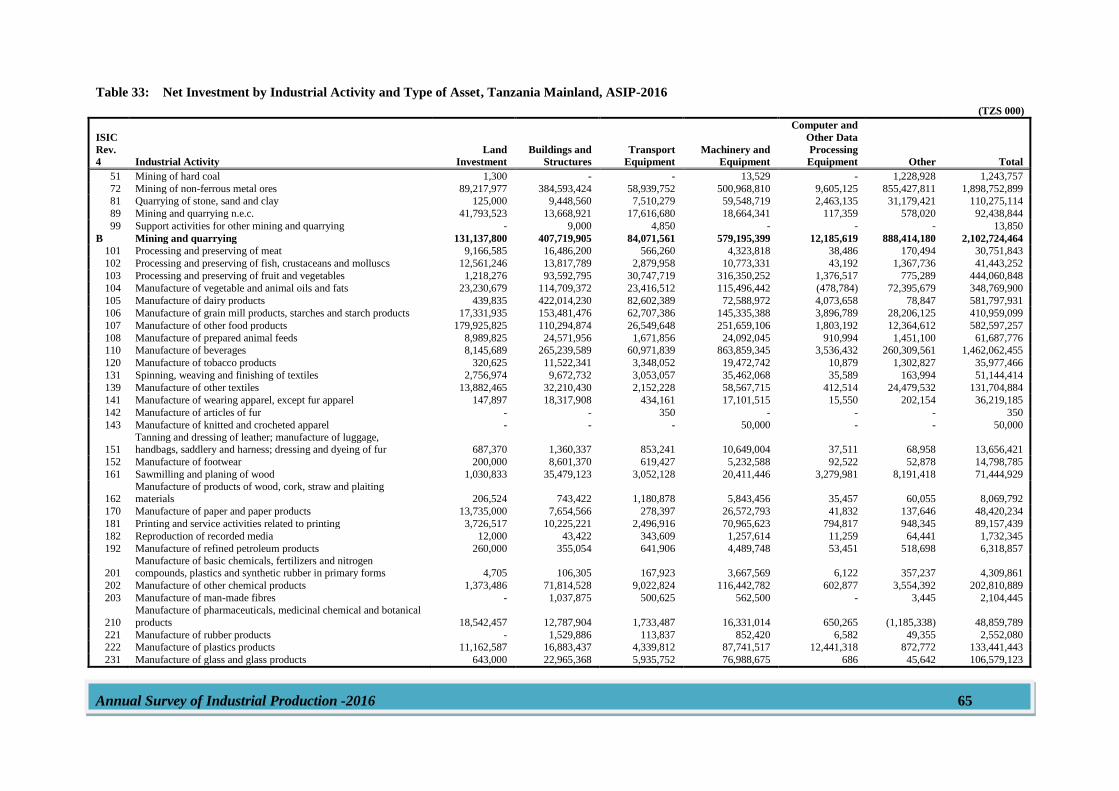
Annual Survey of Industrial Production -2016 65
Table 33: Net Investment by Industrial Activity and Type of Asset, Tanzania Mainland, ASIP-2016
(TZS 000)
ISIC
Rev.
4 Industrial Activity
Land
Investment
Buildings and
Structures
Transport
Equipment
Machinery and
Equipment
Computer and
Other Data
Processing
Equipment Other Total
51 Mining of hard coal 1,300 - - 13,529 - 1,228,928 1,243,757
72 Mining of non-ferrous metal ores 89,217,977 384,593,424 58,939,752 500,968,810 9,605,125 855,427,811 1,898,752,899
81 Quarrying of stone, sand and clay 125,000 9,448,560 7,510,279 59,548,719 2,463,135 31,179,421 110,275,114
89 Mining and quarrying n.e.c. 41,793,523 13,668,921 17,616,680 18,664,341 117,359 578,020 92,438,844
99 Support activities for other mining and quarrying - 9,000 4,850 - - - 13,850
B Mining and quarrying 131,137,800 407,719,905 84,071,561 579,195,399 12,185,619 888,414,180 2,102,724,464
101 Processing and preserving of meat 9,166,585 16,486,200 566,260 4,323,818 38,486 170,494 30,751,843
102 Processing and preserving of fish, crustaceans and molluscs 12,561,246 13,817,789 2,879,958 10,773,331 43,192 1,367,736 41,443,252
103 Processing and preserving of fruit and vegetables 1,218,276 93,592,795 30,747,719 316,350,252 1,376,517 775,289 444,060,848
104 Manufacture of vegetable and animal oils and fats 23,230,679 114,709,372 23,416,512 115,496,442 (478,784) 72,395,679 348,769,900
105 Manufacture of dairy products 439,835 422,014,230 82,602,389 72,588,972 4,073,658 78,847 581,797,931
106 Manufacture of grain mill products, starches and starch products 17,331,935 153,481,476 62,707,386 145,335,388 3,896,789 28,206,125 410,959,099
107 Manufacture of other food products 179,925,825 110,294,874 26,549,648 251,659,106 1,803,192 12,364,612 582,597,257
108 Manufacture of prepared animal feeds 8,989,825 24,571,956 1,671,856 24,092,045 910,994 1,451,100 61,687,776
110 Manufacture of beverages 8,145,689 265,239,589 60,971,839 863,859,345 3,536,432 260,309,561 1,462,062,455
120 Manufacture of tobacco products 320,625 11,522,341 3,348,052 19,472,742 10,879 1,302,827 35,977,466
131 Spinning, weaving and finishing of textiles 2,756,974 9,672,732 3,053,057 35,462,068 35,589 163,994 51,144,414
139 Manufacture of other textiles 13,882,465 32,210,430 2,152,228 58,567,715 412,514 24,479,532 131,704,884
141 Manufacture of wearing apparel, except fur apparel 147,897 18,317,908 434,161 17,101,515 15,550 202,154 36,219,185
142 Manufacture of articles of fur - - 350 - - - 350
143 Manufacture of knitted and crocheted apparel - - - 50,000 - - 50,000
151 Tanning and dressing of leather; manufacture of luggage, handbags, saddlery and harness; dressing and dyeing of fur 687,370 1,360,337 853,241 10,649,004 37,511 68,958 13,656,421
152 Manufacture of footwear 200,000 8,601,370 619,427 5,232,588 92,522 52,878 14,798,785
161 Sawmilling and planing of wood 1,030,833 35,479,123 3,052,128 20,411,446 3,279,981 8,191,418 71,444,929
162 Manufacture of products of wood, cork, straw and plaiting materials 206,524 743,422 1,180,878 5,843,456 35,457 60,055 8,069,792
170 Manufacture of paper and paper products 13,735,000 7,654,566 278,397 26,572,793 41,832 137,646 48,420,234
181 Printing and service activities related to printing 3,726,517 10,225,221 2,496,916 70,965,623 794,817 948,345 89,157,439
182 Reproduction of recorded media 12,000 43,422 343,609 1,257,614 11,259 64,441 1,732,345
192 Manufacture of refined petroleum products 260,000 355,054 641,906 4,489,748 53,451 518,698 6,318,857
201 Manufacture of basic chemicals, fertilizers and nitrogen compounds, plastics and synthetic rubber in primary forms 4,705 106,305 167,923 3,667,569 6,122 357,237 4,309,861
202 Manufacture of other chemical products 1,373,486 71,814,528 9,022,824 116,442,782 602,877 3,554,392 202,810,889
203 Manufacture of man-made fibres - 1,037,875 500,625 562,500 - 3,445 2,104,445
210
Manufacture of pharmaceuticals, medicinal chemical and botanical
products 18,542,457 12,787,904 1,733,487 16,331,014 650,265 (1,185,338) 48,859,789
221 Manufacture of rubber products - 1,529,886 113,837 852,420 6,582 49,355 2,552,080
222 Manufacture of plastics products 11,162,587 16,883,437 4,339,812 87,741,517 12,441,318 872,772 133,441,443
231 Manufacture of glass and glass products 643,000 22,965,368 5,935,752 76,988,675 686 45,642 106,579,123
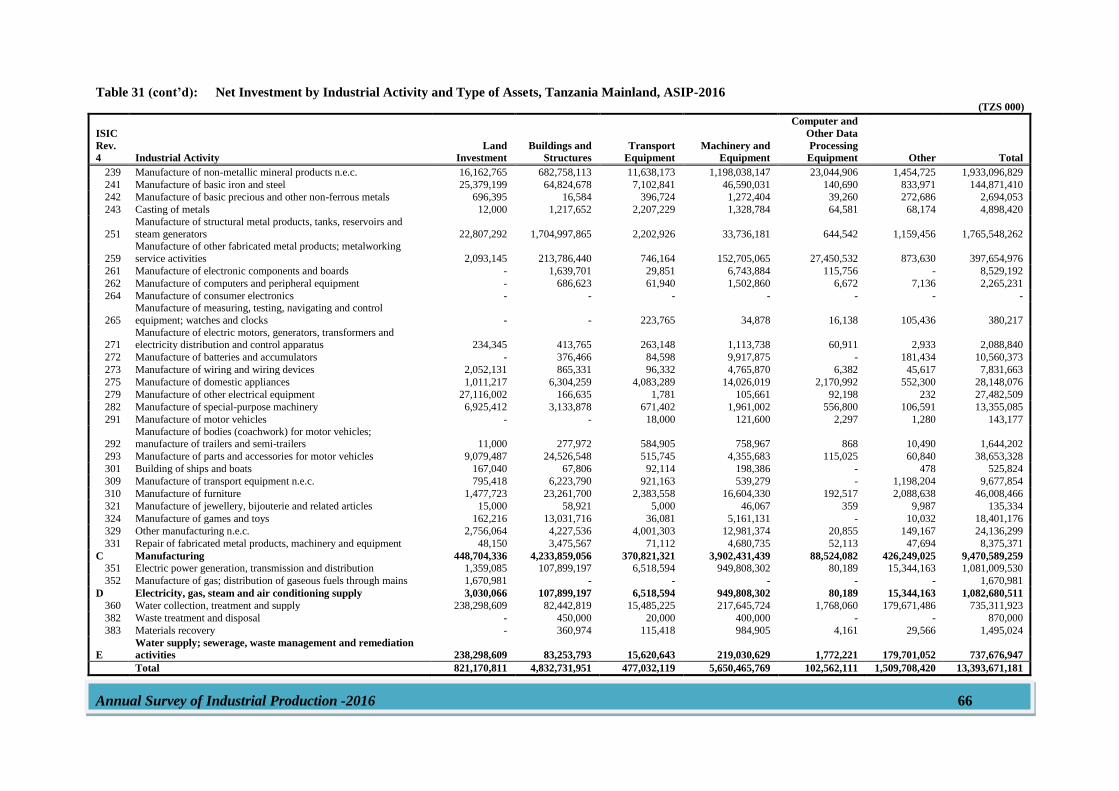
Annual Survey of Industrial Production -2016 66
Table 31 (cont’d): Net Investment by Industrial Activity and Type of Assets, Tanzania Mainland, ASIP-2016 (TZS 000)
ISIC
Rev.
4 Industrial Activity
Land
Investment
Buildings and
Structures
Transport
Equipment
Machinery and
Equipment
Computer and
Other Data
Processing
Equipment Other Total
239 Manufacture of non-metallic mineral products n.e.c. 16,162,765 682,758,113 11,638,173 1,198,038,147 23,044,906 1,454,725 1,933,096,829
241 Manufacture of basic iron and steel 25,379,199 64,824,678 7,102,841 46,590,031 140,690 833,971 144,871,410
242 Manufacture of basic precious and other non-ferrous metals 696,395 16,584 396,724 1,272,404 39,260 272,686 2,694,053
243 Casting of metals 12,000 1,217,652 2,207,229 1,328,784 64,581 68,174 4,898,420
251
Manufacture of structural metal products, tanks, reservoirs and
steam generators 22,807,292 1,704,997,865 2,202,926 33,736,181 644,542 1,159,456 1,765,548,262
259
Manufacture of other fabricated metal products; metalworking
service activities 2,093,145 213,786,440 746,164 152,705,065 27,450,532 873,630 397,654,976
261 Manufacture of electronic components and boards - 1,639,701 29,851 6,743,884 115,756 - 8,529,192
262 Manufacture of computers and peripheral equipment - 686,623 61,940 1,502,860 6,672 7,136 2,265,231
264 Manufacture of consumer electronics - - - - - - -
265
Manufacture of measuring, testing, navigating and control
equipment; watches and clocks - - 223,765 34,878 16,138 105,436 380,217
271 Manufacture of electric motors, generators, transformers and electricity distribution and control apparatus 234,345 413,765 263,148 1,113,738 60,911 2,933 2,088,840
272 Manufacture of batteries and accumulators - 376,466 84,598 9,917,875 - 181,434 10,560,373
273 Manufacture of wiring and wiring devices 2,052,131 865,331 96,332 4,765,870 6,382 45,617 7,831,663
275 Manufacture of domestic appliances 1,011,217 6,304,259 4,083,289 14,026,019 2,170,992 552,300 28,148,076
279 Manufacture of other electrical equipment 27,116,002 166,635 1,781 105,661 92,198 232 27,482,509
282 Manufacture of special-purpose machinery 6,925,412 3,133,878 671,402 1,961,002 556,800 106,591 13,355,085
291 Manufacture of motor vehicles - - 18,000 121,600 2,297 1,280 143,177
292 Manufacture of bodies (coachwork) for motor vehicles; manufacture of trailers and semi-trailers 11,000 277,972 584,905 758,967 868 10,490 1,644,202
293 Manufacture of parts and accessories for motor vehicles 9,079,487 24,526,548 515,745 4,355,683 115,025 60,840 38,653,328
301 Building of ships and boats 167,040 67,806 92,114 198,386 - 478 525,824
309 Manufacture of transport equipment n.e.c. 795,418 6,223,790 921,163 539,279 - 1,198,204 9,677,854
310 Manufacture of furniture 1,477,723 23,261,700 2,383,558 16,604,330 192,517 2,088,638 46,008,466
321 Manufacture of jewellery, bijouterie and related articles 15,000 58,921 5,000 46,067 359 9,987 135,334
324 Manufacture of games and toys 162,216 13,031,716 36,081 5,161,131 - 10,032 18,401,176
329 Other manufacturing n.e.c. 2,756,064 4,227,536 4,001,303 12,981,374 20,855 149,167 24,136,299
331 Repair of fabricated metal products, machinery and equipment 48,150 3,475,567 71,112 4,680,735 52,113 47,694 8,375,371
C Manufacturing 448,704,336 4,233,859,056 370,821,321 3,902,431,439 88,524,082 426,249,025 9,470,589,259
351 Electric power generation, transmission and distribution 1,359,085 107,899,197 6,518,594 949,808,302 80,189 15,344,163 1,081,009,530
352 Manufacture of gas; distribution of gaseous fuels through mains 1,670,981 - - - - - 1,670,981
D Electricity, gas, steam and air conditioning supply 3,030,066 107,899,197 6,518,594 949,808,302 80,189 15,344,163 1,082,680,511
360 Water collection, treatment and supply 238,298,609 82,442,819 15,485,225 217,645,724 1,768,060 179,671,486 735,311,923
382 Waste treatment and disposal - 450,000 20,000 400,000 - - 870,000
383 Materials recovery - 360,974 115,418 984,905 4,161 29,566 1,495,024
E
Water supply; sewerage, waste management and remediation
activities 238,298,609 83,253,793 15,620,643 219,030,629 1,772,221 179,701,052 737,676,947
Total 821,170,811 4,832,731,951 477,032,119 5,650,465,769 102,562,111 1,509,708,420 13,393,671,181
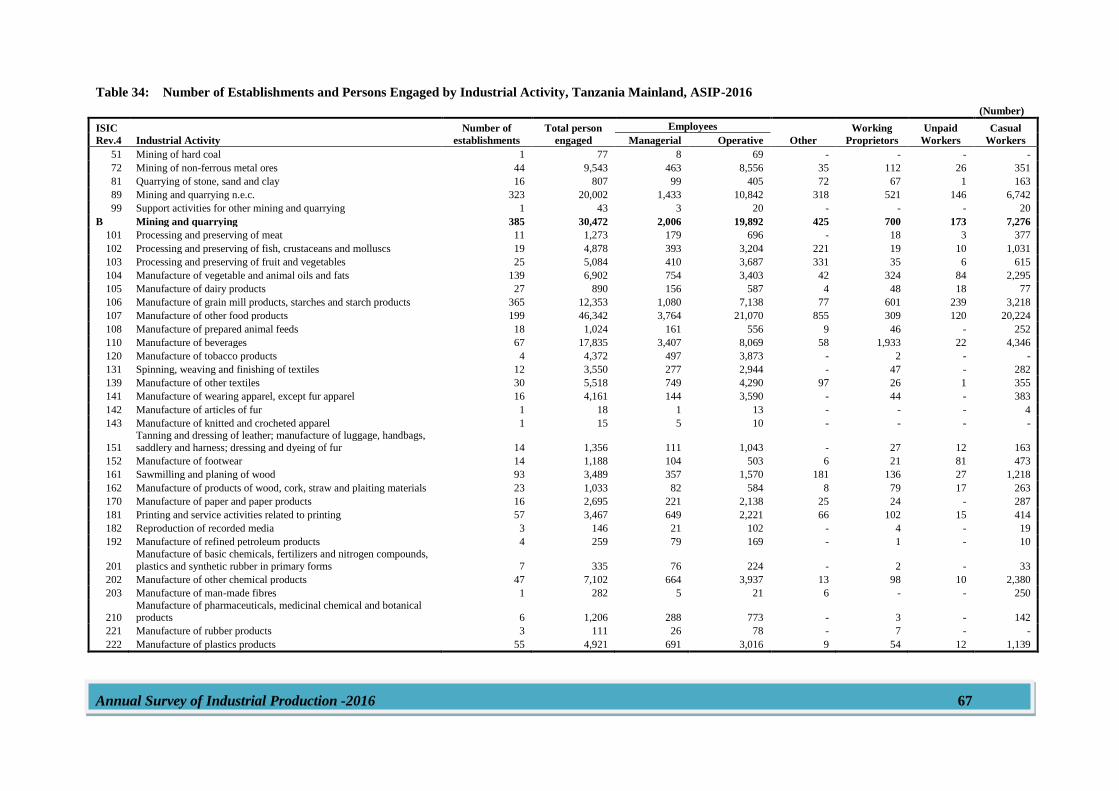
Annual Survey of Industrial Production -2016 67
Table 34: Number of Establishments and Persons Engaged by Industrial Activity, Tanzania Mainland, ASIP-2016
(Number) ISIC
Rev.4 Industrial Activity
Number of
establishments
Total person
engaged
Employees
Other
Working
Proprietors
Unpaid
Workers
Casual
Workers Managerial Operative
51 Mining of hard coal 1 77 8 69 - - - -
72 Mining of non-ferrous metal ores 44 9,543 463 8,556 35 112 26 351
81 Quarrying of stone, sand and clay 16 807 99 405 72 67 1 163
89 Mining and quarrying n.e.c. 323 20,002 1,433 10,842 318 521 146 6,742
99 Support activities for other mining and quarrying 1 43 3 20 - - - 20
B Mining and quarrying 385 30,472 2,006 19,892 425 700 173 7,276
101 Processing and preserving of meat 11 1,273 179 696 - 18 3 377
102 Processing and preserving of fish, crustaceans and molluscs 19 4,878 393 3,204 221 19 10 1,031
103 Processing and preserving of fruit and vegetables 25 5,084 410 3,687 331 35 6 615
104 Manufacture of vegetable and animal oils and fats 139 6,902 754 3,403 42 324 84 2,295
105 Manufacture of dairy products 27 890 156 587 4 48 18 77
106 Manufacture of grain mill products, starches and starch products 365 12,353 1,080 7,138 77 601 239 3,218
107 Manufacture of other food products 199 46,342 3,764 21,070 855 309 120 20,224
108 Manufacture of prepared animal feeds 18 1,024 161 556 9 46 - 252
110 Manufacture of beverages 67 17,835 3,407 8,069 58 1,933 22 4,346
120 Manufacture of tobacco products 4 4,372 497 3,873 - 2 - -
131 Spinning, weaving and finishing of textiles 12 3,550 277 2,944 - 47 - 282
139 Manufacture of other textiles 30 5,518 749 4,290 97 26 1 355
141 Manufacture of wearing apparel, except fur apparel 16 4,161 144 3,590 - 44 - 383
142 Manufacture of articles of fur 1 18 1 13 - - - 4
143 Manufacture of knitted and crocheted apparel 1 15 5 10 - - - -
151
Tanning and dressing of leather; manufacture of luggage, handbags,
saddlery and harness; dressing and dyeing of fur 14 1,356 111 1,043 - 27 12 163
152 Manufacture of footwear 14 1,188 104 503 6 21 81 473
161 Sawmilling and planing of wood 93 3,489 357 1,570 181 136 27 1,218
162 Manufacture of products of wood, cork, straw and plaiting materials 23 1,033 82 584 8 79 17 263
170 Manufacture of paper and paper products 16 2,695 221 2,138 25 24 - 287
181 Printing and service activities related to printing 57 3,467 649 2,221 66 102 15 414
182 Reproduction of recorded media 3 146 21 102 - 4 - 19
192 Manufacture of refined petroleum products 4 259 79 169 - 1 - 10
201
Manufacture of basic chemicals, fertilizers and nitrogen compounds,
plastics and synthetic rubber in primary forms 7 335 76 224 - 2 - 33
202 Manufacture of other chemical products 47 7,102 664 3,937 13 98 10 2,380
203 Manufacture of man-made fibres 1 282 5 21 6 - - 250
210 Manufacture of pharmaceuticals, medicinal chemical and botanical products 6 1,206 288 773 - 3 - 142
221 Manufacture of rubber products 3 111 26 78 - 7 - -
222 Manufacture of plastics products 55 4,921 691 3,016 9 54 12 1,139
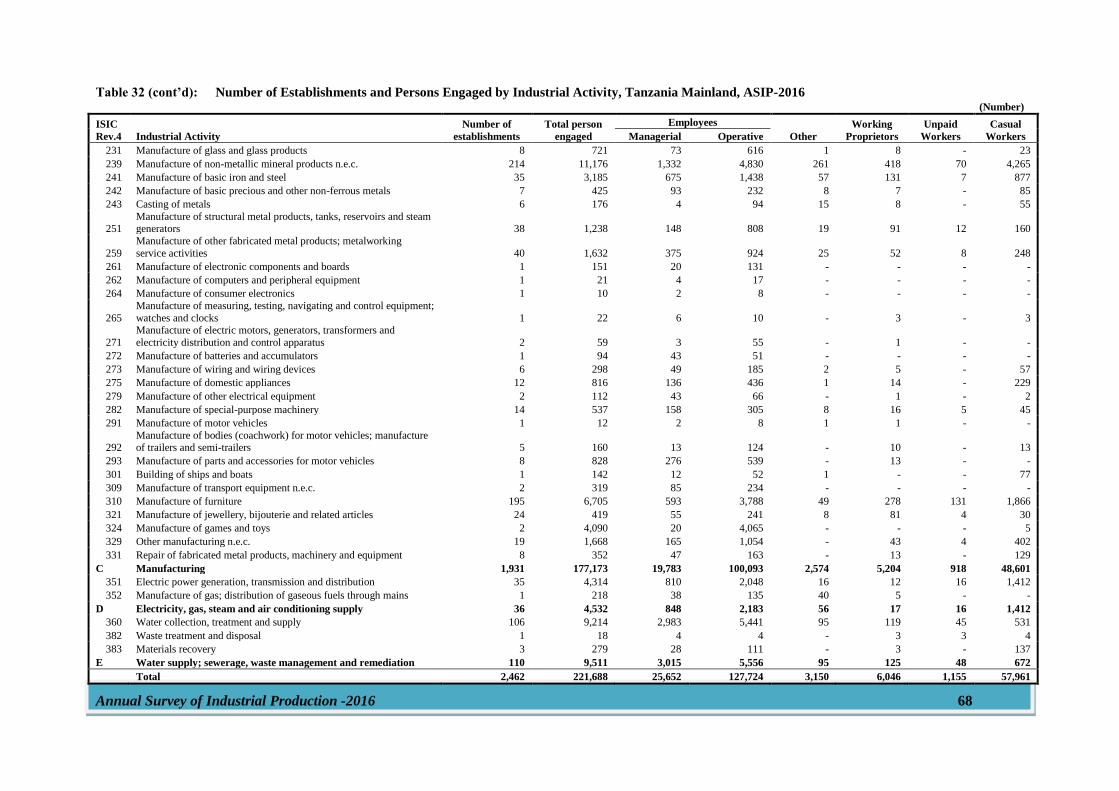
Annual Survey of Industrial Production -2016 68
Table 32 (cont’d): Number of Establishments and Persons Engaged by Industrial Activity, Tanzania Mainland, ASIP-2016 (Number)
ISIC
Rev.4 Industrial Activity
Number of
establishments
Total person
engaged
Employees
Other
Working
Proprietors
Unpaid
Workers
Casual
Workers Managerial Operative
231 Manufacture of glass and glass products 8 721 73 616 1 8 - 23
239 Manufacture of non-metallic mineral products n.e.c. 214 11,176 1,332 4,830 261 418 70 4,265
241 Manufacture of basic iron and steel 35 3,185 675 1,438 57 131 7 877
242 Manufacture of basic precious and other non-ferrous metals 7 425 93 232 8 7 - 85
243 Casting of metals 6 176 4 94 15 8 - 55
251 Manufacture of structural metal products, tanks, reservoirs and steam generators 38 1,238 148 808 19 91 12 160
259
Manufacture of other fabricated metal products; metalworking
service activities 40 1,632 375 924 25 52 8 248
261 Manufacture of electronic components and boards 1 151 20 131 - - - -
262 Manufacture of computers and peripheral equipment 1 21 4 17 - - - -
264 Manufacture of consumer electronics 1 10 2 8 - - - -
265
Manufacture of measuring, testing, navigating and control equipment;
watches and clocks 1 22 6 10 - 3 - 3
271
Manufacture of electric motors, generators, transformers and
electricity distribution and control apparatus 2 59 3 55 - 1 - -
272 Manufacture of batteries and accumulators 1 94 43 51 - - - -
273 Manufacture of wiring and wiring devices 6 298 49 185 2 5 - 57
275 Manufacture of domestic appliances 12 816 136 436 1 14 - 229
279 Manufacture of other electrical equipment 2 112 43 66 - 1 - 2
282 Manufacture of special-purpose machinery 14 537 158 305 8 16 5 45
291 Manufacture of motor vehicles 1 12 2 8 1 1 - -
292 Manufacture of bodies (coachwork) for motor vehicles; manufacture of trailers and semi-trailers 5 160 13 124 - 10 - 13
293 Manufacture of parts and accessories for motor vehicles 8 828 276 539 - 13 - -
301 Building of ships and boats 1 142 12 52 1 - - 77
309 Manufacture of transport equipment n.e.c. 2 319 85 234 - - - -
310 Manufacture of furniture 195 6,705 593 3,788 49 278 131 1,866
321 Manufacture of jewellery, bijouterie and related articles 24 419 55 241 8 81 4 30
324 Manufacture of games and toys 2 4,090 20 4,065 - - - 5
329 Other manufacturing n.e.c. 19 1,668 165 1,054 - 43 4 402
331 Repair of fabricated metal products, machinery and equipment 8 352 47 163 - 13 - 129
C Manufacturing 1,931 177,173 19,783 100,093 2,574 5,204 918 48,601
351 Electric power generation, transmission and distribution 35 4,314 810 2,048 16 12 16 1,412
352 Manufacture of gas; distribution of gaseous fuels through mains 1 218 38 135 40 5 - -
D Electricity, gas, steam and air conditioning supply 36 4,532 848 2,183 56 17 16 1,412
360 Water collection, treatment and supply 106 9,214 2,983 5,441 95 119 45 531
382 Waste treatment and disposal 1 18 4 4 - 3 3 4
383 Materials recovery 3 279 28 111 - 3 - 137
E Water supply; sewerage, waste management and remediation 110 9,511 3,015 5,556 95 125 48 672
Total 2,462 221,688 25,652 127,724 3,150 6,046 1,155 57,961
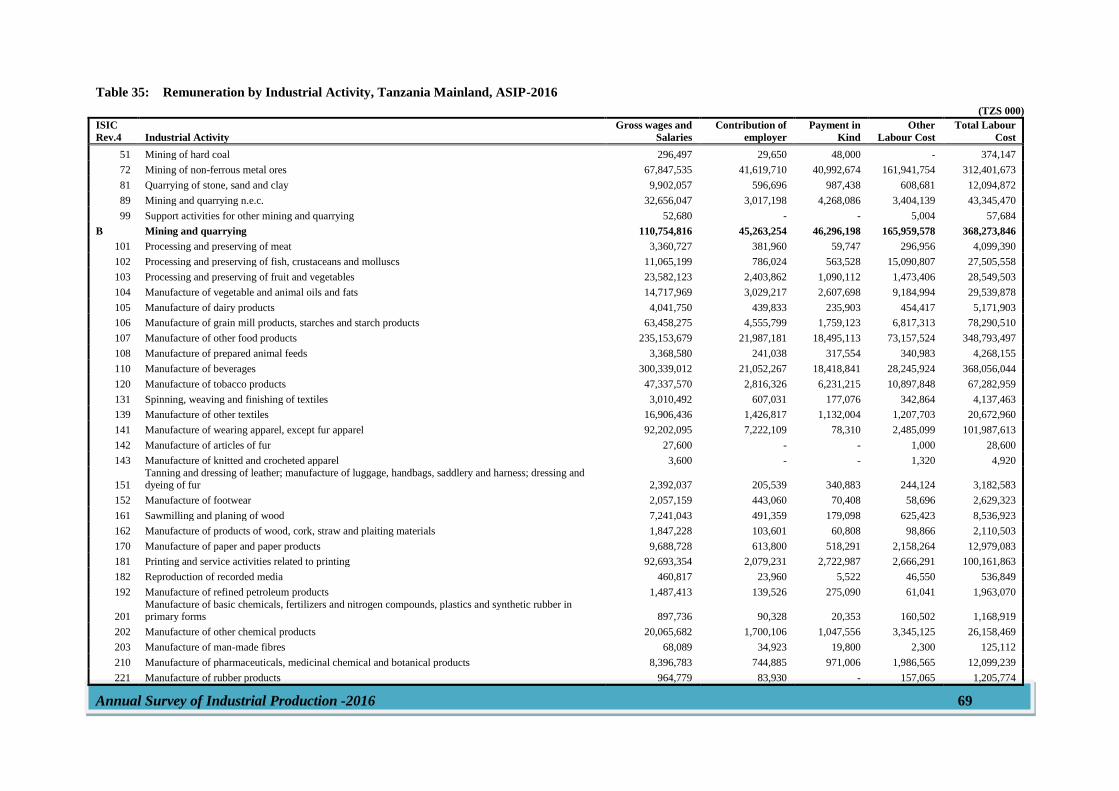
Annual Survey of Industrial Production -2016 69
Table 35: Remuneration by Industrial Activity, Tanzania Mainland, ASIP-2016
(TZS 000) ISIC
Rev.4 Industrial Activity
Gross wages and
Salaries
Contribution of
employer
Payment in
Kind
Other
Labour Cost
Total Labour
Cost
51 Mining of hard coal 296,497 29,650 48,000 - 374,147
72 Mining of non-ferrous metal ores 67,847,535 41,619,710 40,992,674 161,941,754 312,401,673
81 Quarrying of stone, sand and clay 9,902,057 596,696 987,438 608,681 12,094,872
89 Mining and quarrying n.e.c. 32,656,047 3,017,198 4,268,086 3,404,139 43,345,470
99 Support activities for other mining and quarrying 52,680 - - 5,004 57,684
B Mining and quarrying 110,754,816 45,263,254 46,296,198 165,959,578 368,273,846
101 Processing and preserving of meat 3,360,727 381,960 59,747 296,956 4,099,390
102 Processing and preserving of fish, crustaceans and molluscs 11,065,199 786,024 563,528 15,090,807 27,505,558
103 Processing and preserving of fruit and vegetables 23,582,123 2,403,862 1,090,112 1,473,406 28,549,503
104 Manufacture of vegetable and animal oils and fats 14,717,969 3,029,217 2,607,698 9,184,994 29,539,878
105 Manufacture of dairy products 4,041,750 439,833 235,903 454,417 5,171,903
106 Manufacture of grain mill products, starches and starch products 63,458,275 4,555,799 1,759,123 6,817,313 78,290,510
107 Manufacture of other food products 235,153,679 21,987,181 18,495,113 73,157,524 348,793,497
108 Manufacture of prepared animal feeds 3,368,580 241,038 317,554 340,983 4,268,155
110 Manufacture of beverages 300,339,012 21,052,267 18,418,841 28,245,924 368,056,044
120 Manufacture of tobacco products 47,337,570 2,816,326 6,231,215 10,897,848 67,282,959
131 Spinning, weaving and finishing of textiles 3,010,492 607,031 177,076 342,864 4,137,463
139 Manufacture of other textiles 16,906,436 1,426,817 1,132,004 1,207,703 20,672,960
141 Manufacture of wearing apparel, except fur apparel 92,202,095 7,222,109 78,310 2,485,099 101,987,613
142 Manufacture of articles of fur 27,600 - - 1,000 28,600
143 Manufacture of knitted and crocheted apparel 3,600 - - 1,320 4,920
151 Tanning and dressing of leather; manufacture of luggage, handbags, saddlery and harness; dressing and dyeing of fur 2,392,037 205,539 340,883 244,124 3,182,583
152 Manufacture of footwear 2,057,159 443,060 70,408 58,696 2,629,323
161 Sawmilling and planing of wood 7,241,043 491,359 179,098 625,423 8,536,923
162 Manufacture of products of wood, cork, straw and plaiting materials 1,847,228 103,601 60,808 98,866 2,110,503
170 Manufacture of paper and paper products 9,688,728 613,800 518,291 2,158,264 12,979,083
181 Printing and service activities related to printing 92,693,354 2,079,231 2,722,987 2,666,291 100,161,863
182 Reproduction of recorded media 460,817 23,960 5,522 46,550 536,849
192 Manufacture of refined petroleum products 1,487,413 139,526 275,090 61,041 1,963,070
201 Manufacture of basic chemicals, fertilizers and nitrogen compounds, plastics and synthetic rubber in primary forms 897,736 90,328 20,353 160,502 1,168,919
202 Manufacture of other chemical products 20,065,682 1,700,106 1,047,556 3,345,125 26,158,469
203 Manufacture of man-made fibres 68,089 34,923 19,800 2,300 125,112
210 Manufacture of pharmaceuticals, medicinal chemical and botanical products 8,396,783 744,885 971,006 1,986,565 12,099,239
221 Manufacture of rubber products 964,779 83,930 - 157,065 1,205,774
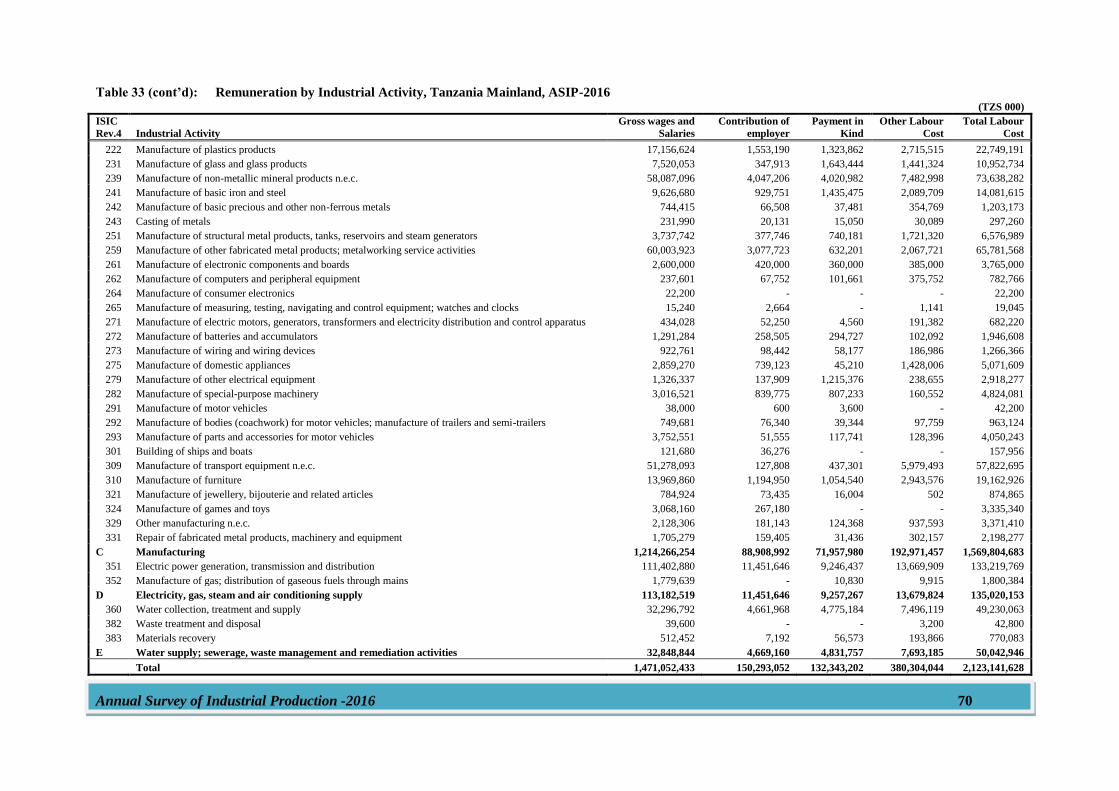
Annual Survey of Industrial Production -2016 70
Table 33 (cont’d): Remuneration by Industrial Activity, Tanzania Mainland, ASIP-2016 (TZS 000)
ISIC
Rev.4 Industrial Activity
Gross wages and
Salaries
Contribution of
employer
Payment in
Kind
Other Labour
Cost
Total Labour
Cost
222 Manufacture of plastics products 17,156,624 1,553,190 1,323,862 2,715,515 22,749,191
231 Manufacture of glass and glass products 7,520,053 347,913 1,643,444 1,441,324 10,952,734
239 Manufacture of non-metallic mineral products n.e.c. 58,087,096 4,047,206 4,020,982 7,482,998 73,638,282
241 Manufacture of basic iron and steel 9,626,680 929,751 1,435,475 2,089,709 14,081,615
242 Manufacture of basic precious and other non-ferrous metals 744,415 66,508 37,481 354,769 1,203,173
243 Casting of metals 231,990 20,131 15,050 30,089 297,260
251 Manufacture of structural metal products, tanks, reservoirs and steam generators 3,737,742 377,746 740,181 1,721,320 6,576,989
259 Manufacture of other fabricated metal products; metalworking service activities 60,003,923 3,077,723 632,201 2,067,721 65,781,568
261 Manufacture of electronic components and boards 2,600,000 420,000 360,000 385,000 3,765,000
262 Manufacture of computers and peripheral equipment 237,601 67,752 101,661 375,752 782,766
264 Manufacture of consumer electronics 22,200 - - - 22,200
265 Manufacture of measuring, testing, navigating and control equipment; watches and clocks 15,240 2,664 - 1,141 19,045
271 Manufacture of electric motors, generators, transformers and electricity distribution and control apparatus 434,028 52,250 4,560 191,382 682,220
272 Manufacture of batteries and accumulators 1,291,284 258,505 294,727 102,092 1,946,608
273 Manufacture of wiring and wiring devices 922,761 98,442 58,177 186,986 1,266,366
275 Manufacture of domestic appliances 2,859,270 739,123 45,210 1,428,006 5,071,609
279 Manufacture of other electrical equipment 1,326,337 137,909 1,215,376 238,655 2,918,277
282 Manufacture of special-purpose machinery 3,016,521 839,775 807,233 160,552 4,824,081
291 Manufacture of motor vehicles 38,000 600 3,600 - 42,200
292 Manufacture of bodies (coachwork) for motor vehicles; manufacture of trailers and semi-trailers 749,681 76,340 39,344 97,759 963,124
293 Manufacture of parts and accessories for motor vehicles 3,752,551 51,555 117,741 128,396 4,050,243
301 Building of ships and boats 121,680 36,276 - - 157,956
309 Manufacture of transport equipment n.e.c. 51,278,093 127,808 437,301 5,979,493 57,822,695
310 Manufacture of furniture 13,969,860 1,194,950 1,054,540 2,943,576 19,162,926
321 Manufacture of jewellery, bijouterie and related articles 784,924 73,435 16,004 502 874,865
324 Manufacture of games and toys 3,068,160 267,180 - - 3,335,340
329 Other manufacturing n.e.c. 2,128,306 181,143 124,368 937,593 3,371,410
331 Repair of fabricated metal products, machinery and equipment 1,705,279 159,405 31,436 302,157 2,198,277
C Manufacturing 1,214,266,254 88,908,992 71,957,980 192,971,457 1,569,804,683
351 Electric power generation, transmission and distribution 111,402,880 11,451,646 9,246,437 13,669,909 133,219,769
352 Manufacture of gas; distribution of gaseous fuels through mains 1,779,639 - 10,830 9,915 1,800,384
D Electricity, gas, steam and air conditioning supply 113,182,519 11,451,646 9,257,267 13,679,824 135,020,153
360 Water collection, treatment and supply 32,296,792 4,661,968 4,775,184 7,496,119 49,230,063
382 Waste treatment and disposal 39,600 - - 3,200 42,800
383 Materials recovery 512,452 7,192 56,573 193,866 770,083
E Water supply; sewerage, waste management and remediation activities 32,848,844 4,669,160 4,831,757 7,693,185 50,042,946
Total 1,471,052,433 150,293,052 132,343,202 380,304,044 2,123,141,628
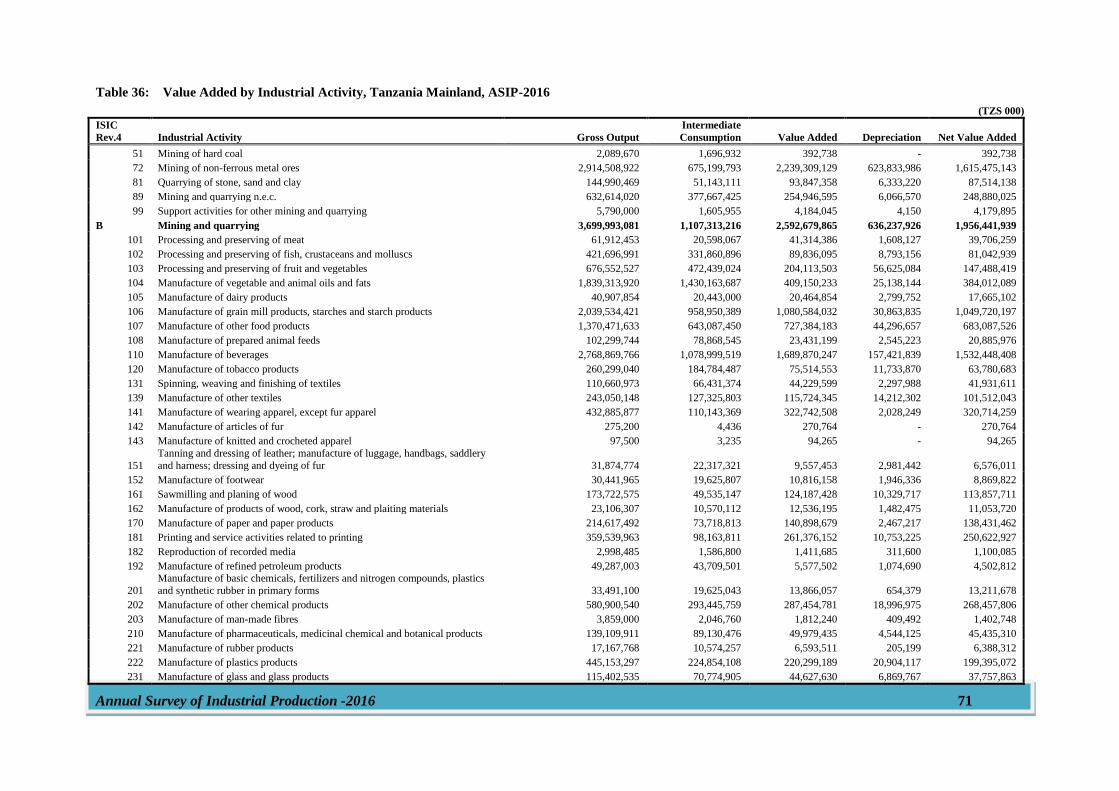
Annual Survey of Industrial Production -2016 71
Table 36: Value Added by Industrial Activity, Tanzania Mainland, ASIP-2016
(TZS 000) ISIC
Rev.4 Industrial Activity Gross Output
Intermediate
Consumption Value Added Depreciation Net Value Added
51 Mining of hard coal 2,089,670 1,696,932 392,738 - 392,738
72 Mining of non-ferrous metal ores 2,914,508,922 675,199,793 2,239,309,129 623,833,986 1,615,475,143
81 Quarrying of stone, sand and clay 144,990,469 51,143,111 93,847,358 6,333,220 87,514,138
89 Mining and quarrying n.e.c. 632,614,020 377,667,425 254,946,595 6,066,570 248,880,025
99 Support activities for other mining and quarrying 5,790,000 1,605,955 4,184,045 4,150 4,179,895
B Mining and quarrying 3,699,993,081 1,107,313,216 2,592,679,865 636,237,926 1,956,441,939
101 Processing and preserving of meat 61,912,453 20,598,067 41,314,386 1,608,127 39,706,259
102 Processing and preserving of fish, crustaceans and molluscs 421,696,991 331,860,896 89,836,095 8,793,156 81,042,939
103 Processing and preserving of fruit and vegetables 676,552,527 472,439,024 204,113,503 56,625,084 147,488,419
104 Manufacture of vegetable and animal oils and fats 1,839,313,920 1,430,163,687 409,150,233 25,138,144 384,012,089
105 Manufacture of dairy products 40,907,854 20,443,000 20,464,854 2,799,752 17,665,102
106 Manufacture of grain mill products, starches and starch products 2,039,534,421 958,950,389 1,080,584,032 30,863,835 1,049,720,197
107 Manufacture of other food products 1,370,471,633 643,087,450 727,384,183 44,296,657 683,087,526
108 Manufacture of prepared animal feeds 102,299,744 78,868,545 23,431,199 2,545,223 20,885,976
110 Manufacture of beverages 2,768,869,766 1,078,999,519 1,689,870,247 157,421,839 1,532,448,408
120 Manufacture of tobacco products 260,299,040 184,784,487 75,514,553 11,733,870 63,780,683
131 Spinning, weaving and finishing of textiles 110,660,973 66,431,374 44,229,599 2,297,988 41,931,611
139 Manufacture of other textiles 243,050,148 127,325,803 115,724,345 14,212,302 101,512,043
141 Manufacture of wearing apparel, except fur apparel 432,885,877 110,143,369 322,742,508 2,028,249 320,714,259
142 Manufacture of articles of fur 275,200 4,436 270,764 - 270,764
143 Manufacture of knitted and crocheted apparel 97,500 3,235 94,265 - 94,265
151
Tanning and dressing of leather; manufacture of luggage, handbags, saddlery
and harness; dressing and dyeing of fur 31,874,774 22,317,321 9,557,453 2,981,442 6,576,011
152 Manufacture of footwear 30,441,965 19,625,807 10,816,158 1,946,336 8,869,822
161 Sawmilling and planing of wood 173,722,575 49,535,147 124,187,428 10,329,717 113,857,711
162 Manufacture of products of wood, cork, straw and plaiting materials 23,106,307 10,570,112 12,536,195 1,482,475 11,053,720
170 Manufacture of paper and paper products 214,617,492 73,718,813 140,898,679 2,467,217 138,431,462
181 Printing and service activities related to printing 359,539,963 98,163,811 261,376,152 10,753,225 250,622,927
182 Reproduction of recorded media 2,998,485 1,586,800 1,411,685 311,600 1,100,085
192 Manufacture of refined petroleum products 49,287,003 43,709,501 5,577,502 1,074,690 4,502,812
201
Manufacture of basic chemicals, fertilizers and nitrogen compounds, plastics
and synthetic rubber in primary forms 33,491,100 19,625,043 13,866,057 654,379 13,211,678
202 Manufacture of other chemical products 580,900,540 293,445,759 287,454,781 18,996,975 268,457,806
203 Manufacture of man-made fibres 3,859,000 2,046,760 1,812,240 409,492 1,402,748
210 Manufacture of pharmaceuticals, medicinal chemical and botanical products 139,109,911 89,130,476 49,979,435 4,544,125 45,435,310
221 Manufacture of rubber products 17,167,768 10,574,257 6,593,511 205,199 6,388,312
222 Manufacture of plastics products 445,153,297 224,854,108 220,299,189 20,904,117 199,395,072
231 Manufacture of glass and glass products 115,402,535 70,774,905 44,627,630 6,869,767 37,757,863
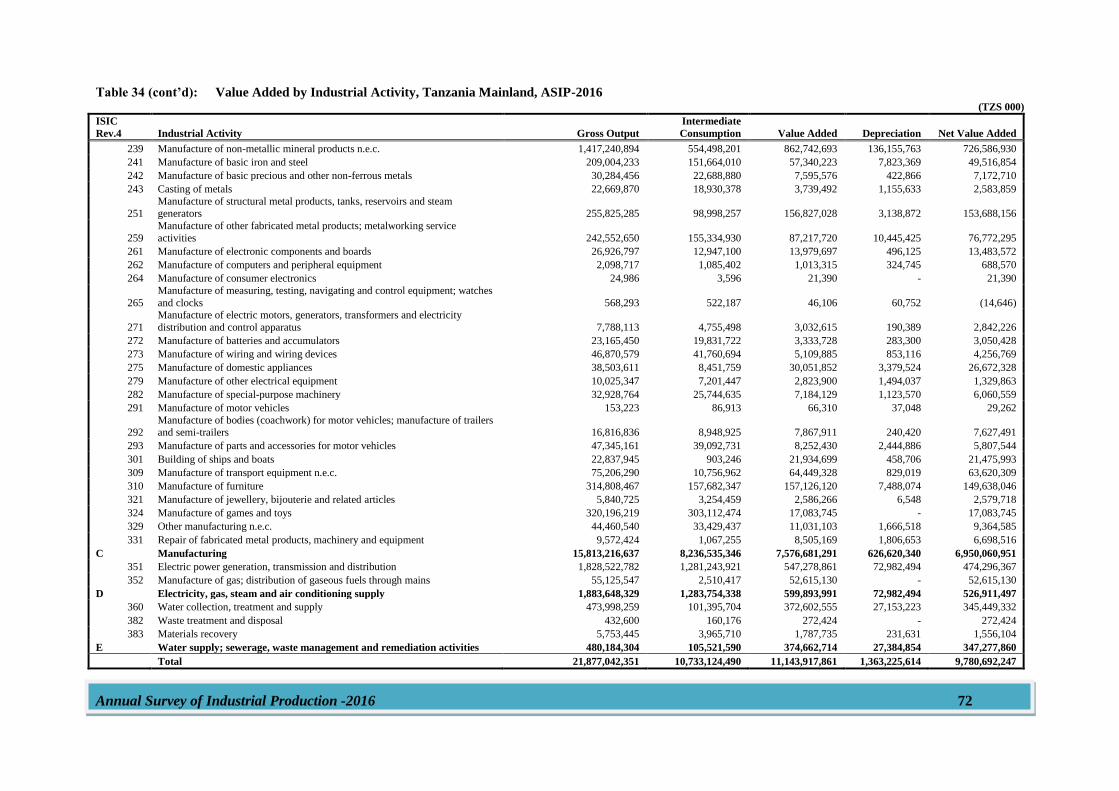
Annual Survey of Industrial Production -2016 72
Table 34 (cont’d): Value Added by Industrial Activity, Tanzania Mainland, ASIP-2016 (TZS 000)
ISIC
Rev.4 Industrial Activity Gross Output
Intermediate
Consumption Value Added Depreciation Net Value Added
239 Manufacture of non-metallic mineral products n.e.c. 1,417,240,894 554,498,201 862,742,693 136,155,763 726,586,930
241 Manufacture of basic iron and steel 209,004,233 151,664,010 57,340,223 7,823,369 49,516,854
242 Manufacture of basic precious and other non-ferrous metals 30,284,456 22,688,880 7,595,576 422,866 7,172,710
243 Casting of metals 22,669,870 18,930,378 3,739,492 1,155,633 2,583,859
251 Manufacture of structural metal products, tanks, reservoirs and steam generators 255,825,285 98,998,257 156,827,028 3,138,872 153,688,156
259
Manufacture of other fabricated metal products; metalworking service
activities 242,552,650 155,334,930 87,217,720 10,445,425 76,772,295
261 Manufacture of electronic components and boards 26,926,797 12,947,100 13,979,697 496,125 13,483,572
262 Manufacture of computers and peripheral equipment 2,098,717 1,085,402 1,013,315 324,745 688,570
264 Manufacture of consumer electronics 24,986 3,596 21,390 - 21,390
265
Manufacture of measuring, testing, navigating and control equipment; watches
and clocks 568,293 522,187 46,106 60,752 (14,646)
271
Manufacture of electric motors, generators, transformers and electricity
distribution and control apparatus 7,788,113 4,755,498 3,032,615 190,389 2,842,226
272 Manufacture of batteries and accumulators 23,165,450 19,831,722 3,333,728 283,300 3,050,428
273 Manufacture of wiring and wiring devices 46,870,579 41,760,694 5,109,885 853,116 4,256,769
275 Manufacture of domestic appliances 38,503,611 8,451,759 30,051,852 3,379,524 26,672,328
279 Manufacture of other electrical equipment 10,025,347 7,201,447 2,823,900 1,494,037 1,329,863
282 Manufacture of special-purpose machinery 32,928,764 25,744,635 7,184,129 1,123,570 6,060,559
291 Manufacture of motor vehicles 153,223 86,913 66,310 37,048 29,262
292 Manufacture of bodies (coachwork) for motor vehicles; manufacture of trailers and semi-trailers 16,816,836 8,948,925 7,867,911 240,420 7,627,491
293 Manufacture of parts and accessories for motor vehicles 47,345,161 39,092,731 8,252,430 2,444,886 5,807,544
301 Building of ships and boats 22,837,945 903,246 21,934,699 458,706 21,475,993
309 Manufacture of transport equipment n.e.c. 75,206,290 10,756,962 64,449,328 829,019 63,620,309
310 Manufacture of furniture 314,808,467 157,682,347 157,126,120 7,488,074 149,638,046
321 Manufacture of jewellery, bijouterie and related articles 5,840,725 3,254,459 2,586,266 6,548 2,579,718
324 Manufacture of games and toys 320,196,219 303,112,474 17,083,745 - 17,083,745
329 Other manufacturing n.e.c. 44,460,540 33,429,437 11,031,103 1,666,518 9,364,585
331 Repair of fabricated metal products, machinery and equipment 9,572,424 1,067,255 8,505,169 1,806,653 6,698,516
C Manufacturing 15,813,216,637 8,236,535,346 7,576,681,291 626,620,340 6,950,060,951
351 Electric power generation, transmission and distribution 1,828,522,782 1,281,243,921 547,278,861 72,982,494 474,296,367
352 Manufacture of gas; distribution of gaseous fuels through mains 55,125,547 2,510,417 52,615,130 - 52,615,130
D Electricity, gas, steam and air conditioning supply 1,883,648,329 1,283,754,338 599,893,991 72,982,494 526,911,497
360 Water collection, treatment and supply 473,998,259 101,395,704 372,602,555 27,153,223 345,449,332
382 Waste treatment and disposal 432,600 160,176 272,424 - 272,424
383 Materials recovery 5,753,445 3,965,710 1,787,735 231,631 1,556,104
E Water supply; sewerage, waste management and remediation activities 480,184,304 105,521,590 374,662,714 27,384,854 347,277,860
Total 21,877,042,351 10,733,124,490 11,143,917,861 1,363,225,614 9,780,692,247
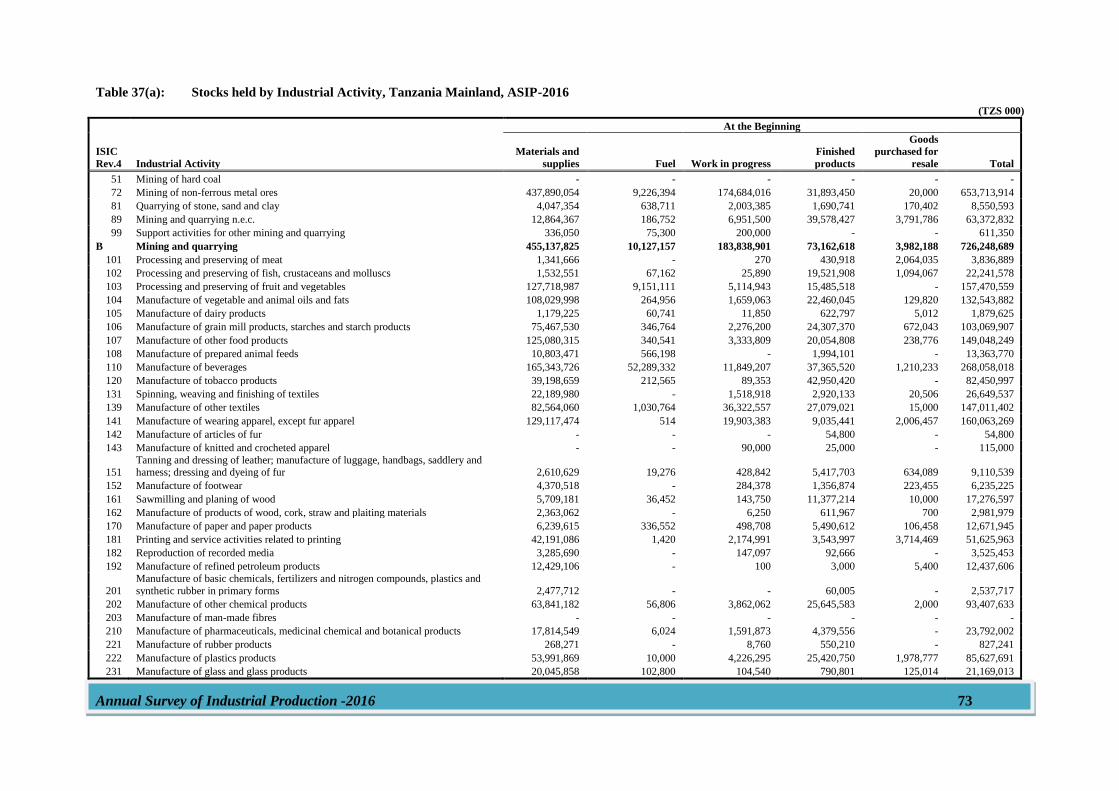
Annual Survey of Industrial Production -2016 73
Table 37(a): Stocks held by Industrial Activity, Tanzania Mainland, ASIP-2016
(TZS 000)
ISIC
Rev.4 Industrial Activity
At the Beginning
Materials and
supplies Fuel Work in progress
Finished
products
Goods
purchased for
resale Total
51 Mining of hard coal - - - - - -
72 Mining of non-ferrous metal ores 437,890,054 9,226,394 174,684,016 31,893,450 20,000 653,713,914
81 Quarrying of stone, sand and clay 4,047,354 638,711 2,003,385 1,690,741 170,402 8,550,593
89 Mining and quarrying n.e.c. 12,864,367 186,752 6,951,500 39,578,427 3,791,786 63,372,832
99 Support activities for other mining and quarrying 336,050 75,300 200,000 - - 611,350
B Mining and quarrying 455,137,825 10,127,157 183,838,901 73,162,618 3,982,188 726,248,689
101 Processing and preserving of meat 1,341,666 - 270 430,918 2,064,035 3,836,889
102 Processing and preserving of fish, crustaceans and molluscs 1,532,551 67,162 25,890 19,521,908 1,094,067 22,241,578
103 Processing and preserving of fruit and vegetables 127,718,987 9,151,111 5,114,943 15,485,518 - 157,470,559
104 Manufacture of vegetable and animal oils and fats 108,029,998 264,956 1,659,063 22,460,045 129,820 132,543,882
105 Manufacture of dairy products 1,179,225 60,741 11,850 622,797 5,012 1,879,625
106 Manufacture of grain mill products, starches and starch products 75,467,530 346,764 2,276,200 24,307,370 672,043 103,069,907
107 Manufacture of other food products 125,080,315 340,541 3,333,809 20,054,808 238,776 149,048,249
108 Manufacture of prepared animal feeds 10,803,471 566,198 - 1,994,101 - 13,363,770
110 Manufacture of beverages 165,343,726 52,289,332 11,849,207 37,365,520 1,210,233 268,058,018
120 Manufacture of tobacco products 39,198,659 212,565 89,353 42,950,420 - 82,450,997
131 Spinning, weaving and finishing of textiles 22,189,980 - 1,518,918 2,920,133 20,506 26,649,537
139 Manufacture of other textiles 82,564,060 1,030,764 36,322,557 27,079,021 15,000 147,011,402
141 Manufacture of wearing apparel, except fur apparel 129,117,474 514 19,903,383 9,035,441 2,006,457 160,063,269
142 Manufacture of articles of fur - - - 54,800 - 54,800
143 Manufacture of knitted and crocheted apparel - - 90,000 25,000 - 115,000
151 Tanning and dressing of leather; manufacture of luggage, handbags, saddlery and harness; dressing and dyeing of fur 2,610,629 19,276 428,842 5,417,703 634,089 9,110,539
152 Manufacture of footwear 4,370,518 - 284,378 1,356,874 223,455 6,235,225
161 Sawmilling and planing of wood 5,709,181 36,452 143,750 11,377,214 10,000 17,276,597
162 Manufacture of products of wood, cork, straw and plaiting materials 2,363,062 - 6,250 611,967 700 2,981,979
170 Manufacture of paper and paper products 6,239,615 336,552 498,708 5,490,612 106,458 12,671,945
181 Printing and service activities related to printing 42,191,086 1,420 2,174,991 3,543,997 3,714,469 51,625,963
182 Reproduction of recorded media 3,285,690 - 147,097 92,666 - 3,525,453
192 Manufacture of refined petroleum products 12,429,106 - 100 3,000 5,400 12,437,606
201
Manufacture of basic chemicals, fertilizers and nitrogen compounds, plastics and
synthetic rubber in primary forms 2,477,712 - - 60,005 - 2,537,717
202 Manufacture of other chemical products 63,841,182 56,806 3,862,062 25,645,583 2,000 93,407,633
203 Manufacture of man-made fibres - - - - - -
210 Manufacture of pharmaceuticals, medicinal chemical and botanical products 17,814,549 6,024 1,591,873 4,379,556 - 23,792,002
221 Manufacture of rubber products 268,271 - 8,760 550,210 - 827,241
222 Manufacture of plastics products 53,991,869 10,000 4,226,295 25,420,750 1,978,777 85,627,691
231 Manufacture of glass and glass products 20,045,858 102,800 104,540 790,801 125,014 21,169,013
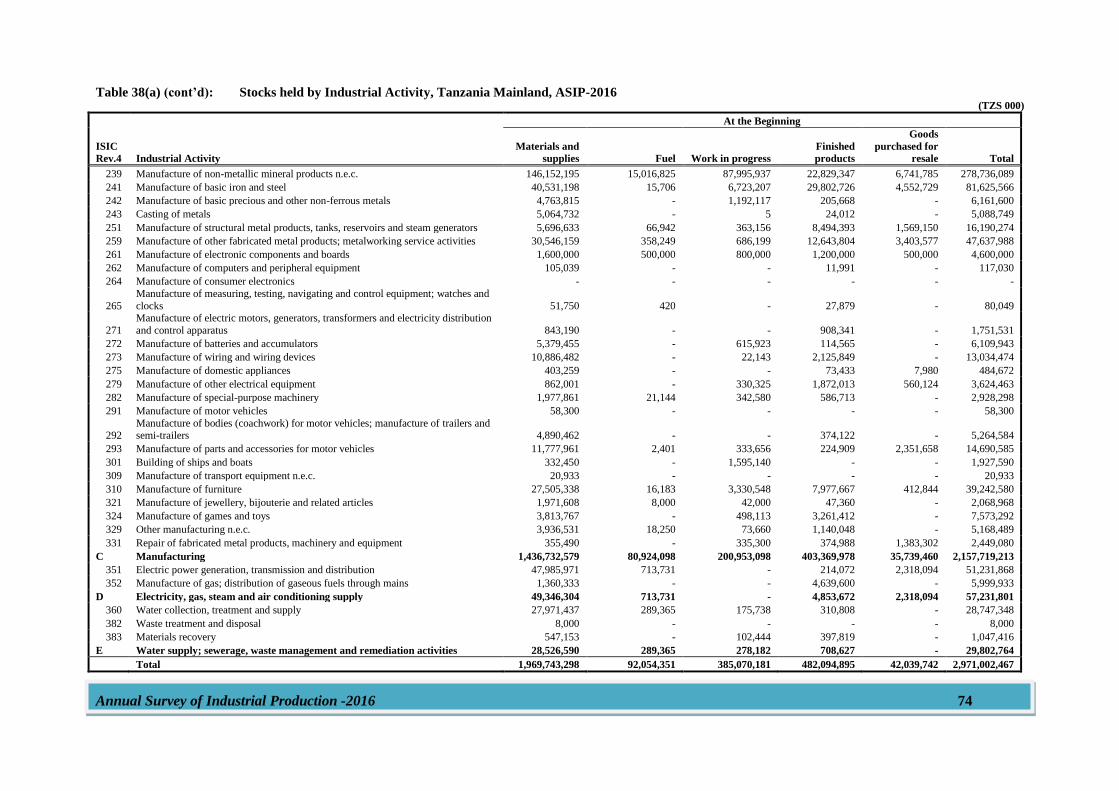
Annual Survey of Industrial Production -2016 74
Table 38(a) (cont’d): Stocks held by Industrial Activity, Tanzania Mainland, ASIP-2016 (TZS 000)
ISIC
Rev.4 Industrial Activity
At the Beginning
Materials and
supplies Fuel Work in progress
Finished
products
Goods
purchased for
resale Total
239 Manufacture of non-metallic mineral products n.e.c. 146,152,195 15,016,825 87,995,937 22,829,347 6,741,785 278,736,089
241 Manufacture of basic iron and steel 40,531,198 15,706 6,723,207 29,802,726 4,552,729 81,625,566
242 Manufacture of basic precious and other non-ferrous metals 4,763,815 - 1,192,117 205,668 - 6,161,600
243 Casting of metals 5,064,732 - 5 24,012 - 5,088,749
251 Manufacture of structural metal products, tanks, reservoirs and steam generators 5,696,633 66,942 363,156 8,494,393 1,569,150 16,190,274
259 Manufacture of other fabricated metal products; metalworking service activities 30,546,159 358,249 686,199 12,643,804 3,403,577 47,637,988
261 Manufacture of electronic components and boards 1,600,000 500,000 800,000 1,200,000 500,000 4,600,000
262 Manufacture of computers and peripheral equipment 105,039 - - 11,991 - 117,030
264 Manufacture of consumer electronics - - - - - -
265
Manufacture of measuring, testing, navigating and control equipment; watches and
clocks 51,750 420 - 27,879 - 80,049
271
Manufacture of electric motors, generators, transformers and electricity distribution
and control apparatus 843,190 - - 908,341 - 1,751,531
272 Manufacture of batteries and accumulators 5,379,455 - 615,923 114,565 - 6,109,943
273 Manufacture of wiring and wiring devices 10,886,482 - 22,143 2,125,849 - 13,034,474
275 Manufacture of domestic appliances 403,259 - - 73,433 7,980 484,672
279 Manufacture of other electrical equipment 862,001 - 330,325 1,872,013 560,124 3,624,463
282 Manufacture of special-purpose machinery 1,977,861 21,144 342,580 586,713 - 2,928,298
291 Manufacture of motor vehicles 58,300 - - - - 58,300
292 Manufacture of bodies (coachwork) for motor vehicles; manufacture of trailers and semi-trailers 4,890,462 - - 374,122 - 5,264,584
293 Manufacture of parts and accessories for motor vehicles 11,777,961 2,401 333,656 224,909 2,351,658 14,690,585
301 Building of ships and boats 332,450 - 1,595,140 - - 1,927,590
309 Manufacture of transport equipment n.e.c. 20,933 - - - - 20,933
310 Manufacture of furniture 27,505,338 16,183 3,330,548 7,977,667 412,844 39,242,580
321 Manufacture of jewellery, bijouterie and related articles 1,971,608 8,000 42,000 47,360 - 2,068,968
324 Manufacture of games and toys 3,813,767 - 498,113 3,261,412 - 7,573,292
329 Other manufacturing n.e.c. 3,936,531 18,250 73,660 1,140,048 - 5,168,489
331 Repair of fabricated metal products, machinery and equipment 355,490 - 335,300 374,988 1,383,302 2,449,080
C Manufacturing 1,436,732,579 80,924,098 200,953,098 403,369,978 35,739,460 2,157,719,213
351 Electric power generation, transmission and distribution 47,985,971 713,731 - 214,072 2,318,094 51,231,868
352 Manufacture of gas; distribution of gaseous fuels through mains 1,360,333 - - 4,639,600 - 5,999,933
D Electricity, gas, steam and air conditioning supply 49,346,304 713,731 - 4,853,672 2,318,094 57,231,801
360 Water collection, treatment and supply 27,971,437 289,365 175,738 310,808 - 28,747,348
382 Waste treatment and disposal 8,000 - - - - 8,000
383 Materials recovery 547,153 - 102,444 397,819 - 1,047,416
E Water supply; sewerage, waste management and remediation activities 28,526,590 289,365 278,182 708,627 - 29,802,764
Total 1,969,743,298 92,054,351 385,070,181 482,094,895 42,039,742 2,971,002,467
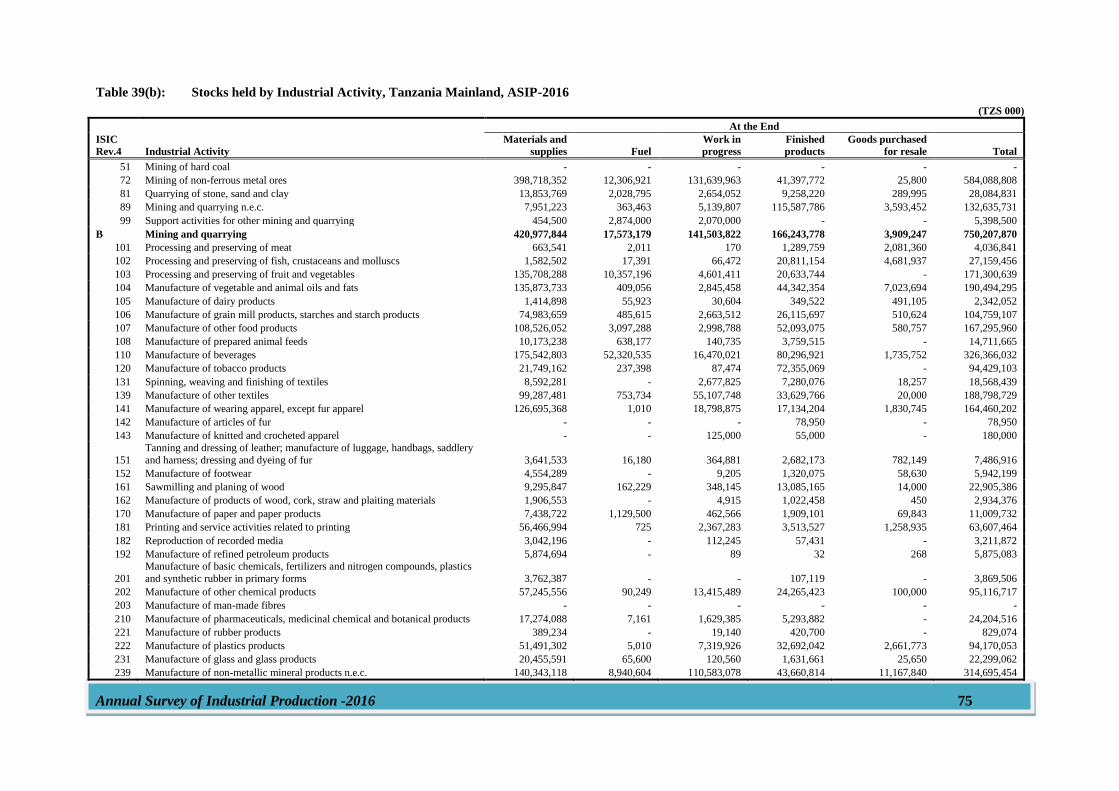
Annual Survey of Industrial Production -2016 75
Table 39(b): Stocks held by Industrial Activity, Tanzania Mainland, ASIP-2016
(TZS 000)
ISIC
Rev.4 Industrial Activity
At the End
Materials and
supplies Fuel
Work in
progress
Finished
products
Goods purchased
for resale Total
51 Mining of hard coal - - - - - -
72 Mining of non-ferrous metal ores 398,718,352 12,306,921 131,639,963 41,397,772 25,800 584,088,808
81 Quarrying of stone, sand and clay 13,853,769 2,028,795 2,654,052 9,258,220 289,995 28,084,831
89 Mining and quarrying n.e.c. 7,951,223 363,463 5,139,807 115,587,786 3,593,452 132,635,731
99 Support activities for other mining and quarrying 454,500 2,874,000 2,070,000 - - 5,398,500
B Mining and quarrying 420,977,844 17,573,179 141,503,822 166,243,778 3,909,247 750,207,870
101 Processing and preserving of meat 663,541 2,011 170 1,289,759 2,081,360 4,036,841
102 Processing and preserving of fish, crustaceans and molluscs 1,582,502 17,391 66,472 20,811,154 4,681,937 27,159,456
103 Processing and preserving of fruit and vegetables 135,708,288 10,357,196 4,601,411 20,633,744 - 171,300,639
104 Manufacture of vegetable and animal oils and fats 135,873,733 409,056 2,845,458 44,342,354 7,023,694 190,494,295
105 Manufacture of dairy products 1,414,898 55,923 30,604 349,522 491,105 2,342,052
106 Manufacture of grain mill products, starches and starch products 74,983,659 485,615 2,663,512 26,115,697 510,624 104,759,107
107 Manufacture of other food products 108,526,052 3,097,288 2,998,788 52,093,075 580,757 167,295,960
108 Manufacture of prepared animal feeds 10,173,238 638,177 140,735 3,759,515 - 14,711,665
110 Manufacture of beverages 175,542,803 52,320,535 16,470,021 80,296,921 1,735,752 326,366,032
120 Manufacture of tobacco products 21,749,162 237,398 87,474 72,355,069 - 94,429,103
131 Spinning, weaving and finishing of textiles 8,592,281 - 2,677,825 7,280,076 18,257 18,568,439
139 Manufacture of other textiles 99,287,481 753,734 55,107,748 33,629,766 20,000 188,798,729
141 Manufacture of wearing apparel, except fur apparel 126,695,368 1,010 18,798,875 17,134,204 1,830,745 164,460,202
142 Manufacture of articles of fur - - - 78,950 - 78,950
143 Manufacture of knitted and crocheted apparel - - 125,000 55,000 - 180,000
151
Tanning and dressing of leather; manufacture of luggage, handbags, saddlery
and harness; dressing and dyeing of fur 3,641,533 16,180 364,881 2,682,173 782,149 7,486,916
152 Manufacture of footwear 4,554,289 - 9,205 1,320,075 58,630 5,942,199
161 Sawmilling and planing of wood 9,295,847 162,229 348,145 13,085,165 14,000 22,905,386
162 Manufacture of products of wood, cork, straw and plaiting materials 1,906,553 - 4,915 1,022,458 450 2,934,376
170 Manufacture of paper and paper products 7,438,722 1,129,500 462,566 1,909,101 69,843 11,009,732
181 Printing and service activities related to printing 56,466,994 725 2,367,283 3,513,527 1,258,935 63,607,464
182 Reproduction of recorded media 3,042,196 - 112,245 57,431 - 3,211,872
192 Manufacture of refined petroleum products 5,874,694 - 89 32 268 5,875,083
201
Manufacture of basic chemicals, fertilizers and nitrogen compounds, plastics
and synthetic rubber in primary forms 3,762,387 - - 107,119 - 3,869,506
202 Manufacture of other chemical products 57,245,556 90,249 13,415,489 24,265,423 100,000 95,116,717
203 Manufacture of man-made fibres - - - - - -
210 Manufacture of pharmaceuticals, medicinal chemical and botanical products 17,274,088 7,161 1,629,385 5,293,882 - 24,204,516
221 Manufacture of rubber products 389,234 - 19,140 420,700 - 829,074
222 Manufacture of plastics products 51,491,302 5,010 7,319,926 32,692,042 2,661,773 94,170,053
231 Manufacture of glass and glass products 20,455,591 65,600 120,560 1,631,661 25,650 22,299,062
239 Manufacture of non-metallic mineral products n.e.c. 140,343,118 8,940,604 110,583,078 43,660,814 11,167,840 314,695,454

Annual Survey of Industrial Production -2016 76
Table 40(b) (cont’d): Stocks held by Industrial Activity, Tanzania Mainland, ASIP-2016 (TZS 000)
ISIC
Rev.4 Industrial Activity
At the End
Materials and
supplies Fuel
Work in
progress
Finished
products
Goods purchased
for resale Total
241 Manufacture of basic iron and steel 45,088,926 16,165 8,905,211 36,062,112 4,991,077 95,063,491
242 Manufacture of basic precious and other non-ferrous metals 5,670,575 75,797 832,322 636,288 - 7,214,982
243 Casting of metals 5,574,953 - 2 30,004 - 5,604,959
251
Manufacture of structural metal products, tanks, reservoirs and steam
generators 6,700,076 80,144 525,234 14,805,778 3,597,443 25,708,675
259 Manufacture of other fabricated metal products; metalworking service activities 36,108,806 366,399 661,530 1,356,418 11,071,888 49,565,041
261 Manufacture of electronic components and boards - - - - - -
262 Manufacture of computers and peripheral equipment 206,037 - - 244,988 - 451,025
264 Manufacture of consumer electronics - - - - - -
265
Manufacture of measuring, testing, navigating and control equipment;
watches and clocks 15,605 75 - - - 15,680
271 Manufacture of electric motors, generators, transformers and electricity distribution and control apparatus 1,198,242 - - 267,821 - 1,466,063
272 Manufacture of batteries and accumulators 4,787,291 - 77,497 720,960 - 5,585,748
273 Manufacture of wiring and wiring devices 13,997,627 - 29,470 1,347,826 - 15,374,923
275 Manufacture of domestic appliances 322,940 - - 132,093 9,877 464,910
279 Manufacture of other electrical equipment 953,521 - 197,666 1,805,555 719,191 3,675,933
282 Manufacture of special-purpose machinery 4,557,773 22,720 560,006 525,725 - 5,666,224
291 Manufacture of motor vehicles 62,000 - - - - 62,000
292
Manufacture of bodies (coachwork) for motor vehicles; manufacture of
trailers and semi-trailers 6,150,815 - - 807,105 - 6,957,920
293 Manufacture of parts and accessories for motor vehicles 9,790,406 12,637 318,305 313,021 247,260 10,681,629
301 Building of ships and boats 753,214 - 12,654,321 - - 13,407,535
309 Manufacture of transport equipment n.e.c. 28,566 - - - - 28,566
310 Manufacture of furniture 34,140,312 53,550 1,676,794 8,326,413 2,350,487 46,547,556
321 Manufacture of jewellery, bijouterie and related articles 2,210,386 8,380 40,500 16,140 - 2,275,406
324 Manufacture of games and toys 474 - - - - 474
329 Other manufacturing n.e.c. 4,033,273 - 51,890 2,513,253 - 6,598,416
331 Repair of fabricated metal products, machinery and equipment 377,561 - 57,678 155,855 1,642,534 2,233,628
C Manufacturing 1,466,704,489 79,428,459 269,959,426 581,953,764 59,743,526 2,457,789,664
351 Electric power generation, transmission and distribution 38,866,195 672,281 1,000,494 139,512 932,017 41,610,499
352 Manufacture of gas; distribution of gaseous fuels through mains 1,410,000 - - 5,791,800 - 7,201,800
D Electricity, gas, steam and air conditioning supply 40,276,195 672,281 1,000,494 5,931,312 932,017 48,812,299
360 Water collection, treatment and supply 29,990,793 37,732 52,065 1,404,355 72,836 31,557,781
382 Waste treatment and disposal 9,500 - - - - 9,500
383 Materials recovery 614,961 - 221,455 525,854 - 1,362,270
E Water supply; sewerage, waste management and remediation activities 30,615,254 37,732 273,520 1,930,209 72,836 32,929,551
Total 1,958,573,782 97,711,651 412,737,262 756,059,063 64,657,626 3,289,739,384
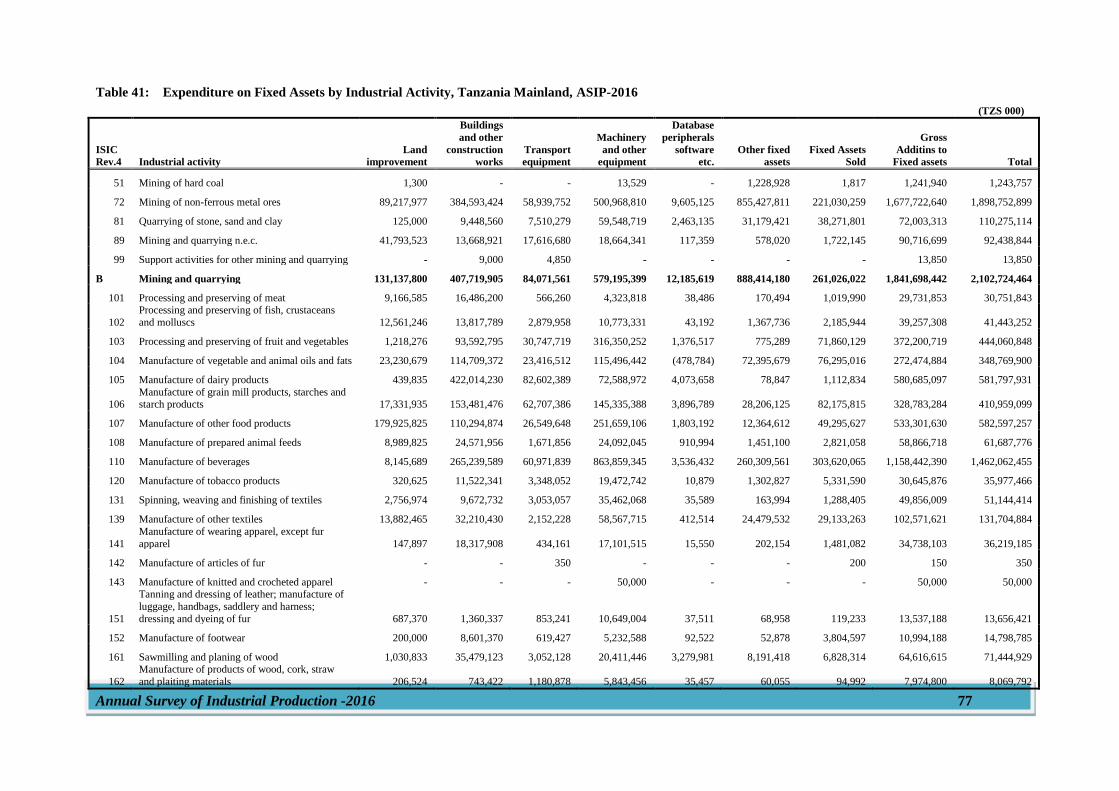
Annual Survey of Industrial Production -2016 77
Table 41: Expenditure on Fixed Assets by Industrial Activity, Tanzania Mainland, ASIP-2016
(TZS 000)
ISIC
Rev.4 Industrial activity
Land
improvement
Buildings
and other
construction
works
Transport
equipment
Machinery
and other
equipment
Database
peripherals
software
etc.
Other fixed
assets
Fixed Assets
Sold
Gross
Additins to
Fixed assets Total
51 Mining of hard coal 1,300 - - 13,529 - 1,228,928 1,817 1,241,940 1,243,757
72 Mining of non-ferrous metal ores 89,217,977 384,593,424 58,939,752 500,968,810 9,605,125 855,427,811 221,030,259 1,677,722,640 1,898,752,899
81 Quarrying of stone, sand and clay 125,000 9,448,560 7,510,279 59,548,719 2,463,135 31,179,421 38,271,801 72,003,313 110,275,114
89 Mining and quarrying n.e.c. 41,793,523 13,668,921 17,616,680 18,664,341 117,359 578,020 1,722,145 90,716,699 92,438,844
99 Support activities for other mining and quarrying - 9,000 4,850 - - - - 13,850 13,850
B Mining and quarrying 131,137,800 407,719,905 84,071,561 579,195,399 12,185,619 888,414,180 261,026,022 1,841,698,442 2,102,724,464
101 Processing and preserving of meat 9,166,585 16,486,200 566,260 4,323,818 38,486 170,494 1,019,990 29,731,853 30,751,843
102
Processing and preserving of fish, crustaceans
and molluscs 12,561,246 13,817,789 2,879,958 10,773,331 43,192 1,367,736 2,185,944 39,257,308 41,443,252
103 Processing and preserving of fruit and vegetables 1,218,276 93,592,795 30,747,719 316,350,252 1,376,517 775,289 71,860,129 372,200,719 444,060,848
104 Manufacture of vegetable and animal oils and fats 23,230,679 114,709,372 23,416,512 115,496,442 (478,784) 72,395,679 76,295,016 272,474,884 348,769,900
105 Manufacture of dairy products 439,835 422,014,230 82,602,389 72,588,972 4,073,658 78,847 1,112,834 580,685,097 581,797,931
106 Manufacture of grain mill products, starches and starch products 17,331,935 153,481,476 62,707,386 145,335,388 3,896,789 28,206,125 82,175,815 328,783,284 410,959,099
107 Manufacture of other food products 179,925,825 110,294,874 26,549,648 251,659,106 1,803,192 12,364,612 49,295,627 533,301,630 582,597,257
108 Manufacture of prepared animal feeds 8,989,825 24,571,956 1,671,856 24,092,045 910,994 1,451,100 2,821,058 58,866,718 61,687,776
110 Manufacture of beverages 8,145,689 265,239,589 60,971,839 863,859,345 3,536,432 260,309,561 303,620,065 1,158,442,390 1,462,062,455
120 Manufacture of tobacco products 320,625 11,522,341 3,348,052 19,472,742 10,879 1,302,827 5,331,590 30,645,876 35,977,466
131 Spinning, weaving and finishing of textiles 2,756,974 9,672,732 3,053,057 35,462,068 35,589 163,994 1,288,405 49,856,009 51,144,414
139 Manufacture of other textiles 13,882,465 32,210,430 2,152,228 58,567,715 412,514 24,479,532 29,133,263 102,571,621 131,704,884
141
Manufacture of wearing apparel, except fur
apparel 147,897 18,317,908 434,161 17,101,515 15,550 202,154 1,481,082 34,738,103 36,219,185
142 Manufacture of articles of fur - - 350 - - - 200 150 350
143 Manufacture of knitted and crocheted apparel - - - 50,000 - - - 50,000 50,000
151
Tanning and dressing of leather; manufacture of
luggage, handbags, saddlery and harness;
dressing and dyeing of fur 687,370 1,360,337 853,241 10,649,004 37,511 68,958 119,233 13,537,188 13,656,421
152 Manufacture of footwear 200,000 8,601,370 619,427 5,232,588 92,522 52,878 3,804,597 10,994,188 14,798,785
161 Sawmilling and planing of wood 1,030,833 35,479,123 3,052,128 20,411,446 3,279,981 8,191,418 6,828,314 64,616,615 71,444,929
162
Manufacture of products of wood, cork, straw
and plaiting materials 206,524 743,422 1,180,878 5,843,456 35,457 60,055 94,992 7,974,800 8,069,792
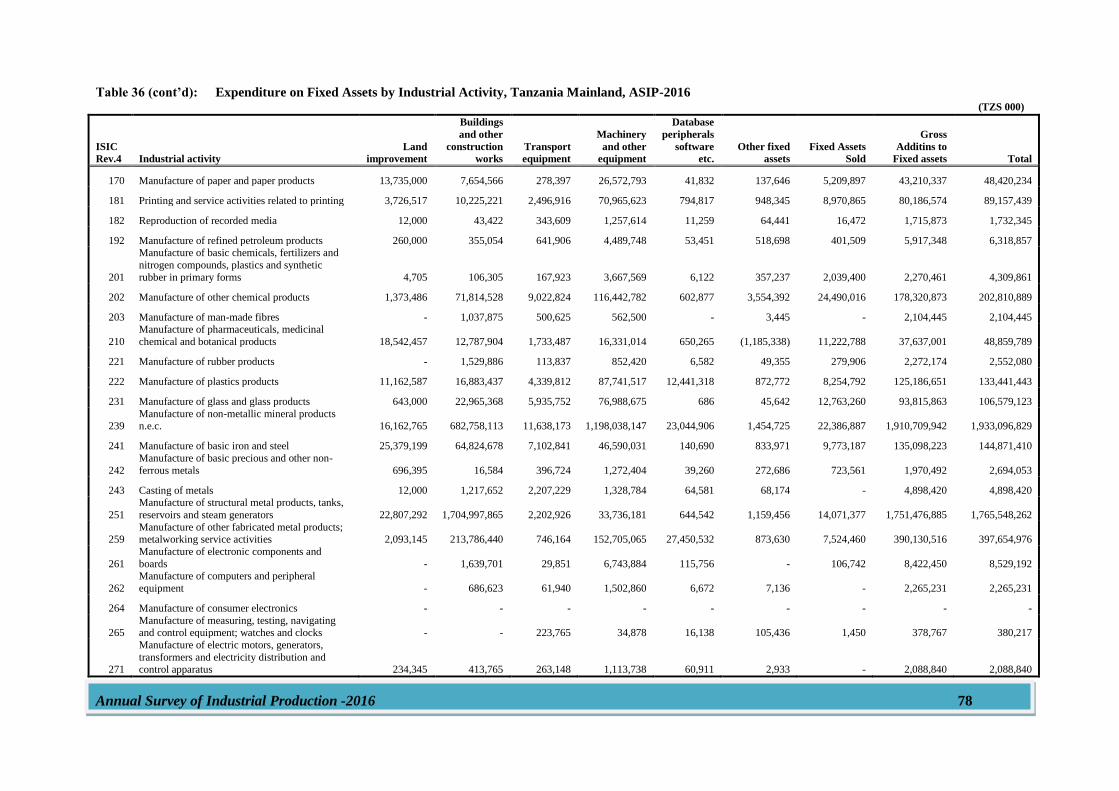
Annual Survey of Industrial Production -2016 78
Table 36 (cont’d): Expenditure on Fixed Assets by Industrial Activity, Tanzania Mainland, ASIP-2016 (TZS 000)
ISIC
Rev.4 Industrial activity
Land
improvement
Buildings
and other
construction
works
Transport
equipment
Machinery
and other
equipment
Database
peripherals
software
etc.
Other fixed
assets
Fixed Assets
Sold
Gross
Additins to
Fixed assets Total
170 Manufacture of paper and paper products 13,735,000 7,654,566 278,397 26,572,793 41,832 137,646 5,209,897 43,210,337 48,420,234
181 Printing and service activities related to printing 3,726,517 10,225,221 2,496,916 70,965,623 794,817 948,345 8,970,865 80,186,574 89,157,439
182 Reproduction of recorded media 12,000 43,422 343,609 1,257,614 11,259 64,441 16,472 1,715,873 1,732,345
192 Manufacture of refined petroleum products 260,000 355,054 641,906 4,489,748 53,451 518,698 401,509 5,917,348 6,318,857
201
Manufacture of basic chemicals, fertilizers and
nitrogen compounds, plastics and synthetic
rubber in primary forms 4,705 106,305 167,923 3,667,569 6,122 357,237 2,039,400 2,270,461 4,309,861
202 Manufacture of other chemical products 1,373,486 71,814,528 9,022,824 116,442,782 602,877 3,554,392 24,490,016 178,320,873 202,810,889
203 Manufacture of man-made fibres - 1,037,875 500,625 562,500 - 3,445 - 2,104,445 2,104,445
210
Manufacture of pharmaceuticals, medicinal
chemical and botanical products 18,542,457 12,787,904 1,733,487 16,331,014 650,265 (1,185,338) 11,222,788 37,637,001 48,859,789
221 Manufacture of rubber products - 1,529,886 113,837 852,420 6,582 49,355 279,906 2,272,174 2,552,080
222 Manufacture of plastics products 11,162,587 16,883,437 4,339,812 87,741,517 12,441,318 872,772 8,254,792 125,186,651 133,441,443
231 Manufacture of glass and glass products 643,000 22,965,368 5,935,752 76,988,675 686 45,642 12,763,260 93,815,863 106,579,123
239 Manufacture of non-metallic mineral products n.e.c. 16,162,765 682,758,113 11,638,173 1,198,038,147 23,044,906 1,454,725 22,386,887 1,910,709,942 1,933,096,829
241 Manufacture of basic iron and steel 25,379,199 64,824,678 7,102,841 46,590,031 140,690 833,971 9,773,187 135,098,223 144,871,410
242
Manufacture of basic precious and other non-
ferrous metals 696,395 16,584 396,724 1,272,404 39,260 272,686 723,561 1,970,492 2,694,053
243 Casting of metals 12,000 1,217,652 2,207,229 1,328,784 64,581 68,174 - 4,898,420 4,898,420
251
Manufacture of structural metal products, tanks,
reservoirs and steam generators 22,807,292 1,704,997,865 2,202,926 33,736,181 644,542 1,159,456 14,071,377 1,751,476,885 1,765,548,262
259 Manufacture of other fabricated metal products; metalworking service activities 2,093,145 213,786,440 746,164 152,705,065 27,450,532 873,630 7,524,460 390,130,516 397,654,976
261
Manufacture of electronic components and
boards - 1,639,701 29,851 6,743,884 115,756 - 106,742 8,422,450 8,529,192
262
Manufacture of computers and peripheral
equipment - 686,623 61,940 1,502,860 6,672 7,136 - 2,265,231 2,265,231
264 Manufacture of consumer electronics - - - - - - - - -
265 Manufacture of measuring, testing, navigating and control equipment; watches and clocks - - 223,765 34,878 16,138 105,436 1,450 378,767 380,217
271
Manufacture of electric motors, generators,
transformers and electricity distribution and control apparatus 234,345 413,765 263,148 1,113,738 60,911 2,933 - 2,088,840 2,088,840
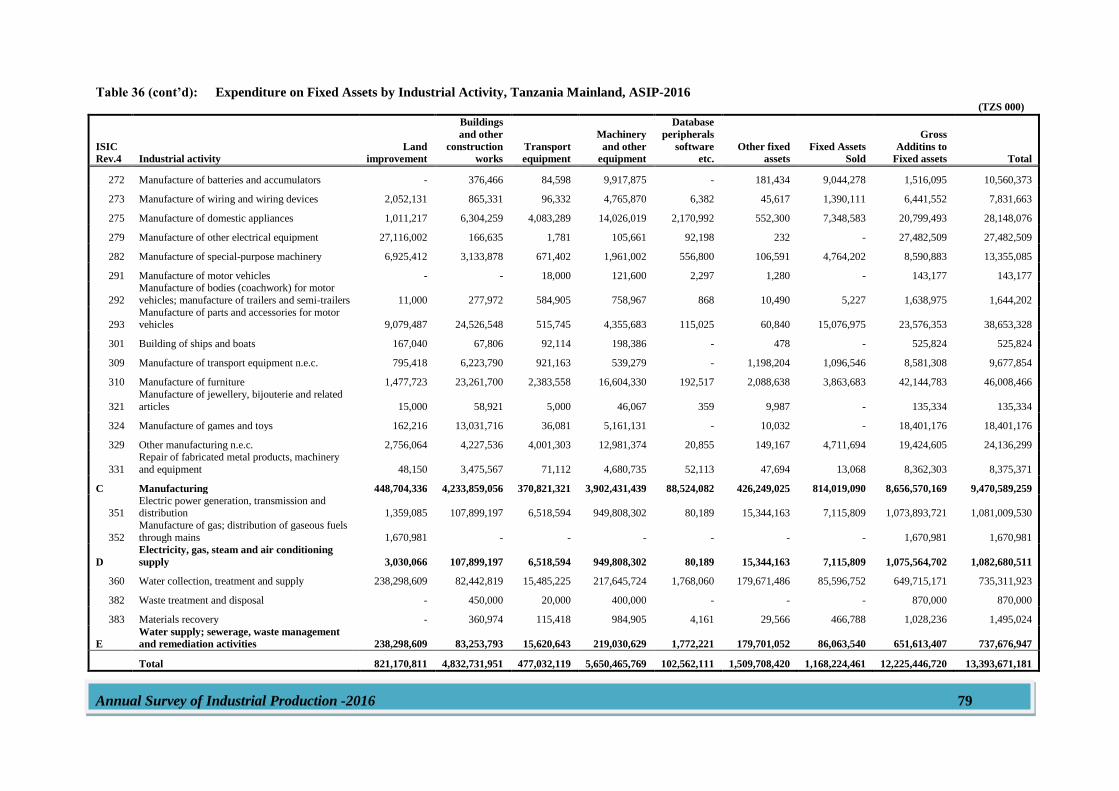
Annual Survey of Industrial Production -2016 79
Table 36 (cont’d): Expenditure on Fixed Assets by Industrial Activity, Tanzania Mainland, ASIP-2016 (TZS 000)
ISIC
Rev.4 Industrial activity
Land
improvement
Buildings
and other
construction
works
Transport
equipment
Machinery
and other
equipment
Database
peripherals
software
etc.
Other fixed
assets
Fixed Assets
Sold
Gross
Additins to
Fixed assets Total
272 Manufacture of batteries and accumulators - 376,466 84,598 9,917,875 - 181,434 9,044,278 1,516,095 10,560,373
273 Manufacture of wiring and wiring devices 2,052,131 865,331 96,332 4,765,870 6,382 45,617 1,390,111 6,441,552 7,831,663
275 Manufacture of domestic appliances 1,011,217 6,304,259 4,083,289 14,026,019 2,170,992 552,300 7,348,583 20,799,493 28,148,076
279 Manufacture of other electrical equipment 27,116,002 166,635 1,781 105,661 92,198 232 - 27,482,509 27,482,509
282 Manufacture of special-purpose machinery 6,925,412 3,133,878 671,402 1,961,002 556,800 106,591 4,764,202 8,590,883 13,355,085
291 Manufacture of motor vehicles - - 18,000 121,600 2,297 1,280 - 143,177 143,177
292
Manufacture of bodies (coachwork) for motor
vehicles; manufacture of trailers and semi-trailers 11,000 277,972 584,905 758,967 868 10,490 5,227 1,638,975 1,644,202
293 Manufacture of parts and accessories for motor vehicles 9,079,487 24,526,548 515,745 4,355,683 115,025 60,840 15,076,975 23,576,353 38,653,328
301 Building of ships and boats 167,040 67,806 92,114 198,386 - 478 - 525,824 525,824
309 Manufacture of transport equipment n.e.c. 795,418 6,223,790 921,163 539,279 - 1,198,204 1,096,546 8,581,308 9,677,854
310 Manufacture of furniture 1,477,723 23,261,700 2,383,558 16,604,330 192,517 2,088,638 3,863,683 42,144,783 46,008,466
321
Manufacture of jewellery, bijouterie and related
articles 15,000 58,921 5,000 46,067 359 9,987 - 135,334 135,334
324 Manufacture of games and toys 162,216 13,031,716 36,081 5,161,131 - 10,032 - 18,401,176 18,401,176
329 Other manufacturing n.e.c. 2,756,064 4,227,536 4,001,303 12,981,374 20,855 149,167 4,711,694 19,424,605 24,136,299
331
Repair of fabricated metal products, machinery
and equipment 48,150 3,475,567 71,112 4,680,735 52,113 47,694 13,068 8,362,303 8,375,371
C Manufacturing 448,704,336 4,233,859,056 370,821,321 3,902,431,439 88,524,082 426,249,025 814,019,090 8,656,570,169 9,470,589,259
351
Electric power generation, transmission and
distribution 1,359,085 107,899,197 6,518,594 949,808,302 80,189 15,344,163 7,115,809 1,073,893,721 1,081,009,530
352
Manufacture of gas; distribution of gaseous fuels
through mains 1,670,981 - - - - - - 1,670,981 1,670,981
D
Electricity, gas, steam and air conditioning
supply 3,030,066 107,899,197 6,518,594 949,808,302 80,189 15,344,163 7,115,809 1,075,564,702 1,082,680,511
360 Water collection, treatment and supply 238,298,609 82,442,819 15,485,225 217,645,724 1,768,060 179,671,486 85,596,752 649,715,171 735,311,923
382 Waste treatment and disposal - 450,000 20,000 400,000 - - - 870,000 870,000
383 Materials recovery - 360,974 115,418 984,905 4,161 29,566 466,788 1,028,236 1,495,024
E
Water supply; sewerage, waste management
and remediation activities 238,298,609 83,253,793 15,620,643 219,030,629 1,772,221 179,701,052 86,063,540 651,613,407 737,676,947
Total 821,170,811 4,832,731,951 477,032,119 5,650,465,769 102,562,111 1,509,708,420 1,168,224,461 12,225,446,720 13,393,671,181
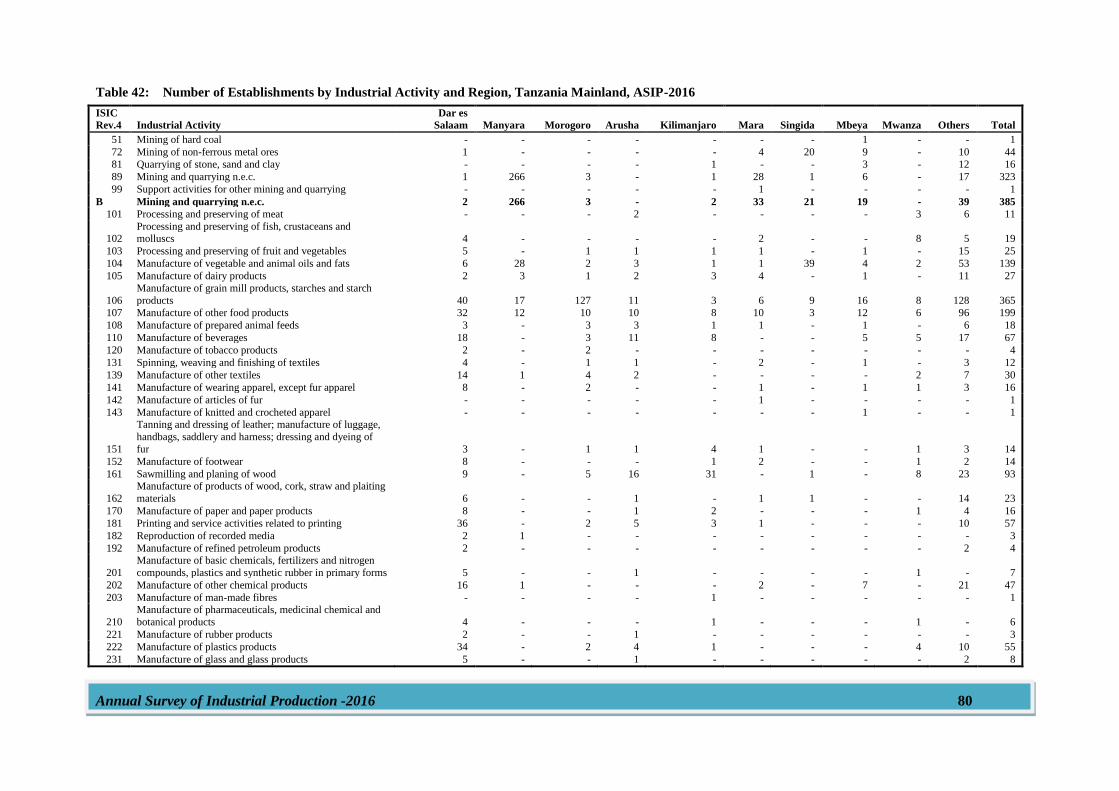
Annual Survey of Industrial Production -2016 80
Table 42: Number of Establishments by Industrial Activity and Region, Tanzania Mainland, ASIP-2016
ISIC
Rev.4 Industrial Activity
Dar es
Salaam Manyara Morogoro Arusha Kilimanjaro Mara Singida Mbeya Mwanza Others Total
51 Mining of hard coal - - - - - - - 1 - - 1
72 Mining of non-ferrous metal ores 1 - - - - 4 20 9 - 10 44
81 Quarrying of stone, sand and clay - - - - 1 - - 3 - 12 16
89 Mining and quarrying n.e.c. 1 266 3 - 1 28 1 6 - 17 323
99 Support activities for other mining and quarrying - - - - - 1 - - - - 1
B Mining and quarrying n.e.c. 2 266 3 - 2 33 21 19 - 39 385
101 Processing and preserving of meat - - - 2 - - - - 3 6 11
102 Processing and preserving of fish, crustaceans and molluscs 4 - - - - 2 - - 8 5 19
103 Processing and preserving of fruit and vegetables 5 - 1 1 1 1 - 1 - 15 25
104 Manufacture of vegetable and animal oils and fats 6 28 2 3 1 1 39 4 2 53 139
105 Manufacture of dairy products 2 3 1 2 3 4 - 1 - 11 27
106
Manufacture of grain mill products, starches and starch
products 40 17 127 11 3 6 9 16 8 128 365
107 Manufacture of other food products 32 12 10 10 8 10 3 12 6 96 199
108 Manufacture of prepared animal feeds 3 - 3 3 1 1 - 1 - 6 18
110 Manufacture of beverages 18 - 3 11 8 - - 5 5 17 67
120 Manufacture of tobacco products 2 - 2 - - - - - - - 4
131 Spinning, weaving and finishing of textiles 4 - 1 1 - 2 - 1 - 3 12
139 Manufacture of other textiles 14 1 4 2 - - - - 2 7 30
141 Manufacture of wearing apparel, except fur apparel 8 - 2 - - 1 - 1 1 3 16
142 Manufacture of articles of fur - - - - - 1 - - - - 1
143 Manufacture of knitted and crocheted apparel - - - - - - - 1 - - 1
151
Tanning and dressing of leather; manufacture of luggage,
handbags, saddlery and harness; dressing and dyeing of
fur 3 - 1 1 4 1 - - 1 3 14
152 Manufacture of footwear 8 - - - 1 2 - - 1 2 14
161 Sawmilling and planing of wood 9 - 5 16 31 - 1 - 8 23 93
162
Manufacture of products of wood, cork, straw and plaiting
materials 6 - - 1 - 1 1 - - 14 23
170 Manufacture of paper and paper products 8 - - 1 2 - - - 1 4 16
181 Printing and service activities related to printing 36 - 2 5 3 1 - - - 10 57
182 Reproduction of recorded media 2 1 - - - - - - - - 3
192 Manufacture of refined petroleum products 2 - - - - - - - - 2 4
201
Manufacture of basic chemicals, fertilizers and nitrogen
compounds, plastics and synthetic rubber in primary forms 5 - - 1 - - - - 1 - 7
202 Manufacture of other chemical products 16 1 - - - 2 - 7 - 21 47
203 Manufacture of man-made fibres - - - - 1 - - - - - 1
210
Manufacture of pharmaceuticals, medicinal chemical and
botanical products 4 - - - 1 - - - 1 - 6
221 Manufacture of rubber products 2 - - 1 - - - - - - 3
222 Manufacture of plastics products 34 - 2 4 1 - - - 4 10 55
231 Manufacture of glass and glass products 5 - - 1 - - - - - 2 8
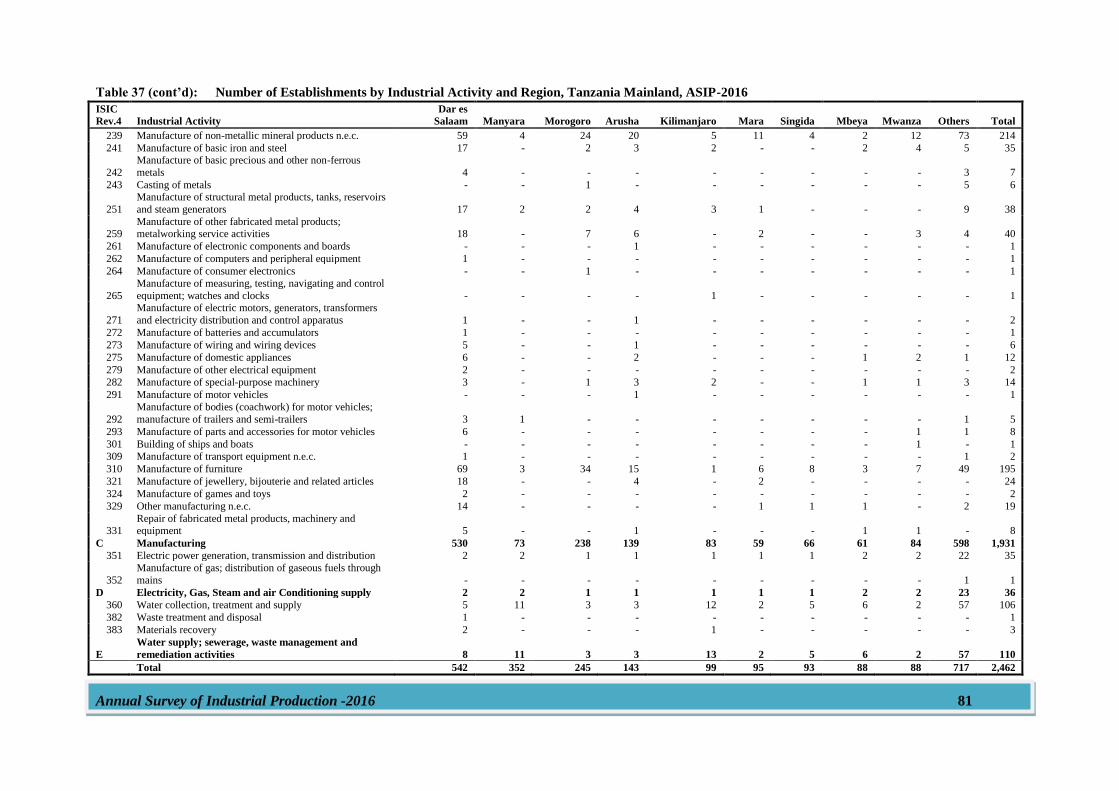
Annual Survey of Industrial Production -2016 81
Table 37 (cont’d): Number of Establishments by Industrial Activity and Region, Tanzania Mainland, ASIP-2016 ISIC
Rev.4 Industrial Activity
Dar es
Salaam Manyara Morogoro Arusha Kilimanjaro Mara Singida Mbeya Mwanza Others Total
239 Manufacture of non-metallic mineral products n.e.c. 59 4 24 20 5 11 4 2 12 73 214
241 Manufacture of basic iron and steel 17 - 2 3 2 - - 2 4 5 35
242
Manufacture of basic precious and other non-ferrous
metals 4 - - - - - - - - 3 7
243 Casting of metals - - 1 - - - - - - 5 6
251
Manufacture of structural metal products, tanks, reservoirs
and steam generators 17 2 2 4 3 1 - - - 9 38
259 Manufacture of other fabricated metal products; metalworking service activities 18 - 7 6 - 2 - - 3 4 40
261 Manufacture of electronic components and boards - - - 1 - - - - - - 1
262 Manufacture of computers and peripheral equipment 1 - - - - - - - - - 1
264 Manufacture of consumer electronics - - 1 - - - - - - - 1
265
Manufacture of measuring, testing, navigating and control
equipment; watches and clocks - - - - 1 - - - - - 1
271
Manufacture of electric motors, generators, transformers
and electricity distribution and control apparatus 1 - - 1 - - - - - - 2
272 Manufacture of batteries and accumulators 1 - - - - - - - - - 1
273 Manufacture of wiring and wiring devices 5 - - 1 - - - - - - 6
275 Manufacture of domestic appliances 6 - - 2 - - - 1 2 1 12
279 Manufacture of other electrical equipment 2 - - - - - - - - - 2
282 Manufacture of special-purpose machinery 3 - 1 3 2 - - 1 1 3 14
291 Manufacture of motor vehicles - - - 1 - - - - - - 1
292
Manufacture of bodies (coachwork) for motor vehicles;
manufacture of trailers and semi-trailers 3 1 - - - - - - - 1 5
293 Manufacture of parts and accessories for motor vehicles 6 - - - - - - - 1 1 8
301 Building of ships and boats - - - - - - - - 1 - 1
309 Manufacture of transport equipment n.e.c. 1 - - - - - - - - 1 2
310 Manufacture of furniture 69 3 34 15 1 6 8 3 7 49 195
321 Manufacture of jewellery, bijouterie and related articles 18 - - 4 - 2 - - - - 24
324 Manufacture of games and toys 2 - - - - - - - - - 2
329 Other manufacturing n.e.c. 14 - - - - 1 1 1 - 2 19
331 Repair of fabricated metal products, machinery and equipment 5 - - 1 - - - 1 1 - 8
C Manufacturing 530 73 238 139 83 59 66 61 84 598 1,931
351 Electric power generation, transmission and distribution 2 2 1 1 1 1 1 2 2 22 35
352
Manufacture of gas; distribution of gaseous fuels through
mains - - - - - - - - - 1 1
D Electricity, Gas, Steam and air Conditioning supply 2 2 1 1 1 1 1 2 2 23 36
360 Water collection, treatment and supply 5 11 3 3 12 2 5 6 2 57 106
382 Waste treatment and disposal 1 - - - - - - - - - 1
383 Materials recovery 2 - - - 1 - - - - - 3
E
Water supply; sewerage, waste management and
remediation activities 8 11 3 3 13 2 5 6 2 57 110
Total 542 352 245 143 99 95 93 88 88 717 2,462
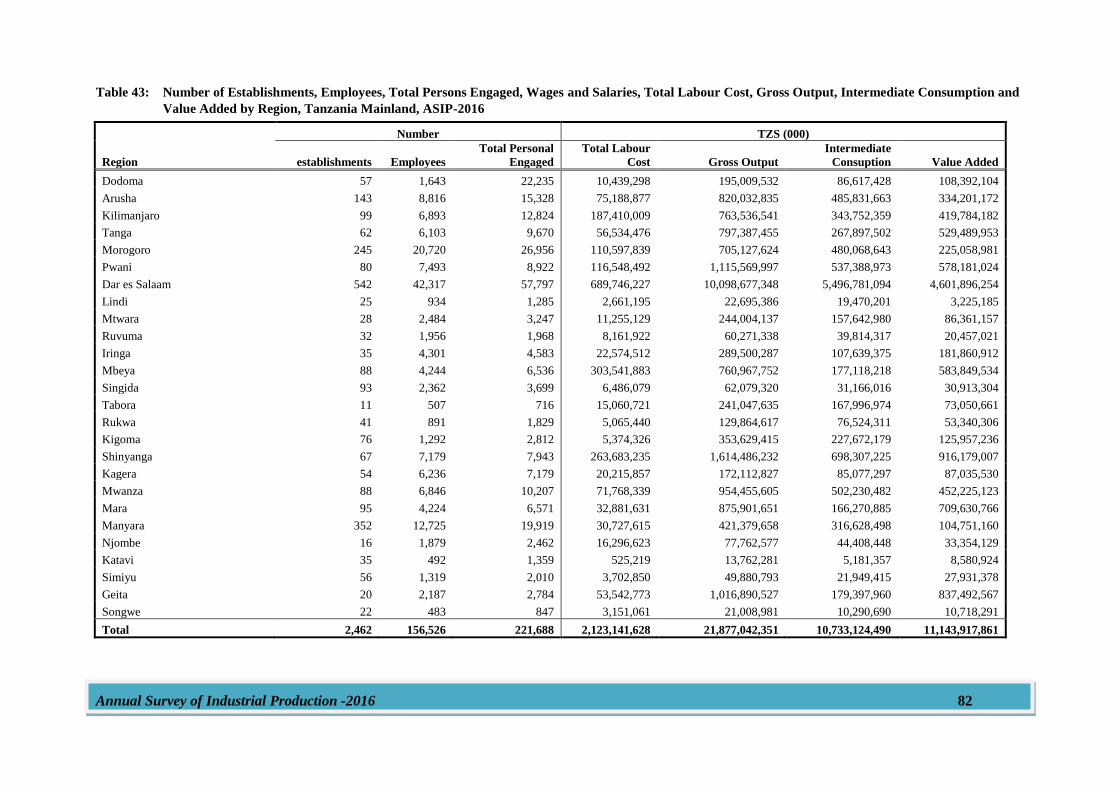
Annual Survey of Industrial Production -2016 82
Table 43: Number of Establishments, Employees, Total Persons Engaged, Wages and Salaries, Total Labour Cost, Gross Output, Intermediate Consumption and
Value Added by Region, Tanzania Mainland, ASIP-2016
Region
Number TZS (000)
establishments Employees
Total Personal
Engaged
Total Labour
Cost Gross Output
Intermediate
Consuption Value Added
Dodoma 57 1,643 22,235 10,439,298 195,009,532 86,617,428 108,392,104
Arusha 143 8,816 15,328 75,188,877 820,032,835 485,831,663 334,201,172
Kilimanjaro 99 6,893 12,824 187,410,009 763,536,541 343,752,359 419,784,182
Tanga 62 6,103 9,670 56,534,476 797,387,455 267,897,502 529,489,953
Morogoro 245 20,720 26,956 110,597,839 705,127,624 480,068,643 225,058,981
Pwani 80 7,493 8,922 116,548,492 1,115,569,997 537,388,973 578,181,024
Dar es Salaam 542 42,317 57,797 689,746,227 10,098,677,348 5,496,781,094 4,601,896,254
Lindi 25 934 1,285 2,661,195 22,695,386 19,470,201 3,225,185
Mtwara 28 2,484 3,247 11,255,129 244,004,137 157,642,980 86,361,157
Ruvuma 32 1,956 1,968 8,161,922 60,271,338 39,814,317 20,457,021
Iringa 35 4,301 4,583 22,574,512 289,500,287 107,639,375 181,860,912
Mbeya 88 4,244 6,536 303,541,883 760,967,752 177,118,218 583,849,534
Singida 93 2,362 3,699 6,486,079 62,079,320 31,166,016 30,913,304
Tabora 11 507 716 15,060,721 241,047,635 167,996,974 73,050,661
Rukwa 41 891 1,829 5,065,440 129,864,617 76,524,311 53,340,306
Kigoma 76 1,292 2,812 5,374,326 353,629,415 227,672,179 125,957,236
Shinyanga 67 7,179 7,943 263,683,235 1,614,486,232 698,307,225 916,179,007
Kagera 54 6,236 7,179 20,215,857 172,112,827 85,077,297 87,035,530
Mwanza 88 6,846 10,207 71,768,339 954,455,605 502,230,482 452,225,123
Mara 95 4,224 6,571 32,881,631 875,901,651 166,270,885 709,630,766
Manyara 352 12,725 19,919 30,727,615 421,379,658 316,628,498 104,751,160
Njombe 16 1,879 2,462 16,296,623 77,762,577 44,408,448 33,354,129
Katavi 35 492 1,359 525,219 13,762,281 5,181,357 8,580,924
Simiyu 56 1,319 2,010 3,702,850 49,880,793 21,949,415 27,931,378
Geita 20 2,187 2,784 53,542,773 1,016,890,527 179,397,960 837,492,567
Songwe 22 483 847 3,151,061 21,008,981 10,290,690 10,718,291
Total 2,462 156,526 221,688 2,123,141,628 21,877,042,351 10,733,124,490 11,143,917,861
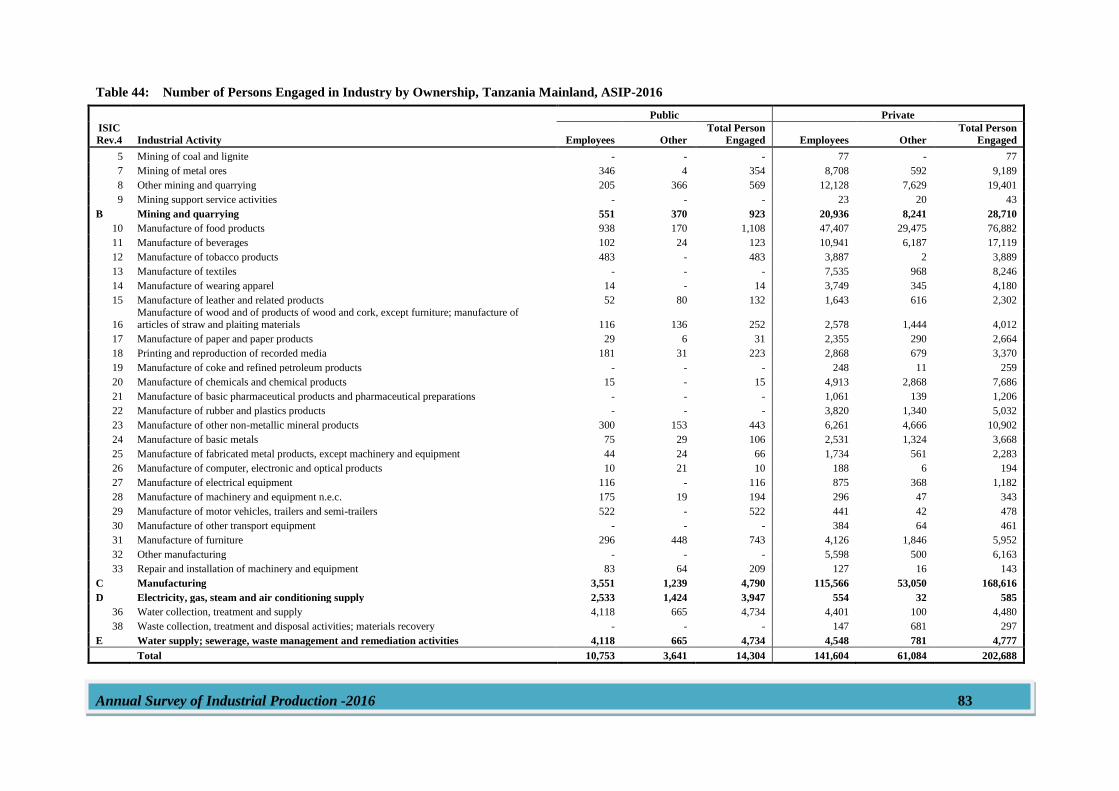
Annual Survey of Industrial Production -2016 83
Table 44: Number of Persons Engaged in Industry by Ownership, Tanzania Mainland, ASIP-2016
ISIC
Rev.4 Industrial Activity
Public Private
Employees Other
Total Person
Engaged Employees Other
Total Person
Engaged
5 Mining of coal and lignite - - - 77 - 77
7 Mining of metal ores 346 4 354 8,708 592 9,189
8 Other mining and quarrying 205 366 569 12,128 7,629 19,401
9 Mining support service activities - - - 23 20 43
B Mining and quarrying 551 370 923 20,936 8,241 28,710
10 Manufacture of food products 938 170 1,108 47,407 29,475 76,882
11 Manufacture of beverages 102 24 123 10,941 6,187 17,119
12 Manufacture of tobacco products 483 - 483 3,887 2 3,889
13 Manufacture of textiles - - - 7,535 968 8,246
14 Manufacture of wearing apparel 14 - 14 3,749 345 4,180
15 Manufacture of leather and related products 52 80 132 1,643 616 2,302
16 Manufacture of wood and of products of wood and cork, except furniture; manufacture of articles of straw and plaiting materials 116 136 252 2,578 1,444 4,012
17 Manufacture of paper and paper products 29 6 31 2,355 290 2,664
18 Printing and reproduction of recorded media 181 31 223 2,868 679 3,370
19 Manufacture of coke and refined petroleum products - - - 248 11 259
20 Manufacture of chemicals and chemical products 15 - 15 4,913 2,868 7,686
21 Manufacture of basic pharmaceutical products and pharmaceutical preparations - - - 1,061 139 1,206
22 Manufacture of rubber and plastics products - - - 3,820 1,340 5,032
23 Manufacture of other non-metallic mineral products 300 153 443 6,261 4,666 10,902
24 Manufacture of basic metals 75 29 106 2,531 1,324 3,668
25 Manufacture of fabricated metal products, except machinery and equipment 44 24 66 1,734 561 2,283
26 Manufacture of computer, electronic and optical products 10 21 10 188 6 194
27 Manufacture of electrical equipment 116 - 116 875 368 1,182
28 Manufacture of machinery and equipment n.e.c. 175 19 194 296 47 343
29 Manufacture of motor vehicles, trailers and semi-trailers 522 - 522 441 42 478
30 Manufacture of other transport equipment - - - 384 64 461
31 Manufacture of furniture 296 448 743 4,126 1,846 5,952
32 Other manufacturing - - - 5,598 500 6,163
33 Repair and installation of machinery and equipment 83 64 209 127 16 143
C Manufacturing 3,551 1,239 4,790 115,566 53,050 168,616
D Electricity, gas, steam and air conditioning supply 2,533 1,424 3,947 554 32 585
36 Water collection, treatment and supply 4,118 665 4,734 4,401 100 4,480
38 Waste collection, treatment and disposal activities; materials recovery - - - 147 681 297
E Water supply; sewerage, waste management and remediation activities 4,118 665 4,734 4,548 781 4,777
Total 10,753 3,641 14,304 141,604 61,084 202,688
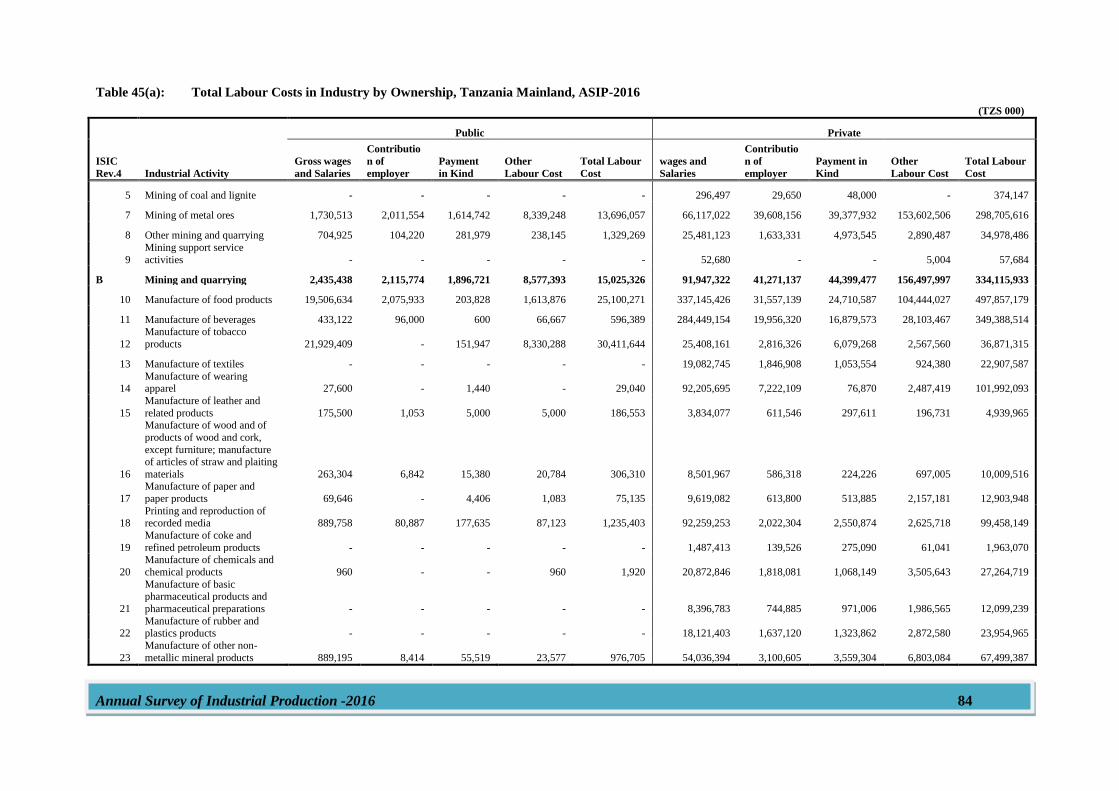
Annual Survey of Industrial Production -2016 84
Table 45(a): Total Labour Costs in Industry by Ownership, Tanzania Mainland, ASIP-2016
(TZS 000)
ISIC
Rev.4 Industrial Activity
Public Private
Gross wages
and Salaries
Contributio
n of
employer
Payment
in Kind
Other
Labour Cost
Total Labour
Cost
wages and
Salaries
Contributio
n of
employer
Payment in
Kind
Other
Labour Cost
Total Labour
Cost
5 Mining of coal and lignite - - - - - 296,497 29,650 48,000 - 374,147
7 Mining of metal ores 1,730,513 2,011,554 1,614,742 8,339,248 13,696,057 66,117,022 39,608,156 39,377,932 153,602,506 298,705,616
8 Other mining and quarrying 704,925 104,220 281,979 238,145 1,329,269 25,481,123 1,633,331 4,973,545 2,890,487 34,978,486
9
Mining support service
activities - - - - - 52,680 - - 5,004 57,684
B Mining and quarrying 2,435,438 2,115,774 1,896,721 8,577,393 15,025,326 91,947,322 41,271,137 44,399,477 156,497,997 334,115,933
10 Manufacture of food products 19,506,634 2,075,933 203,828 1,613,876 25,100,271 337,145,426 31,557,139 24,710,587 104,444,027 497,857,179
11 Manufacture of beverages 433,122 96,000 600 66,667 596,389 284,449,154 19,956,320 16,879,573 28,103,467 349,388,514
12
Manufacture of tobacco
products 21,929,409 - 151,947 8,330,288 30,411,644 25,408,161 2,816,326 6,079,268 2,567,560 36,871,315
13 Manufacture of textiles - - - - - 19,082,745 1,846,908 1,053,554 924,380 22,907,587
14 Manufacture of wearing apparel 27,600 - 1,440 - 29,040 92,205,695 7,222,109 76,870 2,487,419 101,992,093
15
Manufacture of leather and
related products 175,500 1,053 5,000 5,000 186,553 3,834,077 611,546 297,611 196,731 4,939,965
16
Manufacture of wood and of
products of wood and cork,
except furniture; manufacture of articles of straw and plaiting
materials 263,304 6,842 15,380 20,784 306,310 8,501,967 586,318 224,226 697,005 10,009,516
17
Manufacture of paper and
paper products 69,646 - 4,406 1,083 75,135 9,619,082 613,800 513,885 2,157,181 12,903,948
18 Printing and reproduction of recorded media 889,758 80,887 177,635 87,123 1,235,403 92,259,253 2,022,304 2,550,874 2,625,718 99,458,149
19
Manufacture of coke and
refined petroleum products - - - - - 1,487,413 139,526 275,090 61,041 1,963,070
20
Manufacture of chemicals and
chemical products 960 - - 960 1,920 20,872,846 1,818,081 1,068,149 3,505,643 27,264,719
21
Manufacture of basic pharmaceutical products and
pharmaceutical preparations - - - - - 8,396,783 744,885 971,006 1,986,565 12,099,239
22 Manufacture of rubber and plastics products - - - - - 18,121,403 1,637,120 1,323,862 2,872,580 23,954,965
23
Manufacture of other non-
metallic mineral products 889,195 8,414 55,519 23,577 976,705 54,036,394 3,100,605 3,559,304 6,803,084 67,499,387
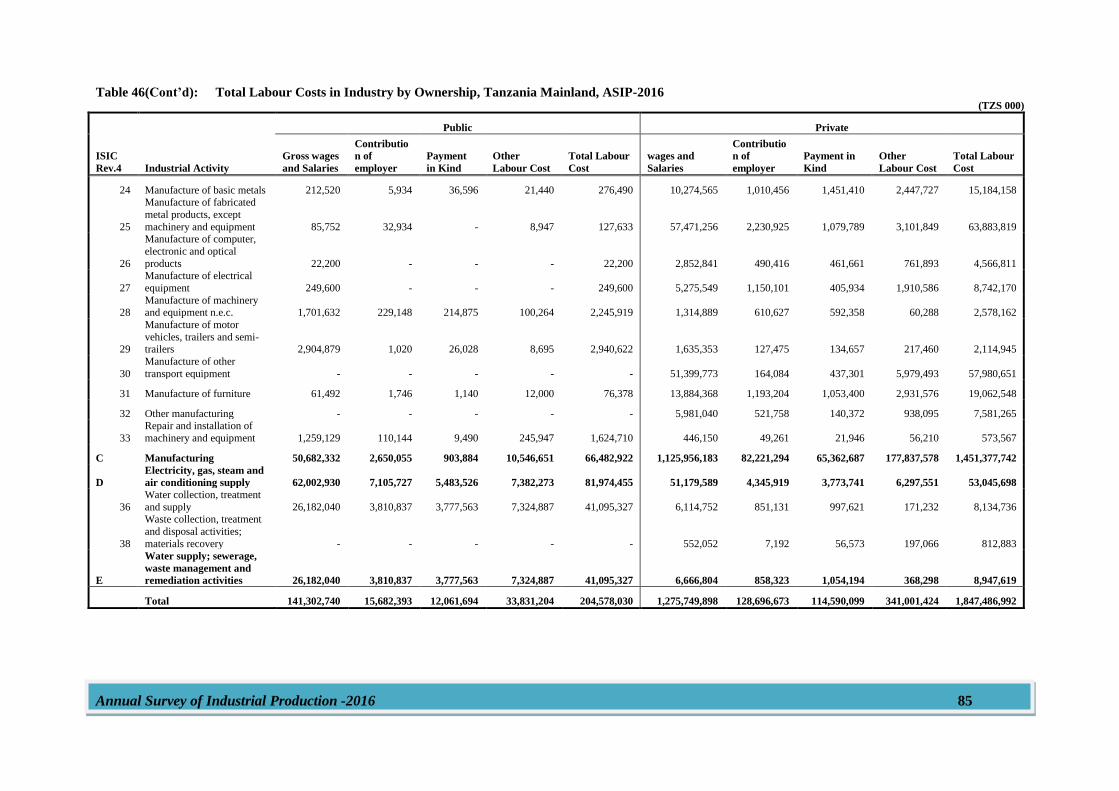
Annual Survey of Industrial Production -2016 85
Table 46(Cont’d): Total Labour Costs in Industry by Ownership, Tanzania Mainland, ASIP-2016 (TZS 000)
ISIC
Rev.4 Industrial Activity
Public Private
Gross wages
and Salaries
Contributio
n of
employer
Payment
in Kind
Other
Labour Cost
Total Labour
Cost
wages and
Salaries
Contributio
n of
employer
Payment in
Kind
Other
Labour Cost
Total Labour
Cost
24 Manufacture of basic metals 212,520 5,934 36,596 21,440 276,490 10,274,565 1,010,456 1,451,410 2,447,727 15,184,158
25
Manufacture of fabricated
metal products, except
machinery and equipment 85,752 32,934 - 8,947 127,633 57,471,256 2,230,925 1,079,789 3,101,849 63,883,819
26
Manufacture of computer,
electronic and optical
products 22,200 - - - 22,200 2,852,841 490,416 461,661 761,893 4,566,811
27
Manufacture of electrical
equipment 249,600 - - - 249,600 5,275,549 1,150,101 405,934 1,910,586 8,742,170
28 Manufacture of machinery and equipment n.e.c. 1,701,632 229,148 214,875 100,264 2,245,919 1,314,889 610,627 592,358 60,288 2,578,162
29
Manufacture of motor
vehicles, trailers and semi-trailers 2,904,879 1,020 26,028 8,695 2,940,622 1,635,353 127,475 134,657 217,460 2,114,945
30
Manufacture of other
transport equipment - - - - - 51,399,773 164,084 437,301 5,979,493 57,980,651
31 Manufacture of furniture 61,492 1,746 1,140 12,000 76,378 13,884,368 1,193,204 1,053,400 2,931,576 19,062,548
32 Other manufacturing - - - - - 5,981,040 521,758 140,372 938,095 7,581,265
33
Repair and installation of
machinery and equipment 1,259,129 110,144 9,490 245,947 1,624,710 446,150 49,261 21,946 56,210 573,567
C Manufacturing 50,682,332 2,650,055 903,884 10,546,651 66,482,922 1,125,956,183 82,221,294 65,362,687 177,837,578 1,451,377,742
D
Electricity, gas, steam and
air conditioning supply 62,002,930 7,105,727 5,483,526 7,382,273 81,974,455 51,179,589 4,345,919 3,773,741 6,297,551 53,045,698
36
Water collection, treatment
and supply 26,182,040 3,810,837 3,777,563 7,324,887 41,095,327 6,114,752 851,131 997,621 171,232 8,134,736
38
Waste collection, treatment
and disposal activities;
materials recovery - - - - - 552,052 7,192 56,573 197,066 812,883
E
Water supply; sewerage,
waste management and
remediation activities 26,182,040 3,810,837 3,777,563 7,324,887 41,095,327 6,666,804 858,323 1,054,194 368,298 8,947,619
Total 141,302,740 15,682,393 12,061,694 33,831,204 204,578,030 1,275,749,898 128,696,673 114,590,099 341,001,424 1,847,486,992
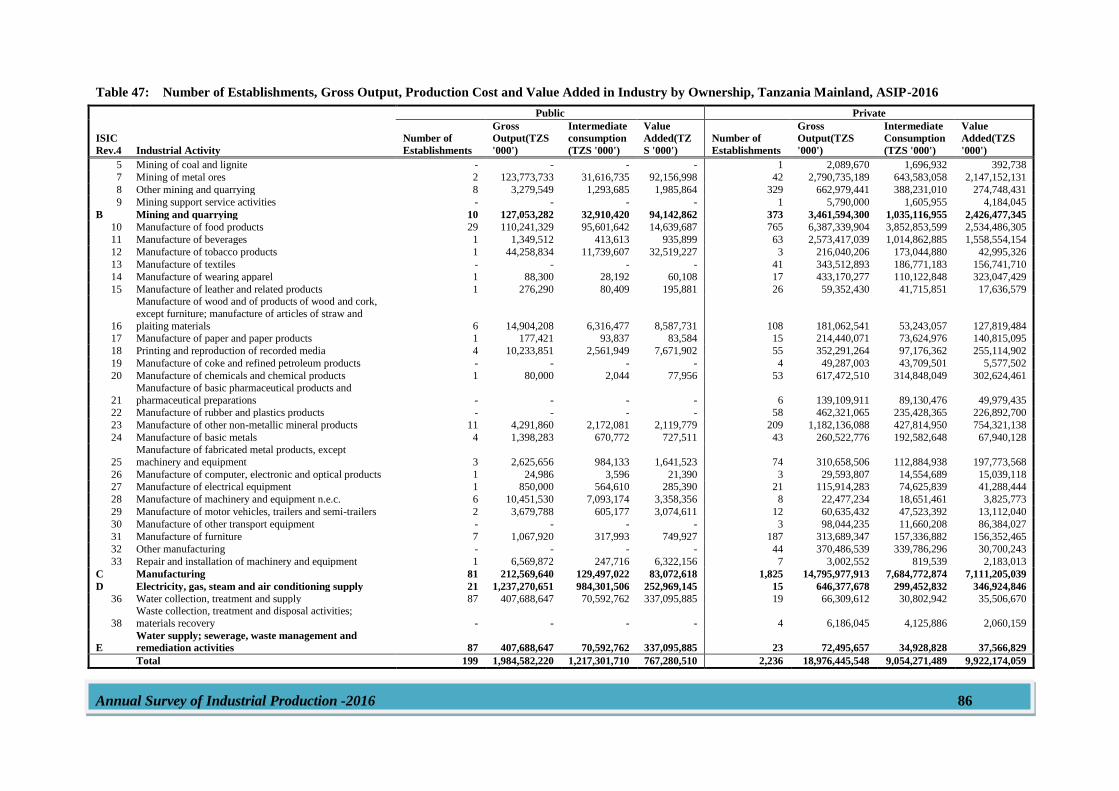
Annual Survey of Industrial Production -2016 86
Table 47: Number of Establishments, Gross Output, Production Cost and Value Added in Industry by Ownership, Tanzania Mainland, ASIP-2016
ISIC
Rev.4 Industrial Activity
Public Private
Number of
Establishments
Gross
Output(TZS
'000')
Intermediate
consumption
(TZS '000')
Value
Added(TZ
S '000')
Number of
Establishments
Gross
Output(TZS
'000')
Intermediate
Consumption
(TZS '000')
Value
Added(TZS
'000')
5 Mining of coal and lignite - - - - 1 2,089,670 1,696,932 392,738
7 Mining of metal ores 2 123,773,733 31,616,735 92,156,998 42 2,790,735,189 643,583,058 2,147,152,131
8 Other mining and quarrying 8 3,279,549 1,293,685 1,985,864 329 662,979,441 388,231,010 274,748,431
9 Mining support service activities - - - - 1 5,790,000 1,605,955 4,184,045
B Mining and quarrying 10 127,053,282 32,910,420 94,142,862 373 3,461,594,300 1,035,116,955 2,426,477,345
10 Manufacture of food products 29 110,241,329 95,601,642 14,639,687 765 6,387,339,904 3,852,853,599 2,534,486,305
11 Manufacture of beverages 1 1,349,512 413,613 935,899 63 2,573,417,039 1,014,862,885 1,558,554,154
12 Manufacture of tobacco products 1 44,258,834 11,739,607 32,519,227 3 216,040,206 173,044,880 42,995,326
13 Manufacture of textiles - - - - 41 343,512,893 186,771,183 156,741,710
14 Manufacture of wearing apparel 1 88,300 28,192 60,108 17 433,170,277 110,122,848 323,047,429
15 Manufacture of leather and related products 1 276,290 80,409 195,881 26 59,352,430 41,715,851 17,636,579
16
Manufacture of wood and of products of wood and cork,
except furniture; manufacture of articles of straw and
plaiting materials 6 14,904,208 6,316,477 8,587,731 108 181,062,541 53,243,057 127,819,484
17 Manufacture of paper and paper products 1 177,421 93,837 83,584 15 214,440,071 73,624,976 140,815,095
18 Printing and reproduction of recorded media 4 10,233,851 2,561,949 7,671,902 55 352,291,264 97,176,362 255,114,902
19 Manufacture of coke and refined petroleum products - - - - 4 49,287,003 43,709,501 5,577,502
20 Manufacture of chemicals and chemical products 1 80,000 2,044 77,956 53 617,472,510 314,848,049 302,624,461
21
Manufacture of basic pharmaceutical products and
pharmaceutical preparations - - - - 6 139,109,911 89,130,476 49,979,435
22 Manufacture of rubber and plastics products - - - - 58 462,321,065 235,428,365 226,892,700
23 Manufacture of other non-metallic mineral products 11 4,291,860 2,172,081 2,119,779 209 1,182,136,088 427,814,950 754,321,138
24 Manufacture of basic metals 4 1,398,283 670,772 727,511 43 260,522,776 192,582,648 67,940,128
25
Manufacture of fabricated metal products, except
machinery and equipment 3 2,625,656 984,133 1,641,523 74 310,658,506 112,884,938 197,773,568
26 Manufacture of computer, electronic and optical products 1 24,986 3,596 21,390 3 29,593,807 14,554,689 15,039,118
27 Manufacture of electrical equipment 1 850,000 564,610 285,390 21 115,914,283 74,625,839 41,288,444
28 Manufacture of machinery and equipment n.e.c. 6 10,451,530 7,093,174 3,358,356 8 22,477,234 18,651,461 3,825,773
29 Manufacture of motor vehicles, trailers and semi-trailers 2 3,679,788 605,177 3,074,611 12 60,635,432 47,523,392 13,112,040
30 Manufacture of other transport equipment - - - - 3 98,044,235 11,660,208 86,384,027
31 Manufacture of furniture 7 1,067,920 317,993 749,927 187 313,689,347 157,336,882 156,352,465
32 Other manufacturing - - - - 44 370,486,539 339,786,296 30,700,243
33 Repair and installation of machinery and equipment 1 6,569,872 247,716 6,322,156 7 3,002,552 819,539 2,183,013
C Manufacturing 81 212,569,640 129,497,022 83,072,618 1,825 14,795,977,913 7,684,772,874 7,111,205,039
D Electricity, gas, steam and air conditioning supply 21 1,237,270,651 984,301,506 252,969,145 15 646,377,678 299,452,832 346,924,846
36 Water collection, treatment and supply 87 407,688,647 70,592,762 337,095,885 19 66,309,612 30,802,942 35,506,670
38
Waste collection, treatment and disposal activities;
materials recovery - - - - 4 6,186,045 4,125,886 2,060,159
E
Water supply; sewerage, waste management and
remediation activities 87 407,688,647 70,592,762 337,095,885 23 72,495,657 34,928,828 37,566,829
Total 199 1,984,582,220 1,217,301,710 767,280,510 2,236 18,976,445,548 9,054,271,489 9,922,174,059
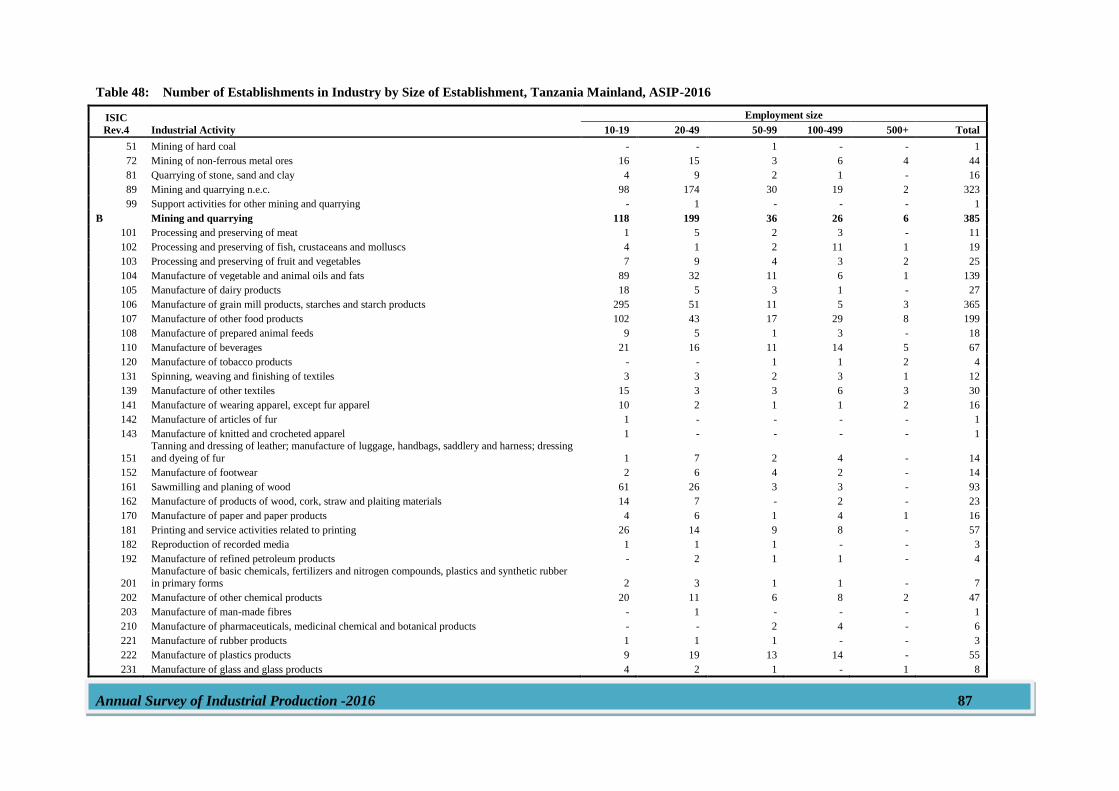
Annual Survey of Industrial Production -2016 87
Table 48: Number of Establishments in Industry by Size of Establishment, Tanzania Mainland, ASIP-2016
ISIC
Rev.4 Industrial Activity
Employment size
10-19 20-49 50-99 100-499 500+ Total
51 Mining of hard coal - - 1 - - 1
72 Mining of non-ferrous metal ores 16 15 3 6 4 44
81 Quarrying of stone, sand and clay 4 9 2 1 - 16
89 Mining and quarrying n.e.c. 98 174 30 19 2 323
99 Support activities for other mining and quarrying - 1 - - - 1
B Mining and quarrying 118 199 36 26 6 385
101 Processing and preserving of meat 1 5 2 3 - 11
102 Processing and preserving of fish, crustaceans and molluscs 4 1 2 11 1 19
103 Processing and preserving of fruit and vegetables 7 9 4 3 2 25
104 Manufacture of vegetable and animal oils and fats 89 32 11 6 1 139
105 Manufacture of dairy products 18 5 3 1 - 27
106 Manufacture of grain mill products, starches and starch products 295 51 11 5 3 365
107 Manufacture of other food products 102 43 17 29 8 199
108 Manufacture of prepared animal feeds 9 5 1 3 - 18
110 Manufacture of beverages 21 16 11 14 5 67
120 Manufacture of tobacco products - - 1 1 2 4
131 Spinning, weaving and finishing of textiles 3 3 2 3 1 12
139 Manufacture of other textiles 15 3 3 6 3 30
141 Manufacture of wearing apparel, except fur apparel 10 2 1 1 2 16
142 Manufacture of articles of fur 1 - - - - 1
143 Manufacture of knitted and crocheted apparel 1 - - - - 1
151
Tanning and dressing of leather; manufacture of luggage, handbags, saddlery and harness; dressing
and dyeing of fur 1 7 2 4 - 14
152 Manufacture of footwear 2 6 4 2 - 14
161 Sawmilling and planing of wood 61 26 3 3 - 93
162 Manufacture of products of wood, cork, straw and plaiting materials 14 7 - 2 - 23
170 Manufacture of paper and paper products 4 6 1 4 1 16
181 Printing and service activities related to printing 26 14 9 8 - 57
182 Reproduction of recorded media 1 1 1 - - 3
192 Manufacture of refined petroleum products - 2 1 1 - 4
201 Manufacture of basic chemicals, fertilizers and nitrogen compounds, plastics and synthetic rubber in primary forms 2 3 1 1 - 7
202 Manufacture of other chemical products 20 11 6 8 2 47
203 Manufacture of man-made fibres - 1 - - - 1
210 Manufacture of pharmaceuticals, medicinal chemical and botanical products - - 2 4 - 6
221 Manufacture of rubber products 1 1 1 - - 3
222 Manufacture of plastics products 9 19 13 14 - 55
231 Manufacture of glass and glass products 4 2 1 - 1 8
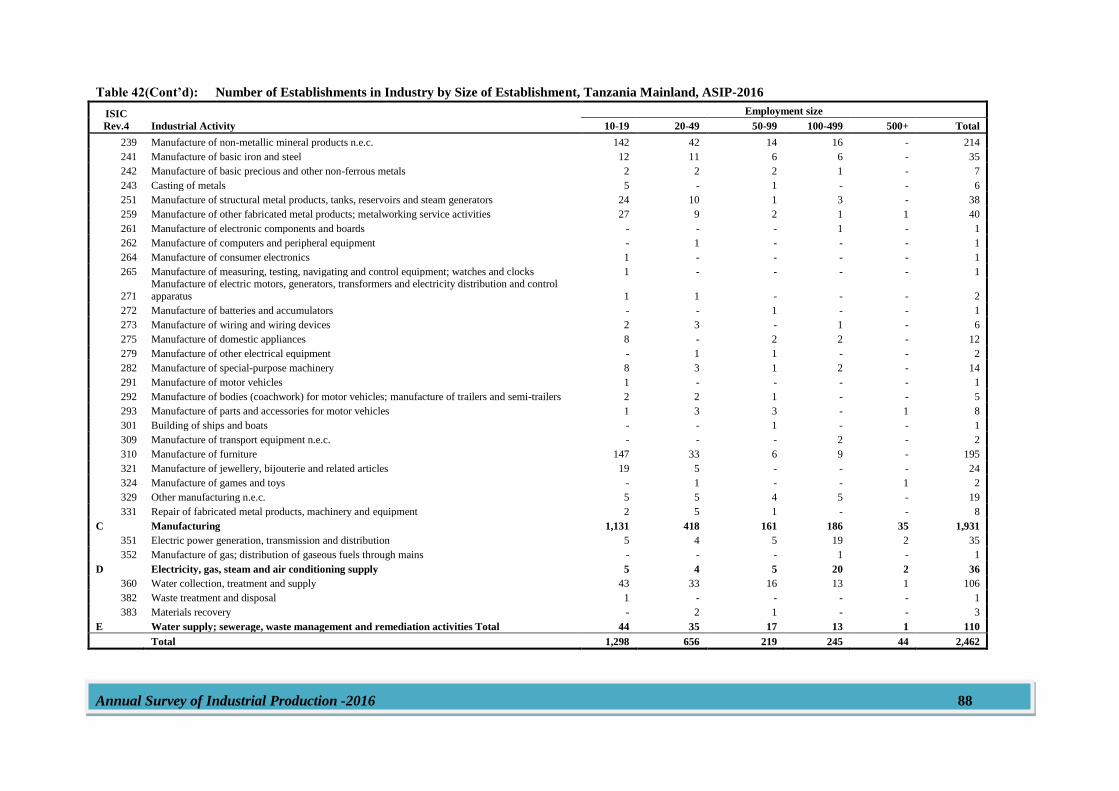
Annual Survey of Industrial Production -2016 88
Table 42(Cont’d): Number of Establishments in Industry by Size of Establishment, Tanzania Mainland, ASIP-2016
ISIC
Rev.4 Industrial Activity
Employment size
10-19 20-49 50-99 100-499 500+ Total
239 Manufacture of non-metallic mineral products n.e.c. 142 42 14 16 - 214
241 Manufacture of basic iron and steel 12 11 6 6 - 35
242 Manufacture of basic precious and other non-ferrous metals 2 2 2 1 - 7
243 Casting of metals 5 - 1 - - 6
251 Manufacture of structural metal products, tanks, reservoirs and steam generators 24 10 1 3 - 38
259 Manufacture of other fabricated metal products; metalworking service activities 27 9 2 1 1 40
261 Manufacture of electronic components and boards - - - 1 - 1
262 Manufacture of computers and peripheral equipment - 1 - - - 1
264 Manufacture of consumer electronics 1 - - - - 1
265 Manufacture of measuring, testing, navigating and control equipment; watches and clocks 1 - - - - 1
271
Manufacture of electric motors, generators, transformers and electricity distribution and control
apparatus 1 1 - - - 2
272 Manufacture of batteries and accumulators - - 1 - - 1
273 Manufacture of wiring and wiring devices 2 3 - 1 - 6
275 Manufacture of domestic appliances 8 - 2 2 - 12
279 Manufacture of other electrical equipment - 1 1 - - 2
282 Manufacture of special-purpose machinery 8 3 1 2 - 14
291 Manufacture of motor vehicles 1 - - - - 1
292 Manufacture of bodies (coachwork) for motor vehicles; manufacture of trailers and semi-trailers 2 2 1 - - 5
293 Manufacture of parts and accessories for motor vehicles 1 3 3 - 1 8
301 Building of ships and boats - - 1 - - 1
309 Manufacture of transport equipment n.e.c. - - - 2 - 2
310 Manufacture of furniture 147 33 6 9 - 195
321 Manufacture of jewellery, bijouterie and related articles 19 5 - - - 24
324 Manufacture of games and toys - 1 - - 1 2
329 Other manufacturing n.e.c. 5 5 4 5 - 19
331 Repair of fabricated metal products, machinery and equipment 2 5 1 - - 8
C Manufacturing 1,131 418 161 186 35 1,931
351 Electric power generation, transmission and distribution 5 4 5 19 2 35
352 Manufacture of gas; distribution of gaseous fuels through mains - - - 1 - 1
D Electricity, gas, steam and air conditioning supply 5 4 5 20 2 36
360 Water collection, treatment and supply 43 33 16 13 1 106
382 Waste treatment and disposal 1 - - - - 1
383 Materials recovery - 2 1 - - 3
E Water supply; sewerage, waste management and remediation activities Total 44 35 17 13 1 110
Total 1,298 656 219 245 44 2,462
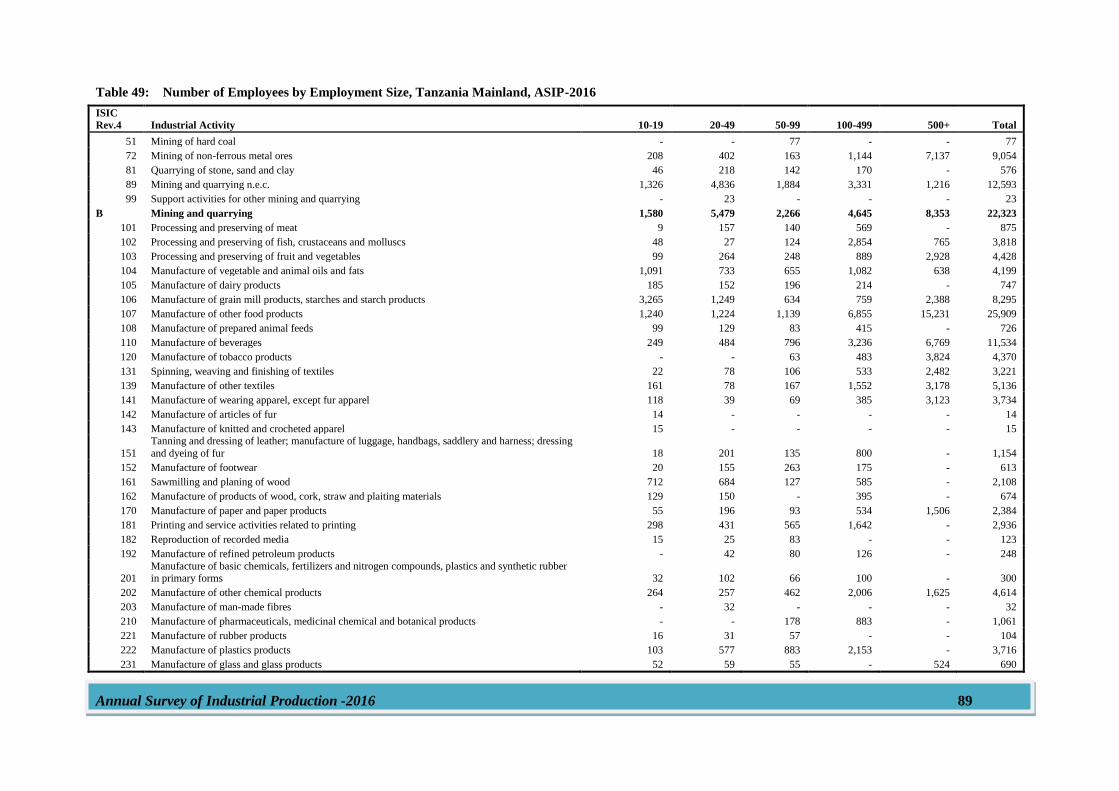
Annual Survey of Industrial Production -2016 89
Table 49: Number of Employees by Employment Size, Tanzania Mainland, ASIP-2016
ISIC
Rev.4 Industrial Activity 10-19 20-49 50-99 100-499 500+ Total
51 Mining of hard coal - - 77 - - 77
72 Mining of non-ferrous metal ores 208 402 163 1,144 7,137 9,054
81 Quarrying of stone, sand and clay 46 218 142 170 - 576
89 Mining and quarrying n.e.c. 1,326 4,836 1,884 3,331 1,216 12,593
99 Support activities for other mining and quarrying - 23 - - - 23
B Mining and quarrying 1,580 5,479 2,266 4,645 8,353 22,323
101 Processing and preserving of meat 9 157 140 569 - 875
102 Processing and preserving of fish, crustaceans and molluscs 48 27 124 2,854 765 3,818
103 Processing and preserving of fruit and vegetables 99 264 248 889 2,928 4,428
104 Manufacture of vegetable and animal oils and fats 1,091 733 655 1,082 638 4,199
105 Manufacture of dairy products 185 152 196 214 - 747
106 Manufacture of grain mill products, starches and starch products 3,265 1,249 634 759 2,388 8,295
107 Manufacture of other food products 1,240 1,224 1,139 6,855 15,231 25,909
108 Manufacture of prepared animal feeds 99 129 83 415 - 726
110 Manufacture of beverages 249 484 796 3,236 6,769 11,534
120 Manufacture of tobacco products - - 63 483 3,824 4,370
131 Spinning, weaving and finishing of textiles 22 78 106 533 2,482 3,221
139 Manufacture of other textiles 161 78 167 1,552 3,178 5,136
141 Manufacture of wearing apparel, except fur apparel 118 39 69 385 3,123 3,734
142 Manufacture of articles of fur 14 - - - - 14
143 Manufacture of knitted and crocheted apparel 15 - - - - 15
151
Tanning and dressing of leather; manufacture of luggage, handbags, saddlery and harness; dressing
and dyeing of fur 18 201 135 800 - 1,154
152 Manufacture of footwear 20 155 263 175 - 613
161 Sawmilling and planing of wood 712 684 127 585 - 2,108
162 Manufacture of products of wood, cork, straw and plaiting materials 129 150 - 395 - 674
170 Manufacture of paper and paper products 55 196 93 534 1,506 2,384
181 Printing and service activities related to printing 298 431 565 1,642 - 2,936
182 Reproduction of recorded media 15 25 83 - - 123
192 Manufacture of refined petroleum products - 42 80 126 - 248
201 Manufacture of basic chemicals, fertilizers and nitrogen compounds, plastics and synthetic rubber in primary forms 32 102 66 100 - 300
202 Manufacture of other chemical products 264 257 462 2,006 1,625 4,614
203 Manufacture of man-made fibres - 32 - - - 32
210 Manufacture of pharmaceuticals, medicinal chemical and botanical products - - 178 883 - 1,061
221 Manufacture of rubber products 16 31 57 - - 104
222 Manufacture of plastics products 103 577 883 2,153 - 3,716
231 Manufacture of glass and glass products 52 59 55 - 524 690
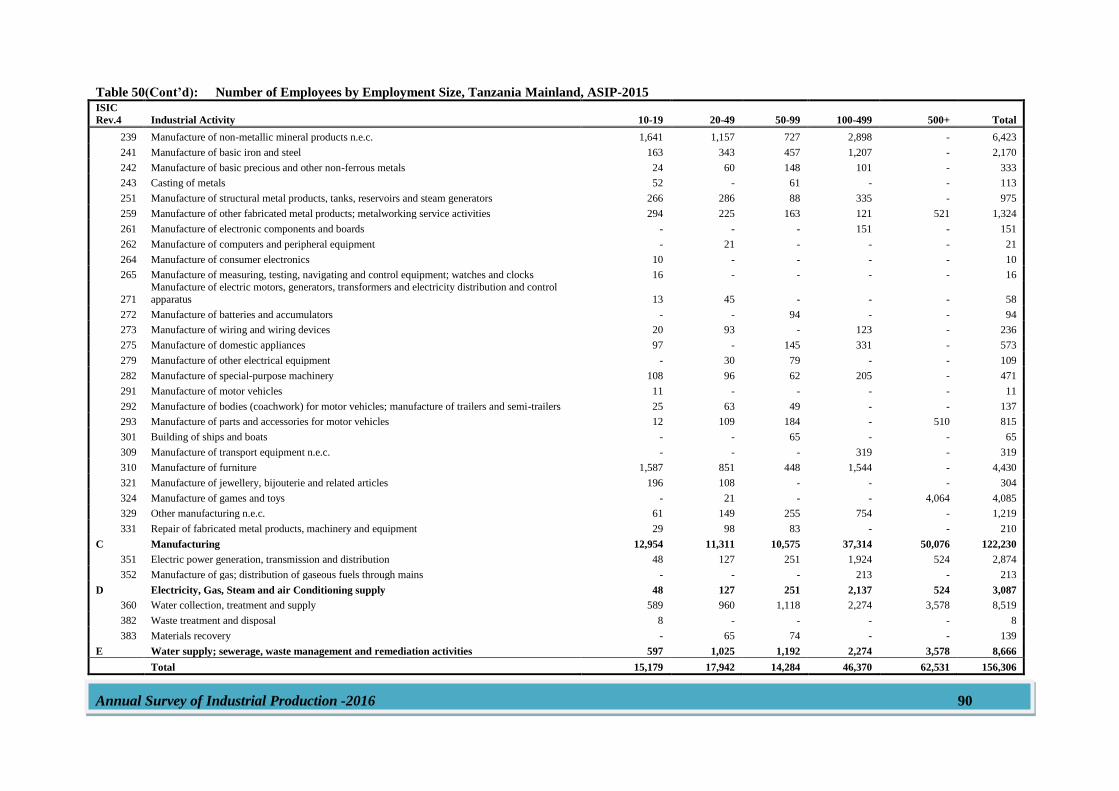
Annual Survey of Industrial Production -2016 90
Table 50(Cont’d): Number of Employees by Employment Size, Tanzania Mainland, ASIP-2015 ISIC
Rev.4 Industrial Activity 10-19 20-49 50-99 100-499 500+ Total
239 Manufacture of non-metallic mineral products n.e.c. 1,641 1,157 727 2,898 - 6,423
241 Manufacture of basic iron and steel 163 343 457 1,207 - 2,170
242 Manufacture of basic precious and other non-ferrous metals 24 60 148 101 - 333
243 Casting of metals 52 - 61 - - 113
251 Manufacture of structural metal products, tanks, reservoirs and steam generators 266 286 88 335 - 975
259 Manufacture of other fabricated metal products; metalworking service activities 294 225 163 121 521 1,324
261 Manufacture of electronic components and boards - - - 151 - 151
262 Manufacture of computers and peripheral equipment - 21 - - - 21
264 Manufacture of consumer electronics 10 - - - - 10
265 Manufacture of measuring, testing, navigating and control equipment; watches and clocks 16 - - - - 16
271
Manufacture of electric motors, generators, transformers and electricity distribution and control
apparatus 13 45 - - - 58
272 Manufacture of batteries and accumulators - - 94 - - 94
273 Manufacture of wiring and wiring devices 20 93 - 123 - 236
275 Manufacture of domestic appliances 97 - 145 331 - 573
279 Manufacture of other electrical equipment - 30 79 - - 109
282 Manufacture of special-purpose machinery 108 96 62 205 - 471
291 Manufacture of motor vehicles 11 - - - - 11
292 Manufacture of bodies (coachwork) for motor vehicles; manufacture of trailers and semi-trailers 25 63 49 - - 137
293 Manufacture of parts and accessories for motor vehicles 12 109 184 - 510 815
301 Building of ships and boats - - 65 - - 65
309 Manufacture of transport equipment n.e.c. - - - 319 - 319
310 Manufacture of furniture 1,587 851 448 1,544 - 4,430
321 Manufacture of jewellery, bijouterie and related articles 196 108 - - - 304
324 Manufacture of games and toys - 21 - - 4,064 4,085
329 Other manufacturing n.e.c. 61 149 255 754 - 1,219
331 Repair of fabricated metal products, machinery and equipment 29 98 83 - - 210
C Manufacturing 12,954 11,311 10,575 37,314 50,076 122,230
351 Electric power generation, transmission and distribution 48 127 251 1,924 524 2,874
352 Manufacture of gas; distribution of gaseous fuels through mains - - - 213 - 213
D Electricity, Gas, Steam and air Conditioning supply 48 127 251 2,137 524 3,087
360 Water collection, treatment and supply 589 960 1,118 2,274 3,578 8,519
382 Waste treatment and disposal 8 - - - - 8
383 Materials recovery - 65 74 - - 139
E Water supply; sewerage, waste management and remediation activities 597 1,025 1,192 2,274 3,578 8,666
Total 15,179 17,942 14,284 46,370 62,531 156,306
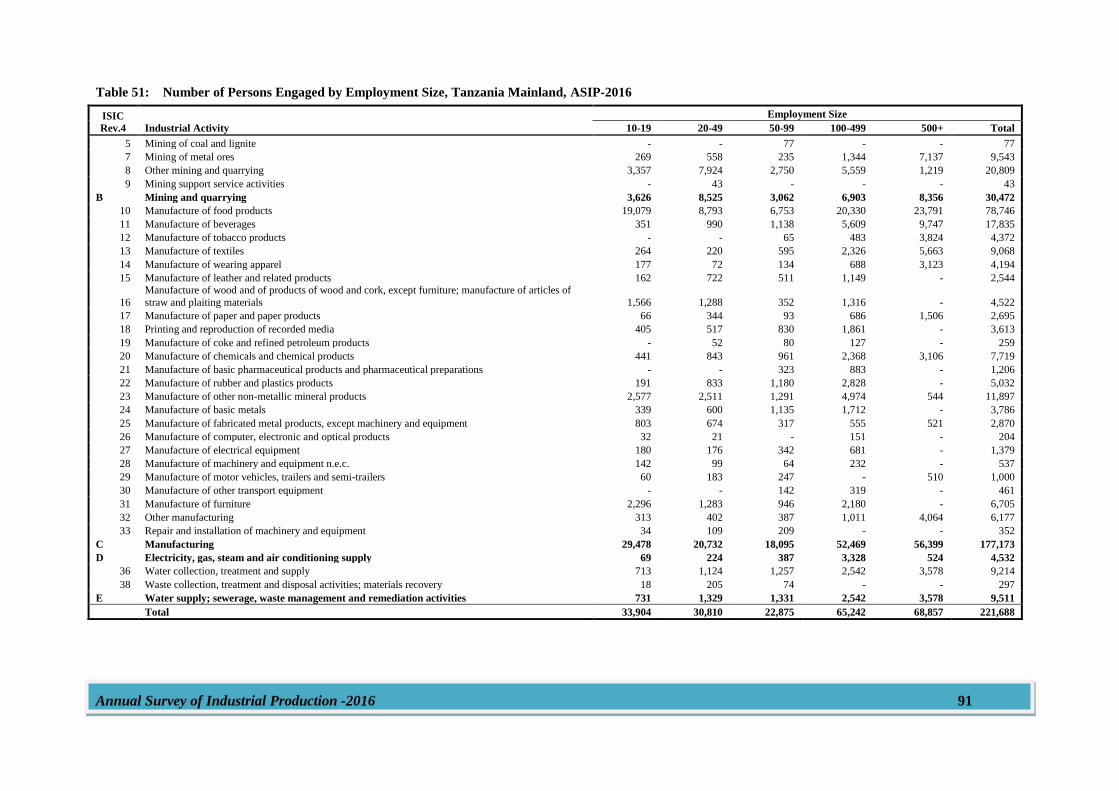
Annual Survey of Industrial Production -2016 91
Table 51: Number of Persons Engaged by Employment Size, Tanzania Mainland, ASIP-2016
ISIC
Rev.4 Industrial Activity
Employment Size
10-19 20-49 50-99 100-499 500+ Total
5 Mining of coal and lignite - - 77 - - 77
7 Mining of metal ores 269 558 235 1,344 7,137 9,543
8 Other mining and quarrying 3,357 7,924 2,750 5,559 1,219 20,809
9 Mining support service activities - 43 - - - 43
B Mining and quarrying 3,626 8,525 3,062 6,903 8,356 30,472
10 Manufacture of food products 19,079 8,793 6,753 20,330 23,791 78,746
11 Manufacture of beverages 351 990 1,138 5,609 9,747 17,835
12 Manufacture of tobacco products - - 65 483 3,824 4,372
13 Manufacture of textiles 264 220 595 2,326 5,663 9,068
14 Manufacture of wearing apparel 177 72 134 688 3,123 4,194
15 Manufacture of leather and related products 162 722 511 1,149 - 2,544
16
Manufacture of wood and of products of wood and cork, except furniture; manufacture of articles of
straw and plaiting materials 1,566 1,288 352 1,316 - 4,522
17 Manufacture of paper and paper products 66 344 93 686 1,506 2,695
18 Printing and reproduction of recorded media 405 517 830 1,861 - 3,613
19 Manufacture of coke and refined petroleum products - 52 80 127 - 259
20 Manufacture of chemicals and chemical products 441 843 961 2,368 3,106 7,719
21 Manufacture of basic pharmaceutical products and pharmaceutical preparations - - 323 883 - 1,206
22 Manufacture of rubber and plastics products 191 833 1,180 2,828 - 5,032
23 Manufacture of other non-metallic mineral products 2,577 2,511 1,291 4,974 544 11,897
24 Manufacture of basic metals 339 600 1,135 1,712 - 3,786
25 Manufacture of fabricated metal products, except machinery and equipment 803 674 317 555 521 2,870
26 Manufacture of computer, electronic and optical products 32 21 - 151 - 204
27 Manufacture of electrical equipment 180 176 342 681 - 1,379
28 Manufacture of machinery and equipment n.e.c. 142 99 64 232 - 537
29 Manufacture of motor vehicles, trailers and semi-trailers 60 183 247 - 510 1,000
30 Manufacture of other transport equipment - - 142 319 - 461
31 Manufacture of furniture 2,296 1,283 946 2,180 - 6,705
32 Other manufacturing 313 402 387 1,011 4,064 6,177
33 Repair and installation of machinery and equipment 34 109 209 - - 352
C Manufacturing 29,478 20,732 18,095 52,469 56,399 177,173
D Electricity, gas, steam and air conditioning supply 69 224 387 3,328 524 4,532
36 Water collection, treatment and supply 713 1,124 1,257 2,542 3,578 9,214
38 Waste collection, treatment and disposal activities; materials recovery 18 205 74 - - 297
E Water supply; sewerage, waste management and remediation activities 731 1,329 1,331 2,542 3,578 9,511
Total 33,904 30,810 22,875 65,242 68,857 221,688
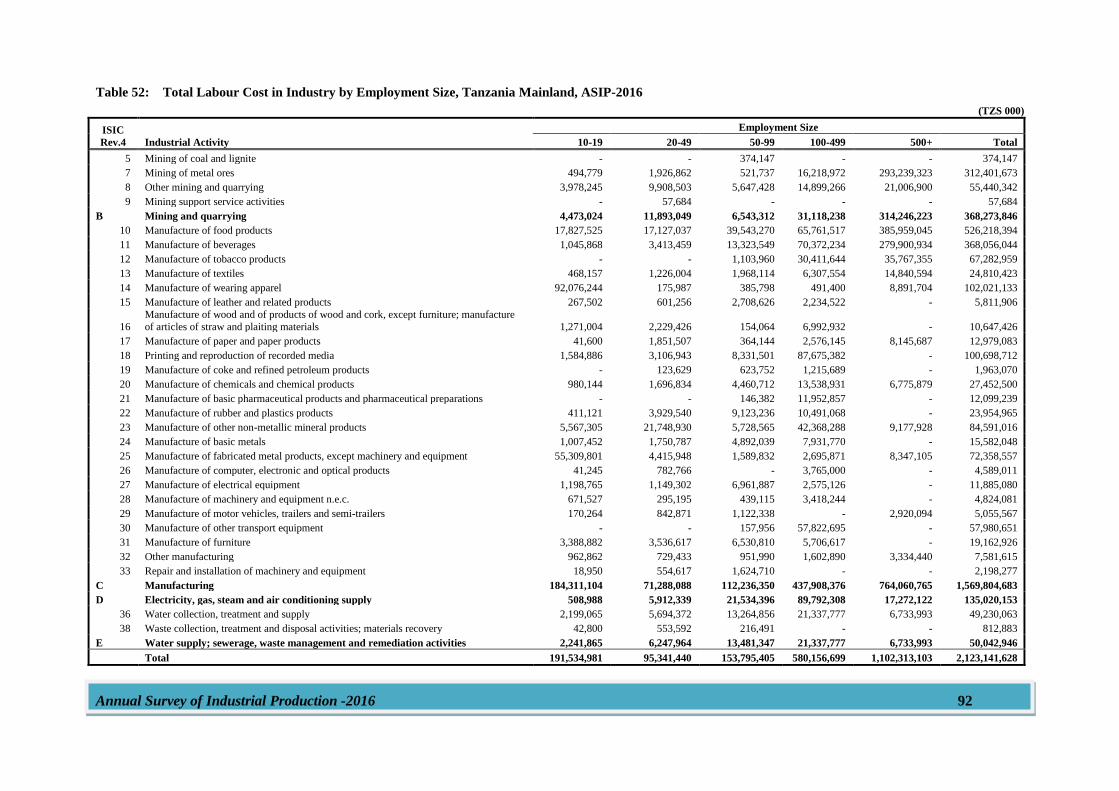
Annual Survey of Industrial Production -2016 92
Table 52: Total Labour Cost in Industry by Employment Size, Tanzania Mainland, ASIP-2016
(TZS 000)
ISIC
Rev.4 Industrial Activity
Employment Size
10-19 20-49 50-99 100-499 500+ Total
5 Mining of coal and lignite - - 374,147 - - 374,147
7 Mining of metal ores 494,779 1,926,862 521,737 16,218,972 293,239,323 312,401,673
8 Other mining and quarrying 3,978,245 9,908,503 5,647,428 14,899,266 21,006,900 55,440,342
9 Mining support service activities - 57,684 - - - 57,684
B Mining and quarrying 4,473,024 11,893,049 6,543,312 31,118,238 314,246,223 368,273,846
10 Manufacture of food products 17,827,525 17,127,037 39,543,270 65,761,517 385,959,045 526,218,394
11 Manufacture of beverages 1,045,868 3,413,459 13,323,549 70,372,234 279,900,934 368,056,044
12 Manufacture of tobacco products - - 1,103,960 30,411,644 35,767,355 67,282,959
13 Manufacture of textiles 468,157 1,226,004 1,968,114 6,307,554 14,840,594 24,810,423
14 Manufacture of wearing apparel 92,076,244 175,987 385,798 491,400 8,891,704 102,021,133
15 Manufacture of leather and related products 267,502 601,256 2,708,626 2,234,522 - 5,811,906
16
Manufacture of wood and of products of wood and cork, except furniture; manufacture
of articles of straw and plaiting materials 1,271,004 2,229,426 154,064 6,992,932 - 10,647,426
17 Manufacture of paper and paper products 41,600 1,851,507 364,144 2,576,145 8,145,687 12,979,083
18 Printing and reproduction of recorded media 1,584,886 3,106,943 8,331,501 87,675,382 - 100,698,712
19 Manufacture of coke and refined petroleum products - 123,629 623,752 1,215,689 - 1,963,070
20 Manufacture of chemicals and chemical products 980,144 1,696,834 4,460,712 13,538,931 6,775,879 27,452,500
21 Manufacture of basic pharmaceutical products and pharmaceutical preparations - - 146,382 11,952,857 - 12,099,239
22 Manufacture of rubber and plastics products 411,121 3,929,540 9,123,236 10,491,068 - 23,954,965
23 Manufacture of other non-metallic mineral products 5,567,305 21,748,930 5,728,565 42,368,288 9,177,928 84,591,016
24 Manufacture of basic metals 1,007,452 1,750,787 4,892,039 7,931,770 - 15,582,048
25 Manufacture of fabricated metal products, except machinery and equipment 55,309,801 4,415,948 1,589,832 2,695,871 8,347,105 72,358,557
26 Manufacture of computer, electronic and optical products 41,245 782,766 - 3,765,000 - 4,589,011
27 Manufacture of electrical equipment 1,198,765 1,149,302 6,961,887 2,575,126 - 11,885,080
28 Manufacture of machinery and equipment n.e.c. 671,527 295,195 439,115 3,418,244 - 4,824,081
29 Manufacture of motor vehicles, trailers and semi-trailers 170,264 842,871 1,122,338 - 2,920,094 5,055,567
30 Manufacture of other transport equipment - - 157,956 57,822,695 - 57,980,651
31 Manufacture of furniture 3,388,882 3,536,617 6,530,810 5,706,617 - 19,162,926
32 Other manufacturing 962,862 729,433 951,990 1,602,890 3,334,440 7,581,615
33 Repair and installation of machinery and equipment 18,950 554,617 1,624,710 - - 2,198,277
C Manufacturing 184,311,104 71,288,088 112,236,350 437,908,376 764,060,765 1,569,804,683
D Electricity, gas, steam and air conditioning supply 508,988 5,912,339 21,534,396 89,792,308 17,272,122 135,020,153
36 Water collection, treatment and supply 2,199,065 5,694,372 13,264,856 21,337,777 6,733,993 49,230,063
38 Waste collection, treatment and disposal activities; materials recovery 42,800 553,592 216,491 - - 812,883
E Water supply; sewerage, waste management and remediation activities 2,241,865 6,247,964 13,481,347 21,337,777 6,733,993 50,042,946
Total 191,534,981 95,341,440 153,795,405 580,156,699 1,102,313,103 2,123,141,628
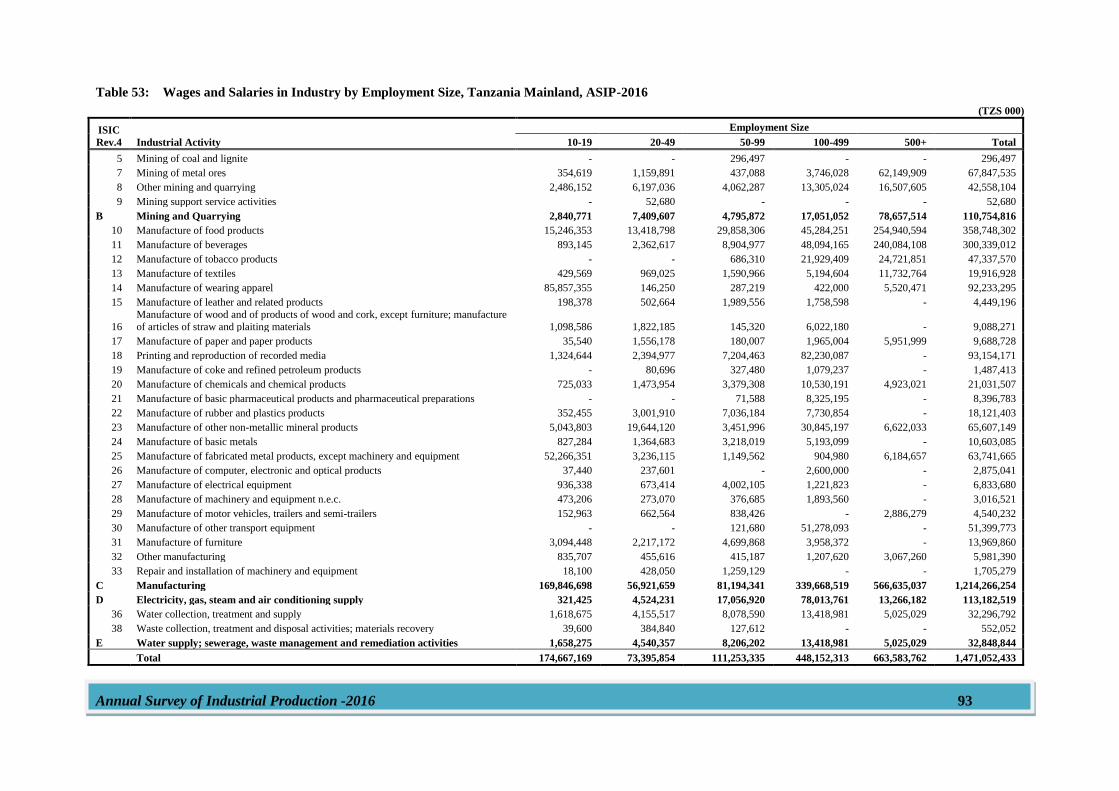
Annual Survey of Industrial Production -2016 93
Table 53: Wages and Salaries in Industry by Employment Size, Tanzania Mainland, ASIP-2016
(TZS 000)
ISIC
Rev.4 Industrial Activity
Employment Size
10-19 20-49 50-99 100-499 500+ Total
5 Mining of coal and lignite - - 296,497 - - 296,497
7 Mining of metal ores 354,619 1,159,891 437,088 3,746,028 62,149,909 67,847,535
8 Other mining and quarrying 2,486,152 6,197,036 4,062,287 13,305,024 16,507,605 42,558,104
9 Mining support service activities - 52,680 - - - 52,680
B Mining and Quarrying 2,840,771 7,409,607 4,795,872 17,051,052 78,657,514 110,754,816
10 Manufacture of food products 15,246,353 13,418,798 29,858,306 45,284,251 254,940,594 358,748,302
11 Manufacture of beverages 893,145 2,362,617 8,904,977 48,094,165 240,084,108 300,339,012
12 Manufacture of tobacco products - - 686,310 21,929,409 24,721,851 47,337,570
13 Manufacture of textiles 429,569 969,025 1,590,966 5,194,604 11,732,764 19,916,928
14 Manufacture of wearing apparel 85,857,355 146,250 287,219 422,000 5,520,471 92,233,295
15 Manufacture of leather and related products 198,378 502,664 1,989,556 1,758,598 - 4,449,196
16
Manufacture of wood and of products of wood and cork, except furniture; manufacture
of articles of straw and plaiting materials 1,098,586 1,822,185 145,320 6,022,180 - 9,088,271
17 Manufacture of paper and paper products 35,540 1,556,178 180,007 1,965,004 5,951,999 9,688,728
18 Printing and reproduction of recorded media 1,324,644 2,394,977 7,204,463 82,230,087 - 93,154,171
19 Manufacture of coke and refined petroleum products - 80,696 327,480 1,079,237 - 1,487,413
20 Manufacture of chemicals and chemical products 725,033 1,473,954 3,379,308 10,530,191 4,923,021 21,031,507
21 Manufacture of basic pharmaceutical products and pharmaceutical preparations - - 71,588 8,325,195 - 8,396,783
22 Manufacture of rubber and plastics products 352,455 3,001,910 7,036,184 7,730,854 - 18,121,403
23 Manufacture of other non-metallic mineral products 5,043,803 19,644,120 3,451,996 30,845,197 6,622,033 65,607,149
24 Manufacture of basic metals 827,284 1,364,683 3,218,019 5,193,099 - 10,603,085
25 Manufacture of fabricated metal products, except machinery and equipment 52,266,351 3,236,115 1,149,562 904,980 6,184,657 63,741,665
26 Manufacture of computer, electronic and optical products 37,440 237,601 - 2,600,000 - 2,875,041
27 Manufacture of electrical equipment 936,338 673,414 4,002,105 1,221,823 - 6,833,680
28 Manufacture of machinery and equipment n.e.c. 473,206 273,070 376,685 1,893,560 - 3,016,521
29 Manufacture of motor vehicles, trailers and semi-trailers 152,963 662,564 838,426 - 2,886,279 4,540,232
30 Manufacture of other transport equipment - - 121,680 51,278,093 - 51,399,773
31 Manufacture of furniture 3,094,448 2,217,172 4,699,868 3,958,372 - 13,969,860
32 Other manufacturing 835,707 455,616 415,187 1,207,620 3,067,260 5,981,390
33 Repair and installation of machinery and equipment 18,100 428,050 1,259,129 - - 1,705,279
C Manufacturing 169,846,698 56,921,659 81,194,341 339,668,519 566,635,037 1,214,266,254
D Electricity, gas, steam and air conditioning supply 321,425 4,524,231 17,056,920 78,013,761 13,266,182 113,182,519
36 Water collection, treatment and supply 1,618,675 4,155,517 8,078,590 13,418,981 5,025,029 32,296,792
38 Waste collection, treatment and disposal activities; materials recovery 39,600 384,840 127,612 - - 552,052
E Water supply; sewerage, waste management and remediation activities 1,658,275 4,540,357 8,206,202 13,418,981 5,025,029 32,848,844
Total 174,667,169 73,395,854 111,253,335 448,152,313 663,583,762 1,471,052,433
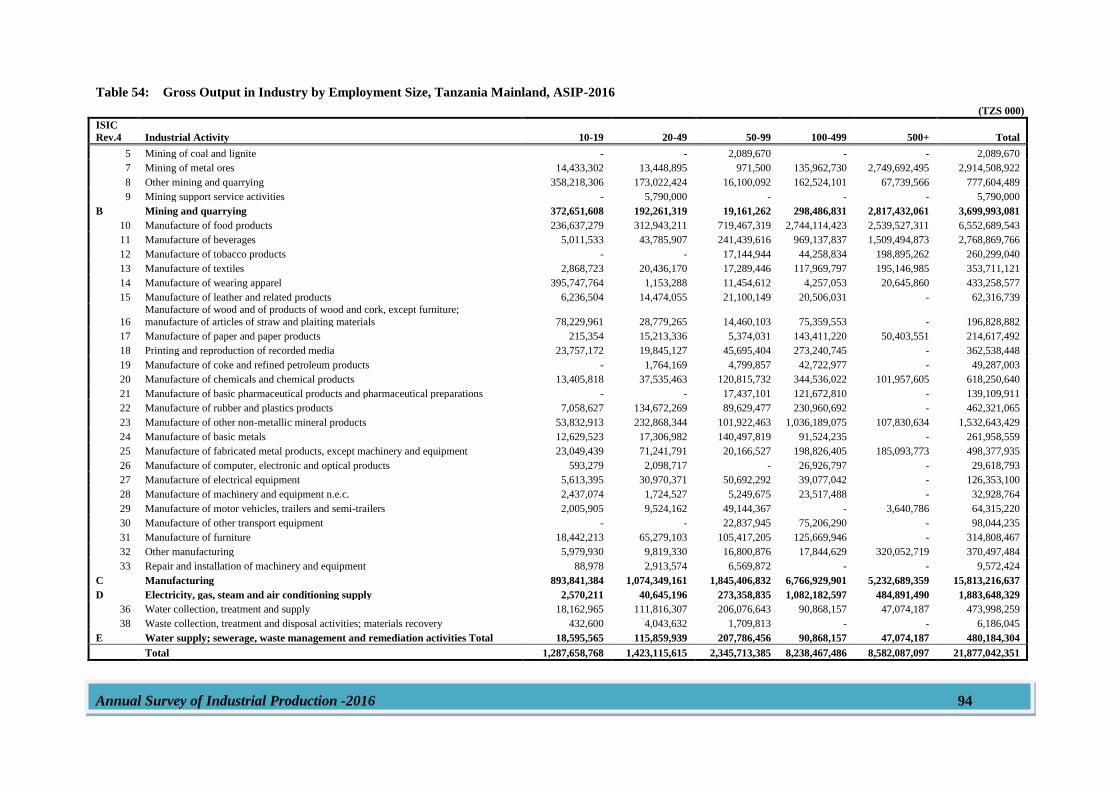
Annual Survey of Industrial Production -2016 94
Table 54: Gross Output in Industry by Employment Size, Tanzania Mainland, ASIP-2016
(TZS 000)
ISIC
Rev.4 Industrial Activity 10-19 20-49 50-99 100-499 500+ Total
5 Mining of coal and lignite - - 2,089,670 - - 2,089,670
7 Mining of metal ores 14,433,302 13,448,895 971,500 135,962,730 2,749,692,495 2,914,508,922
8 Other mining and quarrying 358,218,306 173,022,424 16,100,092 162,524,101 67,739,566 777,604,489
9 Mining support service activities - 5,790,000 - - - 5,790,000
B Mining and quarrying 372,651,608 192,261,319 19,161,262 298,486,831 2,817,432,061 3,699,993,081
10 Manufacture of food products 236,637,279 312,943,211 719,467,319 2,744,114,423 2,539,527,311 6,552,689,543
11 Manufacture of beverages 5,011,533 43,785,907 241,439,616 969,137,837 1,509,494,873 2,768,869,766
12 Manufacture of tobacco products - - 17,144,944 44,258,834 198,895,262 260,299,040
13 Manufacture of textiles 2,868,723 20,436,170 17,289,446 117,969,797 195,146,985 353,711,121
14 Manufacture of wearing apparel 395,747,764 1,153,288 11,454,612 4,257,053 20,645,860 433,258,577
15 Manufacture of leather and related products 6,236,504 14,474,055 21,100,149 20,506,031 - 62,316,739
16
Manufacture of wood and of products of wood and cork, except furniture;
manufacture of articles of straw and plaiting materials 78,229,961 28,779,265 14,460,103 75,359,553 - 196,828,882
17 Manufacture of paper and paper products 215,354 15,213,336 5,374,031 143,411,220 50,403,551 214,617,492
18 Printing and reproduction of recorded media 23,757,172 19,845,127 45,695,404 273,240,745 - 362,538,448
19 Manufacture of coke and refined petroleum products - 1,764,169 4,799,857 42,722,977 - 49,287,003
20 Manufacture of chemicals and chemical products 13,405,818 37,535,463 120,815,732 344,536,022 101,957,605 618,250,640
21 Manufacture of basic pharmaceutical products and pharmaceutical preparations - - 17,437,101 121,672,810 - 139,109,911
22 Manufacture of rubber and plastics products 7,058,627 134,672,269 89,629,477 230,960,692 - 462,321,065
23 Manufacture of other non-metallic mineral products 53,832,913 232,868,344 101,922,463 1,036,189,075 107,830,634 1,532,643,429
24 Manufacture of basic metals 12,629,523 17,306,982 140,497,819 91,524,235 - 261,958,559
25 Manufacture of fabricated metal products, except machinery and equipment 23,049,439 71,241,791 20,166,527 198,826,405 185,093,773 498,377,935
26 Manufacture of computer, electronic and optical products 593,279 2,098,717 - 26,926,797 - 29,618,793
27 Manufacture of electrical equipment 5,613,395 30,970,371 50,692,292 39,077,042 - 126,353,100
28 Manufacture of machinery and equipment n.e.c. 2,437,074 1,724,527 5,249,675 23,517,488 - 32,928,764
29 Manufacture of motor vehicles, trailers and semi-trailers 2,005,905 9,524,162 49,144,367 - 3,640,786 64,315,220
30 Manufacture of other transport equipment - - 22,837,945 75,206,290 - 98,044,235
31 Manufacture of furniture 18,442,213 65,279,103 105,417,205 125,669,946 - 314,808,467
32 Other manufacturing 5,979,930 9,819,330 16,800,876 17,844,629 320,052,719 370,497,484
33 Repair and installation of machinery and equipment 88,978 2,913,574 6,569,872 - - 9,572,424
C Manufacturing 893,841,384 1,074,349,161 1,845,406,832 6,766,929,901 5,232,689,359 15,813,216,637
D Electricity, gas, steam and air conditioning supply 2,570,211 40,645,196 273,358,835 1,082,182,597 484,891,490 1,883,648,329
36 Water collection, treatment and supply 18,162,965 111,816,307 206,076,643 90,868,157 47,074,187 473,998,259
38 Waste collection, treatment and disposal activities; materials recovery 432,600 4,043,632 1,709,813 - - 6,186,045
E Water supply; sewerage, waste management and remediation activities Total 18,595,565 115,859,939 207,786,456 90,868,157 47,074,187 480,184,304
Total 1,287,658,768 1,423,115,615 2,345,713,385 8,238,467,486 8,582,087,097 21,877,042,351
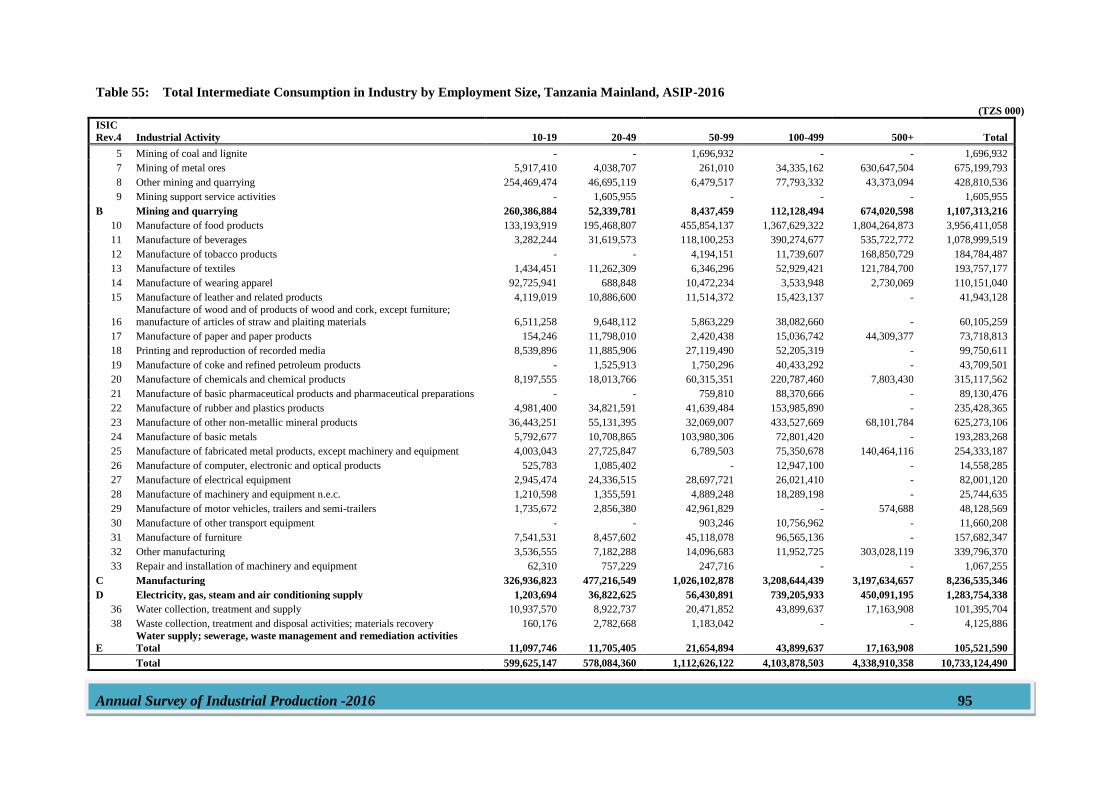
Annual Survey of Industrial Production -2016 95
Table 55: Total Intermediate Consumption in Industry by Employment Size, Tanzania Mainland, ASIP-2016
(TZS 000) ISIC
Rev.4 Industrial Activity 10-19 20-49 50-99 100-499 500+ Total
5 Mining of coal and lignite - - 1,696,932 - - 1,696,932
7 Mining of metal ores 5,917,410 4,038,707 261,010 34,335,162 630,647,504 675,199,793
8 Other mining and quarrying 254,469,474 46,695,119 6,479,517 77,793,332 43,373,094 428,810,536
9 Mining support service activities - 1,605,955 - - - 1,605,955
B Mining and quarrying 260,386,884 52,339,781 8,437,459 112,128,494 674,020,598 1,107,313,216
10 Manufacture of food products 133,193,919 195,468,807 455,854,137 1,367,629,322 1,804,264,873 3,956,411,058
11 Manufacture of beverages 3,282,244 31,619,573 118,100,253 390,274,677 535,722,772 1,078,999,519
12 Manufacture of tobacco products - - 4,194,151 11,739,607 168,850,729 184,784,487
13 Manufacture of textiles 1,434,451 11,262,309 6,346,296 52,929,421 121,784,700 193,757,177
14 Manufacture of wearing apparel 92,725,941 688,848 10,472,234 3,533,948 2,730,069 110,151,040
15 Manufacture of leather and related products 4,119,019 10,886,600 11,514,372 15,423,137 - 41,943,128
16
Manufacture of wood and of products of wood and cork, except furniture;
manufacture of articles of straw and plaiting materials 6,511,258 9,648,112 5,863,229 38,082,660 - 60,105,259
17 Manufacture of paper and paper products 154,246 11,798,010 2,420,438 15,036,742 44,309,377 73,718,813
18 Printing and reproduction of recorded media 8,539,896 11,885,906 27,119,490 52,205,319 - 99,750,611
19 Manufacture of coke and refined petroleum products - 1,525,913 1,750,296 40,433,292 - 43,709,501
20 Manufacture of chemicals and chemical products 8,197,555 18,013,766 60,315,351 220,787,460 7,803,430 315,117,562
21 Manufacture of basic pharmaceutical products and pharmaceutical preparations - - 759,810 88,370,666 - 89,130,476
22 Manufacture of rubber and plastics products 4,981,400 34,821,591 41,639,484 153,985,890 - 235,428,365
23 Manufacture of other non-metallic mineral products 36,443,251 55,131,395 32,069,007 433,527,669 68,101,784 625,273,106
24 Manufacture of basic metals 5,792,677 10,708,865 103,980,306 72,801,420 - 193,283,268
25 Manufacture of fabricated metal products, except machinery and equipment 4,003,043 27,725,847 6,789,503 75,350,678 140,464,116 254,333,187
26 Manufacture of computer, electronic and optical products 525,783 1,085,402 - 12,947,100 - 14,558,285
27 Manufacture of electrical equipment 2,945,474 24,336,515 28,697,721 26,021,410 - 82,001,120
28 Manufacture of machinery and equipment n.e.c. 1,210,598 1,355,591 4,889,248 18,289,198 - 25,744,635
29 Manufacture of motor vehicles, trailers and semi-trailers 1,735,672 2,856,380 42,961,829 - 574,688 48,128,569
30 Manufacture of other transport equipment - - 903,246 10,756,962 - 11,660,208
31 Manufacture of furniture 7,541,531 8,457,602 45,118,078 96,565,136 - 157,682,347
32 Other manufacturing 3,536,555 7,182,288 14,096,683 11,952,725 303,028,119 339,796,370
33 Repair and installation of machinery and equipment 62,310 757,229 247,716 - - 1,067,255
C Manufacturing 326,936,823 477,216,549 1,026,102,878 3,208,644,439 3,197,634,657 8,236,535,346
D Electricity, gas, steam and air conditioning supply 1,203,694 36,822,625 56,430,891 739,205,933 450,091,195 1,283,754,338
36 Water collection, treatment and supply 10,937,570 8,922,737 20,471,852 43,899,637 17,163,908 101,395,704
38 Waste collection, treatment and disposal activities; materials recovery 160,176 2,782,668 1,183,042 - - 4,125,886
E
Water supply; sewerage, waste management and remediation activities
Total 11,097,746 11,705,405 21,654,894 43,899,637 17,163,908 105,521,590
Total 599,625,147 578,084,360 1,112,626,122 4,103,878,503 4,338,910,358 10,733,124,490

Annual Survey of Industrial Production -2016 96
Table 56: Value Added in Industry by Employment Size, Tanzania Mainland, ASIP-2016
(TZS 000) ISIC
Rev.4 Industrial Activity 10-19 20-49 50-99 100-499 500+ Total
5 Mining of coal and lignite - - 392,738 - - 392,738
7 Mining of metal ores 8,515,892 9,410,188 710,490 101,627,568 2,119,044,991 2,239,309,129
8 Other mining and quarrying 103,748,832 126,327,305 9,620,575 84,730,769 24,366,472 348,793,953
9 Mining support service activities - 4,184,045 - - - 4,184,045
B Mining and quarrying 112,264,724 139,921,538 10,723,803 186,358,337 2,143,411,463 2,592,679,865
10 Manufacture of food products 103,443,360 117,474,404 263,613,182 1,376,485,101 735,262,438 2,596,278,485
11 Manufacture of beverages 1,729,289 12,166,334 123,339,363 578,863,160 973,772,101 1,689,870,247
12 Manufacture of tobacco products - - 12,950,793 32,519,227 30,044,533 75,514,553
13 Manufacture of textiles 1,434,272 9,173,861 10,943,150 65,040,376 73,362,285 159,953,944
14 Manufacture of wearing apparel 303,021,823 464,440 982,378 723,105 17,915,791 323,107,537
15 Manufacture of leather and related products 2,117,485 3,587,455 9,585,777 5,082,894 - 20,373,611
16
Manufacture of wood and of products of wood and cork, except furniture;
manufacture of articles of straw and plaiting materials 71,718,703 19,131,153 8,596,874 37,276,893 - 136,723,623
17 Manufacture of paper and paper products 61,108 3,415,326 2,953,593 128,374,478 6,094,174 140,898,679
18 Printing and reproduction of recorded media 15,217,276 7,959,221 18,575,914 221,035,426 - 262,787,837
19 Manufacture of coke and refined petroleum products - 238,256 3,049,561 2,289,685 - 5,577,502
20 Manufacture of chemicals and chemical products 5,208,263 19,521,697 60,500,381 123,748,562 94,154,175 303,133,078
21 Manufacture of basic pharmaceutical products and pharmaceutical preparations - - 16,677,291 33,302,144 - 49,979,435
22 Manufacture of rubber and plastics products 2,077,227 99,850,678 47,989,993 76,974,802 - 226,892,700
23 Manufacture of other non-metallic mineral products 17,389,662 177,736,949 69,853,456 602,661,406 39,728,850 907,370,323
24 Manufacture of basic metals 6,836,846 6,598,117 36,517,513 18,722,815 - 68,675,291
25 Manufacture of fabricated metal products, except machinery and equipment 19,046,396 43,515,944 13,377,024 123,475,727 44,629,657 244,044,748
26 Manufacture of computer, electronic and optical products 67,496 1,013,315 - 13,979,697 - 15,060,508
27 Manufacture of electrical equipment 2,667,921 6,633,856 21,994,571 13,055,632 - 44,351,980
28 Manufacture of machinery and equipment n.e.c. 1,226,476 368,936 360,427 5,228,290 - 7,184,129
29 Manufacture of motor vehicles, trailers and semi-trailers 270,233 6,667,782 6,182,538 - 3,066,098 16,186,651
30 Manufacture of other transport equipment - - 21,934,699 64,449,328 - 86,384,027
31 Manufacture of furniture 10,900,682 56,821,501 60,299,127 29,104,810 - 157,126,120
32 Other manufacturing 2,443,375 2,637,042 2,704,193 5,891,904 17,024,600 30,701,114
33 Repair and installation of machinery and equipment 26,668 2,156,345 6,322,156 - - 8,505,169
C Manufacturing 566,904,561 597,132,612 819,303,954 3,558,285,462 2,035,054,702 7,576,681,291
D Electricity, gas, steam and air conditioning supply 1,366,517 3,822,571 216,927,944 342,976,664 34,800,295 599,893,991
36 Water collection, treatment and supply 7,225,395 102,893,570 185,604,791 46,968,520 29,910,279 372,602,555
38 Waste collection, treatment and disposal activities; materials recovery 272,424 1,260,964 526,771 - - 2,060,159
E Water supply; sewerage, waste management and remediation activities 7,497,819 104,154,534 186,131,562 46,968,520 29,910,279 374,662,714
Total 688,033,621 845,031,255 1,233,087,263 4,134,588,983 4,243,176,739 11,143,917,861
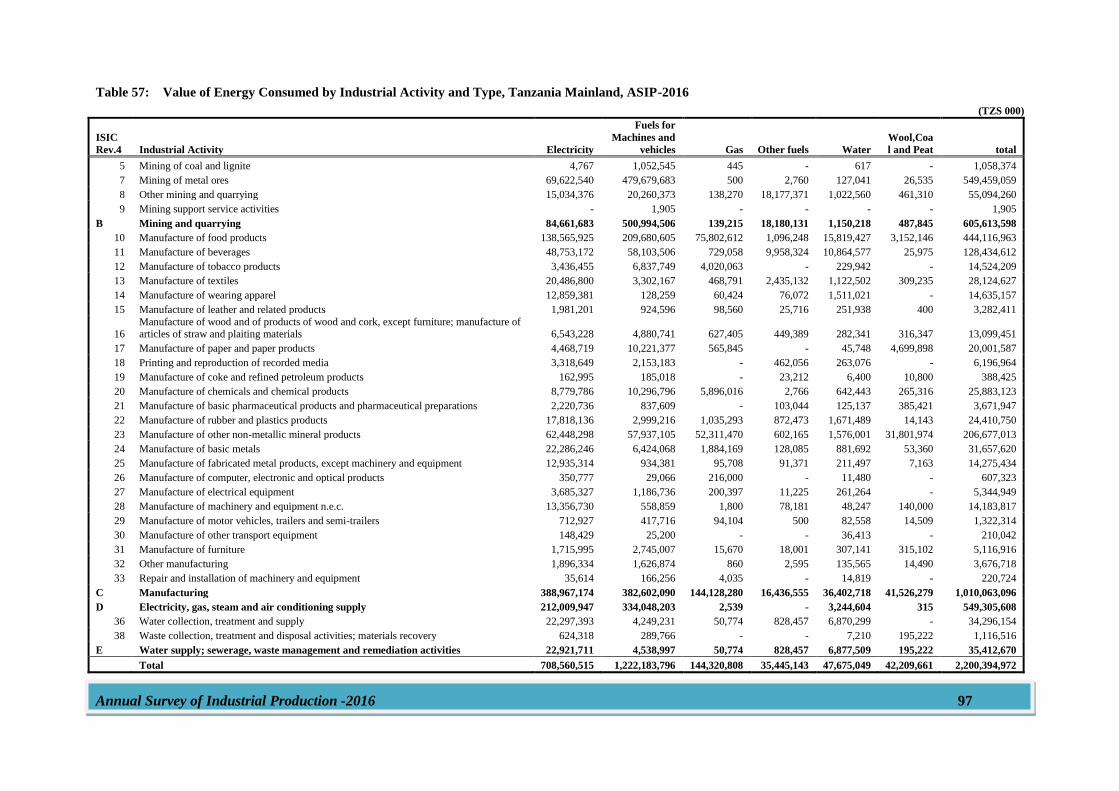
Annual Survey of Industrial Production -2016 97
Table 57: Value of Energy Consumed by Industrial Activity and Type, Tanzania Mainland, ASIP-2016
(TZS 000)
ISIC
Rev.4 Industrial Activity Electricity
Fuels for
Machines and
vehicles Gas Other fuels Water
Wool,Coa
l and Peat total
5 Mining of coal and lignite 4,767 1,052,545 445 - 617 - 1,058,374
7 Mining of metal ores 69,622,540 479,679,683 500 2,760 127,041 26,535 549,459,059
8 Other mining and quarrying 15,034,376 20,260,373 138,270 18,177,371 1,022,560 461,310 55,094,260
9 Mining support service activities - 1,905 - - - - 1,905
B Mining and quarrying 84,661,683 500,994,506 139,215 18,180,131 1,150,218 487,845 605,613,598
10 Manufacture of food products 138,565,925 209,680,605 75,802,612 1,096,248 15,819,427 3,152,146 444,116,963
11 Manufacture of beverages 48,753,172 58,103,506 729,058 9,958,324 10,864,577 25,975 128,434,612
12 Manufacture of tobacco products 3,436,455 6,837,749 4,020,063 - 229,942 - 14,524,209
13 Manufacture of textiles 20,486,800 3,302,167 468,791 2,435,132 1,122,502 309,235 28,124,627
14 Manufacture of wearing apparel 12,859,381 128,259 60,424 76,072 1,511,021 - 14,635,157
15 Manufacture of leather and related products 1,981,201 924,596 98,560 25,716 251,938 400 3,282,411
16 Manufacture of wood and of products of wood and cork, except furniture; manufacture of articles of straw and plaiting materials 6,543,228 4,880,741 627,405 449,389 282,341 316,347 13,099,451
17 Manufacture of paper and paper products 4,468,719 10,221,377 565,845 - 45,748 4,699,898 20,001,587
18 Printing and reproduction of recorded media 3,318,649 2,153,183 - 462,056 263,076 - 6,196,964
19 Manufacture of coke and refined petroleum products 162,995 185,018 - 23,212 6,400 10,800 388,425
20 Manufacture of chemicals and chemical products 8,779,786 10,296,796 5,896,016 2,766 642,443 265,316 25,883,123
21 Manufacture of basic pharmaceutical products and pharmaceutical preparations 2,220,736 837,609 - 103,044 125,137 385,421 3,671,947
22 Manufacture of rubber and plastics products 17,818,136 2,999,216 1,035,293 872,473 1,671,489 14,143 24,410,750
23 Manufacture of other non-metallic mineral products 62,448,298 57,937,105 52,311,470 602,165 1,576,001 31,801,974 206,677,013
24 Manufacture of basic metals 22,286,246 6,424,068 1,884,169 128,085 881,692 53,360 31,657,620
25 Manufacture of fabricated metal products, except machinery and equipment 12,935,314 934,381 95,708 91,371 211,497 7,163 14,275,434
26 Manufacture of computer, electronic and optical products 350,777 29,066 216,000 - 11,480 - 607,323
27 Manufacture of electrical equipment 3,685,327 1,186,736 200,397 11,225 261,264 - 5,344,949
28 Manufacture of machinery and equipment n.e.c. 13,356,730 558,859 1,800 78,181 48,247 140,000 14,183,817
29 Manufacture of motor vehicles, trailers and semi-trailers 712,927 417,716 94,104 500 82,558 14,509 1,322,314
30 Manufacture of other transport equipment 148,429 25,200 - - 36,413 - 210,042
31 Manufacture of furniture 1,715,995 2,745,007 15,670 18,001 307,141 315,102 5,116,916
32 Other manufacturing 1,896,334 1,626,874 860 2,595 135,565 14,490 3,676,718
33 Repair and installation of machinery and equipment 35,614 166,256 4,035 - 14,819 - 220,724
C Manufacturing 388,967,174 382,602,090 144,128,280 16,436,555 36,402,718 41,526,279 1,010,063,096
D Electricity, gas, steam and air conditioning supply 212,009,947 334,048,203 2,539 - 3,244,604 315 549,305,608
36 Water collection, treatment and supply 22,297,393 4,249,231 50,774 828,457 6,870,299 - 34,296,154
38 Waste collection, treatment and disposal activities; materials recovery 624,318 289,766 - - 7,210 195,222 1,116,516
E Water supply; sewerage, waste management and remediation activities 22,921,711 4,538,997 50,774 828,457 6,877,509 195,222 35,412,670
Total 708,560,515 1,222,183,796 144,320,808 35,445,143 47,675,049 42,209,661 2,200,394,972
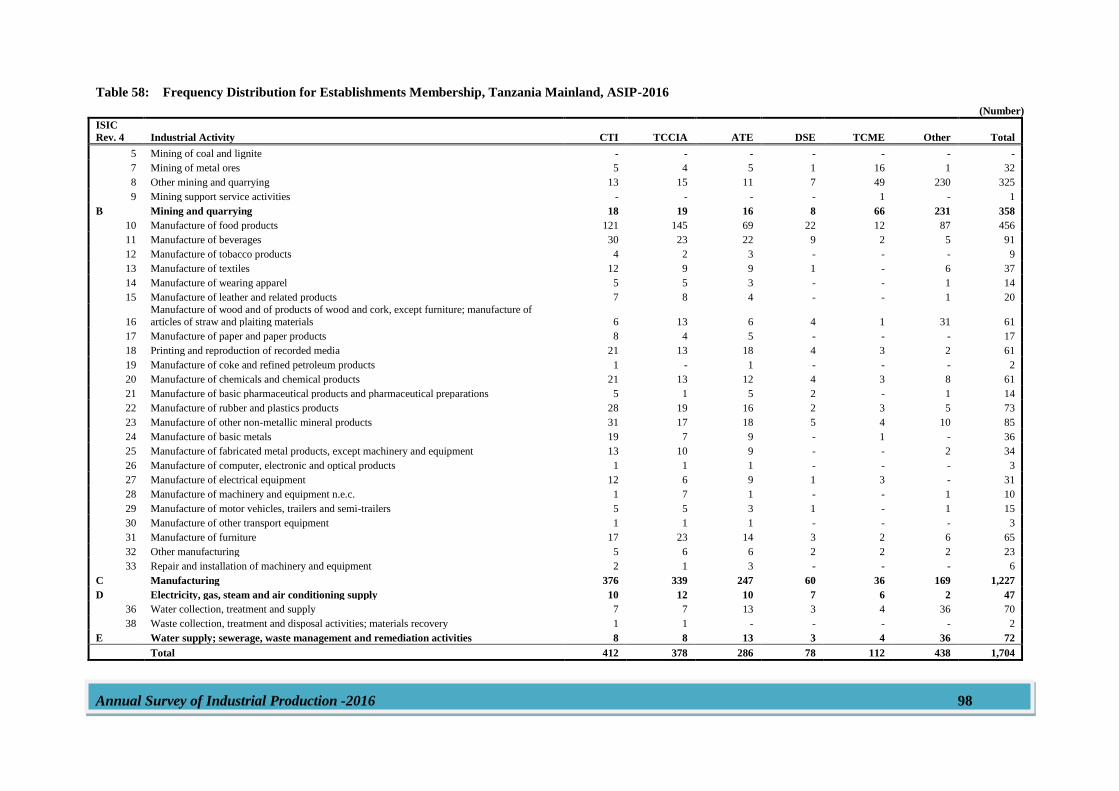
Annual Survey of Industrial Production -2016 98
Table 58: Frequency Distribution for Establishments Membership, Tanzania Mainland, ASIP-2016
(Number) ISIC
Rev. 4 Industrial Activity CTI TCCIA ATE DSE TCME Other Total
5 Mining of coal and lignite - - - - - - -
7 Mining of metal ores 5 4 5 1 16 1 32
8 Other mining and quarrying 13 15 11 7 49 230 325
9 Mining support service activities - - - - 1 - 1
B Mining and quarrying 18 19 16 8 66 231 358
10 Manufacture of food products 121 145 69 22 12 87 456
11 Manufacture of beverages 30 23 22 9 2 5 91
12 Manufacture of tobacco products 4 2 3 - - - 9
13 Manufacture of textiles 12 9 9 1 - 6 37
14 Manufacture of wearing apparel 5 5 3 - - 1 14
15 Manufacture of leather and related products 7 8 4 - - 1 20
16
Manufacture of wood and of products of wood and cork, except furniture; manufacture of
articles of straw and plaiting materials 6 13 6 4 1 31 61
17 Manufacture of paper and paper products 8 4 5 - - - 17
18 Printing and reproduction of recorded media 21 13 18 4 3 2 61
19 Manufacture of coke and refined petroleum products 1 - 1 - - - 2
20 Manufacture of chemicals and chemical products 21 13 12 4 3 8 61
21 Manufacture of basic pharmaceutical products and pharmaceutical preparations 5 1 5 2 - 1 14
22 Manufacture of rubber and plastics products 28 19 16 2 3 5 73
23 Manufacture of other non-metallic mineral products 31 17 18 5 4 10 85
24 Manufacture of basic metals 19 7 9 - 1 - 36
25 Manufacture of fabricated metal products, except machinery and equipment 13 10 9 - - 2 34
26 Manufacture of computer, electronic and optical products 1 1 1 - - - 3
27 Manufacture of electrical equipment 12 6 9 1 3 - 31
28 Manufacture of machinery and equipment n.e.c. 1 7 1 - - 1 10
29 Manufacture of motor vehicles, trailers and semi-trailers 5 5 3 1 - 1 15
30 Manufacture of other transport equipment 1 1 1 - - - 3
31 Manufacture of furniture 17 23 14 3 2 6 65
32 Other manufacturing 5 6 6 2 2 2 23
33 Repair and installation of machinery and equipment 2 1 3 - - - 6
C Manufacturing 376 339 247 60 36 169 1,227
D Electricity, gas, steam and air conditioning supply 10 12 10 7 6 2 47
36 Water collection, treatment and supply 7 7 13 3 4 36 70
38 Waste collection, treatment and disposal activities; materials recovery 1 1 - - - - 2
E Water supply; sewerage, waste management and remediation activities 8 8 13 3 4 36 72
Total 412 378 286 78 112 438 1,704
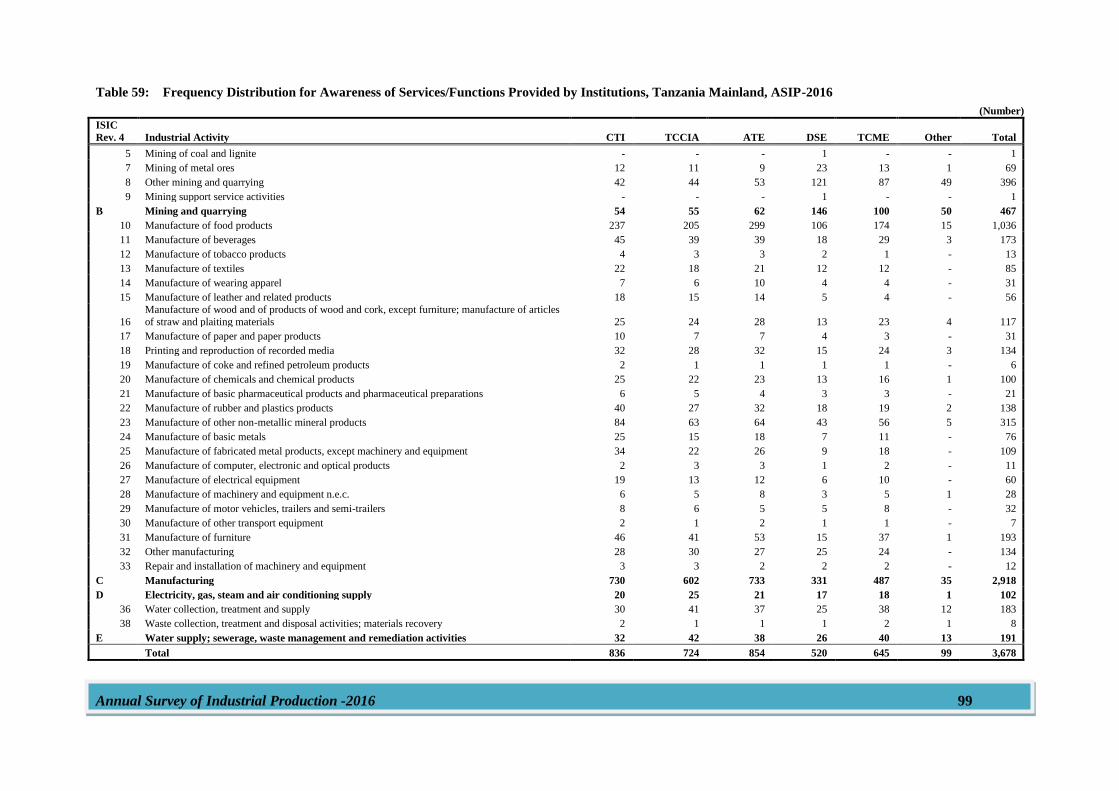
Annual Survey of Industrial Production -2016 99
Table 59: Frequency Distribution for Awareness of Services/Functions Provided by Institutions, Tanzania Mainland, ASIP-2016
(Number) ISIC
Rev. 4 Industrial Activity CTI TCCIA ATE DSE TCME Other Total
5 Mining of coal and lignite - - - 1 - - 1
7 Mining of metal ores 12 11 9 23 13 1 69
8 Other mining and quarrying 42 44 53 121 87 49 396
9 Mining support service activities - - - 1 - - 1
B Mining and quarrying 54 55 62 146 100 50 467
10 Manufacture of food products 237 205 299 106 174 15 1,036
11 Manufacture of beverages 45 39 39 18 29 3 173
12 Manufacture of tobacco products 4 3 3 2 1 - 13
13 Manufacture of textiles 22 18 21 12 12 - 85
14 Manufacture of wearing apparel 7 6 10 4 4 - 31
15 Manufacture of leather and related products 18 15 14 5 4 - 56
16
Manufacture of wood and of products of wood and cork, except furniture; manufacture of articles
of straw and plaiting materials 25 24 28 13 23 4 117
17 Manufacture of paper and paper products 10 7 7 4 3 - 31
18 Printing and reproduction of recorded media 32 28 32 15 24 3 134
19 Manufacture of coke and refined petroleum products 2 1 1 1 1 - 6
20 Manufacture of chemicals and chemical products 25 22 23 13 16 1 100
21 Manufacture of basic pharmaceutical products and pharmaceutical preparations 6 5 4 3 3 - 21
22 Manufacture of rubber and plastics products 40 27 32 18 19 2 138
23 Manufacture of other non-metallic mineral products 84 63 64 43 56 5 315
24 Manufacture of basic metals 25 15 18 7 11 - 76
25 Manufacture of fabricated metal products, except machinery and equipment 34 22 26 9 18 - 109
26 Manufacture of computer, electronic and optical products 2 3 3 1 2 - 11
27 Manufacture of electrical equipment 19 13 12 6 10 - 60
28 Manufacture of machinery and equipment n.e.c. 6 5 8 3 5 1 28
29 Manufacture of motor vehicles, trailers and semi-trailers 8 6 5 5 8 - 32
30 Manufacture of other transport equipment 2 1 2 1 1 - 7
31 Manufacture of furniture 46 41 53 15 37 1 193
32 Other manufacturing 28 30 27 25 24 - 134
33 Repair and installation of machinery and equipment 3 3 2 2 2 - 12
C Manufacturing 730 602 733 331 487 35 2,918
D Electricity, gas, steam and air conditioning supply 20 25 21 17 18 1 102
36 Water collection, treatment and supply 30 41 37 25 38 12 183
38 Waste collection, treatment and disposal activities; materials recovery 2 1 1 1 2 1 8
E Water supply; sewerage, waste management and remediation activities 32 42 38 26 40 13 191
Total 836 724 854 520 645 99 3,678
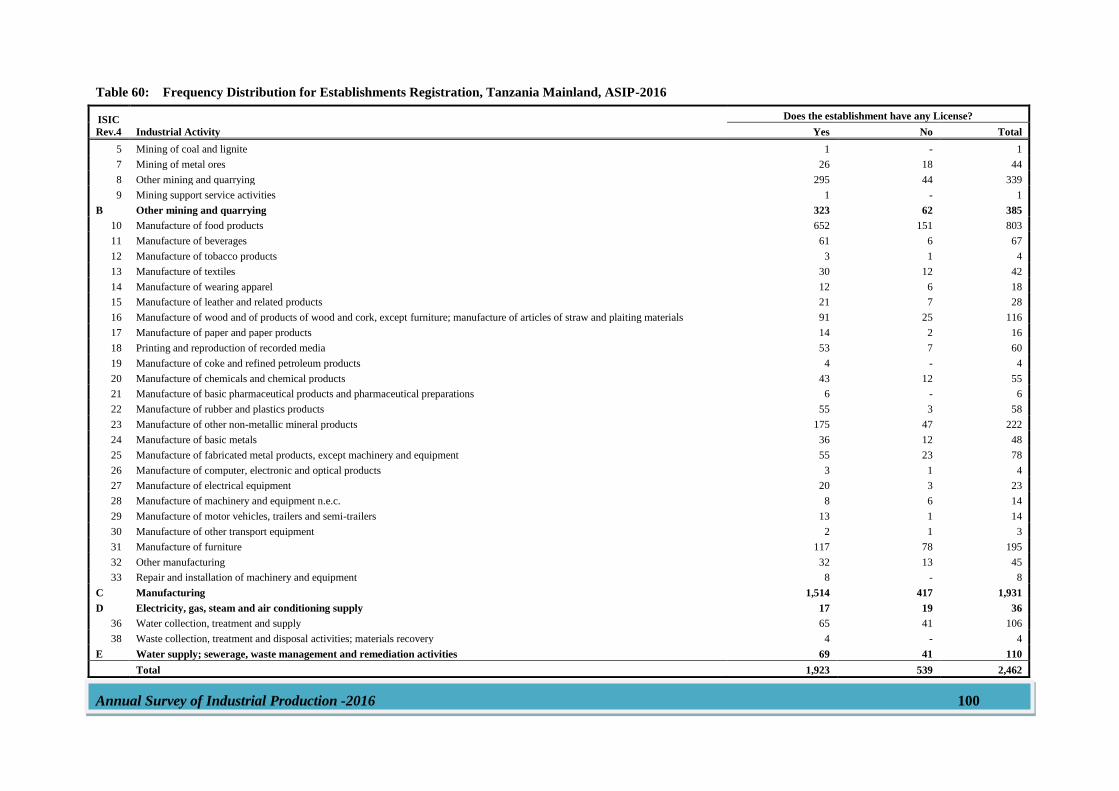
Annual Survey of Industrial Production -2016 100
Table 60: Frequency Distribution for Establishments Registration, Tanzania Mainland, ASIP-2016
ISIC
Rev.4 Industrial Activity
Does the establishment have any License?
Yes No Total
5 Mining of coal and lignite 1 - 1
7 Mining of metal ores 26 18 44
8 Other mining and quarrying 295 44 339
9 Mining support service activities 1 - 1
B Other mining and quarrying 323 62 385
10 Manufacture of food products 652 151 803
11 Manufacture of beverages 61 6 67
12 Manufacture of tobacco products 3 1 4
13 Manufacture of textiles 30 12 42
14 Manufacture of wearing apparel 12 6 18
15 Manufacture of leather and related products 21 7 28
16 Manufacture of wood and of products of wood and cork, except furniture; manufacture of articles of straw and plaiting materials 91 25 116
17 Manufacture of paper and paper products 14 2 16
18 Printing and reproduction of recorded media 53 7 60
19 Manufacture of coke and refined petroleum products 4 - 4
20 Manufacture of chemicals and chemical products 43 12 55
21 Manufacture of basic pharmaceutical products and pharmaceutical preparations 6 - 6
22 Manufacture of rubber and plastics products 55 3 58
23 Manufacture of other non-metallic mineral products 175 47 222
24 Manufacture of basic metals 36 12 48
25 Manufacture of fabricated metal products, except machinery and equipment 55 23 78
26 Manufacture of computer, electronic and optical products 3 1 4
27 Manufacture of electrical equipment 20 3 23
28 Manufacture of machinery and equipment n.e.c. 8 6 14
29 Manufacture of motor vehicles, trailers and semi-trailers 13 1 14
30 Manufacture of other transport equipment 2 1 3
31 Manufacture of furniture 117 78 195
32 Other manufacturing 32 13 45
33 Repair and installation of machinery and equipment 8 - 8
C Manufacturing 1,514 417 1,931
D Electricity, gas, steam and air conditioning supply 17 19 36
36 Water collection, treatment and supply 65 41 106
38 Waste collection, treatment and disposal activities; materials recovery 4 - 4
E Water supply; sewerage, waste management and remediation activities 69 41 110
Total 1,923 539 2,462
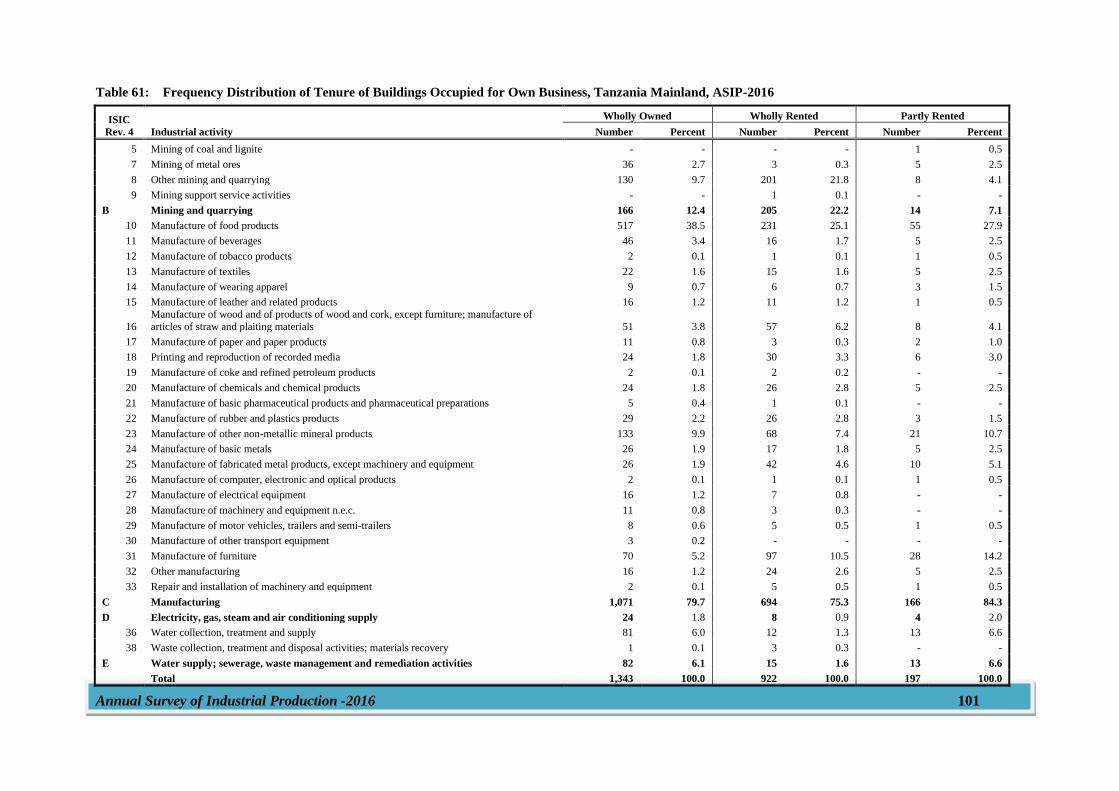
Annual Survey of Industrial Production -2016 101
Table 61: Frequency Distribution of Tenure of Buildings Occupied for Own Business, Tanzania Mainland, ASIP-2016
ISIC
Rev. 4 Industrial activity
Wholly Owned Wholly Rented Partly Rented
Number Percent Number Percent Number Percent
5 Mining of coal and lignite - - - - 1 0.5
7 Mining of metal ores 36 2.7 3 0.3 5 2.5
8 Other mining and quarrying 130 9.7 201 21.8 8 4.1
9 Mining support service activities - - 1 0.1 - -
B Mining and quarrying 166 12.4 205 22.2 14 7.1
10 Manufacture of food products 517 38.5 231 25.1 55 27.9
11 Manufacture of beverages 46 3.4 16 1.7 5 2.5
12 Manufacture of tobacco products 2 0.1 1 0.1 1 0.5
13 Manufacture of textiles 22 1.6 15 1.6 5 2.5
14 Manufacture of wearing apparel 9 0.7 6 0.7 3 1.5
15 Manufacture of leather and related products 16 1.2 11 1.2 1 0.5
16
Manufacture of wood and of products of wood and cork, except furniture; manufacture of
articles of straw and plaiting materials 51 3.8 57 6.2 8 4.1
17 Manufacture of paper and paper products 11 0.8 3 0.3 2 1.0
18 Printing and reproduction of recorded media 24 1.8 30 3.3 6 3.0
19 Manufacture of coke and refined petroleum products 2 0.1 2 0.2 - -
20 Manufacture of chemicals and chemical products 24 1.8 26 2.8 5 2.5
21 Manufacture of basic pharmaceutical products and pharmaceutical preparations 5 0.4 1 0.1 - -
22 Manufacture of rubber and plastics products 29 2.2 26 2.8 3 1.5
23 Manufacture of other non-metallic mineral products 133 9.9 68 7.4 21 10.7
24 Manufacture of basic metals 26 1.9 17 1.8 5 2.5
25 Manufacture of fabricated metal products, except machinery and equipment 26 1.9 42 4.6 10 5.1
26 Manufacture of computer, electronic and optical products 2 0.1 1 0.1 1 0.5
27 Manufacture of electrical equipment 16 1.2 7 0.8 - -
28 Manufacture of machinery and equipment n.e.c. 11 0.8 3 0.3 - -
29 Manufacture of motor vehicles, trailers and semi-trailers 8 0.6 5 0.5 1 0.5
30 Manufacture of other transport equipment 3 0.2 - - - -
31 Manufacture of furniture 70 5.2 97 10.5 28 14.2
32 Other manufacturing 16 1.2 24 2.6 5 2.5
33 Repair and installation of machinery and equipment 2 0.1 5 0.5 1 0.5
C Manufacturing 1,071 79.7 694 75.3 166 84.3
D Electricity, gas, steam and air conditioning supply 24 1.8 8 0.9 4 2.0
36 Water collection, treatment and supply 81 6.0 12 1.3 13 6.6
38 Waste collection, treatment and disposal activities; materials recovery 1 0.1 3 0.3 - -
E Water supply; sewerage, waste management and remediation activities 82 6.1 15 1.6 13 6.6
Total 1,343 100.0 922 100.0 197 100.0
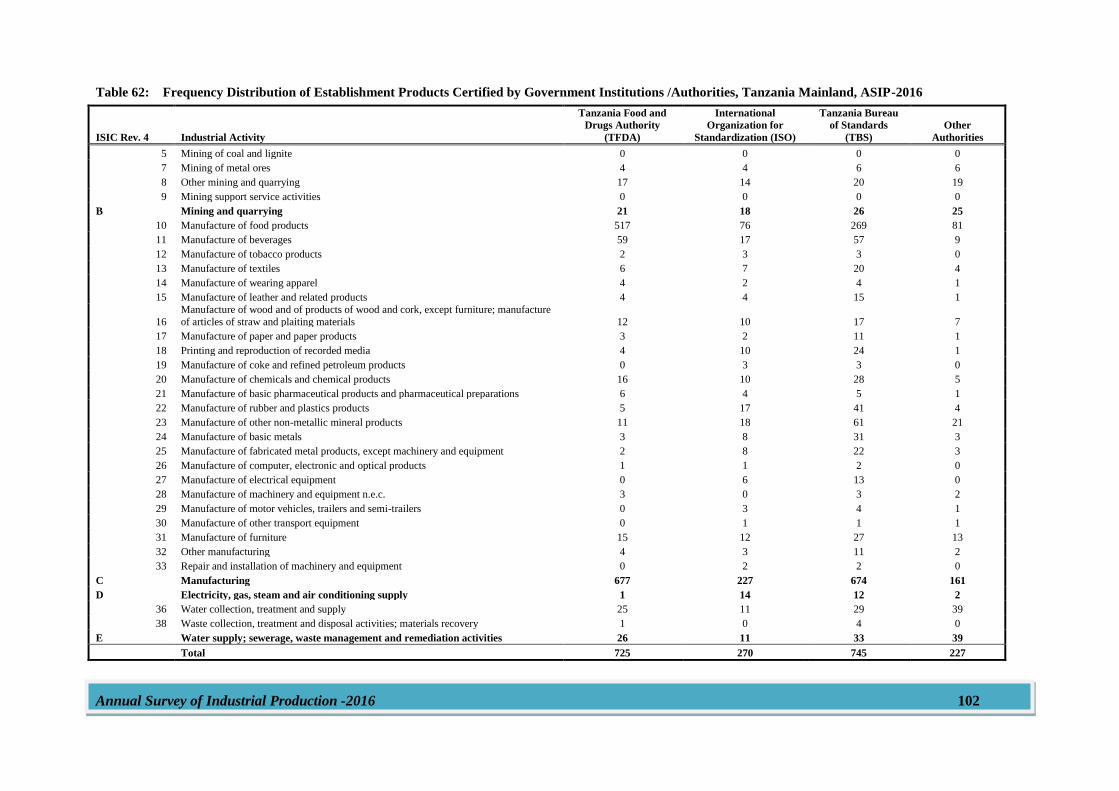
Annual Survey of Industrial Production -2016 102
Table 62: Frequency Distribution of Establishment Products Certified by Government Institutions /Authorities, Tanzania Mainland, ASIP-2016
ISIC Rev. 4 Industrial Activity
Tanzania Food and
Drugs Authority
(TFDA)
International
Organization for
Standardization (ISO)
Tanzania Bureau
of Standards
(TBS)
Other
Authorities
5 Mining of coal and lignite 0 0 0 0
7 Mining of metal ores 4 4 6 6
8 Other mining and quarrying 17 14 20 19
9 Mining support service activities 0 0 0 0
B Mining and quarrying 21 18 26 25
10 Manufacture of food products 517 76 269 81
11 Manufacture of beverages 59 17 57 9
12 Manufacture of tobacco products 2 3 3 0
13 Manufacture of textiles 6 7 20 4
14 Manufacture of wearing apparel 4 2 4 1
15 Manufacture of leather and related products 4 4 15 1
16
Manufacture of wood and of products of wood and cork, except furniture; manufacture
of articles of straw and plaiting materials 12 10 17 7
17 Manufacture of paper and paper products 3 2 11 1
18 Printing and reproduction of recorded media 4 10 24 1
19 Manufacture of coke and refined petroleum products 0 3 3 0
20 Manufacture of chemicals and chemical products 16 10 28 5
21 Manufacture of basic pharmaceutical products and pharmaceutical preparations 6 4 5 1
22 Manufacture of rubber and plastics products 5 17 41 4
23 Manufacture of other non-metallic mineral products 11 18 61 21
24 Manufacture of basic metals 3 8 31 3
25 Manufacture of fabricated metal products, except machinery and equipment 2 8 22 3
26 Manufacture of computer, electronic and optical products 1 1 2 0
27 Manufacture of electrical equipment 0 6 13 0
28 Manufacture of machinery and equipment n.e.c. 3 0 3 2
29 Manufacture of motor vehicles, trailers and semi-trailers 0 3 4 1
30 Manufacture of other transport equipment 0 1 1 1
31 Manufacture of furniture 15 12 27 13
32 Other manufacturing 4 3 11 2
33 Repair and installation of machinery and equipment 0 2 2 0
C Manufacturing 677 227 674 161
D Electricity, gas, steam and air conditioning supply 1 14 12 2
36 Water collection, treatment and supply 25 11 29 39
38 Waste collection, treatment and disposal activities; materials recovery 1 0 4 0
E Water supply; sewerage, waste management and remediation activities 26 11 33 39
Total 725 270 745 227
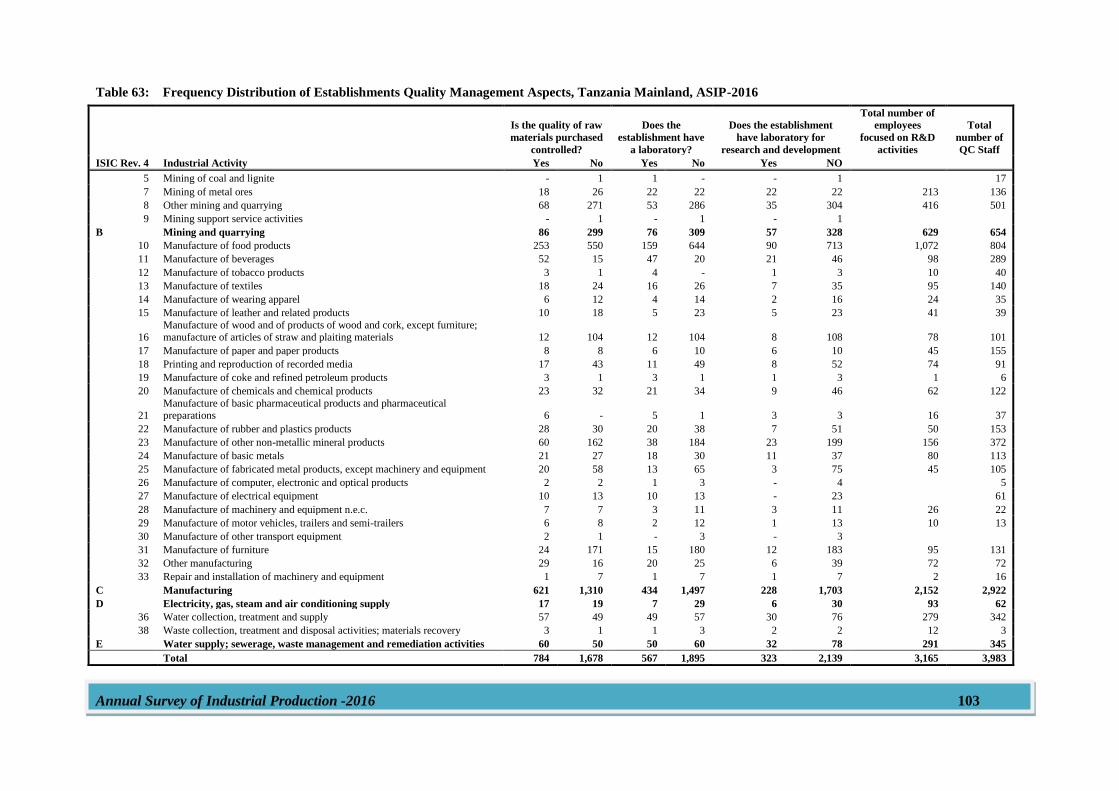
Annual Survey of Industrial Production -2016 103
Table 63: Frequency Distribution of Establishments Quality Management Aspects, Tanzania Mainland, ASIP-2016
ISIC Rev. 4 Industrial Activity
Is the quality of raw
materials purchased
controlled?
Does the
establishment have
a laboratory?
Does the establishment
have laboratory for
research and development
Total number of
employees
focused on R&D
activities
Total
number of
QC Staff
Yes No Yes No Yes NO
5 Mining of coal and lignite - 1 1 - - 1
17
7 Mining of metal ores 18 26 22 22 22 22 213 136
8 Other mining and quarrying 68 271 53 286 35 304 416 501
9 Mining support service activities - 1 - 1 - 1
B Mining and quarrying 86 299 76 309 57 328 629 654
10 Manufacture of food products 253 550 159 644 90 713 1,072 804
11 Manufacture of beverages 52 15 47 20 21 46 98 289
12 Manufacture of tobacco products 3 1 4 - 1 3 10 40
13 Manufacture of textiles 18 24 16 26 7 35 95 140
14 Manufacture of wearing apparel 6 12 4 14 2 16 24 35
15 Manufacture of leather and related products 10 18 5 23 5 23 41 39
16 Manufacture of wood and of products of wood and cork, except furniture; manufacture of articles of straw and plaiting materials 12 104 12 104 8 108 78 101
17 Manufacture of paper and paper products 8 8 6 10 6 10 45 155
18 Printing and reproduction of recorded media 17 43 11 49 8 52 74 91
19 Manufacture of coke and refined petroleum products 3 1 3 1 1 3 1 6
20 Manufacture of chemicals and chemical products 23 32 21 34 9 46 62 122
21 Manufacture of basic pharmaceutical products and pharmaceutical preparations 6 - 5 1 3 3 16 37
22 Manufacture of rubber and plastics products 28 30 20 38 7 51 50 153
23 Manufacture of other non-metallic mineral products 60 162 38 184 23 199 156 372
24 Manufacture of basic metals 21 27 18 30 11 37 80 113
25 Manufacture of fabricated metal products, except machinery and equipment 20 58 13 65 3 75 45 105
26 Manufacture of computer, electronic and optical products 2 2 1 3 - 4
5
27 Manufacture of electrical equipment 10 13 10 13 - 23
61
28 Manufacture of machinery and equipment n.e.c. 7 7 3 11 3 11 26 22
29 Manufacture of motor vehicles, trailers and semi-trailers 6 8 2 12 1 13 10 13
30 Manufacture of other transport equipment 2 1 - 3 - 3
31 Manufacture of furniture 24 171 15 180 12 183 95 131
32 Other manufacturing 29 16 20 25 6 39 72 72
33 Repair and installation of machinery and equipment 1 7 1 7 1 7 2 16
C Manufacturing 621 1,310 434 1,497 228 1,703 2,152 2,922
D Electricity, gas, steam and air conditioning supply 17 19 7 29 6 30 93 62
36 Water collection, treatment and supply 57 49 49 57 30 76 279 342
38 Waste collection, treatment and disposal activities; materials recovery 3 1 1 3 2 2 12 3
E Water supply; sewerage, waste management and remediation activities 60 50 50 60 32 78 291 345
Total 784 1,678 567 1,895 323 2,139 3,165 3,983
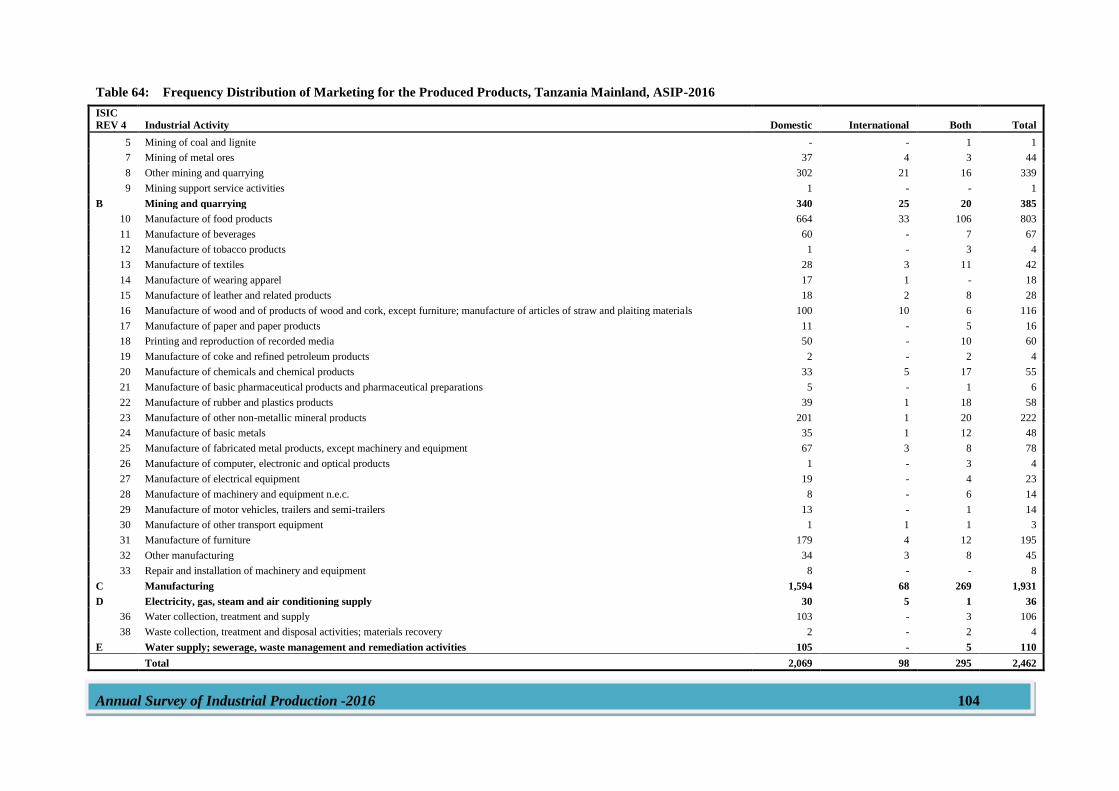
Annual Survey of Industrial Production -2016 104
Table 64: Frequency Distribution of Marketing for the Produced Products, Tanzania Mainland, ASIP-2016
ISIC
REV 4 Industrial Activity Domestic International Both Total
5 Mining of coal and lignite - - 1 1
7 Mining of metal ores 37 4 3 44
8 Other mining and quarrying 302 21 16 339
9 Mining support service activities 1 - - 1
B Mining and quarrying 340 25 20 385
10 Manufacture of food products 664 33 106 803
11 Manufacture of beverages 60 - 7 67
12 Manufacture of tobacco products 1 - 3 4
13 Manufacture of textiles 28 3 11 42
14 Manufacture of wearing apparel 17 1 - 18
15 Manufacture of leather and related products 18 2 8 28
16 Manufacture of wood and of products of wood and cork, except furniture; manufacture of articles of straw and plaiting materials 100 10 6 116
17 Manufacture of paper and paper products 11 - 5 16
18 Printing and reproduction of recorded media 50 - 10 60
19 Manufacture of coke and refined petroleum products 2 - 2 4
20 Manufacture of chemicals and chemical products 33 5 17 55
21 Manufacture of basic pharmaceutical products and pharmaceutical preparations 5 - 1 6
22 Manufacture of rubber and plastics products 39 1 18 58
23 Manufacture of other non-metallic mineral products 201 1 20 222
24 Manufacture of basic metals 35 1 12 48
25 Manufacture of fabricated metal products, except machinery and equipment 67 3 8 78
26 Manufacture of computer, electronic and optical products 1 - 3 4
27 Manufacture of electrical equipment 19 - 4 23
28 Manufacture of machinery and equipment n.e.c. 8 - 6 14
29 Manufacture of motor vehicles, trailers and semi-trailers 13 - 1 14
30 Manufacture of other transport equipment 1 1 1 3
31 Manufacture of furniture 179 4 12 195
32 Other manufacturing 34 3 8 45
33 Repair and installation of machinery and equipment 8 - - 8
C Manufacturing 1,594 68 269 1,931
D Electricity, gas, steam and air conditioning supply 30 5 1 36
36 Water collection, treatment and supply 103 - 3 106
38 Waste collection, treatment and disposal activities; materials recovery 2 - 2 4
E Water supply; sewerage, waste management and remediation activities 105 - 5 110
Total 2,069 98 295 2,462
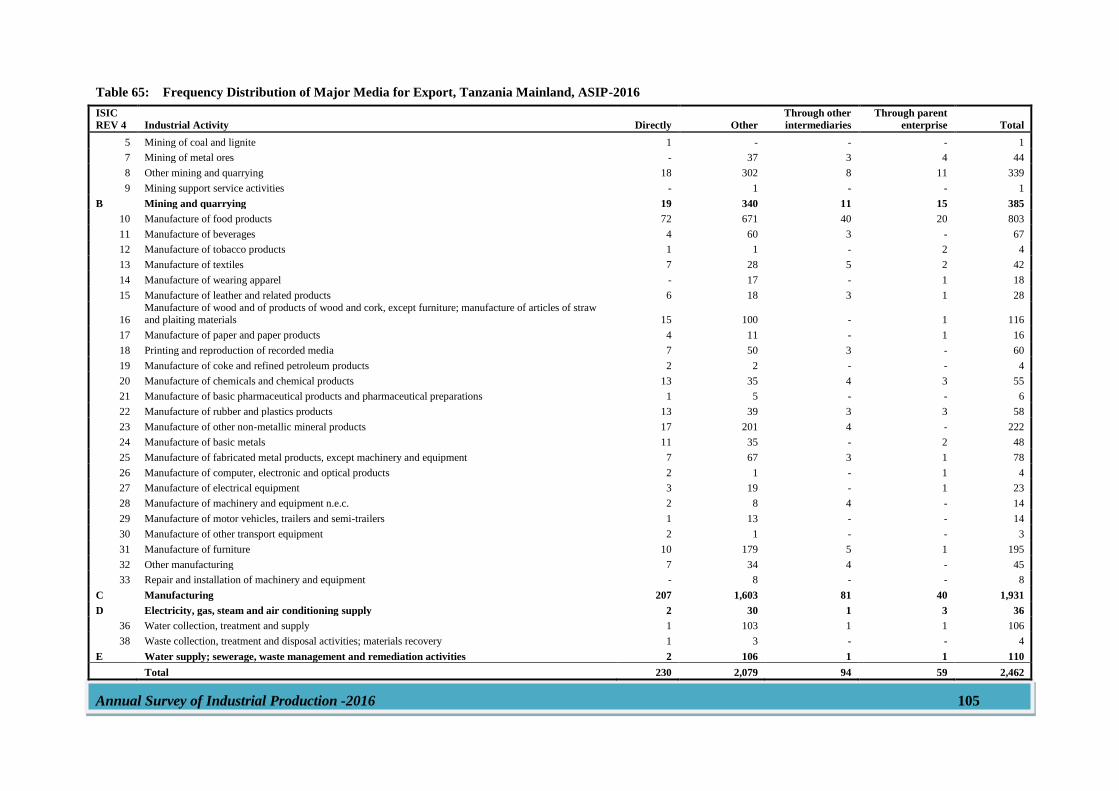
Annual Survey of Industrial Production -2016 105
Table 65: Frequency Distribution of Major Media for Export, Tanzania Mainland, ASIP-2016
ISIC
REV 4 Industrial Activity Directly Other
Through other
intermediaries
Through parent
enterprise Total
5 Mining of coal and lignite 1 - - - 1
7 Mining of metal ores - 37 3 4 44
8 Other mining and quarrying 18 302 8 11 339
9 Mining support service activities - 1 - - 1
B Mining and quarrying 19 340 11 15 385
10 Manufacture of food products 72 671 40 20 803
11 Manufacture of beverages 4 60 3 - 67
12 Manufacture of tobacco products 1 1 - 2 4
13 Manufacture of textiles 7 28 5 2 42
14 Manufacture of wearing apparel - 17 - 1 18
15 Manufacture of leather and related products 6 18 3 1 28
16 Manufacture of wood and of products of wood and cork, except furniture; manufacture of articles of straw and plaiting materials 15 100 - 1 116
17 Manufacture of paper and paper products 4 11 - 1 16
18 Printing and reproduction of recorded media 7 50 3 - 60
19 Manufacture of coke and refined petroleum products 2 2 - - 4
20 Manufacture of chemicals and chemical products 13 35 4 3 55
21 Manufacture of basic pharmaceutical products and pharmaceutical preparations 1 5 - - 6
22 Manufacture of rubber and plastics products 13 39 3 3 58
23 Manufacture of other non-metallic mineral products 17 201 4 - 222
24 Manufacture of basic metals 11 35 - 2 48
25 Manufacture of fabricated metal products, except machinery and equipment 7 67 3 1 78
26 Manufacture of computer, electronic and optical products 2 1 - 1 4
27 Manufacture of electrical equipment 3 19 - 1 23
28 Manufacture of machinery and equipment n.e.c. 2 8 4 - 14
29 Manufacture of motor vehicles, trailers and semi-trailers 1 13 - - 14
30 Manufacture of other transport equipment 2 1 - - 3
31 Manufacture of furniture 10 179 5 1 195
32 Other manufacturing 7 34 4 - 45
33 Repair and installation of machinery and equipment - 8 - - 8
C Manufacturing 207 1,603 81 40 1,931
D Electricity, gas, steam and air conditioning supply 2 30 1 3 36
36 Water collection, treatment and supply 1 103 1 1 106
38 Waste collection, treatment and disposal activities; materials recovery 1 3 - - 4
E Water supply; sewerage, waste management and remediation activities 2 106 1 1 110
Total 230 2,079 94 59 2,462
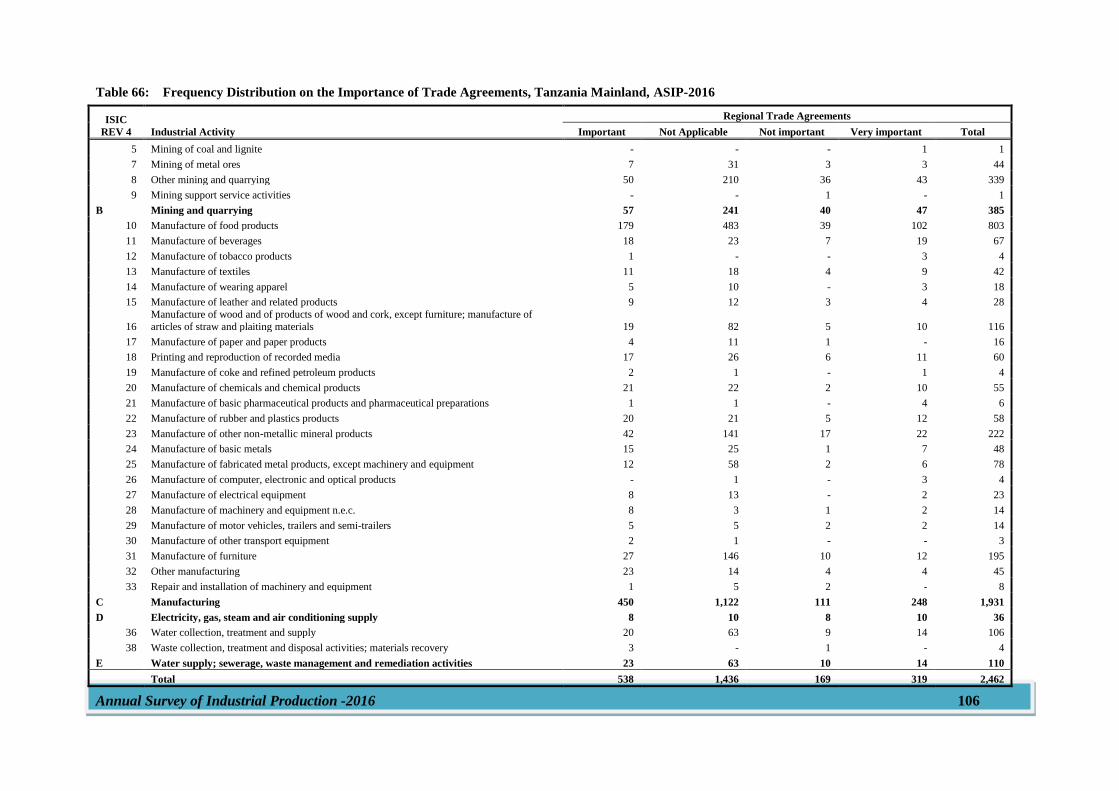
Annual Survey of Industrial Production -2016 106
Table 66: Frequency Distribution on the Importance of Trade Agreements, Tanzania Mainland, ASIP-2016
ISIC
REV 4 Industrial Activity
Regional Trade Agreements
Important Not Applicable Not important Very important Total
5 Mining of coal and lignite - - - 1 1
7 Mining of metal ores 7 31 3 3 44
8 Other mining and quarrying 50 210 36 43 339
9 Mining support service activities - - 1 - 1
B Mining and quarrying 57 241 40 47 385
10 Manufacture of food products 179 483 39 102 803
11 Manufacture of beverages 18 23 7 19 67
12 Manufacture of tobacco products 1 - - 3 4
13 Manufacture of textiles 11 18 4 9 42
14 Manufacture of wearing apparel 5 10 - 3 18
15 Manufacture of leather and related products 9 12 3 4 28
16
Manufacture of wood and of products of wood and cork, except furniture; manufacture of
articles of straw and plaiting materials 19 82 5 10 116
17 Manufacture of paper and paper products 4 11 1 - 16
18 Printing and reproduction of recorded media 17 26 6 11 60
19 Manufacture of coke and refined petroleum products 2 1 - 1 4
20 Manufacture of chemicals and chemical products 21 22 2 10 55
21 Manufacture of basic pharmaceutical products and pharmaceutical preparations 1 1 - 4 6
22 Manufacture of rubber and plastics products 20 21 5 12 58
23 Manufacture of other non-metallic mineral products 42 141 17 22 222
24 Manufacture of basic metals 15 25 1 7 48
25 Manufacture of fabricated metal products, except machinery and equipment 12 58 2 6 78
26 Manufacture of computer, electronic and optical products - 1 - 3 4
27 Manufacture of electrical equipment 8 13 - 2 23
28 Manufacture of machinery and equipment n.e.c. 8 3 1 2 14
29 Manufacture of motor vehicles, trailers and semi-trailers 5 5 2 2 14
30 Manufacture of other transport equipment 2 1 - - 3
31 Manufacture of furniture 27 146 10 12 195
32 Other manufacturing 23 14 4 4 45
33 Repair and installation of machinery and equipment 1 5 2 - 8
C Manufacturing 450 1,122 111 248 1,931
D Electricity, gas, steam and air conditioning supply 8 10 8 10 36
36 Water collection, treatment and supply 20 63 9 14 106
38 Waste collection, treatment and disposal activities; materials recovery 3 - 1 - 4
E Water supply; sewerage, waste management and remediation activities 23 63 10 14 110
Total 538 1,436 169 319 2,462
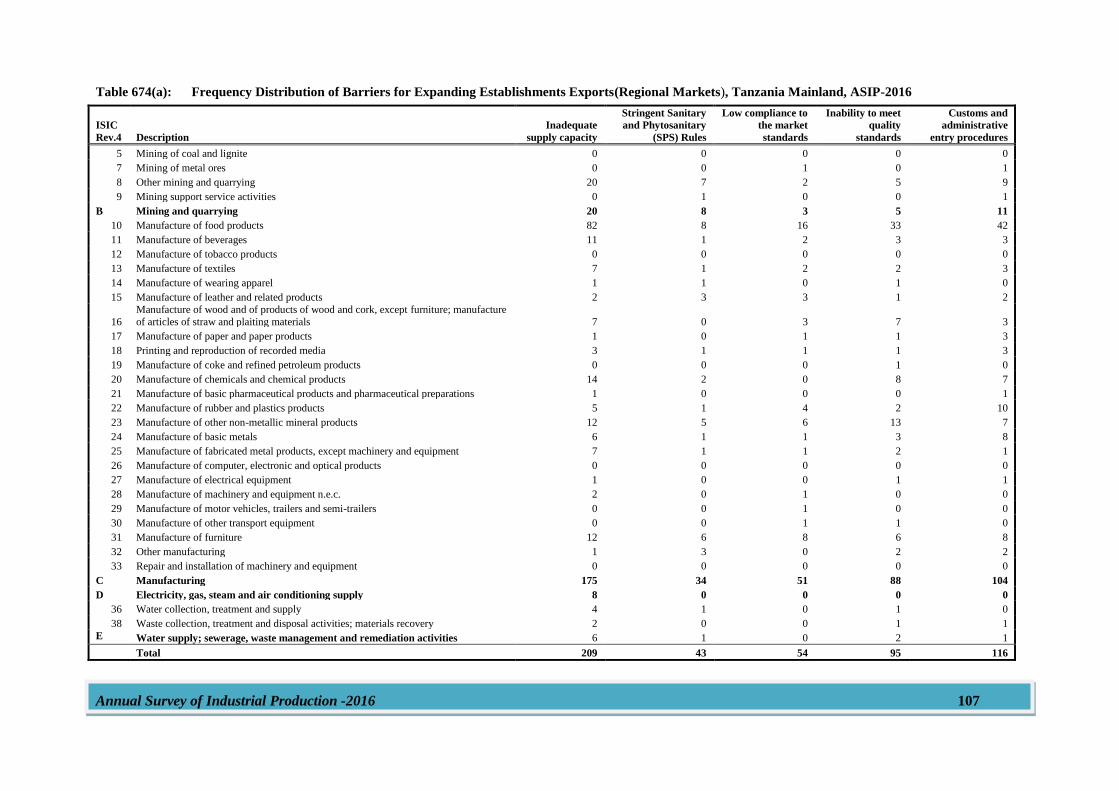
Annual Survey of Industrial Production -2016 107
Table 674(a): Frequency Distribution of Barriers for Expanding Establishments Exports(Regional Markets), Tanzania Mainland, ASIP-2016
ISIC
Rev.4 Description
Inadequate
supply capacity
Stringent Sanitary
and Phytosanitary
(SPS) Rules
Low compliance to
the market
standards
Inability to meet
quality
standards
Customs and
administrative
entry procedures
5 Mining of coal and lignite 0 0 0 0 0
7 Mining of metal ores 0 0 1 0 1
8 Other mining and quarrying 20 7 2 5 9
9 Mining support service activities 0 1 0 0 1
B Mining and quarrying 20 8 3 5 11
10 Manufacture of food products 82 8 16 33 42
11 Manufacture of beverages 11 1 2 3 3
12 Manufacture of tobacco products 0 0 0 0 0
13 Manufacture of textiles 7 1 2 2 3
14 Manufacture of wearing apparel 1 1 0 1 0
15 Manufacture of leather and related products 2 3 3 1 2
16
Manufacture of wood and of products of wood and cork, except furniture; manufacture
of articles of straw and plaiting materials 7 0 3 7 3
17 Manufacture of paper and paper products 1 0 1 1 3
18 Printing and reproduction of recorded media 3 1 1 1 3
19 Manufacture of coke and refined petroleum products 0 0 0 1 0
20 Manufacture of chemicals and chemical products 14 2 0 8 7
21 Manufacture of basic pharmaceutical products and pharmaceutical preparations 1 0 0 0 1
22 Manufacture of rubber and plastics products 5 1 4 2 10
23 Manufacture of other non-metallic mineral products 12 5 6 13 7
24 Manufacture of basic metals 6 1 1 3 8
25 Manufacture of fabricated metal products, except machinery and equipment 7 1 1 2 1
26 Manufacture of computer, electronic and optical products 0 0 0 0 0
27 Manufacture of electrical equipment 1 0 0 1 1
28 Manufacture of machinery and equipment n.e.c. 2 0 1 0 0
29 Manufacture of motor vehicles, trailers and semi-trailers 0 0 1 0 0
30 Manufacture of other transport equipment 0 0 1 1 0
31 Manufacture of furniture 12 6 8 6 8
32 Other manufacturing 1 3 0 2 2
33 Repair and installation of machinery and equipment 0 0 0 0 0
C Manufacturing 175 34 51 88 104
D Electricity, gas, steam and air conditioning supply 8 0 0 0 0
36 Water collection, treatment and supply 4 1 0 1 0
38 Waste collection, treatment and disposal activities; materials recovery 2 0 0 1 1
E Water supply; sewerage, waste management and remediation activities 6 1 0 2 1
Total 209 43 54 95 116
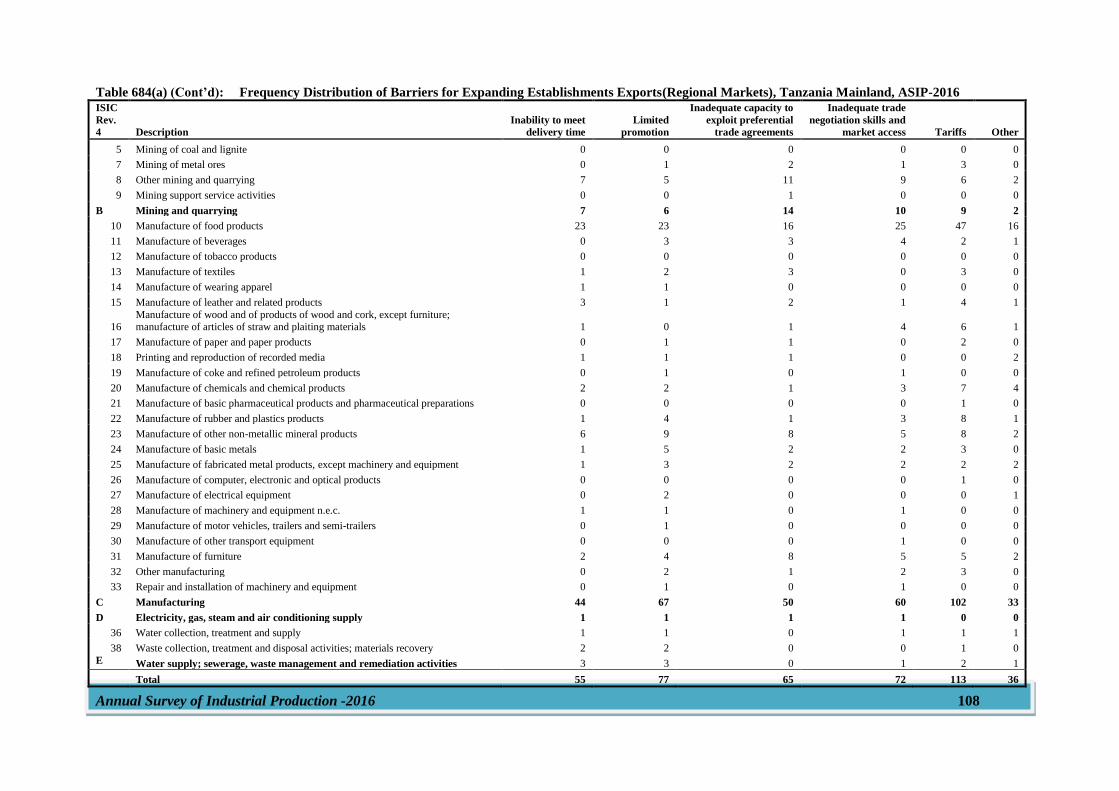
Annual Survey of Industrial Production -2016 108
Table 684(a) (Cont’d): Frequency Distribution of Barriers for Expanding Establishments Exports(Regional Markets), Tanzania Mainland, ASIP-2016 ISIC
Rev.
4 Description
Inability to meet
delivery time
Limited
promotion
Inadequate capacity to
exploit preferential
trade agreements
Inadequate trade
negotiation skills and
market access Tariffs Other
5 Mining of coal and lignite 0 0 0 0 0 0
7 Mining of metal ores 0 1 2 1 3 0
8 Other mining and quarrying 7 5 11 9 6 2
9 Mining support service activities 0 0 1 0 0 0
B Mining and quarrying 7 6 14 10 9 2
10 Manufacture of food products 23 23 16 25 47 16
11 Manufacture of beverages 0 3 3 4 2 1
12 Manufacture of tobacco products 0 0 0 0 0 0
13 Manufacture of textiles 1 2 3 0 3 0
14 Manufacture of wearing apparel 1 1 0 0 0 0
15 Manufacture of leather and related products 3 1 2 1 4 1
16 Manufacture of wood and of products of wood and cork, except furniture; manufacture of articles of straw and plaiting materials 1 0 1 4 6 1
17 Manufacture of paper and paper products 0 1 1 0 2 0
18 Printing and reproduction of recorded media 1 1 1 0 0 2
19 Manufacture of coke and refined petroleum products 0 1 0 1 0 0
20 Manufacture of chemicals and chemical products 2 2 1 3 7 4
21 Manufacture of basic pharmaceutical products and pharmaceutical preparations 0 0 0 0 1 0
22 Manufacture of rubber and plastics products 1 4 1 3 8 1
23 Manufacture of other non-metallic mineral products 6 9 8 5 8 2
24 Manufacture of basic metals 1 5 2 2 3 0
25 Manufacture of fabricated metal products, except machinery and equipment 1 3 2 2 2 2
26 Manufacture of computer, electronic and optical products 0 0 0 0 1 0
27 Manufacture of electrical equipment 0 2 0 0 0 1
28 Manufacture of machinery and equipment n.e.c. 1 1 0 1 0 0
29 Manufacture of motor vehicles, trailers and semi-trailers 0 1 0 0 0 0
30 Manufacture of other transport equipment 0 0 0 1 0 0
31 Manufacture of furniture 2 4 8 5 5 2
32 Other manufacturing 0 2 1 2 3 0
33 Repair and installation of machinery and equipment 0 1 0 1 0 0
C Manufacturing 44 67 50 60 102 33
D Electricity, gas, steam and air conditioning supply 1 1 1 1 0 0
36 Water collection, treatment and supply 1 1 0 1 1 1
38 Waste collection, treatment and disposal activities; materials recovery 2 2 0 0 1 0
E Water supply; sewerage, waste management and remediation activities 3 3 0 1 2 1
Total 55 77 65 72 113 36
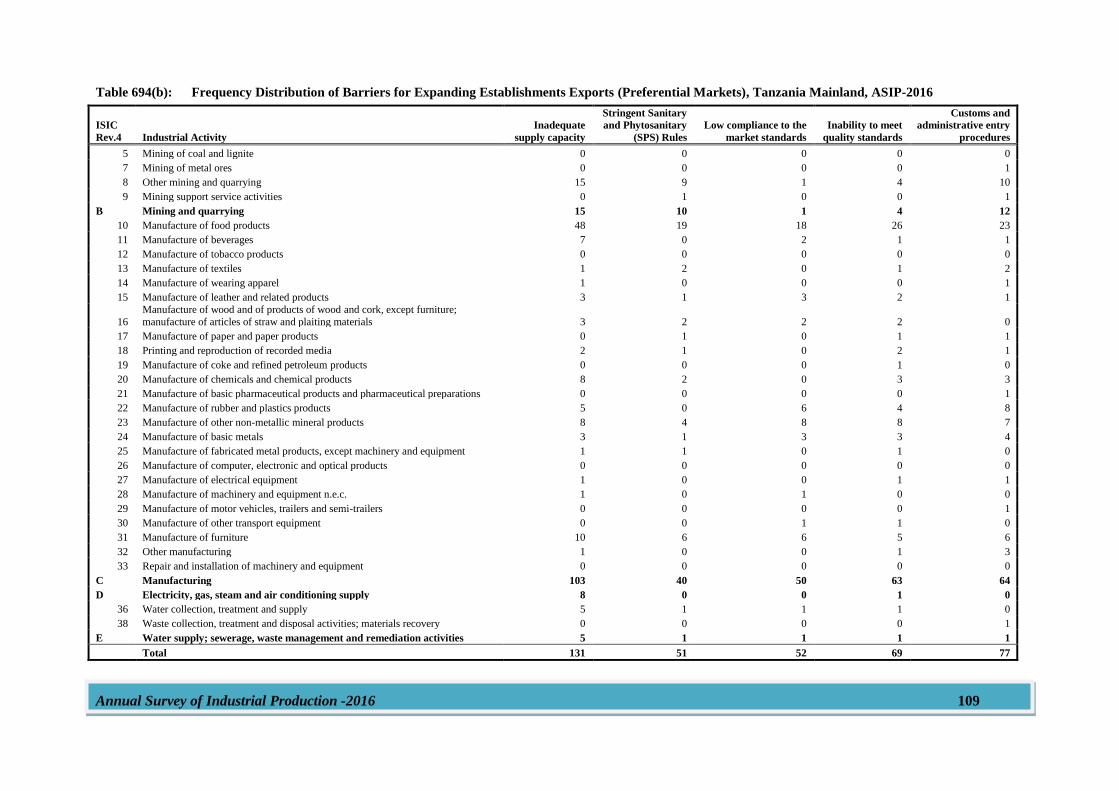
Annual Survey of Industrial Production -2016 109
Table 694(b): Frequency Distribution of Barriers for Expanding Establishments Exports (Preferential Markets), Tanzania Mainland, ASIP-2016
ISIC
Rev.4 Industrial Activity
Inadequate
supply capacity
Stringent Sanitary
and Phytosanitary
(SPS) Rules
Low compliance to the
market standards
Inability to meet
quality standards
Customs and
administrative entry
procedures
5 Mining of coal and lignite 0 0 0 0 0
7 Mining of metal ores 0 0 0 0 1
8 Other mining and quarrying 15 9 1 4 10
9 Mining support service activities 0 1 0 0 1
B Mining and quarrying 15 10 1 4 12
10 Manufacture of food products 48 19 18 26 23
11 Manufacture of beverages 7 0 2 1 1
12 Manufacture of tobacco products 0 0 0 0 0
13 Manufacture of textiles 1 2 0 1 2
14 Manufacture of wearing apparel 1 0 0 0 1
15 Manufacture of leather and related products 3 1 3 2 1
16
Manufacture of wood and of products of wood and cork, except furniture;
manufacture of articles of straw and plaiting materials 3 2 2 2 0
17 Manufacture of paper and paper products 0 1 0 1 1
18 Printing and reproduction of recorded media 2 1 0 2 1
19 Manufacture of coke and refined petroleum products 0 0 0 1 0
20 Manufacture of chemicals and chemical products 8 2 0 3 3
21 Manufacture of basic pharmaceutical products and pharmaceutical preparations 0 0 0 0 1
22 Manufacture of rubber and plastics products 5 0 6 4 8
23 Manufacture of other non-metallic mineral products 8 4 8 8 7
24 Manufacture of basic metals 3 1 3 3 4
25 Manufacture of fabricated metal products, except machinery and equipment 1 1 0 1 0
26 Manufacture of computer, electronic and optical products 0 0 0 0 0
27 Manufacture of electrical equipment 1 0 0 1 1
28 Manufacture of machinery and equipment n.e.c. 1 0 1 0 0
29 Manufacture of motor vehicles, trailers and semi-trailers 0 0 0 0 1
30 Manufacture of other transport equipment 0 0 1 1 0
31 Manufacture of furniture 10 6 6 5 6
32 Other manufacturing 1 0 0 1 3
33 Repair and installation of machinery and equipment 0 0 0 0 0
C Manufacturing 103 40 50 63 64
D Electricity, gas, steam and air conditioning supply 8 0 0 1 0
36 Water collection, treatment and supply 5 1 1 1 0
38 Waste collection, treatment and disposal activities; materials recovery 0 0 0 0 1
E Water supply; sewerage, waste management and remediation activities 5 1 1 1 1
Total 131 51 52 69 77
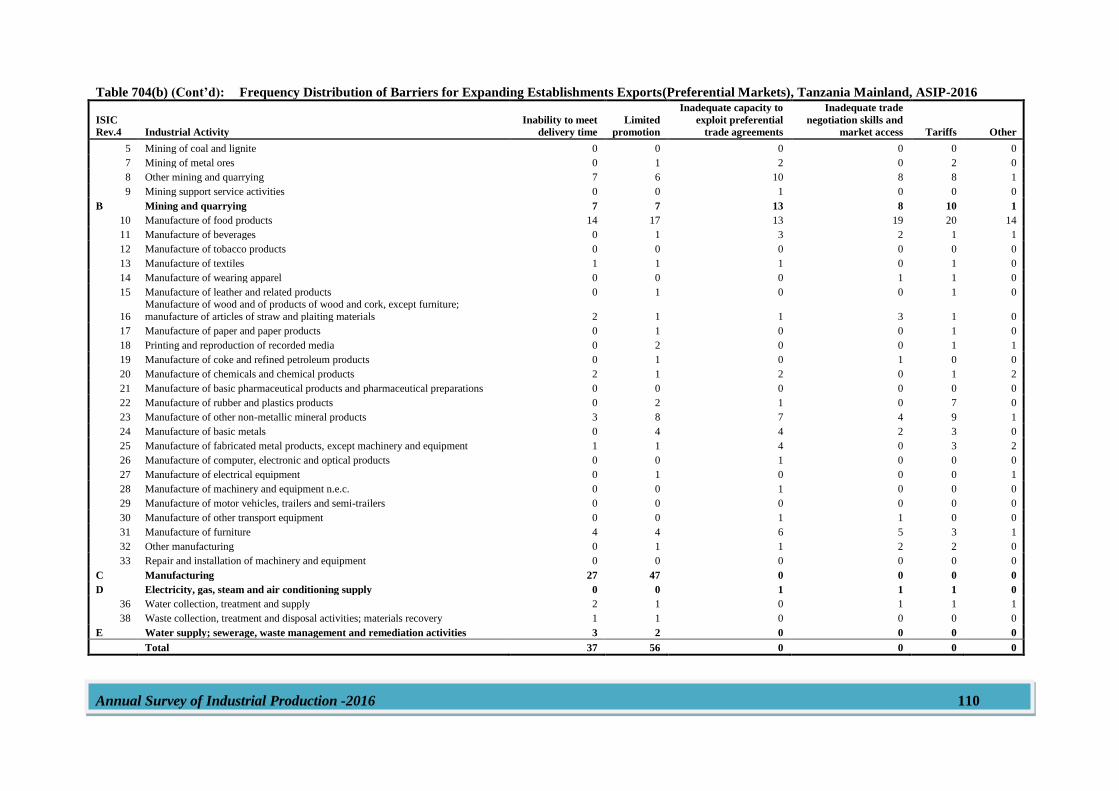
Annual Survey of Industrial Production -2016 110
Table 704(b) (Cont’d): Frequency Distribution of Barriers for Expanding Establishments Exports(Preferential Markets), Tanzania Mainland, ASIP-2016
ISIC
Rev.4 Industrial Activity
Inability to meet
delivery time
Limited
promotion
Inadequate capacity to
exploit preferential
trade agreements
Inadequate trade
negotiation skills and
market access Tariffs Other
5 Mining of coal and lignite 0 0 0 0 0 0
7 Mining of metal ores 0 1 2 0 2 0
8 Other mining and quarrying 7 6 10 8 8 1
9 Mining support service activities 0 0 1 0 0 0
B Mining and quarrying 7 7 13 8 10 1
10 Manufacture of food products 14 17 13 19 20 14
11 Manufacture of beverages 0 1 3 2 1 1
12 Manufacture of tobacco products 0 0 0 0 0 0
13 Manufacture of textiles 1 1 1 0 1 0
14 Manufacture of wearing apparel 0 0 0 1 1 0
15 Manufacture of leather and related products 0 1 0 0 1 0
16
Manufacture of wood and of products of wood and cork, except furniture;
manufacture of articles of straw and plaiting materials 2 1 1 3 1 0
17 Manufacture of paper and paper products 0 1 0 0 1 0
18 Printing and reproduction of recorded media 0 2 0 0 1 1
19 Manufacture of coke and refined petroleum products 0 1 0 1 0 0
20 Manufacture of chemicals and chemical products 2 1 2 0 1 2
21 Manufacture of basic pharmaceutical products and pharmaceutical preparations 0 0 0 0 0 0
22 Manufacture of rubber and plastics products 0 2 1 0 7 0
23 Manufacture of other non-metallic mineral products 3 8 7 4 9 1
24 Manufacture of basic metals 0 4 4 2 3 0
25 Manufacture of fabricated metal products, except machinery and equipment 1 1 4 0 3 2
26 Manufacture of computer, electronic and optical products 0 0 1 0 0 0
27 Manufacture of electrical equipment 0 1 0 0 0 1
28 Manufacture of machinery and equipment n.e.c. 0 0 1 0 0 0
29 Manufacture of motor vehicles, trailers and semi-trailers 0 0 0 0 0 0
30 Manufacture of other transport equipment 0 0 1 1 0 0
31 Manufacture of furniture 4 4 6 5 3 1
32 Other manufacturing 0 1 1 2 2 0
33 Repair and installation of machinery and equipment 0 0 0 0 0 0
C Manufacturing 27 47 0 0 0 0
D Electricity, gas, steam and air conditioning supply 0 0 1 1 1 0
36 Water collection, treatment and supply 2 1 0 1 1 1
38 Waste collection, treatment and disposal activities; materials recovery 1 1 0 0 0 0
E Water supply; sewerage, waste management and remediation activities 3 2 0 0 0 0
Total 37 56 0 0 0 0
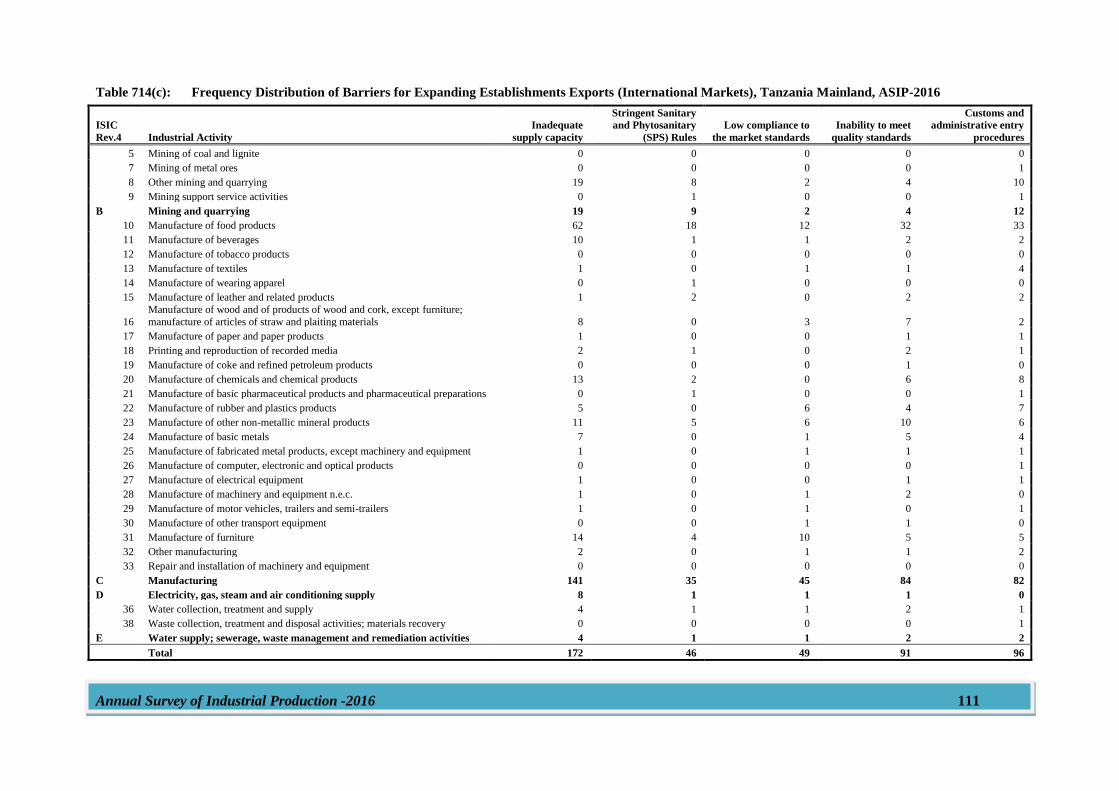
Annual Survey of Industrial Production -2016 111
Table 714(c): Frequency Distribution of Barriers for Expanding Establishments Exports (International Markets), Tanzania Mainland, ASIP-2016
ISIC
Rev.4 Industrial Activity
Inadequate
supply capacity
Stringent Sanitary
and Phytosanitary
(SPS) Rules
Low compliance to
the market standards
Inability to meet
quality standards
Customs and
administrative entry
procedures
5 Mining of coal and lignite 0 0 0 0 0
7 Mining of metal ores 0 0 0 0 1
8 Other mining and quarrying 19 8 2 4 10
9 Mining support service activities 0 1 0 0 1
B Mining and quarrying 19 9 2 4 12
10 Manufacture of food products 62 18 12 32 33
11 Manufacture of beverages 10 1 1 2 2
12 Manufacture of tobacco products 0 0 0 0 0
13 Manufacture of textiles 1 0 1 1 4
14 Manufacture of wearing apparel 0 1 0 0 0
15 Manufacture of leather and related products 1 2 0 2 2
16
Manufacture of wood and of products of wood and cork, except furniture;
manufacture of articles of straw and plaiting materials 8 0 3 7 2
17 Manufacture of paper and paper products 1 0 0 1 1
18 Printing and reproduction of recorded media 2 1 0 2 1
19 Manufacture of coke and refined petroleum products 0 0 0 1 0
20 Manufacture of chemicals and chemical products 13 2 0 6 8
21 Manufacture of basic pharmaceutical products and pharmaceutical preparations 0 1 0 0 1
22 Manufacture of rubber and plastics products 5 0 6 4 7
23 Manufacture of other non-metallic mineral products 11 5 6 10 6
24 Manufacture of basic metals 7 0 1 5 4
25 Manufacture of fabricated metal products, except machinery and equipment 1 0 1 1 1
26 Manufacture of computer, electronic and optical products 0 0 0 0 1
27 Manufacture of electrical equipment 1 0 0 1 1
28 Manufacture of machinery and equipment n.e.c. 1 0 1 2 0
29 Manufacture of motor vehicles, trailers and semi-trailers 1 0 1 0 1
30 Manufacture of other transport equipment 0 0 1 1 0
31 Manufacture of furniture 14 4 10 5 5
32 Other manufacturing 2 0 1 1 2
33 Repair and installation of machinery and equipment 0 0 0 0 0
C Manufacturing 141 35 45 84 82
D Electricity, gas, steam and air conditioning supply 8 1 1 1 0
36 Water collection, treatment and supply 4 1 1 2 1
38 Waste collection, treatment and disposal activities; materials recovery 0 0 0 0 1
E Water supply; sewerage, waste management and remediation activities 4 1 1 2 2
Total 172 46 49 91 96
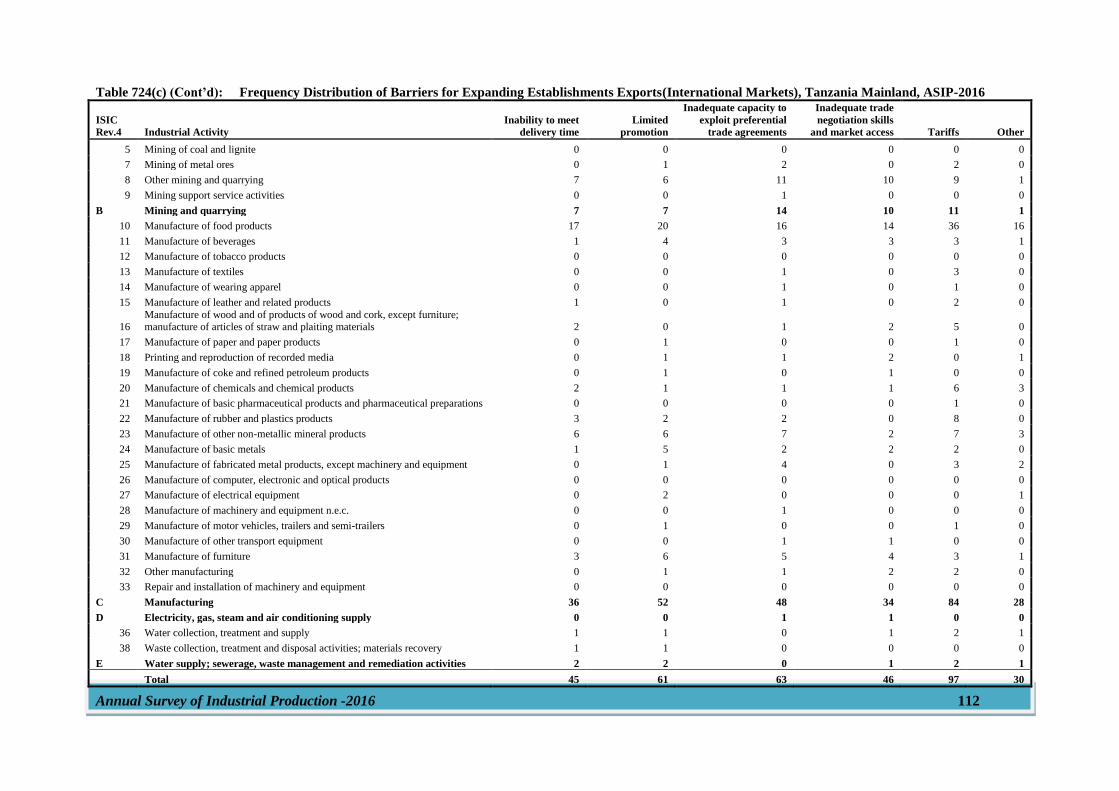
Annual Survey of Industrial Production -2016 112
Table 724(c) (Cont’d): Frequency Distribution of Barriers for Expanding Establishments Exports(International Markets), Tanzania Mainland, ASIP-2016
ISIC
Rev.4 Industrial Activity
Inability to meet
delivery time
Limited
promotion
Inadequate capacity to
exploit preferential
trade agreements
Inadequate trade
negotiation skills
and market access Tariffs Other
5 Mining of coal and lignite 0 0 0 0 0 0
7 Mining of metal ores 0 1 2 0 2 0
8 Other mining and quarrying 7 6 11 10 9 1
9 Mining support service activities 0 0 1 0 0 0
B Mining and quarrying 7 7 14 10 11 1
10 Manufacture of food products 17 20 16 14 36 16
11 Manufacture of beverages 1 4 3 3 3 1
12 Manufacture of tobacco products 0 0 0 0 0 0
13 Manufacture of textiles 0 0 1 0 3 0
14 Manufacture of wearing apparel 0 0 1 0 1 0
15 Manufacture of leather and related products 1 0 1 0 2 0
16 Manufacture of wood and of products of wood and cork, except furniture; manufacture of articles of straw and plaiting materials 2 0 1 2 5 0
17 Manufacture of paper and paper products 0 1 0 0 1 0
18 Printing and reproduction of recorded media 0 1 1 2 0 1
19 Manufacture of coke and refined petroleum products 0 1 0 1 0 0
20 Manufacture of chemicals and chemical products 2 1 1 1 6 3
21 Manufacture of basic pharmaceutical products and pharmaceutical preparations 0 0 0 0 1 0
22 Manufacture of rubber and plastics products 3 2 2 0 8 0
23 Manufacture of other non-metallic mineral products 6 6 7 2 7 3
24 Manufacture of basic metals 1 5 2 2 2 0
25 Manufacture of fabricated metal products, except machinery and equipment 0 1 4 0 3 2
26 Manufacture of computer, electronic and optical products 0 0 0 0 0 0
27 Manufacture of electrical equipment 0 2 0 0 0 1
28 Manufacture of machinery and equipment n.e.c. 0 0 1 0 0 0
29 Manufacture of motor vehicles, trailers and semi-trailers 0 1 0 0 1 0
30 Manufacture of other transport equipment 0 0 1 1 0 0
31 Manufacture of furniture 3 6 5 4 3 1
32 Other manufacturing 0 1 1 2 2 0
33 Repair and installation of machinery and equipment 0 0 0 0 0 0
C Manufacturing 36 52 48 34 84 28
D Electricity, gas, steam and air conditioning supply 0 0 1 1 0 0
36 Water collection, treatment and supply 1 1 0 1 2 1
38 Waste collection, treatment and disposal activities; materials recovery 1 1 0 0 0 0
E Water supply; sewerage, waste management and remediation activities 2 2 0 1 2 1
Total 45 61 63 46 97 30
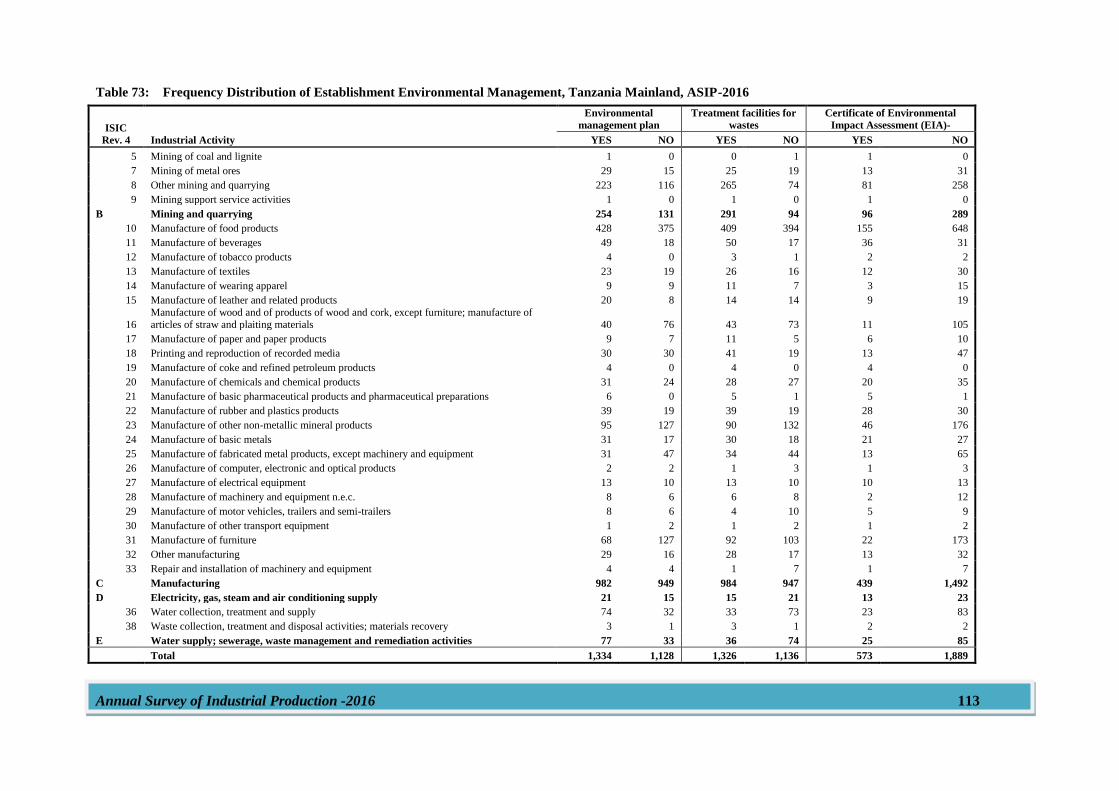
Annual Survey of Industrial Production -2016 113
Table 73: Frequency Distribution of Establishment Environmental Management, Tanzania Mainland, ASIP-2016
ISIC
Rev. 4 Industrial Activity
Environmental
management plan
Treatment facilities for
wastes
Certificate of Environmental
Impact Assessment (EIA)-
YES NO YES NO YES NO
5 Mining of coal and lignite 1 0 0 1 1 0
7 Mining of metal ores 29 15 25 19 13 31
8 Other mining and quarrying 223 116 265 74 81 258
9 Mining support service activities 1 0 1 0 1 0
B Mining and quarrying 254 131 291 94 96 289
10 Manufacture of food products 428 375 409 394 155 648
11 Manufacture of beverages 49 18 50 17 36 31
12 Manufacture of tobacco products 4 0 3 1 2 2
13 Manufacture of textiles 23 19 26 16 12 30
14 Manufacture of wearing apparel 9 9 11 7 3 15
15 Manufacture of leather and related products 20 8 14 14 9 19
16 Manufacture of wood and of products of wood and cork, except furniture; manufacture of articles of straw and plaiting materials 40 76 43 73 11 105
17 Manufacture of paper and paper products 9 7 11 5 6 10
18 Printing and reproduction of recorded media 30 30 41 19 13 47
19 Manufacture of coke and refined petroleum products 4 0 4 0 4 0
20 Manufacture of chemicals and chemical products 31 24 28 27 20 35
21 Manufacture of basic pharmaceutical products and pharmaceutical preparations 6 0 5 1 5 1
22 Manufacture of rubber and plastics products 39 19 39 19 28 30
23 Manufacture of other non-metallic mineral products 95 127 90 132 46 176
24 Manufacture of basic metals 31 17 30 18 21 27
25 Manufacture of fabricated metal products, except machinery and equipment 31 47 34 44 13 65
26 Manufacture of computer, electronic and optical products 2 2 1 3 1 3
27 Manufacture of electrical equipment 13 10 13 10 10 13
28 Manufacture of machinery and equipment n.e.c. 8 6 6 8 2 12
29 Manufacture of motor vehicles, trailers and semi-trailers 8 6 4 10 5 9
30 Manufacture of other transport equipment 1 2 1 2 1 2
31 Manufacture of furniture 68 127 92 103 22 173
32 Other manufacturing 29 16 28 17 13 32
33 Repair and installation of machinery and equipment 4 4 1 7 1 7
C Manufacturing 982 949 984 947 439 1,492
D Electricity, gas, steam and air conditioning supply 21 15 15 21 13 23
36 Water collection, treatment and supply 74 32 33 73 23 83
38 Waste collection, treatment and disposal activities; materials recovery 3 1 3 1 2 2
E Water supply; sewerage, waste management and remediation activities 77 33 36 74 25 85
Total 1,334 1,128 1,326 1,136 573 1,889
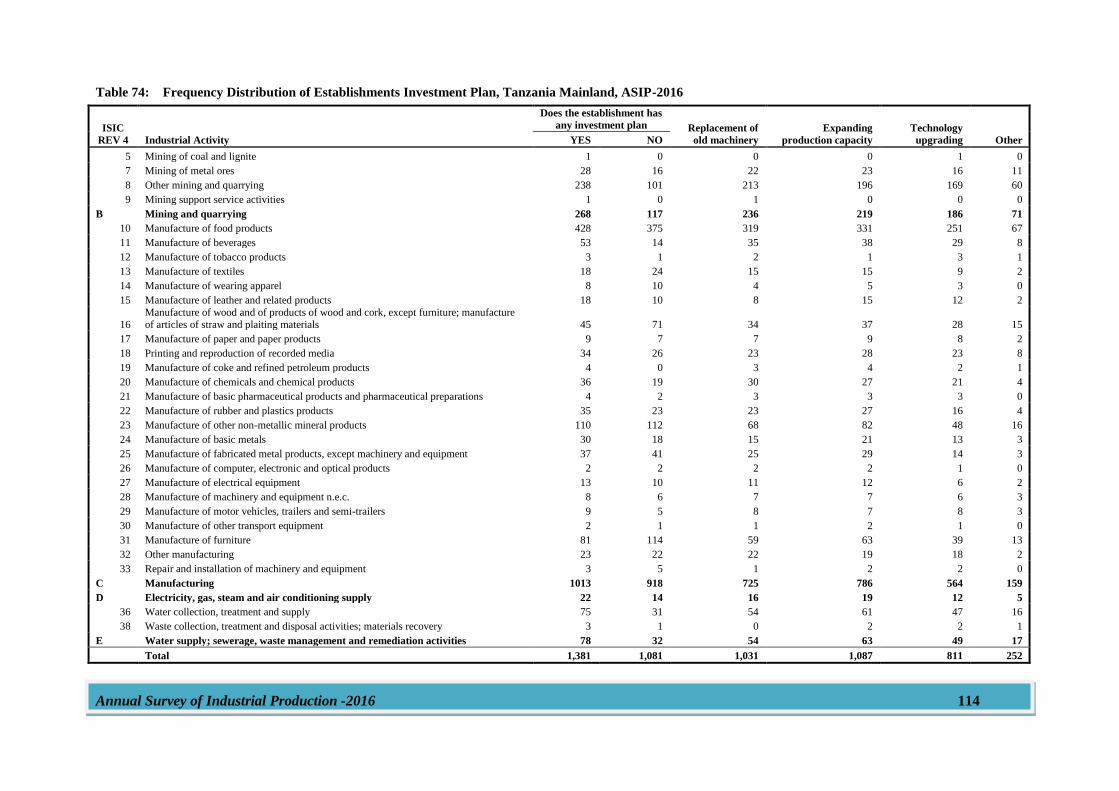
Annual Survey of Industrial Production -2016 114
Table 74: Frequency Distribution of Establishments Investment Plan, Tanzania Mainland, ASIP-2016
ISIC
REV 4 Industrial Activity
Does the establishment has
any investment plan Replacement of
old machinery
Expanding
production capacity
Technology
upgrading Other YES NO
5 Mining of coal and lignite 1 0 0 0 1 0
7 Mining of metal ores 28 16 22 23 16 11
8 Other mining and quarrying 238 101 213 196 169 60
9 Mining support service activities 1 0 1 0 0 0
B Mining and quarrying 268 117 236 219 186 71
10 Manufacture of food products 428 375 319 331 251 67
11 Manufacture of beverages 53 14 35 38 29 8
12 Manufacture of tobacco products 3 1 2 1 3 1
13 Manufacture of textiles 18 24 15 15 9 2
14 Manufacture of wearing apparel 8 10 4 5 3 0
15 Manufacture of leather and related products 18 10 8 15 12 2
16 Manufacture of wood and of products of wood and cork, except furniture; manufacture of articles of straw and plaiting materials 45 71 34 37 28 15
17 Manufacture of paper and paper products 9 7 7 9 8 2
18 Printing and reproduction of recorded media 34 26 23 28 23 8
19 Manufacture of coke and refined petroleum products 4 0 3 4 2 1
20 Manufacture of chemicals and chemical products 36 19 30 27 21 4
21 Manufacture of basic pharmaceutical products and pharmaceutical preparations 4 2 3 3 3 0
22 Manufacture of rubber and plastics products 35 23 23 27 16 4
23 Manufacture of other non-metallic mineral products 110 112 68 82 48 16
24 Manufacture of basic metals 30 18 15 21 13 3
25 Manufacture of fabricated metal products, except machinery and equipment 37 41 25 29 14 3
26 Manufacture of computer, electronic and optical products 2 2 2 2 1 0
27 Manufacture of electrical equipment 13 10 11 12 6 2
28 Manufacture of machinery and equipment n.e.c. 8 6 7 7 6 3
29 Manufacture of motor vehicles, trailers and semi-trailers 9 5 8 7 8 3
30 Manufacture of other transport equipment 2 1 1 2 1 0
31 Manufacture of furniture 81 114 59 63 39 13
32 Other manufacturing 23 22 22 19 18 2
33 Repair and installation of machinery and equipment 3 5 1 2 2 0
C Manufacturing 1013 918 725 786 564 159
D Electricity, gas, steam and air conditioning supply 22 14 16 19 12 5
36 Water collection, treatment and supply 75 31 54 61 47 16
38 Waste collection, treatment and disposal activities; materials recovery 3 1 0 2 2 1
E Water supply; sewerage, waste management and remediation activities 78 32 54 63 49 17
Total 1,381 1,081 1,031 1,087 811 252
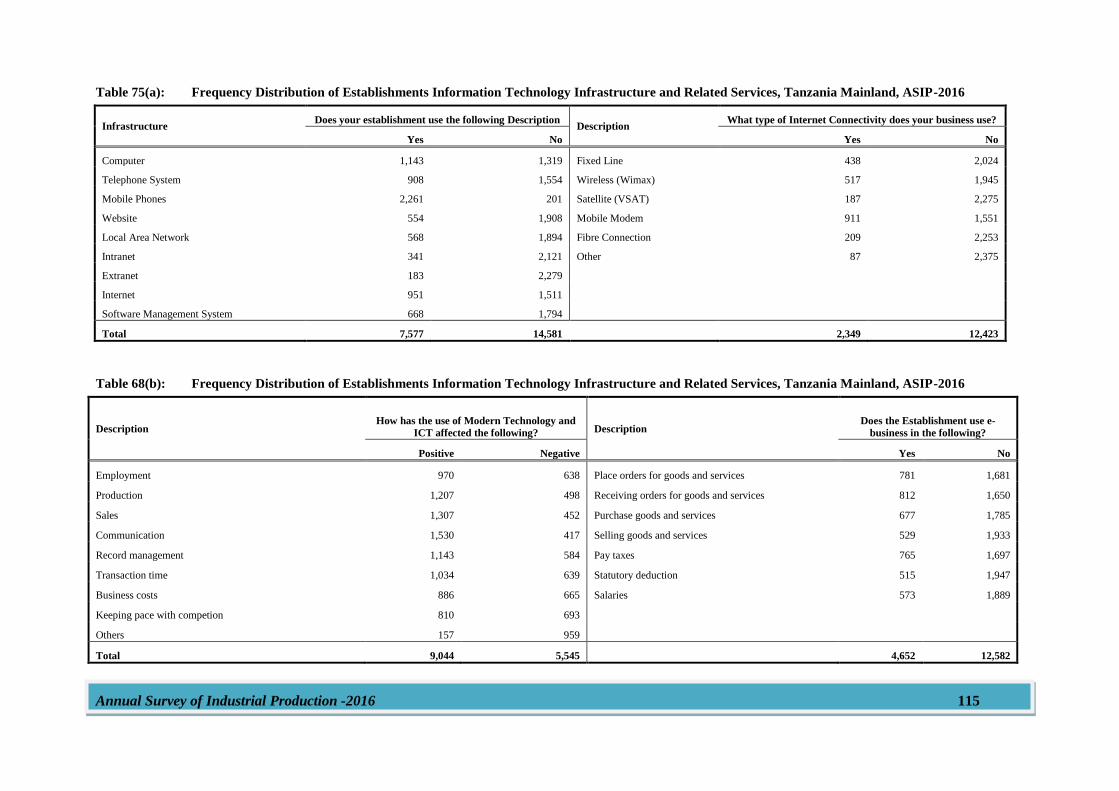
Annual Survey of Industrial Production -2016 115
Table 75(a): Frequency Distribution of Establishments Information Technology Infrastructure and Related Services, Tanzania Mainland, ASIP-2016
Infrastructure Does your establishment use the following Description
Description What type of Internet Connectivity does your business use?
Yes No Yes No
Computer 1,143 1,319 Fixed Line 438 2,024
Telephone System 908 1,554 Wireless (Wimax) 517 1,945
Mobile Phones 2,261 201 Satellite (VSAT) 187 2,275
Website 554 1,908 Mobile Modem 911 1,551
Local Area Network 568 1,894 Fibre Connection 209 2,253
Intranet 341 2,121 Other 87 2,375
Extranet 183 2,279
Internet 951 1,511
Software Management System 668 1,794
Total 7,577 14,581
2,349 12,423
Table 68(b): Frequency Distribution of Establishments Information Technology Infrastructure and Related Services, Tanzania Mainland, ASIP-2016
Description How has the use of Modern Technology and
ICT affected the following? Description Does the Establishment use e-
business in the following?
Positive Negative Yes No
Employment 970 638 Place orders for goods and services 781 1,681
Production 1,207 498 Receiving orders for goods and services 812 1,650
Sales 1,307 452 Purchase goods and services 677 1,785
Communication 1,530 417 Selling goods and services 529 1,933
Record management 1,143 584 Pay taxes 765 1,697
Transaction time 1,034 639 Statutory deduction 515 1,947
Business costs 886 665 Salaries 573 1,889
Keeping pace with competion 810 693
Others 157 959
Total 9,044 5,545
4,652 12,582
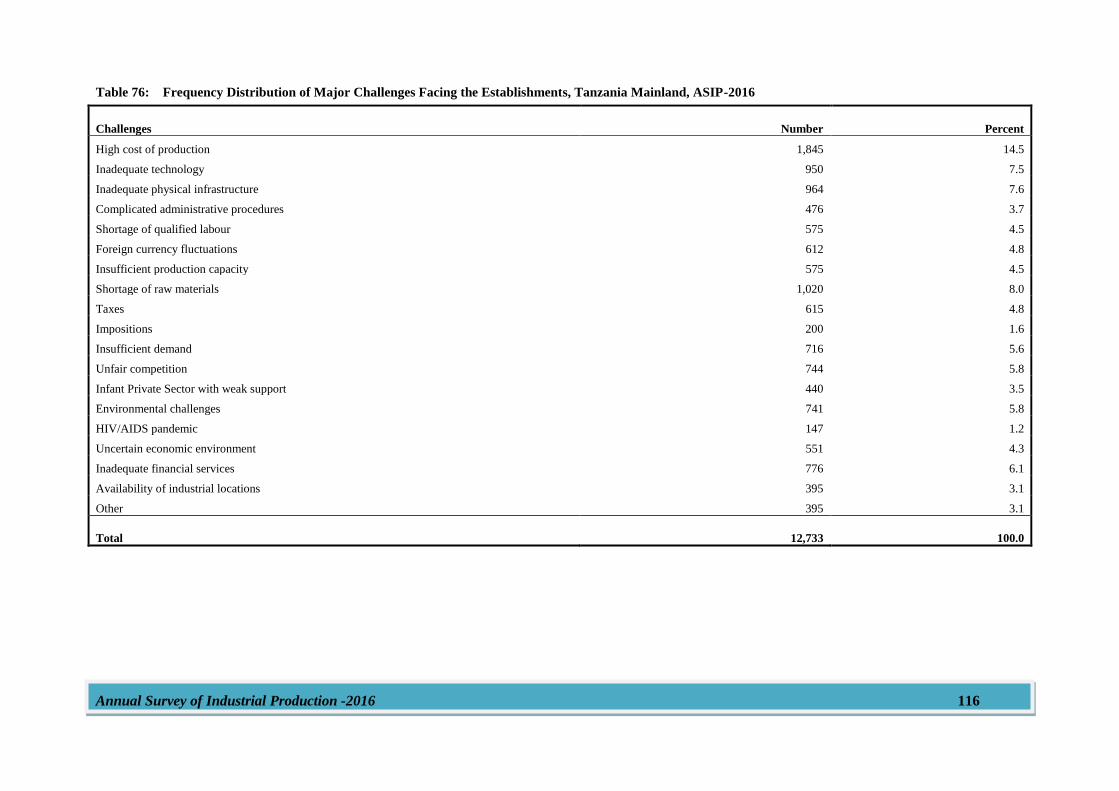
Annual Survey of Industrial Production -2016 116
Table 76: Frequency Distribution of Major Challenges Facing the Establishments, Tanzania Mainland, ASIP-2016
Challenges Number Percent
High cost of production 1,845 14.5
Inadequate technology 950 7.5
Inadequate physical infrastructure 964 7.6
Complicated administrative procedures 476 3.7
Shortage of qualified labour 575 4.5
Foreign currency fluctuations 612 4.8
Insufficient production capacity 575 4.5
Shortage of raw materials 1,020 8.0
Taxes 615 4.8
Impositions 200 1.6
Insufficient demand 716 5.6
Unfair competition 744 5.8
Infant Private Sector with weak support 440 3.5
Environmental challenges 741 5.8
HIV/AIDS pandemic 147 1.2
Uncertain economic environment 551 4.3
Inadequate financial services 776 6.1
Availability of industrial locations 395 3.1
Other 395 3.1
Total 12,733 100.0
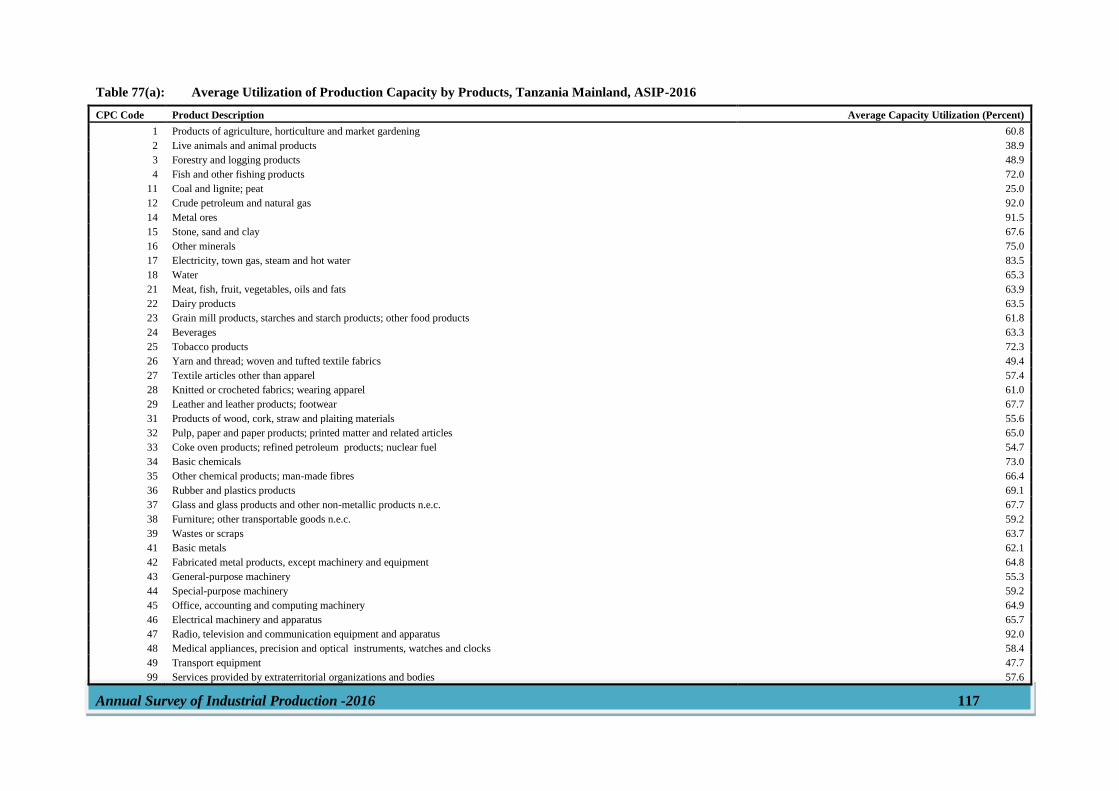
Annual Survey of Industrial Production -2016 117
Table 77(a): Average Utilization of Production Capacity by Products, Tanzania Mainland, ASIP-2016
CPC Code Product Description Average Capacity Utilization (Percent)
1 Products of agriculture, horticulture and market gardening 60.8
2 Live animals and animal products 38.9
3 Forestry and logging products 48.9
4 Fish and other fishing products 72.0
11 Coal and lignite; peat 25.0
12 Crude petroleum and natural gas 92.0
14 Metal ores 91.5
15 Stone, sand and clay 67.6
16 Other minerals 75.0
17 Electricity, town gas, steam and hot water 83.5
18 Water 65.3
21 Meat, fish, fruit, vegetables, oils and fats 63.9
22 Dairy products 63.5
23 Grain mill products, starches and starch products; other food products 61.8
24 Beverages 63.3
25 Tobacco products 72.3
26 Yarn and thread; woven and tufted textile fabrics 49.4
27 Textile articles other than apparel 57.4
28 Knitted or crocheted fabrics; wearing apparel 61.0
29 Leather and leather products; footwear 67.7
31 Products of wood, cork, straw and plaiting materials 55.6
32 Pulp, paper and paper products; printed matter and related articles 65.0
33 Coke oven products; refined petroleum products; nuclear fuel 54.7
34 Basic chemicals 73.0
35 Other chemical products; man-made fibres 66.4
36 Rubber and plastics products 69.1
37 Glass and glass products and other non-metallic products n.e.c. 67.7
38 Furniture; other transportable goods n.e.c. 59.2
39 Wastes or scraps 63.7
41 Basic metals 62.1
42 Fabricated metal products, except machinery and equipment 64.8
43 General-purpose machinery 55.3
44 Special-purpose machinery 59.2
45 Office, accounting and computing machinery 64.9
46 Electrical machinery and apparatus 65.7
47 Radio, television and communication equipment and apparatus 92.0
48 Medical appliances, precision and optical instruments, watches and clocks 58.4
49 Transport equipment 47.7
99 Services provided by extraterritorial organizations and bodies 57.6
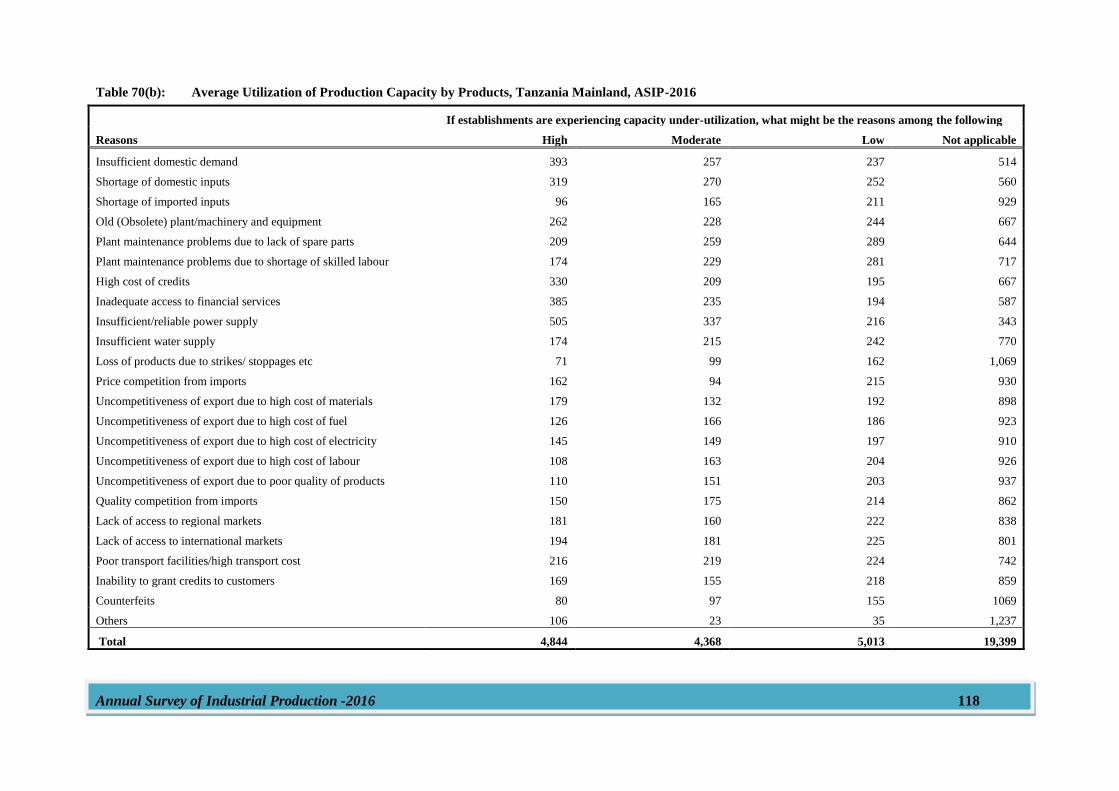
Annual Survey of Industrial Production -2016 118
Table 70(b): Average Utilization of Production Capacity by Products, Tanzania Mainland, ASIP-2016
Reasons
If establishments are experiencing capacity under-utilization, what might be the reasons among the following
High Moderate Low Not applicable
Insufficient domestic demand 393 257 237 514
Shortage of domestic inputs 319 270 252 560
Shortage of imported inputs 96 165 211 929
Old (Obsolete) plant/machinery and equipment 262 228 244 667
Plant maintenance problems due to lack of spare parts 209 259 289 644
Plant maintenance problems due to shortage of skilled labour 174 229 281 717
High cost of credits 330 209 195 667
Inadequate access to financial services 385 235 194 587
Insufficient/reliable power supply 505 337 216 343
Insufficient water supply 174 215 242 770
Loss of products due to strikes/ stoppages etc 71 99 162 1,069
Price competition from imports 162 94 215 930
Uncompetitiveness of export due to high cost of materials 179 132 192 898
Uncompetitiveness of export due to high cost of fuel 126 166 186 923
Uncompetitiveness of export due to high cost of electricity 145 149 197 910
Uncompetitiveness of export due to high cost of labour 108 163 204 926
Uncompetitiveness of export due to poor quality of products 110 151 203 937
Quality competition from imports 150 175 214 862
Lack of access to regional markets 181 160 222 838
Lack of access to international markets 194 181 225 801
Poor transport facilities/high transport cost 216 219 224 742
Inability to grant credits to customers 169 155 218 859
Counterfeits 80 97 155 1069
Others 106 23 35 1,237
Total 4,844 4,368 5,013 19,399
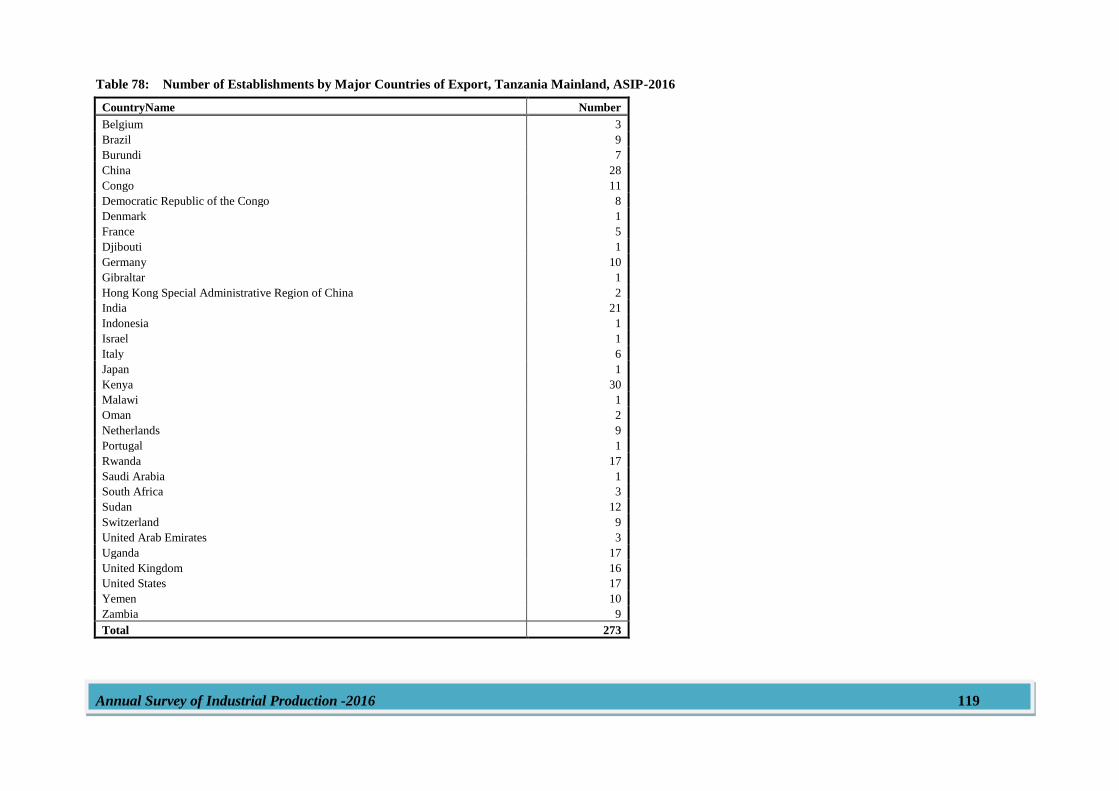
Annual Survey of Industrial Production -2016 119
Table 78: Number of Establishments by Major Countries of Export, Tanzania Mainland, ASIP-2016
CountryName Number
Belgium 3
Brazil 9
Burundi 7
China 28
Congo 11
Democratic Republic of the Congo 8
Denmark 1
France 5
Djibouti 1
Germany 10
Gibraltar 1
Hong Kong Special Administrative Region of China 2
India 21
Indonesia 1
Israel 1
Italy 6
Japan 1
Kenya 30
Malawi 1
Oman 2
Netherlands 9
Portugal 1
Rwanda 17
Saudi Arabia 1
South Africa 3
Sudan 12
Switzerland 9
United Arab Emirates 3
Uganda 17
United Kingdom 16
United States 17
Yemen 10
Zambia 9
Total 273
Annual Survey of Industrial Production -2016
Vision
To become a one stop centre for official statistics in Tanzania
Mission
To produce quality official statistics and service that meet needs of national and international stakeholders for evidence-based planning and
decision making.