the use of big data for official statistics - unece · the use of big data for official statistics...
TRANSCRIPT

Henk Verduin - Statistics Netherlands11 April 2018
Consumer Price IndexThe use of big data for official statistics
High-Level Seminar on Strategic Partnerships
3
I Main changes in data collection, the use of big data
II Partnerships to collect the data
Outline
4
Main changes in data collection
5
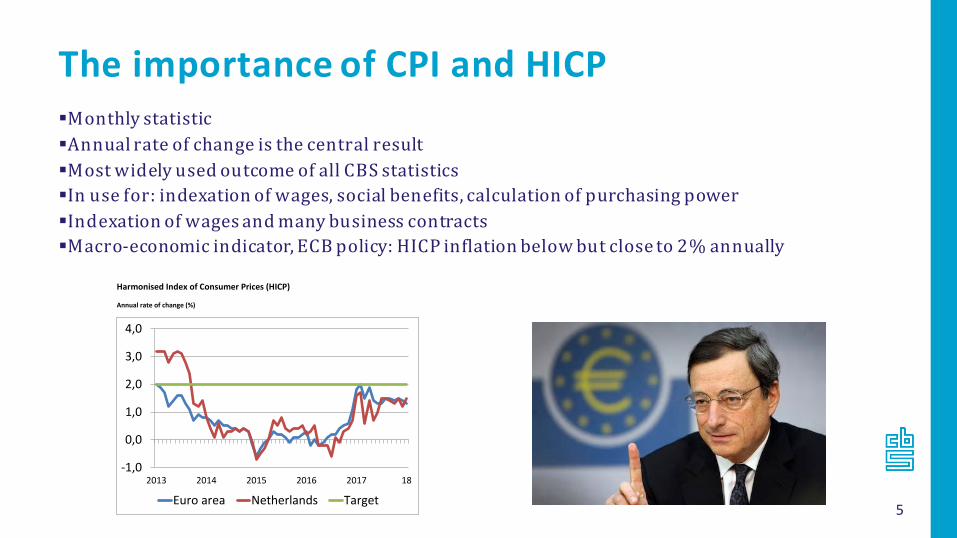
Monthly statisticAnnual rate of change is the central resultMost widely used outcome of all CBS statisticsIn use for: indexation of wages, social benefits, calculation of purchasing powerIndexation of wages and many business contractsMacro-economic indicator, ECB policy: HICP inflation below but close to 2% annually
The importance of CPI and HICP
Harmonised Index of Consumer Prices (HICP)
Annual rate of change (%)
-1,0
0,0
1,0
2,0
3,0
4,0
2013 2014 2015 2016 2017 18
Euro area Netherlands Target
6
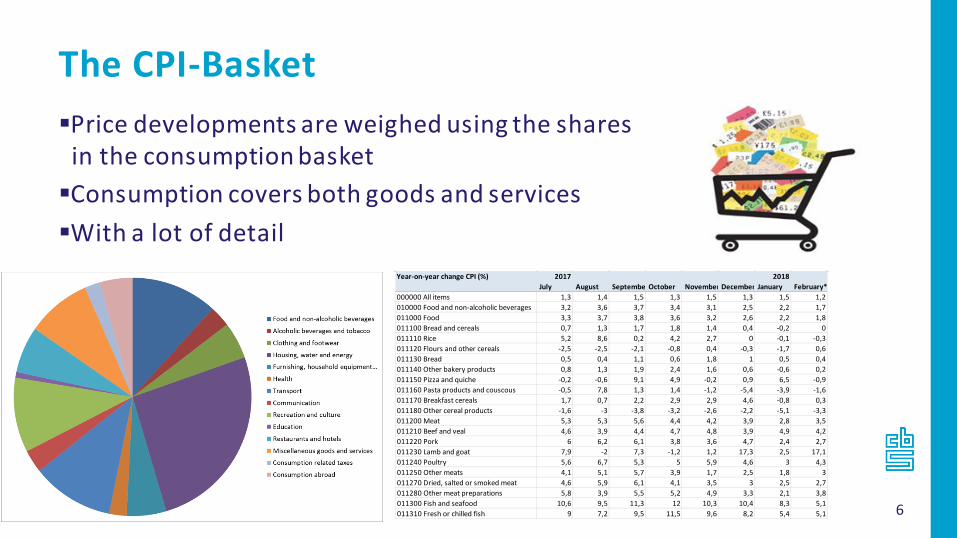
Price developments are weighed using the shares in the consumption basketConsumption covers both goods and servicesWith a lot of detail
The CPI-Basket
Year-on-year change CPI (%) 2017 2018 July August Septembe October November December January February*
000000 All items 1,3 1,4 1,5 1,3 1,5 1,3 1,5 1,2010000 Food and non-alcoholic beverages 3,2 3,6 3,7 3,4 3,1 2,5 2,2 1,7011000 Food 3,3 3,7 3,8 3,6 3,2 2,6 2,2 1,8011100 Bread and cereals 0,7 1,3 1,7 1,8 1,4 0,4 -0,2 0011110 Rice 5,2 8,6 0,2 4,2 2,7 0 -0,1 -0,3011120 Flours and other cereals -2,5 -2,5 -2,1 -0,8 0,4 -0,3 -1,7 0,6011130 Bread 0,5 0,4 1,1 0,6 1,8 1 0,5 0,4011140 Other bakery products 0,8 1,3 1,9 2,4 1,6 0,6 -0,6 0,2011150 Pizza and quiche -0,2 -0,6 9,1 4,9 -0,2 0,9 6,5 -0,9011160 Pasta products and couscous -0,5 7,8 1,3 1,4 -1,2 -5,4 -3,9 -1,6011170 Breakfast cereals 1,7 0,7 2,2 2,9 2,9 4,6 -0,8 0,3011180 Other cereal products -1,6 -3 -3,8 -3,2 -2,6 -2,2 -5,1 -3,3011200 Meat 5,3 5,3 5,6 4,4 4,2 3,9 2,8 3,5011210 Beef and veal 4,6 3,9 4,4 4,7 4,8 3,9 4,9 4,2011220 Pork 6 6,2 6,1 3,8 3,6 4,7 2,4 2,7011230 Lamb and goat 7,9 -2 7,3 -1,2 1,2 17,3 2,5 17,1011240 Poultry 5,6 6,7 5,3 5 5,9 4,6 3 4,3011250 Other meats 4,1 5,1 5,7 3,9 1,7 2,5 1,8 3011270 Dried, salted or smoked meat 4,6 5,9 6,1 4,1 3,5 3 2,5 2,7011280 Other meat preparations 5,8 3,9 5,5 5,2 4,9 3,3 2,1 3,8011300 Fish and seafood 10,6 9,5 11,3 12 10,3 10,4 8,3 5,1011310 Fresh or chilled fish 9 7,2 9,5 11,5 9,6 8,2 5,4 5,1
7
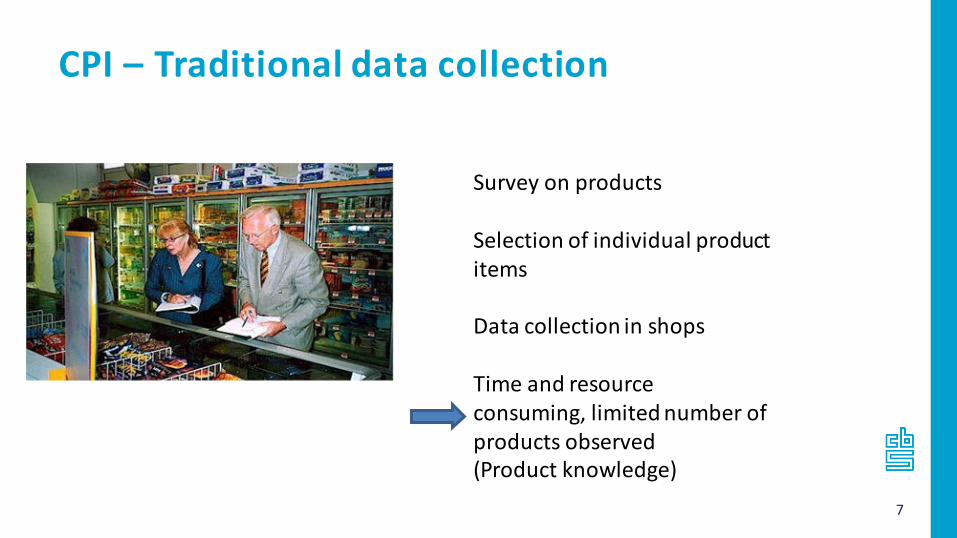
CPI – Traditional data collection
Survey on products
Selection of individual product items
Data collection in shops
Time and resource consuming, limited number of products observed(Product knowledge)
8
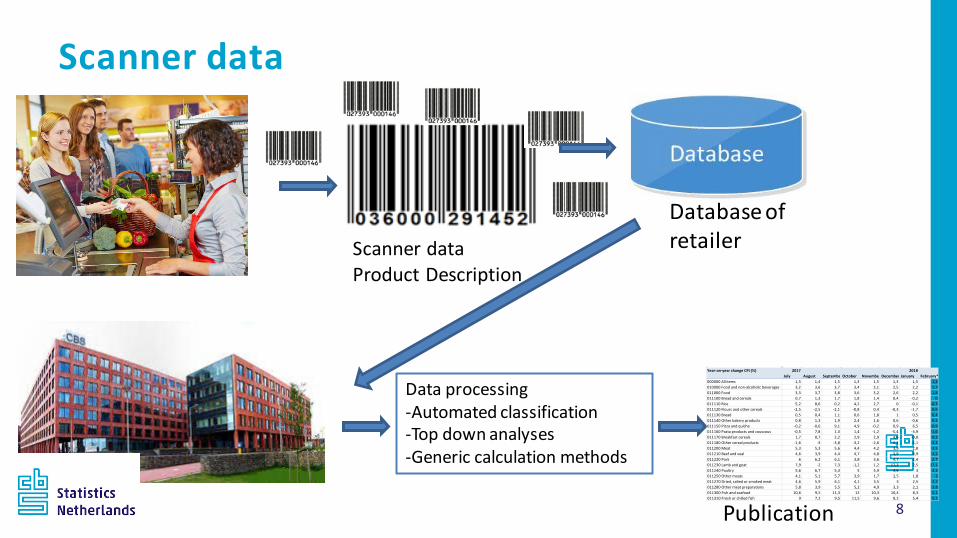
Scanner dataProduct Description
Database of retailer
Data processing-Automated classification-Top down analyses-Generic calculation methods
Publication
Year-on-year change CPI (%) 2017 2018 July August Septembe October November December January February*
000000 All items 1,3 1,4 1,5 1,3 1,5 1,3 1,5 1,2010000 Food and non-alcoholic beverages 3,2 3,6 3,7 3,4 3,1 2,5 2,2 1,7011000 Food 3,3 3,7 3,8 3,6 3,2 2,6 2,2 1,8011100 Bread and cereals 0,7 1,3 1,7 1,8 1,4 0,4 -0,2 0011110 Rice 5,2 8,6 0,2 4,2 2,7 0 -0,1 -0,3011120 Flours and other cereals -2,5 -2,5 -2,1 -0,8 0,4 -0,3 -1,7 0,6011130 Bread 0,5 0,4 1,1 0,6 1,8 1 0,5 0,4011140 Other bakery products 0,8 1,3 1,9 2,4 1,6 0,6 -0,6 0,2011150 Pizza and quiche -0,2 -0,6 9,1 4,9 -0,2 0,9 6,5 -0,9011160 Pasta products and couscous -0,5 7,8 1,3 1,4 -1,2 -5,4 -3,9 -1,6011170 Breakfast cereals 1,7 0,7 2,2 2,9 2,9 4,6 -0,8 0,3011180 Other cereal products -1,6 -3 -3,8 -3,2 -2,6 -2,2 -5,1 -3,3011200 Meat 5,3 5,3 5,6 4,4 4,2 3,9 2,8 3,5011210 Beef and veal 4,6 3,9 4,4 4,7 4,8 3,9 4,9 4,2011220 Pork 6 6,2 6,1 3,8 3,6 4,7 2,4 2,7011230 Lamb and goat 7,9 -2 7,3 -1,2 1,2 17,3 2,5 17,1011240 Poultry 5,6 6,7 5,3 5 5,9 4,6 3 4,3011250 Other meats 4,1 5,1 5,7 3,9 1,7 2,5 1,8 3011270 Dried, salted or smoked meat 4,6 5,9 6,1 4,1 3,5 3 2,5 2,7011280 Other meat preparations 5,8 3,9 5,5 5,2 4,9 3,3 2,1 3,8011300 Fish and seafood 10,6 9,5 11,3 12 10,3 10,4 8,3 5,1011310 Fresh or chilled fish 9 7,2 9,5 11,5 9,6 8,2 5,4 5,1
Scanner data
9
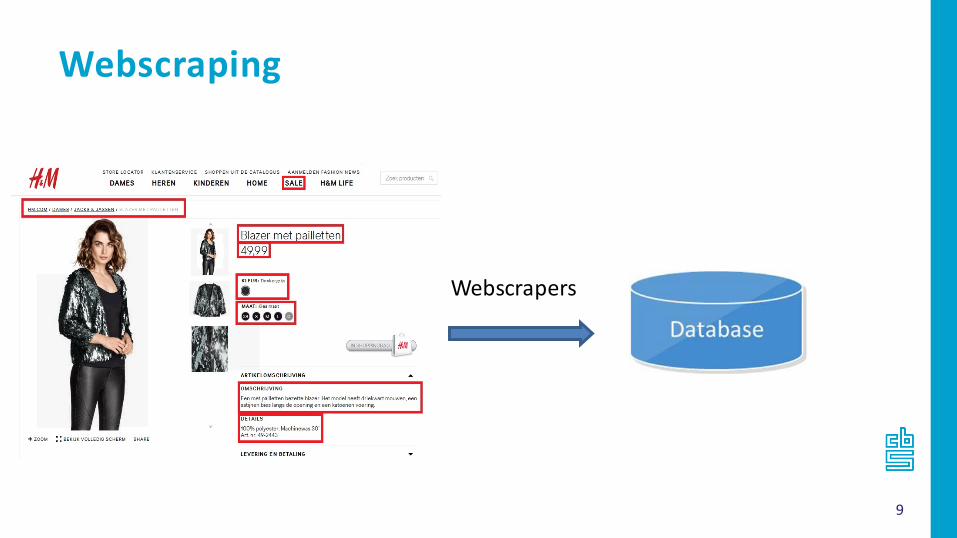
Webscraping
Webscrapers

10
Higher qualityLower costsLower response burden
Big Data and the CPI
11
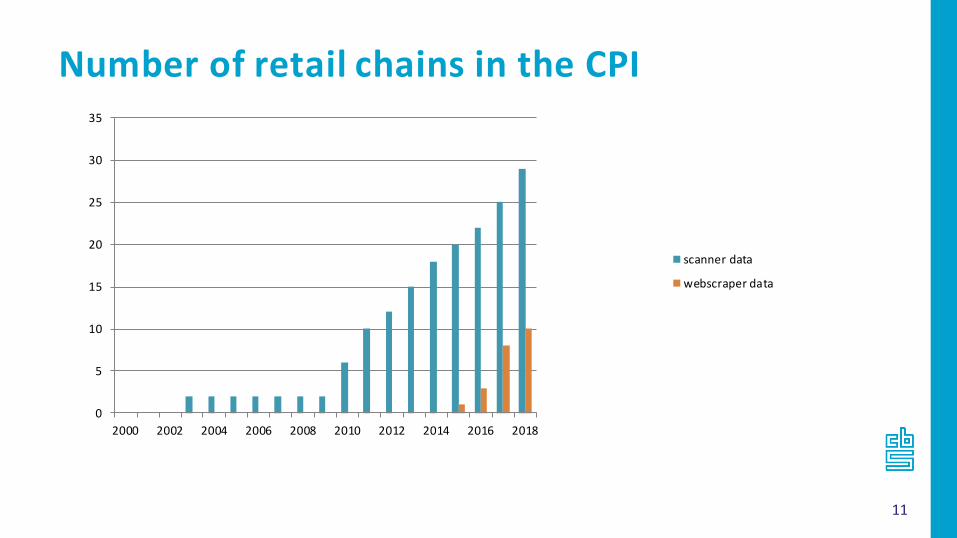
Number of retail chains in the CPI
0
5
10
15
20
25
30
35
2000 2002 2004 2006 2008 2010 2012 2014 2016 2018
scanner data
webscraper data

12
Number of observed prices per monthper maand
scannerdata andwebscraper data:2.700.000 prices
Retail outlets: 8.500 prices

13
Number of outlets visited each month in CPI
0
1000
2000
3000
4000
5000
6000
7000
8000
2000 2002 2004 2006 2008 2010 2012 2014 2016 2018
Reduction of 90%
14
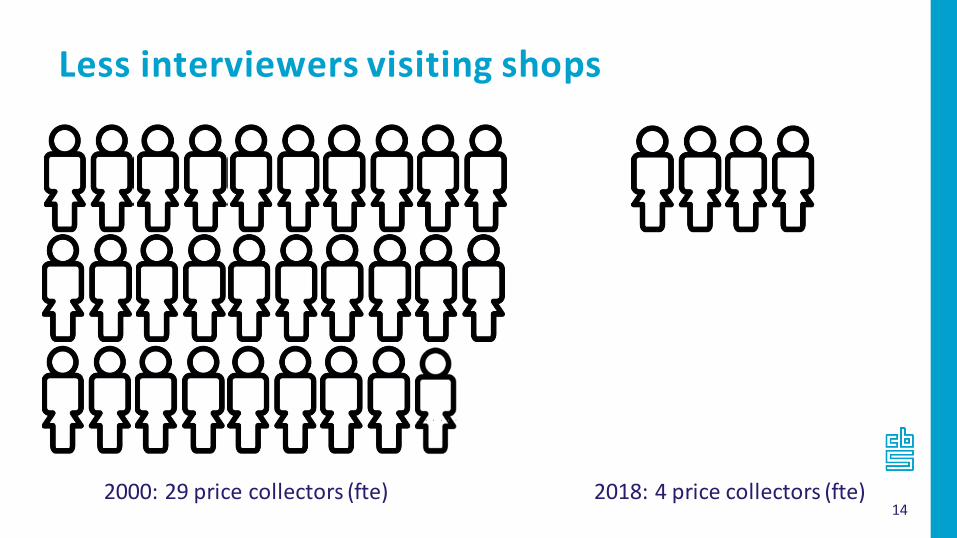
Less interviewers visiting shops
2000: 29 price collectors (fte) 2018: 4 price collectors (fte)
15
Strategic partnerships andthe data collection
16
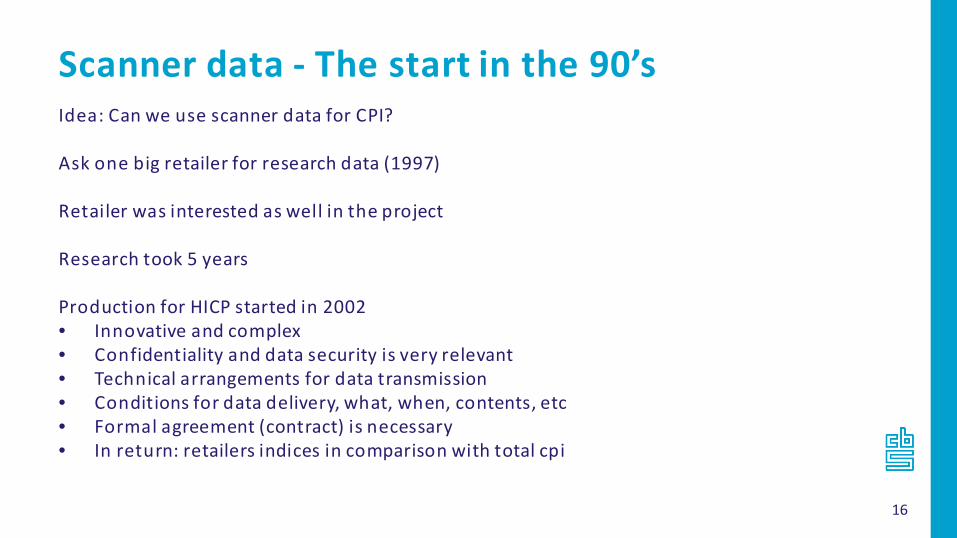
Idea: Can we use scanner data for CPI?
Ask one big retailer for research data (1997)
Retailer was interested as well in the project
Research took 5 years
Production for HICP started in 2002 • Innovative and complex• Confidentiality and data security is very relevant• Technical arrangements for data transmission• Conditions for data delivery, what, when, contents, etc• Formal agreement (contract) is necessary• In return: retailers indices in comparison with total cpi
Scanner data - The start in the 90’s

17
National Law on Statistics 2003 (CBS-wet)Detailed data such as scanner data may be requested
HICP- Regulation 2016 (article 5.4)Upon the request of the national bodies responsible for compiling the harmonised indices, the statistical units shall provide, where available, electronic records of transactions, such as scanner data, and at the level of detail necessary in order to produce harmonised indices and to evaluate compliance with the comparability requirements and the quality of the harmonised indices.
Legal Framework
18
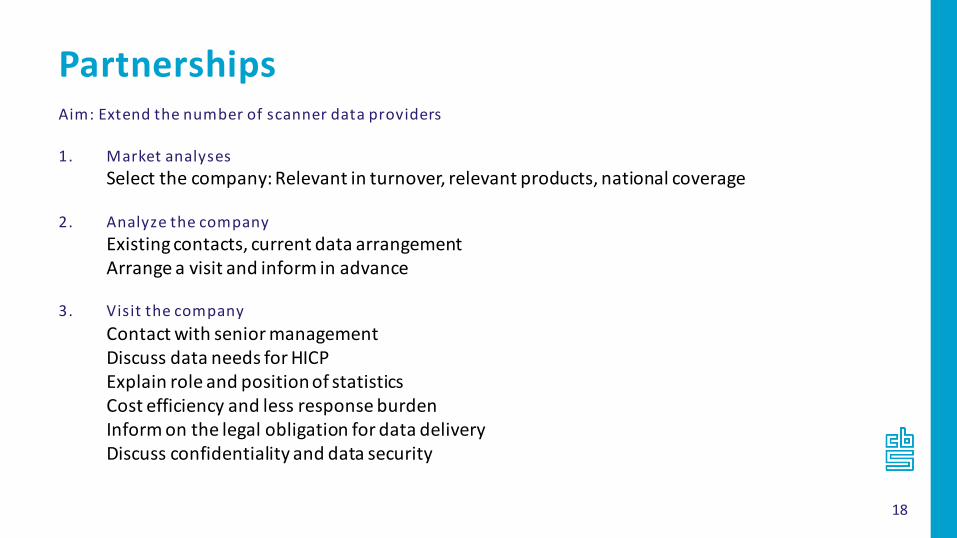
Aim: Extend the number of scanner data providers
1. Market analysesSelect the company: Relevant in turnover, relevant products, national coverage
2. Analyze the companyExisting contacts, current data arrangementArrange a visit and inform in advance
3. Visit the companyContact with senior managementDiscuss data needs for HICPExplain role and position of statisticsCost efficiency and less response burdenInform on the legal obligation for data deliveryDiscuss confidentiality and data security
Partnerships
19
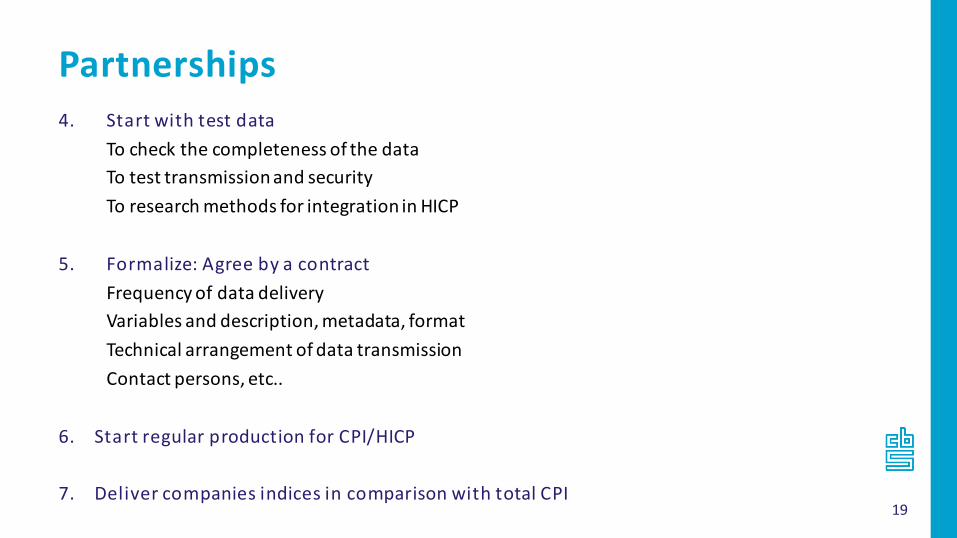
4. Start with test dataTo check the completeness of the dataTo test transmission and securityTo research methods for integration in HICP
5. Formalize: Agree by a contractFrequency of data deliveryVariables and description, metadata, formatTechnical arrangement of data transmissionContact persons, etc..
6. Start regular production for CPI/HICP
7. Deliver companies indices in comparison with total CPI
Partnerships
20
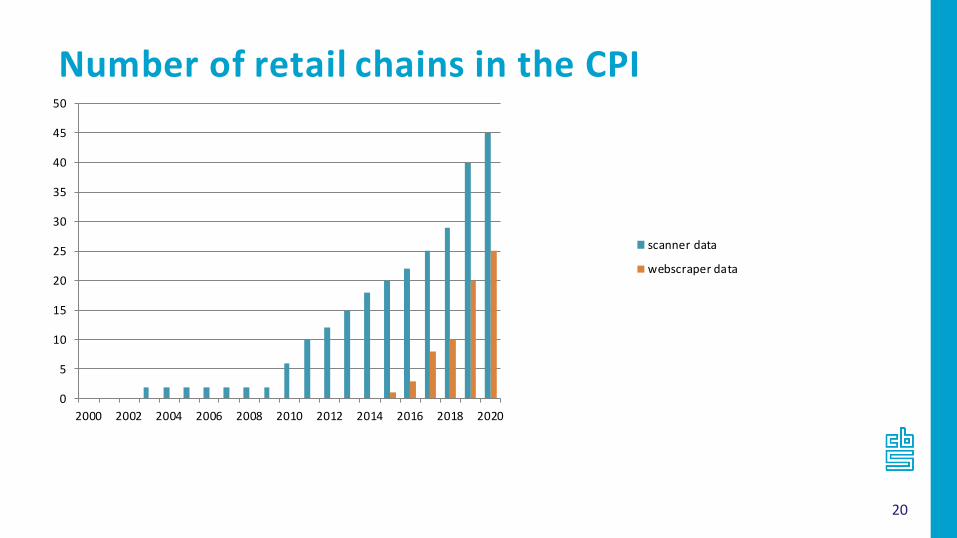
Number of retail chains in the CPI
0
5
10
15
20
25
30
35
40
45
50
2000 2002 2004 2006 2008 2010 2012 2014 2016 2018 2020
scanner data
webscraper data

21
Scanner data supermarketsCrosscutting subjects: health, non-healthy foodSustainable or non-sustainable productionTurnover data and details of turnover(Fipronil)Input for consumption estimate (GDP)Retail statisticsIndustry blur
Wealth of data