the use of computer workstations in the study of
TRANSCRIPT

Proceedings of the 10th Annual Conference on Hazardous Waste Research 341
THE USE OF COMPUTER WORKSTATIONSIN THE STUDY OF ENVIRONMENTAL GEOLOGY:
INTEGRATION OF GEOPHYSICAL ANDGEOLOGIC DATA
A. Martinez1, T. Carr1, R. Black2, H.R. Feldman1, J.F. Hopkins1, A.J. Feltz1, D.R. Collins1, J.Doveton1 and N.L. Anderson3, 1Kansas Geological Survey, Lawrence, KS 66044;
2Department of Geology, University of Kansas, Lawrence, KS; and 3Department of Geology &Geophysics, University of Missouri-Rolla, Rolla, MO
ABSTRACTGeophysical techniques coupled with the modern computer workstation have not beenwidely used in environmental geology. The Kansas Geological Survey is investigating theapplication of the computer workstation in a number of projects underway that involveenvironmental questions and problems associated with salt dissolution. The computerworkstation provides an efficient approach to integrate geologic and geophysicalinterpretations of the shallow subsurface. In addition to modification of availabletechniques originally developed for computer-aided exploration and development ofhydrocarbons, several new applications unique to shallow subsurface characterizationare being developed. All applications are capable of addressing environmentally-relatedquestions at various scales from regional aquifer mapping to site specificcharacterization.
Various geophysical and geologic methods have been used to image the shallowsubsurface (0-100 m). These methods used in conjunction with a modified computerizedinterpretation system include high-resolution seismic reflection (2-D and 3-D), verticalseismic profiling (VSP), ground-penetrating radar (GPR), and color image transformationand treatment of the transformed wireline log data as "seismic" traces (pseudo-seismic).The computer workstation approach allows efficient, detailed and integrated studies to beperformed at these sites.
Examples from throughout Kansas involving a variety of environmental questions andproblems associated with salt dissolution are used to illustrate the utility of using thecomputer workstation in the study of environmental geology.
KEY WORDScomputer workstations, environmental geology, Permian salts, geophysical data
INTRODUCTIONComputer workstation-based interpret a-tional software has revolutionized howgeophysical, geologic and engineering dataare interpreted by the petroleum industry.Major computer technologies, includingnear super-computing capabilities on inte r-active desktop workstations, complex ne t-working, high capacity mass storage d e-vices, 3-D visualization software, and large
digital databases, have radically changedthe petroleum industry's approach to expl o-ration and development. Emphasis withinthe petroleum industry is now on powerfulinterpretational software that minimizes r e-petitive tasks, integrates technologic disc i-plines, maximizes analysis and simulation,and increases the number of mistakes (dryholes) that are drilled on the desk insteadof in the field. These powerful computer-aided interpretational systems have yet to

Proceedings of the 10th Annual Conference on Hazardous Waste Research342
be widely used by environmental profe s-sionals.
Adequate understanding of heterogeneitiesof near subsurface geology is an importantcomponent to improved site investigations,avoidance of excess spending and ineffe c-tive remediation. Environmental investig a-tions have focused on the point data o b-tained from the drill rig. Point data are ofteninadequate for understanding preferentialflow pathways and variations in relativepermeability. Near-surface computer-aidedgeophysical and geologic methods are a n-other way to image the subsurface. Appl i-cation of computer-aided visualization andanalysis systems in conjunction with theuse of near-surface geophysical and ge o-logic methods can provide detailed info r-mation of subsurface structures that affectfluid flow direction and rate of fluid mov e-ment and enhance containment and rem e-diation procedures.
This paper presents projects underway inKansas that involve the application of ge o-physical and geological methods and thecomputer workstation to a variety of env i-ronmental questions and problems assoc i-ated with salt dissolution. Permian saltspresent in the shallow subsurface of thecentral and southern parts of Kansas resultin a number of environmental problemsranging from large-scale contamination of
entire aquifers to localized dissolution co l-lapse features. Causation is a complex i n-teraction of natural processes and anthr o-pogenic activities (e.g., irrigation and oilfield activities). Examples from Kansas illu s-trate the utility of the computer workstationto perform integrated studies of enviro n-mental problems at scales ranging fromsmall-scale site investigation to regionalaquifer studies (Figure 1). Data were co l-lected as part of ongoing studies of groundwater aquifers in Kansas by the KansasGeological Survey.
Various geophysical methods were used atseveral site investigations to image the g e-ology of the shallow subsurface (0-100 m).These methods include high-resolutionseismic reflection (2-D and 3-D), verticalseismic profiling (VSP), and ground-penetrating radar (GPR). These geophys i-cal methods along with subsurface geologicdata are used in conjunction with a co m-puterized interpretation system. The sy s-tem allows efficient, detailed and integratedstudies to be performed at these sites.
In order to undertake a regional aquiferstudy, a new application of computerworkstation-based interpretational softwarewas developed. This application treatstransformed wireline log data as "seismic"traces for the purposes of processing, i n-terpretation and display. A color imagetransformation can combine data from s e-lected wireline logging tools to generate acolor coded "crossplot log" for each well. Awell-designed transformation can providean image of the spatial distribution of su b-surface lithology or fluids. The transformedimage, in either 2-D or 3-D, can be treatedon the workstation as "seismic" data, ea s-ing the data handling burdens through useof computerized techniques designed forinterpretation of seismic data.
SMALL- TO MEDIUM-SCALEAPPLICATIONS: THE SIEFKES
STUDY SITE
Figure 1. Location of the Siefkes Study Site and theselected pseudo-seismic line from the Dakota StudyArea in Kansas.

Proceedings of the 10th Annual Conference on Hazardous Waste Research 343
The Siefkes Study Site is located in centralKansas (Section 27, T21S, R12W, StaffordCounty). The site is contaminated with aregion of salt water intrusion into the freshwater aquifer. Salt water contamination ofsubsurface fresh water supplies is a seriousconcern within this area of central Kansas[1]. The main source of fresh water in theregion is a near-surface aquifer containedwithin unconsolidated Quaternary alluvium.Salt-rich waters are upwelling from thePermian bedrock into this overlying all u-vium. At the Siefkes Study Site there is anoticeable upwelling of salt-rich watersaround an irrigation well late in the pumpingseason. Salt water contamination reachesa high enough level that crop damage canresult.
The Siefkes Study Site is part of the Mi n-eral Intrusion Study Area, a region of i n-tensive study by the Geohydrology Sectionof the Kansas Geological Survey [2, 3]. Sitecharacterization and ground water mode l-ing of the Siefkes Study Site were unde r-taken in order to improve understanding ofground water flow within the area. Twomonitoring wells were placed within theproximity of the irrigation well to monitorsubsurface salinity levels and providelithological information. Ground watermodeling of the area used information pr o-vided by these ground-water monitoringwells. However, the limited control points
severely limited site characterization andsubsequent ground water mode ling.
In order to improve site characterization, aseries of geophysical investigations wereperformed (Figure 2). The geophysical datacollected include a ground-penetrating r a-dar profile imaging the very-near surfaceabove the water table, 2-D and 3-D near-surface seismic reflection data imaging thePermian bedrock surface and deeper rockunits, and near-surface vertical seismicprofile data used to depth-tie the seismicdata with lithological information.
Ground-penetrating radar (GPR)A short line (76 m) of GPR data was a c-quired in the vicinity of two wells at theSiefkes Study Site. Data was acquired u s-ing a GSSI SIR System 8 GPR unit with a500-MHz transducer. The data weredownloaded from the unit and convertedinto SEGY format for data integration andinterpretation within the workstation env i-ronment. The vertical (time) and horizontal(distance) scales for GPR data differ co n-siderably from seismic reflection data. B e-cause the GPR data length is in nanose c-onds, rather than milliseconds, it was ne c-essary to time-scale the sample interval ofthe data by a factor of 1x10⁶ for viewingpurposes. The horizontal spacing (CDP) forthis data set is approximately 1.2 cm perCDP point.
Figure 2. Detail map of the geophysical study at the Siefkes Study Site. The locations of the ground-penetratingradar (GPR) profile, 2-D seismic reflection profiles, 3-D seismic reflection patch and vertical seismic profiles (VSP)are shown.

Proceedings of the 10th Annual Conference on Hazardous Waste Research344
Once time-scaled, the GPR data wereloaded into the computer workstation andviewed. The GPR data were treated asstacked seismic data, opening up the po s-sibility of using conventional post-stackseismic reflection tools to process the data.Trace balancing and gains were applied inorder to give the profile an even appea r-ance and to accentuate anomalies. Otherdigital processing techniques includedbandpass filtering (to remove high-frequency multiple events caused by thewater table) and f-k filtering (to reduce hor i-zontal linear events and accentuateanomalies).
Several features of interest were foundalong the GPR profile. A portion of the pr o-file over a subsurface feature is interpretedas a portion of a paleo-stream channel,with the interpreted point bar and cut bankhighlighted (Figure 3). Also seen is a di f-fraction, believed to be caused by the r e-mains of a shot point station from theseismic data collected in the area. TheGPR data indicates that the very-near su r-face is relatively laterally and vertically he t-erogeneous in nature (Figure 3). This he t-erogeneity can greatly affect the infiltrationof fresh water from the surface into the
subsurface and should be incorporated todevelop accurate models of aquifer r e-charge.
2-D and 3-D near-surface seismicreflection and vertical seismic
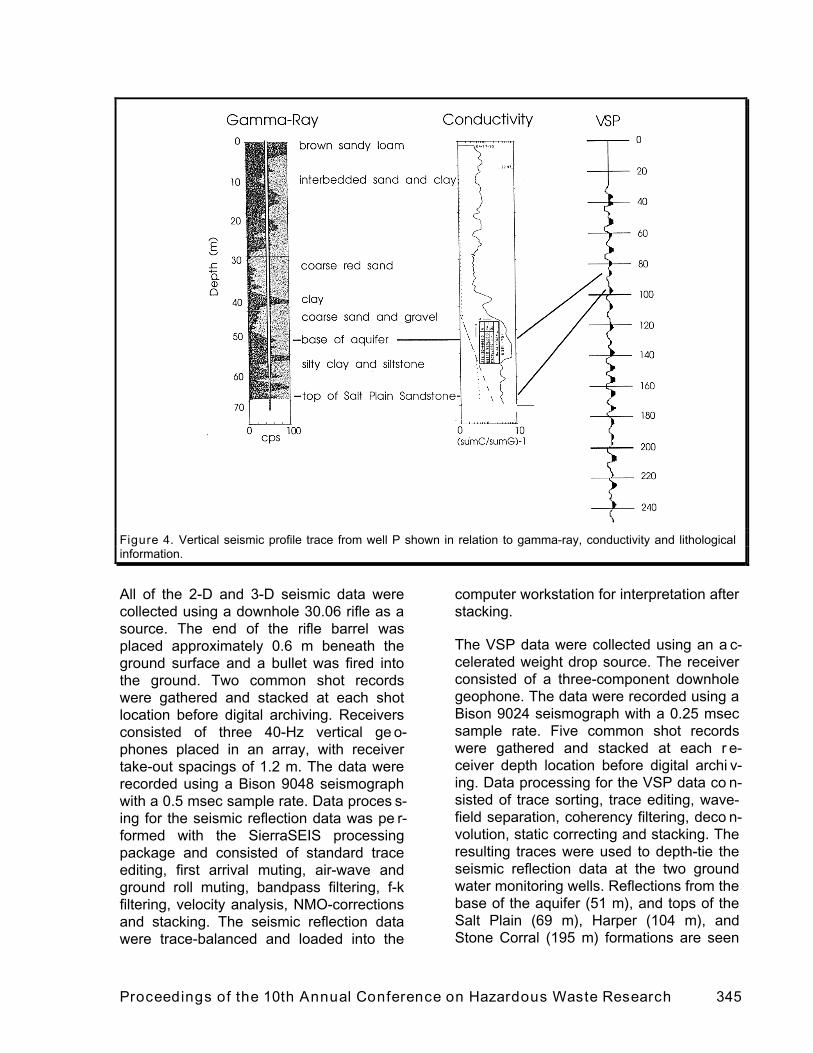
profilingNear-surface 2-D seismic reflection profiles,a 3-D seismic reflection patch, and two ve r-tical seismic profiles were collected at theSiefkes Study Site. Seismic Line One i m-ages the subsurface between the twoground-water monitoring wells (wells P andDA on Figure 2). Seismic Line Two is pe r-pendicular to Line One and is located nearwell P. The single-fold 3-D seismic patch iscentered on the two seismic lines in orderto maximize velocity information for normalmove-out (NMO) corrections. The two vert i-cal seismic profiles (VSP) were collected atwells P and DA. The VSP data providedbasic velocity functions for the seismic datainterpretation process and, more impo r-tantly, time-depth information to depth-tiethe seismic reflection data to known su b-surface stratigraphic units. The verticalseismic profile trace from well P in relationto gamma-ray and conductivity logs isshown in Figure 4.
Figure 3. Detailed image of ground-penetrating radar profile across a feature interpreted as a paleo-stream cha n-nel. The cut bank, as well as several lateral accretionary bars, are hig hlighted.
Proceedings of the 10th Annual Conference on Hazardous Waste Research 345
All of the 2-D and 3-D seismic data werecollected using a downhole 30.06 rifle as asource. The end of the rifle barrel wasplaced approximately 0.6 m beneath theground surface and a bullet was fired intothe ground. Two common shot recordswere gathered and stacked at each shotlocation before digital archiving. Receiversconsisted of three 40-Hz vertical ge o-phones placed in an array, with receivertake-out spacings of 1.2 m. The data wererecorded using a Bison 9048 seismographwith a 0.5 msec sample rate. Data proces s-ing for the seismic reflection data was pe r-formed with the SierraSEIS processingpackage and consisted of standard traceediting, first arrival muting, air-wave andground roll muting, bandpass filtering, f-kfiltering, velocity analysis, NMO-correctionsand stacking. The seismic reflection datawere trace-balanced and loaded into the
computer workstation for interpretation afterstacking.
The VSP data were collected using an a c-celerated weight drop source. The receiverconsisted of a three-component downholegeophone. The data were recorded using aBison 9024 seismograph with a 0.25 msecsample rate. Five common shot recordswere gathered and stacked at each r e-ceiver depth location before digital archi v-ing. Data processing for the VSP data co n-sisted of trace sorting, trace editing, wave-field separation, coherency filtering, deco n-volution, static correcting and stacking. Theresulting traces were used to depth-tie theseismic reflection data at the two groundwater monitoring wells. Reflections from thebase of the aquifer (51 m), and tops of theSalt Plain (69 m), Harper (104 m), andStone Corral (195 m) formations are seen
Figure 4. Vertical seismic profile trace from well P shown in relation to gamma-ray, conductivity and lithologicalinformation.

Proceedings of the 10th Annual Conference on Hazardous Waste Research346
on Seismic Line One (Figure 5). All depthsrefer to the depths of reflectors at well P asdetermined by the VSP.
Seismic reflection imaging of the subsu r-face reveals previously unknown subsu r-face structure at the Siefkes Study Site.The area between wells P and DA appearsto be a Permian structural low in the su b-surface. In addition, the reflection from thecontact between the base of the Salt PlainFormation and the top of the Harper San d-stone Formation disappears on the easternportion of Seismic Line One. This is inte r-preted as destructive interference betweenthe second peak of the Salt Plain reflectiondoublet and the first peak of the HarperSandstone doublet as a result ofstratigraphic thinning of the interval b e-tween the two units. The well data was i n-sufficient to image the structural andstratigraphic variations at the Siefkes site.Such subsurface heterogeneities may behydrologically significant in influencing themovement and concentration of Permiansalt-rich brines at the site.
The single-fold near-surface 3-D seismicreflection data were collected in an attemptto determine the feasibility of small-scale 3-D seismic methods in near-surface studies.The 3-D seismic reflection data have a bin
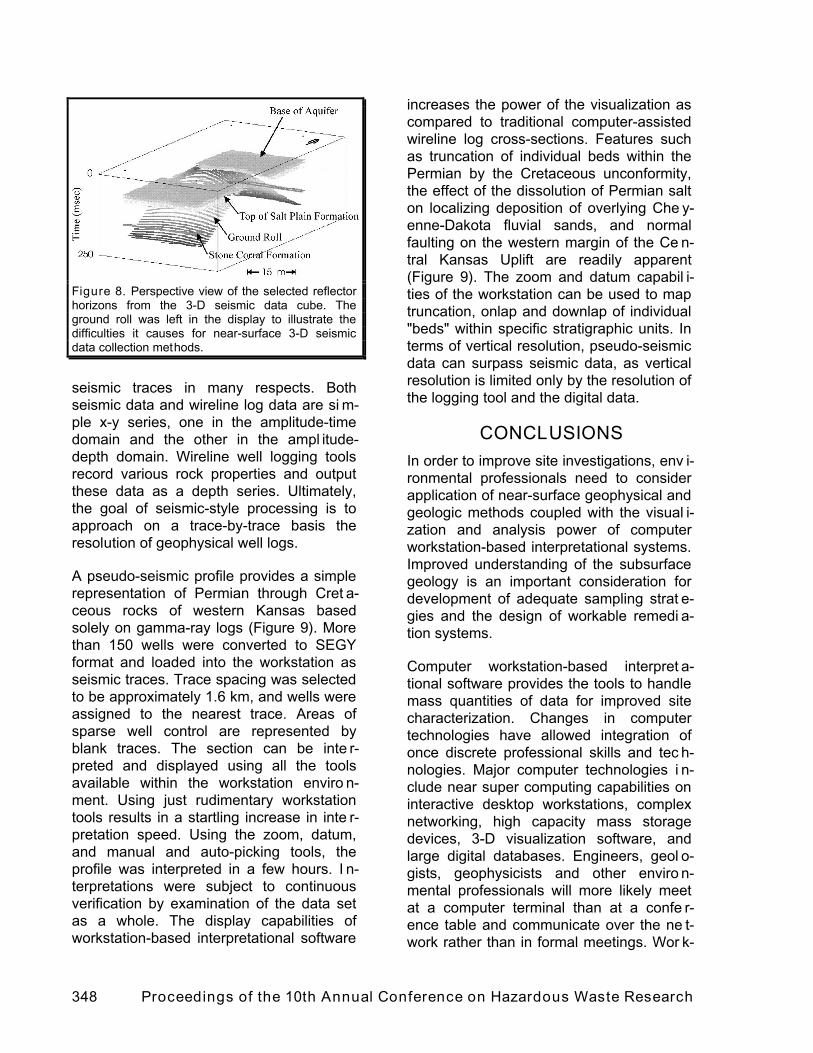
size of 0.6 m x 1.2 m. Although the dataare only single fold and encompass a rel a-tively small area, useful information wasobtained once the data were loaded intothe computer workstation and interpreted.Interpretation of the 3-D seismic reflectiondata was greatly enhanced by the data i m-aging capabilities of the workstation. Vert i-cal and horizontal data slices were taken ofthe data (Figures 6 & 7). Horizon tops wereselected using these data slices. The resul t-ing horizon picks were displayed as a 3-Dvolume for visualization purposes (Figure8). The reflections from the base of theaquifer, the top of the Salt Plain Formation,and the Stone Corral Formation are visibleon vertical slices. The reflection from thetop of the Harper Sandstone is very faintand is visible on only a few vertical slices.The time-slice through the Salt Plain Fo r-mation reflection shows that the reflectionhas a slight dip to the south-east, sugges t-ing that the Salt Plain Formation may dipslightly to the south-east in the Siefkesarea. The experimental 3-D patch could besignificantly improved with higher fold. Thehigher fold would provide greater velocitycontrol and more reflection continuity forthe 3-D data.
Figure 5. Greyscale display of Seismic Line One. Interpreted horizons include the base of the aquifer, the top ofthe Salt Plain Formation, the top of the Harper Formation, and the top of the Stone Corral Formation.

Proceedings of the 10th Annual Conference on Hazardous Waste Research 347
A LARGE-SCALE APPLICA-TION: THE DAKOTA STUDY
AND THE PSEUDO-SEISMIC APPROACH
As near-surface ground water sources b e-come more scarce, the Cretaceous Dakotaaquifer is becoming an important potentialsource of ground water for western Kansas.A study of the Dakota aquifer is underwayin order to develop a better assessment ofwater-resource potential and planningneeds of the aquifer [4]. The Dakota aquiferis composed of irregularly distributedsandstones of the Dakota and Kiowa fo r-mations and Cheyenne Sandstone. An u n-derstanding of the aquifer's lateral extent,vertical thickness and overall capacityacross western Kansas is important for d e-veloping well-spacing requirements andsound resource management. The Dakotaaquifer study mainly involves using existingwell log information to achieve these goals.Because the study encompasses a largearea (approx. 125,000 km 2) and a largenumber of wells, alternative methods ofmacro- scale well log analysis were exa m-ined and a method designated as pseudo-seismic profiling was developed [5].
Pseudo-seismic profilingStratigraphic interpretation from wirelinelogs is typically drawn from multiple logtraces or from crossplots of log data. Bothtechniques can readily depict verticalchanges in lithology or reservoir quality, butlateral relationships are not easily visua l-ized. Significant improvement in the ge o-logic interpretation of wireline log data canbe achieved through color image transfo r-mation and treatment of the transformeddata as "seismic" traces for the purposed ofprocessing, interpretation and display [6].Such transforms can combine data fromporosity, gamma and density tools genera t-ing a color coded "crossplot log" for eachwell. A well-designed color transformationof wireline log data from multiple wellsmaximizes both spatial and compositionalinformation content and provides a readilyinterpretable image of the subsurface geo l-ogy. The transformed image, in either 2-Dor 3-D, can be treated as "seismic" data,easing the data-handling burdens throughthe use of computerized techniques d e-signed for interpretation of seismic data.
The pseudo-seismic approach tostratigraphic interpretation is based on theobservation that wireline well logs resemble
Figure 7. Horizontal data slice taken at 95 msecfrom the 3D seismic reflection data volume. The r e-flection from the Salt Plains Formation is intersectedby this data slice.
Figure 6. Vertical data slice from the northern faceof the 3-D seismic reflection data volume.
Proceedings of the 10th Annual Conference on Hazardous Waste Research348
seismic traces in many respects. Bothseismic data and wireline log data are si m-ple x-y series, one in the amplitude-timedomain and the other in the ampl itude-depth domain. Wireline well logging toolsrecord various rock properties and outputthese data as a depth series. Ultimately,the goal of seismic-style processing is toapproach on a trace-by-trace basis theresolution of geophysical well logs.
A pseudo-seismic profile provides a simplerepresentation of Permian through Cret a-ceous rocks of western Kansas basedsolely on gamma-ray logs (Figure 9). Morethan 150 wells were converted to SEGYformat and loaded into the workstation asseismic traces. Trace spacing was selectedto be approximately 1.6 km, and wells wereassigned to the nearest trace. Areas ofsparse well control are represented byblank traces. The section can be inte r-preted and displayed using all the toolsavailable within the workstation enviro n-ment. Using just rudimentary workstationtools results in a startling increase in inte r-pretation speed. Using the zoom, datum,and manual and auto-picking tools, theprofile was interpreted in a few hours. I n-terpretations were subject to continuousverification by examination of the data setas a whole. The display capabilities ofworkstation-based interpretational software
increases the power of the visualization ascompared to traditional computer-assistedwireline log cross-sections. Features suchas truncation of individual beds within thePermian by the Cretaceous unconformity,the effect of the dissolution of Permian salton localizing deposition of overlying Che y-enne-Dakota fluvial sands, and normalfaulting on the western margin of the Ce n-tral Kansas Uplift are readily apparent(Figure 9). The zoom and datum capabil i-ties of the workstation can be used to maptruncation, onlap and downlap of individual"beds" within specific stratigraphic units. Interms of vertical resolution, pseudo-seismicdata can surpass seismic data, as verticalresolution is limited only by the resolution ofthe logging tool and the digital data.
CONCLUSIONSIn order to improve site investigations, env i-ronmental professionals need to considerapplication of near-surface geophysical andgeologic methods coupled with the visual i-zation and analysis power of computerworkstation-based interpretational systems.Improved understanding of the subsurfacegeology is an important consideration fordevelopment of adequate sampling strat e-gies and the design of workable remedi a-tion systems.
Computer workstation-based interpret a-tional software provides the tools to handlemass quantities of data for improved sitecharacterization. Changes in computertechnologies have allowed integration ofonce discrete professional skills and tec h-nologies. Major computer technologies i n-clude near super computing capabilities oninteractive desktop workstations, complexnetworking, high capacity mass storagedevices, 3-D visualization software, andlarge digital databases. Engineers, geol o-gists, geophysicists and other enviro n-mental professionals will more likely meetat a computer terminal than at a confe r-ence table and communicate over the ne t-work rather than in formal meetings. Wor k-
Figure 8. Perspective view of the selected reflectorhorizons from the 3-D seismic data cube. Theground roll was left in the display to illustrate thedifficulties it causes for near-surface 3-D seismicdata collection methods.

Proceedings of the 10th Annual Conference on Hazardous Waste Research 349
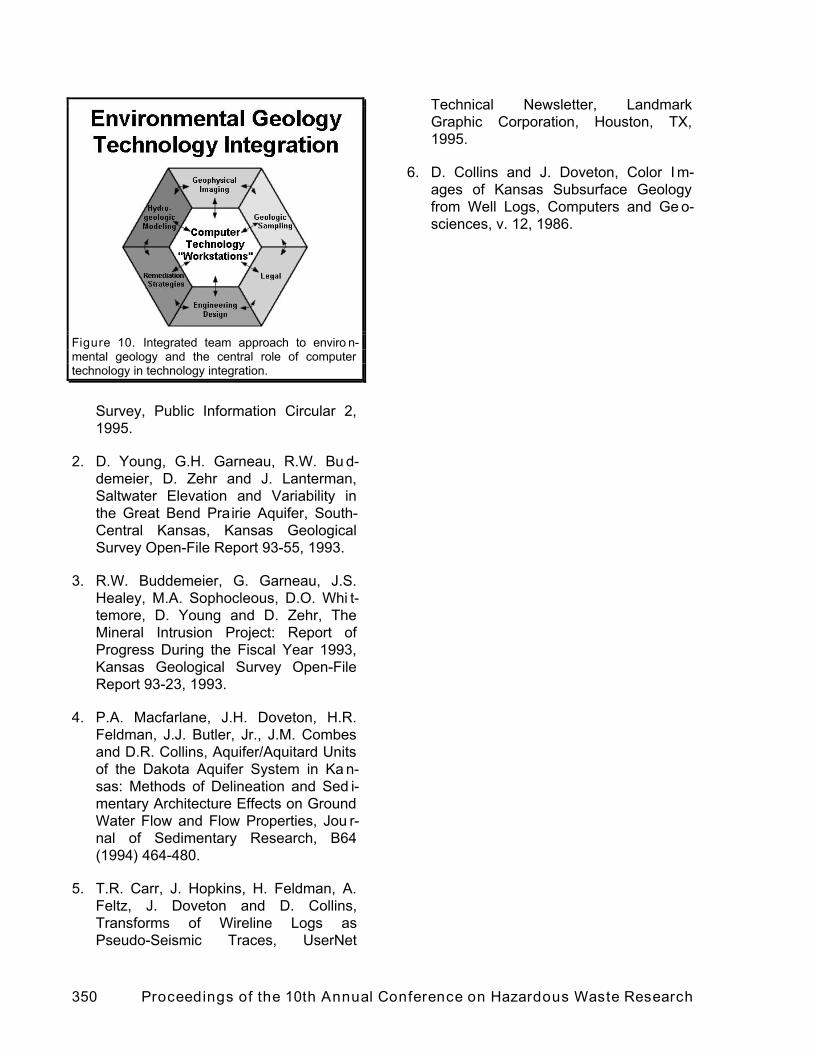
stations can radically change the approachto environmental geology by integratingtechnology across disciplines (Figure 10).Teams will become more common-place.No longer can each discipline work on itspiece of the problem use a colored pencil toput the results on a piece of paper or map,pass the results along to the next discipline,and be done with it. Large volumes of datashould be accessible to and used by all themembers of a team, permitting reiteration inthe constant process of site characteriz a-tion, sample design, remediation and policydevelopment.
As illustrated above, near-surface ge o-physical methods are capable of imagingthe shallow subsurface and determining thegeometries of subsurface structures thataffect direction and rate contaminant flow.Various two-dimensional profiles and three-dimensional volumes of environmental-oriented geophysical data along with ge o-logic point data from wells can be broughttogether for an integrated interpretationwithin the computer workstation enviro n-ment. The color display and post-stackprocessing capabilities of the workstation
greatly enhance data interpretation, allo w-ing small-scale to large-scale lateral near-surface heterogeneities of the alluvium anddeeper bedrock structures to be succes s-fully imaged and interpreted.
A copy of this paper along with color ve r-sions of the figures are available on theKansas Geological Survey's web site(http://www.kgs.ukans.edu) on the Petr o-leum Research Section's recent public a-tions page (http://crude1.kgs.ukans.edu/cgi-bin/wwwwais.pl).
ACKNOWLEDGMENTLandmark Graphics Corporation providedthe interpretation and analysis software u n-der an educational grant to the KansasGeological Survey and the University ofKansas.
REFERENCES1. R.W. Buddemeier, R.S. Sawind, D.O.
Whittemore and D.P. Young, Salt Co n-tamination of Ground Water in South-Central Kansas, Kansas Geological
Figure 9. Structurally-datumed pseudo-seismic profile of gamma-ray logs showing the Dakota aquifer. Light graytones correspond to low gamma-ray values associated with sandstones, limestones and evaporites. Darker shadescorrespond to high gamma-ray values from shales. This profile was constructed using gamma-ray logs from over150 wells. (modified from [4])
Proceedings of the 10th Annual Conference on Hazardous Waste Research350
Survey, Public Information Circular 2,1995.
2. D. Young, G.H. Garneau, R.W. Bu d-demeier, D. Zehr and J. Lanterman,Saltwater Elevation and Variability inthe Great Bend Prairie Aquifer, South-Central Kansas, Kansas GeologicalSurvey Open-File Report 93-55, 1993.
3. R.W. Buddemeier, G. Garneau, J.S.Healey, M.A. Sophocleous, D.O. Whi t-temore, D. Young and D. Zehr, TheMineral Intrusion Project: Report ofProgress During the Fiscal Year 1993,Kansas Geological Survey Open-FileReport 93-23, 1993.
4. P.A. Macfarlane, J.H. Doveton, H.R.Feldman, J.J. Butler, Jr., J.M. Combesand D.R. Collins, Aquifer/Aquitard Unitsof the Dakota Aquifer System in Ka n-sas: Methods of Delineation and Sed i-mentary Architecture Effects on GroundWater Flow and Flow Properties, Jou r-nal of Sedimentary Research, B64(1994) 464-480.
5. T.R. Carr, J. Hopkins, H. Feldman, A.Feltz, J. Doveton and D. Collins,Transforms of Wireline Logs asPseudo-Seismic Traces, UserNet
Technical Newsletter, LandmarkGraphic Corporation, Houston, TX,1995.
6. D. Collins and J. Doveton, Color I m-ages of Kansas Subsurface Geologyfrom Well Logs, Computers and Ge o-sciences, v. 12, 1986.
Figure 10. Integrated team approach to enviro n-mental geology and the central role of computertechnology in technology integration.