the use of exergy analysis to benchmark the resource...
TRANSCRIPT
I
The Use of Exergy Analysis to Benchmark the Resource Efficiency of
Municipal Waste Water Treatment Plants in Ireland
By
Matthew Horrigan B.Eng.
A Thesis Submitted in Fulfilment of the Requirements for the Degree of
Masters of Engineering
Supervisors
Dr. Lorna Fitzsimons & Dr. Brian Corcoran
School of Mechanical and Manufacturing Engineering
Dublin City University
January 2016

II
DECLARATION
I hereby certify that this material, which I now submit for assessment on the
programme of study leading to the award of Masters of Engineering is entirely my
own work, that I have exercised reasonable care to ensure that the work is original,
and does not to the best of my knowledge any law of copyright, and has not been
acknowledged within the text of my work.
Signed: _____________ (Candidate) ID No.: ______________ Date: _________

III
ACKNOWLEDGEMENTS
I would sincerely like to acknowledge; my supervisors, Dr. Lorna Fitzsimons, Dr.
Brian Corcoran and Dr. Yann Delaure. I would like to thank all of them for accepting
me onto the project, allowing me to step back into the engineering sector. As my
primary supervisor, Dr. Lorna Fitzsimons has always been extremely approachable
and friendly while concurrently providing direction to my research.
I would like to acknowledge the contribution from Greg McNamara and Thomas
Phelan who provided a great deal of fun and laughter when they joined the project.
They were great in acting as a spring board for research ideas. Also, Niall Durham has
proved invaluable in obtaining the data needed to complete my work.
I would like acknowledge Enda Fitzpatrick from DCU Athletics Academy for the
great fun he provided throughout the year.
This research is published as part of the Environmental Protection Agency Research
Programme 2014-2020. The programme is financed by the Irish Government. It is
administered on behalf of the Department of the Environment, Community and Local
Government by the Environmental Protection Agency which has the statutory
function of co-ordinating and promoting environmental research. The author would
like to acknowledge the Environmental Protection Agency for the financial support.

IV
Table of Contents 1 Introduction ............................................................................................................................. 1
2 Literature Review.................................................................................................................... 4
2.1 Overview of Waste Water Treatment Processes and Relevant Parameters ......................... 4
2.1.1 Organic matter in waste water .................................................................................. 4
2.1.2 Organic matter parameters ........................................................................................ 5
2.2 Wastewater treatment plant discharge regulation ........................................................ 5
2.3 Mechanical treatment ................................................................................................... 7
2.3.1 Biological treatment .................................................................................................. 7
2.3.2 Activated Sludge Process .......................................................................................... 8
2.3.3 Sludge treatment ....................................................................................................... 9
2.4 Irish waste water treatment sector................................................................................ 9
2.5 Good practice guide for WWTP equipment .............................................................. 10
2.5.1 Aerators ................................................................................................................... 10
2.5.2 Control Systems ...................................................................................................... 11
2.5.3 Pump Energy ........................................................................................................... 12
2.5.4 Variable Frequency Drives ..................................................................................... 13
2.6 New Energy Efficient Technologies .......................................................................... 14
2.6.1 OxyMem ................................................................................................................. 14
2.6.2 Anaerobic Ammonium Oxidation........................................................................... 15
2.6.3 Pumped Flow Biofilm Reactor ............................................................................... 15
2.7 Sustainable Energy Efficiency ................................................................................... 15
2.7.1 Energy Audit ........................................................................................................... 16
2.7.2 Types of Audits ....................................................................................................... 17
2.7.3 Energy Management System .................................................................................. 18
2.7.4.1 Key performance indicators (KPI) ....................................................................... 19
2.7.4.2 KPI Benchmarking of WWTPs ........................................................................... 20
2.7.4.3 Deming cycle – (Plan-Do-Check-Act) ................................................................. 20
2.8 Life cycle analysis...................................................................................................... 22
2.9 Exergy analysis of WWTP......................................................................................... 22
2.9.1 Total Specific Exergy ............................................................................................. 24
2.9.2 Reference environment ........................................................................................... 25
2.9.2.1 WWTP discharging to inland rivers .................................................................... 28
2.9.2.2 WWTP discharging to the sea.............................................................................. 28
2.9.3 Organic matter calculation methodology ................................................................ 29
V
3 Exergy Calculation Methodologies....................................................................................... 33
3.1 Wastewater Treatment Plant Selection ...................................................................... 34
3.2 Materials and methods ............................................................................................... 34
3.2.1 Waste water treatment plant testing ........................................................................ 35
3.2.2 Testing..................................................................................................................... 35
3.2.3 Energy monitoring .................................................................................................. 35
3.3 Exergy analysis methodology .................................................................................... 37
3.3.1 Organic matter exergy calculation methodology .................................................... 38
3.3.2 Organic matter calculation example 1 .................................................................... 39
3.4 Inorganic matter exergy calculation methodology .................................................... 39
3.5 Exergy Value of Electricity ....................................................................................... 40
3.6 Notes .......................................................................................................................... 40
4 Results ................................................................................................................................... 41
4.1 Plant A Site Description and Results ......................................................................... 41
4.1.1 Calculation Assumptions ........................................................................................ 41
4.2 Plant B Site Description and Results ......................................................................... 48
4.2.1 Calculation Assumptions ................................................................................... 49
4.3 Plant C Site Description and Results ......................................................................... 53
4.3.1 Calculation Assumptions ........................................................................................ 54
5 Discussion ............................................................................................................................. 58
5.1 Overall Plant Exergy Destruction Comparison .......................................................... 59
5.2 Plant A exergy destruction and exergy loss discussion ......................................... 60
5.3 Plant B & C exergy destruction and exergy loss discussion ...................................... 62
6 Conclusions and Recommendations ..................................................................................... 64
6.1 Conclusions ................................................................................................................ 64
6.2 Research Limitations ................................................................................................. 65
6.3 Recommendations for further research ...................................................................... 66
Appendix .................................................................................................................................. 71
Table 1: Waste water treatment plant characteristics ...................................................... 71

VI
NOMENCLATURE
Acronyms
ASHRAE American Society of Heating, Refrigerating and Air-Conditioning Engineers
BEP Break Efficiency Point
BOD Biological Oxygen Demand
COD Chemical Oxygen Demand
DO Dissolved Oxygen
ECM Energy Conservation Measures
EMS Energy Management Systems
EPA Environmental Protection Agency
KPI Key Performance Indicators
LCA Life Cycle Analysis
MABR Membrane Aerated Biofilm Reactor
PE Population Equivalent
PFBR Pumped Flow Biofilm Reactor
PID Proportional Integral Derivative
RE Reference Environment
THOD Theoretical Oxygen Demand
TN Total Nitrogen
TOC Total Organic Carbon
TOD Total Oxygen Demand
TP Total Phosphorus
US United States
UWWTD Urban Waste Water Treatment Directive
VFD Variable Frequency Drives
WWTP Waste Water Treatment Plant
VII
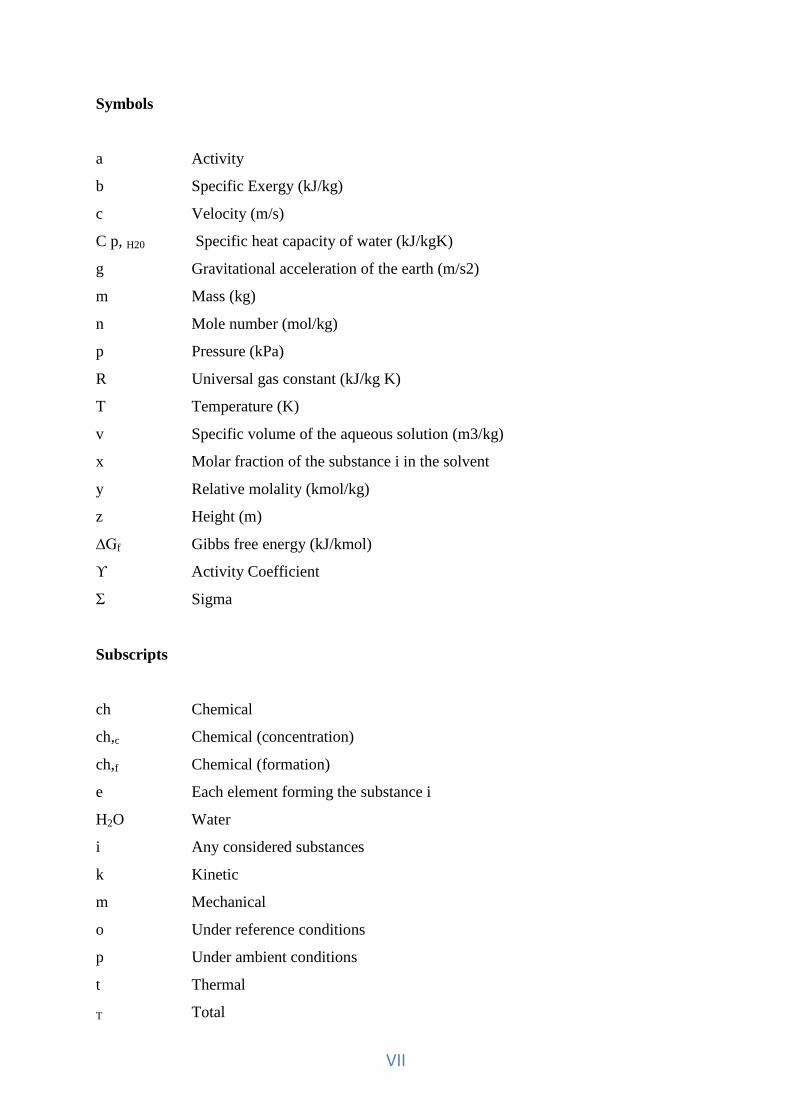
Symbols
a Activity
b Specific Exergy (kJ/kg)
c Velocity (m/s)
C p, H20 Specific heat capacity of water (kJ/kgK)
g Gravitational acceleration of the earth (m/s2)
m Mass (kg)
n Mole number (mol/kg)
p Pressure (kPa)
R Universal gas constant (kJ/kg K)
T Temperature (K)
v Specific volume of the aqueous solution (m3/kg)
x Molar fraction of the substance i in the solvent
y Relative molality (kmol/kg)
z Height (m)
∆Gf Gibbs free energy (kJ/kmol)
ϒ Activity Coefficient
Σ Sigma
Subscripts
ch Chemical
ch,c Chemical (concentration)
ch,f Chemical (formation)
e Each element forming the substance i
H2O Water
i Any considered substances
k Kinetic
m Mechanical
o Under reference conditions
p Under ambient conditions
t Thermal
T Total

VIII
z Potential

IX
Table of Figures
Figure 1: Electricity requirements for activated sludge wastewater treatment process [15] ... 10
Figure 2: DO cascade feedback control diagram [24] ............................................................. 12
Figure 3: Wasted Energy in Alternative Control Schemes Compared to Variable Frequency
Drives [29] ............................................................................................................................... 14
Figure 4: Deming Cycle - Focused on continual improvement [38] ....................................... 21
Figure 5: Example of typical process inputs & outputs associated with WWTP operation .... 33
Figure 6: Site Layout Plant A .................................................................................................. 41
Figure 7: Site Layout Plant B................................................................................................... 48
Figure 8: Site Layout Plant C................................................................................................... 53
Figure 9: Exergy Destruction across analysed plants .............................................................. 59
Figure 10: Exergy Destruction breakdown for Plant A ........................................................... 60
Figure 11: Exergy Destruction breakdown for Plants B & C .................................................. 62
X
Table of Tables
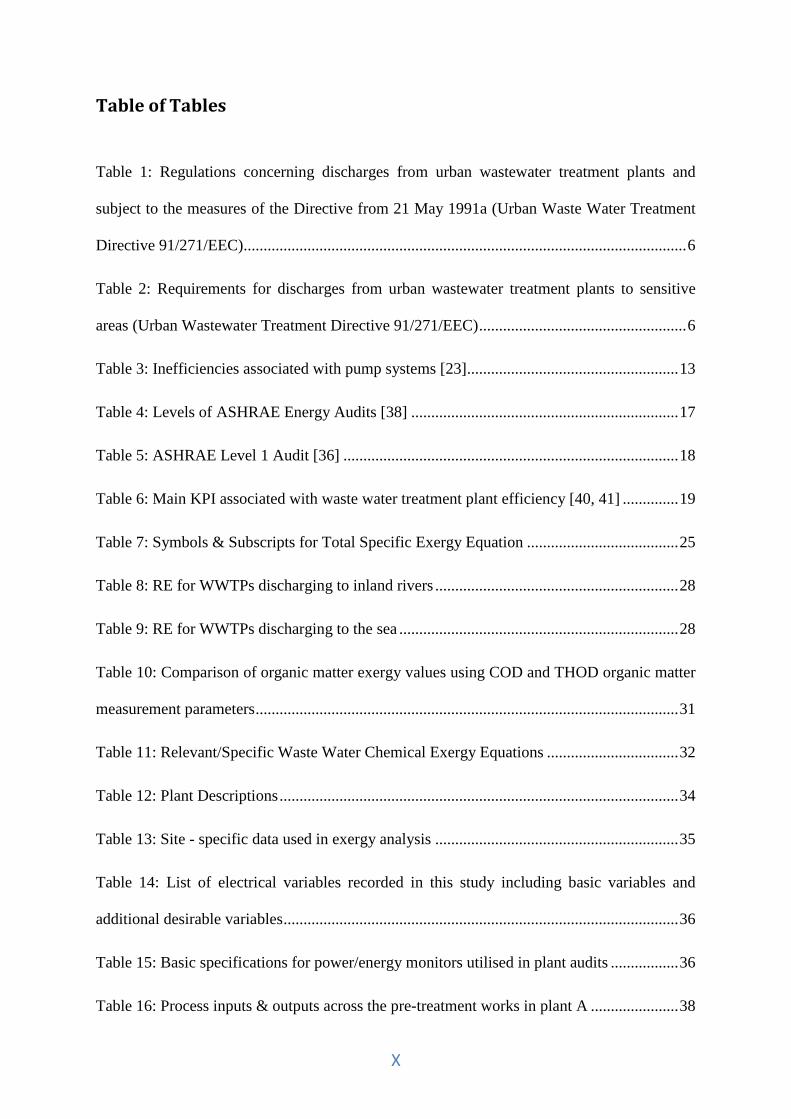
Table 1: Regulations concerning discharges from urban wastewater treatment plants and
subject to the measures of the Directive from 21 May 1991a (Urban Waste Water Treatment
Directive 91/271/EEC)............................................................................................................... 6
Table 2: Requirements for discharges from urban wastewater treatment plants to sensitive
areas (Urban Wastewater Treatment Directive 91/271/EEC) .................................................... 6
Table 3: Inefficiencies associated with pump systems [23] ..................................................... 13
Table 4: Levels of ASHRAE Energy Audits [38] ................................................................... 17
Table 5: ASHRAE Level 1 Audit [36] .................................................................................... 18
Table 6: Main KPI associated with waste water treatment plant efficiency [40, 41] .............. 19
Table 7: Symbols & Subscripts for Total Specific Exergy Equation ...................................... 25
Table 8: RE for WWTPs discharging to inland rivers ............................................................. 28
Table 9: RE for WWTPs discharging to the sea ...................................................................... 28
Table 10: Comparison of organic matter exergy values using COD and THOD organic matter
measurement parameters .......................................................................................................... 31
Table 11: Relevant/Specific Waste Water Chemical Exergy Equations ................................. 32
Table 12: Plant Descriptions .................................................................................................... 34
Table 13: Site - specific data used in exergy analysis ............................................................. 35
Table 14: List of electrical variables recorded in this study including basic variables and
additional desirable variables ................................................................................................... 36
Table 15: Basic specifications for power/energy monitors utilised in plant audits ................. 36
Table 16: Process inputs & outputs across the pre-treatment works in plant A ...................... 38

XI
Table 17: Exergy Calculation of Sodium Hydroxide .............................................................. 40
Table 18: Summary of Plant A's Process inputs and outputs .................................................. 42
Table 19: Plant A – Pre Treatment Works ............................................................................... 44
Table 20: Plant A - Primary Clarifier ...................................................................................... 45
Table 21: Plant A - Aeration Basin .......................................................................................... 46
Table 22: Plant A - Secondary Clarifier .................................................................................. 47
Table 23: Summary of Plant B's Process inputs and outputs ................................................... 50
Table 24: Plant B - Pre - Treatment Works ............................................................................. 50
Table 25: Plant B - Aeration Basin .......................................................................................... 51
Table 26: Plant B - Secondary Clarifier ................................................................................... 52
Table 27: Summary of Plant C's Process inputs and outputs ................................................... 55
Table 28: Plant C – Pre Treatment works ................................................................................ 55
Table 29: Plant C - Aeration Basin .......................................................................................... 56
Table 30: Plant C - Secondary Clarifier ................................................................................... 57
Table 31: Exergy Analysis Results Comparison ..................................................................... 58

XII
PUBLICATIONS FROM THIS RESEARCH
Horrigan, M., Corcoran, B., Delauré, Y., Phelan, T., McNamara, G. and Fitzsimons, L., “The
use of exergy analysis to benchmark the resource efficiency of municipal waste water
treatment plants in Ireland”, 1st South East European Conference on Sustainable
Development of Energy, Water and Environment Systems – Ohrid, Macedonia, 29 June - 3
July, 2014

XIII
ABSTRACT
The use of Exergy Analysis to Benchmark the Resource Efficiency of
Municipal Waste Water Treatment plants in Ireland
By
Matthew Horrigan
With ever increasing environmental standards and waste water loading rates, energy
consumption for waste water treatment is predicted to rise by over 20% by 2020 in the United
States. When considering the resource efficiency of waste water treatment plants factors such
as effluent quality, carbon footprint and increasing electricity rates act as a driving force for
sustainable design of these facilities. Exergy analysis has been identified in the literature as a
powerful tool in the analysis of thermal systems. It enables the resource efficiency of systems
to be benchmarked, where the process with the greatest exergy destruction represents the
greatest energy efficiency opportunity. The objectives of this research are: (i) calculate the
chemical exergy of the relevant process streams within waste water treatment plants; (ii)
identify the most suitable parameter to calculate the chemical exergy of organic matter; (iii)
identify exergy losses from process streams that could be utilised to produce work. Exergy
analysis of three separate waste water treatment plants has been performed. Having identified
and measured all the key process input and outputs, a comprehensive exergy analysis has
been undertaken. Following an extensive literature review, earlier methods to calculate
chemical exergy of organic matter are critically assessed; chemical oxygen demand was
identified as the most useful parameter when calculating the chemical exergy of organic
matter in waste water. Results for the work indicate that organic matter is the principal
contributor to chemical exergy values in waste water treatment plants. Influent organic matter
loading rates also greatly impact the exergy destruction rates across a waste water treatment
plant.

1
1 Introduction
Energy is a key input in the operation of a number of Waste Water Treatment Plant (WWTP)
processes. It is used in the initial transportation of waste water to the plant, the biological
treatment of organic matter and the eventual discharge of treated waste water from the plant.
Additionally, substantial quantities of other resources such as coagulants and disinfectants are
consumed in the treatment of waste water. With WWTPs accounting for approximately 1% of
the world’s total energy consumption [1] and the current instability in the cost of supplied
electricity, greater emphasis has been placed on proficient use of these fundamental
resources. Therefore, characterisation and optimisation of all resources within a WWTP is
crucial. Establishing a connection between energy, resources and sustainability necessitates
the use of a method to quantify resources and resource consumption within WWTPs; exergy
analysis is a potential method.
Exergy is a thermodynamic property, which combines the first and second law of
thermodynamics and can be defined as the maximum theoretical work that can be achieved
when two systems at different states are brought into equilibrium [2]. Exergy analysis is
recognised as an important instrument in the analysis of thermal and chemical systems [3, 4].
Exergy analysis takes into consideration thermodynamic irreversibilities often neglected by
the conventional energy balance such as energy losses in heat transfer and chemical reactions
[5]. However, exergy analysis has rarely been applied to WWTP optimisation. By
quantifying the exergy content of process streams, the exergy destruction across plant
processes can be calculated. A hierarchy of inefficient processes can be identified, allowing
informed design decisions to be made with regard to WWTP sustainability.

2
This research takes a holistic view of all aspects of WWTP treatment with a number of
WWTPs across Ireland benchmarked based on certain characteristics such as; (i) Population
Equivalent (PE) load; (ii) type of treatment (i.e. primary, secondary, tertiary); (iii) discharge
location; (iv) aerobic versus anaerobic treatment of waste water. The benchmarking
methodology is composed of a number of steps, measurement of:
Energy demand of all equipment and processes
Waste water treatment parameters (i.e. Chemical Oxygen Demand etc.)
Waste water flow rate.
Once all the information was obtained from the respective WWTPs, the following objectives
were defined for this research:
Determine most suitable method to calculate the chemical exergy of organic and
inorganic matter for waste water treatment
Conduct exergy analyses of a number of WWTPs, quantifying the exergy content or
work potential of process streams
Establish a hierarchy of wastewater treatment plant processes with the greatest
exergy destruction
Determine the exergy losses from WWTP processes that could be utilised to produce
work.
The pertinent WWTP resource efficiency and exergy research literature is reviewed in
Chapter 2. The key sections include an introduction to the current state of the waste water
sector in Ireland and an investigation into the most suitable energy efficient technologies
applicable to WWTPs; allied to this, a method to achieve sustained savings such as energy
management systems is also reviewed. The fundamentals of exergy analysis are reviewed

3
along with its application to benchmarking the resource efficiency of WWTPs. The review of
exergy analysis discusses the pertinent issues relevant to this research such as:
How is exergy analysis used to benchmark the resource efficiency of WWTPs?
What is the most suitable organic measurement parameter to calculate the
chemical exergy of organic matter in waste water?
Chapter 3 details the chemical exergy calculation methodology associated with the exergy
analysis of WWTPs and provides guidance on how to calculate the chemical exergy of
process inputs and outputs from WWTP plant processes. In addition, a number of practical
examples are presented.
The results of the exergy analyses of the respective WWTPs are presented in Chapter 4. The
site layouts and site descriptions are characterised for each plant. The process inputs and
outputs for each WWTP process are detailed for each plant, with associated exergy value
detailed. The exergy destruction for each process is then calculated.
Chapter 5 provides detailed discussion of the results from the exergy analyses of the WWTPs
in Chapter 4. Finally the conclusions of the research and recommendations for future work
that could be undertaken are presented in Chapter 6.

4
2 Literature Review
The objective of this chapter is to discuss the relevant research in relation to exergy analysis
of waste water treatment plants. Due to the cross-discipline nature of this research project,
research findings from other academic fields are reviewed and incorporated in this literature
review.
2.1 Overview of Waste Water Treatment Processes and Relevant Parameters
A brief overview of the processes involved in the treatment of waste water is now provided
and the relevant organic matter parameters in relation to waste water quality are also
reviewed.
2.1.1 Organic matter in waste water
Domestic waste water can contain both solid and dissolved pollutants with organic
compounds in waste water generally composed of a combination of carbon, hydrogen, and
oxygen. As all waste water is eventually discharged back into the aquatic environment,
untreated waste water can have a significant negative effect on the water environment. Proper
treatment of waste water reduces the risk of waterborne diseases, eutrophication etc. and
therefore significantly reduces any threat to public health.
Typical waste water constituents are sugars, carbohydrates, fats, soluble proteins, and urea.
Various techniques have been established to determine the organic content of waste water.
Gross quantities of organic matter in waste water can be measured by laboratory analysis
such as Chemical Oxygen Demand (COD), Biological Oxygen Demand (BOD), Theoretical
Oxygen Demand (THOD), Total Organic Carbon (TOC) and Total Oxygen Demand (TOD).
These measurement parameters are defined below; as they are of paramount importance when
assessing the organic chemical matter present in waste water.

5
2.1.2 Organic matter parameters
Biological oxygen demand. BOD is the quantity of dissolved oxygen consumed by aerobic
biological organisms in the oxidation of organic matter present in waste water.
Chemical oxygen demand. COD is the quantity of oxygen required to chemically oxidise all
organic and inorganic compounds in waste water. The COD value is usually larger than
BOD, as some organic substances are oxidised more easily chemically than biologically.
Theoretical oxygen demand. THOD represents the quantity of oxygen required to oxidise a
compound to its final oxidation products.
Total organic carbon. TOC represents the quantity of organic carbon contained within an
aqueous sample. It can be used to measure the pollution characteristics within waste water.
Total oxygen demand. TOD is a measure of all matter oxidised in a sample of waste water,
determined by measurement of the depletion of oxygen after chamber combustion.
2.2 Wastewater treatment plant discharge regulation
The Urban Waste Water Treatment Directive (UWWTD) has set out acceptable measures of
water quality for WWTPs. Table 1 and Table 2 detail the UWWTD discharge limits for urban
areas with populations greater than 2,000 PE. Municipal WWTP influent flow rates are
determined by PE; PE can be defined as, one person within the WWTP collection area is
expected to produce 200 litres of sewage flow per day containing 60 grams of BOD.

6
Table 1: Regulations concerning discharges from urban wastewater treatment plants
and subject to the measures of the Directive from 21 May 1991a (Urban Waste Water
Treatment Directive 91/271/EEC)
Parameters Discharge Concentration Minimum Percentage Reduction2
5-Day biochemical oxygen demand (BOD5 at 20°C) without nitrification1
25 mg/l O2 70 - 90 %
COD 125 mg/l O2 75%
TSS
35 mg/l 3
• 35 mg/l in high mountain regions for
agglomerations with more than 10,000 PE
• 60 mg/l in high mountain regions for agglomerations whose size falls between
2,000 and 10,000 PE
90 % 3
• 90% in high mountain regions for
agglomerations of more than 10,000 PE
•70% in high mountain regions for agglomerations whose size falls
between 2,000 and 10,000 PE
1. This parameter can be replaced with another parameter: Total Organic Carbon (TOC) or Total Oxygen Demand (TOD) if a
relationship can be established with BOD5 and the substitute parameter
2. Reduction relative to influent values. 3. Requirement Optional
Table 2: Requirements for discharges from urban wastewater treatment plants to
sensitive areas (Urban Wastewater Treatment Directive 91/271/EEC)
Parameters Discharge Concentration Minimum Percentage Reduction1
TP 2 mg/l (10,000 - 100,000 P.E.)
80%
1 mg/l > (100,000 P.E.)
TN 15 mg/l (10,000 - 100,000 P.E.)
70 - 80%
10 mg/l > (100,000 P.E.)
1. Reduction relative to influent values.
The UWWTD requires secondary treatment of all discharges from agglomerations > 2,000
PE [6]; consequently €4.6 billion in Irish Exchequer resources have been spent on both the
waste water sector to ensure compliance with the UWWTD and also to deliver quality
drinking water to the Irish public [7]. As a result, secondary treatment for agglomerations >
2,000 PE now stands at 92%, compared to 25% in 2000 [7]. However, according to a recent
Environmental Protection Agency (EPA) report [8, 9], only 69% of Irish WWTPs with
secondary treatment are meeting the minimum effluent quality standards (i.e. BOD, COD) set
7
out under UWWTD. Additionally, 44 (26%) of the 170 large urban did not comply with the
European Union quality standards for such areas.
The treatment of waste water generally can be divided into mechanical, biological and sludge
treatment, with the selection of a waste water treatment process or sequence of processes
dependent on a number of factors summarized below [10]:
Characteristics of influent waste water (BOD, COD, pH etc.)
Effluent quality required
Cost and availability of land
Consideration of possible future upgrading of waste water quality standards.
2.3 Mechanical treatment
Large suspended solids such as pieces of plastic, wood, toilet paper residue and fabric are
removed through the use of screens. The sewage then flows into a grit chamber, where
minerals such as gravel and sand are separated by sedimentation. The sewage then passes into
large sedimentation tanks where the majority of the solids, known as primary sludge, settle to
the bottom in a process known as primary clarification.
2.3.1 Biological treatment
Biological treatment is achieved by microorganisms consuming organic matter; it involves
the manipulation of oxygen conditions to grow specific types of bacteria to consume organic
matter. There are three different methods of biological treatment, detailed as follows:
Aerobic Treatment – Dissolved oxygen is present in this process with aerobic bacteria
utilising oxygen in the tank provided by aerators. The main products of this process
are biomass, carbon dioxide and water.

8
Anaerobic Treatment – Dissolved oxygen is not available, but anaerobic bacteria can
utilize the oxygen bound in sulphate to breath. The main products of this process are
hydrogen sulphide, carbon dioxide and water.
Anoxic Treatment – Dissolved oxygen is not available, but anoxic bacteria can utilize
the oxygen bound in nitrate to breath. The main product of this process is nitrogen
gas.
WWTP managers can utilise any number of the processes detailed above when designing
their biological treatment systems. Clearwater WWTP in Florida for example operates a 5 –
stage Bardenpho process consisting of anaerobic zone followed by two anoxic and anaerobic
zones [11]. The second anoxic zone provides an opportunity to denitrify the nitrates created
in the aeration zone, allowing lower total nitrogen effluent concentrations.
2.3.2 Activated Sludge Process
The activated sludge process is a biological treatment process where air is introduced to
waste water to produce a biological floc. The floc then settles to the bottom of the aeration
basin enabling it to be removed from the process and thus reducing the organic content of the
waste water. This clarified effluent is categorised into two categories:
Return activated sludge
Waste activated sludge.
Return activated sludge is re - introduced to the beginning of the process through a sludge
recycling system as they are very efficient at digesting organic matter in the aeration basin.
Excess solids and organisms removed from the process are referred to as waste activated
sludge.

9
2.3.3 Sludge treatment
Following biological treatment, the waste water flows to secondary settlement tanks where
the majority of biological solids are deposited as sludge while the clarified effluent passes to
the outfall pipe for discharge. If aerobic treatment of organic matter is being utilised in the
plant, a portion of the sludge is returned to the inlet of the aeration tanks to reseed the new
waste water entering the tank. Typically, sludge is thickened to reduce its volume and
transported off-site for disposal. Alternative methods such as incineration, anaerobic
digestion and land application can also be utilised.
2.4 Irish waste water treatment sector
Municipal waste water treatment in Ireland is provided by small treatment plants distributed
throughout the country. Approximately 66% of municipal WWTPs in Ireland have a PE of
less than 2,000, while only 12% (65) of Irish WWTPs have a PE of greater than 10,000 [12].
Irish Water has recently been established to amalgamate the water and waste water services
of the 34 Local Authorities under one national service provider. Prior to January 2014, waste
water services within Ireland had been provided by these 34 Local Authorities. This led to a
large degree of division in the provision of services, with this division hindering the
standardisation of procedures and technology [13]. The recent economic crisis has led to
increased pressures on local authorities to deliver services, for example local authorities such
as Limerick County Council saw a 3% decrease in overall budget expenditure while
expenditure for the operation and maintenance of WWTPs in Limerick increased by 3%
between 2012 -2013 [14].
The majority of energy consumption in municipal WWTPs is associated with the secondary
treatment process [15] (Figure 1), with approximately 90% of WWTP utilising the activated
sludge treatment process in Ireland [16]. According to the United States (US) Environmental

10
Protection Agency (EPA), aeration and waste water pumping typically consume 68% of
electrical energy usage within the activated sludge process (Figure 1). This would suggest
that WWTP plant managers should therefore focus on efficient operation of their aeration and
waste water pumping systems by using a combination of more energy efficient retrofits,
effective process control, pro-active equipment maintenance and good operational practice.
Figure 1: Electricity requirements for Activated Sludge Waste Water Treatment [15]
2.5 Good practice guide for WWTP equipment
2.5.1 Aerators
Waste water aeration accounts for up to 54% of electrical energy usage within the activated
sludge process [15]; therefore WWTP plant managers should spend a significant amount of
time monitoring, characterising and optimising their aeration system as significant energy
savings opportunities exist. Within the activated sludge treatment process, micro -organisms
degrade organic matter converting it into carbon dioxide, water and biomass. As these micro-
organisms require oxygen to survive, air is introduced to the system through a number of

11
methods. Mechanical aerators introduce air to the system by agitating the waste water surface
with either blades or propellers. Alternatively, waste water can be aerated by bubbling air or
high purity oxygen through it from below. Cantwell et al. [17] estimated that aeration energy
consumption can be reduced by up to 40% by retrofitting mechanical and coarse bubble
aeration systems with fine bubble diffused aeration systems. Fine bubble diffused aeration
systems support higher oxygen transfer rates due to in an increase in bubble surface area per
unit volume of fine bubbles over coarse bubbles [18].However, fine bubble diffused aeration
systems require more routine cleaning and are more prone to plugging leading to an increase
in maintenance costs. Killarney WWTP replaced mechanical rotor aerators with fine bubble
diffused aeration systems reducing the power demand in the aeration ditch from 45 kW to
less than 15 kW, as reported in a study of both Killarney and Dingle WWTPs [19]. The
installed fine bubble diffused aerators have a payback period of two years with respect to the
initial capital investment. In order for the aeration system to address real time operating
conditions within the plant, aeration control strategies should be implemented. However,
biological treatment of waste water is not a simple process; appropriate aeration control is a
balance between energy efficiency and effective waste water treatment.
2.5.2 Control Systems
The most frequently used control variable in the WWTP industry is Dissolved Oxygen (DO)
[20, 21]. Through the use of automatic control systems, DO levels can be adjusted to real-
time process requirements, thus reducing aeration blower energy consumption requirements
[22]. DO control systems build flexibility into a WWTP’s aeration system, by adjusting the
oxygen requirements to the real time variable conditions within its aeration basin [23]. One of
the most common DO control systems is the cascade feedback control system, illustrated in
Figure 2 below [24].

12
Figure 2: DO cascade feedback control diagram [24]
To achieve specific DO set points the airflow in the tank is constantly manipulated; this is
achieved through the use of a Proportional, Integral and Derivative (PID) controller
[24].Olsson [25] noted that the use of PIDs is only one approach to achieve specific DO set
point control, other methods such as genetic algorithm and fuzzy logic control can be used,
but not much evidence exists to suggest they are more effective than PIDs. The US EPA
undertook a series of control tests demonstrating energy savings of approximately 40% can
be obtained by using automated dissolved oxygen control over manual control [21]. Although
biological oxygen demand within the aeration basin varies with the proportion of organic and
ammonia loading in the influent waste water [23], variations in DO and ammonia levels
within the WWTP basin should also be considered. Over aeration can increase energy costs,
while under aeration leads to problems such as poor sludge settling and an increase in the
number of filamentous organisms [23]. Therefore, multiple DO sensor zones with
independent air supply for each zone reduce energy consumption by matching the airflow to
the DO needs for that particular zone [26]. When placing the sensor within the zone, areas
that experience instability should be avoided as hunting problems in the control system could
be represented in the measured value from the sensor [27].
2.5.3 Pump Energy
Waste water pumping accounts for up to 14% of electrical energy usage within the activated
sludge process [15], second only to aeration. Within the plant, pumps are used to transport

13
waste water and sludge between the various treatment processes. Operating conditions within
the WWTP greatly affect overall WWTP pump efficiency [28], inefficiencies arise when
pumps are expected to operate over a wide range of conditions. Additional losses may occur
if pumps are sized for peak flow conditions that occur infrequently, therefore the pump will
not operate at its Best Efficiency Point (BEP)1. Signs of an inefficient pumping system are
detailed below in Table 3 [23].
Table 3: Inefficiencies associated with pump systems [23]
Signs of an inefficient pumping system include
1) Highly or frequently throttled control valves
2) Bypass line (recirculation) flow control
3) Frequent on/off cycling
4) Cavitation noise at the pump or elsewhere in the system
5) A hot running motor
6) A pump system with no means of measuring flow, pressure, or power
consumption
7) Inability to produce maximum design flow
2.5.4 Variable Frequency Drives
As waste water pumps experience a large variation in diurnal flow, Variable Frequency
Drives (VFD) can be applied to WWTP pumps and blowers to manipulate their speed to
match waste water flow conditions. VFD alter the frequency of the input signal to the motor,
by controlling this frequency the speed of the motor may be regulated (Figure 3). Numerous
alternative methods such as stop/start control, throttling valves and bypass control may be
used to control waste water flow, all of which are detailed in Figure 3. Stop/start control is
symptomatic of an over - sized pump that matches flow. Throttling valves move the operating
point on the pump’s curve to the left, thereby reducing flow. Bypass control returns a
percentage of the water pumped back to the suction side of the pump, wasting a percentage of
the energy used to recirculate the water with no beneficial work achieved. VFD are the most
efficient method to control waste water flow (Figure 3) [29]. The energy savings potential of
1 BEP is the flow rate and head that gives the maximum efficiency on a pump curve

14
VFD was reported in a study carried out at Dingle WWTP where a fine bubble diffused
aeration system was coupled to a low speed variable output blower, reducing energy
consumption within the plant by 37% [19]. However, VFD are not applicable in all situations,
for example, when a large ratio of static to dynamic head exists.
Figure 3: Wasted Energy in Alternative Control Schemes Compared to Variable
Frequency Drives [29]
2.6 New Energy Efficient Technologies
2.6.1 OxyMem
The OxyMem Membrane Aerated Biofilm Reactor (MABR) is a secondary treatment system.
As the waste water travels through the OxyMem MABR the organic matter is consumed by
biofilm cultures that live on the membranes inside the reactor. This enables oxygen to be

15
transferred directly to the bacteria resulting in oxygen transfer efficiency rates of up to 99%,
leading to a reported direct reduction in operating costs of up to 75% [30]. It is important to
note that a whole life cycle costing should be carried out on the OxyMem MABR to take into
consideration such issues as membrane cleaning etc.
2.6.2 Anaerobic Ammonium Oxidation
Anaerobic Ammonium Oxidation is an ammonium removal technology, developed at Delft
University of Technology. The initial step in the process is partial nitrification of half of the
ammonium to nitrite by ammonia oxidising bacteria. A growth rate exists at higher
temperatures where ammonium is oxidised but nitrite is not converted; both processes can
take place in the one reactor. This results in the ammonium and nitrite being converted into
dinitrogen gas [31]. In anaerobic ammonium oxidation systems, oxygen demand is greatly
reduced by up to 50% as only half of the ammonium needs to be oxidised to nitrite, as
opposed to full conversion to nitrate [11].
2.6.3 Pumped Flow Biofilm Reactor
The Pumped Flow Biofilm Reactor (PFBR) is a two reactor technology that enables aerobic,
anoxic and anaerobic conditions to be sequenced. Biofilm grow on plastic media modules
within the two reactors. The two reactors empty and fill a numerous times during a typical
aeration sequence, exposing the biofilm to atmospheric air and waste water [32]. Operational
costs of the PFBR have been shown to be 66% less than the conventional activated sludge
system [33].
2.7 Sustainable Energy Efficiency
An ad-hoc approach to energy efficiency within WWTPs leads to initial savings that address
immediate energy problems within WWTPs. In order for sustained savings to be achieved a

16
cohesive and consistent approach is needed and therefore a spirit of energy efficiency needs
to be fostered within the plant.
2.7.1 Energy Audit
A key step in establishing the baseline energy usage within a WWTP is an energy audit; from
which future energy efficiency improvements can be measured. An energy audit is an
inspection and analysis of energy usage within a facility [34]. An audit identifies energy use
patterns, the potential for energy and cost savings, and can include recommendations for
actions to improve energy efficiency and reduce energy costs [35]. Energy audits identify
potential capital improvements such as retrofits (motors, blowers etc.) and operational
improvements such as operation time of equipment.
Plant operation data in conjunction with waste water parameters such as BOD and TN can be
used to establish the various operating seasons of a WWTP [36]. The seasons reflect
variances in infiltration rates in the water collection system and temporary changes in
population (i.e. schools). Once operating seasons are established, measurements of influent
plant load should be taken to benchmark plant energy usage.
The conditions and seasonal variations in Irish WWTP load are summarised below [37]:
• Season 1 (October – March): High flow, High load (BOD, TN etc.), and low wastewater
temperature
• Season 2 (April – June): Average flow, average load, and low wastewater temperature
• Season 3 (July – September): Low flow, low load, and higher wastewater temperature.
17
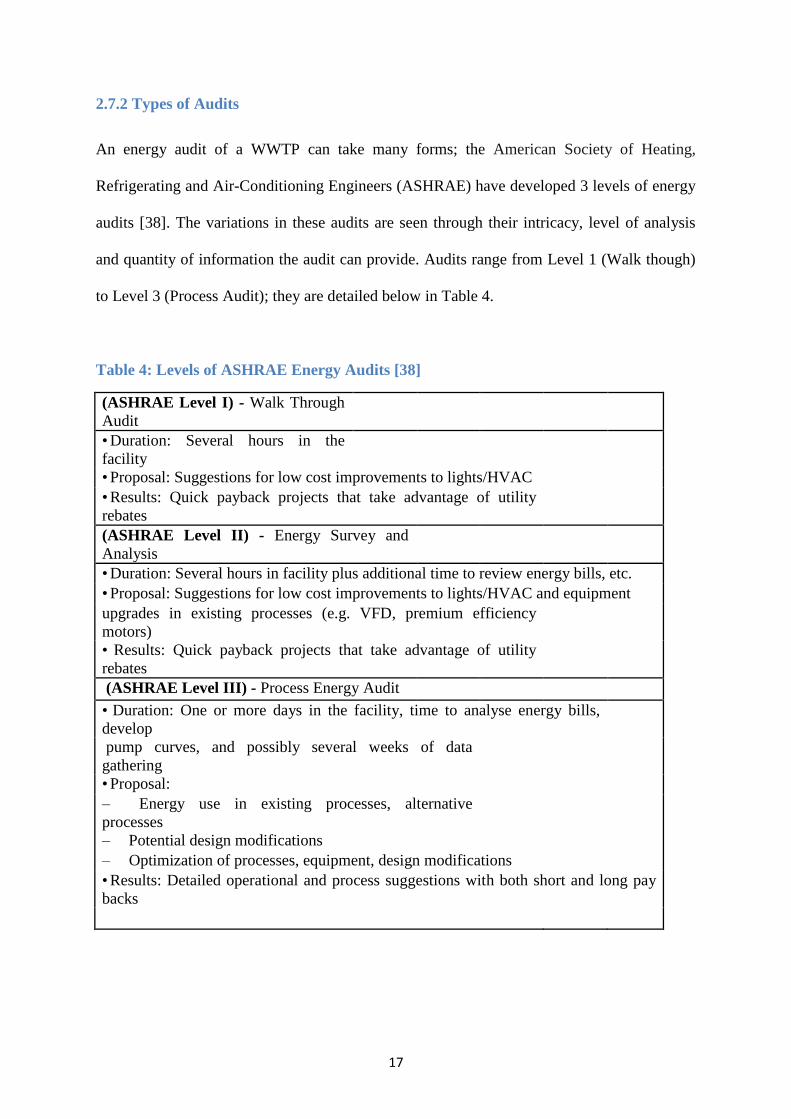
2.7.2 Types of Audits
An energy audit of a WWTP can take many forms; the American Society of Heating,
Refrigerating and Air-Conditioning Engineers (ASHRAE) have developed 3 levels of energy
audits [38]. The variations in these audits are seen through their intricacy, level of analysis
and quantity of information the audit can provide. Audits range from Level 1 (Walk though)
to Level 3 (Process Audit); they are detailed below in Table 4.
Table 4: Levels of ASHRAE Energy Audits [38]
(ASHRAE Level I) - Walk Through
Audit
• Duration: Several hours in the
facility
• Proposal: Suggestions for low cost improvements to lights/HVAC
• Results: Quick payback projects that take advantage of utility
rebates
(ASHRAE Level II) - Energy Survey and
Analysis
• Duration: Several hours in facility plus additional time to review energy bills, etc.
• Proposal: Suggestions for low cost improvements to lights/HVAC and equipment
upgrades in existing processes (e.g. VFD, premium efficiency
motors)
• Results: Quick payback projects that take advantage of utility
rebates
(ASHRAE Level III) - Process Energy Audit
• Duration: One or more days in the facility, time to analyse energy bills,
develop
pump curves, and possibly several weeks of data
gathering
• Proposal:
– Energy use in existing processes, alternative
processes
– Potential design modifications
– Optimization of processes, equipment, design modifications
• Results: Detailed operational and process suggestions with both short and long pay
backs

18
Table 5, detailed below, provides an example of an ASHRAE level 1 audit where equipment
inventories are used to categorise the horsepower of plant equipment, usage and control type
in place.
Table 5: ASHRAE Level 1 Audit [36]
Equipment
Type Quantity Horsepower Usage Control
Mechanical
Aerator 1 90 Continuous
Variable Frequency Drive
(VFD), manual adjustment
Blowers 1 20 Intermittent Fixed Speed
Mixer 1 4 Continuous Fixed Speed
Influent Pump
(No. 1 & 2) 2 15 Continuous VFD, speed based on flow
Influent Pump
(No. 3) 1 5 Back Up VFD, speed based on flow
Centrifuge 1 50 30-40 hrs.
/week VFD, fixed speed
2.7.3 Energy Management System
An energy audit is the initial component of a continuous process known as an Energy
Management System (EMS). An EMS is a critical management tool that “clearly articulates
the measures that are, or will be, deployed by a department to reduce its energy consumption”
[39]. An EMS is an example of an operational improvement that could be implemented in a
WWTP.
The EMS is a relatively new approach to energy auditing where sustained savings is the main
objective. In order to achieve sustained savings a real commitment is necessary from all
parties in an organisation.
19
2.7.4.1 Key performance indicators (KPI)
An instrumental aspect of an EMS is its use of Key Performance Indicators (KPI). KPI help
an organization identify and appraise progress toward organizational goals. Once an
organization has identified the various stakeholders and defined its goals, it needs a process
to measure progress towards these goals. Key performance indicators are these
measurements.
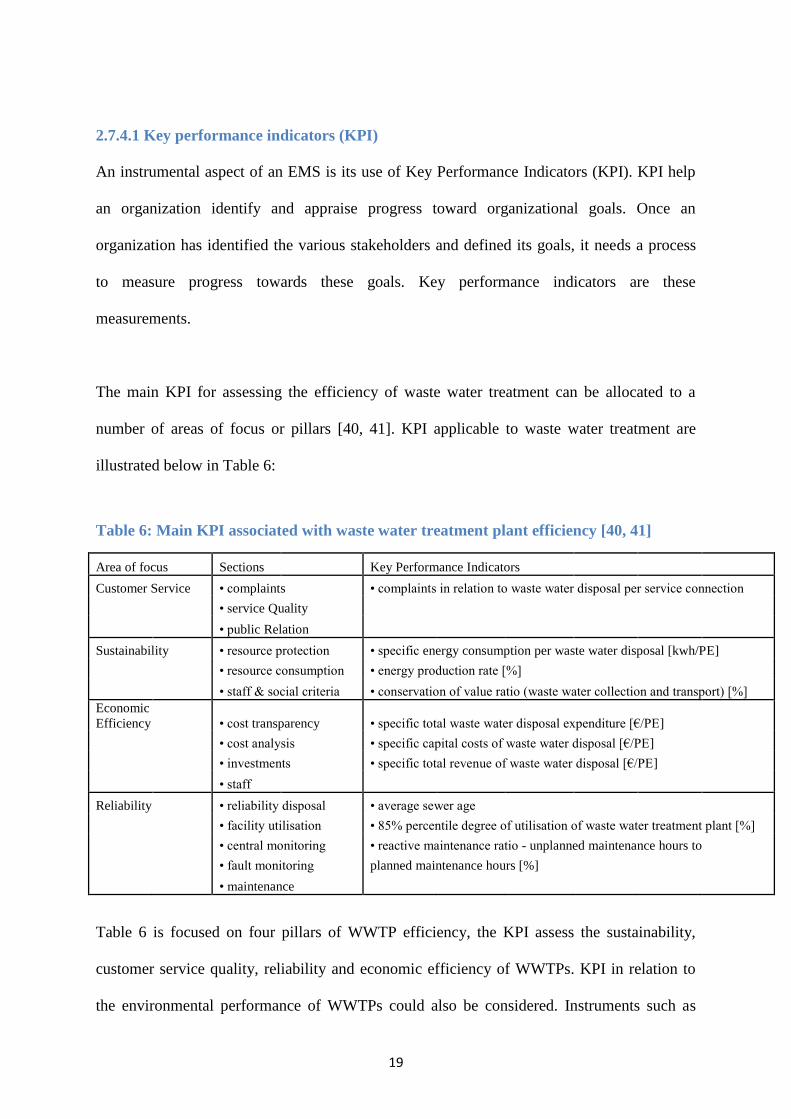
The main KPI for assessing the efficiency of waste water treatment can be allocated to a
number of areas of focus or pillars [40, 41]. KPI applicable to waste water treatment are
illustrated below in Table 6:
Table 6: Main KPI associated with waste water treatment plant efficiency [40, 41]
Area of focus Sections Key Performance Indicators
Customer Service • complaints • complaints in relation to waste water disposal per service connection
• service Quality
• public Relation
Sustainability • resource protection • specific energy consumption per waste water disposal [kwh/PE]
• resource consumption • energy production rate [%]
• staff & social criteria • conservation of value ratio (waste water collection and transport) [%]
Economic
Efficiency • cost transparency • specific total waste water disposal expenditure [€/PE]
• cost analysis • specific capital costs of waste water disposal [€/PE]
• investments • specific total revenue of waste water disposal [€/PE]
• staff
Reliability • reliability disposal • average sewer age
• facility utilisation • 85% percentile degree of utilisation of waste water treatment plant [%]
• central monitoring • reactive maintenance ratio - unplanned maintenance hours to
• fault monitoring planned maintenance hours [%]
• maintenance
Table 6 is focused on four pillars of WWTP efficiency, the KPI assess the sustainability,
customer service quality, reliability and economic efficiency of WWTPs. KPI in relation to
the environmental performance of WWTPs could also be considered. Instruments such as

20
WWTP discharge requirements and influent COD, BOD etc. percentage removal rates could
be used to assess the environmental performance of WWTPs
2.7.4.2 KPI Benchmarking of WWTPs
KPI provided the platform for the Austrian benchmarking system to be established. Its initial
objective was to develop KPI and best practice guidelines for the operation of WWTPs.
Plants were benchmarked for yearly total, capital and operating costs based on compliance
with a number of criteria detailed below:
Austrian emission standards
Minimum quality of technical data
Available operating and yearly total costs.
Data was acquired from the plants through an internet platform, enabling technical and
financial data to be processed. During the processing stage plausibility checks were
conducted, with KPI for cost categories and processes also calculated for each plant.
Currently, over 40% of WWTPs in Austria upload information via the internet platform to the
benchmarking system [42]. A decline in specific operating costs with increasing plant size
was observed; in additional, and importantly, no correlation between treatment efficiency and
operating costs could be found, with excellent treatment efficiency often achieving the lowest
specific costs [42].
2.7.4.3 Deming cycle – (Plan-Do-Check-Act)
Although KPI enable an organisation to measure progress towards goals, this is not sufficient
unless a system is in place which implements and maintains progress. Approaches such as the
Deming cycle can help in this respect. The European standards in relation to EMS are based
on the methodology known as Plan-Do-Check-Act system (Figure 4); the system provides a

21
communication mechanism between plant managers and upper management, thus
incorporating important stakeholders in energy management activities [43]. It can be
described as follows [44]:
- Plan: establish the goals and processes necessary to achieve results in accordance with
the organizations energy policy.
- Do: implement the process. Often on a small scale if possible.
- Check: monitor and measure processes against energy policy, objectives, targets, legal
obligations and other requirements to which the organization subscribes, and report
the results.
- Act: take actions to continually improve performance of the energy management
system.
Figure 4: Deming Cycle - Focused on continual improvement [38]
22
2.8 Life cycle analysis
Following the introduction of the UWWTD, an increased focus was placed on the
environmental performance and footprint of WWTPs. Life Cycle Analysis (LCA) is a cradle–
to–grave approach that quantifies the environmental cost at every stage of a product’s life;
From the energy needed to extract the product’s raw materials, to the use and eventual
disposal or recycling of the product. WWTP consume electricity, chemicals and numerous
other resources, while concurrently emitting pollutants to water, soil and air. LCA holistically
examines all environmental impacts from a WWTP. Although LCA can be used to
benchmark the resource efficiency of WWTPs, the compilation of a Life Cycle Inventory and
subsequent impact assessment, provides only a certain amount of meaningful data. It is not
necessary to make comprehensive inventories as the impact classifications are very sensitive
to few compounds released in large quantities. Thus, to obtain useful data a limited number
of indicators should be selected. [45] Alternative methods can be used to benchmark the
resource efficiency of a WWTP; exergy analysis has been advocated as a useful tool for
WWTP characterisation through the quantification of system irreversibilities.
2.9 Exergy analysis of WWTP
The US EPA reported that local governments allocate up to 10% of their annual operating
budget on energy [46] and with WWTPs in the US accounting for 3% of the electrical load
[1], energy efficiency within WWTPs is essential. Additionally, the US EPA states energy
consumption for waste water treatment systems is expected to rise by 20% by 2020 [47].
Energy is vital in all steps of a WWTPs treatment process, from the collection of raw sewage
to the discharge of treated effluent. Exergy analysis has been identified as an important tool
in the analysis of thermal and chemical processes [5]. However, to date, this approach has
seldom been applied to the study of WWTP optimisation. Exergy is a thermodynamic

23
property, which combines the first and second law of thermodynamics, and can be defined as
the maximum theoretical work obtainable as two systems interact to equilibrium [2]. By
conducting an exergy balance across plant processes, the exergy destruction in each process
can be quantified, and in turn used to focus energy efficiency efforts. Several researchers
have used this approach to identify inefficiencies in thermal and chemical systems [3, 4].
Furthermore, exergy analysis can be used to quantify the work potential of waste streams. In
WWTPs the generation of waste streams is unavoidable and exergy analysis may provide
invaluable insight into their potential to do useful work. Exergy analysis can therefore be
used to quantify waste streams enabling informed design decisions with regard to
optimisation of WWTPs.
Initial works by Tai et al. [48] related the chemical exergy of organic matter to waste water
indices Total Oxygen Demand (TOD) and Total Organic Carbon (TOC). In recent years
exergy analysis has been applied to the quantification and optimisation of the environmental
performance of a WWTP [49], it has also been used to quantify chemical exergy assessment
of organic matter in water flow [50]. Hellström [51] showed that exergy analysis can be used
to estimate the flow and consumption of physical resources within WWTPs.
The objective of this research is to conduct exergy analysis on several WWTPs, quantifying
the exergy content or work potential of process streams. Consequently, a hierarchy of WWTP
processes and plants with the greatest exergy destruction will be established, with exergy
destruction rates being utilised to benchmark plant performance.
24
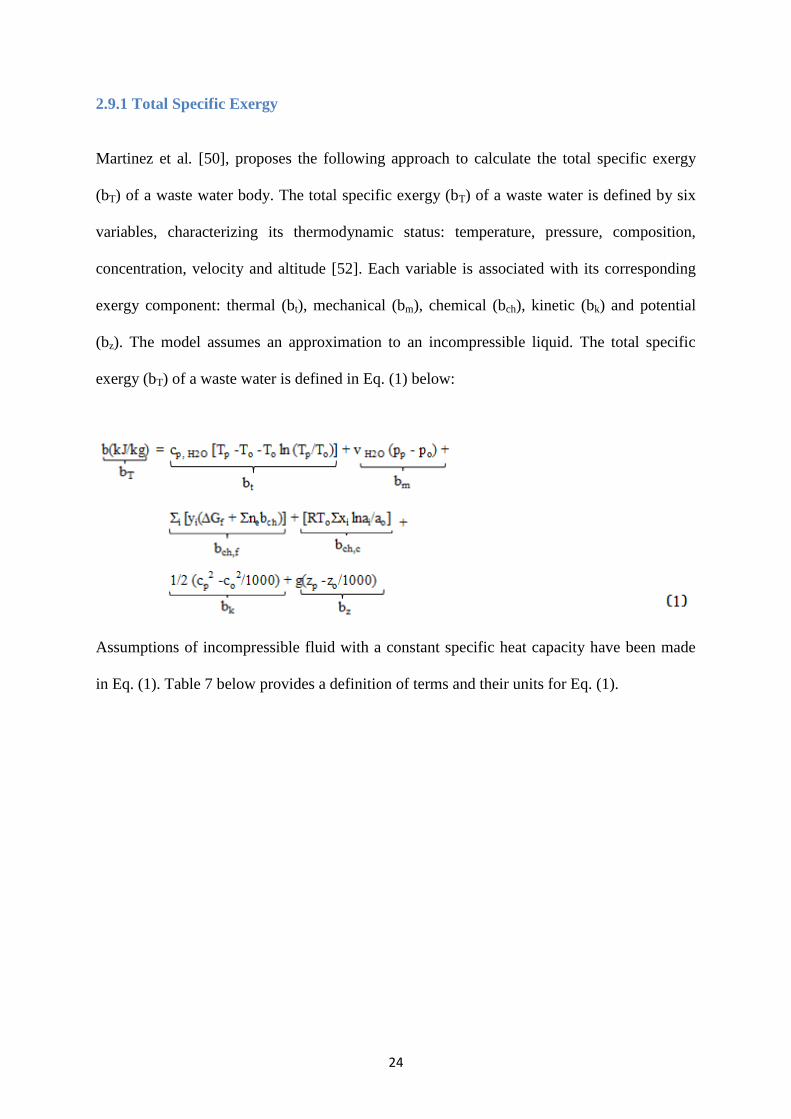
2.9.1 Total Specific Exergy
Martinez et al. [50], proposes the following approach to calculate the total specific exergy
(bT) of a waste water body. The total specific exergy (bT) of a waste water is defined by six
variables, characterizing its thermodynamic status: temperature, pressure, composition,
concentration, velocity and altitude [52]. Each variable is associated with its corresponding
exergy component: thermal (bt), mechanical (bm), chemical (bch), kinetic (bk) and potential
(bz). The model assumes an approximation to an incompressible liquid. The total specific
exergy (bT) of a waste water is defined in Eq. (1) below:
Assumptions of incompressible fluid with a constant specific heat capacity have been made
in Eq. (1). Table 7 below provides a definition of terms and their units for Eq. (1).

25
Table 7: Symbols & Subscripts for Total Specific Exergy Equation
As the majority of WWTPs operate isothermally, thermal exergy is negligible. Mechanical
exergy is also negligible as pressure changes within WWTPs are not significant. Potential
exergy is often also insignificant, depending on plant configuration. Therefore, when
calculating the total specific exergy (bT) of a waste water body, it is sufficient to focus on its
chemical exergy component. The total chemical exergy (bch, T) component combines two
chemical exergy components: formation (bch, f) and concentration (bch, c) exergy which are
detailed in Eq. (2):
(2)
2.9.2 Reference environment
The chemical exergy of a substance is dependent on the environmental model that is selected
as its Reference Environment (RE). The RE from a technical perspective should be as close
as possible to the natural environment [53]. Therefore, when defining the RE for a WWTP its
composition should be close as possible to that of its receiving waters. This is in contrast to
the Szargut RE, where he defined a reference substance for every element in the
Symbols
a activity Subscripts
b specific exergy (kJ/kg) ch chemical
c velocity (m/s) ch,c chemical (concentration)
c p, H20 specific heat capacity of water (kJ/kg K) ch,f chemical (formation)
g gravitational acceleration of the earth (m/s2) e each element forming the substance i
m mass (kg) H2O water
n mole number (mol/kg) i any considered substances
p pressure (kPa) k kinetic
R universal gas constant (kJ/kg K) m mechanical
T temperature (K) o under reference conditions
v specific volume of the aqueous solution (m3/kg) p under ambient conditions
x molar fraction of the substance i in the solvent t thermal
y relative molality (kmol/kg) T total
z height (m) z potential
∆Gf Gibbs free energy (kJ/kmol)
b(kJ/kg) Σi [yi(∆Gf + Σnebch)] + [RToΣxi lnai/ao]
bch,T
=

26
environment; the exergy of other substances may be then calculated by means of a balanced
chemical reaction between the specific substance and its reference substances [54].
If a substance is not contained within the defined RE, its formation chemical exergy is the
only component considered and is calculated by Eq. (3) detailed below [55]:
bch, f = Σi [yi (∆Gf + Σnebch)] (3)
This is the equation to calculate the chemical of a compound, ∆Gf is the formation of Gibbs
energy of the ith element, ne is the amount of kmol of the element e in the compound i and
bch is the standard chemical exergy of the element e.
If a substance is already contained within the defined RE its concentration chemical exergy is
the only component required and is calculated by Eq. (4) detailed below:
bch, c = [RToΣxi lnai/ao] (4)
Xi is the molar fraction and ai and a0 are the activity coefficients of substance i in the water
sample and in the RE. The activity of each substance can be calculated by applying the Eq.
(5):
ai = ϒi .mli (5)
ϒi the activity coefficient and mli is the molality of the ith substance. The activity coefficient
is calculated by applying the Debye–Hückel Theory [56] which explains the unexpected
behaviour of electrolyte ions in a dilute solution by considering their electrostatic
interactions. The Debye–Hückel Theory applies only to electrolytic solutions; other activities
27
that are non-electrolytic in nature can exist in the mixture. Additionally, Fitzsimons [57]
demonstrated that the Debye–Hückel Theory is relevant for very low molalities.
Martinez et al. [55] analysed a number of different RE scenarios in calculating the chemical
exergy of river water, in particular:
Sea water without organic matter and nutrients
Sea water with organic matter and nutrients
A completely degraded RE, with very high organic matter and nutrient concentrations
Pure Water.
As the final discharge location for Martinez’s river case study is located in the eastern
Spanish coast, sea water without organic matter was chosen as the RE. Pure water and the
completely degraded RE models were easily discarded as they are not representative of the
rivers final discharge location in that case. Sea water with organic matter and nutrients was
also discarded as only trace elements of nutrients and organic matter exist in sea water. The
reference environment analysis carried out by Martinez is more of a dead state choice than a
defined RE as defined by Szargut [54]. Chen and Ji utilised an indicator called specific
relative chemical exergy with reference to a range of substances when assessing water
quality. This method was again in contrast to the Szargut [54] approach with chemical exergy
based on global reference substances.
When analysing the RE for a WWTP its discharge location impacts greatly on the selection
of a suitable RE. For example, a WWTP discharging to an inland river would have a
significantly different RE than a WWTP discharging to the sea. Therefore, two different REs
are defined for WWTPs below.
28
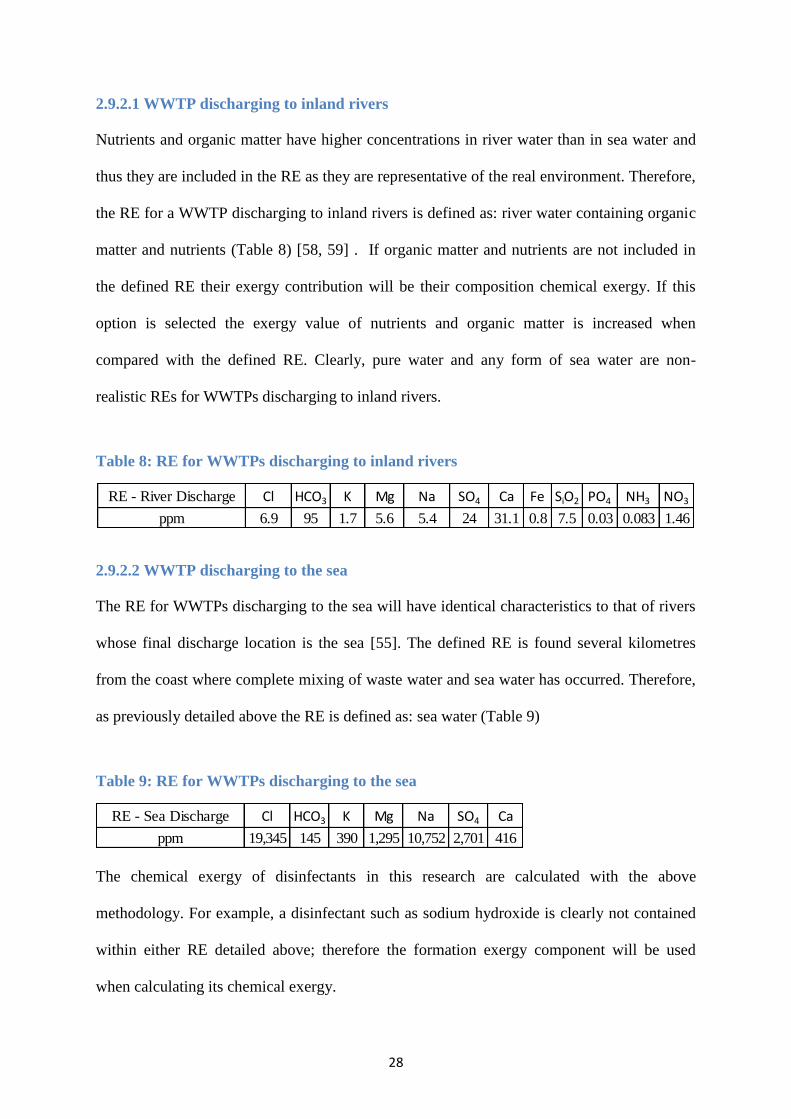
2.9.2.1 WWTP discharging to inland rivers
Nutrients and organic matter have higher concentrations in river water than in sea water and
thus they are included in the RE as they are representative of the real environment. Therefore,
the RE for a WWTP discharging to inland rivers is defined as: river water containing organic
matter and nutrients (Table 8) [58, 59] . If organic matter and nutrients are not included in
the defined RE their exergy contribution will be their composition chemical exergy. If this
option is selected the exergy value of nutrients and organic matter is increased when
compared with the defined RE. Clearly, pure water and any form of sea water are non-
realistic REs for WWTPs discharging to inland rivers.
Table 8: RE for WWTPs discharging to inland rivers
2.9.2.2 WWTP discharging to the sea
The RE for WWTPs discharging to the sea will have identical characteristics to that of rivers
whose final discharge location is the sea [55]. The defined RE is found several kilometres
from the coast where complete mixing of waste water and sea water has occurred. Therefore,
as previously detailed above the RE is defined as: sea water (Table 9)
Table 9: RE for WWTPs discharging to the sea
The chemical exergy of disinfectants in this research are calculated with the above
methodology. For example, a disinfectant such as sodium hydroxide is clearly not contained
within either RE detailed above; therefore the formation exergy component will be used
when calculating its chemical exergy.
RE - River Discharge Cl HCO3 K Mg Na SO4 Ca Fe SiO2 PO4 NH3 NO3
ppm 6.9 95 1.7 5.6 5.4 24 31.1 0.8 7.5 0.03 0.083 1.46
RE - Sea Discharge Cl HCO3 K Mg Na SO4 Ca
ppm 19,345 145 390 1,295 10,752 2,701 416

29
In the context of this work, only one input component to WWTP plant A was calculated
using an RE scenario (Table 9) as detailed above. This is due to the organic nature of the
WWTP process inputs and outputs.
2.9.3 Organic matter calculation methodology
Tai et al. [48] established a relationship between the standard chemical exergy of a 138
organic compounds and the organic matter parameter TOD and TOC, as indicated below by
Eqs. (6) and (7):
bch (J/l) = 13.6 (kJ/g) x TOD (mg/l) (6)
bch (J/l) = 45 (kJ/g) x TOC (mg/l) (7)
Tai stated that it is very difficult to identify and determine every organic compound found in
waste water. Therefore, he selected a reference substance to calculate the chemical exergies
of the atmospheric gases, allocating zero exergy to several stable chemical compounds. He
then conveniently expressed a generic organic compound as CaHbOc [55] and plotted
theoretical TOC and TOD against chemical exergy to develop linear best fit equations to
obtain Eqs. (6) and (7).
As it is difficult to determine the composition of organics in waste water, certain practical
limitations exist when using the method proposed by Tai et al. to calculate the chemical
exergy of organic compounds. In order to tackle this issue, Martinez et al. [55] proposed that

30
the analyses may be divided into measurements of aggregate organic matter greater than 1.0
mg/l and trace concentrations ranging from 10–12
mg/l – 1.0 mg/l.
Tai stated that organic matter parameters BOD and COD could also be used as approximate
measures of effective energy, as TOD indirectly represented the magnitude of utilisable
energy from wastewater. However, alternative methods exist for the measurement of organic
matter parameters listed above. For example, potassium dichromate or potassium
permanganate can be used to chemical oxidise organic matter, thus allowing COD to be
quantified. Tai et al. [48] noted that the BOD and COD (permanganate) relationship with
TOD is not as strong as the COD (dichromate) and TOD relationship. Tai et al. used
theoretical values of TOD and TOC when developing Eqs. (6) and (7); therefore analysis
should be conducted on how closely theoretical values of organic matter parameters relate to
measured values for these substances.
A clear link exists between theoretical TOD and measured COD (dichromate), with an
equivalence ratio of 95% demonstrated by Moore et al. [60]. Hellström [51] suggested that
BOD is the most reliable indicator of available exergy within waste water because it
represents the amount of easily biodegradable organic matter. However, he did not
demonstrate how measured values of BOD relate to the chemical exergy of organic matter.
Martinez [50] demonstrated that using the COD and BOD parameters provided coherent
results when compared with TOC in calculating the chemical exergy of organic matter in
surface waters as opposed to waste waters.
Khosravi et al. [49] identified potential limitations with the Tai approach because typical
compounds found in WWTP were not included in the development of the correlations.

31
Khosravi et al. [49] proposed that theoretical TOD could be used to estimate the chemical
exergy of organic matter in waste water, as indicated below by Eq. (8):
bch (J/l) = 13.7 (kJ/g) -116 x COD (mg/l) (8)
Khosravi et al. carried out an exergy analysis of a WWTP in Qod, Iran. Khosravi et al. [49]
provides COD values for all organic matter inputs and outputs in their process exergy
analysis. (Note that these are not the same chemical exergy values determined by Tai,
however, the different approaches used to calculate the chemical exergy result in similar
values for the majority of the elements under consideration). Two different approaches have
been proposed, it is important to see how they differ in terms of calculating the chemical
exergy. In order to achieve this, the two approaches have been compared in Table 10.
The first column of Table 10 takes a random sample of COD input/output values from the
Khosravi et al. paper. The obtained COD value is multiplied by 13.6 (Eq. (6)) and then the
WWTP flow to obtain the exergy values in column 2. Column 3 details the exergy values of
organic matter obtained by Khosravi et al. using Eq.8 above and then multiplying it by the
flow. As you can see little difference exists between the two methods.
Table 10: Comparison of organic matter exergy values using COD and THOD organic
matter measurement parameters
COD value (mg/l) Tai COD Exergy
Method (GJ/Day)
Khosravi THOD Exergy
Method (GJ/Day)
% Difference
371.1 227.11 224.4 1.19
204.1 124.21 121.07 2.53
6800 23.12 23.35 - 0.99
260.7 158.76 155.3 2.18
As theoretical TOD signifies the quantity of oxygen required to oxidise a compound to its
final oxidation products, it represents an unrealistic and worst case scenario of oxygen
requirements. The actual oxygen demand of any organic compound is its biodegradability;

32
but as no clear link has been established with BOD and theoretical TOD, COD (dichromate)
will be used to estimate the chemical exergy of organic matter in waste water in this research.
The chemical exergy of sludge, return liquors and mixed liquor suspended solids in this
research will also be calculated by Eq. (8), indicated below:
bch (J/l) = 13.6 (kJ/g) x COD (mg/l) (8)
The numerous chemical exergy calculation models are detailed below in Table 11.
Table 11: Relevant/Specific Waste Water Chemical Exergy Equations
Relevant/Specific Waste Water Chemical Exergy Equations Source
e = n[uo - uo
o + R To lnc/co] [51, 55, 61, 62]
e = Σi [yi(∆Gf + Σnebch) + RToΣxi lnai/ao] [55]
e = Σi xi eich
+ RToΣxi lnai [62, 63]
Chemical Exergy of Organic Matter Equations
eo = 13.6 x TOD [55]
eo = 45 x TOC [55]
eo = 13.6 x COD [51, 62]
eo = 13.6 x BOD [51, 55]
eo = 13.7 x THOD - 116 [49]
Extensive further work may be needed to study and compare each of these approaches in
detail; however, this is beyond the scope of this research.

33
3 Exergy Calculation Methodologies
This chapter outlines the chemical exergy calculation methodology associated with the
exergy analysis of WWTPs in chapter 4. It provides guidance on how to calculate the
chemical exergy of process inputs and outputs from WWTP plant processes. As can be seen
in Figure 5, WWTPs have numerous waste streams containing differences in the
concentration of organic matter, sludge, nutrients and coagulants. Other typical inputs include
electricity usage from compressors, blowers and pumps within the plant.
I II
III
IV
V VI
Pi
CiBi
Pii
Piii
1 3
4
5
6
7 8
Main WWTP Components
I) Inlet works
II) Primary Clarifier
III) Aeration Tank
IV) Secondary Clarifier
V) Aeration Tank
VI) Secondary Clarifier
Main WWTP Streams
1) Raw Sewage
2) Clarified Waste Water
3) Biologically Treated Waste Water
4) Biologically Clarified Waste Water
5) Return Activated Sludge
6) R.A.S with Ferric Chloride
7) Biologically & Chemically Treated Waste Water
8) Treated Effluent
Energy Requirements
Pi Pii Piii Pumps
Ci Compressor
Bi Blowers
Subsystem 1
Subsystem 2
Subsystem 3
2
Figure 5: Example of typical process inputs & outputs associated with WWTP
operation

34
3.1 Wastewater Treatment Plant Selection
Three Irish WWTPs were selected for this research with exergy analyses conducted on all
three plants. The characteristics of the selected WWTPs are detailed in Table 12. Plant A has
a very large PE and discharges its final effluent to the sea. This is in contrast to plants B and
C, which are of a much smaller scale. Plants B and C utilise similar treatment technologies,
are of a similar scale and both plants discharge their final effluent to inland rivers. Plants B
and C enable comparative analysis to be conducted due to their similar characteristics and the
selection of plant A provides a valuable comparison to differences in discharges
requirements, PE etc.
Table 12: Plant Descriptions
Plant Design
Capacity
(PE)
Agglomeration
Served (PE)
Receiving
water body
type
Level of
treatment
Type of
secondary
treatment12
A 186,000 79,133 Seawater Secondary AS
B 12,000 12,284 Freshwater Secondary AS+P
C 12,000 9,036 Freshwater Secondary AS+P
3.2 Materials and methods
The data used in the study are a combination of measured, site-specific data, and data
obtained from the literature. The selection, deployment and gathering of WWTP data was
done by my colleagues on the EPA project Mr Thomas Phelan and Mr Niall Durham. Table
13 lists the site-specific data used in the study.
1 AS = Activated Sludge, +P = with phosphorus removal
35
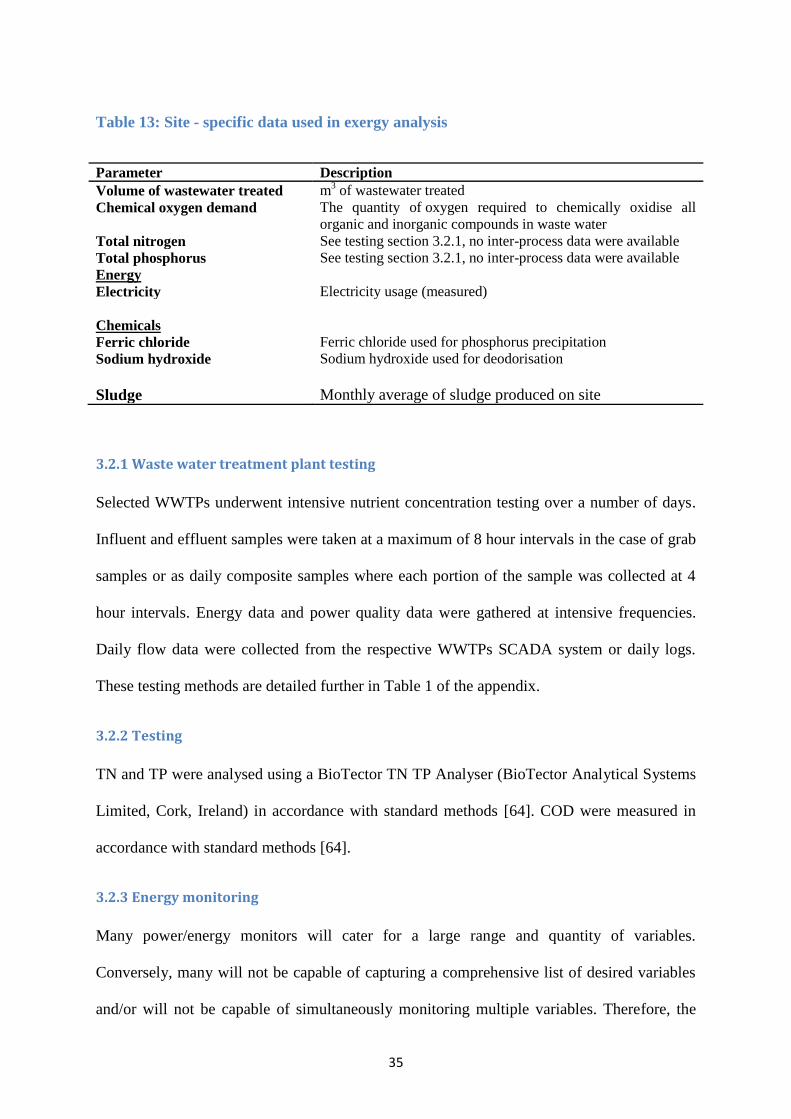
Table 13: Site - specific data used in exergy analysis
Parameter Description
Volume of wastewater treated m3 of wastewater treated
Chemical oxygen demand The quantity of oxygen required to chemically oxidise all
organic and inorganic compounds in waste water
Total nitrogen See testing section 3.2.1, no inter-process data were available
Total phosphorus See testing section 3.2.1, no inter-process data were available
Energy
Electricity Electricity usage (measured)
Chemicals
Ferric chloride Ferric chloride used for phosphorus precipitation
Sodium hydroxide Sodium hydroxide used for deodorisation
Sludge Monthly average of sludge produced on site
3.2.1 Waste water treatment plant testing
Selected WWTPs underwent intensive nutrient concentration testing over a number of days.
Influent and effluent samples were taken at a maximum of 8 hour intervals in the case of grab
samples or as daily composite samples where each portion of the sample was collected at 4
hour intervals. Energy data and power quality data were gathered at intensive frequencies.
Daily flow data were collected from the respective WWTPs SCADA system or daily logs.
These testing methods are detailed further in Table 1 of the appendix.
3.2.2 Testing
TN and TP were analysed using a BioTector TN TP Analyser (BioTector Analytical Systems
Limited, Cork, Ireland) in accordance with standard methods [64]. COD were measured in
accordance with standard methods [64].
3.2.3 Energy monitoring
Many power/energy monitors will cater for a large range and quantity of variables.
Conversely, many will not be capable of capturing a comprehensive list of desired variables
and/or will not be capable of simultaneously monitoring multiple variables. Therefore, the

36
specifications of the monitoring equipment play a big role in the scope of an energy audit.
Table 14 shows the variables monitored in this study. The first column lists the basic criteria,
wherever possible these variables were recorded. The additional variables allowed for a more
detailed diagnosis of plant machinery or power characteristics.
Table 14: List of electrical variables recorded in this study including basic variables and
additional desirable variables
Basic Variables Additional Variables
Voltage Current Harmonic Distortions (A)
Current Voltage Harmonic Distortions (A)
Active Power Frequency (Hz)
Apparent Power Unbalance (%)
Reactive Power Dips and Swells
Power Factor Energy Losses (kWh)
Phase angle -----
Harmonic Distortion -----
Neutral Current -----
This detailed diagnosis was performed using the Fluke 435 Series II power quality analyser
(PQA), which is a high-specification energy analyser. The PQA was supplemented with three
Amprobe PQ 55A energy analysers. These devices are mid-range cost and specification and
were capable of recording all basic variables. Finally, smaller plant equipment was metered
using eight Iso-Tech IPM2005 meters. Although these meters were capable of monitoring all
basic variables, this could not be done simultaneously. Table 15 outlines in more detail the
basic specifications of each metering device.
Table 15: Basic specifications for power/energy monitors utilised in plant audits
Monitor Power Capability Logger Sampling
Freq. (Hz)
Harmonics
(up to) Coms
Fluke 453
Series II Mains Single and 3 phase
SD Card (8
GB) 1.3e
-4 – 4 50th USB
Amprobe PQ
55A Mains Single and 3 phase 20000 records 8.0e
-3 – 0.2 31st RS-232
Iso-Tech IPM
2005
Batter
y
Single and balanced 3
phase 8000 records 1.6e
-3 – 1 n/a
USB
optical

37
3.3 Exergy analysis methodology
The basic exergy calculation methodology is detailed below:
• Quantify the exergy content of process streams, and importantly, waste streams
• Calculate exergy destruction across plant processes
• Determine a hierarchy of inefficient processes
• Identify opportunities to recoup and make use of potential energy sources.
By analyzing the exergy destroyed in each process in a WWTP, the focus area to improve
overall system efficiency can be identified. Therefore, it can be used to compare components
or systems to help make informed design decisions.
The chemical composition of waste water can be broken down into two separate components:
Organic matter containing hairs, food, paper fibres, plant material, humus etc
Inorganic matter containing nutrients, metals, gases etc.
Therefore, the calculation of the chemical exergy of WWTP process inputs and outputs can
be broken down into two distinct calculation methodologies:
1) The calculation of the chemical exergy of organic matter including raw sewage, waste
water, mixed liquor suspended solids, return liquors, return activated sludge and
sludge.
2) The calculation of the chemical exergy of inorganic matter including nutrients, metals
and coagulants.

38
Now consider a practical example from the exergy analysis of plant A. Table 16 details the
process inputs & outputs across the pre-treatment works in plant A. Table 16 is displayed
again on page 44 as Table 19 with the additional treatment processes for plant A.
Table 16: Process inputs & outputs across the pre-treatment works in plant A
3.3.1 Organic matter exergy calculation methodology
The chemical exergy of organic matter is calculated using Eq. (8) below:
bch (J/l) = 13.6 (kJ/g) x COD (mg/l) (8)
Multiply the COD value (mg/l) of the constituent by the coefficient of 13.6 (kJ/g) and
divide by a 1000 to obtain the value in kJ/l.
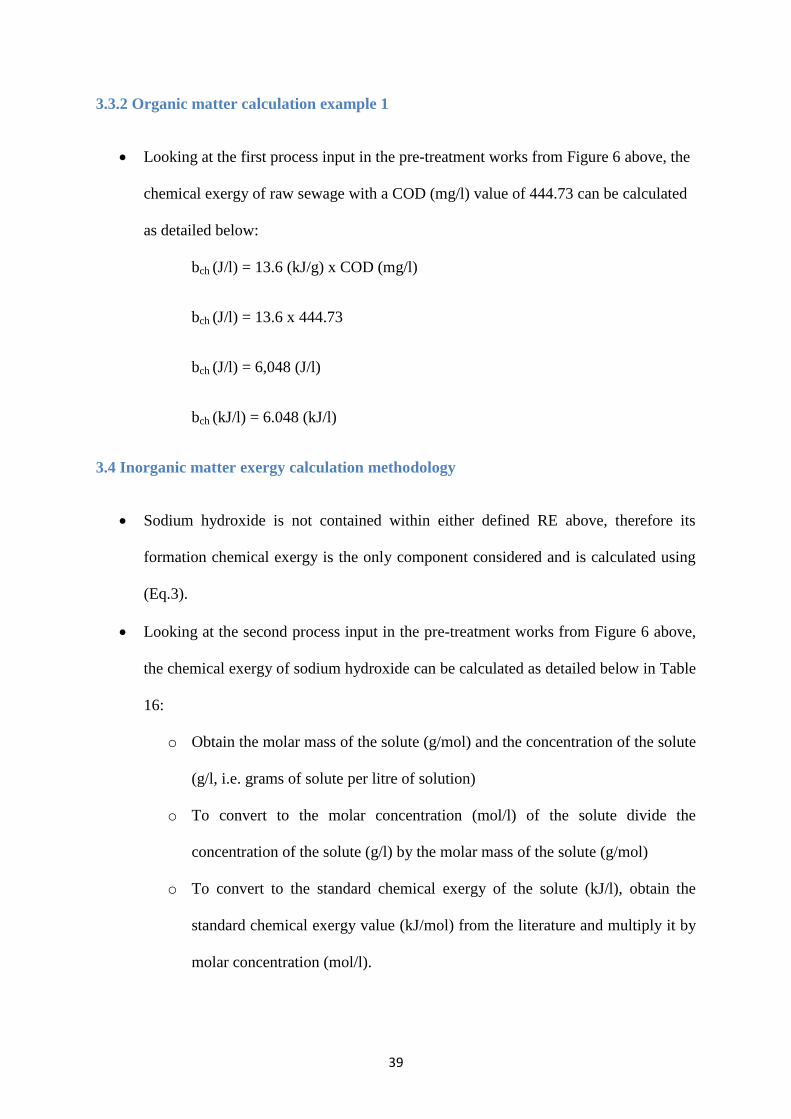
39
3.3.2 Organic matter calculation example 1
Looking at the first process input in the pre-treatment works from Figure 6 above, the
chemical exergy of raw sewage with a COD (mg/l) value of 444.73 can be calculated
as detailed below:
bch (J/l) = 13.6 (kJ/g) x COD (mg/l)
bch (J/l) = 13.6 x 444.73
bch (J/l) = 6,048 (J/l)
bch (kJ/l) = 6.048 (kJ/l)
3.4 Inorganic matter exergy calculation methodology
Sodium hydroxide is not contained within either defined RE above, therefore its
formation chemical exergy is the only component considered and is calculated using
(Eq.3).
Looking at the second process input in the pre-treatment works from Figure 6 above,
the chemical exergy of sodium hydroxide can be calculated as detailed below in Table
16:
o Obtain the molar mass of the solute (g/mol) and the concentration of the solute
(g/l, i.e. grams of solute per litre of solution)
o To convert to the molar concentration (mol/l) of the solute divide the
concentration of the solute (g/l) by the molar mass of the solute (g/mol)
o To convert to the standard chemical exergy of the solute (kJ/l), obtain the
standard chemical exergy value (kJ/mol) from the literature and multiply it by
molar concentration (mol/l).
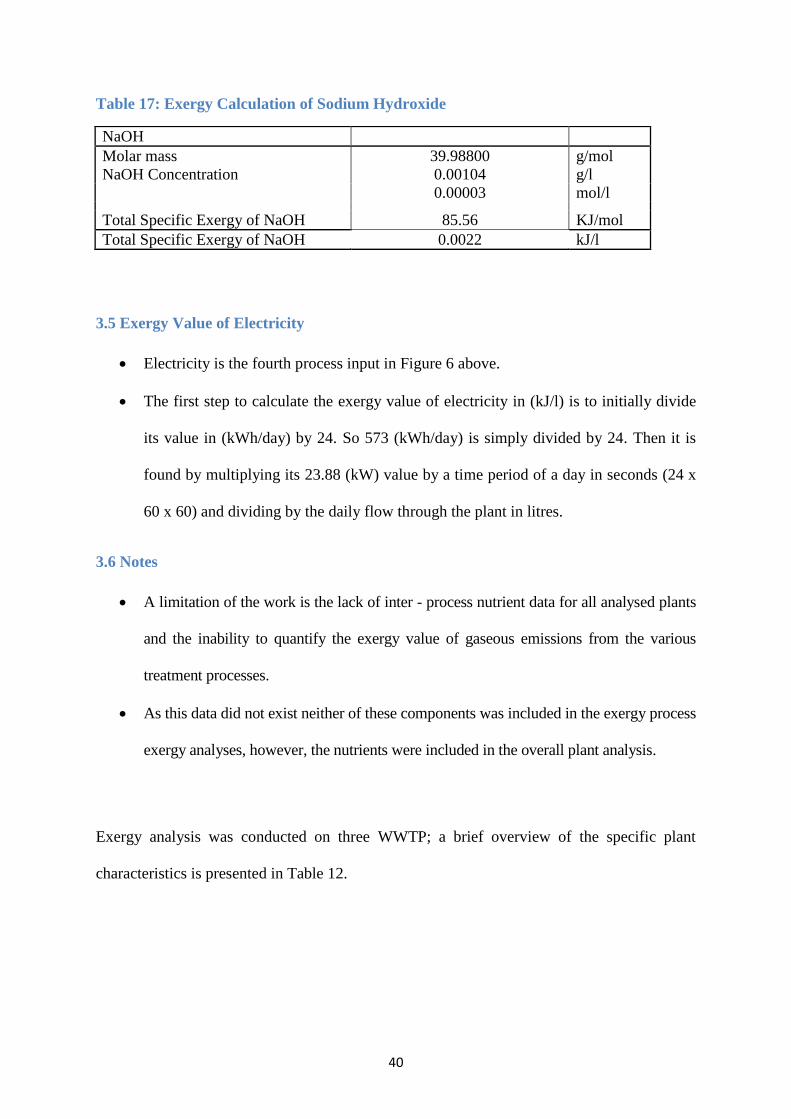
40
Table 17: Exergy Calculation of Sodium Hydroxide
3.5 Exergy Value of Electricity
Electricity is the fourth process input in Figure 6 above.
The first step to calculate the exergy value of electricity in (kJ/l) is to initially divide
its value in (kWh/day) by 24. So 573 (kWh/day) is simply divided by 24. Then it is
found by multiplying its 23.88 (kW) value by a time period of a day in seconds (24 x
60 x 60) and dividing by the daily flow through the plant in litres.
3.6 Notes
A limitation of the work is the lack of inter - process nutrient data for all analysed plants
and the inability to quantify the exergy value of gaseous emissions from the various
treatment processes.
As this data did not exist neither of these components was included in the exergy process
exergy analyses, however, the nutrients were included in the overall plant analysis.
Exergy analysis was conducted on three WWTP; a brief overview of the specific plant
characteristics is presented in Table 12.
NaOH
Molar mass 39.98800 g/mol NaOH Concentration 0.00104 g/l 0.00003 mol/l Total Specific Exergy of NaOH 85.56 KJ/mol
Total Specific Exergy of NaOH 0.0022 kJ/l
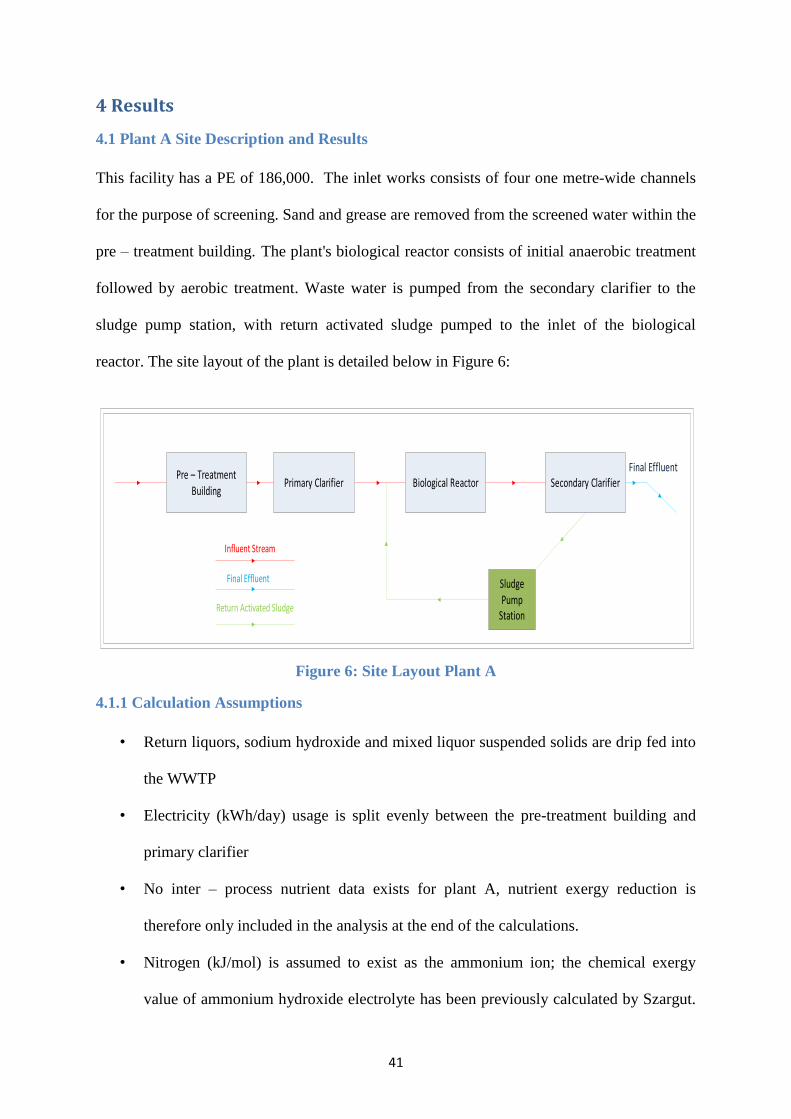
41
4 Results
4.1 Plant A Site Description and Results
This facility has a PE of 186,000. The inlet works consists of four one metre-wide channels
for the purpose of screening. Sand and grease are removed from the screened water within the
pre – treatment building. The plant's biological reactor consists of initial anaerobic treatment
followed by aerobic treatment. Waste water is pumped from the secondary clarifier to the
sludge pump station, with return activated sludge pumped to the inlet of the biological
reactor. The site layout of the plant is detailed below in Figure 6:
Pre – TreatmentBuilding
Primary Clarifier Biological Reactor Secondary Clarifier
Sludge Pump
Station
Final Effluent
Influent Stream
Return Activated Sludge
Final Effluent
Figure 6: Site Layout Plant A
4.1.1 Calculation Assumptions
• Return liquors, sodium hydroxide and mixed liquor suspended solids are drip fed into
the WWTP
• Electricity (kWh/day) usage is split evenly between the pre-treatment building and
primary clarifier
• No inter – process nutrient data exists for plant A, nutrient exergy reduction is
therefore only included in the analysis at the end of the calculations.
• Nitrogen (kJ/mol) is assumed to exist as the ammonium ion; the chemical exergy
value of ammonium hydroxide electrolyte has been previously calculated by Szargut.

42
This value obtained from Szargut (kJ/mol) is multiplied by the concentration of the
component in (mol/l), this provides the exergy value in kJ/l.
Table 18 below provides a breakdown of the measured data across each of the processes
recorded from the plant A. The table is included for the readers’ ease of reference when
looking for specific values from plant A.
Table 18: Summary of Plant A's Process inputs and outputs
Note:
• The return activated sludge calculation in the aeration basin was determined by
summating the daily return liquors value (mg/l) taken at the plant and divides it by the
total days in the month. Samples were randomly taken ten days for the month, it is
unclear from the data whether return liquors are sent to the inlet of the aeration basin
daily or just on the days of sampling.
• The mg/l concentration of the return liquors samples varies from 2000 mg/l to 500
mg/l over the course of the month, suggesting that the return liquors concentration is
Process stage Flow type Flow (m3/day) COD (mg/l) TN (mg/l) TP (mg/l)Energy
(kWh/day)
Chemical
exergy (kJ/l)Work (kJ/l) Total exergy (kJ/l)
Pre-treament (in) Wastewater 27,270 444.73 32.75 - 573 6.05 1.82 13.54
Return Liquors 417.2 5.67
Pre-treatment (out) Wastewater 273.47 3.72 3.72
Primary Clarifier (in) Wastewater 273.47 573 3.72 1.82 5.54
Primary Clarifier (out) Wastewater 153.5 2.09 3.47
Sludge 101.25 1.38
Aeration basin (in) Wastewater 153.5 1306 2.09 4.14 9.35
Return Liquors 229.47 3.12
Aeration basin (out) Mixed Liquors 328.3 4.46 4.56
Wastewater 7.61 0.10
Secondary clarifier (in) Mixed Liquors 328.3 4.46 4.56
Wastewater 7.61 0.10
Secondary clarifier (out) Final Effluent 25,720 34.03 25.91 - 0.46 0.46
Wastewater 39.28 0.53 0.53
43
carefully analysed to maintain the balance of microorganisms within the aeration
basin.
Tables 19 – 22 detail the exergy values of the process inputs & outputs across each of the
treatment processes in plant A and the overall exergy destruction across the process. Table 19
is also displayed as an example on page 38 as Table 16.

44
Table 19: Plant A – Pre Treatment Works
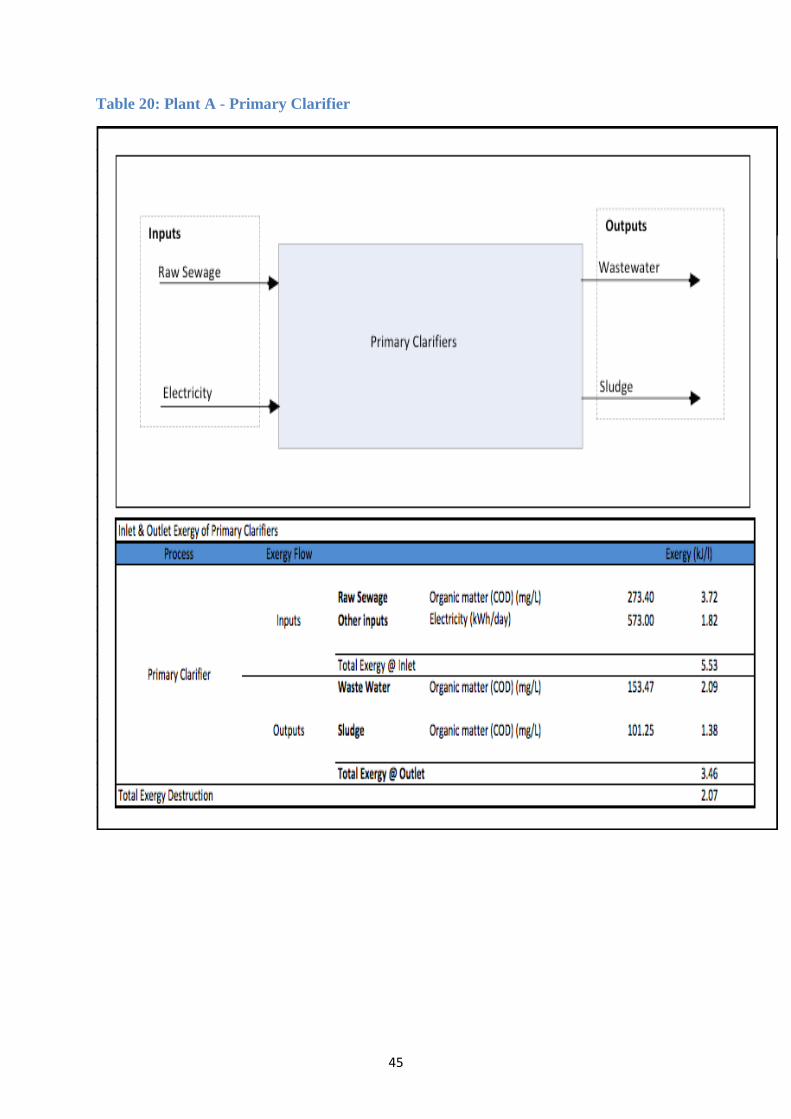
45
Table 20: Plant A - Primary Clarifier

46
Table 21: Plant A - Aeration Basin

47
Table 22: Plant A - Secondary Clarifier
Inlet&OutletExergyofSecondaryClarifiers
Exergy(kJ/l)
MLSS MixedLiquorSuspendedSolids(mg/l) 328.30
WasteWater Organicmatter(COD)(mg/L) 7.61
TotalExergy@Inlet
FinalEffluent Organicmatter(COD)(mg/L) 34.03
WasteWatertoSPS Organicmatter(COD)(mg/L) 39.28
TotalExergy@Outlet
TotalExergyDestruction
OverallExergyPlantDestruction
OverallExergyPlantDestructionincludingnutrientreductionacrosstheplant 20.33
20.24
0.46
0.53
1.00
Process ExergyFlow
0.10
4.57
3.57
SecondaryClarifier
Inputs
4.46
Outputs
FinalEffluent
SecondaryClarifier
Wastewater
Inputs Outputs
Wastewater
MLSS

48
4.2 Plant B Site Description and Results
Plant B has a max design PE of 12,000 but is licensed by the Irish EPA to cater for a PE of
only 9,683. This WWTP comprises of screening, grit removal, three aeration tanks (diffused
aeration system), two clarifiers, phosphorus removal, sludge thickening and sludge
dewatering. Storm water storage tanks and a picket fence thickener are also included as part
of the waste water works. The WWTP discharges to an inland river. The site layout of the
plant is detailed below in Figure 7:
ClarifierNo.1
ClarifierNo.2
Aeration Basin Aeration Basin
Chemical Dosing
Building
River Influent Stream
Return Activated Sludge
Final Effluent
Chemical Dosing
Inlet Works
Process Flow
Stormwater Tanks
Anoxic tank with F.S.C
F.S.C
Picket Fence ThickenerS.P.S
Sludge Dewatering Building
Outfall Pumping Station
F.S.C = Flow Splitting Chamber
S.P.S = Sludge Pumping Station
Figure 7: Site Layout Plant B

49
4.2.1 Calculation Assumptions
A 13.57% reduction in organic matter across the pre – treatment works was assumed.
This figure was obtained from organic matter reductions in eight different waste water
treatment plants [65].
As no inter – process nutrient data exists for plant B, nutrient exergy reduction is
therefore only included in analysis at the end of the calculations.
No inter – process sludge existed for plant B. The sludge output calculation in the
secondary clarifier was determined by dividing the daily average of sludge out of the
plant (kg/day) by the daily average of flow through the plant in m3/day.
The chemical exergy of nutrients (kJ/mol) has been previously calculated by Szargut.
This value obtained from Szargut (kJ/mol) is multiplied by the concentration of the
component in (mol/l). Resulting in an exergy value in kJ/l.
No return activated sludge line to the inlet of the aeration basin was present on the site
layout plans was there any mention of return activated sludge on the discharge licence
application for the plant to the Environmental Protection Agency. It was quite
possible that activated sludge is returned to the inlet of the aeration basin but the
figure was not included in analysis for these reasons. Also, this data was not available
when the analysis was performed. Hence return activated sludge is excluded from the
analysis.
Table 23 below provides a breakdown of the measured data across each of the processes
recorded from the plant B. The table is included for the readers’ ease of reference when
looking for specific values from plant B.
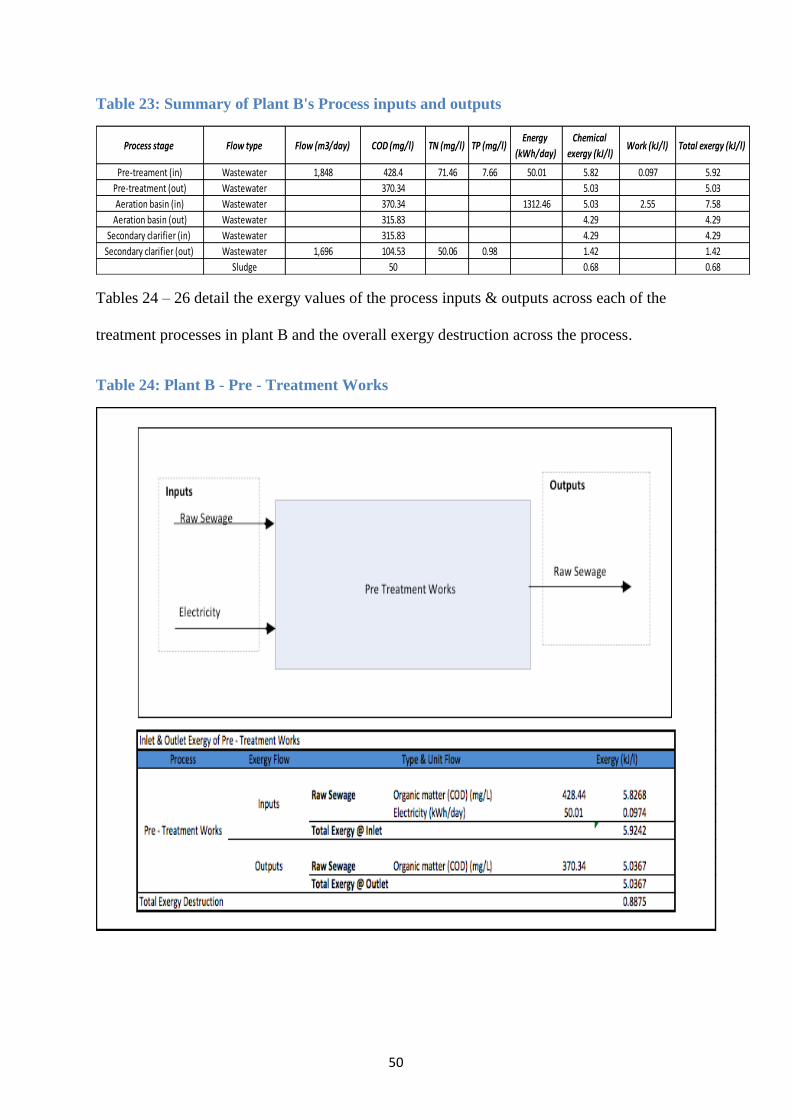
50
Table 23: Summary of Plant B's Process inputs and outputs
Tables 24 – 26 detail the exergy values of the process inputs & outputs across each of the
treatment processes in plant B and the overall exergy destruction across the process.
Table 24: Plant B - Pre - Treatment Works
Process stage Flow type Flow (m3/day) COD (mg/l) TN (mg/l) TP (mg/l)Energy
(kWh/day)
Chemical
exergy (kJ/l)Work (kJ/l) Total exergy (kJ/l)
Pre-treament (in) Wastewater 1,848 428.4 71.46 7.66 50.01 5.82 0.097 5.92
Pre-treatment (out) Wastewater 370.34 5.03 5.03
Aeration basin (in) Wastewater 370.34 1312.46 5.03 2.55 7.58
Aeration basin (out) Wastewater 315.83 4.29 4.29
Secondary clarifier (in) Wastewater 315.83 4.29 4.29
Secondary clarifier (out) Wastewater 1,696 104.53 50.06 0.98 1.42 1.42
Sludge 50 0.68 0.68

51
Table 25: Plant B - Aeration Basin
Inlet & Outlet Exergy of Aeration Basin
Exergy (kJ/l)
Waste Water Organic matter (COD) (mg/L) 370.34
Other inputs Electricity (kWh/day) 1,312.46
Total Exergy @ Inlet
Waste Water Organic matter (COD) (mg/L) 315.83
Total Exergy @ Outlet
Total Exergy Destruction
5.0367
4.2953
4.2953
Process Exergy Flow Type & Unit Flow
Aeration Basin
Inputs
Outputs
3.2981
2.5567
7.5934
Waste Water
Electricity
Aeration BasinWaste Water
Inputs Outputs

52
Table 26: Plant B - Secondary Clarifier
Inlet & Outlet Exergy of Secondary Clarifiers
Exergy (kJ/l)
Waste Water Organic matter (COD) (mg/L) 315.83
Total Exergy @ Inlet
Final Effluent Organic matter (COD) (mg/L) 104.53
Sludge (mg/l) 50.00
Total Exergy @ Outlet
Total Exergy Destruction
Overall Exergy Plant Destruction
Overall Exergy Plant Destruction including nutrient reduction across the plant 6.7265
0.6800
2.1937
6.3793
4.2953
Outputs1.4216
2.1016
Process Exergy Flow
Secondary Clarifier
Inputs4.2953
Waste Water
Secondary Clarifier
Inputs Outputs
Waste Water
Sludge

53
4.3 Plant C Site Description and Results
This facility has a PE of 12,000 with a reserve capacity of 4,000 PE. The inlet works
comprises mechanical and manual screens together with a compaction unit, overflow unit and
grit traps.
The influent is then passed to the anaerobic tanks where it is mixed with RAS. The effluent
from each anaerobic tank is spilt between the two aeration basins. The secondary treatment
process is a single stage anoxic zone extended aeration process followed by clarification. The
clarified effluent is discharged to an inland river. This is the primary discharge point. The site
layout of the plant is detailed below in Figure 8:
ClarifierTank
Storm
Tank
Aeration Basin
Air Blower House
Inlet Works
Chemical Dosing Plant
Sludge Building
P.F.T = Picket Fence Thickener
Aeration Basin
Storm
Tank
ClarifierTank
ClarifierTank
ClarifierTank
P.F.T P.F.T
P.F.T P.F.T
Influent Stream
Return Activated Sludge
Final Effluent
Anoxic Zone
Anoxic Zone
Figure 8: Site Layout Plant C

54
4.3.1 Calculation Assumptions
• A 13.57% reduction in organic matter across the pre – treatment works was assumed.
This figure was obtained from organic matter reductions in eight different waste water
treatment plants [64].
• As an intermittent process sample for organic matter was not taken for plant C
WWTP, the reduction in organic matter across plant B was used as a reference as both
plants are of similar scale and similar treatment processes in place.
• As no inter – process nutrient data exists for plant C, nutrient exergy reduction is
therefore only included in analysis at the end of the calculations.
• No inter – process sludge existed for plant B. The sludge output calculation in the
secondary was determined dividing the daily average of sludge out of the plant
(kg/day) by the daily average of flow through the plant in m3/day.
• The chemical exergy of nutrients (kJ/mol) has been previously calculated by Szargut.
This value obtained from Szargut (kJ/mol) is multiplied by the concentration of the
component in (mol/l), resulting in an exergy value in kJ/l.
• No return activated sludge line to the inlet of the aeration basin was present on the site
layout plans. It was quite possible that activated sludge is returned to the inlet of the
aeration basin but the figure was not included in analysis for this reason. Also, this
data was not available when the analysis was performed. Hence return activated
sludge is excluded from the analysis.
Table 27 below provides a breakdown of the measured data across each of the processes
recorded from the plant C. The table is included for the readers’ ease of reference when
looking for specific values from plant C.

55
Table 27: Summary of Plant C's Process inputs and outputs
Tables 28 – 30 detail the exergy values of the process inputs & outputs across each of the
treatment processes in plant C and the overall exergy destruction across the process.
Table 28: Plant C – Pre Treatment works
Process stage Flow type Flow (m3/day) COD (mg/l) TN (mg/l) TP (mg/l)Energy
(kWh/day)
Chemical
exergy (kJ/l)Work (kJ/l) Total exergy (kJ/l)
Pre-treament (in) Wastewater 1,980 245.33 29.8 3.8 41.82 3.33 0.08 3.41
Pre-treatment (out) Wastewater 212.1 2.88 2.88
Aeration basin (in) Wastewater 212.1 395.56 2.88 0.77 3.65
Aeration basin (out) Wastewater 180.9 2.46 2.46
Secondary clarifier (in) Wastewater 180.9 2.46 2.46
Secondary clarifier (out) Wastewater 1,944 64.89 17 0.9 0.88 0.88
Sludge 30 0.40 0.40

56
Table 29: Plant C - Aeration Basin
Inlet & Outlet Exergy of Aeration Basin
Exergy (kJ/l)
Waste Water Organic matter (COD) (mg/L) 212.06
Other inputs Electricity (kWh/day) 395.56
Total Exergy @ Inlet
Waste Water Organic matter (COD) (mg/L) 180.89
Total Exergy @ Outlet
Total Exergy Destruction
2.4601
1.1945
Process Exergy Flow Type & Unit Flow
Aeration Basin
Inputs2.8840
0.7706
3.6546
Outputs 2.4601
Waste Water
Electricity
Aeration BasinWaste Water
Inputs Outputs

57
Table 30: Plant C - Secondary Clarifier
Inlet & Outlet Exergy of Secondary Clarifiers
Exergy (kJ/l)
Waste Water Organic matter (COD) (mg/L) 180.89
Total Exergy @ Inlet
Final Effluent Organic matter (COD) (mg/L) 64.89
Sludge (mg/l) 30.00
Total Exergy @ Outlet
Total Exergy Destruction
Overall Exergy Plant Destruction
Overall Exergy Plant Destruction including nutrient reduction across the plant 3.1040
2.8980
0.8825
0.4080
1.2905
1.1696
Secondary Clarifier
Inputs2.4601
2.4601
Outputs
Process Exergy Flow
Waste Water
Secondary Clarifier
Inputs Outputs
Waste Water
Sludge

58
5 Discussion
Table 31 below provides a breakdown of results of all three analysed plants. Exergy
destruction is compared across all plants and exergy destruction including nutrient exergy
destruction is also detailed. Exergy losses meaning the lost opportunity do with work with
WWTP process outputs is also detailed for all analysed plants.
Table 31: Exergy Analysis Results Comparison
Process
Exergy kJ/l
Plant A Plant B Plant C
Pretreatment
Exergy In 13.5 5.9 3.4
Exergy out 3.7 5.0 2.9
Exergy destruction 9.8 0.9 0.5
Exergy Loss 0 5.0 2.9
Primary Clarifier n/a n/a
Exergy In 5.5
Exergy out 3.5
Exergy destruction 2.1
Exergy Loss 0
Aeration
Exergy In 9.4 7.6 3.7
Exergy out 4.6 4.3 2.5
Exergy destruction 4.9 3.3 1.2
Exergy Loss 3.9 0 0
Secondary clarifier
Exergy In 4.6 4.3 2.5
Exergy out 1 2.1 1.3
Exergy destruction 3.6 2.2 1.2
Exergy Loss 0.4 1.6 0.7
Overall plant exergy destruction 20.2 6.4 2.9
Overall Exergy Loss 4.3 6.6 3.6

59
5.1 Overall Plant Exergy Destruction Comparison
Figure 9 provides a breakdown of the cumulative exergy destruction across all
treatment processes in Plants A, B and C.
Figure 9: Exergy Destruction across analysed plants
The influent COD loading rate in Plant A is quite similar to that of Plant B and almost
double that of Plant C. The main discrepancy between exergy destruction between
Plant A and Plants B & C is that Plant A utilises return liquors in the pre-treatment
works. These return liquors COD loading rates are double that of the influent load in
Plant C and quite similar to the initial load in Plant B.
Plants B and C have similar PEs and plant configurations. The discrepancy between
exergy destruction (kJ/l) across both plants can to a certain extent be related to the
influent COD loading rates. The organic composition of the influent load in Plant B
was almost twice that of Plant C during the sample period thus Plant B has greater
oxygen requirements in its aeration basin to maintain DO concentration levels.

60
Therefore, a larger quantity of electricity will be used in Plant B, resulting in larger
exergy destruction rates across the plant.
5.2 Plant A exergy destruction and exergy loss discussion
Figure 10: Exergy Destruction breakdown for Plant A
The pre-treatment works account for 48% of the exergy destruction across the whole
WWTP. This is due to the excess activated sludge that is refed to the inlet works from
the activated sludge system. These return liquors have very high organic loading rates,
quite similar to the influent COD loading rates received by the plant.
Uncertainty exists regarding the exergy destruction rate across the aeration basin in
Plant A as organic matter samples were randomly taken ten days for the analysed
month, it is unclear from the data whether return liquors are sent to the inlet of the
aeration basin daily or just on the days of sampling. If the return liquors are returned
daily to the inlet of the aeration basin the magnitude of exergy destruction across the
aeration could potentially increase by approximately a factor of 3.
As the return liquors are refed into the pre – treatment works for further processing,
70% of the thickener return liquors will be utilised in conjunction with the primary
sludge to produce energy in the anaerobic digestion system. It was not possible to
61
quantify the work potential of this process stream but the electricity produced from
this process is utilised within the aeration basin, resulting in minimal exergy
destruction across the aeration basin.
The aeration basin is normally the chief energy consumer within the majority of
WWTPs, as is the case with Plants B and C. Plant A employs anaerobic digestion
while Plant B and C utilise a combination of anoxic and aerobic zones to treat
activated sludge. This anaerobic digestion system produces almost 40% of the
electricity requirements for plant. Allied to this, Plant A discharges its final effluent to
the sea therefore it has the least stringent discharge limitations. Less energy is
therefore required to purify the waste water to the required standards.
The secondary clarifier has the second highest exergy destruction with 28%; the
chemical exergy lost in the destruction of the Mixed Liquor Suspended Solids
(MLSS) is the chief source of exergy destruction.
Khosravi [49] noted similar losses across the secondary clarifier and minimal losses
across the aeration basin were also noted.
To minimise this exergy loss across the secondary clarifier in Plant A, the MLSS
should be diverted to the thickening/digesting systems for further processing directly
from the aeration basin and then utilised within the anaerobic digestion system to
produce energy. A source of exergy loss from the output of the secondary clarifier is
the nitrogen in the sludge that could be utilised as fertiliser.

62
5.3 Plant B & C exergy destruction and exergy loss discussion
Figure 11: Exergy Destruction breakdown for Plants B & C
Although significant differences exist in terms of exergy destruction magnitude,
Plants B and C are similar regarding the order of their process exergy destruction; the
hierarchy of exergy destruction being the aeration basin, the secondary clarifier and
the pre-treatment works
In contrast to Plant A, the pre-treatment works account for only 16% of the exergy
destruction across the whole WWTP on average between plants B and C. This is
interesting as Plants B and C have a very similar PE and both discharge to inland
rivers. A source of exergy loss from the output of the pre-treatment works from both
Plants B and C is the pre-treated sewage which may have the correct volatile fatty
acid mix to be utilised in an anaerobic digestion system.
The aeration basin has the highest exergy destruction with 46% on average between
Plants B and C. The exergy value of electricity comprises a far greater proportion of
total exergy destruction across both Plants B and C than in plant A.
The exergy value of electricity in Plant B comprises 78% of total exergy destruction
across the entire process and 40% of total exergy destruction across the entire plant.
Pre-Treatment
14%
Aeration Basin 52%
Secondary Clarifier
34%
Plant B Pre-
Treatment 18%
Aeration Basin 41%
Secondary Clarifier
41%
Plant C
63
This exergy destruction is unavoidable due to the influent loading in plant B forcing
all blowers in the aeration basin to operate during peak hours to meet oxygen
requirements within the basin.
One potential explanation may be due to the primary treatment. The pre-treatment
works and primary clarification in Plant A reduces the organic loading substantially
prior to the aeration basin thus reducing the subsequent blower work input required.
This is not the case for Plants A and B, where there is no primary clarification and
consequently the aeration basins receive higher organic loads.
Similar to Plant A the secondary clarifier has the second highest exergy destruction
with 37% on average between Plants B and C.
Therefore, when optimising Plants B and C the aeration basin followed by the
secondary clarifier should be the focus of optimisation improvements.
The waste sludge from this process could be utilised for composting if thermal drying
process was implemented in both Plants B and C. Another source of exergy loss from
the output of the secondary clarifier is the nutrients in the sludge that could be utilised
as fertiliser from both Plants B and C.
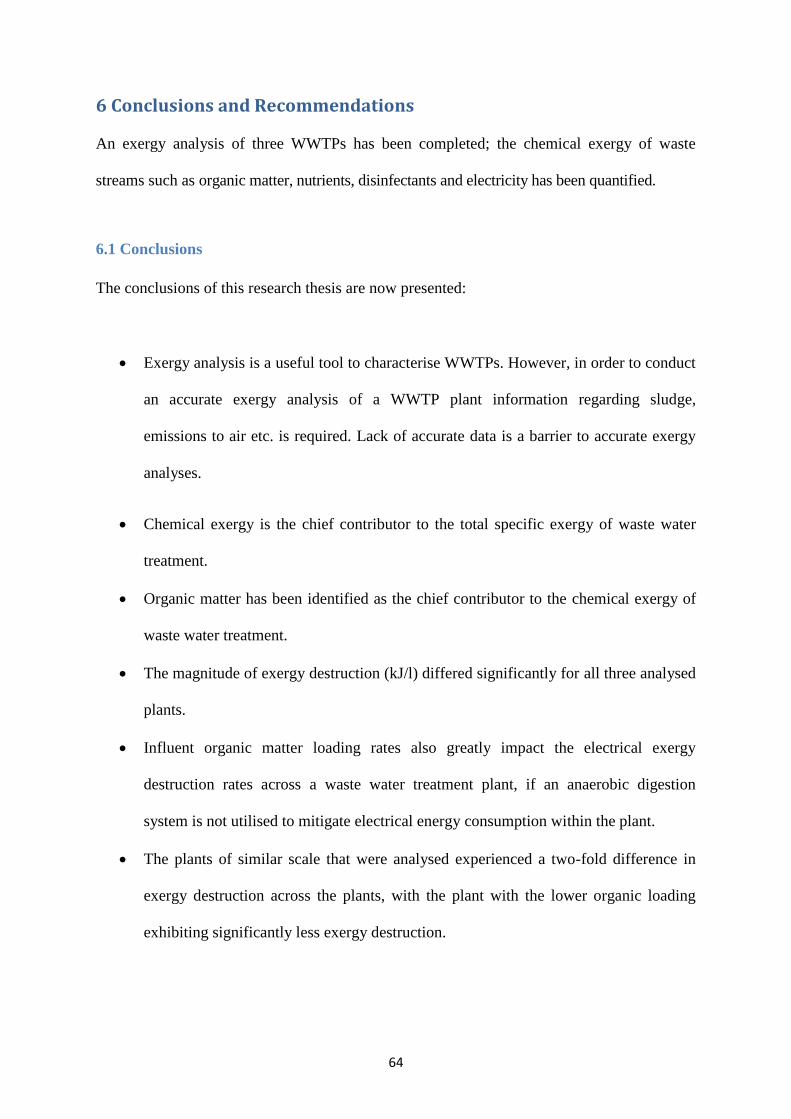
64
6 Conclusions and Recommendations
An exergy analysis of three WWTPs has been completed; the chemical exergy of waste
streams such as organic matter, nutrients, disinfectants and electricity has been quantified.
6.1 Conclusions
The conclusions of this research thesis are now presented:
Exergy analysis is a useful tool to characterise WWTPs. However, in order to conduct
an accurate exergy analysis of a WWTP plant information regarding sludge,
emissions to air etc. is required. Lack of accurate data is a barrier to accurate exergy
analyses.
Chemical exergy is the chief contributor to the total specific exergy of waste water
treatment.
Organic matter has been identified as the chief contributor to the chemical exergy of
waste water treatment.
The magnitude of exergy destruction (kJ/l) differed significantly for all three analysed
plants.
Influent organic matter loading rates also greatly impact the electrical exergy
destruction rates across a waste water treatment plant, if an anaerobic digestion
system is not utilised to mitigate electrical energy consumption within the plant.
The plants of similar scale that were analysed experienced a two-fold difference in
exergy destruction across the plants, with the plant with the lower organic loading
exhibiting significantly less exergy destruction.

65
The pre – treatment works had the lowest exegry destruction across the plants of
similar scale that were analysed and the aeration basin had the highest exergy
destrcution rate across both analysed plants.
The exergy destruction rate of the large scale plant was quite large in comparison to
the plants of smaller scale. A large proportion of the exergy destruction in the larger
scale plant is attributed to the pre – treatment works, this process is quite efficient
removing 39% of the organic load. This efficiency comes at a cost, with large exergy
destruction therefore associated with this process.
6.2 Research Limitations
A limitation of the work is the lack of inter - process nutrient data for all analysed plants
and the inability to quantify the exergy value of gaseous emissions from the various
treatment processes.
Lack of available return activated sludge data is a limitation of this work.
Lack of available sludge data concentrations and flow rates is also a limitation of this
work.
Subject to a better suite of data becoming available an additional assessment could be
carried out.
66
6.3 Recommendations for further research
Further work is needed to identify the most relevant/specific waste water chemical exergy
model, which is not within the scope of this research project.
Further work could also consider a comprehensive analysis of all identifiable WWTP inputs
and outputs. Analysis and quantification of plant inputs such as metals, gases, sulphur,
chloride, alkalinity etc. would provide extremely accurate characterisation of a WWTP from
an exergy analysis perspective.
Further work could characterise WWTP processes from an economic perspective. For
example, exergy destruction across the aeration basin in plant A was insignificant in this
research. However, it is widely known the aeration basin is the chief energy consumer in
WWTPs, thus this process may require consideration from an economic perspective.

67
References
[1] United States EPA, Wastewater management fact sheet [Online].
http://www.p2pays.org/energy/WastePlant.pdf [accessed: September 2013]
[2] M. Moran and H. Shapiro, Fundamentals of Engineering Thermodynamics , vol. 5, John
Wiley & Sons Ltd, U.K., Ed. 2006, pp. 273.
[3] L. Wang, Y. Yang and G. Tsatsanonis, "Advanced Thermodynamic Analysis and
Evaluation of a Supercritical Power Plant," vol. 5, pp. 1850 – 1863, 2012.
[4] G. Tsatsanonis, "Thermeconomic analysis and optimization of energy systems,” Program
energy combustion science," vol. 19, pp. 227- 257, 1993.
[5] J. Szargut, D. R. Morris and F. R. Steward, "Exergy analysis of thermal, chemical and
metallurgical processes," New York: Hemisphere, 1988.
[6] European Commission. (2013), Council directive 91/271/EEC of 21 May 1991
concerning urban waste-water treatment . January 2014.
[7] "Water services investment programme 2010 - 2012," Irish Department for Environment,
Heritage and Local Government, environ.ie, 2010.
[8] EPA calls for the elimination of raw sewage entering the environment and improvement
in the management of wastewater plants [Online].
http://www.epa.ie/newsandevents/news/previous/2014/name,53429,en.html#.U_NarfldX00
[accessed: August 2014]
[9] D. Shannon, B. Wall and D. Flynn, "Focus on urban waste water treatment in 2012,"
Environmental Protection Agency ireland, EPA website, 2012.
[10] R. S. Ramalho, "Introduction to wastewater treatment processes," in (Academic Press
Inc, Ed. 1977, pp. 71.
[11] J. Collins, K. Olmstead and k. Takacs, "Municipal nutrient removal technologies
reference document," US Environmental Protection Agency, Tech. Rep. 1, 2008.
[12] D. Shannon, B. Wall and D. Flynn, "Focus on urban waste water treatment in 2012: A
report for the year 2012," Irish Environmental Protection Agency, Wexford, Ireland, 2014.
[13] G. Cronin, "Irish water: Phase 1 report," Pricewaterhouse Coopers, environ.ie, 2011.
[14] C. Murray, "Limerick county council budget 2013," Limerick County Council, Limerick
County Council Website, 2012.
[15] P. Zahreddine, "Innovative energy conservation measures at wastewater treatment
facilities," United States, Environmental Protection Agency, 2012.
[16] Enterprise Ireland, "Best practice guide wastewater treatment – activated sludge
process," Enterprise Ireland, Tech. Rep. No. BPGCS002,
68
[17] J. Cantwell, J. Newton and T. Jenkins, "Running an energy-efficient wastewater utility,"
Water Environment Federation, 2009.
[18] F. Spellman, "Water & wastewater infrastructure," in CRC Press Taylor & Francis
Group, 2013, pp. 300.
[19] "Air power at dingle waste water treatment plant," Sustainable Energy Authority of
Ireland, SEAI Website, 2010.
[20] A. Lazic, V. Larsson and A. Nordenborg, "Energy savings potential of new aeration
system: Full scale trials, Water Practice & Technology," vol. 7, 2012.
[21] "Fine pore aeration systems," United States EPA, Tech. Rep. EPA/625/1-/89/023, 1989.
[22] G. Tchobanoglous, F. L. Burton and H. D. Stensel, "Wastewater engineering: Treatment
and reuse, Fourth edition ed.USA," in 2003, pp. 1819.
[23] L. Defresne and S. Couture, "Evaluation of energy conservation measures for
wastewater treatment facilities," US EPA, Tech. Rep. EPA 832-R-10-005, 2010.
[24] D. Vrecˇko, "Improvement of ammonia removal in activated sludge process with
feedforward-feedback aeration controllers," vol. 53, pp. 125, 2006.
[25] G. Olsson and B. Newell, "Wastewater Treatment Systems. Modelling, Diagnosis and
Control," pp. 728, 1999.
[26] L. Ferrell, "Aeration efficiency and optimization, Schneider electric water wastewater
competency center, tennessee water wastewater utility partnership," 2012.
[27] Dissolved Oxygen Metering System [Online].
http://www.yokogawa.com/an/download/manual/IM12J05B03-01E.pdf [accessed: August
2014]
[28] J. Cantwell, L. Fillimore and S. Chaudhry, "Energy efficiency RFP guidance for water &
amp; wastewater facilities," Consortium for Energy Efficiency, Consortium for Energy
Efficiency, 2010.
[29] Pump Systems Matte and the Hydraulic Institute, Parsippany, NJ [Online].
www.PumpSystemsMatter.org [accessed: June 2014]
[30] [Online]. http://www.oxymem.com/oxymem-mabr/ [accessed: August 2014]
[31] Z. Hu, et al, "Nitrogen removal by a nitritation-anammox bioreactor at low
temperature." vol. 10, 2013.
[32] E. Clifford and N. Jones, "Modelling a novel batch biofilm passive aeration technology
using aquasim, vol 68," in 2014.
[33] K. Mizuta and M. Shimada, "Benchmarking energy consumption in municipal waste
water treatment plants in japan," IWA, vol. 62, pp. 2256–2262, 2010.
69
[34] "Energy Audits Benefitting your Drinking Water and Waste Water Treatment
Facility, EPA region 3 energy efficiency team," United States EPA.
[35] "Building energy manager's resource guide," Sustainable Energy Ireland, 2005.
[36] "Energy efficiency strategies for municipal wastewater treatment facilities," United
States National Renewable Energy Laboratory, Tech. Rep. DE-AC36-08GO28308, 2012.
[37] "Waste Water Treatment Manuals, Primary, Secondary and Tertiary Treatment," Irish
EPA, 1997.
[38] J. Horne and J. Turgeon, "Energy self ‐ assessment tools and energy audits for water and
wastewater utilities," US EPA,
[39] "An introduction to strategic energy management plans for climatesmart buildings,"
Queensland Department of Public Works, 2007.
[40] "European Wastewater Benchmarking Reporting - Discussion of Current Activities and
Chances of Cross National Comparison," The European Water Association and the German
Association for Water, Wastewater and Waste, 2009.
[41] D. Main, et al, "Process Benchmarking Drives WWTP Maintenance Optimization
within the National Water and Wastewater Benchmarking Initiative," vol. 18, pp. 479-496,
2011.
[42] H. Schaar, H. Kroiss and S. Lindtner, "Benchmarking for wastewater treatment plants –
the austrian practice," European Wastewater Benchmarking Reporting, 2008.
[43] G. J. Langley, R. Moen and K. M. Nolan, "The improvement Guide: A practical
approach to enhancing organizational performance, second ed," Jossey Bass, 2009.
[44] "Energy management system – requirements with guidance for use," Tech. Rep. EN
16001; 2009, 2009.
[45] J. Krozer, "How to get LCA in the right direction," vol. 6, pp. 53-61, 1998.
[46] "Energy efficiency in Local government Operations," United States EPA, Tech. Rep.
EPA-430-R-09-033, 2011.
[47] R. Goldstein and W. Smith, "Water & sustainability (volume 4): U.S. electricity
consumption for water supply & treatment - the next half century," Electric Power Research
Institute, United States of America, 2002.
[48] S. Tai, K. Matsushige and T. Goda, "Chemical exergy of organic matter in
wastewater," International Journal of Environmental Studies, vol. 27, pp. 301-315, 1986.
[49] S. Khosravi and M. Panjeshahi, "Application of exergy analysis for quantification and
optimisation of the environmental performance in wastewater treatment
plants," International Journal of Exergy, vol. 12, pp. 119-138, 2013.

70
[50] A. Martínez and J. Uche. (2010). Chemical exergy assessment of organic matter in a
water flow. Energy 35(1), pp. 77-84.
[51] D. Hellström. (1997 Jan. - Feb.). An exergy analysis for a wastewater treatment plant:
An estimation of the consumption of physical resources. Water Environ. Res. 69(1), pp. 44-
51. Available: http://www.jstor.org/stable/25044841
[52] A. Zaleta-Aguilar, L. Ranz and A. Valero. (1998). Towards a unified measure of
renewable resources availability: The exergy method applied to the water of a river. Energy
Conversion and Management 39(16–18), pp. 1911-1917.
[53] R. Rivero and M. Garfias. (2006). Standard chemical exergy of elements updated.
Energy 31(15), pp. 3310-3326.
[54] K. Gaudreau, R. Fraser and S. Murphy, "The Characteristics of the Exergy Reference
Environment and Its Implications for Sustainability-Based Decision-Making," vol. 5, pp.
2197-2213, 2012.
[55] A. Martinez, "Exergy cost assessment of water resources: physical hydronomics,
University of Zaragosa, Zargosa, Spain." pp. 145-149, 2009.
[56] P. Debye and E. Huckel, "Physik. Z." vol. 24, pp. 185-334, 1923.
[57] Fitzsimons, Lorna (2011) A detailed study of desalination exergy models and their
application to a semi-conductor ultra-pure water plant. PhD thesis, Dublin City University
[58] D. Livingston, "Chemical composiiton of rivers and lakes," in , vol. 6, 1963, pp. 64.
[59] M. Lehane and B. O'Leary, "Ireland's environment 2012 - an assessment,"
Environmental Protection Agency of Ireland, 2012.
[60] W. Moore, R. Kroner and C. Ruchhoft, "“Dichromate Reflux Method for Determination
of Oxygen Consumed: Effectiveness in Oxidation of Organic Compounds”, Analytical
Chemistry," vol. 21, pp. 953‐957, 1949.
[61] D. Hellström, "Exergy Analysis: A Comparison of Source Separation Systems and
Conventional Treatment Systems," vol. 71, pp. 1354-1363, 1999.
[62] C. Mora-Bejarano and S. de Oliveira Jr, "Wastewater Chemically Enhanced Primary
Treatment Renewability Assessment by Exergoenvironmental Analysis," 2009.
[63] C. Mora-Bejarano and S. de Oliveira Jr, "Environmental Exergy Analysis of Wastewater
Treatment Plants," vol. 5, pp. 24-29, 2006.
[64] Standard Methods for the Examination of Water and Wastewater, American Public
Health Association, 21st Edition, 2005.
[65]W. Eckenfelder and D. Ford, “Water Pollution Control; Experimental Procedures for
Process Design,” pp.16, Pemberton Press, 1970.

71
Appendix
Table 1: Waste water treatment plant characteristics
CHARACTERISTIC WWTP A WWTP B WWTP C
Sampling dates
03 to 07, 10 to 14
17 to 21, 24 to 26 of
Nov. (2013)
02/09/2014 to
07/09/2014
07, 08, 09, 14,
15, 16, 19 of
October 2015
Number of days 18 days 6 days 7 days
Flow streams
sampled
Influent and
Effluent
Influent and
Effluent
Influent and
Effluent
Number of samples
per stream per day
As per plant
managers schedule 6 6
Time between
samples N/A 4 hours 4 hours
Influent testing
location Influent Stream Screening Screening
Influent sampling
method
Grab Sample
(Automatic
Sampler)
24 hour
composite
24 hour
composite
Effluent testing
location Outfall channel
Leaving Final
Clarifier
Leaving Final
Clarifier
Effluent sampling
method
Grab Sample
(Automatic
Sampler)
24 hour
composite
24 hour
composite
Energy data Yes Yes Yes
Data point frequency Daily totals and
process breakdown 30-60 seconds 30-60 seconds
Influent flow data Yes Yes Yes
Frequency and type Daily Total Daily Total Daily Total
Effluent flow data Yes Yes Yes
Frequency Daily Total Daily Total Daily Total