the use of multiple representations and …
TRANSCRIPT

THE USE OF MULTIPLE REPRESENTATIONS AND
VISUALIZATIONS IN STUDENT LEARNING OF INTRODUCTORY
PHYSICS: AN EXAMPLE FROM WORK AND ENERGY
DISSERTATION
Presented in Partial Fulfillment of the Requirements for
the Degree Doctor of Philosophy in the
Graduate School of The Ohio State University
By
Xueli Zou, B.S., M.S.
*****
The Ohio State University
2000
Dissertation Committee: Approved by
Professor Alan Van Heuvelen, Co-Adviser ___________________
Professor Richard Furnstahl, Co-Adviser Co-Adviser
Dr. James Stith ___________________
Professor K. K. Gan Co-Adviser
Department of Physics
ii
ABSTRACT
In the past three decades, physics education research has primarily focused on
student conceptual understanding; little work has been conducted to investigate student
difficulties in problem solving. In cognitive science and psychology, however, extensive
studies have explored the differences in problem solving between experts and naive
students. A major finding indicates that experts often apply qualitative representations in
problem solving, but that novices use an equation-centered method. This dissertation
describes investigations into the use of multiple representations and visualizations in
student understanding and problem solving with the concepts of work and energy.
The concepts of work and energy constitute a fundamental part of the college
introductory mechanics course. A multiple-representation strategy was developed to help
students acquire expert-like problem solving skills. In this approach, a typical work-
energy problem is considered as a physical process. The process is first described in
words—the verbal representation of the process. Next, a sketch or a picture, called a
pictorial representation, is used to represent the process. This is followed by work-energy
bar charts—a physical representation of the same processes. Finally, this process is
represented mathematically by using a generalized work-energy equation. In terms of the
multiple representations, the goal of solving a work-energy problem is to represent the

iii
physical process in different ways—words, sketches, bar charts, and equations. The
abstract verbal description is linked to the abstract mathematical representation by the
more intuitive pictorial and diagrammatic physical representations. Ongoing assessment
of student learning indicates that this multiple-representation technique is more effective
than standard instruction methods in student problem solving.
Internal energy is an abstract concept in work and energy. To help students
visualize this difficult-to-understand concept, a guided-inquiry learning activity using a
pair of model carts and an experiment problem using a sandbag were developed.
Assessment results have shown that these research-based materials are effective in
helping students visualize this concept and give a pictorial idea of “where the kinetic
energy goes” during inelastic collisions.
The research and curriculum development was conducted in the context of the
introductory calculus-based physics course. Investigations were carried out using
common physics education research tools, including open-ended surveys, written test
questions, and individual student interviews.

iv
Dedicated to my parents

v
ACKNOWLEDGMENTS
I wish to thank my adviser, Alan Van Heuvelen, for his guidance, patience, and
understanding. Professor Van Heuvelen is a master at a veritable font of knowledge, with
open mind, giving constant encouragement to his students, and never lacking of solid
research ideas. The breadth of his interests is amazing. His support during my graduate
study has been invaluable and inspiring. Thank you very much, Alan, for giving me the
opportunity to study with you and learn from you—not only about physics and physics
education research, but also about how to generate ideas, teach students, collaborate with
others, and much more.
I also wish to thank Professor Richard Furnstahl for serving co-chair on my
dissertation committee. His support and advice on my dissertation research is valuable.
Of course my many thanks go to the other current and former professors in the
OSU physics education research group: Len Jossem, Gordon Aubrecht, Ken Wilson, Bill
Ploughe, and James Stith. All have contributed greatly to my knowledge and have helped
me understand difficult issues. Special thanks go to Professor Jossem for his great help
with providing perfect and timely resources for my research. Also, Professor Aubrecht’s
support, in particular, his review of a draft of this dissertation, has been very valuable.
Professor Wilson’s intelligent, insightful, and unique thoughts about science education
reform have strongly encouraged me to work on physics education research. Professor

vi
Ploughe’s valuable review of this lengthy dissertation has been acknowledged. Dr. Stith’s
encouragement and support has been constantly strong, even after he left the group.
My research work has also been benefited from discussions with many other
people in the physics education research community. Especially, I would like to thank
Professor Joe Redish, Professor David Maloney, and Professor Uri Ganiel for their
profitable discussions with me.
I gratefully thank Richard Furnstahl, James Stith, and K. K. Gan for serving on
my committee.
Support from the National Science Foundation (grants #DUE-9653145, #DUE-
9751719, and #GER-9553460) is deeply appreciated. It has enabled me to do this
dissertation research at The Ohio State University.
Support from other faculty and staff in the OSU physics department has been
appreciated as well. I would like to specially thank Dr. Constance Barsky and Professor
Bunny Clark for their support, Professor Lemberger, Dr. Adelson, and Professor Gan for
their important help with my data collections, Nick Noll, Thomas Kelch, Harold Whitt
for their time and crucial assistance with making apparatus used in my research, and
computer staff for their helpful hands to deal with my computer problems.
My many thanks also go to Dr. Hwa-Wei Lee and his wife, Mary. As our friends
and parental advisers, they have always provided help and guidance for my husband and
me to come through various difficulties. I have specially appreciated Mary for her
proofreading this lengthy dissertation. Her time and support has been truly helpful and
important.

vii
Last, but not least, thanks to my fellow graduate students, friends, and family. I
cannot image how difficult and awful it would be to go through graduate school without
good social support. I have appreciated the friendship and the help from all the OSU
physics education research group fellows, Leith Allen, Kathy Andre, Dave Van Domelen,
David May, Tom Kassebaum, Keith Oliver, Dave Torick, and postdoc Seth Rosenberg,
whom I hope to collaborate with in the future. I have also had and have benefited from
many interesting discussions with them all. Specially, I would like to thank Leith for her
constructive feedback and criticism on my research project, to thank Kathy for her help
with my data collections and for her intelligent suggestions on my dissertation writing, to
thank Dave (Van Domelen) for providing me some data from his research, and to thank
Tom for working with me on some student interviews.
Of course, strong support and encouragement from Linda Van Heuvelen has been
invaluable. Her parental love has been always special to me. Unfailing support from my
parents has always been strong. My four-year old son, Steven, has known no other life
than being the child of students—my husband, Dakuan, and I both in graduate schools. I
can only hope that the positive role models have weighted up against the relative lack of
time and money. Dakuan’s life skills, his knowledge of education, statistics, and
computer science, as well as his extreme patience and unfailing support for my efforts
have been invaluable.

viii
VITA
January 9, 1964 …………………… Born - Changchun, China 1985 ………………………………. B.S. Physics, Northeast Normal University, Changchun, China 1985-1993………………………… Research Fellow and Textbook Writer & Editor,
National Research Institute on Curriculum Development & Teaching Materials and People’s Education Press, Beijing, China
1994-present………………………. Research and Teaching Associate, The Ohio State
University, Columbus, Ohio
PUBLICATIONS
1. Van Huevelen, A., and Zou, X., “Multiple representations of work-energy processes,” Am. J. Phys. 68 (9), 2000.
2. Van Heuvelen, A., and Zou, X., Constructing and Applying the Concepts of Physics: Laboratory Manual Physics 131, Hayden-McNeil Publishing, Inc., 1999.
FIELDS OF STUDY
Major Field: Physics Studies in physics education research: Professor Alan Van Heuvelen
ix
TABLE OF CONTENTS
Page Abstract …………………………………………………………………………………...ii Dedication .…………………………………………………………………………….…iv Acknowledgments ………………………………………………………………………...v Vita ………………………………………………………………………………….….viii List of Tables …………………………………………………………………………...xiv List of Figures …………………………………………………………………………xviii Chapters:
1. Introduction …………………………………………………………………………...1
1.1 Context for research ……………………………………………………………...8 1.2 Research methods ………………………………………………………………..9 1.3 Overview of dissertation ………………………………………………………..12
Endnotes of Chapter 1 …………………………………………………………………...13
2. Review of literature ………………………………………………………………….15
2.1 Research on student understanding of work and energy ……………………….16 2.1.1 Research on student understanding of conservation of energy ………….16 2.1.2 Research on student understanding of the concept of internal energy in
mechanics ………………………………………………………………..18 2.2 External representations and their roles in problem solving …………………...20
2.2.1 Representation and its components ……………………………………...20 2.2.2 External representations and their roles in problem solving …………….21
2.2.2.1 The roles of external representations in problem solving ………23 2.2.2.2 Basic criteria for an effective instructional representation……...25
2.2.3 Multiple representations in physics and their roles in problem solving ...27 2.2.3.1 Differences in problem solving between experts and novices …30 2.2.3.2 The roles of multiple representations in physics ……………….33
2.3 Discussion and summary ……………………………………………………….36 Endnotes of Chapter 2 …………………………………………………………………..39

x
3. Multiple representations of work-energy processes ………………………………...42
3.1 Investigation of students’ difficulties using qualitative and quantitative representations in work-energy problem solving ………………………………43 3.1.1 Written Test Questions (Autumn 1997 and Winter1999) ……………….43
3.1.1.1 Student use of physical and mathematical representations in solving a work-energy problem (Roller-coaster problem, Autumn 1997) ……………………………………………………………43
3.1.1.2 Discussion of student use of physical and mathematical representations in solving the roller-coaster problem …………..46
3.1.1.3 Student use of pictorial representations in solving two work-energy problems (Block-spring problem and incline-loop problem, Winter 1999) ……………………………………………………49
3.1.1.4 Discussion of student use of pictorial representations in solving the two work-energy problems………………………………….50
3.1.1.5 Discussion of Written Test Results ……………………………..53 3.1.2 Think-aloud individual student interviews (Autumn 1999) ……………..54
3.1.2.1 Interview setup and procedure ………………………………….55 3.1.2.2 Interview problems ……………………………………………..57 3.1.2.3 Analysis of the interview problems from a perspective of multiple
representations in physics ………………………………………58 3.1.2.4 Student performance on interview problems …………………...65 3.1.2.5 Discussion of interview results …………………………………70
3.2 Development and implementation of a systematic multiple-representation strategy …………………………………………………………….……………73 3.2.1 Development of work-energy bar chart as a physical representation of
work-energy processes …………………………………………………..75 3.2.2 Multiple Representations of work-energy processes ……………………77 3.2.3 Systems and work ……………………………………………………….79 3.2.4 Instruction ……………………………………………………………….85
3.2.4.1 Qualitative representations of work-energy processes …………86 3.2.4.2 Quantitative work-energy problem solving …………………….92
3.3 Assessment of the effectiveness of the multiple-representation strategy ………92 3.3.1 Evaluation results (Autumn 1997 and Winter 1998) ……………………94
3.3.1.1 Student attitudes towards the energy bar charts and the multiple representation approach of solving work-energy problems …….94
3.3.1.2 Student performance on a tutorial-type question ……………….99 3.3.1.3 Student use of the multiple-representation strategy in problem
solving …………………………………………………………101 3.3.2 Discussion of the assessment results …………………………………...104 3.3.3 Evaluation results (Autumn 1999) ……………………………………..105
3.3.3.1 Student attitudes towards the energy bar charts and the multiple representation approach of solving work-energy problems …...105
3.3.3.2 Student performance on a written test problem (Bullet-block-spring problem) ………………………………………………..111

xi
3.3.3.3 Student performance on a similar bullet-block-spring problem after standard instruction ………………………….…………..113
3.3.3.4 Comparison of student performance on the two bullet-block-spring problems ……………………………………………….116
3.3.3.5 Student use of the multiple-representation strategy in problem solving …………………………………………………………118
3.3.3.6 Think-aloud individual student interviews ……………………121 3.3.3.7 Student performance on the interview problems ……………...124 3.3.3.8 Discussion of student performance on the interview problems
…………………………………………………………………132 3.4 Discussion and summary ……………………………………………………...133
Endnotes of Chapter 3 ………………………………………………………………….139
4. Visualization of internal thermal energy produced during inelastic collisions …….141
4.1 Investigation of students’ difficulties understanding the concept of internal thermal energy ………………………………………………………………...143 4.1.1 Individual student demonstration interviews (Spring 1998) …………..143
4.1.1.1 Interview demonstrations ……………………………………..145 4.1.1.2 Student responses and reasoning ……………………………...150 4.1.1.3 Discussion of interview results ………………………………..154
4.1.2 Written question (Autumn 1998) ………………………………………155 4.1.3 Discussion of student difficulties understanding the concept of internal
thermal energy …………………………………………………………157 4.2 Development and implementation of a guided-inquiry student learning activity
…………………………………………………………………………………157 4.2.1 Construction and modification of model carts (Spring and Autumn 1998)
………………………………………………………………………….158 4.2.2 Development of student worksheets …………………………………...159
4.2.2.1 Student worksheets (Autumn 1998) …………………………..159 4.2.2.2 Student worksheets (Autumn 1999) …………………………..162
4.2.3 Instruction ……………………………………………………………...164 4.3 Assessment of the effectiveness of the guided-inquiry learning activity ……..165
4.3.1 Evaluation results (Autumn 1998) ……………………………………..165 4.3.1.1 Student responses to the worksheet questions …...……………166 4.3.1.2 Discussion of the student responses to the worksheet questions
…………………………………………………………………170 4.3.1.3 Student performance on written questions ……………………171
4.3.2 Evaluation results (Autumn 1999) ……………………………………..175 4.3.2.1 Student responses to the worksheet questions…... ……………176 4.3.2.2 Student performance on a midterm examination question ……180 4.3.2.3 Discussion of Student performance on the midterm examination
question ……………………………………………………….184 4.3.2.4 Student performance on a final examination question ………..184
4.3.3 Individual student demonstration interviews (Spring 1999) …………..186 4.3.3.1 Interview demonstrations and student responses ……………..187

xii
4.3.3.2 Discussion of the interview results ……………………………192 4.4 Discussion and summary ……………………………………………………...194
Endnotes of Chapter 4 ………………………………………………………………….197
5. Visualization of internal potential energy produced during inelastic collisions …...199
5.1 Investigation of students’ difficulties understanding the internal potential energy produced during inelastic collisions …………………. ………………………202 5.1.1 Individual student demonstration interviews (Spring 1998) …………...202
5.1.1.1 Student responses and reasoning on the task ………………….203 5.1.1.2 Discussion of the interview results ……………………………204
5.1.2 Pretest problem (Spring 1999) …………………………………………205 5.1.2.1 A multipart problem including a partially inelastic collision …205 5.1.2.2 Student responses and reasoning ……………………………...208 5.1.2.3 Discussion of pretest results …………………………………..211
5.1.3 Discussion of student difficulties understanding the internal potential energy produced during inelastic collisions ……………………………213
5.2 Development and implementation of an experiment problem as a laboratory activity ………………………………………………………………………...214 5.2.1 Development of Pendulum-Box Bash experiment problem (Spring 1999)
………………………………………………………………………….214 5.2.1.1 Problem setup …………………………………………………215 5.2.1.2 The use of a sandbag versus a super ball as the pendulum bob
…………………………………………………………………215 5.2.2 Development of student laboratory worksheets ……………………….216 5.2.3 Instruction ……………………………………………………………...217
5.2.3.1 Experiment problem …………………………………………..217 5.2.3.2 Sandbag versus super ball laboratory …………………………218
5.3 Assessment of the effectiveness of the Pendulum-Box Bash experiment problem as the laboratory activity (Spring 1999) ………………………………………219 5.3.1 Student performance on post-test problem …...………………………..220
5.3.1.1 Student responses and reasoning ……………………………...220 5.3.1.2 Discussion of post-test results ……….………….…………….229
5.3.2 Student performance on a final examination problem …………………230 5.3.2.1 Student performance …………………………………………..232 5.3.2.2 Discussion of final examination results ………..……………...236
5.3.3 Individual student demonstration interviews (Spring 1999) ….………..237 5.3.3.1 Interview demonstrations and questions ………………………237 5.3.3.2 Student responses and reasoning ……………………………...239 5.3.3.3 Discussion of interview results ………….………………….…245
5.3.4 Discussion of evaluation results …………………………………….….246 5.4 Discussion and summary …………………………………………….………..247
Endnotes of Chapter 5 ………………………………………………………………….249
6. Conclusion …………………………………………………………………………251

xiii
Appendices: A. Warm-up questions and work-energy equation sheet used for think-aloud individual student interviews (Autumn 1999) ……………………………………………….….…258 B. Three think-aloud individual student pre-interview problems (with the work-energy bar charts, Autumn 1999) ………………………………………………………….…..260 C. Three think-aloud individual student pre-interview problems (without the work-energy bar charts, Autumn 1999) ………………………………..………………………….…...264 D. Detailed solutions produced by two students for the think-aloud individual student pre-interview problems (with the work-energy bar chart, Autumn 1999) ……………..267 E. Detailed solutions produced by one student for the think-aloud individual student pre-interview problems (without the work-energy bar chart, Autumn 1999) ……………...274 F. Three think-aloud individual student follow-up interview problems (Autumn 1999) ………………………………………………………………………………………….277 G. Detailed solutions produced by one student for the think-aloud individual student follow-up interview problems (this student learned the concepts of work and energy using the multiple-representation strategy, Autumn 1999) ………………………………….280 H. Detailed solutions produced by one student for the think-aloud individual student follow-up interview problems (this student learned the concepts of work and energy using other approaches, Autumn 1999) ……………………………………………………..283 I. Individual student demonstration interview protocols (Spring 1998) ………………286 J. Student worksheets developed in the autumn quarter of 1998 ……………………..288 K. Student worksheets developed in the autumn quarter of 1999 …………………….292 L. Pendulum-Box Bash experiment problem setup …………………………………..296 M. 131 Lab manual used in the spring quarter of 1999 ……………………………….299 Bibliography …………………………………………………………………………..302

xiv
LIST OF TABLES
Table Page
1.1 Detailed characteristics of the demonstration interview and the think-aloud interview ………………………………………………………………………….11
3.1 Student use of physical and mathematical representations in solving question (b) of
the work-energy problem shown in Figure 3.1 ……………………………………47 3.2 Student use of physical and mathematical representations in solving question (c) of
the work-energy problem shown in Figure 3.1 ……………………………………47 3.3 Student use of a pictorial representation when answering the problem shown in
Figure 3.2 ………………………………………………………………………….51 3.4 Student use of a pictorial representation when answering the problem shown in
Figure 3.3 ………………………………………………………………………….52 3.5 Students’ responses for question 1 on the survey: Did using the energy bar charts
help you learn energy concepts and solve work-energy problems? Explain why they were useful or not useful …………………………………………………………..96
3.6 Students’ responses for question 2 on the survey: Did representing the work-energy
processes in multiple ways—words, sketches, bar charts and equations—help you learn energy concepts and solve energy problems? Explain why they were useful or not useful ………………………………………………………………………….97
3.7 Students’ responses for question 3 on the survey: Did you (or how did you) use the
energy bar charts and the multiple representations of work-energy processes to solve energy problems while doing homework, group problems in recitation, problems in lab, and/or on exam problems? Did you use them when first becoming familiar with the concepts and then less as you become more expert at solving work-energy problems? ……………………….………………………………………………...98
3.8 Students’ responses for question 1 on the survey: Did using the energy bar charts help you learn energy concepts and solve work-energy problems? Explain why they were useful or not useful …………………………………………………………107

xv
3.9 Students’ responses for question 2 on the survey: Did representing the work-energy processes in multiple ways—words, sketches, bar charts and equations—help you learn energy concepts and solve energy problems? Explain why they were useful or not useful ………………..…………………………………………………..……108
3.10 Students’ responses for question 3 on the survey: Did you (or how did you) use the
energy bar charts and multiple representations of work-energy processes to solve energy problems while doing homework or exam problems? ……………………109
3.11 Students’ performance on the energy problem that is a sub-part of the problem
shown in Figure 3.22. This energy problem includes the interaction between the bullet-block system and the spring ……..………………………………………...112
3.12 Students’ performance on the energy problem that is a sub-part of the problem
shown in Figure 3.23. This energy problem includes the interaction between the bullet-block system and the spring ……….………………………………………115
3.13 Pretest scores of the FCI from honors engineering students and honors physics or
mathematical majors. The test was given at the very beginning of each quarter ...117 3.14 Students’ performance on the problem shown in Figure 3.24 ……………………120 4.1 Students’ reasoning about why the unhappy ball did not bounce back but the happy
ball did after the students observed the demonstration …………………………..152 4.2 Students’ responses to the worksheet question: Provide one or more reasons why
you think one of the balls did not bounce back, but the other did ……………….167 4.3 Students’ responses to the worksheet question: What do you think happened to the
energy of the unhappy ball just after the collision? ….…………………………..167 4.4 Students’ responses to the worksheet question: Kinetic energy that individual
molecules have is one example of internal energy. The faster molecules inside a solid move and rotate, the larger their internal energy, and the “hotter” the solid is. So now, using the concept of internal energy, explain why the “unhappy” ball did not bounce back, but the “happy” ball did ……………………………………….169
4.5 Proportion of students who correctly recognized the collision as a small sub-
problem in the two complex problems …………………………………………...174 4.6 Students’ responses to the worksheet question: Provide one or more reasons why
you think one of the balls did NOT bounce back, but the other did ……………..178 4.7 Students’ responses to the worksheet question: What do you think happened to the
energy of the unhappy ball just after the collision? ………………………………178

xvi
4.8 Student responses to Question 12 on the worksheet: We can consider the two carts as a simple analogy for the two black balls. Now explain why the “unhappy” ball died on the surface after the collision ………………………………………...…..179
4.9 Student responses for the second part of question b) of the problem shown in Figure
4.9. The cart group refers to the students who learned the guide-inquiry activity using the model carts, while the non-cart group refers to the students who learned how to solve some complex multipart problems including inelastic collisions ….183
4.10 Student performance on the inelastic collision part of the final examination for one
section of the Physics 131E class. The cart group refers to the students who learned the guided-inquiry activity using the model cart, while the non-cart group refers to the students who did not learned this activity, but studied solving some multipart problems including perfectly inelastic collisions as sub-small parts ………….….186
4.11 Student responses to interview questions related the demonstration using the happy
and unhappy ball during the individual student interviews ………………………188 4.12 Student reasoning about what happened to the initial kinetic energy of the unhappy
ball right after its collision ………………………………………………………..190 4.13 Student reasoning about why one cart bounced back a significantly shorter distance
than the other one (before two covers of the carts were taken off) ……….…...…191 4.14 Student reasoning about why the rubber-band cart bounced back a significantly
shorter distance than the rigid-rod cart (after two covers of the carts were taken off) …………………………………………………………………………………….193
5.1 Students’ responses and explanations for question (a), shown in Figure 5.2, which
asks to compare the kinetic energy of the pendulum bob just before the collision with the kinetic energy of the block just after the collision ………………...……209
5.2 Students’ responses and explanations for the question (b), shown in Figure 5.2,
which asks to compare the magnitude of the momentum of the pendulum bob just before the collision with the magnitude of the momentum of the block just after the collision …………………………………………………………………..………210
5.3 Major differences in using a sandbag as the pendulum bob and using a super ball as
the pendulum bob for the Pendulum-Box Bash Experiment Problem Laboratory activity ……………………………………………………………………………219
5.4 Students responses and explanations, grouped by the sandbag and the super ball
laboratory, on question (a) of the post-test problem shown in Figure 5.3, which asked to compare the kinetic energy of the karate expert’s fist just before the collision with the kinetic energy of the boxing bag just after the collision ……...222

xvii
5.5 Students responses and explanations, grouped by the sandbag and the super ball laboratory, on question (b) of the post-test problem shown in Figure 5.3, which asked to compare the magnitude of the momentum of the karate expert’s fist just before the collision with the magnitude of the momentum of the boxing bag just after the collision ………………………………………..………………………..223
5.6 Students responses and explanations, grouped by the sandbag lab and the super ball
laboratory, on question (a) of the pretest problem shown in Figure 5.2, which asked to compare the kinetic energy of the pendulum bob just before the collision with the kinetic energy of the block just after the collision ……………………………….225
5.7 Students responses and explanations, grouped by the sandbag lab and the super ball
lab, on question (b) of the pretest problem shown in Figure 5.2, which asked to compare the magnitude of the momentum of the pendulum bob just before the collision with that of the block just after the collision ………………………. ….226
5.8 Student overall performance on the final examination problem shown in Figure 5.4
………………………………………………………………………………….…233 5.9 Proportion of students who incorrectly answered for pretest question (a) that the
initial kinetic energy of the bob was equal to the kinetic energy of the box after the collision and percentage of students who incorrectly applied the conservation of energy to the problem as a whole or incorrectly applied the conservation of kinetic energy to the collision part. Those students received either A or B for their final class letter grades and were grouped by the sandbag and the super ball laboratory …………………………………………………………………………….………234
5.10 Proportion of students who incorrectly answered for pretest question (a) that the
initial kinetic energy of the bob was equal to the kinetic energy of the box after the collision and percentage of students who incorrectly applied the conservation of energy to the problem as a whole or incorrectly applied the conservation of kinetic energy to the collision part. Those students received C, D or E for their final class letter grades and were grouped by the sandbag and the super ball laboratory …..234
5.11 Student explanations about “where the kinetic energy of the sandbag goes” during
the collision between a sandbag and a table ………………………………..…….241 5.12 Student responses to the question asking for a comparison between the kinetic
energy of the super ball before the collision with that of the box after the collision ……………………………………………………………………………….……243
xviii
LIST OF FIGURES
Figure Page
1.1 The model used by the Physics Education Group at the University of Washington for their physics education research ………………………………………………...3
1.2 The model used by the Physics Education Research Group at the University of
Maryland for their physics education research ……………………………………...3 1.3 The model used in the studies described in this dissertation ………………………..4 2.1 The set-up used by the researchers at the UW during individual demonstration
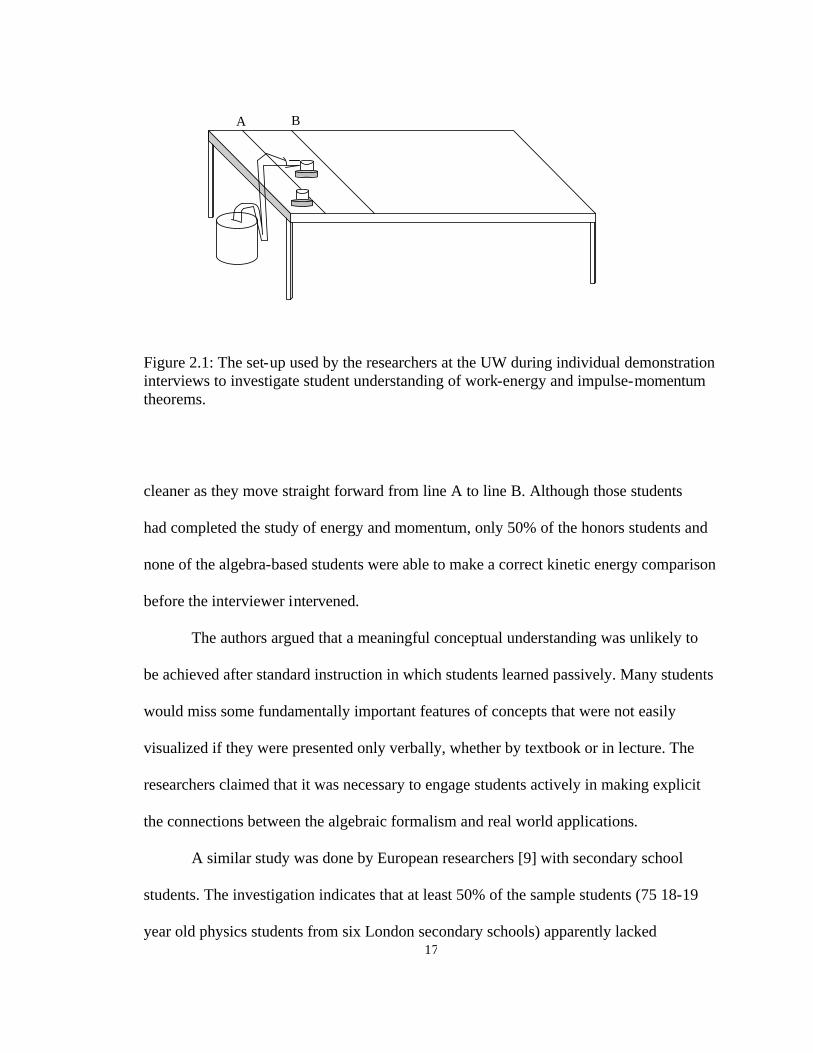
interviews to investigate student understanding of work-energy and impulse-momentum theorems ………………………………………………………….…...17
2.2 The represented and representing worlds. Symbols on the piece of paper at the bottom form the representing world and represent the real world at the top, the represented world ……………………………………………………………….....22
2.3 The three different graphs represent the same information—population sizes in
Beijing and Tokyo. To answer the question “By how much is the population of Tokyo larger than that of Beijing?” the bar graph is the easiest representation to answer this question …………………………………………………………..…..24
2.4 The free-body force diagrams illustrate good instructional representations to solve
the dynamics problem. They not only show some constraints (e.g., TAB = TBA in magnitude) explicitly, but also serve as an intermediary to lead students from the pictorial description with real objects to abstract formalisms and to help them set up equations correctly ……………………………………………………….………..26
2.5 Two different motion diagrams representing a coin moving vertically upward.
Motion diagram (b) represents better than motion diagram (a) the changing velocity and the relationship between velocity and acceleration …………………………..27
2.6 The kinematics process can be represented in verbal, pictorial, physical, and mathematical representations ……………………………………………………...29

xix
2.7 Example interview problems used by Jill Larkin et al. to investigate differences in problem solving between experts and novices …………...………………………..32
2.8 The physics process is described in the multiple representations. Each representation
has its own functions in problem solving ………………………………………….34 3.1 The work-energy problem (roller-coaster problem) given on the Physics 131 final
examination in the autumn quarter of 1997 ………………………………………..45 3.2 The work-energy problem (block-spring problem) appeared on the Physics 131 final
examination in the winter quarter of 1999 ………………………………………...51 3.3 The work-energy problem (incline-loop problem) appeared on the Physics 131 final
examination in the winter quarter of 1999 …………………………………...……52 3.4 A problem representation chart for problem 1 used during the pre-interview. The
representation chart is composed of two parts: the left part consisting of the multiple representations of the physical process and the right part consisting of the problem statement and the questions in problem 1. The arrows connecting them indicate which representation could be used to answer which question readily …………....60
3.5 A problem representation chart for problem 2 used during the pre-interview. The
representation chart is composed of two parts: the left part consisting of the multiple representations of the physical process and the right part consisting of the problem statement and the questions in problem 2. The arrows connecting them indicate which representation could be used to answer which question readily ………..…..63
3.6 A problem representation chart of pre-interview problem 3. The representation chart
is composed of two parts: the left part consisting of the multiple representations of the physical process and the right part consisting of the problem statement and the questions in problem 3. The arrows connecting them indicate which representation could be used to answer which question readily …………………………….…….64
3.7 One example of the work-energy bar charts that students correctly completed for the
interview problem 1 ……………………………………………………….……….66 3.8 Three work-energy bar charts made by three students when answering the question
asking for completing the work-energy bar chart for interview problem 1 ……….67 3.9 Multiple representations of a dynamics process …………………………………..74 3.10 Work-energy bar charts that serve the same role for analyzing work-energy
processes as motion diagrams and force diagrams serve when analyzing kinematics and dynamics problems ……………………………………………………………76
3.11 Multiple representations of a work-energy process ………………………………..78

xx
3.12 The different systems are chosen for the same physical process. In (a), the cart, the spring, and Earth are in the system. In (b), however, the cart and the spring are in the system, but not Earth. The system in (c) includes only the cart. For each chosen system there is one work-energy bar chart and the corresponding generalized work-energy equation. In practice, it would be easy for students to use a system that includes Earth and the spring, although the way to choose the system does not affect the physical results ………………………………………………………………...81
3.13 The physical processes involve friction. In (a), a point-particle block slides to a stop
on a floor with friction. The system includes only the point-particle block. So the floor exerts on the point-particle block an external frictional force, and this frictional force does a negative amount of work, which has the same magnitude as the block’s initial kinetic energy. In (b), a real car skids to stop on a rough road. The car is the only object in the system. Thus, the road that touches the car causes an external frictional force and a difficult work calculation. Chabay and Sherwood argue that for such a real system that includes the car, it has less negative work done by the friction of the road on the car than the car’s initial kinetic energy. The remaining amount of the car’s kinetic energy is transferred into the internal energy in the car (see Ref [9], pp. 236-241 for detailed discussions about this advanced topic). In (c), we see a recommended system choice that includes the objects and the frictional interfaces between the objects in the system. In this way we can readily include the system’s internal energy change due to friction rather than dealing with a complex work calculation ………………………………………………………………..….83
3.14 The work-energy process is described in words and in a sketch as shown in (a).
Students are asked to construct the pictorial representation, including a system choice and a coordinate system, and indicating the values of the quantities in the system’s initial and final states as shown in (b) …………………………….……..87
3.15 For the given work-energy process, students are asked to construct the detailed
sketch, and then convert it to an energy bar chart. Finally, they use the bar chart to apply the generalized work-energy equation ………………………………………88
3.16 A work-energy process is described by a work-energy bar chart. Students start with
the bar chart and invent a sketch, a real-world situation in words and a generalized work-energy equation that is consistent with the bar chart ………………..………90
3.17 The so-called Jeopardy problem starts with the mathematical equation for a work-
energy process. Students are asked to construct a bar chart that is consistent with the equation, to draw a sketch, and to invent a process that would produce the equation and the chart ………………………………………………………………..……..91

xxi
3.18 One of the quantitative problems included in the Active Learning Problem Sheets. Students solve those problems using the multiple-representation strategy after having developed skills in constructing qualitative representations. These multiple-representation problems help students develop qualitative understanding about the physical processes and develop problem-solving expertise, instead of using only an equation-centered method ……………………………………….……………..….93
3.19 The problem originally developed by the Physics Education Group at UW was
administered to the OSU honors engineering freshmen one quarter after they had learned the work-energy method. The students were told that their scores on the problem did not affect their class grades. This problem was also given to 147 OSU regular calculus-based introductory physics students after standard instruction in which the bar charts and the multiple-representation strategy had not been used …………………………………………………………………………………….100
3.20 The graph shows the proportion of each group that correctly answered the question
shown in Figure 3.19. Bars 1 and 2 indicate that no more than 20% of over one thousand calculus-based physics students from UW and OSU answered and explained the problem correctly after standard instruction. Bars 3 and 4 indicate that 65% of about two hundred physics graduate students and faculty correctly provided the answers and reasoning for the problem on pretests before the UW tutorials. Bar 5 indicates that 60% of more than fifty OSU honors engineering freshmen successfully answered the question with correct reasoning ………………..…….102
3.21 A problem that appeared on the final examination in a calculus-based class for
honors engineering freshmen in the autumn quarter of 1997 ……………...……..103 3.22 The problem was given on the final exam for the honors engineering freshmen who
had learned the work-energy bar charts and the multiple-representation strategy with the concepts of work and energy …………………………………………………112
3.23 The problem was given on the final exam for the honors physics majors who had
learned the work-energy concepts in standard instruction ………………….……114 3.24 The work-energy problem given on the midterm exam of 131E class. The exam was
given when the students just had learned the multiple-representation strategy with the concepts of work and energy …………………………………………………120
3.25 A part of the solution produced by the 131E student for solving Question 1 in the
interview Problem 1. He constructed the work-energy bar chart, used it to set up the generalized work-energy equation, and then plugged numbers into the equation to solve for the unknown quantity …………………………………………………..127

xxii
3.26 A part of the solution produced by the 131H student for solving Question 1 in the interview Problem 2. She did not set up the generalized work-energy equation. Instead, she separately calculated the initial energy (i.e., P = mgy) and the final energy (i.e., 1/2mv2 = 0.9 J) …………………………………..………………….129
4.1 Developed by Uri Ganiel, this model cart is used for demonstrating inelastic
collisions ………………………………………………………………………….144 4.2 Developed by Uri Ganiel, this model cart is used for demonstrating elastic collisions
…………………………………………………………………………………….144 4.3 The macromolecular structure of neoprene rubber, of which the happy ball is made
…………………………………………………………………………………….147 4.4 The macromolecular structure of polynorbornene rubber, of which the unhappy ball
is made ……………………………………………………………………………147 4.5 The information about how to construct the rigid-rod model cart, as shown in the
picture (this model cart can be used for demonstrating elastic collisions) …….....160 4.6 The information about how to construct the rubber-band model cart, as shown in the
picture (this model cart can be used for demonstrating inelastic collisions) ……..161 4.7 The Pendulum-Box Bash Problem in the Problem Decomposition Diagnostic Test
…………………………………………………………………………………….172 4.8 The Block Catcher Problem in the Problem Decomposition Diagnostic Test …...173 4.9 The problem appeared on the midterm examination for one section of the honors
engineering freshmen class in the autumn of 1999. Question b) asked the students 1) to calculate how much the initial energy is lost and 2) to explain what happens to the “lost” energy. In our research, student answers for the second part of question b) are analyzed and summarized in Table 4.9 ……………………………………….….181
4.10 Distributions of students’ final class letter grades from the cart group and the non-
cart group …………………………………………………………………………183 4.11 The problem appeared on the final examination for one section of the Physics 131E
class, in which about half of the students studied the guided-inquiry learning activity using the model carts ………………………………………………….………….185
5.1 Lennard-Jones potential energy function, which approximately describes the
potential energy of two neutral atoms ……………………………………………200

xxiii
5.2 The pretest problem was administered to students in the OSU regular calculus-based physics 131 class in the spring quarter of 1999. When taking this test, the students had learned the concepts of work and energy, momentum, and collisions ………206
5.3 The post-test problem was administered to students in one section of the calculus-
based physics 131 course in the spring quarter of 1999. The students took this test at the end of the Pendulum-Box Bash Experiment Problem laboratory …………...221
5.4 Distribution of the number of students, from the sandbag and the super ball
laboratory, who received final class letter grades as A and B, C and D, as well as E …………………………………………………………………………….……....228
5.5 The problem appeared on the final examination for one section of the 131 class in
the spring quarter of 1999. In this section, half of the students took the Pendulum-Box Bash laboratory using a sandbag as the pendulum bob and the other half took the same laboratory but using a super ball as the pendulum bob …………..…….231
1
CHAPTER 1
INTRODUCTION
About three decades ago, some physicists to their surprise found that there existed
a great difference between what was taught and what was learned [1]. Since then,
systematic investigations done by physicists about how students learn physics have been
growing in number and sophistication. Forming a new community and building a new
area in physics—physics education research—researchers have gained deep insight both
into students’ difficulties understanding physics and into how to help students learn more
effectively [2]. At the same time, the goal of learning physics has also been examined and
challenged by the needs in the 21st century workplace. Studies by the U.S. Department of
Labor [3], the Accreditation Board of Engineering and Technology (ABET) (e.g., ABET
Criteria 2000 [4]), the National Science Foundation [5], and the American Institute of
Physics [6, 7] unanimously suggest some common skills that the real world workplace
wants employees in science and engineering to have: for example, knowing how to learn,
scientific investigation skills, problem solving ability, communication and teamwork
skills, and others. Therefore, the goals of physics education research are various and
different. Some focus more on understanding of physics knowledge, some emphasize
developing procedural skills to meet the needs of the workplace, and some do both. For
example, Tutorials in Introductory Physics, developed by Lillian McDermott and the
2
physics education group at the University of Washington, aims primarily to overcome
students’ persistent conceptual difficulties and to develop scientific reasoning skills [8],
while some projects done by the physics education research group of The Ohio State
University intend to help students build a solid conceptual foundation and develop
procedural skills, such as techniques to solve complex, multipart problems and teamwork
skills [9, 10, 11, 12].
Although the goals of physics education research can differ, the procedures for
investigations contain some common characteristics [13, 14, 15]:
1) Conduct systematic investigations of student understanding, especially their
difficulties in learning physics concepts;
2) Apply the results of this research to develop and implement curricula and instructional
techniques; and
3) Assess the effectiveness of the curricula and instructional strategies on student
learning.
These steps are not mutually isolated, but form a coherent, continuous, interactive, and
iterative process. The Physics Education Group (PEG) at the University of Washington
(UW) categorized this process into three components, namely, research, curriculum
development, and instruction [14, 15]. These three parts constitute the triangular model
(see Figure 1.1) used by the PEG of the UW to conduct their research. Building upon this
UW model, the Physics Education Research Group (PERG) at the University of
Maryland (UMd) integrated a model of learning into the triangle and developed their
wheel model [13], as shown in Figure 1.2. The PERG at the UMd believe that the

3
Figure 1.1: The model used by the Physics Education Group at the University of Washington for their physics education research.
Figure 1.2: The model used by the Physics Education Research Group at the University of Maryland for their physics education research.
Research
Instruction Curriculum Development
Model of learning
Curriculum Development
Instruction
Research

4
learning model is a central component of the research process and can inform the
research cycle at all of its stages.
A model [16] used in the studies described in this dissertation also contains these
three common components of physics education research. As shown in Figure 1.3, this
model includes three parts: the initial state ( Ψ0 ) of student knowing, the desired state
( Ψ ) of student knowing, and a learning system transformer (ε̂ ). The initial state of the
student knowing includes student life experience, prior knowledge, skills, as well as
attitudes and beliefs; The desired state of student knowing includes the target knowledge,
skills, attitudes and beliefs, and so forth; and the learning system transformer includes
learning materials, instructional strategies, instructors, classroom implementations, and so
forth. The learning system transformer attempts to help students transform from the
initial state to the desired state.
Figure 1.3: The model used in the studies described in this dissertation.
Desired State of Student Knowing
Ψ
Learning System Transformer ε̂
Initial State of Student Knowing
Ψ0

5
To achieve insight into the student initial state, systematic research is needed. The
research results provide a fundamental basis to develop a systematic learning system
transformer. To be effective, the learning system transformer must “match” the student
initial state and be able to help transform it to the desired state, which is carefully
constructed. For example, the learning system transformer must correspond with the
model of student learning and must explicitly address student difficulties. After students
have been exposed to the learning system transformer, their understanding, as a final
state, must be investigated and assessed. The student final state could be the desired state,
but might not be. On the basis of the assessment results, combined with results of the
research into the student initial state, the learning system is modified, revised, or re-
designed. Then the new learning system transformer can interact with students and a new
cycle of this model begins. This dissertation illustrates studies, following this model, in
the context of work and energy. A primary goal of the research is to help students achieve
a desired state in which they grasp expert-like problem solving skills, in particular, the
capacity to use both qualitative and quantitative representations in solving work-energy
problems.
It is well known that students attempt to solve problems by matching quantities
listed in the problem statement to special equations that have been used to solve similar
problems. Students move between words and equations, which are very abstract
representations of the world, with no attempt to connect either representation to more
qualitative representations that improve understanding and intuition. Research [17, 18,
19] into how experts solve problems, however, has discovered that, in a typical procedure
of solving dynamics problems, physicists often draw a sketch, develop qualitative

6
physical representations, such as free-body force diagrams, and then apply mathematical
equations. Constructing the force diagrams can help experts conceptually understand the
problem and set up correctly mathematical equations of Newton’s laws. Therefore, to
help students develop expertise in problem solving, it is critical to help them learn how to
use qualitative representations, in particular, physical representations, in their problem
solving. This is not easy. First, it is very difficult to help students overcome the persistent
habit of using an equation-centered approach to solve problems, a result of traditional
instruction. Second, in many cases, such as in the context of work and energy, there is
lack of a good, pedagogical physical representation, which could be used by students to
understand work-energy problems conceptually and to set up the work-energy equation
correctly. Such physical representations may need to be invented first. Third, even in
cases such as dynamics, where good physical representations (e.g., free-body force
diagrams) already exist, without systematically learning why and how to use the free-
body force diagrams, students are unable to use these physical representations in solving
dynamics problems. It is essential to develop a reliable systematic learning system, which
explicitly addresses students’ difficulties and helps them actively acquire expert-like
problem-solving skills.
This dissertation reports a series of studies to develop and assess such a learning
system that attempts to help students develop expertise in solving work-energy problems.
Alan Van Heuvelen [20] developed a multiple-representation strategy for solving work-
energy problems. In this approach, he also developed qualitative work-energy bar charts
as a physical representation for work-energy processes. However, as a newly-developed
representation, is the work-energy bar chart effective from the point of view of

7
representation matter and pedagogy? What role does it play in solving work-energy
problems? What do students think about this new representation and the multiple-
representation technique? Is this approach helpful in getting students to understand the
concept of work-energy and to solve related problems? If so, how does learning this
strategy help students abandon a naïve, formula-centered method and develop expertise
in problem solving? To use the work-energy bar chart and the multiple-representation
technique to develop an effective, systematic learning system in student learning of the
context of work-energy, it is necessary and critical to investigate these questions.
In addition, as a part of the research effort to develop and assess this learning
system, the use of visualization was introduced to enhance student understanding of the
concept of internal energy. The multiple-representation technique recommends that two
touching surfaces involved in friction be included in the system. In this way, a gain in
internal energy of the system is counted, instead of a difficult calculation for work done
by the friction. It was found that students had difficulties understanding this abstract
concept of internal energy. They lacked a meaningful mental picture of it. But few studies
have been conducted to investigate and address the difficulties that introductory physics
students have with this concept. In this dissertation, a pair of model carts and an
experiment problem using a sandbag, with other learning materials, were developed and
used to help students visualize and understand this difficult concept of internal energy.
Overall, the research work conducted in this dissertation attempted to develop and
assess a systematic learning system that could help students develop expertise in solving
work-energy problems, to demonstrate a process for development and evaluation of new

8
pedagogical, physical representations in physics problem solving, and to present a
method to use visual aids in enhancing student learning.
1.1 Context of the Research
The concepts of work and energy constitute a fundamental part of mechanics,
which is a branch of the common course for university introductory physics. There is
considerable diversity in the way that physics faculty teach the work-energy portion.
There is also no qualitative physical representation (see more detailed discussions in
Section 2.1) to represent the conservation of energy involved in work-energy processes. It
is well known that most physics professors and teachers solving dynamics problems rely
on diagrammatic force representations—a free-body diagram or a force diagram. There
is, however, no similar representation for solving work-energy problems. As a physical
representation for work-energy processes, Alan Van Heuvelen [20] developed qualitative
work-energy bar charts, which serves the same role for analyzing work-energy processes
as motion diagrams and force diagrams serve when analyzing kinematics and dynamics
problems. Building on his work, a systematic investigation was conducted to probe how
naïve students solve work-energy problems, and a series of assessments was done to
evaluate student problem-solving performance after they were exposed to the new
representation technique. The investigations took place at The Ohio State University
(OSU) primarily with honors engineering freshmen in the calculus-based mechanics
course from 1997 through 1999.
Applying the approach in the context of work and energy, the concept of internal
energy is introduced, rather than having students deal with a difficult calculation of
“work done by friction”. Internal energy is also a key for helping students to understand

9
collisions, especially inelastic collisions. We found that many naïve students had
difficulties understanding this abstract concept. To help students visualize this difficult-
to-understand concept and develop a mental image of it, a guided-inquiry learning
activity using a pair of model carts and an experiment problem using a sandbag were
developed. These two studies also were conducted at OSU, but the former with the
honors engineering freshmen and the latter with regular calculus-based introductory
students.
1.2 Research Methods
To understand how students learn physics, the following methods are widely used
in physics education research:
1) Informal observations: Daily instructional interactions with students inside and
outside the classroom provide direct insight into how students learn and where they have
conceptual difficulties. Especially in the naturalistic setting of the classroom, there are
opportunities to observe, listen to, and communicate with relatively large numbers of
students. These informal observations often help initiate some interesting studies.
2) Individual student interviews: Learning and understanding is a very sophisticated
process. To understand deeply how students learn a particular topic, in addition to the
informal observations discussed above, formal individual student interviews are needed.
For example, the Physics Education Group at the UW uses individual demonstration
interviews, typically lasting 30 to 60 minutes, as the primary data source in investigations
of student understanding [15]. The interview demonstration, usually involving real
equipment, provides the context for the discussion between the interviewer and the
student. They have also found that they could learn more about the students’ ideas if the

10
student is asked to make predictions about a particular situation during the interview.
Through transcribing and analyzing interview data, students’ reasoning and difficulties
are identified.
For the research set forth in this dissertation, not only is the individual student
demonstration interview used, but also the think-aloud interview [21], which is widely
used in cognitive science and psychology. The think-aloud interview, often used for
problem solving tasks, typically intends to investigate what a subject thinks about while
he or she answers some questions. These two types of interviews differ primarily in the
following ways: 1) During the think-aloud interview, the subject is typically instructed to
verbalize aloud everything he or she is thinking from the very beginning until the task is
completed [21], while the student in the demonstration interview is usually instructed to
explain or describe their reasoning about a particular situation often after they have given
answers (see Table 1.1 for details). 2) After a task has been given to the subject, the
interviewer is not a part of the think-aloud interview, and communication between the
interviewer and the subject is minimized [21]. More social interactions and
communication between the interviewer and the student occur during the demonstration
interview, and the researcher participates more in the interview procedure. Some detailed
characteristics of both interviews are summarized in Figure 1.3.
3) Written tests: Carefully constructed written questions are also used to probe student
understanding. Compared to the interview technique, a written test has two distinct
advantages: 1) It is easy to administer to a large number of students; and 2) Data analysis
costs much less time and labor than that for interview data. However, it is sometimes
11
Demonstration Interview Think-Aloud Interview
Suitable for
Demonstration tasks
Written problem solving tasks
Procedures
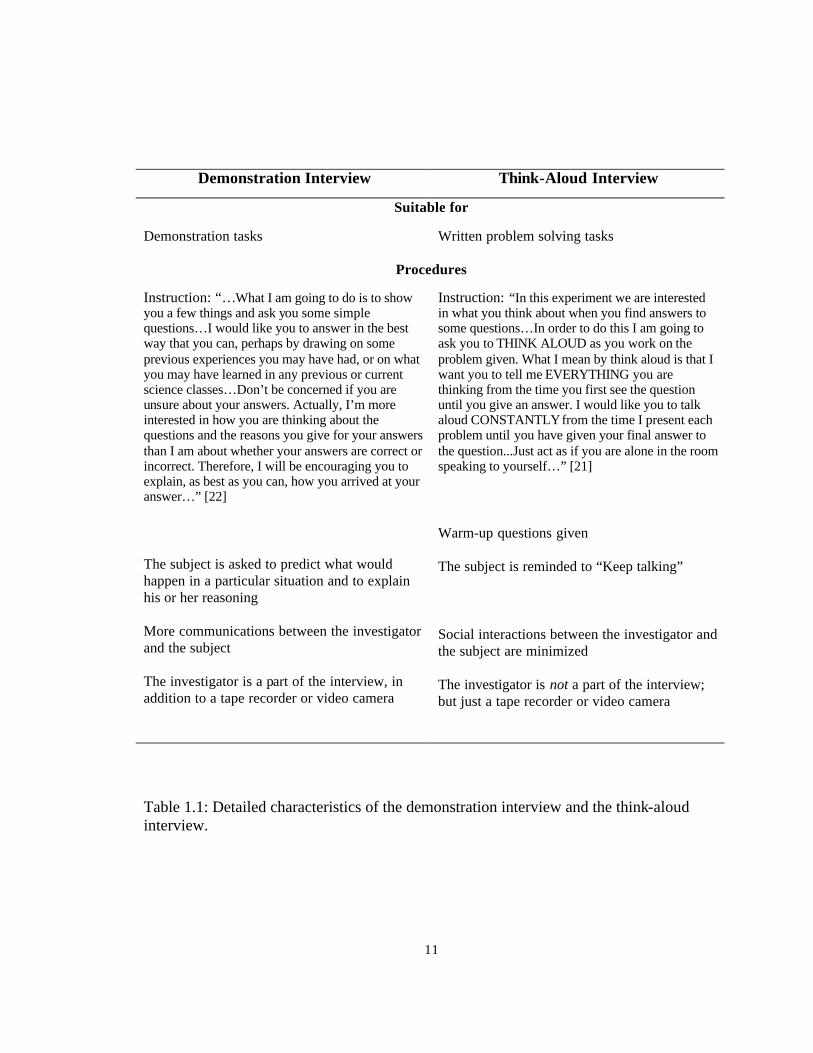
Instruction: “…What I am going to do is to show you a few things and ask you some simple questions…I would like you to answer in the best way that you can, perhaps by drawing on some previous experiences you may have had, or on what you may have learned in any previous or current science classes…Don’t be concerned if you are unsure about your answers. Actually, I’m more interested in how you are thinking about the questions and the reasons you give for your answers than I am about whether your answers are correct or incorrect. Therefore, I will be encouraging you to explain, as best as you can, how you arrived at your answer…” [22] The subject is asked to predict what would happen in a particular situation and to explain his or her reasoning More communications between the investigator and the subject The investigator is a part of the interview, in addition to a tape recorder or video camera
Instruction: “In this experiment we are interested in what you think about when you find answers to some questions…In order to do this I am going to ask you to THINK ALOUD as you work on the problem given. What I mean by think aloud is that I want you to tell me EVERYTHING you are thinking from the time you first see the question until you give an answer. I would like you to talk aloud CONSTANTLY from the time I present each problem until you have given your final answer to the question...Just act as if you are alone in the room speaking to yourself…” [21] Warm-up questions given The subject is reminded to “Keep talking” Social interactions between the investigator and the subject are minimized The investigator is not a part of the interview; but just a tape recorder or video camera
Table 1.1: Detailed characteristics of the demonstration interview and the think-aloud interview.

12
difficult to get deep, accurate understanding of student reasoning, thinking, or problem
solving skills from written test results.
To gain deep, comprehensive insight into student learning, all three techniques
above were used for the studies in this dissertation.
1.3 Overview of Dissertation
The dissertation consists of two parts, the main body and the appendices. The
main body describes the process of research and curriculum development, while the
appendices contain student interview data transcribed and original materials developed
during the investigation process.
Chapter 2 briefly reviews previous studies related to research about the concepts
of work and energy and functions of multiple representations and visualizations in
problem solving. Chapters 3-5 report the major studies set forth in this dissertation. Each
chapter basically consists of three parts: 1) an investigation that was conducted to identify
students’ initial difficulties (i.e., Ψ0 ), 2) development and implementation of learning
materials (i.e., ε̂ , a learning system transformer) that attempt to match the student initial
state, to address these difficulties, and to help students achieve the desired state of
understanding, and 3) assessment that was done to evaluate the effectiveness of these
learning materials by determining how the final state compared to the desired one (i.e.,
Ψ ). In particular, Chapter 3 discusses the use of multiple representations in student
problem solving in the context of work-energy, while Chapters 4 and 5 report the use of
visualizations to enhance student understanding of the concepts of internal thermal
energy and internal potential energy, respectively. The main body of the dissertation ends
with Chapter 6, which includes summary and conclusions.

13
ENDNOTES OF CHAPTER 1
1. McDermott, L. C., “Guest comments: How we teach and how student learn—A mismatch?” Am. J. Phys. 61, 295-298 (1993).
2. McDermott, L. C. and Redish, E. F., “Resource letter: PER-1: Physics education
research,” Am. J. Phys. 67, 755 (1999). 3. Carnevale, A. P., Gainer, L. J., and Meltzer, A.S., Workplace basics: The essential
skills employers want (Jossey-Bass Publishers, San Francisco, 1990). 4. ABET criteria 2000 documents can be downloaded from the ABET web site at
http://www.abet.org/downloads.htm. 5. “Shaping the future: New expectations for undergraduate education in science,
mathematics, engineering, and technology”. This document is a report on the review of undergraduate education from the Committee for the Review to the National Science Foundation Directorate for Education and Human Resources (1996), and can be downloaded from http://www.ehr.nsf.gov/ehr/due/documents/review/96139/start.htm.
6. Czujko, R., AIP Stat. Div., “Physics bachelors as a passport to the workplace: Recent
research results”. 7. Rosdil, D., “What are masters doing?” AIP Statistics Div., Pub.No. R-398.1, Sept.
1996. 8. McDermott, L. C., Shaffer, P. S., and the Physics Education Group, Tutorials in
introductory physics (Prentice-Hall, Inc., Upper Saddle River, New Jersey, 1998). 9. Van Heuvelen, A., “Experiment Problems for Mechanics,” Phys. Teach. 33, 176-180
(1995). 10. Van Heuvelen, A., Allen, L., and Mihas, P. “Experiment Problems for Electricity
and Magnetism,” Phys. Teach. 37, 482-485 (1999). 11. A set of these experiment problems are available on the OSU Physics Education
Research web site: http://www.physics.ohio-state.edu/~physedu/index2.html.

14
12. Andre, K. M., “Cooperative Learning: An Inside Story,” Phys. Teach. 37, 356-358 (1999).
13. Wittmann, M. C., Making sense of how students come to an understanding of
physics: An example from mechanical waves, Ph.D. dissertation, University of Maryland, 1998.
14. Wosilait, K., Research as a guide for the development of tutorials to improve student
understanding of geometrical and physical optics, Ph.D. dissertation, University of Washington, 1996.
15. McDermott, L. C., “Millikan Lecture 1990: What we teach and what is learned—
Closing the gap,” Am. J. Phys. 59, 301-315 (1991). 16. Van Heuvelen, A., “The Robert A. Millikan Award Lecture—Research about
physics learning, linguistics, our mind, and the workplace,” Announcer 29, 88 (Summer 1999).
17. Larkin, J., McDermott, J., Simon, D. P., and Simon, H. A., “Expert and novice
performance in solving physics problems,” Science 208, 1335-1362 (1980). 18. Larkin, J., “Cognition of learning physics,” Am. J. Phys. 49(6), 534-541 (1981). 19. Larkin, J., “Understanding, problem representations, and skill in physics” In S. F.
Chipman, J. W. Segal and R. Glaser (Eds.), Thinking and learning skills (Lawrence Erlbaum, Hillsdale, NJ, 1985), Vol. 2, pp. 141-159.
20. Van Heuvelen, A., Active Learning Problem Sheets (Hayden-McNeil Publishing,
Inc., Plymouth, Michigan, 1996). 21. Ericsson, K. A. and Simon, H. A., Protocol analysis: Verbal report as data (The
MIT Press, Cambridge, Massachusetts, 1996). 22. Goldberg, F., “Tasks to elicit subject’s knowledge,” unpublished material, San Diego
State University.

15
CHAPTER 2
REVIEW OF LITERATURE
Systematic investigations into student understanding of physics have blossomed
since the 1970’s. A large number of empirical studies done in the past three decades may
be categorized into three areas in terms of their primary emphasis: research about student
conceptual understanding and reasoning; research about student problem solving; and
research about student attitudes and beliefs [1]. Investigations of student difficulties in
conceptual understanding have been more comprehensively documented than those about
student problem solving or about beliefs and attitudes. Much of the research into student
conceptual understanding has been in kinematics, Newtonian dynamics, electric circuits,
and geometrical optics.
Some investigations into student problem solving in physics have been conducted
in psychology and cognitive science. A considerable number of studies report differences
between experts and novices in problem solving, in varied areas including physics topics
and games [e.g., 2, 3, 4, 5, 6]. Some of these research findings and the related theoretical
frameworks provide physics education researchers with a useful guide for investigating
how students learn physics and what works in physics instruction [7].
It is convenient to divide this chapter into three sections. The first section reviews
studies from the literature concerning student conceptual understanding of work-energy

16
concepts. The second section reviews published documents concerning the role of
external representations in problem solving. The last one is a brief summary.
2.1 Research on Student Understanding of Work and Energy
In this section, we first review some studies concerning student conceptual
understanding of the work-energy theorem and the conservation of energy principle.
Then we review research on student understanding of the internal energy produced during
inelastic collisions.
2.1.1 Research on Student Understanding of Conservation of Energy
The concepts of work and energy constitute a fundamental basis for physics at all
levels. In introductory physics, of course, work and energy forms a very important topic
of the course. However, compared to extensive studies about student understanding of
kinematics and Newton’s laws, few published documents address students’ difficulties in
understanding the concepts of work and energy.
R. A. Lawson and L. C. McDermott [8] from the Physics Education Group at the
UW investigated student understanding of the work-energy and momentum-impulse
theorems. The investigation probed the ability of introductory students to apply these
theorems in the analysis of a real motion. The researchers administered the demonstration
interviews, including an experimental set-up shown in Figure 2.1, to 28 introductory
students—16 from an algebra-based course and 12 from a calculus-based honors section.
Using the apparatus shown in Figure 2.1, the students were asked to compare the final
momenta and kinetic energies of two dry-ice pucks, one more massive than the other, that
move on a glass table. Equal forces are applied to the two pucks by a reversed vacuum
17
Figure 2.1: The set-up used by the researchers at the UW during individual demonstration interviews to investigate student understanding of work-energy and impulse-momentum theorems. cleaner as they move straight forward from line A to line B. Although those students
had completed the study of energy and momentum, only 50% of the honors students and
none of the algebra-based students were able to make a correct kinetic energy comparison
before the interviewer intervened.
The authors argued that a meaningful conceptual understanding was unlikely to
be achieved after standard instruction in which students learned passively. Many students
would miss some fundamentally important features of concepts that were not easily
visualized if they were presented only verbally, whether by textbook or in lecture. The
researchers claimed that it was necessary to engage students actively in making explicit
the connections between the algebraic formalism and real world applications.
A similar study was done by European researchers [9] with secondary school
students. The investigation indicates that at least 50% of the sample students (75 18-19
year old physics students from six London secondary schools) apparently lacked
B A
18
comprehension of the law of energy conservation—they could not apply this principle to
simple activities in real life, although they were able to make correct verbal statements.
For instance, one sample problem used in the research was: “The spring in a toy car was
wound up and the car let go on the floor. Why did the car stop after a while?” About 87%
of the students could not correctly explain this phenomenon.
2.1.2 Research on Student Understanding of the Concept of Internal Energy in Mechanics
The concept of internal energy is often introduced to students when they learn
about collisions and work done by friction. This is an important concept for students to
understand the principle of conservation of energy completely, but it is a very abstract
concept. Some studies have been done to investigate student understanding of this
abstract concept.
Uri Ganiel [10] developed a pair of model carts: one could be used to demonstrate
partially inelastic collisions during which “internal energy” is produced; the other one
could be used to represent elastic collisions during which “energy transfer into internal
energy” does not occur. Ganiel claimed that his model carts provided a nice visualization
for students to understand “where the kinetic energy goes,” but he did not show detailed
assessment data from students. The effectiveness and limitation of his model carts on
student understanding of the concept of internal energy are discussed in detail in Chapter
5.
A study by N. Grimellini-Tomasini and other researchers from Italy and Brazil
[11] was particularly interesting, since it focused on probing student’s understanding of
the role and meaning of both conservation of energy and conservation of momentum laws

19
in describing the same collision process. One student difficulty, which they documented
on the basis of data from a large and diverse population of students (in particular, from
fourteen- to sixteen-year-old students), was that students lacked a meaningful
understanding about what is transferred during a collision. Many students believed that in
a collision something was transmitted from the projectile to the target, but they did not
understand what the “something” was. Different students identified the “something”
differently, such as motion, energy, force, power, inertia, thrust, velocity, acceleration,
etc. For example, the researchers found that it was not difficult for students to realize that
a loss of the transmitted quantity may occur during the collision, but difficult for them to
give a meaning to the lost quantity. The “loss of energy” during the collision is often
justified by students in terms of the colliding objects’ mass, velocity, or a combination of
the two, rather than energy.
To help students conceptualize energy as the quantity transmitted during the
collision, the researchers introduced a visual aid (a spring bumper on a colliding body)
and helped students apply familiar concepts such as kinetic and potential energy to look
at what is transmitted during the collision. They found that this approach was accepted by
students without difficulty. Here is an example of student explanation:
“…kinetic energy is there before the collision; during the collision no, it’s less, after the collision it is there again. But it may always be there, except that it is absorbed by the spring (the spring bumper on one the colliding bodies) during the collision, as energy that the spring has.” [12] Additionally, it was discovered that students were unable to distinguish
conceptually between the concepts of energy and momentum. For instance, some
students believed that energy and momentum both were conserved in an elastic collision,
and that they both decreased in an inelastic collision.
20
Furthermore, the study indicated that in situations in which both energy
conservation and momentum conservation were applicable, students sometimes applied
first one law and then the other, rather than attempting a simultaneous solution that
satisfied both conditions. Even when students had mastered both conservation laws
separately, they exhibited great difficulty in attempting to solve real-life problems in
which they had to choose the approach to use and then make necessary approximations.
2.2 External Representations and Their Roles in Problem Solving
In this section, we first briefly review the nature of representation. Then the role
of external representations in human problem solving is discussed. This is followed by a
discussion of multiple representations in physics and their roles in problem solving.
2.2.1 Representation and Its Components
A representation is something that stands for something else [13]. This definition
of representation seems too simple, but its related issues are extremely sophisticated and
important. Many disciplines in science and social science, such as cognitive science,
psychology, philosophy, linguistics, education, neuroscience, artificial intelligence,
mathematics, chemistry, physics, and others, involve representation issues.
represents “go,” and a red traffic light represents “stop.” The symbol or the light here is a
kind of representation. Basically, any representation includes the following ingredients
[14, 15, 16]:
1) the represented world: that which is to be represented;
We live in a world full of representations. In real life, for example, it is common
to use the symbol “ ” to represent “man,” and “ ” for “woman;” a green traffic light
21
2) the representing world: a set of symbols, each standing for something in the
represented world;
3) what aspects of the represented world are being represented;
4) what aspects of the representing world are doing the representing; and
5) the correspondence between the two worlds.
These components of a representation are illustrated in an example (see Figure 2.2)
shown in Donald Norman’s book—Things That Make Us Smart [16]. In Figure 3.1, the
represented world is the real world in which there exist a tree, mountains, people, and a
ball, while the representing world is the drawing on the piece of paper at the bottom. In
the representing world, the two drawn symbols represent the tree and the mountains, and
the other objects, such as the ball and the people, are ignored. The spatial relation (e.g.,
the tree in front of the mountains) between the tree and the mountains is correspondingly
represented in the relation between the tree symbol and the mountain symbol in the
representing world (e.g. the tree symbol in front of the mountain symbol, but, for
example, not above the mountain symbol).
2.2.2 External Representations and Their Roles in Problem Solving
Why is representation important? Donald Norman [17] says: “without external
aids, memory, thought, and reasoning are all constrained.” An external representation is a
type of external aid to a human being and can assist people in problem solving.
External representations typically refer to 1) physical symbols, objects, or
dimensions (e.g., written symbols, beads of abacuses, shapes or sizes of graphs, etc.) and
2) external rules, constraints, or relations embedded in physical configurations (e.g.,

22
Figure 2.2: The represented and representing worlds. Symbols on the piece of paper at the bottom form the representing world and represent the real world at the top, the represented world.

23
spatial relations of written digits, physical constraints in an abacus, etc.) [18]. Without the
use of external representations, our modern human life would be impossible.
2.2.2.1 The Roles of External Representations in Problem Solving
Below, we briefly review some important roles of external representations in a
human’s reasoning and problem solving.
First, external representations aid human memory [18]. This might be the most
obvious function that external representations play. For example, symbols or words
written in one’s calendar book are external representations, and they aid one in
remembering daily events.
Second, diagrammatic representations sometimes help people recognize problem
features more easily and make inferences directly in problem solving. This role of
diagrams was shown in a study by Jill Larkin and Herbert Simon [19]. Some details of
this research are discussed in section 2.2.3.2.
Third, external representations can change the nature of tasks. Some studies
[16,18, 20] in cognitive science show that different forms of graphic displays or different
physical constraints for the same task can change the ease or difficulty of the task. One
simple example illustrated by Donald Norman [21] is shown in Figure 2.3: three different
types of drawings represent the same information—the populations of Tokyo and Beijing.
By how much is the population of Tokyo larger than that of Beijing? To answer this
question correctly (an estimated answer is that Tokyo is five times as large as Beijing),
the bar graph representation shown in Figure 2.3 makes it easier to answer than the other
two representations. Norman [21] explains this as a result of human beings being more
accurate in estimating line lengths than many other shapes.

24
(1) Circle graph
Beijing
Tokyo
(2) Pie graph
(3) Bar graph
Figure 2.3: The three different graphs represent the same information—population sizes in Beijing and Tokyo. To answer the question “By how much is the population of Tokyo larger than that of Beijing?” the bar graph is the easiest representation to answer this question.
Beijing
Tokyo
Tokyo Beijing

25
2.2.2.2 Basic Criteria for an Effective Instructional Representation
As discussed above, some representations can make the task easier for a solver,
but others can make it more difficult. This raises an interesting and important question
related to the research interest of this dissertation: What are effective representations that
can help students learn formal knowledge? Swiss psychologist Kurt Reusser [22]
indicates some basic criteria for evaluating the effectiveness of an instructional
representation.
1) A pedagogically effective representation should help students capture the
critical structural features of a problem. Feynman diagrams, widely used in quantum
physics, serve as a good example for this case. For instance, electron-proton scattering is
a very complex process, but a Feynman diagram vividly describes crucial features of the
scattering process.
2) An ideal representation should have an efficient form that reflects the
constraints of a problem, directs students to make inference, and allows them to evaluate
solutions of the problem.
3) An instructionally valuable representation should mediate between “ordinary
language, or the physical view of concrete objects,” and “canonical scientific languages
and conceptualizations” [22]. In other words, an ideal instructional representation should
help our minds make a bridge between concrete daily-life and the abstract scientific
domain; it should help students move more easily from the former to the latter.
The commonly used free-body force diagram in physics is an example of an ideal
pedagogical representation. The free-body diagrams for the problem (two boxes A and B
are pulled by a force F on a frictional surface) shown in Figure 2.4 not only show some
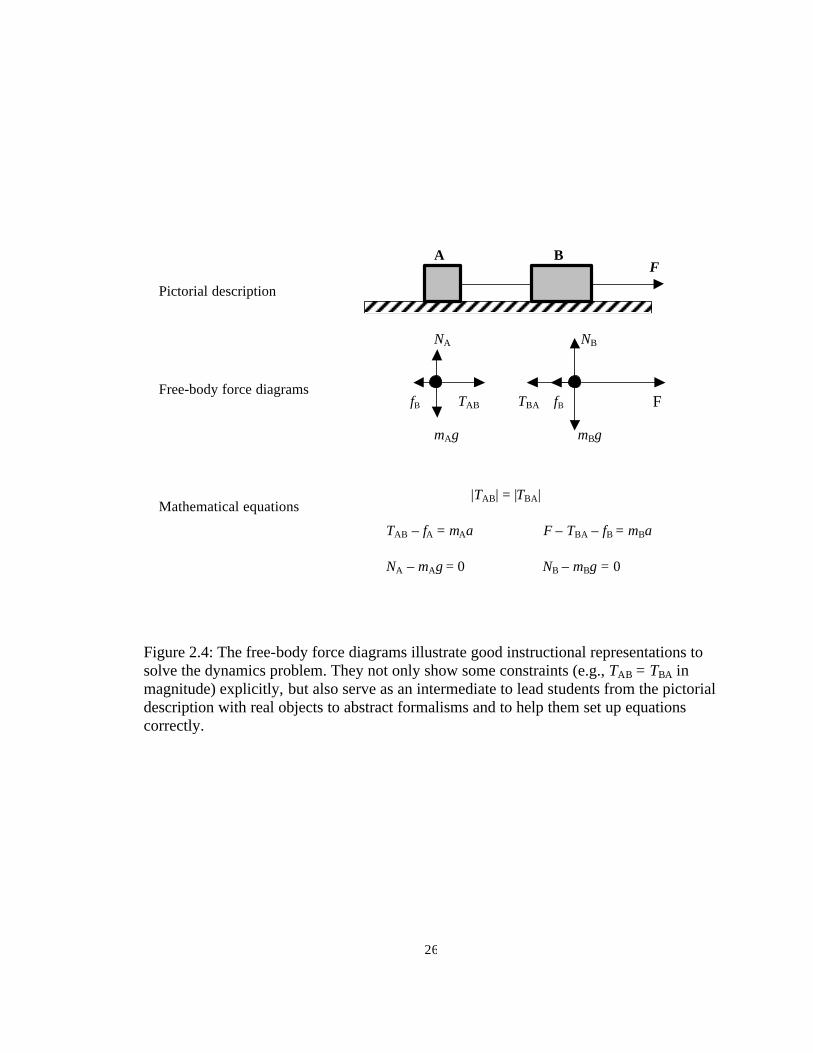
26
Figure 2.4: The free-body force diagrams illustrate good instructional representations to solve the dynamics problem. They not only show some constraints (e.g., TAB = TBA in magnitude) explicitly, but also serve as an intermediate to lead students from the pictorial description with real objects to abstract formalisms and to help them set up equations correctly.
F B A
Pictorial description
mBg
Free-body force diagrams TBA fB fB F TAB
mAg
NA NB
Mathematical equations |TAB| = |TBA|
TAB – fA = mAa F – TBA – fB = mBa
NA – mAg = 0 NB – mBg = 0

27
Figure 2.5: Two different motion diagrams representing a coin moving vertically upward. Motion diagram (b) represents better than motion diagram (a) the changing velocity and the relationship between velocity and acceleration. constraints (e.g., TAB = TBA in magnitude) explicitly, but also serve as an intermediate to
lead students from the pictorial description with real objects to abstract formalisms and to
help them set up equations correctly.
4) A proper representation should also supply students with simple and perceptual
information and reduce the demand for their mental reasoning. For instance, Figures 2.5
(a) [23] and (b) [24] show two different formats of a motion diagram representing a
simple physical process: a coin moving vertically upward. Motion diagram (b) represents
better than motion diagram (a) the changing velocity and the relationship between
velocity and acceleration.
2.2.3 Multiple Representations in Physics and Their Roles in Problem Solving External representations aid in human problem solving and reasoning in daily life.
They also represent formal knowledge and help transfer and disseminate such knowledge.
In physics, we use a variety of diagrams, graphs, sketches, and symbolic expressions such
~ ~
Position r
~ ~
Velocity v
Acceleration a (a)
a
y
0
v
v
(b)

28
as mathematical notations and equations, to help us understand the real world, to build
the body of knowledge, and to communicate with each other. All these diagrammatic and
symbolic expressions are external representations.
In her studies [6, 25, 26, 27] Jill Larkin categorizes physics problem
representations into four types: a verbal statement, a naïve representation, a physical
representation, and a mathematical representation. The verbal statement is simply a
problem statement in a natural language. The naïve representation is defined by Larkin as
a sketch that is composed of real-world objects (such as blocks, springs, pulleys) and
describes the problem situation in a real time order sequence [28]. In contrast, the
physical representation, very often used by physicists, contains more abstract physics
concepts (force, energy, momentum, etc.) and corresponds to physics laws (such as
Newton’s laws, conservation of energy, or conservation of momentum). An example is a
free-body diagram for solving dynamics problems [26]. These diagrams (the physical
representation) can aid in qualitative reasoning. For solving a work-energy problem (e.g.,
a block-sliding problem), an expert could have a qualitative understanding of the problem
as “The energy at C1 consists of kinetic energy…and potential energy determined by the
known height h1… ” [25], after he or she used a naïve representation but before applying
equations. In both naïve and physical representations, the inference rules are qualitative.
This is in contrast to quantitative equations, which are called mathematical
representations.
On the basis of Larkin’s work, Van Heuvelen [24, 29, 30] developed a multiple
representation technique to represent physics problems (see Figure 2.6). In his approach,
a typical physics problem is considered as a physical process, and this process

29
Multiple Representations in Kinematics
Verbal Representation
A car at a stop sign initially at rest starts to move forward with an acceleration of 2 m/s2. After the car reaches a speed of 10 m/s, it continues to move with constant velocity.
Pictorial Representation
Physical Representation (Motion Diagram)
Physical Representation (Kinematics Graphs)
Mathematical Representation For 0 < x < x1 and 0 < t < t1 For x1 < x and t1 < t x = 0 + 0 • t + (1/2)(2 m/s2) t2 x = x1 + (10 m/s) t v = 0 + (2 m/s2) t v = + 10 m/s
Figure 2.6: The kinematics process can be represented in verbal, pictorial, physical, and mathematical representations.
v1 = v2
Time
Position
t1 Time t1
Velocity
0
x
t2 = ? x2 = ? v2 = v1 = + 10 m/s
a01 = + 2 m/s2 t1 = ? x1 = ? v1 = + 10 m/s
t0 = 0 x0 = 0 v0 = 0
a12 = 0
0
v1 v
a01 a12 = 0
v
t1 Time
Acceleration

30
is represented in verbal, pictorial, physical, and mathematical representations, which are
similar to Larkin’s definitions except for the physical representation. Van Heuvelen
explicitly defines the physical representation as physical diagrams and graphs such as
motion diagrams, free-body diagrams, kinematics graphs, and others.
2.2.3.1 Differences in Problem Solving between Experts and Novices
In the past thirty years, substantial progress in cognitive science, psychology, and
physics education has been made in exploring and explaining differences in problem
solving between experts and novices. Researchers found that physicists and introductory
students use problem representations differently. Based on studies [6, 26, 27, 31] by Jill
Larkin, Herbert Simon, and other researchers, differences between expert and novice
performance in solving physics problems can be briefly summarized as:
1) Knowledge difference: experts know many things and can rapidly evoke the particular
items relevant to the problem at hand, but novices cannot.
2) Physicists categorize problems as they correspond to physics concepts and principles,
but novice students categorize problems as they correspond to surface features (inclined
planes, ropes, springs, etc.)
3) Skilled solvers usually solve problems by working forward—from given information
to the desired quantities. In contrast, inexperienced students solve problems backwards—
from the unknown variables to the given quantities.
4) A typical problem solving procedure by experts often includes three stages: drawing a
sketch, developing physical representations such as free-body diagrams, and applying
mathematical equations. On the other hand, beginning students usually jump directly

31
from either the problem statement or the naïve sketch to mathema tical formulas, without
the use of physical representations.
5) Skilled solvers often carry through as one single step from identifying the right
equation, substituting the values of the quantities in it, and solving for the unknown
variable. However, inexperienced solvers usually treat substituting values for variables
and solving the equation as distinct, separate steps. And also they often ask themselves
“What do I do next?” during problem solving and usually make a decision partly by
looking at the equations and partly by thinking about the problem goal or sub-goals.
The central difference in problem solving between experts and novices, according
to Jill Larkin [27], is that novices have much less ability than experts to construct or use
physical representations. Several empirical studies support her point. First, an
investigation done by Chi, et al. [31] shows that when beginning students were asked to
sort physics problems into categories, they use problem surface features such as inclined
planes, springs, or blocks, called naïve representations by Larkin, to group the problems.
In contrast, experts sorted the problems using deep structures of physics knowledge such
as energy problems or force problems, called physical representations by Larkin. In
addition, studies by Larkin et al. [6, 26, 27] have found that, by comparing problem
written solutions and think-aloud protocols from experts and novices when solving some
typical textbook kinematics and dynamics problems (see two examples in Figure 2.7),
skilled physicists generally first make sketch containing real objects in the problem
statement, then develop a physical representation such as a free-body force diagram, and
apply equations last. However, inexperienced students often jump directly either from the
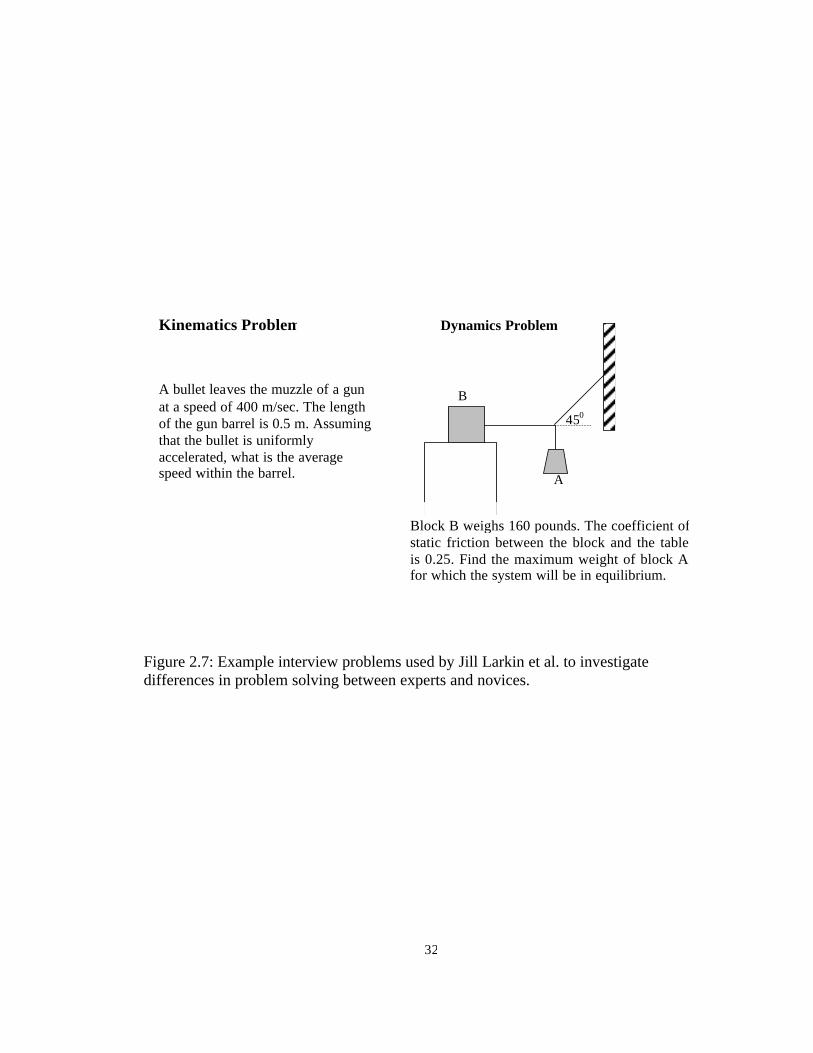
32
Figure 2.7: Example interview problems used by Jill Larkin et al. to investigate differences in problem solving between experts and novices.
Kinematics Problem A bullet leaves the muzzle of a gun at a speed of 400 m/sec. The length of the gun barrel is 0.5 m. Assuming that the bullet is uniformly accelerated, what is the average speed within the barrel.
450
B
A
Dynamics Problem Block B weighs 160 pounds. The coefficient of static friction between the block and the table is 0.25. Find the maximum weight of block A for which the system will be in equilibrium.
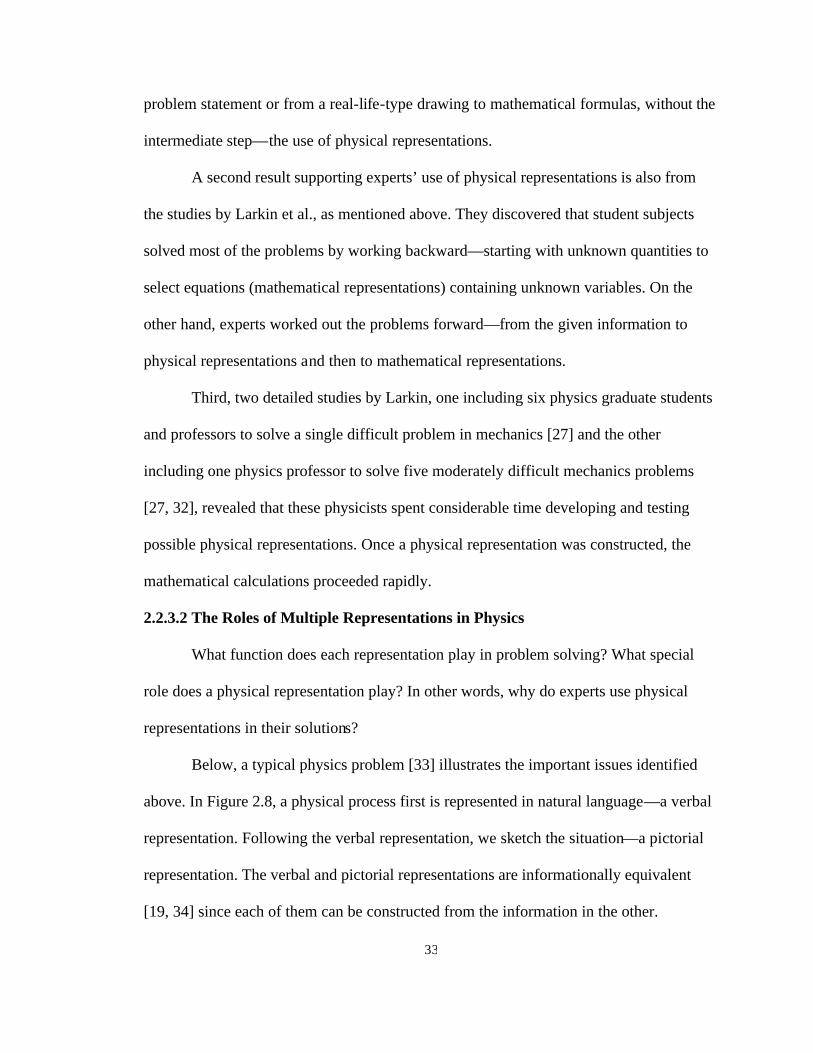
33
problem statement or from a real-life-type drawing to mathematical formulas, without the
intermediate step—the use of physical representations.
A second result supporting experts’ use of physical representations is also from
the studies by Larkin et al., as mentioned above. They discovered that student subjects
solved most of the problems by working backward—starting with unknown quantities to
select equations (mathematical representations) containing unknown variables. On the
other hand, experts worked out the problems forward—from the given information to
physical representations and then to mathematical representations.
Third, two detailed studies by Larkin, one including six physics graduate students
and professors to solve a single difficult problem in mechanics [27] and the other
including one physics professor to solve five moderately difficult mechanics problems
[27, 32], revealed that these physicists spent considerable time developing and testing
possible physical representations. Once a physical representation was constructed, the
mathematical calculations proceeded rapidly.
2.2.3.2 The Roles of Multiple Representations in Physics What function does each representation play in problem solving? What special
role does a physical representation play? In other words, why do experts use physical
representations in their solutions?
Below, a typical physics problem [33] illustrates the important issues identified
above. In Figure 2.8, a physical process first is represented in natural language—a verbal
representation. Following the verbal representation, we sketch the situation—a pictorial
representation. The verbal and pictorial representations are informationally equivalent
[19, 34] since each of them can be constructed from the information in the other.
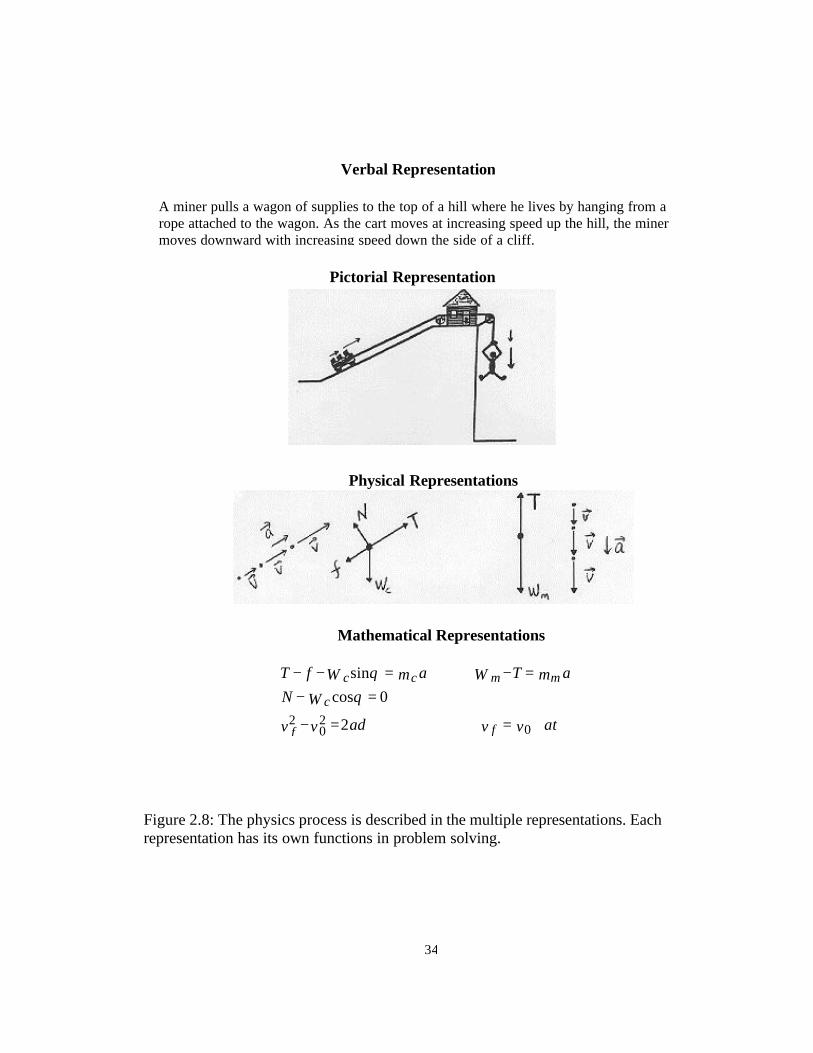
34
Figure 2.8: The physics process is described in the multiple representations. Each representation has its own functions in problem solving.
Verbal Representation
A miner pulls a wagon of supplies to the top of a hill where he lives by hanging from a rope attached to the wagon. As the cart moves at increasing speed up the hill, the miner moves downward with increasing speed down the side of a cliff.
Pictorial Representation
Mathematical Representations
atvvadvv
WNamTWamWfT
ff
c
mmcc
+==−
=−=−=−−
020
2 2
0cossinθ
θ
Physical Representations

35
Therefore, translating the verbal description into the sketch does not provide new
information. However, a study conducted by Larkin and Simon [19] reveals that pictorial
representations are superior to verbal representations for solving the problem in the
following two ways:
• Diagrams automatically aid in perceptual inferences, which are very easy for humans.
• Diagrams group together all interrelated information using location, thus avoiding a
large amount of searching for what is needed in problem solving.
These advantages of pictorial representations usefully and efficiently support one’s
reasoning in problem solving.
The pictorial representation includes all real objects such as the hill, the rope, the
wagon, the miner, and so on; but it does not have physics meaning. It describes the
physical process following a time flow. There is a considerable gap to move directly from
the pictorial representation to the mathematical representation(s) that corresponds to
physical laws and principles. This gap is filled by physical representations; and the
pictorial sketch is helpful for constructing the physical representations.
The physical representations in Figure 2.8 are consistent with the pictorial
representation and consist of both motion diagrams and free-body force diagrams for the
wagon and the miner. From the physical representations, one can see that the motion
diagrams are similar to the drawings (such as arrows) used to describe the motions of the
wagon and the miner in the pictorial representation, but the motion diagrams are body–
free—independent of the surface features of the real objects. This illustrates that the
pictorial representation may not be useful for directly constructing the mathematical
representation, but it is helpful in developing the physical representations. Similar to the

36
pictorial representation, the physical representations also have qualitative features and
diagrammatic formats. But they have some unique advantages in general [25], as listed
below:
• Physical representations have meanings in physics (e.g. force, velocity, acceleration,
etc.).
• They are closely associated with fundamental principles of physics (e.g. Newton’s
laws).
• They are often time-independent (e.g. constant acceleration, the directions of the
forces do not change, etc.)
The physical representations are extremely helpful in setting up the abstract mathematical
representations, which can provide quantitative results for the problem.
2.3 Discussion and Summary In summary, on the basis of the discussions in section 2.1, few studies have been
done to probe systematically student understanding and problem solving in the context of
work and energy. The published docume nts show that many students lack a deep
understanding of the concepts of work and energy and are unable to apply either the
work-energy theorem or the conservation of energy principle to real-life phenomena.
Standard instruction in which students passively observe demonstrations and problem
solving performed by instructors, is not an effective teaching model enabling most
students to visualize the abstract concepts of work and energy and to develop connections
between the algebraic formalism and real world applications.
To help students address these difficulties, innovative learning materials and
interactive instructional strategies are essential. Tutorials in Introductory Physics [35]

37
illustrates a successful model that uses the research-based curriculum and the interactive
engagement teaching technique to help students gain a meaningful conceptual
understanding and to develop scientific reasoning skills. For instance, after the tutorial
sections of energy and momentum [35], introductory physics students at the UW gained a
better conceptual understanding of the work-energy and impulse-momentum theorems
than they had after standard instruction, in terms of the student proportion of correctly
answering and reasoning about some conceptual questions [36].
The tutorials, a set of supplements to the lectures and textbook of a standard
introductory physics course, were developed with more emphasis on the development of
conceptual understanding and scientific reasoning skills, but did not emphasize the
development of student problem solving skills. A research-based, systematic learning
system in the context of work and energy is needed to help students build a solid
conceptual foundation and acquire expertise in problem solving.
As the studies reviewed in section 2.2 show, there is ample evidence that external
representations play very crucial roles in human problem solving. Herbert Simon [37]
says “Solving a problem simply means representing it so as to make the solution
transparent.” Problem solving in physics is such a case. The multiple representation
strategy developed by Van Heuvelen considers a typical problem as a physical process;
solving the problem means representing it in verbal, pictorial, physical, and mathematical
representations, rather than just figuring out some unknown numbers.
Many studies have been done to explore how and why experts and novices
perform differently in problem solving in many different disciplines. On the basis of
empirical research findings, some researchers (e.g., Larkin) argue that a central difference

38
between experts and novices in physics problem solving is the extent to which they can
use physical representations. Therefore, to help students develop expertise in problem
solving, it becomes significantly critical to help them learn how to use physical
representations in their problem solving. The next chapter illustrates a study to help
students learn to use a physical representation (i.e., the work-energy bar chart) and a
multiple-representation strategy to solve work-energy problems and to help them acquire
expert-like problem solving skills.

39
ENDNOTES OF CHAPTER 2
1. McDermott, L. C. and Redish, E., “Resource letter: PER-1: Physics education
research,” Am. J. Phys. 67, 755 (1999). This resource letter includes a comprehensive list of references on research in physics education.
2. De Groot, A. D., Thought and Choice in Chess (The Hague: Mouton, 1978), 2nd ed.. 3. Chase, W. G. and Simon, H. A., “Perception in chess,” Cognitive Psychology 4, 55-
81 (1973). 4. Hayes, J. R. and Simon, H. A., “Psychological differences among problem
isomorphs,” In N. J. Castellan, D. B. Pisoni, and G. R. Potts (Eds.), Cognitive Theory (Lawrence Erlbaum Associates, Hillsdale, NJ, 1977), Vol. 2, pp. 22-41.
5. Simon, D. P. and Simon, H. A., “Individual differences in solving physics
problems,” In R. Siegler (Ed.), Children’s Thinking: What develops? (Lawrence Erlbaum Associates, Hillsdale, NJ, 1978), pp. 325-348.
6. Larkin, J., McDermott, J., Simon, D. P., and Simon, H. A., “Expert and novice
performance in solving physics problems,” Science 208, 1335-1362 (1980). 7. Redish, E., “Implications of cognitive studies for teaching physics,” The American
Journal of Physics 62, 796-803 (1994). 8. Lawson, R. A. and McDermott, L. C., “Student understanding of the work-energy
and impulse-momentum theorems,” Am. J. Phys. 55, 811-817 (1987). 9. Goldring, H. and Osborne, J., “Students’ difficulties with energy and related
concepts,” Physics Education 29, 26-31, 1994. 10. Ganiel, U., “Elastic and inelastic collisions: A model,” Phys. Teach. 30, 18-19
(1992). 11. Grimellini-Tomasini, N., Pecori-Balandi, B., Pacca, J. L. A., and Villani, A.,
“Understanding conservation laws in mechanics: Students’ conceptual change in learning about collisions,” Science Education 77, 169 (1993).

40
12. See Ref. 11, p. 179. 13. Plamer, S. E., “Fundamental aspects of cognitive representation,” In E. Rosch and B.
B. Lloyd (Eds.), Cognition and categorization (Lawrence Erlbaum Associates, Hillsale, NJ, 1978), p. 262.
14. See Ref. 13, pp. 259-303. 15. Kaput, J. J., “Representation and problem solving: Methodological issues related to
modeling,” E. A. Silver (Ed.), Teaching and Learning Mathematical Problem Solving: Multiple Research Perspectives (Lawrence Erlbaum Associates, Hillsale, NJ, 1985), pp. 381-398.
16. Norman, D. A., Things that make us smart (Addison-Wesley Publishing Company,
1993), p. 49. 17. See Ref. 16, p. 43. 18. Zhang, J., “The nature of external representations in problem solving,” Cog. Sci. 21,
179-217 (1997). 19. Larkin, J. and Simon, H. A., “Why a diagram is (sometimes) worth ten thousand
words,” In H. A. Simon, Models of Thought (Yale University Press, New Haven, 1989), Vol. II, pp. 413-437.
20. Zhang, J. and Norman, D. A., “Representations in distributed cognitive tasks,” Cog.
Sci., 18, 87-122 (1994). 21. See Ref. 10, pp. 94-95. 22. Reusser, K., “Tutoring Systems and pedagogical theory: Representational tools for
understanding, planning, and reflection in problem solving,” In S. P. Lajoie and S. J. Derry (Eds.), Computer as Cognitive Tools (Lawrence Erlbaum, Hillsdale, NJ, 1993).
23. Plotzner, R., The Integrative Use of Qualitative and Quantitative Knowledge in
Physics Problem Solving (Peter Lang, Frankfurt am Main, 1994), p. 39. 24. Van Heuvelen, A., Active Learning Problem Sheets: Mechanics (Hayden-McNeil
Publishing, Inc. Plymouth, Michigan, 1996). 25. Larkin, J., “The role of problem representation in physics,” In D. Gentner and A. L.
Stevens (Eds.), Mental models (Lawrence Erlbaum, Hillsdale, NJ, 1983), pp. 75-98. 26. Larkin, J., “Cognition of learning physics,” Am. J. Phys. 49(6), 534-541 (1981).

41
27. Larkin, J., “Understanding, problem representations, and skill in physics” In S. F. Chipman, J. W. Segal and R. Glaser (Eds.), Thinking and learning skills (Lawrence Erlbaum, Hillsdale, NJ, 1985), Vol. 2, pp. 141-159.
28. See Ref. 25, p. 75. 29. Van Heuvelen, A., “Overview Case Study Physics,” Am. J. Phys. 59, 898-907
(1991). 30. Van Heuvelen, A., “Learning to think like a physicist: A review of research-based
instructional strategies,” Am. J. Phys. 59, 891-897 (1991). 31. Chi, M. T. H., Feltovich, P. J., and Glaser, R., “Categorization and representation of
physics knowledge by expert and novices,” Cog. Sci. 5, 121-152 (1981). 32. Larkin, J. H., “Skilled problem solving in physics: A hierarchical planning
approach,” Journal of Structured Learning 6, 121-130 (1980). 33. This problem is originally from A. Van Heuvelen, Active Learning Problem Sheets:
Mechanics (Hayden-McNeil Publishing, Inc. Plymouth, Michigan, 1996), p. II-21. 34. Simon, H. A., “On the forms of mental representation,” In C. W. Savage (Ed.),
Minnesota studies in the philosophy of science (University of Minnesota Press, Minneapolis, Minnesota, 1978), Vol. IX, Perception and cognition: Issues in the foundations of psychology.
35. McDermott, L. C., Shaffer, P. S., and the Physics Education Group of University of
Washington, Tutorials in introductory physics (Prentice Hall, Upper Saddle River, New Jersey, 1998), preliminary ed.
36. O’Brien Pride, T., Vokos, S. and McDermott, L. C., “The challenge of matching
learning assessments to teaching goals: An example from the work-energy and impulse-momentum theorems,” Am. J. Phys. 66, 147-157 (1998).
37. Simon, H. A., The sciences of the artificial (MIT Press, Cambridge, MA, 1981), 2nd
ed..

42
CHAPTER 3
MULTIPLE REPRESENTATIONS OF WORK-ENERGY PROCESSES
Based on the previous research discussed in Chapter 2, it is clear that a major
difference in problem solving between experts and novices is that experts integrate
qualitative representations into their reasoning and understanding processes when they
solve problems, but novices do not (see Section 2.2.3.1). Thus, to help naive students
acquire expertise in problem solving, we need explicitly to help them learn a systematic
problem-solving strategy using multiple representations, especially qualitative
representations, in solving physics problems.
This chapter is composed of four parts. The first part discusses investigations into
student difficulties using qualitative and quantitative representations in solving work-
energy problems. Written test questions and individual student interviews are illustrated
in detail. The second part describes how to develop a multiple-representation approach to
represent work-energy processes and how to help students learn this strategy to solve
work-energy problems. This is followed by extensive assessment results describing the
effectiveness of this multiple-representation method in student understanding and
problem solving in work-energy. This chapter ends with discussion and summary.

43
3.1 Investigation of Students’ Difficulties Using Qualitative and Quantitative Representations in Work-Energy Problem Solving
It is well known that students attempt to solve problems by matching quantities
listed in the problem statement to special equations that have been used to solve similar
problems [1]. Students move between words and equations, which are very abstract
representations of the world, with no attempt to connect either representation to more
qualitative representations that improve understanding and intuition. However, few
studies have been done to investigate how students solve work-energy problems from a
perspective of problem representation. To explore this research question, we carefully
analyzed students’ solutions on three written-test work-energy problems and conducted
in-depth individual student interviews.
3.1.1 Written Test Questions (Autumn 1997 and Winter 1999)
To investigate how students solve work-energy problems using different
representations, we consider a physics problem as a physical process. A physical process
can be represented in verbal, pictorial, physical, and mathematical representations, which
were discussed in detail in Chapter 2. Following this multiple-representation problem-
solving strategy, we carefully analyzed some students’ final exam solutions of work-
energy problems from an OSU calculus-based introductory physics course (Physics 131)
in the autumn quarter of 1997 and in the winter quarter of 1999.
3.1.1.1 Student Use of Physical and Mathematical Representations in Solving a Work-Energy Problem (Roller-Coaster Problem, Autumn 1997)
In autumn 1997, we collected some students’ final examination solutions from the
Physics 131 class. This ten-week class covered the regular concepts of mechanics:

44
kinematics, Newton’s dynamics, work-energy, momentum, and some rotational
dynamics. The work-energy concepts were taught in a standard way: The concept and
mathematical expression of each type of energy was introduced first. Then, the
conservation of energy principle was explored. After this, students practiced solving
standard work-energy problems quantitatively. They worked with the work and energy
concepts for about five lecture periods, four recitation periods, two laboratory periods,
and in their homework assignments. We collected solutions for the final examination
from twenty-seven students in one typical recitation section of Physics 131 and carefully
analyzed their performances on a work-energy problem (see Figure 3.1. The problem was
written by the course instructor).
Question (a) of the problem shown in Figure 3.1 asked for a simple calculation of
the potential energy of car at point A, B, and C, based on the definition of gravitational
potential energy. For research interest, we carefully analyzed students’ responses to
questions (b) and (c) from a perspective of multiple representations. Since the problem
was given in words with a detailed sketch, we looked carefully at how students used
physical and mathematical representations when answering questions (b) and (c). Here
the physical representation could be a free-body force diagram or any other type of
physics-like graphical representation. About the mathematical representation, we
distinguished it into two types, algebraic and numerical representations. An algebraic
representation was a symbolic equation or expression, while a numerical representation
was a mathematical equation or description using the Arabic numerals. For example,
applying the conservation of energy principle for solving question (b) shown in Figure
3.1, one could use two different types of mathematical equations that were consistent

45
Figure 3.1: The work-energy problem (roller-coaster problem) given on the Physics 131 final examination in the autumn quarter of 1997.
An 800 kg car rides along the path shown below. It starts from rest at point A and rolls along until it comes to rest at point C. There is a constant force of friction acting on the car. Unfortunately, we don’t know what the coefficient of friction is. The distance along the path from point A to point B is 20.0 m, while the distance along the path from point B to point C is 10.0m.
(a) What is the potential energy of the car at points A, B, and C, assuming that the level surface is at y = 0, and U = 0 there?
(b) What is the magnitude of force of friction the road exerts on the car? (c) What is the speed of the car at point B?
X
Y
8.0m
5.0m
15.0m C
B
A

46
with the conservation of energy principle:
(1) mghA = mghC + Ff d,
(2) (800 kg)(9.8 m/s2)(15.0) = (800 kg)(9.8 m/s2)(8.0) + Ff (20 m + 10 m), or
(3) 117600 = 62720 + Ff d.
Equation (1) above was an example of the algebraic representation, while equation (2)
showed an instance of the numerical representation. When analyzing the students’
solutions, we found that some students wrote the energy conservation equation in the
format of equation (3). We identified it as a type of the numerical representation as well.
(The differences between the algebraic and numerical representations and their roles in
problem solving are discussed in detail in Section 3.1.2) Summaries of the students’
solutions to questions (b) and (c) are reported in Tables 3.1 and 3.2.
3.1.1.2 Discussion of Student Use of Physical and Mathematical Representations in Solving the Roller-Coaster Problem The problem shown in Figure 3.1 was a typical moderately difficult problem. We
considered a student’s solution of question (b) or (c) as a correct one when it had a
correct set-up (i.e., the correct conservation of energy equation) and each quantity in the
energy equation had its correct value. We counted a solution correct if it had the correct
physics, but contained simple calculation errors.
From Table 3.1 we saw that out of twenty-seven students, sixty-two percent
answered the question (b) correctly, nineteen percent answered it incorrectly, and
nineteen percent either had no answers or had unclear ones. Overall, however, only about
eight percent (two students) drew a free-body diagram on their solutions. (The two force
diagrams they drew were not correct in terms of the number of forces exerting on the car
or the force directions.) No other types of physical representations were used in the
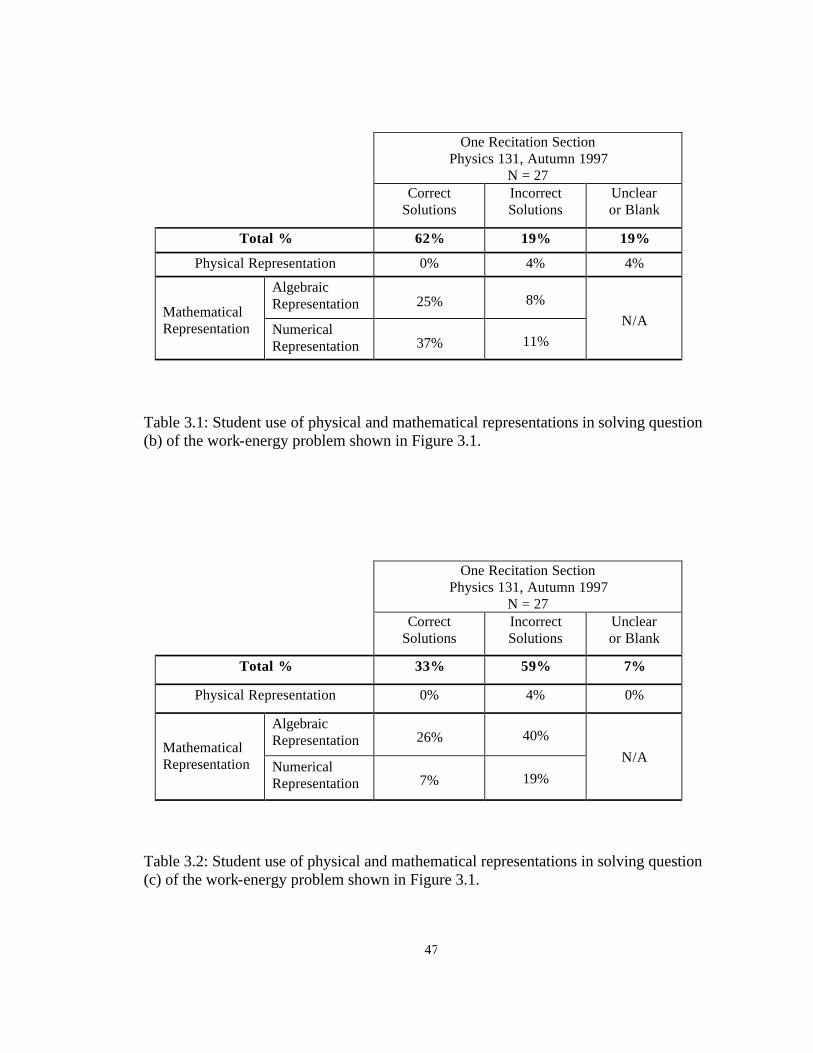
47
One Recitation Section Physics 131, Autumn 1997
N = 27
Correct Solutions
Incorrect Solutions
Unclear or Blank
Total % 62% 19% 19%
Physical Representation 0% 4% 4%
Algebraic Representation
25%
8%
Mathematical Representation Numerical
Representation
37%
11%
N/A
Table 3.1: Student use of physical and mathematical representations in solving question (b) of the work-energy problem shown in Figure 3.1.
One Recitation Section Physics 131, Autumn 1997
N = 27
Correct Solutions
Incorrect Solutions
Unclear or Blank
Total % 33% 59% 7%
Physical Representation 0% 4% 0%
Algebraic Representation
26%
40%
Mathematical Representation Numerical
Representation
7%
19%
N/A
Table 3.2: Student use of physical and mathematical representations in solving question (c) of the work-energy problem shown in Figure 3.1.

48
students’ solutions. There could be several reasons for no use of physical representations
in the students’ solutions. First, there was not a good physical representation for
representing work-energy processes. Solving dynamics problems relied on a free-body
diagram or a force diagram. There was, however, no similar physical representation for
solving work-energy problems. The students did not learn physics-like diagrams to help
them in work-energy problem solving. Second, although the students did learn the free-
body diagram in dynamics, the role it played in problem solving usually was not
emphasized enough. The students could consider that drawing a force diagram was a
redundant step. Without the mastery of a systematic, coherent multiple-representation
strategy to solve physics problems, the students could not realize that a physical
representation such as a force diagram acted as a bridge between the verbal and the
mathematical representations and could help them move in smaller and easier steps from
words to equations. Third, with the time pressure needed to complete an examination, the
students skipped steps, which they felt were not needed to complete the solution.
The results in Table 3.1 also showed that among sixty-two percent of the students
who solved question (b) correctly, twenty-five percent started to solve the question (b)
with the generalized work-energy equation (called an algebraic representation) such as
equation (1) shown in Section 3.1.1.1; but thirty-seven percent started with the work-
energy equation including numbers (called a numerical representation) like equation (2)
or (3) shown in Section 3.1.1.1. Among nineteen percent of them who could not solve
question (b) correctly, eight percent set up the generalized work-energy equation and
eleven percent started with the work-energy equation including numbers. Overall, about
half of the students just played number games in their solutions.
49
In Table 3.2, we saw that only thirty-three percent of the twenty-seven students
correctly solved question (c) shown in Figure 3.1. Students’ primary difficulties were
identified as: 1) not including the work done by friction; 2) confusion about the sign of
the work done by friction; and 3) not counting in the gravitational potential energy of the
car-earth system at point B.
Again, few students used a physical representation in their solutions. But more
students started with the generalized work-energy equation to answer question (c) than to
answer question B. Among the thirty-three percent of the students who correctly solved
question (c), twenty-six percent started with the algebraic representation. Among the
fifty-nine percent of them who incorrectly solved the question, forty percent started with
the algebraic representation.
In summary, not surprisingly, we found that students used an equations-centered
approach to solve the work-energy problem. There was a lack of a systematic and
coherent multiple- representation strategy that could help them develop expertise in
work-energy problem solving. In addition, it appeared that many students just played
with numbers in their solutions. It was interesting to study what functions an algebraic
representation and a numerical representation played in problem solving. This issue is
addressed in Section 3.1.2.5.
3.1.1.3 Student Use of Pictorial Representations in Solving Two Work-Energy Problems (Block-Spring Problem and Incline-Loop Problem, Winter 1999) If a work-energy process was only described in words without a sketch, did
students draw a picture or a sketch to help them understand and solve the problem? To
answer this question, we analyzed students’ solutions of two written questions on the
final examination for Physics 131 in the winter quarter of 1999 at OSU. This was a
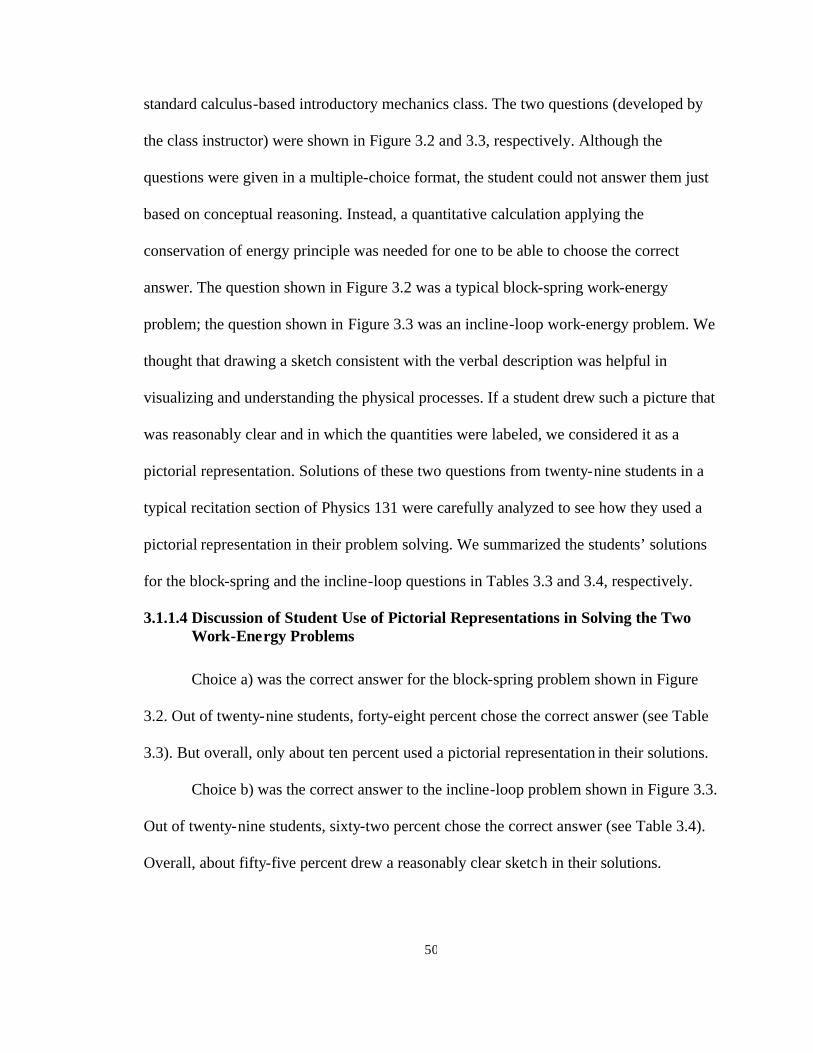
50
standard calculus-based introductory mechanics class. The two questions (developed by
the class instructor) were shown in Figure 3.2 and 3.3, respectively. Although the
questions were given in a multiple-choice format, the student could not answer them just
based on conceptual reasoning. Instead, a quantitative calculation applying the
conservation of energy principle was needed for one to be able to choose the correct
answer. The question shown in Figure 3.2 was a typical block-spring work-energy
problem; the question shown in Figure 3.3 was an incline-loop work-energy problem. We
thought that drawing a sketch consistent with the verbal description was helpful in
visualizing and understanding the physical processes. If a student drew such a picture that
was reasonably clear and in which the quantities were labeled, we considered it as a
pictorial representation. Solutions of these two questions from twenty-nine students in a
typical recitation section of Physics 131 were carefully analyzed to see how they used a
pictorial representation in their problem solving. We summarized the students’ solutions
for the block-spring and the incline-loop questions in Tables 3.3 and 3.4, respectively.
3.1.1.4 Discussion of Student Use of Pictorial Representations in Solving the Two Work-Energy Problems
Choice a) was the correct answer for the block-spring problem shown in Figure
3.2. Out of twenty-nine students, forty-eight percent chose the correct answer (see Table
3.3). But overall, only about ten percent used a pictorial representation in their solutions.
Choice b) was the correct answer to the incline-loop problem shown in Figure 3.3.
Out of twenty-nine students, sixty-two percent chose the correct answer (see Table 3.4).
Overall, about fifty-five percent drew a reasonably clear sketch in their solutions.

51
Figure 3.2: The work-energy problem (block-spring problem) appeared on the Physics 131 final examination in the winter quarter of 1999.
One recitation Section Physics 131, Winter 1999
N = 29
Correct choice Incorrect choice Total %
Total % 48% 52% 100%
Pictorial representation 10% 0% 10%
Some drawing but not good enough or no sketch
38% 52% 90%
Table 3.3: Student use of a pictorial representation when answering the problem shown in Figure 3.2.
A 2.0 kg block slides across a frictionless surface and collides with a massless spring with a spring constant of 30 N/m. The block compresses the spring by 12 cm from its rest position. What was the kinetic energy in joules of the block just before it impinged on the spring.
a) 0.22 b) 0.44 c) 3.6 d) 0.47 e) none of the above
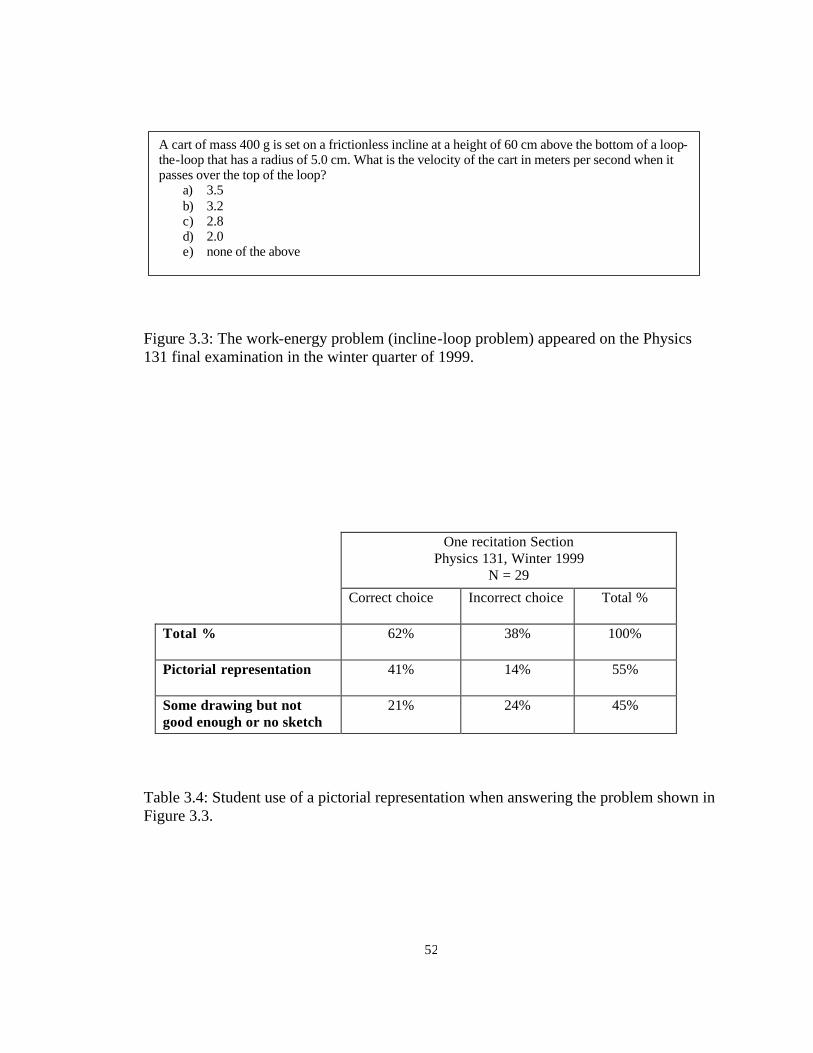
52
Figure 3.3: The work-energy problem (incline-loop problem) appeared on the Physics 131 final examination in the winter quarter of 1999.
One recitation Section Physics 131, Winter 1999
N = 29
Correct choice Incorrect choice Total %
Total % 62% 38% 100%
Pictorial representation 41% 14% 55%
Some drawing but not good enough or no sketch
21% 24% 45%
Table 3.4: Student use of a pictorial representation when answering the problem shown in Figure 3.3.
A cart of mass 400 g is set on a frictionless incline at a height of 60 cm above the bottom of a loop-the-loop that has a radius of 5.0 cm. What is the velocity of the cart in meters per second when it passes over the top of the loop?
a) 3.5 b) 3.2 c) 2.8 d) 2.0 e) none of the above

53
Although these two problems had different surface features, they were both
simple work-energy problems and could be answered by directly applying the
conservation of energy principle. But it was interesting to find that about fourteen percent
more students answered the incline-loop problem correctly than answered the block-
spring problem correctly. Also, about thirty-one percent more students drew a sketch in
their correct solutions for the incline-loop question than in the correct solutions for the
block-spring problem. It seemed that it was more difficult for the student to create a
mental picture about the physical process described in the incline-loop problem than that
in the block-spring problem. So the student needed to draw an external pictorial
representation to help him or her visualize and understand the problem. Drawing a picture
appeared to be helpful to the student in answering the problem correctly. But we also
found that many students were not accustomed to drawing an effective sketch in their
problem solving. A major student difficulty we discovered was that some students did not
label the values of relevant quantities in their sketches. As a result, such a sketch could be
less helpful to the student in understanding the problem than a sketch with valuables
labeled.
3.1.1.5 Discussion of Written Test Results
On the basis of student performance on the three test problems discussed above, it
was seemly fair to summarize that:
1) Students seldom used any qualitative, physical representation in solving the work-
energy problem. There was a lack of an effective physical representation for work-energy
processes and a lack of a systematic, coherent multiple-representation strategy to help
students develop expertise in problem solving.

54
2) Students used pictorial representations in their problem solving. It appeared more
natural for students to draw a picture than to use a physical representation. Since a
physical representation had special physics meanings, students needed to learn how to
construct and use it. A pictorial representation, however, included real-life objects and
situations. It was not difficult for most students to draw such a sketch based on their real-
life experience. But we found that some students did not indicate any physics quantities
and/or their values in their sketches. A drawing without any labels that had physics
meanings would not be as effective as one with physics meanings in helping reason about
the problem.
3) Students primarily relied on mathematical representations to solve quantitative
problems. It was interesting to find that some students set up the generalized work-energy
equation (i.e., algebraic representation) first and then plugged in numbers, but a
considerable number of students started at the very beginning with plugging in numbers
to every known quantity, separately calculated out each related concept such as kinetic
energy, gravitational potential energy and so forth, and assembled these numerical results
together to have an energy-conservation equation (i.e. numerical representation). It was
interesting to probe what functions algebraic and numerical representations play in
students’ problem solving, which was an undocumented issue.
3.1.2 Think-Aloud Individual Student Interviews (Autumn 1999)
In the autumn quarter of 1999 at OSU, think-aloud individual student interviews
were conducted to investigate how students solved work-energy problems. For research
interest, the interview was designed to investigate 1) how students solved work-energy
problems from a perspective of problem representations before formally learning the
55
work-energy concepts; 2) how they used a physical representation without completely
understanding its roles in problem solving; and 3) what differences existed if a student
started with the generalized work-energy equation or with a numerical work-energy
equation to answer certain questions.
Fourteen honors engineering freshmen students from an introductory calculus-
based mechanics class (Physics 131E) participated in the interviews on a voluntary basis.
By the time of the interview, the student had been exposed to the concepts of kinematics
and dynamics but not the concepts of work and energy (but all fourteen students were
exposed to the context of work and energy in their high school physics classes). So this
interview was called the pre-interview in this section.
The student was told that the interview aimed to improve the teaching and
learning of physics in the introductory classes; their performance on interview questions
would not affect their class grades. Each participant was paid a small amount of money
for his/her help and time.
3.1.2.1 Interview Setup and Procedure
During the interview, the student first was instructed how to keep talking about
what they were thinking while solving the interview problems. To let the subject become
comfortable with this thinking-aloud approach, the student was given three warm-up
exercise questions (see Appendix A).
After getting comfortable with how to talk aloud while solving the problem, the
student was given an equation sheet with the definitions of different kinds of energy (see
Appendix A). The mathematical expression for each type of the energy was explained to
the subject by means of a demonstration. For example, to help the subject understand
56
kinetic energy, we showed the student a moving toy car, which had the kinetic energy.
For understanding elastic potential energy, we showed the student a compressed and a
stretched spring, which had elastic potential energy.
After helping the student review the basic concepts of work and energy, we
introduced the work-energy bar chart and gave the student a short tutorial on it. The
work-energy bar chart (see Figure 3.10) is a bar graph describing the conservation of
energy for work-energy processes. It has the fundamental features of a physical
representation (see more details in Section 3.2.1.) We instructed the student on the
meaning of each term in the bar chart and showed him or her the structure of the bar
chart, which represented the conservation of energy for a work-energy process. We also
showed how to draw a bar under a particular type of energy, which qualitatively
represented a certain amount of the energy. The student was informed that the sum of the
height of bars on the left should equal the sum of the height of bars on the right, which
qualitatively represented the conservation of energy. But we did not explicitly teach the
student how to use the work-energy bar chart in solving a work-energy problem. After
this introductory part of the interview, the student started to solve three interview
problems (see Appendix B).
Notice that, of fourteen students, twelve were given the problems with the work-
energy bar chart, as shown in Appendix B. Two students, randomly selected on arriving
at the site, were given three similar problems but without the work-energy bar chart (see
Appendix C). These two students did not receive the tutorial on the work-energy bar
chart during the introduction.
57
3.1.2.2 Interview Problems
Below are the three interview problems shown in Appendix B:
Problem 1: It consisted of two parts. The first part was a verbal problem
statement and a sketch consistent with the statement. The second part included four
questions. The problem statement and the four questions were written on five separate
cards. They were placed face down and piled in the order of the problem statement,
Question 1.0, Question 1, Question 2, and Question 3. The student was instructed to flip
over each card and to answer each question in order. When the subject felt satisfied about
his or her answer, he or she could go to the next question on the card.
Problem 2: It consisted of two parts as well. The first part was a problem
statement including a verbal description of a physical process, a sketch consistent with
the description, and a work-energy bar chart. The second part consisted of three
questions. Similarly, the problem statement and the three questions were written on four
separate cards. They were placed face down and piled in the order of the problem
statement, Question 1, Question 2, and Question 3. The student was instructed to flip over
each card and to answer each question in order. When the subject felt satisfied about his
or her answer, he or she could go to the next question on the card.
Problem 3: It also consisted of two parts. The first part was a problem statement
including a verbal description of a physical process, as well as a sketch and a completed
work-energy bar chart, which were consistent with the physical process described in the
verbal statement. The second part consisted of three questions. Similarly, the problem
statement and the three questions were written on four separate cards. They were placed
face down and piled up in the order of the problem statement, Question 1, Question 2,

58
and Question 3. The student was instructed to flip over each card and to answer each
question in order. When the subject felt satisfied about his or her answer, he or she could
go to the next question on the card.
Below were the three interview problems without the work-energy bar chart,
which are showed in Appendix C:
Problem 1: The problem statement and questions 1, 2, and 3 were exactly the
same as those of problem 1 with the work-energy bar-chart, except for question 1.0,
which asked the student to complete the work-energy bar chart.
Problem 2: Questions 1, 2, and 3 were exactly the same as those of problem 2
with the work-energy bar chart, except for the problem statement. The problem statement
did not include the work-energy bar chart, but the verbal statement and the sketch were
the same.
Problem 3: Questions 1, 2, and 3 were exactly the same as those of problem 3
with the work-energy bar chart, except for the problem statement. The problem statement
did not include the completed work-energy bar chart, but the verbal statement and the
sketch was the same.
Papers and pencils were provided to the students, and they were allowed to use a
calculator if needed. Students’ paper-pencil solutions were collected and their verbal
explanations were recorded.
3.1.2.3 Analysis of the Interview Proble ms from a Perspective of Multiple Representations in Physics Since the interviews were conducted before the students learned the concepts of
work-energy, the interview problems were designed to be relatively simple. But to
investigate the research questions described in Section 3.1.2.1, we carefully constructed

59
each question of the three interview problems. In this section, we discuss detailed
structures of each interview problem from a perspective of multiple representations in
physics (see more details in Section 2.2.3.).
Problem 1 (see Appendix B): Figure 3.4 showed a problem representation chart
for problem 1 from a perspective of the multiple representations. The figure consisted of
two parts. The right part was composed of the problem statement and the four questions.
The left part indicated how the physical process described in the problem statement could
be represented in the multiple representations—verbal, pictorial, physical and
mathematical representations.
In the problem statement, the verbal and pictorial representations were given. But
in question 1.0 the student was asked to complete the work-energy bar chart, which was
intended to play the role of a physical representation. To answer this question, on the
basis of the verbal and pictorial representations, the student needed to draw a bar with
some height on the slot for the initial gravitational potential energy term and a bar with
some height on the slot for the final kinetic energy term on the chart. The height of each
bar had to be equal, which represented that the energy was conserved during a change
from the initial state to the final state. This was a qualitative question. To complete the
bar chart, one needed to understand the physical process conceptually.
To answer Question 1, one needed to do a quantitative calculation applying the
generalized work-energy equation, which could be either in an algebraic representation or
a numerical representation, as shown in Figure 3.4.
Question 2 was a qualitative reasoning question. It could be readily answered if
one reasoned based on the algebraic representation (the generalized work-energy
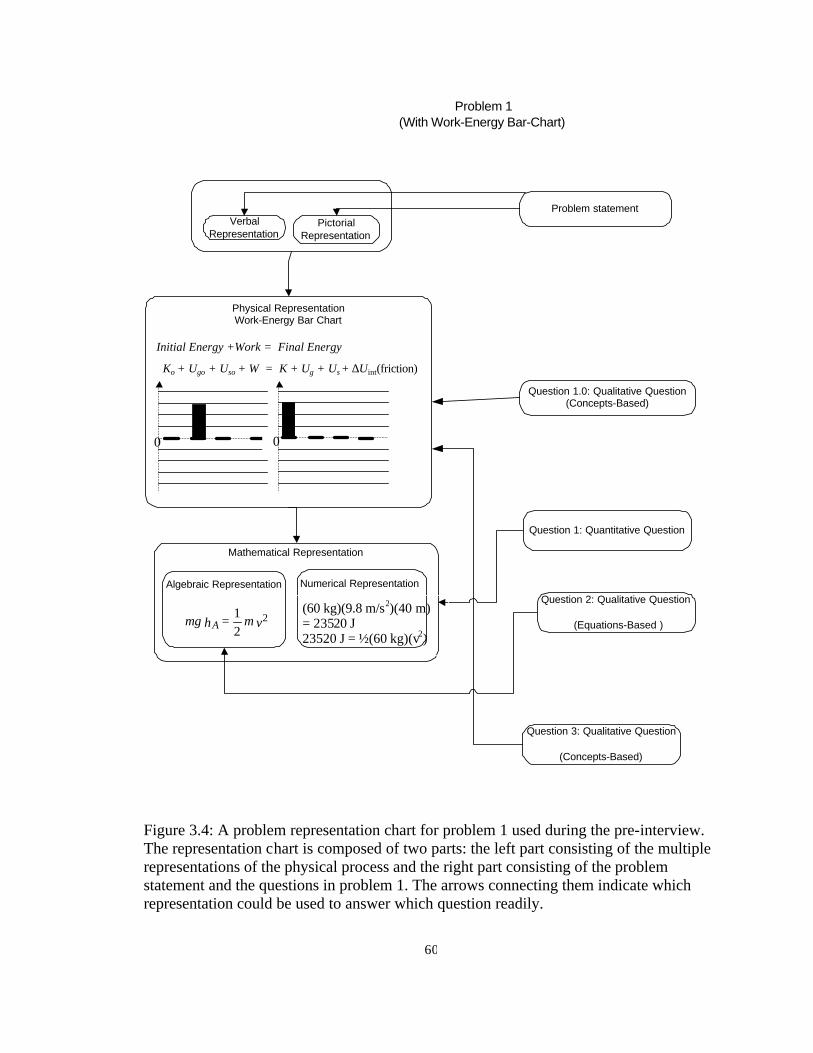
60
Initial Energy +Work = Final Energy
Ko + Ugo + Uso + W = K + Ug + Us + ∆Uint(friction)
0 0
Mathematical Representation
Algebraic Representation Numerical Representation
VerbalRepresentation
PictorialRepresentation
Problem statement
Question 2: Qualitative Question
(Equations-Based )
Question 3: Qualitative Question
(Concepts-Based)
Problem 1 (With Work-Energy Bar-Chart)
Question 1.0: Qualitative Question(Concepts-Based)
Physical RepresentationWork-Energy Bar Chart
Question 1: Quantitative Question
Figure 3.4: A problem representation chart for problem 1 used during the pre-interview. The representation chart is composed of two parts: the left part consisting of the multiple representations of the physical process and the right part consisting of the problem statement and the questions in problem 1. The arrows connecting them indicate which representation could be used to answer which question readily.
vmhmg A2
21=
(60 kg)(9.8 m/s2)(40 m) = 23520 J 23520 J = ½(60 kg)(v2)
61
question). From the algebraic representation shown in Figure 3.4, it was apparent that the
mass m in the equation could be cancelled out, so the speed of the skier at point B was
independent of the skier’s mass. Thus, the woman and the male skiers should have the
same speed when they reached point B. To answer this question, one would need more
efforts or mental reasoning if he or she used either the bar chart or the numerical
representation. For example, if the work-energy bar chart was used to answer question 2,
one had to reason that since the male skier was more massive than the woman skier, the
initial gravitational potential energy bar Ugo would get higher. Based on the conservation
of energy principle, the final kinetic energy bar K would get higher as well so that bars
Ugo and K would have the same height. Compared with bar K representing the woman’s
kinetic energy at point B, bar K for the man’s kinetic energy at point B was higher. But
just based on a comparison of the height of two kinetic energy bars, one still could not
decide about the man’s speed at point B, since the kinetic energy was associated with
mass as well. Also, this would easily mislead a naïve student to come up an incorrect
answer, that the man’s speed was greater than the woman’s speed since bar K for the
man’s kinetic energy at point B was higher than the bar K representing the woman’s
kinetic energy at point B. If using the numerical representation to answer question 2, a
student had to replace the woman’s mass with the man’s mass and then to calculate his
speed at point B. Doing so, it would not only take a student more time, but also would
become difficult for the student to understand conceptually that the skier’s speed at B was
independent of the skier’s mass.
Question 3 was also a qualitative reasoning question. However, it could be easily
answered using the work-energy bar chart. Since the initial potential energy bar kept

62
constant, adding a gravitational potential energy bar representing the final gravitational
potential energy of the woman-earth system at point C would make the woman’s final
kinetic energy bar K lower. So it was easy to decide that her speed at C would be less
than her speed at point B.
To distinguish these two different types of qualitative reasoning questions, we
defined questions like question 2 as the equations-based question, while defining
questions like question 3 as the concepts-based question. But this distinction was not very
strict; some qualitative questions could be readily answered in either way. In Figure 3.4,
the arrows linking the right and left parts represent which representation could be used to
answer which question readily.
Problem 2 (see Appendix B): Similarly, a problem representation chart for
problem 2 was analyzed and shown in Figure 3.5. In the problem statement, a work-
energy bar chart was given, but it was not completed. We intended to investigate whether
or not the student constructed it himself and used it in their problem solving.
To answer question 1, one needed to do a quantitative calculation applying the
generalized work-energy equation, which could be either in an algebraic representation or
a numerical representation. Question 2 was a qualitative reasoning question. It could be
answered readily either using the algebraic representation or the work-energy bar chart.
Similar to question 2 in problem 1, question 3 in this problem could be readily answered
using the algebraic representation.
Problem 3 (see Appendix B): A problem representation chart for problem 3 was
shown in Figure 3.6. In the problem statement, a completed work-energy bar chart was
given, which represented the physical process described in the verbal and pictorial

63
Algebraic Representation Numerical Representation
Q1: Quantitative Question
Problem statement
Q2: Qualitative Question
Q3: Qualitative Question
(Equations-Based)
Problem 2(With Work-Energy Bar-Chart)
VerbalRepresentation
PictorialRepresentation
Physical RepresentationWork-Energy Bar Chart
Mathematical representation
Figure 3.5: A problem representation chart for problem 2 used during the pre-interview. The representation chart is composed of two parts: the left part consisting of the multiple representations of the physical process and the right part consisting of the problem statement and the questions in problem 2. The arrows connecting them indicate which representation could be used to answer which question readily.
Initial Energy + Work = Final Energy
Ko + Ugo + Uso + W = K + Ug + Us + ∆Uint(friction)
0 0
mghmv =221
½(0.05 kg) (30 m/s)2 = 22.5 J 22.5J = (0.05 kg) (9.8 m/s2) h

64
Algebraic Representation
Numerical Representation
Q1: Quantitative Question
Problem statement
Q2: Qualitative Question
Q3: Qualitative Question
Problem 3(With Work-energy Bar-Chart)
Physical RepresentationWork-Energy Bar Chart
Mathematical representation
VerbalRepresentation
PictorialRepresentation
Figure 3.6: A problem representation chart of pre-interview problem 3. The representation chart is composed of two parts: the left part consisting of the multiple representations of the physical process and the right part consisting of the problem statement and the questions in problem 3. The arrows connecting them indicate which representation could be used to answer which question readily.
0
Initial Energy +Work = Final Energy
0
Ko + Ugo + Uso + W = K + Ug + Us + ∆Uint(friction)
mghmvxK −=∆ 2221
)(21
½(100 N/m)(0.2 m)2 = 2 J
(0.05 kg)(9.8 m/s2)(1.0 m) = 0.49 J
2 = ½(0.05 kg)v2 –0.49
65
representations. Compared with problems 1 and 2, this problem was more complicated.
So with the completed work-energy bar chart given, we intended to see whether or not
the student could recognize that the bar chart could be useful for him or her to answer the
questions, in particular, question 1.
Question 1 was a quantitative question. One needed to do a quantitative
calculation applying the generalized work-energy equation, which could be either in an
algebraic representation or a numerical representation. Questions 2and 3 both were
qualitative reasoning questions. They could be answered readily either using the algebraic
representation or the work-energy bar chart.
3.1.2.4 Student Performance on Interview Problems
Of the fourteen students interviewed, twelve were given the problems with the
work-energy bar chart while the other two were given the same problems but without the
work-energy bar chart.
We first analyzed the twelve students’ solutions for question 1.0 in problem 1,
which asked the student to construct the work-energy bar chart consistent with the
physical process described in the problem statement. On the basis of data analysis, we
found that except for one student trying to calculate numbers for each related energy term
and to put actual values on the chart rather than drawing bars, the other eleven students
did qualitatively draw bars on the chart. Eight of them correctly constructed the bar chart
that was consistent with the initial and final states that they chose. One example of the
completed bar charts from these eight students was shown in Figure 3.7. The bar charts
made by the other three students were shown in Figure 3.8. It was apparent that they had
conceptual difficulty dealing with gravity; they did not understand if they should
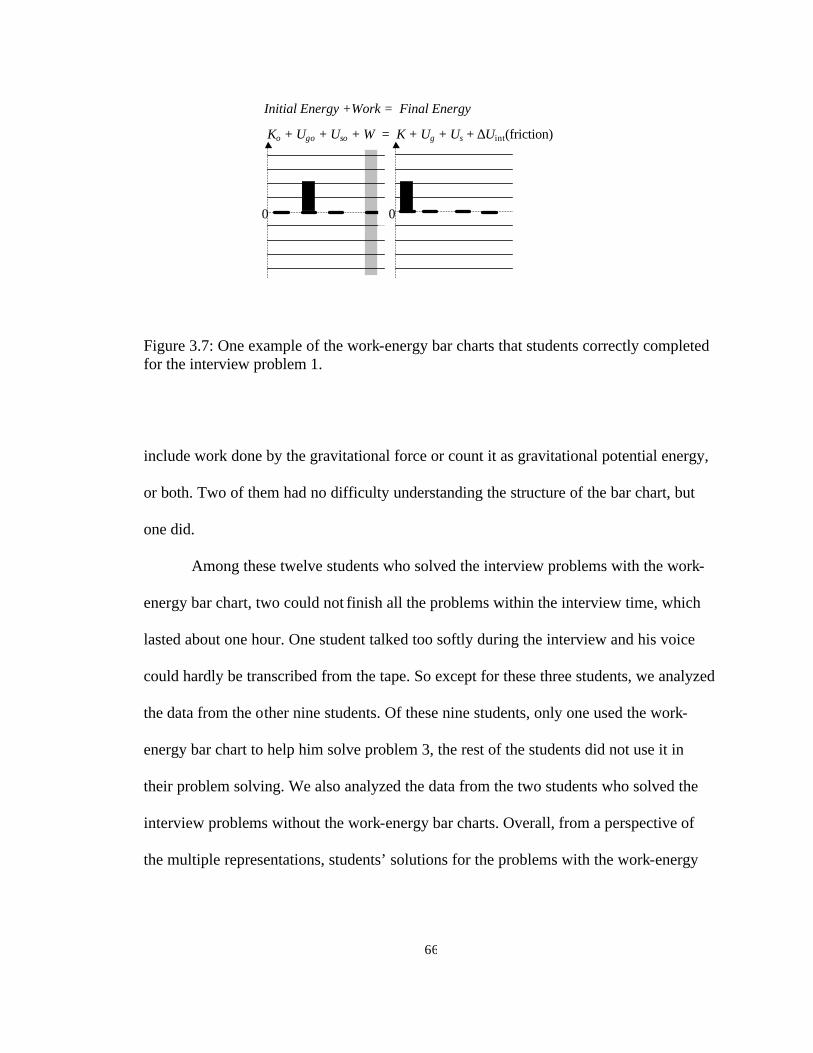
66
Figure 3.7: One example of the work-energy bar charts that students correctly completed for the interview problem 1. include work done by the gravitational force or count it as gravitational potential energy,
or both. Two of them had no difficulty understanding the structure of the bar chart, but
one did.
Among these twelve students who solved the interview problems with the work-
energy bar chart, two could not finish all the problems within the interview time, which
lasted about one hour. One student talked too softly during the interview and his voice
could hardly be transcribed from the tape. So except for these three students, we analyzed
the data from the other nine students. Of these nine students, only one used the work-
energy bar chart to help him solve problem 3, the rest of the students did not use it in
their problem solving. We also analyzed the data from the two students who solved the
interview problems without the work-energy bar charts. Overall, from a perspective of
the multiple representations, students’ solutions for the problems with the work-energy
Initial Energy +Work = Final Energy
Ko + Ugo + Uso + W = K + Ug + Us + ∆Uint(friction)
0 0
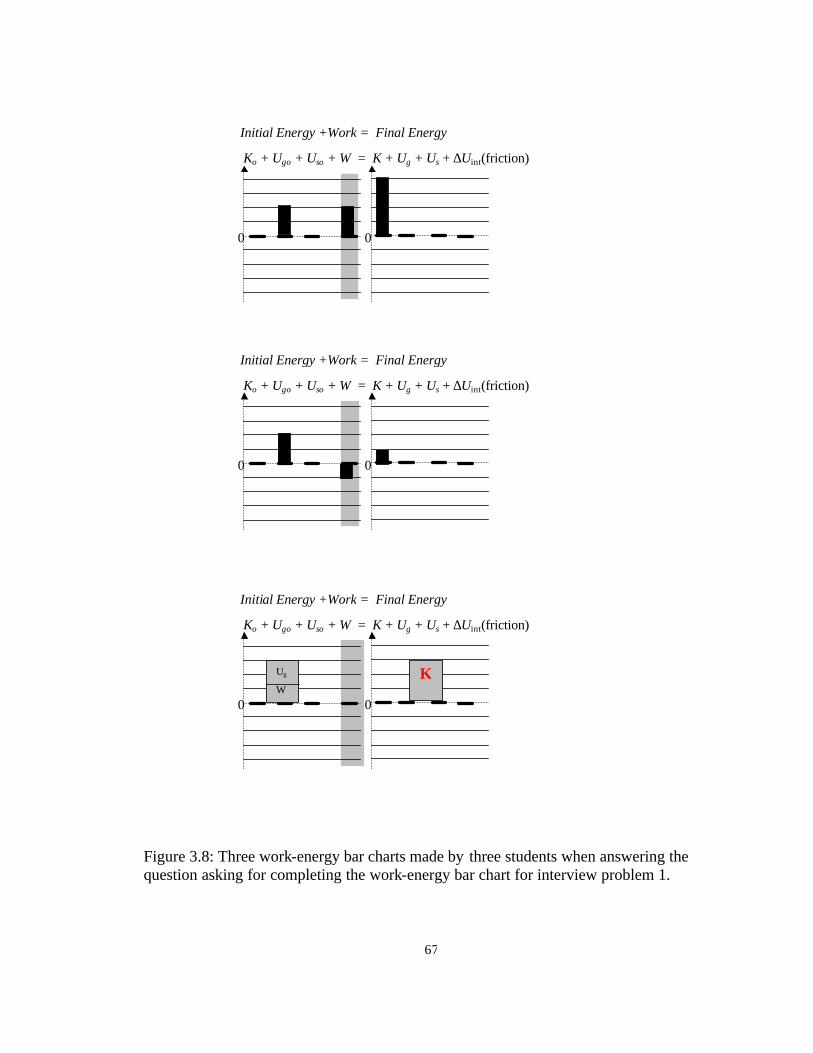
67
Figure 3.8: Three work-energy bar charts made by three students when answering the question asking for completing the work-energy bar chart for interview problem 1.
0
Initial Energy +Work = Final Energy
Ko + Ugo + Uso + W = K + Ug + Us + ∆Uint(friction)
0
0
Initial Energy +Work = Final Energy
Ko + Ugo + Uso + W = K + Ug + Us + ∆Uint(friction)
0
0
Initial Energy +Work = Final Energy
Ko + Ugo + Uso + W = K + Ug + Us + ∆Uint(friction)
0
K Ug
W

68
bar charts were similar to these for the problems without the work-energy bar chart. Two
students’ detailed solutions for the interview problems with the work-energy bar charts
are illustrated in Appendix D, while one student’s detailed solutions for the interview
problems without the work-energy bar chart are shown in Appendix E.
Student performance on problem 1: As shown in Appendixes D and E, all these
three students used the numerical representations to answer question 1, which was a
quantitative question. None of them started with the algebraic representation, as shown in
Figure 3.4. For question 2 (qualitative question), only one student used the algebraic
representation to reason about the question. The other two students both still used their
numerical representations from question 1 to answer this question. As a result, one could
not correctly response the question; the other one got the correct answer but it took him a
long time and more efforts to arrive at the correct answer. To answer question 3, all three
students primarily relied on the pictorial representation. Two of them used the concepts
of work and energy to explain their reasoning, but one used projectile motion ideas to
answer the question, shifting his knowledge domain from work-energy to projectile
motion.
Student performance on problem 2: To answer question 1, all three students
used the numerical representations. For qualitative question 2, it was interesting to see
that they all used the numerical representations from question 1, plugged in the new value
for the initial speed, and calculated the new height. This question could be easily
answered either using the algebraic representation or the physical representation. Student
performance on question 3 was even more interesting. One student used the algebraic
representation and quickly reached the correct answer. Another student first assumed a

69
numerical value for mass of the lighter ball and then used the numerical representations
to calculate the maximum vertical height. For the last student, apparently, he first
attempted to reason the question qualitatively. He imagined a real-life situation he
experienced (throwing up a golf ball and a baseball) and tried to link it with the question.
His mental picture was a type of internal pictorial representation, because 1) unlike an
external representation, it was a mental picture; and 2) his mental image consisted of real-
life objects rather than abstract physics concepts. Then he attempted to think mentally
about some formula (seemly to be equations for projectile motion, but too hard for him to
do it mentally). Then he said: “It’s the best and easiest way to calculate it
mathematically.” He assigned a numerical value for mass of the lighter ball and used the
numerical representations to calculate the maximum vertical height. After he found that
his final results had the same value for both the more massive and less massive balls, he
realized that the mass of the ball had to not matter. Then he set up the generalized work-
energy equation and immediately saw that mass m could be cancelled out.
Student performance on problem 3: This problem was more complex than the
first two problems. One student used the given work-energy bar chart when he answered
all three questions. First, when struggling with question 1, he realized that the work-
energy bar chart was helpful for him to understand the problem, in particular, to
understand about the gravitational potential energy. Then he used the bar chart to help
himself set up the generalized work-energy equation. So he quickly solved the question
correctly. When he answered questions 2 and 3, apparently, he used the work-energy bar
chart to help reason about and evaluate his answers.
70
For the other two students, one did not use the work-energy bar chart to answer
the questions, although it was given; one was not given the work-energy bar chart. They
basically used the numerical and pictorial representations to answer all the questions.
3.1.2.5 Discussion of Interview Results
The student performance on the interview problems, as discussed above, provided
some empirical evidence about how students solved work-energy problems from a
perspective of the multiple representations and how they used the work-energy bar chart
in their problem solving before formally learning about it.
First, it was apparent that most students did not have difficulty understanding the
format and the structure of the work-energy bar chart, even though they just had a short
tutorial on it. This provided evidence that the work-energy bar chart as an external
representation was easy for the student to understand. Research in psychology found that
a bar graph was easy for human beings to reason about some tasks (see more details in
Section 2.2.2.1).
Second, the data indicated that students relied more on the pictorial representation
than on the physical representation to reason in problem solving. Students could correctly
construct the work-energy bar chart for problem 1, but did not use it to answer the
following questions, some of which could be answered easily using the work-energy bar
chart. It seemed fair to conclude that, without understanding why and how to use the
work-energy bar chart in problem solving, students did not use it. Although the work-
energy bar chart had an easy-to-understand format, it had physics meanings. We needed
to treat the physical representation itself as physics knowledge and to explicitly teach the
student how to use it.

71
In contrast, the pictorial representation consisted of a daily situation and concrete
objects; the student was familiar with them based on his or her real-life experience. In
addition to its diagrammatic format (see more details in Section 2.2.3), the pictorial
representation was helpful for the student to visualize what was going on in the problem
and to reason in problem solving. However, including real objects in the pictorial
representation could become disadvantageous. It appeared that it was difficult for the
student to answer certain qualitative questions using the pictorial representation. It
provided surface features that could trigger inappropriate reasoning.
Third, to understand student problem solving from a perspective of the multiple
representations, it was necessary to distinguish two types of mathematical representation:
the algebraic and the numerical representations. There was empirical evidence that they
played different functions in student problem solving. Apparently, the naïve student
basically used the numerical representation to solve quantitative questions and to answer
some qualitative questions as well. A strategy that the student used could be summarized
as: represent related concept in numbers first, assemble these numbers together based on
a law or a principle, and calculate out a number for the unknown variable. By doing this,
it appeared that the meaning of each concept became invisible or lost; the student met
difficulty conceptually understanding the physical process.
Apparently, it was difficult for the student to use the numerical representation to
answer some qualitative questions. It would either take the student a longer time and/or
more effort to reach the correct answer or be misled to make an incorrect answer.
Compared with the numerical representation, the algebra representation had some
advantages. It was helpful for the student to answer some qualitative questions quickly.

72
Additionally, it could aid in student conceptual understanding of the physical process.
But the algebraic representation was an abstract, symbolic representation. Maybe it was
too abstract for the beginning student, so he or she wanted to avoid using it or use it as
little as possible.
Fourth, we also found that the student went back and forth between pictorial
representations (sometimes verbal representations) and numerical representations in
problem solving. It seemed to the student that these were concrete, familiar, and
manageable representations. But they contained few physics concepts or meanings; they
were less helpful to reason in the physics domain. Apparently, an intermediary
representation was needed 1) to provide physics concepts or meanings, 2) to have a
diagrammatic format so as to link closely with the pictorial representation, and 3) to be
closely associated with fundamental laws or principles in physics so as to aid in
understanding and setting up the algebra representation. A physical representation could
help close this gap. Previous studies (See Section 2.2.3.1) had found that the central
difference in problem solving between experts and naïve students was that experts
integrated physical representations into their understanding and reasoning while solving
problems, but novices did not. To help students develop expertise in solving work-energy
problems, it was essential to introduce a physical representation in the context of work
and energy and to help students apply the physical representation in their own problem
solving.
Could the work-energy bar chart be used as an effective physical representation in
solving work-energy problems? How could we help students use it in their problem
solving? What functions would the work-energy bar chart play in student problem

73
solving? Would students perform more expert-like in problem solving after they are
exposed to this new technique? In the rest of this chapter, we attempt to address and
investigate these questions.
3.2 Development and Implementation of a Systematic Multiple-Representation Strategy To address the students’ difficulties and to help students acquire expert-like
problem solving skills, we developed an approach to representing work-energy processes
in multiple ways. In this method, a typical physics problem is considered as a physical
process. The process is first described in words—the verbal representation of the process.
Next, a sketch or a picture, called a pictorial representation, is used to represent the
process. This is followed by a physical representation that involves more physics-like
quantities and descriptions such as free-body diagrams and graphs. Finally, the process is
represented mathematically by using basic physics principles to describe the process.
Since a physics principle usually can be either represented by a more generalized
algebraic formula or a numerical equation, for a mathematical representation we can
distinguish two formats: the former as an algebraic representation, and the latter as a
numerical representation. The pictorial and physical representations are often called
qualitative representations, in contrast to the quantitative mathematical representation. In
this chapter, the use of verbal, pictorial, physical, and mathematical representations is
called multiple-representation problem solving. An example of multiple representations
for a kinematics process is shown in Figure 3.9. In terms of multiple representations, the
goal of solving physics problems is to represent physical processes in different ways—
words, sketches, diagrams, graphs, and equations, rather than solving for some unknown

74
Multiple Representations in Dynamics
Verbal Representation
A cat fell off a roof, and landed in snow. It stopped after sinking 0.2 m into the snow. Just before hitting the snow, the cat was falling at a speed of 10 m/s. Determine the average force of the snow on the 5 kg cat while it was sinking into the snow.
Pictorial Representation
Mathematical Representation
vvyya 20
20)(2 −=−
amWN =−
Figure 3.9: Multiple representations of a dynamics process.
y0 = 0, v0 0
y, v = 0 t0
Initial Situation Final Situation
t
a
v
y
N (snow on cat)
W (Earth’s mass on cat)
v0
System
Physical Representations (Motion Diagram and Force Diagram)

75
quantity. This multiple representation process helps students develop meaning for the
abstract algebraic symbols by linking them to the more concrete pictorial and physical
representations.
3.2.1 Development of Work-Energy Bar Chart as a Physical Representation of Work-Energy Processes
As we know, most physics professors and teachers solve dynamics problems by
relying on diagrammatic force representations—a free-body diagram or a force diagram.
There is, however, no similar representation for solving work-energy problems. As was
discussed in Section 3.1.1 and 3.1.2, when solving work-energy problems, most
introductory physics students just play with equations and numbers, and seldom use any
qualitative physical representations to help them understand the problem.
Van Heuvelen [2] developed work-energy bar charts (see Figure 3.10) that serve
the same role for analyzing work-energy processes as motion diagrams and force
diagrams serve when analyzing kinematics and dynamics problems. The basic structure
of the bar charts as shown in Figure 3.10 relies on the principle of conservation of energy,
which says the initial energy of a system plus work done on the system equals its final
energy. Hence, the bar chart is composed of three parts. The first part includes the initial
system energy, which can have different types, such as kinetic energy (Ko), gravitational
potential energy (Ugo), and elastic potential energy (Uso). Work (W) is the second part in
the bar chart. To conceptually distinguish between work and energy (because work is a
process quantity, but energy is a state quantity), we indicate the work part in the bar chart
in shadow. The last part is the final system energy that includes kinetic energy (Ko),

76
Figure 3.10: Work-energy bar charts that serve the same role for analyzing work-energy processes as motion diagrams and force diagrams serve when analyzing kinematics and dynamics problems. gravitational potential energy (Ugo), elastic potential energy (Uso), and internal energy
[∆Uint(friction)], which is the last term in the bar chart (See Section 3.2.3 for detailed
discussions about the internal energy).
The relative magnitudes of the different types of energy in the bar chart are
initially unknown, just as the magnitudes of forces in a free-body diagram are often
initially unknown. The chart does, however, allow us to conserve energy qualitatively—
the sum of the height of bars on the left equals the sum of the height of bars on the right.
For example, Figure 3.10 shows that a system initially has some elastic potential energy,
say, three units (no need to know the exact magnitude). During a process that the system
changes from its initial state to its final state, no external work is done on the system.
Initial Energy + Work = Final Energy
0 0
Ko + Ugo+Uso+ W = K + Ug + Us + ∆Uint(friction)

77
Therefore, the sum of the final energies, that is, kinetic energy and gravitational potential
energy, should equal three units. The kinetic energy could be one unit, and the
gravitational potential energy could be two units, as shown in Figure 3.10. However, the
kinetic energy could be two units, while the gravitational potential energy is one unit, so
that the sum of these two bars equals three units.
The work-energy bar chart has all the important features of a physical
representation (see Section 2.2.3.2). First, the bar chart has meaning in physics—it
represents the conservation of energy. Second, as discussed above, it qualitatively
represents the conservation of energy. Third, it has a diagrammatic format. A bar chart
usually is an effective external representation to help people reason about information
that it represents [3]. Thus, theoretically, the work-energy bar chart can be used as a
physical representation for work-energy processes. How to use it by students in work-
energy problem solving is discussed below.
3.2.2 Multiple Representations of Work-Energy Processes To help students forgo a formula-centered problem solving method and acquire a
coherent expert-like problem solving strategy, we developed a multiple-representation
approach for solving work-energy problems. That is, a work-energy process can be
represented in verbal, pictorial, the bar chart (as a physical representation), and
mathematical representations, as shown in Figure 3.11. Notice that the pictorial
representation used in this strategy refers to a detailed sketch that identifies the system
and its initial and final states, includes a coordinate system, and indicates the values of
relevant quantities in the system’s initial and final states. The mathematical

78
Figure 3.11: Multiple representations of a work-energy process.
Mathematical Representation
dfvmygm += 20 2
1
d
y
0
t, y = 0v > 0
t0, y0, v = 0
System
Earth
Verbal Representation
A large rock initially at rest slides down a hill and is moving at the bottom of the hill.
Pictorial Representation
0 0
Initial Energy+Work=Final Energy
Ko+Ugo+Uso+ W = K+ Ug+ Us+ ∆Uint(friction)
Physical Representation (Work-Energy Bar Charts)

79
representation is defined as the generalized work-energy equation (i.e., algebraic
representation of the conservation of energy principle), as shown in the bottom of Figure
3.11. To use this approach with the concepts of work and energy, students must learn
certain conceptual ideas and skills, including:
• Choosing a system—the object or objects of interest for the process being considered;
• Characterizing the initial state and the final state of the process;
• Identifying the types of energy that change as the system moves from its initial state to
its final state and the signs of the initial and final energies of each type;
• Deciding if work is done on the system by one or more objects outside the system as
the system changes states;
• Developing the idea that the initial energy of the system plus the work done on the
system leads to the final energy of the system—the energy of the universe remains
constant;
• Constructing an energy bar chart—a qualitative representation of the work-energy
process; and
• Converting the bar chart to a mathematical representation that leads to a problem
solution.
3.2.3 Systems and Work
To use this multiple-representation approach with the concepts of work and
energy, we need to pay a lot of attention to the system, to its changing characteristics, and
to its interaction with its environment. The book by Bridgman [4] provides a nice
introduction to the effect of system choice on the description of the work-energy process.

80
Burkhardt [5], Sherwood [6], Sherwood and Bernard [7], Arons [8], and Chabay and
Sherwood [9] also discuss the importance of system choice. A system includes an object
or objects of interest in a region defined by an imaginary surface that separates it from its
surroundings. Choosing a system is the key for deciding what energy changes occur and
what work is done. Work is done only if an object outside the system exerts a force on an
object inside the system and consequently does work on the system as the internal object
moves.
This idea is illustrated in Figure 3.12 where the same process (neglecting friction)
is analyzed by using three different systems (an idea provided by Bob Sledz at Garfield
High School in Cleveland). Notice that in Figure 3.12 (a) the cart and the spring are in the
system, as is Earth. The process is not affected by objects outside the system. Thus, no
external work is done on the system. Potential energy change occurs when objects in a
system change their shape or their position relative to other objects in the system. For
example, the change in separation of a mass relative to Earth’s mass in the system causes
a gravitational potential energy change. The change in separation of two electric charges
in the system causes a change in electrical potential energy. The change in the shape of a
spring when it compresses or stretches causes a change in its elastic potential energy. In
Figure 3.12 (a), the system’s initial energy, the elastic potential energy of the compressed
spring, is converted to the system’s final energy, the kinetic energy of the cart and the
gravitational potential energy due to the separation of the cart and Earth.
In Figure 3.12 (b), the system has been chosen with the earth outside the system.
Thus, the earth's mass exerts an external gravitational force on the cart and consequently
does work on the cart as it moves to higher elevation. In this case, we do not count the

81
Figure 3.12: The different systems are chosen for the same physical process. In (a), the cart, the spring, and Earth are in the system. In (b), however, the cart and the spring are in the system, but not Earth. The system in (c) includes only the cart. For each chosen system there is one work-energy bar chart and the corresponding generalized work-energy equation. In practice, it would be easy for students to use a system that includes Earth and the spring, although the way to choose the system does not affect the physical results.
(a)
t0, y0 = 0 v0 = 0
y
t, y, v
Earth
System
0
x0
0
Initial Energy+Work=Final Energy
Apply the work-energy equation to the process represented above.
mgyvmkx += 220 2
121
Ko+Ugo+Uso+W = K+ Ug+Us+∆Uint(friction)
0
Earth
t0, y0 = 0 v0 = 0
y
t, y, v
System
0
x0
0
Apply the work-energy equation to the process represented above.
vmygmxk 220 2
121 =−
Initial Energy+Work=Final Energy
0
Ko+Ugo+Uso+W = K+ Ug+Us+∆Uint(friction)
(b)
Earth
t0, y0 = 0 v0 = 0
y
t, y, v
System
0
x0
0
Apply the work-energy equation to the process represented above.
vmygmW spring2
21=−
0
Initial Energy+Work=Final Energy
Ko+Ugo+Uso+W = K+ Ug+Us+∆Uint(friction)
(c)

82
system's gravitational potential energy as changing because the earth is not in the system.
As we know, the negative work done by the Earth's gravitational force on the left side of
the chart in Figure 3.12 (b) has the same effect as positive final gravitational potential
energy on the right side of the chart in Figure 3.12 (a).
For the system in Figure 3.12 (c), the cart alone is in the system. Thus, we now
include the effect of the spring by analyzing the work done by the external force of the
spring on the cart and the work done by the external earth's gravitational force. The sum
of these two work terms causes the system's kinetic energy to increase. There is no elastic
potential energy change in the system since the spring is now outside the system.
In the above example, the system chosen in Figure 3.12 (a) is probably easiest to
use in physics instruction. Gravitational potential energy is usually emphasized in high
school and college introductory physics courses and is an easier concept for students to
understand. It may, in practice, be easier for students to solve problems if they choose
systems that include the earth. Similarly, it is more difficult for students to calculate the
work done by a spring than to calculate its elastic potential energy kx2
21
at the beginning
and end of a process.
What about friction? Bridgman [10], Sherwood [6], Sherwood and Bernard [7]
Arons [11], and Chabay and Sherwood [9] have discussed examples such as these shown
in Figure 3.13—one object sliding along a surface. Let us discuss a non-real but simple
situation first. In Figure 3.13 (a), we imagine the block is a point particle, and this point-
particle block is moving until it stops because of the floor’s frictional force. The system
includes only the point-particle block. So the floor exerts on the point-particle block an

83
Figure 3.13: The physical processes involve friction. In (a), a point-particle block slides to a stop on a floor with friction. The system includes only the point-particle block. So the floor exerts on the point-particle block an external frictional force, and this frictional force does a negative amount of work, which has the same magnitude as the block’s initial kinetic energy. In (b), a real car skids to stop on a rough road. The car is the only object in the system. Thus, the road that touches the car causes an external frictional force and a difficult work calculation. Chabay and Sherwood argue that for such a real system that includes the car, it has less negative work done by the friction of the road on the car than the car’s initial kinetic energy. The remaining amount of the car’s kinetic energy is transferred into the internal energy in the car (see Ref [9], pp. 236-241 for detailed discussions about this advanced topic). In (c), we see a recommended system choice that includes the objects and the frictional interfaces between the objects in the system. In this way we can readily include the system’s internal energy change due to friction rather than dealing with a complex work calculation.
0 0 0
Initial Energy+Work=Final Energy Initial Energy+Work=Final Energy
Ko+Ugo+Uso+W = K+ Ug+Us+∆Uint(friction)
0
v0 ≠ 0
System
m
Initial Energy+Work=Final Energy
Ko+Ugo+Uso+W = K+ Ug+Us+∆Uint(friction)
0
v0 ≠ 0
System
0
v0 ≠ 0
System
Ko+Ugo+Uso+W = K+ Ug+Us+∆Uint(friction)

84
external frictional force which points opposite to the direction of motion. This frictional
force does negative work. This negative work in stopping the point-particle block has the
same magnitude as the block’s initial kinetic energy. But in a real and complex situation,
such as the car skidding to a stop on a rough road as shown in Figure 3.13 (b), the car is a
real object. If the car is the only object in the system, the road that touches the car causes
an external frictional force. The work done by this frictional force is very difficult to
calculate, if we look carefully at what really happens at the boundary between the car
tires and the road. As Arons says [11]:
What happens at the interface is a very complicated mess: We have abrasion, bending of “aspirates,” welding and unwelding of regions of “contact,” as well as shear stresses and strains in both the block and the floor.
In this situation, it is very difficult to deal with the formal definition of work done by the
frictional force. Ruth Chabay and Bruce Sherwood in their new textbook give a nice and
detailed explanation about how to calculate the work done by the frictional force in such
a situation—see Matter and Interactions [9]. According to Chabay and Sherwood’s
arguments, the work done by this frictional force is still negative, but the magnitude of
this work is less than the initial kinetic energy (and not equal to –Ffrictiond either); the
remaining amount of the initial kinetic energy is transferred into internal energy in the car
(see the following for detailed discussions about the internal energy).
Rather than dealing with this difficult work calculation, Bridgman [4] and Arons
[8] recommend that the two touching surfaces, such as the car tires and the road, be
included in the system as in Figure 3.13 (c). Since friction is no longer an external force,
we look for energy changes in the system. Friction causes objects rubbing against each

85
other to become warmer—the random kinetic energy of the atoms and molecules in the
touching surfaces increases. Friction can also cause atomic and molecular bonds to break.
This causes the potential energy holding atoms and molecules together to change. This
happens, for example, when snow melts as a person's skis rub against the snow or when a
meteorite burns due to air friction. A large number of bonds between rubber molecules
are broken when a car skids to a stop. Thus, if surfaces with friction are in the system, the
system's internal energy increases due to friction. The internal energy of the system is
expressed by the last term, ∆Uint(friction), in the qualitative work-energy bar chart.
3.2.4 Instruction
How do we use the bar charts and the multiple-representation strategy with
students? To help students overcome their dependence on a formula-centered method to
solve work-energy problems, to help them develop a qualitative understanding of the
work-energy concepts, and to acquire a systematic, coherent expert-like problem solving
strategy, we explicitly expose students to such learning experience as the following:
• Learn to draw a pictorial representation from a verbal statement.
• Construct a qualitative work-energy bar chart for the process represented by the
pictorial and verbal representation.
• Set up the generalized work-energy equation based on the bar chart. That is, there is
one term in the equation for each term in the bar chart.
• Learn to move among representations in any direction. For example, construct a
detailed sketch and a verbal description that is consistent with a complete bar chart or
with a mathematical equation that is the application of the conservation of energy
principle for some physical process.

86
• Solve quantitative problems using the multiple-representation strategy.
3.2.4.1 Qualitative Representations of Work-Energy Processes
In this section, some examples (Figures 3.14 – 3.17) are given in detail to
illustrate how students learn to use the work-energy bar chart and the multiple
representation strategy to qualitatively analyze work-energy processes [12]. Usually, the
processes shown in the worksheets are demonstrated with real objects in the lecture or
laboratory. In Figure 3.14 (a), a work-energy process is described in words and in a
sketch. Students are asked to construct a detailed sketch that identifies the system and its
initial and final states, includes a coordinate system, and indicates the values of relevant
quantities in the system’s initial and final states. Construction of a sketch such as that in
Figure 3.14 (b), a pictorial representation of the process, is perhaps the most difficult task
for students.
Having completed a pictorial representation of the process, students next
construct a qualitative work-energy bar chart for the process (as in Figure 3.15). The
student looks at the initial situation and decides whether the system has kinetic energy,
Ko. If so, the student places a short bar above the initial kinetic energy slot. If there is no
initial kinetic energy, no bar is drawn. The bar for initial gravitational potential energy,
Ugo, depends on the initial location of an object in the system relative to the origin of the
vertical coordinate system. The student draws a positive bar if the object is at a higher
position than the origin of the y-axis, no bar if at the same elevation as the origin, or a
negative bar if lower than the origin. Similarly, the bar for the initial elastic potential
energy, Uso, depends on whether compressed or stretched elastic objects are initially in
the system. The work W bar depends on the presence of objects outside the system that

87
Figure 3.14: The work-energy process is described in words and in a sketch as shown in (a). Students are asked to construct the pictorial representation, including a system choice and a coordinate system, and indicating the values of the quantities in the system’s initial and final states as shown in (b).
The cable lowers the elevator, initially moving down, so that it comes to a stop at a lower elevation.
y t0, y0 v0 > 0
t, y = 0, v = 0
System
0
Earth
(a) (b)
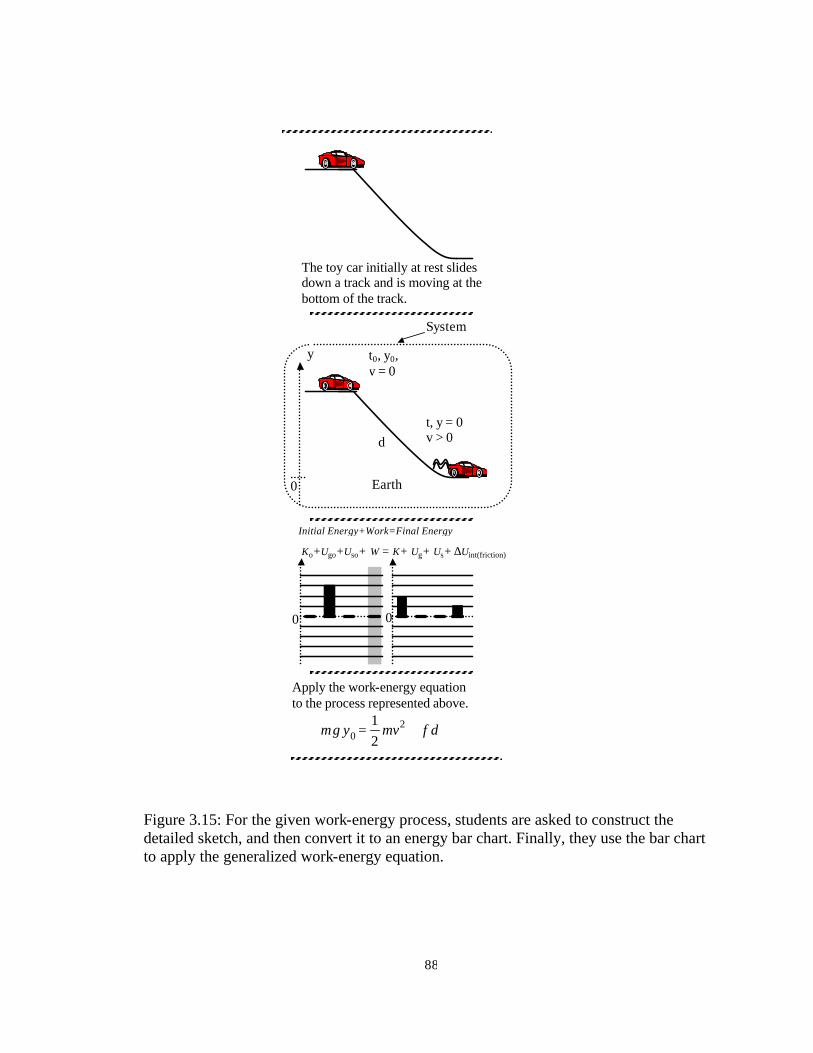
88
Figure 3.15: For the given work-energy process, students are asked to construct the detailed sketch, and then convert it to an energy bar chart. Finally, they use the bar chart to apply the generalized work-energy equation.
0 0
Apply the work-energy equation to the process represented above.
dfvmygm += 20 2
1
Initial Energy+Work=Final Energy
Ko+Ugo+Uso+ W = K+ Ug+ Us+ ∆Uint(friction)
t, y = 0v > 0 d
t0, y0, v = 0
System
Earth
y
0
The toy car initially at rest slides down a track and is moving at the bottom of the track.

89
exert forces on objects inside the system as the system moves from its initial state to its
final state. The sign of the work depends on the direction of the external force relative to
the direction of the displacement of the object in the system. The final energy of the
system is analyzed in the same way as the initial energy.
Having identified non-zero energy terms by placing short bars in the chart, we can
now emphasize the conservation of energy principle by making the sum of the lengths of
bars on the left equal to the sum of the bars on the right. The relative magnitudes of the
bars on one side are usually unknown, just as the relative magnitudes of force arrows in a
force diagram are often unknown.
Having constructed the bar chart, it is now a simple task to construct the
generalized work-energy equation to describe this process. There is one term in the
equation for each term in the bar chart. When detailed expressions for the types of energy
are developed, students can include these expressions in the equations, as in the bottom
mathematical representation in Figure 3.15. For the problem in Figure 3.15, students
could be asked to think about how the chart and the actual process would change if the
coefficient of kinetic friction was doubled.
In Figure 3.16, students start with a complete bar chart and are asked to invent a
verbal and pictorial description of a physical process that would lead to that bar chart, and
to construct the mathematical representation of the physical process. (There are many
processes that could lead to a particular chart.) In Figure 3.17, students start with the
mathematical representation of a process and are asked to construct a bar chart that is
consistent with the equation, and to invent a process that would produce the equation and
the chart—a so-called Jeopardy problem [13]. Students should now have a good

90
Figure 3.16. A work-energy process is described by a work-energy bar chart. Students start with the bar chart and invent a sketch, a real-world situation in words and a generalized work-energy equation that is consistent with the bar chart.
0 0
Verbal Representation
Pictorial Representation
Mathematical Representation
Initial Energy+Work=Final Energy
Ko+Ugo+Uso+W = K+ Ug+Us+∆Uint(friction)

91
Figure 3.17. The so-called Jeopardy problem starts with the mathematical equation for a work-energy process. Students are asked to construct a bar chart that is consistent with the equation, to draw a sketch, and to invent a process that would produce the equation and the chart.
0 0
Mathematical Representation
)m20()N30()m20(5.0
)35sinm20()m/s10()kg10(2
02
+= k
Verbal Representation
Pictorial Representation
Initial Energy+Work=Final Energy
Ko+Ugo+Uso+W = K+ Ug+Us+∆Uint(friction)

92
qualitative understanding of work-energy processes—at least much better than when the
processes are introduced first using a formal mathematical approach.
3.2.4.2 Quantitative Work-Energy Problem Solving
Students next solve quantitative problems using this multiple-representation
strategy. They go from words, to sketches and symbols, qualitative bar graphs, a
generalized work-energy equation, a solution, and finally an evaluation to see if their
solution is reasonable. An example is shown in Figure 3.18. A set of Active Learning
Problem Sheets (the ALPS Kits) [12] has a Work-Energy Kit that includes 38 qualitative
questions [such as illustrated in Figure 3.14 (a)] and 16 quantitative problems (such as
illustrated in Figure 3.18). Students buy the ALPS Kits at the beginning of the quarter.
They solve some of these problems during lectures, during recitations, and for
homework. Problems from the text are assigned with the proviso that the same format
should be used on these problems. In addition, a set of 14 qualitative and quantitative
work-energy problems (included as part of the ActivPhysics1 CD and workbook [14]) is
used as active learning activities during lectures and laboratories. The problems are
computer simulations, which include the dynamic work-energy bar charts to help students
visualize energy transformations and conservation during physical processes.
3.3 Assessment of the Effectiveness of the Multiple- Representation Strategy
In the autumn quarters of 1997 and 1999, honors engineering freshmen in a
calculus-based introductory mechanics class (Physics 131E) at OSU learned the multiple-
representation strategy with the concepts of work and energy. This ten-week class
covered the regular concepts of mechanics: kinematics, Newton’s dynamics, momentum,
work and energy, and some rotational dynamics. The students worked with the work and

93
Figure 3.18: One of the quantitative problems included in the Active Learning Problem Sheets. Students solve those problems using the multiple-representation strategy after having developed skills in constructing qualitative representations. These multiple-representation problems help students develop qualitative understanding about the physical processes and develop problem-solving expertise, instead of using only an equation-centered method.
Ko + Ugo + Uso + W = K + Ug + Us + ∆Uint(friction)
A 500-kg cart, including the passengers, is initially at rest. When the spring is released, the cart is launched for a trip around the loop-the-loop whose radius is 10 m. Determine the distance the spring of force constant 68,000 N/m must be compressed in order that the cart’s speed at the top of the loop is 12 m/s. Ignore friction. Assume that g = 10 m/s2.
(d) Evaluation • Does the answer have the correct units?
• Does the answer seem reasonable?
• How would the answer differ if the loop has a smaller radius? Does this agree with the equation in part (c)?
(a) Construct a qualitative work-energy bar chart for the process at the left.
Initial Energy + Work = Final Energy
(b) Use the work-energy bar chart to help construct the work-energy equation for this process.
(c) Rearrange the above to determine the unknown distance that the spring must be compressed.
0 0
B
Earth
A
System

94
energy concepts for about six lecture periods, three recitation periods, one lab period, and
in their homework assignments. Below, we report results of assessing the effectiveness of
the multiple-representation problem solving strategy on student understanding and
problem solving in work-energy.
3.3.1 Evaluation Results (Autumn 1997 and Winter 1998)
In the autumn quarter of 1997 and in the winter quarter of 1998, we conducted a
series of assessment activities for the honors engineering freshmen in Physics 131E who
learned this multiple-representation strategy with the concepts of work-energy. We
administered a survey to evaluate student attitudes towards the work-energy bar chart and
the multiple-representation approach, gave a tutorial-type question to assess students’
conceptual understanding, and analyzed students’ solutions of a work-energy problem on
the final exam.
3.3.1.1 Student attitudes towards the energy bar charts and the multiple representation approach of solving work-energy problems
Most of the honors engineering freshmen in Physics 131E took high school
physics that is taught in the standard way. So it becomes important to know what they
think about the multiple-representation problem-solving strategy, which is innovative and
counter to the traditional formula-centered instruction. A survey was administered to
evaluate what students thought about the roles of the work-energy bar charts and the
multiple-representation strategy. The survey included three free-response questions. The
survey questions and students’ answers on each of the three survey questions are
summarized in Tables 3.5, 3.6, and 3.7. Below, we discuss in detail students’ responses to
survey question 1 and 2, which are summarized in Table 3.5 and 3.6. The students’
responses to survey question 3 are discussed in Section 3.3.1.3.

95
Table 3.5 reports a summary of the students’ responses for question 1 on the
survey: “Did using the energy bar charts help you learn energy concepts and solve work-
energy problems? Explain why they were useful or not useful.” We found that out of 67
students, overall, ninety-two percent thought that the energy bar charts were useful.
Sixty-four percent of them thought that the energy bar charts helped them visualize what
is happening to different types of energy in energy problems, and helped them set up the
correct equations to solve the problems easily. Fifteen percent of them thought that the
energy bar charts helped them better understand the abstract energy concepts and energy
conservation. Ten percent of the students thought that the energy bar charts were helpful
in learning the energy concepts at the beginning, and after a while they could create the
bar charts mentally rather than write them out. But eight percent of the students preferred
using equations directly rather than the energy bar charts.
Based on the students’ comments, apparently students think that the work-energy
bar charts as a physical representation help them visualize the process of energy
transformation and “see” the conservation of energy. Also, students think that the work-
energy bar charts play a crucial role in helping them set up equations correctly and
readily.
Table 3.6 reports a summary of the students’ responses for question 2 on the
survey: “Did representing the work-energy processes in multiple ways—words, sketches,
bar charts and equations—help you learn energy concepts and solve energy problems?
Explain why they were useful or not useful.” Out of 67 students, eighty-four percent
thought that this multiple-representation strategy was helpful: helped them understand the
concepts better; set up the problems correctly; and was a good teaching method for a

96
92% Useful (N = 67)
64%
These students thought that the energy bar charts helped them visualize what is happening to different types of energy in energy problems, and set up the right equations to solve the problems easily. Two examples of the students’ responses:
• Greatly helped, because they provided visual representation of what’s going on and made figuring out the equations easier.
• The energy bar charts were extremely useful because they provided direction for each problem. You were able to see what types of energy were being used at different stages of the problems and what individual energy equations to apply to the problems.
15%
These students thought that the energy bar charts helped them understand the abstract energy concepts and the energy conservation better. Two examples of the students’ responses:
• Yes, they were very helpful. They allowed me to see how and in what forms energy was conserved.
• These were extremely helpful. Doing this made me change my way of think [sic] from thinking in terms of equations to concepts. Once I had the concepts down, then I can choose the right equations.
10%
These students thought that the energy bar charts were helpful in learning the energy concepts at the beginning, and after a while they could create the bar charts mentally rather write them out. One example of the students’ responses:
• They were useful since they gave a visual way to go about the problems. After a while I got to the point that I automatically did them in my head and did not need to really write them out.
3%
These students thought that the energy bar charts were helpful, but they did not explain their reasons.
8% Not Useful (N = 67)
8%
These students preferred using equations directly rather the energy bar charts. One example of the students’ responses:
• No. I had trouble finding relationships between the energies involved using the energy bar charts. I was better off using the equations. The energy bar charts only
showed before, after, which increased, or decreased, and which energy was more. Personally, I needed exact values, which working equations provided. I did not gain a better understanding of energy using the charts.
Table 3.5. Students’ responses for question 1 on the survey: Did using the energy bar charts help you learn energy concepts and solve work-energy problems? Explain why they were useful or not useful.

97
84% Useful (N = 67)
84%
These students thought that the multiple-representation strategy was helpful to understand the concepts better, and to set up the problems correctly, and was a good teaching method to help a variety of students learn physics. Two examples of the students’ responses:
• Doing these problems in many different ways with different descriptions helped to visualize the deeper basic concepts underlying them. Seeing a problem only one way, or learning a concept only one way, causes your knowledge of that concept to be very one-dimensional. Representing multiple ways helps me to see all sides of a concept.
• They did help me by letting me see the problem different ways. Also I would like to note that this is a good teaching method to help a variety of students learn physics. Often times a student doesn’t understand one method but sees another.
9%Useful and Not Useful (N = 67)
9%
These students thought that the multiple representations were helpful to understand the energy concepts, but were sometimes a waste of time for quantitative problem-solving. One example of the students’ responses:
• Sometimes they were useful but doing each type of description for each problem was overkill and wasted a lot of time.
7% Not Useful (N= 67)
7%
These students thought that the multiple representations were not helpful except equations. One example of the students’ responses:
• No. Only the equations were of any use to me. The rest just seemed to get in the way.
Table 3.6. Students’ responses for question 2 on the survey: Did representing the work-energy processes in multiple ways—words, sketches, bar charts and equations—help you learn energy concepts and solve energy problems? Explain why they were useful or not useful.

98
95% Use in Problem Solving (N = 67)
46%
These students used the energy bar charts and the multiple representations to solve problems at the beginning, but less and less as they became more familiar with the problems. Two examples of the students’ responses:
• I used them less as I became more of an expert. I began to go straight to writing out the formulas (for each type of energy) and the equations. But, I kept the bar chart ideas in the back of my mind.
• I did use them. I first used the bar chart just to see what parts I wanted in the equations, such as work from friction or potential spring energy. Then I would write the equation down and solve. Now I’ve become more able to solve problems. I still use the bars whenever I get confused. They really help to limit mistakes in writing the initial equation.
33%
These students used the energy bar charts and the multiple representations most of time when solving energy problems. Two examples of the students’ responses:
• I used the charts and representations throughout the process to be sure I was setting up the problem right without overlooking important details. Converting one representation to another was just one more way I double checked my work.
• I used the charts every time, although I didn’t always write it down on paper. It’s a safe guard [sic] that you are not neglecting any form of energy.
16%
These students used the energy bar charts and the multiple representations in other ways. Two examples of the students’ responses:
• I personally only used the bar charts if I felt the situation was difficult enough to require a further analysis. However, at the beginning I used the bar charts for every problem and they really helped me grasp the concepts.
• I used them very little in the very beginning, but then I realized their uses. Once I became familiar with them, I was able to be more comfortable solving problems. Now I have worked with many different problems, I use them to check my work.
5% Not Use in Problem Solving (N = 67 in total)
5%
These students did not use this method unless it was required. They just preferred to use equations or got help from the textbook.
Table 3.7: Students’ responses for question 3 on the survey: Did you (or how did you) use the energy bar charts and the multiple representations of work-energy processes to solve energy problems while doing homework, group problems in recitation, problems in lab, and/or on exam problems? Did you use them when first becoming familiar with the concepts and then less as you become more expert at solving work-energy problems?

99
variety of students. Nine percent of the students thought that the multiple representations
were helpful in understanding the energy concepts, but were sometimes a waste of time
for quantitative problem solving. Seven percent of the students still just liked to use
equations directly in their problem solving.
From the students’ responses, we find that this multiple-representation technique
is helpful to most students in learning the concepts of work and energy and in solving
related problems. It helps students develop a deeper conceptual understanding while
solving problems.
3.3.1.2 Student Performance on a Tutorial-Type Question
Although the work-energy bar charts and the multiple-representation approach are
developed as a problem-solving strategy to help students acquire problem-solving
expertise, they emphasize the development of qualitative understanding and reasoning
about work-energy concepts and processes. Does performing this type of qualitative
analysis improve student scores on conceptual work-energy questions? To address this
question, we examined our students using a tutorial-type work-energy problem (shown in
Figure 3.19) developed by the Physics Education Group at The University of Washington
(UW) [15, 16].
The problem in Figure 3.19 asks students to compare the final kinetic energy of
two pucks having different masses pushed by the same force across the same distance.
The OSU honors engineering freshmen were given this problem on a survey test at the
end of winter quarter of 1998—one quarter after they had studied the introduction of the
work-energy method in the autumn quarter of 1997. Out of the 56 students, about 60% of
them gave correct answers with correct reasoning in words or by using equations. The
same problem was given on the final exam to a regular OSU engineering calculus-based

100
Figure 3.19: The problem originally developed by the Physics Education Group at UW was administered to the OSU honors engineering freshmen one quarter after they had learned the work-energy method. The students were told that their scores on the problem did not affect their class grades. This problem was also given to 147 OSU regular calculus-based introductory physics students after standard instruction in which the bar charts and the multiple-representation strategy had not been used.
m
F F
Finish
4m
Start
The diagram depicts two pucks on a frictionless table. Puck II is four times as massive as puck I. Starting from rest, the pucks are pushed across the table by two equal forces. Which puck has the greater kinetic energy upon reaching the finish line? Explain your reasoning.

101
physics class after standard instruction in which the bar charts and the multiple
representation strategy had not been used. Only about 20% of 147 students in this class
provided correct explanations for the problem.
The paper by T. O’Brien Pride and et al. [16] reports that after standard lecturing
for 985 regular and honors calculus-based physics students from UW, just 15% got
correct answers with correct reasoning on this question. In addition, for 74 UW tutorial
instructors (most of them graduate teaching associates) before teaching the Washington
work-energy tutorial sections, 65% answered correctly with correct explanations.
Furthermore, it is interesting to see from this paper that before the tutorials, 65% of 137
physics faculty from the national tutorial workshops successfully produced correct
answers to the question shown in Figure 3.19. The proportion of these different groups
successfully answering this question is summarized in the bar graph in Figure 3.20. The
OSU calculus-based honors engineering freshmen learning the multiple-representation
strategy and using the energy bar charts performed on this problem much better than
regular and honors calculus-based physics students both from OSU and from UW, and
they did almost as well as physics faculty and physics graduate students.
3.3.1.3 Student use of the multiple-representation strategy in problem solving
How did students use the multiple-representation method to solve energy
problems? In the survey with the three free-response questions administered to the 67
honors engineering freshmen, the last question asked how the students used the work-
energy bar charts and the multiple representations for solving problems. A summary of
the student responses are reported in Table 3.7. We find that most of the students used
this method to solve problems. Although about half of the students used it less and less

102
Figure 3.20: The graph shows the proportion of each group that correctly answered the question shown in Figure 3.19. Bars 1 and 2 indicate that no more than 20% of over one thousand calculus-based physics students from UW and OSU answered and explained the problem correctly after standard instruction. Bars 3 and 4 indicate that 65% of about two hundred physics graduate students and faculty correctly provided the answers and reasoning for the problem on pretests before the UW tutorials. Bar 5 indicates that 60% of more than fifty OSU honors engineering freshmen successfully answered the question with correct reasoning.
1 2 3 4 5
1. UW-Regular Eng.
2. OSU-Regular Eng.
3. UW-Graduate TA
4. Physics Faculty
5. OSU-Honors Eng. 0%
10% 20%
30%
40%
50% 60%
70%
80%

103
when becoming more familiar with energy problems, many of them still kept the energy
bar charts in their mind as a useful problem-solving tool in evaluating their solutions.
But did the students actually apply the multiple-representation method when
rushing through their exams? On the final exam problem (see Figure 3.21) given in this
calculus-based honors engineering freshmen class, 66% of the students constructed a
pictorial representation of the process. Fifty-seven percent of the students solved the
problem using the work-energy method, but 43% of them applied Newton’s second law.
Among the 57% of students who used the work-energy approach, about 16% of them
drew a qualitative work-energy bar chart, and 79% of them correctly constructed the
generalized work-energy equation.
From the above results, we saw that many students made a pictorial sketch to help
them understand the problem, but not many actually constructed a work-energy bar chart
on the final exam problem. There could be several reasons for this. With the time
Figure 3.21: A problem that appeared on the final examination in a calculus-based class for honors engineering freshmen in the autumn quarter of 1997.
A Soap Box Derby car starts at rest and coasts 50 m down a steep 200 incline. The effective coefficient of friction due to all sources is 0.10. How fast is the car moving after traveling 50 m? Assume g = 10 m/s2. You must show all of the work supporting your answer or no credit will be given.

104
pressure needed to complete an exam, students skip steps that they feel are not absolutely
necessary to complete the solution. Students’ responses on the survey question in Table
3.7 indicate that many students had become more familiar with work-energy problems
and had learned to draw the bar charts mentally—they no longer needed to draw them
explicitly. A similar effect can be found for students using the motion diagrams to solve
kinematics problems. The students explicitly drew the motion diagrams less and less
frequently as their expertise developed and they could construct the motion diagrams
mentally. Alternatively, this final exam problem may not have been difficult enough for
most of the students to need to use the work-energy bar charts to complete the solution.
Finally, it might be that some students felt the bar charts were not useful in problem
solving, and so there was no reason to use them.
3.3.2 Discussion of the Assessment Results
From the measurements of student responses on the written survey questions, on
the conceptual reasoning question, and on the final exam problem, we find that more than
80% of the students thought the work-energy bar chart and the multiple-representation
strategy was useful for them in understanding the work-energy concepts and in solving
related problems. Students’ performance on the tutorial-type question indicates that
representing a work-energy process in multiple ways, especially using qualitative
representations, helps the students develop meaningful understanding about the physical
processes. However, we also find that not many students actually constructed the work-
energy bar chart on their solutions to the final exam problem. There are still some critical
research questions that need to be investigated further. For instance, do students have
better performance on complex energy problems using this method instead of using other

105
approaches? How do students solve work-energy problems after learning this multiple-
representation strategy? That is, do they still use a formula-centered approach or do they
use this multiple-representation method? To address these research questions, we
conducted a series of assessment activities in the autumn 1999 at OSU. In Section 3.3.3
below, we report these evaluation results.
3.3.3 Evaluation Results (Autumn 1999)
In the autumn quarter of 1999, we conducted a series of assessments in a calculus-
based introductory mechanics class at OSU for honors engineering freshmen (Physics
131E) that learned this multiple-representation strategy. In addition to the survey
questions given in the autumn quarter of 1997, the evaluation also included in-depth
individual student interviews and a comparison of student performance for this class and
another honors class on a complex work-energy problem. This ten-week class covered
the regular concepts of mechanics: kinematics, Newton’s dynamics, momentum, work
and energy, and some rotational dynamics. The students studied work and energy
concepts for about six lecture periods, three recitation periods, one lab period, and in their
homework assignments.
3.3.3.1 Student Attitudes towards the Energy Bar Charts and the Multiple Representation Approach of Solving Work-Energy Problems
The survey questions of the autumn 1999 version are slightly different from the
ones given in the autumn quarter of 1997: the first two questions are the same, but we
slightly modified the last question. The last question from autumn 1997 asks: “Did you
(or how did you) use the energy bar charts and the multiple representations of work-
energy processes to solve energy problems while doing homework, group problems in
recitation, problems in lab, and/or on exam problems? Did you use them when first

106
becoming familiar with the concepts and then less as you become more expert at solving
work-energy problems?” We think this question, especially the second part, is a leading
question. Hence, we revised the last question as: “Did you (or how did you) use the
energy bar charts and the multiple representations of work-energy processes to solve
energy problems while doing homework and/or exam problems?”
This revised survey was administered to the honors engineering freshmen in 131E
to evaluate what they thought about the role of the work-energy bar charts and the
multiple-representation strategy. Students’ answers on each of the three free-response
survey questions are summarized in Tables 3.8, 3.9, and 3.10. Below, we discuss in detail
the students’ responses for Questions 1 and 2, which are listed in Table 3.8 and 3.9. The
students’ responses for Question 3 are discussed in Section 3.3.3.5.
Table 3.8 reports a summary of the students’ responses for question 1 on the
survey: “Did using the energy bar charts help you learn energy concepts and solve work-
energy problems? Explain why they were useful or not useful.” This question is the same
as the one given in the autumn 1997. We found that of 76 students, eighty-six percent
thought that the energy bar charts were useful. Fifty-seven percent thought that the
energy bar charts helped them visualize what is happening to different types of energy in
energy problems, and set up the right equations to solve the problems easily. Seventeen
percent thought that the energy bar charts helped them understand the abstract energy
concepts and the energy conservation better. Seven percent thought that the energy bar
charts were helpful in learning the energy concepts at the beginning, and that after a
while they could create the bar charts mentally rather than write them out. Fourteen
percent of the students preferred using equations directly rather the energy bar charts.

107
86% Useful (N = 76)
57%
These students thought that the energy bar charts helped them visualize what is happening to different types of energy in energy problems, and set up the right equations to solve the problems easily. Two examples of the students’ responses:
• The bar charts were helpful. It’s a technique I’ve never really seen before. They were helpful because they give an easy-to-understand graphical representation of what’s going on. From the graphs, it’s then pretty easy to write out the work-energy equations.
• Yes. It helps me to visualize the conservation of energy throughout the processes. Once you have the bar chart done all you have to do is plug in equations and values.
17%
These students thought that the energy bar charts helped them understand the abstract energy concepts and the energy conservation better. Two examples of the students’ responses:
• I think they were useful in visualizing the concept of energy conservation. • I think that they are very useful to the students when first learning about
conservation of energy. It teaches the students to make initial and final energy balance out and not to forget any of the energy.
7%
These students thought that the energy bar charts were helpful in learning the energy concepts at the beginning, and after a while they could create the bar charts mentally rather write them out. One example of the students’ responses:
• These charts were helpful at first because they helped us see which terms to use from the “universal” energy conservation equation. But eventually I could pick up on which terms to use without the bar charts.
5%
These students thought that the energy bar charts were helpful, but they did not explain their reasons.
14% Not Useful (N = 76)
14%
These students preferred using equations directly rather the energy bar charts. One example of the students’ responses:
• No, they were annoying. They were actually more confusing because I had to think how much energy was in what form. That’s what you can see after you do the equation.
Table 3.8: Students’ responses for question 1 on the survey: Did using the energy bar charts help you learn energy concepts and solve work-energy problems? Explain why they were useful or not useful.

108
82% Useful (N = 76)
82%
These students thought that the multiple-representation strategy was helpful to understand the concepts better, and to set up the problems correctly, and was a good teaching method to help a variety of students learn physics. Two examples of the students’ responses:
• Having the concepts in several forms helps me to see how the energy is conserved and helps to explain what is going on. Each representation shows in a different way what is happening in the system. This makes the parts of the problem easier to understand and pick out.
• I think that multiple descriptions definitely help with the learning process in physics. By giving the students multiple descriptions, it gives the students a complete understanding of how things work. .
10%Useful and Not Useful (N = 76)
10%
These students thought that the multiple representations were helpful to understand the energy concepts, but were sometimes a waste of time for quantitative problem-solving. One example of the students’ responses:
• It helped in some cases, but when it was required and not really needed, it was annoying. If we can figure out a problem without going through everything, we should be able to once in a while.
8% Not Useful (N= 76)
8%
These students thought that the multiple representations were not helpful except equations. One example of the students’ responses:
• I prefer numbers over all that stuff. It’s a pain to require us to do a bunch of busy work.
Table 3.9: Students’ responses for question 2 on the survey: Did representing the work-energy processes in multiple ways—words, sketches, bar charts and equations—help you learn energy concepts and solve energy problems? Explain why they were useful or not useful.

109
88% Use in Problem Solving (N = 76)
19%
These students used the energy bar charts and the multiple representations to solve problems at the beginning, but less and less as they became more familiar with the problems. Two examples of the students’ responses:
• When first doing these problems I used the bar chats to assist in visualizing the problem. And this made it easier to set up the equations… After I got the hand of it though, the bar charts were no longer necessary to actually draw.
• I used them at first, but after I became accustomed to the concept, I used the bar charts less frequently.
31%
These students used the multiple representations, especially the energy bar charts, most of time when solving energy problems. Two examples of the students’ responses:
• Whenever possible I always tried to use energy bar charts including on homework, midterm, and even a few practice problems. I think using energy bar charts greatly increases my overall understanding of the problem.
• I always made a bar chart before working with equations. This way I knew visually what equations to use and I was more sure on what to use in my equations.
30%
These students explained that they used the bar charts to help set up equations correctly when solving the problem. Two examples of the students’ responses:
• I used bar charts to outline the setup for a problem, and then used sketches and arrows to reinforce my bar charts and check vector directions and overall problem setup. After this, setting up equations was easy, just correspond pictures and energy bars to formulas.
• I created the bars for the applicable forms of energy, then derived my equation from this bar chart. When having the choice between using work-energy problem solving method or another method, the work-energy is almost always simple and more straightforward. If often makes the problem easier to understand, the work involved easier to follow, and thus overall, less mistakes are made.
8%
These students used the energy bar charts and the multiple representations in other ways. One example of the students’ responses:
• Honestly, when working by myself I rarely used them, again except when the problems were multi-part and complex.
12% Not Use in Problem Solving (N = 76 in total)
12%
These students did not use this method unless it was required to do so. They just preferred to use equations.
Table 3.10. Students’ responses for question 3 on the survey: Did you (or how did you) use the energy bar charts and multiple representations of work-energy processes to solve energy problems while doing homework or exam problems?

110
Question 2 in the survey is same as the one given in the autumn 1997 as well. Table 3.9
reports a summary of the students’ responses for Question 2: “Did representing the work-
energy processes in multiple ways—words, sketches, bar charts and equations—help you
learn energy concepts and solve energy problems? Explain why they were useful or not
useful.” Out of 76 students, eighty-two percent thought that this multiple representation
strategy was helpful: helped them understand the concepts better; set up the problems
correctly; and be a good teaching method for a variety of students learn physics. Ten
percent thought that the multiple representations were helpful in understanding the
energy concepts, but were sometimes a waste of time for quantitative problem solving.
Eight percent still just liked to use equations directly in their problem solving.
From the students’ responses for the Questions 1 and 2, we see that these results
are very similar to those from autumn 1997. The consistency of the students’ responses
from these two classes indicates that most students appreciated the use of this multiple-
representation strategy in helping learn the concepts of work and energy. Many students
realized that the work-energy bar chart helps them visualize the energy transformation
among different types of energies and “see” the conservation of energy during a physical
process. Also, a large number of students were conscious of the crucial role that the
work-energy bar chart plays in helping them set up equations correctly and readily.
Furthermore, we find that the multiple-representation technique is helpful for most
students to learn the concepts of work and energy and to solve related problems. It helps
students develop deeper conceptual understanding while solving problems.

111
3.3.3.2 Student Performance on a Written Test Question (Bullet-Block-Spring Problem)
Did students who experienced the multiple-representation technique have better
performance on work-energy problem solving than others who learned some other
approach with the work-energy concepts? To address this research question, we
administered a written test problem (see Figure 3.22) to the Physics 131E class on the
final examination in autumn 1999. Also, a similar test question (see Figure 3.23) was
given to the Physics 131H class, an honors class for physics majors, who were exposed to
the concepts of work-energy in other approaches. In this section, we report how the 131E
students performed on the problem shown in Figure 3.22. In the next section, we discuss
how the 131H students performed on the problem shown in Figure 3.23.
The question shown in Figure 3.22 was administered to 77 students who were
exposed to the concepts of work-energy using the multiple representation strategy. This
question can be divided into two small sub-problems. The first one includes the
interaction between the bullet and the block, a momentum conservation problem. The
second sub-problem includes the interaction between the block-bullet system and the
spring, an energy conservation problem. To determine the bullet’s speed before it hits the
block, the student needs to solve both sub-problems correctly. Overall, out of 77 students,
72% solved the problem correctly. For research interest, below we report in detail about
students’ performance on the second part of the problem—the interaction between the
block-bullet system and the spring, an energy conservation problem. This part is referred
to as the energy problem in the following.

112
Figure 3.22: The problem was given on the final exam for the honors engineering freshmen who had learned the work-energy bar charts and the multiple-representation strategy with the concepts of work and energy.
131E Autumn 1999 N = 77
Mathematical representation
% Total
Physical representation (Work-Energy Bar Chart)
Algebraic representation
Numerical representation
Correct Answer 77% 38% 73% 4%
Incorrect Answer 22% 6% 18% 4%
Not include mass of bullet
8% 3% 7% 1%
Incorrectly apply the conservation of energy
9% 3% 9% 0%
Apply Newton’s laws 5% 0% 2% 3%
Unclear 1% N/A
Table 3.11: Students’ performance on the energy problem that is a sub-part of the problem shown in Figure 3.22. This energy problem includes the interaction between the bullet-block system and the spring.
A 0.10-kg bullet is fired into at 1.90-kg block. The block is attached to a spring of force constant 1000 N/m. The block slides for 0.40 m while compressing the spring after the bullet runs into the block. Determine the bullet’s speed before it hit the block. Assume that the gravitational constant is 10 m/s2. You must show all of the work supporting your answer or no credit will be given.
v0 ?

113
The performance of the 77 Physics 131E students on this energy problem is
summarized in Table 3.11. Overall, 77% solved the energy problem correctly, 44% drew
the work-energy bar chart in their solutions, 91% set up the generalized work-energy
equation, and only 8% played with numbers in their solutions. It is also interesting to see
that among the 77% students who correctly answered the problem, about 50% drew
work-energy bar charts in their solutions. But among the 22% students who incorrectly
answered the problem, only about 27% drew work-energy bar charts.
3.3.3.3 Student Performance on a Similar Bullet-Block-Spring Problem after Standard Instruction
In autumn quarter 1999 at OSU, we also collected data from a calculus-based
introductory mechanics class for honors physics majors (Physics 131H). This was a ten-
week standard lecture-based class. It covered the regular concepts of mechanics:
kinematics, Newton’s dynamics, momentum, work and energy, and some rotational
dynamics. The students worked with the work and energy concepts for about twelve
lecture periods, one lab period, and in their homework assignments. The class was taught
by an experienced professor and placed emphasis more on theoretical inferences and on
mathematical derivations.
The problem shown in Figure 3.23 was administered on the final examination in
the Physics 131H class in the autumn quarter of 1999. This question is similar to the one
(see Figure 3.22) given to the Physics 131E class who learned the work-energy bar chart
and multiple-representation strategy with the concepts of work-energy. Similarly, it could

114
Figure 3.23: The problem was given on the final exam for the honors physics majors who had learned the work-energy concepts in standard instruction.
A bullet (1.0 g) is fired into at a stationary190 g block that is attached to a spring (k = 100 N/m). The collision between the bullet and the block occurred so quickly that the block did not move significantly. After the bullet embedded itself in the block, the block slid 0.40 m before it stopped.
a) Immediately after the collision between the bullet and the block, how fast was the block moving?
b) Suppose that friction between the block and the underlying surface was negligible. From the given maximum compression of the spring, how fast was the bullet moving before it hit the block?
v0

115
131H Autumn 1999 N = 52
Mathematical representation
% Total
Physical representation (Work-Energy Bar Chart)
Algebraic representation
Numerical representation
Correct Answer 48% 0% 36% 12%
Incorrect Answer 52% 0% 28% 24%
Not include mass of bullet
6% 0% 4% 2%
Incorrectly apply the conservation of energy
6% 0% 2% 4%
Apply Newton’s laws 11% 0% 3% 8%
Not solve the problem 21% 0% 19% 2%
Other errors 8% 0% 0% 8%
Table 3.12: Students’ performance on the energy problem that is a sub-part of the problem shown in Figure 3.23. This energy problem includes the interaction between the bullet-block system and the spring.

116
be divided into two small sub-problems. The first one includes the interaction between
the bullet and the block, a momentum conservation problem. The second sub-problem
includes the interaction between the block-bullet system and the spring, an energy
conservation problem. A major difference between the problems shown in Figures 3.22
and 3.23 is that the two separate questions in Figure 3.23 had explicitly broken the
problem into the two small sub-problems. This might have made the problem in Figure
3.23 easier, since less effort is needed by a student to identify and break the problem as a
whole into the smaller ones.
Overall, out of 52 physics majors, 25% correctly answered both question a) and b)
of the problem shown in Figure 3.23. Student performance on question a), which is the
energy problem, is summarized in Table 3.12. Overall, 48% of the students correctly
solved this energy problem; 64% started the problem with the generalized work-energy
equation; but 36% still played with numbers in their solutions. Not surprisingly, none of
the students used the work-energy bar chart s or any other physical representations in
their solutions, since they had learned only to use mathematical expressions to represent
work-energy processes.
3.3.3.4 Comparison of Student Performance on the Two Bullet-Block-Spring Problems To make this comparison meaningful, we carefully checked some factors that
could have significantly affected the comparison results (See Table 3.13). First, the two
professors taught these two classes were both very experienced instructors; both had
taught these classes before. Second, honors engineering freshmen in Physics 131E class
were exposed to the concepts of work and energy for about two weeks, while honors

117
131E 131H Student academic background
Honors engineering freshmen Honors physics or mathematics majors
Autumn 1999 63.4% 57.1%
Autumn 1998 59.8% 64.5%
Pretest scores of FCI
Autumn 1997 unknown 65.3%
Table 3.13: Pretest scores of the FCI from honors engineering students and honors physics or mathematical majors. The test was given at the very beginning of each quarter. physics and mathematics majors were exposed to the concepts of work and energy for
about three weeks. Third, we kept track of students’ pretest scores on the Force Concept
Inventory (FCI) [17] from the autumn quarter of 1997 through the autumn quarter of
1999. On the basis of the test scores, we saw that the two classes had very similar
performance on the pre-FCI tests. Therefore, it seemed reasonable to compare the student
performance on the two bullet-block-spring problems.
Comparing data in Tables 3.11 and 3.12, we found that overall the honors
engineering freshmen who learned the multiple representation strategy performed better
than the honors physics or mathematics majors on the energy problems of the two similar
bullet-block-spring problems. Furthermore, the former performed more expert-like than
the latter. Of 77 honors engineering students, in addition to about the half using the work-
energy bar chart, about ninety percent set up the generalized work-energy equation and
only eight percent just played with numbers in their solutions. In contrast, of 52 honors
physics or mathematics majors, overall, sixty-four percent set up the generalized work-
energy equation and thirty-six percent played with numbers in their solutions. To further
investigate how the students from these two classes solved work-energy problems, we
118
solicited some volunteers from these two classes and conducted think-aloud individual
student interviews. Interview results are discussed in Section 3.3.3.6.
3.3.3.5 Student Use of the Multiple-Representation Strategy in Problem Solving
In autumn 1999, we also investigated how students use the multiple-
representation method to solve energy problem. It was very important to understand
whether this strategy was helpful in student solving work-energy problems and, if so,
how it was helpful. In addition to a survey question that asked how students used this
strategy, we analyzed students’ solutions of one examination problem. Below, we discuss
students’ responses to the survey question and their solutions for a work-energy problem
that appeared on their examination.
In the survey with the three free-response questions administered to the 76 honors
engineering freshmen, the last question asked the students: “Did you (or how did you)
use the energy bar charts and multiple representations of work-energy processes to solve
energy problems while doing homework or exam problems?” Students’ responses to this
question are summarized in Table 3.10. We found that, overall, eighty-eight percent of
the students commented that they used this method to solve problems, while only about
twelve percent responded that they just liked to use equations to solve work-energy
problems unless they were required to use qualitative representations such as the work-
energy bar charts. Furthermore, it appeared that about thirty-one percent of the students
used this strategy, especially the work-energy bar charts, most of time when solving
energy problems. Again, we found that about nineteen percent of the students used it less
and less as they became more familiar with energy problems. But many of them still kept
the energy bar charts in their minds as a useful problem-solving tool in evaluating their

119
solutions. It was also interesting to see that about thirty percent of the students explained
that they used the work-energy bar charts to help set up equations correctly when solving
the problems.
But did the students actually apply the multiple-representation method when
rushing through their examinations? We collected students’ solutions for a midterm
examination problem from two of the three recitation sections of this calculus-based
honors engineering freshmen class. By this midterm examination time, the students had
learned the concepts of work and energy. The problem shown in Figure 3.24 was one of
the problems given on their one-hour examination. This problem could be readily solved
applying the conservation of energy principle. Students’ solutions were analyzed from a
perspective of the multiple representations. The results are summarized in Table 3.14.
Overall, out of 55 students, seventy-eight percent answered the problem correctly.
Seventy-three percent drew the work-energy bar chart in their solutions, and eighty-eight
percent constructed the algebraic representation of the generalized work-energy equation.
We also found that all of these seventy-three percent of students set up the work-energy
equations that were consistent with the bars in their work-energy bar charts.
On the basis of the results in Table 3.14, it appeared that most students
constructed the physical representation to help them understand the problem. Comparing
the assessment result we got in the autumn quarter of 1997 (see Section 3.3.1.3), we
found that more students constructed the work-energy bar chart in their solutions for the
problem shown in Figure 3.24. There could be several reasons for this. The problem
shown in Figure 3.24 was difficult to be answered applying Newton’s laws, but the

120
Figure 3.24: The work-energy problem given on the midterm exam of 131E class. The exam was given when the students just had learned the multiple-representation strategy with the concepts of work and energy.
131E Autumn 1999
N = 55 (From two of the three recitation sections)
Mathematical representation
% Total
Physical representation (Work-Energy Bar Chart)
Algebraic representation
Numerical representation
Correct Answer 78% 64% 73% 5%
Incorrect Answer 20% 9% 15% 5%
Unclear 2% N/A
Table 3.14: Students’ performance on the problem shown in Figure 3.24.
A 3200 N/m spring initially compressed 2.0 m launches an 80 kg cart up a 370 incline. A 100 N friction force opposes the motion. How far up the incline will the cart travel before coming to a stop? Assume that the gravitational constant is 10 N/kg. Be sure to show your work.

121
problem shown in Figure 3.21 could be answered easily either applying Newton’s laws or
the conservation of energy principle. Thus, more students applied the conservation of
energy principle to solve the problem shown in Figure 3.24; there were more possibilities
for students to use the work-energy bar chart in problem solving. The problem shown in
Figure 3.24 was harder than the one shown in Figure 3.21. Students needed to further
reason about the former. So the work-energy bar chart could help them understand the
problem and set up the equation. The problem in Figure 3.24 was given in the midterm
examination in autumn 1999 when students just learned the concepts of work and energy.
But the problem in Figure 3.21 appeared on the final examination in the autumn quarter
of 1997.Students might keep the multiple-representation technique fresher right after they
learned it than after a while.
Overall, apparently, many students used the physical representation in their
problem solving. For research interest, we conducted in-depth think-aloud individual
student interviews to probe how students used the work-energy bar chart in their problem
solving.
3.3.3.6 Think-Aloud Individual Student Interviews
After honors engineering freshmen (the Physics 131E students) learned the
concepts of work and energy using the multiple-representation technique in the autumn
quarter of 1999, we conducted follow-up interviews. Six students were interviewed from
this class on a voluntary basis. None of these six students were interviewed during the
pre-interview that was conducted before students learned the concepts of work and
energy. For research interest, we also interviewed, on a voluntary basis, four honors

122
students from the Physics 131H class in which honors physics or mathematics majors
learned the concepts of work and energy in other approaches.
Interview Procedure and Problems: During the interview, the students first
were instructed how to keep talking about what they were thinking while solving the
interview problems. To let them become comfortable with this think-aloud approach, the
students were given three warm-up exercise questions (see Appendix A).
After getting comfortable with “thinking aloud” while solving the problems, the
students were given three interview problems. We provided them an equation sheet,
which includes all basic equations from kinematics, Newtonian dynamics, work and
energy, momentum, and rotational dynamics. They were also allowed to use a calculator.
The student completed the interview problems (see Appendix F) in the following
consequence: Problem 1, Problem 2, and Problem 3. Each problem consisted of two
parts. The first part was a verbal problem statement. The second part included three
questions. The problem statement and the three questions were written on four separate
cards. They were placed face down and piled up in the order of the problem statement,
Question 1, Question 2, and Question 3. The students were instructed to flip over each
card and to answer each question in order. When they felt satisfied about their answers,
they could go to the next question on the card. When finishing all three questions of
Problem1, the student could get into Problem 2 and so on.
Problem 1 (see Appendix F) is a conceptual reasoning question. The correct
answer for Question 1 is that the two sleds have the same kinetic energy when they reach
the finish line. This question can be readily answered if one applies the work-energy
theorem. But it also can be answered applying Newton’s second law plus kinematics
123
equations. Based on the answer to question 1, it is easy to answer Question 2: Sled B has
the greater speed since it is less massive. For Question 3, again, based on the work-
energy theorem, we know that sled A has the greater kinetic energy. Notice that there are
no numbers given in this problem. We attempted to probe whether or not the students
could use algebraic representations to answer the questions.
Problem 2 (see Appendix F) involves a complex physical process. To answer
Question 1, one needs to do quantitative calculation either applying the conservation of
energy principle or by Newton’s laws plus kinematics equations. But it is much easier to
use the concepts of work-energy than those of dynamics and kinematics. Questions 2 and
3 are both qualitative questions. The correct answer for Question 2 is that the speed of the
toy car will be the same right before it lands on the floor. For question 3, the correct
answer is that the speed of the toy car will become less right before it lands on the floor,
if the height of the table is lowered.
Problem 3 is also a complex work-energy problem. It is easier to be answered
applying the conservation of energy principle. Questions 1 and 2 are quantitative
questions and Question 3 is a qualitative one.
Notice that the three problem statements do not include any sketches. We
intended to investigate how students used pictorial, physical, and mathematical
representations to solve the problems. Working papers and pencils were provided to the
student and a calculator was allowed to use if needed. Student’s paper–pencil solutions
were collected and his or her verbal explanations were recorded.

124
3.3.3.7 Student Performance on the Interview Problems
We carefully analyzed two sets of problem solutions produced by two students,
one from the Physics 131E class and one from the Physics 131H class. The former
learned the multiple-representation strategy with the concepts of work and energy, while
the latter learned those concepts in other approaches. Their detailed solutions are
illustrated in Appendices G and H, respectively.
Solving for Problem 1, the 131E student used the concepts of Newton’s second
law and kinematics. After reading the problem statement, he drew a sketch and labeled
related known information. To answer Question 1 in the problem, he started with the
concept of kinetic energy (the question goal). To compare the kinetic energy of sled A
with the kinetic energy of sled B at the finish line, he realized that he needed to figure out
their final speeds. Then he used Newton’s second law and a kinematics equation (not
including time) to derive speed squares (V2) for both sleds A and B. After this, he
plugged each V2, respectively, into the sled A’s kinetic energy equation and the sled B’s
kinetic energy equation. By comparing the two kinetic energies, he correctly answered
Question 1. To answered Questions 2, he referred to the speed square (V2) equations that
he got from Question 1. To answer Question 3, he used the final kinetic energy equations
in his solution for Question 1 to reason. He correctly answered Questions 2 and 3.
The 131H student did not make any drawings but wrote down given information
after reading the problem statement in Problem 1. To answer Question 1, she started with
a work-energy theorem idea. She explicitly realized that the work done on sleds A and B
was the same since the forces exerted on both and the distances they traveled were the
same. She also recalled: “the work done equals the change of kinetic energy.” But she
125
gave up with this idea after she realized that the work done equaled the change of kinetic
energy, but not kinetic energy itself, which was asked to solve for. She shifted to use
Newton’s second law. After she found that the acceleration of sled A would be different
from that of sled B since they had the different masses, she realized that the more
massive sled could move slow. Then she shifted to look for the kinetic energy of each
sled at the finish line. After she plugged the mass into the kinetic energy equations of
sleds A and B, she said: "if speeds for sleds A and B are the same, then they have the
same kinetic energy at the finish line. But I don't know if their speeds are same or not."
Then she looked back for Newton’s second law and used it with the velocity equation
(including time) to derive the speeds of sleds A and B. Finally, she plugged the speed
expressions back to the kinetic energy equations and derive the final kinetic energies of
sleds A and B at the finish line. Since she ignored the time differences in motions of sleds
and B, she incorrectly answered Question 1.
To answer Question 2, this 131H student used her speed equations from Question
1. But she still could not correctly answer Question 2. For Question 3, she started with a
work idea, and then tried to use the work-energy theorem to solve for the kinetic energy.
To answer Problem 1, both the students used algebraic representations; none of
them assigned numbers for physics quantities used in the problem. But compared their
solutions, apparently, the 131H students shifted more often between different concepts
such as the work-energy theorem, Newton’s second law and kinematics, and the
definition of kinetic energy. She made a decision to shift her idea each time partly by
looking at the equation sheet and partly by thinking about the problem goal or sub-goals.

126
This is one of the characteristics of naïve problem solving identified from a study done
by Jill Larkin et al. (see Section 2.2.3.1 for more details).
For solving Problem 2, the 131E student first drew a pictorial representation—a
clear sketch with given information labeled. Then he constructed a simplified work-
energy bar chart (see Figure 3.25) to help him understand the problem: he wrote down
each possible energy term, represented by each letter, in the chart, and used it as a guide
to check whether each type of energy was zero or not in the initial and final states. He
drew a bar for each non-zero type of energy, and also made the final kinetic energy bar as
high as the sum of the initial gravitational potential energy bar and the initial elastic
potential energy bar (i.e., spring energy bar). Then he used the complete work-energy bar
chart to set up the generalized work-energy equation: one expression of energy term in
the equation for each bar in the bar chart (see Figure 3.25). After he constructed the
generalized the work-energy equation, he substituted numbers into the equation and
solved for the unknown variable.
To answer Question 2, which is a qualitative question, he used the generalized
work-energy equation to reason. For Question 3, which is also a qualitative question, he
used the work-energy bar chart to reason about it.
Clearly, this 131E student solved Question 1 by working forward—from the given
information to the desired quantity. His problem solving procedure explicitly consisted of
three stages: drawing a sketch, developing a physical representation—the work-energy
bar chart, and applying a mathematical equation—the generalized work-energy equation.
Also, after he set up the generalized work-energy equation, he treated as one single step
by substituting the values of the quantities in it and solving for the

127
Figure 3.25: A part of the solution produced by the 131E student for solving Question 1 in the interview Problem 1. He constructed the work-energy bar chart, used it to set up the generalized work-energy equation, and then plugged numbers into the equation to solve for the unknown quantity.
S Ug K S Ug K
vmkxmgh 22
21
21
=+
.05 kg (10 m/s2) (1 m) + ½ (100 N/m)(.2 m)2 = ½(.05 kg)v2
.5 + 2 = .025v2 2.5/.025 = v2 v = 10 m/s

128
unknown variable. All these features were identified, from studies by Jill Larkin et al., as
problem solving strategies often used by experts.
The 131H student also started by drawing a sketch and labeling known
information to help her understand Problem 2. By looking their paper solutions, we found
that the drawings that both of the 131H and the 131E students made were almost identical
and equally good. After this step, their solutions become very different. To answer
Question 1, the 131H student started with the goal—find the speed of the toy car just
before hitting the floor. Then she looked at the equation sheet and decided to solve for the
kinetic energy of the toy car just before the hitting. So she started to look at the top of the
ramp and to use the concepts of work and energy to solve the question. Her detailed
solution is shown in Figure 3.26. She did not set up the generalized work-energy
equation. Instead, she separately calculated the initial energy (i.e., P = mgy) and the final
energy (i.e., 1/2mv2 = 0.9 J). Apparently, she relied on numerical representations to
answer the question. She used her sketch (i.e., a pictorial representation) to reason about
Questions 2 and 3 and incorrectly answered them.
Apparently, the solution of Problem 2 produced by this 131H student reflected the
following features: 1) jumping from the sketch to mathematical equations; 2) using a
numerical-representation-centered approach, instead of constructing the generalized
work-energy equation—an algebraic representation; and 3) relying on the pictorial
representation to reason about the conceptual questions. These are identified as naïve
problem solving characteristics by other researchers (see Section 2.2.3.1 for more details)
and studies done in this dissertation.

129
Figure 3.26: A part of the solution produced by the 131H student for solving Question 1 in the interview Problem 2. She did not set up the generalized work-energy equation. Instead, she separately calculated the initial energy (i.e., P = mgy) and the final energy (i.e., 1/2mv2 = 0.9 J).
JPmsmkgP
ygmP
9.08.11005.0 2
=⋅⋅=
⋅⋅=
smsmvsmv
Jmv
Jmv
JK
66
36
8.1
9.021
9.0
222
2
2
−=±=
=
=
=
=

130
For Problem 3, both Questions 1 and 2 are quantitative ones, but Question 3 is a
qualitative question. As shown in Appendix G, the solutions produced by the 131E
student consisted of three steps: a sketch with known information, the work-energy bar
charts, and the generalized work-energy equations. From a perspective of the multiple
representations in problem solving, his solutions consisted of three representations: the
pictorial, physical, and mathematical representations. He used the generalized work-
energy equation from Question 2 to reason about Question 3. Apparently, his solutions
reflected critical features of expertise in problem solving.
To answer Problem 3, the 131H student also constructed a sketch with related
known information labeled. To solve for Question 1, she started with a work-energy idea.
She tried to identify what types of energy that the model cart had at the point leaving the
plateau, at the top of the first hill, and at the top of the second hill. She got a hard time to
think about this mentally and to memorize the different types of energy. Then she labeled
to the above three points as 1), 2), and 3), and wrote down
at 1) P + K,
at 2) P/2 + K,
at 3) P + 0, and
where P represented gravitational potential energy and K represented kinetic energy.
Then she assumed that the above equations had to be equal because of the conservation
of energy. She assigned U for a constant and revised the above equations as
at 1) P + K = U,
at 2) P/2 + K = U, and
at 3) P + 0 = U.

131
Then she tried to see how the potential energy and kinetic energy change at these three
points. She said: “I’m trying to visualize what’s happening to the energy at these different
points.” She used her sketch and started to think about the potential and kinetic energies
at point 1) (at the top point of the plateau). After she realized that she only knew the
potential energy but not the kinetic energy at this point, she wrote down P1 = mgh,
plugged into numbers, and calculated P1 = 1 J. Then she tried to reason about how the
potential energy and kinetic energy changed at point 2) (at the top of the first hill). She
said: “the potential energy would be 0.5 J since its height is 0.5 m. About the kinetic
energy, it should be as twice as that at the point 1). But I don’t know how large it (the
kinetic energy) is at point 1).” Then she looked at point 3) (at the top of the second hill)
and realized that the kinetic energy should be zero, but the potential energy was unknown
since she did not know the height of the hill, which was the desired variable. Then she
was stuck there. She tried to link the potential energy at point 3) with the energy at the
beginning point 1), but she realized that she did not know the kinetic energy at point 1).
Then she looked at her sketch and went back and forth between these three points for
several times, and had a difficulty imaging how the energy changed and the relationship
of the energies at different position. Finally, she looked at the equation sheet and said:
“I’m looking at equations, and hope these magic formula can tell me how to do it.” From
the equation sheet, she found the potential energy expression for a spring. She seemingly
got a cue from this equation and realized that the energy stored in the spring initially
should equal the kinetic energy that she was looking for. Then she used the given
numbers to calculate the spring potential energy. Finally, she added together two

132
numbers, the value for both the potential energy and the kinetic energy at the point of the
plateau, and solved for the desired variable.
To answer Question 2, she started by drawing a sketch. Then she used the
numerical result U = 2.6 J from her solution for Question 1 to calculate the potential
energy and kinetic energy at the second hill with the new height. After she got the value
for the kinetic energy of the cart at the beginning of the track, she tried to solve for the
speed of the cart at that point. Then she realized that this speed was not the desired
variable. She went back to look at the question and then used the work-energy theorem to
calculate the frictional force. As shown in Appendix H, she used numerical
representations to answer this question. To answer Question 3, she used her numerical
representations from Question 2 to reason.
This 131H student started with the concepts of work and energy and worked
forward to solve Questions 1 and 2. But, apparently, she struggled with imagining the
energy changes at the different points during the physical process described in the
problem. She wrote down symbolic equations to help her reason and memorize different
types of energy at the different points. But those symbols such as P or K could not let her
see visually how large they were in magnitude; she had to infer and memorize mentally.
It appeared that she needed an external, qualitative visual aid, between the pictorial and
symbolic representations, to help her “see” easily how the different types of energy
changed at the different points and understand the problem conceptually. It seemed that
she could not access such an external visual representation, and finally, she looked at the
equation sheet and hoped that some “magic formula” could help her. She used a bunch of
numerical representations to finish her solutions.

133
3.3.3.8 Discussion of Student Performance on the Interview Problems
Based on the student performance on the interview problems, we find that the
student who learned the multiple-representation strategy used this technique to solve the
work-energy problems. In particular, this student’s solutions for Problem 2 and 3 reflect
expertise in problem solving. We also find that he used the work-energy bar chart to help
him understand the problems conceptually first, to set up the generalized work-energy
equations, and to reason about some questions qualitatively.
The solutions produced by the 131H student who learned the concepts of work-
energy using other approaches primarily reflect naïve problem-solving features, but
contain some expertise, such as working forward and recognizing the problems using the
concepts of work and energy. But it appears that without being able to access a physical
representation, it is difficult for the student to understand and infer the problem
conceptually before she used equations. In other words, it is unlikely that the student will
uses expert-like problem solving strategies without learning how to use a physical
representation to aid in the problem solving.
3.4 Discussion and Summary
It is well known that students attempt to solve problems by matching quantities
listed in the problem statement to special equations that have been used to solve similar
problems. Research into differences in problem solving between experts and non-experts
has found that experts often use physical representations to help them qualitatively
understand the problem. This is the central, fundamental difference, argued by some
researchers (see Chapter 2).

134
But few studies have documented how naïve students use an equation-centered
approach to solve problems from a perspective of multiple representations in physics.
Research reported in this chapter reveals that, to understand how naïve students solve
problems, it is necessary to separate two types of a mathematical representation: an
algebraic representation and a numerical representation. The former is defined as
symbolic physics equations; the latter is defined as numerical physics equations.
Beginning students use a numerical-representation-centered approach in their problem
solving: representing related concepts in numbers first, assembling these numbers
together based on a law or a principle, and calculating a number for the unknown
variable. Using this naïve method, we have found that it is difficult for students to gain a
conceptual understanding while solving problems. Playing with numbers, students loose
the connection between physics concepts and the mathematical symbolic expressions and
the connection between mathematical expressions and real physical processes.
It is also discovered that naïve students often go back and forth between pictorial
representations and numerical representations in problem solving. Apparently, they
seldom use any physical representations and rarely use algebraic representations in
solving work-energy problems.
To help students address those difficulties (i.e., the initial state) and to help them
develop expertise in problem solving (i.e., the desired final state), Alan Van Heuvelen
developed a problem solving strategy of representing work-energy processes in multiple
ways: verbal, pictorial, work-energy bar chart, and mathematical representations. A
systematic series of assessment activities were conducted to evaluate the effectiveness of
this new learning technique on student conceptual understanding and problem solving in

135
the context of work and energy after it was implemented in introductory physics classes
for honors engineering freshmen.
As a newly developed representation, the work-energy bar chart meets the basic
criteria for an effective, pedagogical representation and possesses basic features of a
physical representation:
1) It has physics meaning—each slot represents a type of energy or work.
2) It has a bar graph format—easy for students to use and to make inferences.
3) It diagrammatically represents the critical structure of a work-energy problem—the
initial energy of a system plus the work done on the system leads to the final energy of
the system. That is, it qualitatively represents the conservation of energy principle.
4) It is independent of time and the surface features of real objects.
The studies reported in this chapter provide empirical evidence that the work-
energy bar chart plays a very important role in student problem solving.
1) The work-energy bar chart helps students reason about work-energy problems
qualitatively and conceptually first. Being independent of surface features of real objects
such as ropes, springs, or inclines, it aids students in using the concepts of work and
energy to understand the problem before they apply mathematical equations. In a bar
graph format, it also helps students qualitatively “see” the conservation of energy.
2) The work-energy bar chart helps students set up the generalized work-energy
equation correctly and easily. A complete work-energy bar chart provides visual aid for
students to construct the mathematical equation—there is one term in the equation for
each bar in the bar chart.

136
3) The work-energy bar chart directs students to make inferences and allows them to
evaluate their problem solutions. Students use it to answer conceptual reasoning
questions and to check their results.
Overall, from the point of view of the multiple representation of work-energy
processes, the work-energy bar chart, as a physical representation, plays a central role in
students’ solving of work-energy problems. Its function is like a bridge, helping students
move easily with smaller steps from the abstract realm of words, or from real-life
sketches with surface features, to the abstract realm of scientific and mathematical
notations. By linking pictorial and mathematical representation together, the work-energy
bar chart can also help students produce mental images for the different energy quantities
and to make mathematical symbols meaningful.
Pictorial and mathematical representations also have their own functions in
student problem solving. We have found that it is relatively natural for students to draw a
sketch to help them understand the problem. In a diagrammatic format, it helps students
visualize, infer, and reason about the physical process. A sketch with its system choice
also aids students in constructing the work-energy bar chart. On the basis of the empirical
data presented in this chapter, it has been discovered that students use a sketch combined
with the qualitative bar chart to reason about physical processes without using
mathematics and to answer conceptual questions such as being asked to predict
qualitatively how changes in various factors will affect the process. But a pictorial
representation—a drawing including real objects such as springs, pulleys, and others—
can “trigger” students’ responses based on surface features.

137
A mathematical representation can include algebraic and numerical
representations. The generalized work-energy equation, identified as an algebraic
representation, quantitatively represents the conservation of energy. We have found that
it is useful for students in answering some qualitative questions. But it is abstract. A
numerical representation can help students solve for unknown information or a value of
the desired quantity in the problem. To some students, the numerical representation is
less abstract and more easily manageable than the algebraic representation. But the
former has the least physics meanings.
This strategy constitutes one part of the learning system (the transformer), which
attempted to match the students’ initial state, to address their difficulty, and to help
students develop expert-like problem-solving skills (the desired state). The actual
classroom strategies are also very important. Students learn to learn better if they
understand the reasons for various pedagogical strategies. This research has indicated that
it is relatively natural for students to use pictorial representations but not physical
representations. A physical representation is physics knowledge after all. In addition,
many students have experienced only formula-centered didactic instruction. Some
students like only equations and think that it wastes time or is a redundant task to
represent a problem in different ways. Thus, students must understand why they need to
use the qualitative, physical representation in their problem solving, must explicitly learn
how to use it, and must have opportunities to apply it in different situations.
To help students address the difficulty in using a numerical-representation-
centered approach in their problem solving, it is necessary for students to set up
explicitly, on the basis of a complete work-energy bar chart, the generalized work-energy

138
equation without any numbers. Students seem to accept qualitative representations more
easily, understand them better, and use them more effectively for qualitative reasoning
and problem solving if the qualitative representations are introduced BEFORE the
corresponding mathematical equations are introduced.
Finally, when students have learned all of the representation types, their
understanding improves if they learn to move among representations in any direction. For
example, they might be given a numerical representation that is the application of the
conservation of energy principle for some process. Their task is to construct other
representations of that process—playing Equation Jeopardy. They learn to "read" the
mathematics language of physics with understanding, to make numbers and symbols
meaningful in physics, and to make a link with real physical processes.
In summary, empirical evidence has shown that in the learning system including
the technique representing a work-energy process in verbal, pictorial, physical and
mathematical representations, students do apply this strategy in their own problem
solving. In particular, students use the work-energy bar chart to help them conceptually
understand the problem, qualitatively infer about the physical process, and set up the
generalized work-energy equation. In conclusion, this technique helps students abandon
their naïve problem solving method and develop expertise in problem solving.

139
ENDNOTES OF CHAPTER 3
1. Plotzner, R., The Integrative Use of Qualitative and Quantitative Knowledge in Physics Problem Solving (Peter Lang, Frankfurt am Main, 1994), pp. 33-53. In the book, he summarizes research findings on differences in problem solving between novices and experts.
2. Van Heuvelen, A. and Zou, X., “ Multiple representations of work-energy processes,”
Am. J. Phys. 68(9), (2000). 3. Zhang, J., “External representations in complex information processing tasks,” In A.
Kent (ed), Encyclopedia of Library and Information Science (Marcel Dekker, Inc, New York).
4. Bridgman, P. W., The Nature of Thermodynamics (Harvard University Press,
Cambridge, MA, 1941). 5. Burkhardt, H., “System physics: A uniform approach to the branches of classical
physics,” Am. J. Phys. 55, 344-350 (1987). 6. Sherwood, B. A., "Pseudowork and real work," Am. J. Phys. 51, 597-602 (1983). 7. Sherwood, B. A. and Bernard, W. H., "Work and heat transfer in the presence of
sliding friction," Am. J. Phys. 52, 1001-1007 (1984). 8. Arons, A. B., Teaching Introductory Physics (John Wiley & Sons, New York, 1997). 9. Chabay, R. W., and Sherwood, B. A., Matter & Interactions (Preliminary Edition,
John Wiley & Sons, New York, 1999). 10. See Ref. 4, pp. 47-56. 11. See Ref. 8, pp. 150-153. 12. Van Heuvelen, A., Mechanics Active Learning Problem Sheets (the ALPS Kits)
(Hayden-McNeil Publishing, Inc., 1996). This set of the ALPS Kits is developed for college or high school students to learn mechanics in algebra-based and calculus-based introductory physics courses. Another set of the Electricity and Magnetism ALPS Kits can be used by students in the electricity and magnetism part of introductory physics courses.

140
13. Van Heuvelen, A., and Maloney, D., “Playing physics Jeopardy,” Am. J. Phys. 67, 252-256 (1999).
14. Van Heuvelen, A., ActivPhysics1 (Addison Wesley Longman, Palo Alto, CA, 1997). 15. Lawson, R. A., and McDermott, L. C., “Student understanding of the work-energy
and impulse-momentum theorems,” Am. J. Phys. 55, 811-817 (1987). 16. O’Brien Pride, T., Vokos, S., and McDermott, L. C., “The challenge of matching
learning assessments to teaching goals: An example from the work-energy and impulse-momentum theorems,” Am. J. Phys. 66, 147-157 (1998).
17. Hestenes, D., Wells, M., and Swackhamer, G., “Force Concept Inventory,” Phys.
Teach. 30, 141-151 (1992).

141
CHAPTER 4
VISUALIZATION OF INTERNAL THERMAL ENERGY PRODUCED DURING INELASTIC COLLISIONS
As discussed in Chapter 3, ample assessment results show that the multiple
representation strategy, especially the use of the work-energy bar chart as a physical
representation of work-energy processes, helps students acquire a meaningful
understanding of the concepts of work and energy and develop expertise in problem
solving. To use this technique with work-energy processes, we need to pay a lot of
attention to a choice of system. Especially when we deal with physical processes in
which friction cannot be negligible, the choice of the system is crucial. This multiple-
representation approach recommends that two touching surfaces involved in the friction
be included in the system. In this way, we count a gain in internal energy of the system,
rather than deal with a difficult calculation for the work done by the friction. In light of
our classroom observations and the assessment results, we found that few students had
difficulty accepting inclusion of the frictional boundaries within the system and in
calculating a change of the system’s internal energy. But we observed that many students
did not understand the concept of internal energy itself. This concept seemed too abstract
for them; they lacked a meaningful mental image or model of it.

142
Moreover, an understanding of the concept of internal energy is a key for students
in applying the conservation of energy principle in collisions, in particular, in inelastic
collisions. Few introductory physics textbooks [1], however, introduce this concept in an
easy-to-understand way or provide any visual representations to aid in understanding.
Without full understanding of this concept, many students recognize elastic collision and
inelastic collisions by observation of surface features (see Section 5.1 for details). In
addition, some physics instructors often either leave out introduction to this concept or
use the term “heat” to describe “where the initial kinetic energy goes” during inelastic
collisions. As a result, to a large number of students, “internal energy” and “heat” mean
the same thing, but they do not know what that thing is (see Section 4.3.3.1for details).
In this chapter, we discuss studies that investigate and address student difficulties
understanding the concept of internal thermal energy. Next chapter, we report research
that investigates and addresses student difficulties understanding the concept of internal
potential energy.
This chapter is divided into four parts. The first part reports studies concerning
student difficulties with the internal thermal energy produced during inelastic collisions.
We discuss in detail individual student demonstration interviews and student responses to
a written question. The second part describes how to develop a guided-inquiry learning
activity to help students visualize the abstract concept of internal thermal energy and to
develop a meaningful mental image of it. In addition to student worksheets, the activity
includes classroom demonstrations using a pair of rubber balls and a pair of model carts.
The third part discusses extensive assessment results of the effectiveness of the learning
activity. The chapter ends with discussion and summary.

143
4.1 Investigation of Students’ Difficulties Understanding the Concept of Internal Thermal Energy
Internal thermal energy is a very abstract concept in physics. It is defined as
average random kinetic energy that molecules have at the microscopic level. It is
associated with the temperature of a physical object. The greater an average random
kinetic energy that the object’s molecules have, the higher the object’s temperature is. To
help students visualize this not-easy-to-see concept, Uri Ganiel [2] developed a pair of
model carts. The model cart shown in Figure 4.1 was used for demonstrating inelastic
collisions, while the other one in Figure 4.2 was for showing elastic collisions (see
Section 4.1.1.1 for details). Uri Ganiel used the model carts to help in-service teachers
visualize “where the kinetic energy goes” during the inelastic collision. But he did not
evaluate further how the students understood the physics that the model carts showed.
Based on his work, we built a pair of Ganiel’s model carts. Using the model carts and a
pair of rubber balls (happy and unhappy balls), we designed an individual student
interview to elicit students’ ideas about internal thermal energy and to assess the
effectiveness of the model carts on students’ understanding of this concept.
4.1.1 Individual Student Demonstration Interviews (Spring 1998) The individual student demonstration interview was conducted in spring quarter
1998 at OSU. Five students participated in the interview on a voluntary basis. Three were
honors engineering freshmen, who learned the multiple-representation strategy with the
concepts of work and energy in the Physics 131E class in autumn quarter 1997. The other
two came from a regular calculus-based introductory physics class (Physics 132). Thus,

144
Figure 4.1: Developed by Uri Ganiel, this model cart is used for demonstrating inelastic collisions.
Figure 4.2: Developed by Uri Ganiel, this model cart is used for demonstrating elastic collisions.

145
by the interview time, they all had learned the concepts of mechanics from their
respective calculus-based introductory physics classes.
The students were told that the interviews aimed to improve the teaching and
learning of physics in the introductory classes; their performance on interview questions
would not affect their class grades. Each participant was paid a small amount of money
for his or her help and time.
4.1.1.1 Interview Demonstrations
The interview attempted to investigate: 1) after instruction, what did students
understand about the energy transformation during collisions? In particular, what did they
understand about the internal thermal energy produced during inelastic collisions? 2)
How could the model carts help students understand and visualize the concept of internal
thermal energy and energy conservation during inelastic collisions? 3) How could we use
the model carts effectively with students in a large classroom setting? Therefore, three
demonstrations were performed during the interview: 1) a happy ball and an unhappy ball
were dropped onto a table from the same height; 2) the unhappy ball and a clay ball were
dropped onto a table from the same height; and 3) the two model carts collided with a
wall. Below, we discuss in detail the demonstrations using the happy and unhappy balls
and the model carts, while leaving the demonstration using the unhappy ball and clay ball
to be discussed in Section 5.1.
Happy and unhappy ball demonstration: Happy and unhappy balls are a pair of
identical-looking black balls. The pair used for the interview, sold by Arbor Scientific
[3], have identical diameter of 2.5 cm. They have slightly different masses: the happy ball
has a mass of 8.60 grams, while the unhappy ball has a mass of 9.85 grams. These

146
identical-looking balls’ behavior would surprise you when they are dropped onto a table
from the same height. After hitting the table, the happy ball bounces back close to the
release height, but the unhappy ball barely bounces at all. Due to this remarkable
property, the happy and unhappy balls are widely used by physics teachers to show
students a more elastic collision and a more inelastic collision, respectively.
Why do the happy and unhappy balls behave so differently? To understand this
mystery, we need to look into their molecular structures. The happy ball is made of
neoprene rubber, whose macromolecular structure [4] is shown in Figure 4.3. In these
chain macromolecules, although there exist large chlorine groups that restrict rotation on
every fourth carbon, the carbon atoms (held together by single bonds) are still able to
rotate around their axes. Depending on the temperature, therefore, it could be expected
that these chains would be in a constant twisting motion and that they would thus be
badly entangled with each other. Any deformation of the neoprene rubber will tend to
“straighten out,” or uncoil, the entangled mass of contorted chains, but subsequently they
will tend to coil up and return to their original positions [4]. By virtue of these violent
contortions and restorations of long chains of the rubber, the happy ball can bounce back
after it hits the table [5].
From the point of view of energy, the happy ball makes a more elastic collision.
Before being dropped, it has gravitational potential energy due to the separation between
the ball and Earth. Just before it hits the table, most of the happy ball’s potential energy
has been converted to kinetic energy (choosing the table as a reference level). As the ball
touches the table, it starts to deform. But the entangled macromolecular chains inside the

147
Figure 4.3: The macromolecular structure of neoprene rubber, of which the happy ball is made. Figure 4.4: The macromolecular structure of polynorbornene rubber, of which the unhappy ball is made.
n
CH2
Cl CH2
H C = C
n
CH CH2
CH2 CH2
C C CH

148
ball lack degrees of freedom to vibrate, so they tend to resist deformation. Thus, the
kinetic energy is not readily converted into vibrational energy of the macromolecules, a
type of internal thermal energy. (We ignore that the small amount of the kinetic energy
that could be converted into the internal energy of the table.) As a result, the happy ball
bounces back high.
How about the unhappy ball? It is made of polynorbornene rubber. Its
macromolecular structure is shown in Figure 4.4 [6]. Due to the carbon ring structure, the
macromolecular chains of polynorbornene are not able to twist and entangle. With more
degrees of molecular freedom, at room temperature this polymer cannot quickly return to
its original shape during the collision with the table. Thus, the kinetic energy of the
unhappy ball can be converted easily into vibrational energy of the macromolecules. That
is, the unhappy ball gains internal thermal energy during the collision, defined as an
inelastic collision.
Since the students could not see visually what happened to the energy
transformation at a molecular level during the collisions that the happy and unhappy balls
made, we used this demonstration to probe students’ qualitative understanding of the
concept of internal thermal energy and of the conservation of energy principle during
elastic and inelastic collisions. Instead of asking the students to answer, by memorization,
such questions as “what do the terms ‘internal thermal energy’ or ‘heat’ mean to you”, we
asked the students to observe this demonstration and explain their reasoning as they
observed the results.
Model cart demonstration: We make the model carts shown in Figures 4.1 and
4.2 collide with a rigid wall on a smooth hallway floor. A strong spring bumper in the

149
front of each cart hits the wall. (See Section 4.2.1 for detailed information about
structures of the model carts and how to build them.) After hitting the wall, the cart with
the rigid rods (shown in Figure 4.2) bounces back significantly farther than the one with
the rubber bands (shown in Figure 4.1). Moreover, small disks tied to the rubber bands
randomly vibrate much more strongly just after the collision. Obviously, some of this
cart’s kinetic energy before the collision is transferred to kinetic energy of the small
disks, which represents a gain of “internal thermal energy” in the cart. Thus, this rubber-
band cart demonstrates a more inelastic collision.
The rigid-rod cart demonstrates a more elastic collision. Since the small disks on
this cart are fixed and have no degrees of freedom to vibrate, the kinetic energy of the
cart cannot be converted into vibrational energy of the small disks. Therefore, this cart
bounces back significantly farther after the collision.
During the interview, the students first were informed that the two carts had
identical mass, that the spring bumper in the front of each cart were identical, and that
each one had four identical wheels. Then the students were shown the two carts, starting
at the same starting line, pushed simultaneously with the same initial speed toward the
wall. We asked the students to observe what happened to the carts before and after the
collisions and to explain their reasoning as they observed the results.
The use of the model carts as a simple analogy of the balls: Up to this point, we
have seen why the happy ball experiences a more elastic collision while the unhappy ball
experiences a more inelastic collision, and why the rigid-rod cart demonstrates a more
elastic collision while the rubber-band cart demonstrates a more inelastic collision. Is it
reasonable to use the two model carts as a simple analogy to the happy and unhappy

150
balls? Actually, Uri Ganiel’s [2] major purpose for inventing the carts originally was his
intention to use the carts to model microscopic structures of solids and to demonstrate the
energy transformation, on a molecular scale, experienced by the solids during elastic and
inelastic collisions. With associations such as the small disks representing the
“molecules” of a solid and the rubber bands representing the “bonds” between molecules,
the rubber-band cart can be considered as a simple model of the unhappy ball and the
rigid-rod cart as a simple model of the happy ball. For the rubber-band cart, during the
collision a gain of the random vibrational energy of the small disks can demonstrate a
gain in internal thermal energy of the unhappy ball. For the rigid-rod cart, during the
collision, without access to “vibrational degrees of freedom,” no energy transfer into the
motion of the small disks can occur. This can represent the lack of degrees of freedom to
vibrate of the entangled macromolecular chains of the happy ball, so its kinetic energy
cannot easily be converted into internal thermal energy of the ball. Thus, the carts provide
simple models for elastic and inelastic collisions. The rubber-band cart helps students
especially visualize “where the kinetic energy goes,” “see” the internal thermal energy
produced, and have an idea of how energy conservation works during inelastic collisions.
What do students think of this analogy? How can we use the model carts to help
them visualize the abstract concept of internal thermal energy and develop a meaningful
mental image of it? Given our interest in these questions, we conducted individual
student demonstration interviews to try to address these questions.
4.1.1.2 Student Responses and Reasoning
Upon arrival, the students were first instructed to verbalize their thinking and
were encouraged to explain their reasoning as best as they could. Then the three
151
demonstrations mentioned above were shown in sequence. Before each demonstration,
the students were asked to make a prediction first and to give their reasoning. After each
demonstration, the students were asked to explain their reasoning again on the basis of
their observations. A protocol of the interviews is shown in Appendix I. Not every single
question on the protocol had been asked to each student. But the listed questions served
as a guide to help the interviewer ask each student the same questions in the same way.
Student responses and reasoning related to the happy and unhappy ball
demonstration: All five students predicted that the two balls would bounce back after
they hit the table. Three honors engineering students explicitly mentioned that if the balls
were made of the same material and had the same size, they should bounce back to the
same height at the first bounce. Two regular engineering students explained that the two
balls would bounce back because the table would push them to bounce back.
After the students saw that one ball bounced back high but the other almost did
not bounce at all, they gave a variety of explanations, as shown in Table 4.1. It was
apparent that the two regular students had difficulty understanding the energy
transformation during the unhappy ball’s collision with the table. They thought that the
initial kinetic energy of the unhappy ball was absorbed by the table, since the unhappy
ball stopped after the collision. As being asked “in what form the absorbed energy existed
in the table,” one answered in the form of kinetic energy. He mentioned that the table
would move a tiny, tiny bit, but one could hardly see it since the table was too heavy. The
other one considered the absorbed energy as heat and sound, but she had no idea about
what she meant by “heat.”
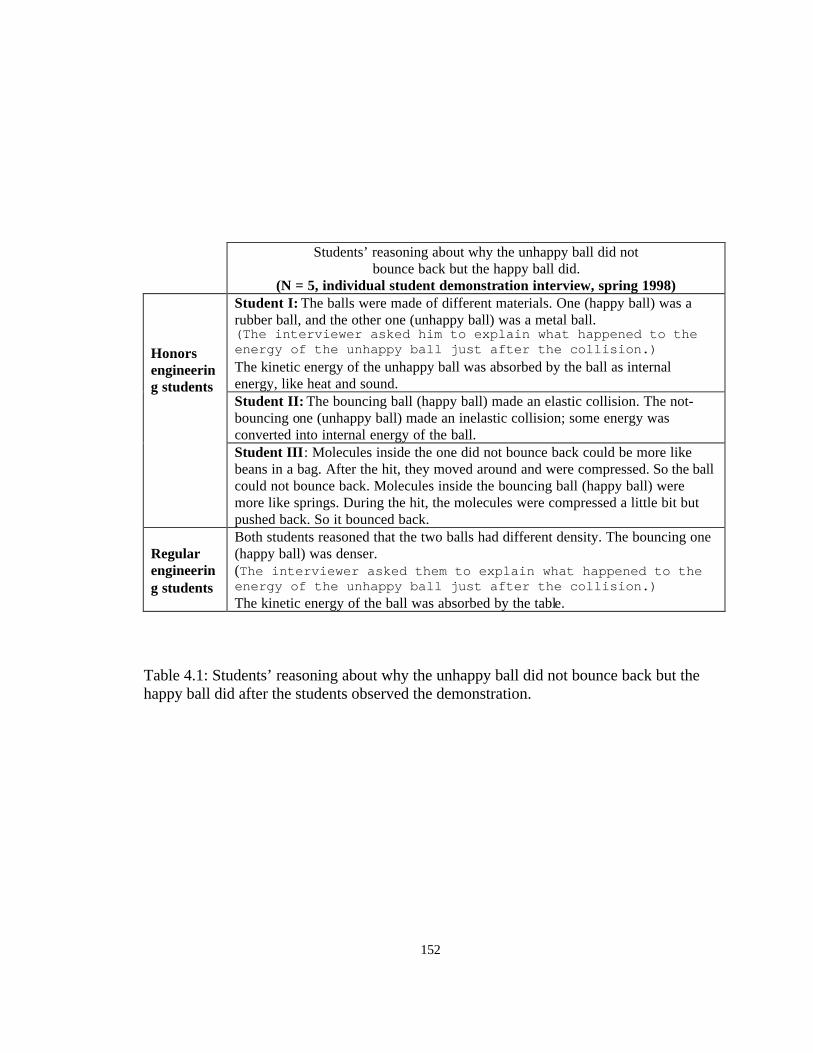
152
Students’ reasoning about why the unhappy ball did not bounce back but the happy ball did.
(N = 5, individual student demonstration interview, spring 1998) Student I: The balls were made of different materials. One (happy ball) was a rubber ball, and the other one (unhappy ball) was a metal ball. (The interviewer asked him to explain what happened to the energy of the unhappy ball just after the collision.) The kinetic energy of the unhappy ball was absorbed by the ball as internal energy, like heat and sound. Student II: The bouncing ball (happy ball) made an elastic collision. The not-bouncing one (unhappy ball) made an inelastic collision; some energy was converted into internal energy of the ball.
Honors engineering students
Student III: Molecules inside the one did not bounce back could be more like beans in a bag. After the hit, they moved around and were compressed. So the ball could not bounce back. Molecules inside the bouncing ball (happy ball) were more like springs. During the hit, the molecules were compressed a little bit but pushed back. So it bounced back.
Regular engineering students
Both students reasoned that the two balls had different density. The bouncing one (happy ball) was denser. (The interviewer asked them to explain what happened to the energy of the unhappy ball just after the collision.) The kinetic energy of the ball was absorbed by the table.
Table 4.1: Students’ reasoning about why the unhappy ball did not bounce back but the happy ball did after the students observed the demonstration.

153
All three honors students thought that the initial kinetic energy of the unhappy
ball was converted to its “internal energy”, but they had different understandings of the
term “internal energy”. Student I thought that the internal energy was heat and sound, and
“heat” meant something from the ball into the air and dissipated in the air. Student II
thought that “internal energy” was a type of energy that atoms and molecules had
internally. From the explanation given by student III, it appeared to him that “internal
energy” was the energy to move and compress molecules.
Student responses and reasoning related to the model cart demonstration: The
students were first asked to predict what would happen if the two carts were pushed at the
same speed toward a wall in a hallway. At that moment, the two model carts were
covered and the student could not see the inside structures of the carts. All five students
predicted that the two carts would bounce back the same distance since they had identical
mass, bumpers, and wheels.
After the demonstration was actually shown, the student observed that one
bounced back a significantly shorter distance than the other one. To explain this
phenomenon, five students provided different reasoning. All three honors engineering
students thought that this would result from different mass distributions inside the two
carts. For example, one thought that the not-bouncing cart would have something like a
pendulum hung inside. After the collision, the pendulum swung back and forth. As a
result the cart was slowed down. One regular student thought that some of the initial
kinetic energy of the not-bouncing cart was absorbed by the wall. The other regular
student thought that the two carts had different structures inside: one (bouncing cart) had
a solid structure and the other one (not-bouncing cart) had a loose structure.

154
After the cover was taken off from each model cart, we showed the students the
same demonstration again and asked them to explain why they thought one cart bounced
back a significantly shorter distance than the other one. This time, the students could see
that the rubber-band cart bounced back a significantly shorter distance than the rigid-rod
cart. But we did not explicitly ask the students to observe closely about what would
happen to the small disks on each cart before and after the collisions.
One honors student noticed that the small weights on rubber bands vibrated much
more than before and he provided his reason that since the small weights absorbed some
of the initial kinetic energy, the rubber-band cart could not bounce back farther. The other
two honors students still thought that the difference in mass distribution between the two
carts resulted in the difference in two carts’ behaviors. The two regular students still gave
the same reasoning for this as before.
Finally, as being asked to match the model carts with the balls, one regular
student matched the happy ball with the rubber-band cart (since the cart had rubber bands
on it and the happy ball was made of rubber or spring-like material) and matched the
unhappy ball with the rigid-rod cart (since the cart was rigid and the unhappy ball was
made of dense material). The four other students matched the happy ball with the rigid-
rod cart (since they both bounced back high or far) and matched the unhappy ball with
the rubber-band cart (since they both could not bounced back that much).
4.1.1.3 Discussion of Interview Results
The interview data showed that the honors and regular students all had difficulty
understanding “where the kinetic energy goes” during the inelastic collision between the
unhappy ball and the table. Apparently, they lacked a mental picture of the concept of

155
internal thermal energy. They used the terms “internal energy” or “heat” without a
meaningful understanding of them.
It appeared that the students were distracted by the different-looking structures of
the two model carts. They thought that the two carts’ different behaviors (one bouncing
back a significantly shorter distance than the other) resulted from their different mass
distributions, even after they actually observed the cart demonstration. Clearly, the
students used surface features to reason about the physical phenomena. To avoid this
surface distraction and to help students visualize and understand easily “the physics that
the carts were intended to show”, we modified the rigid-rod cart and developed a new
pair of model carts. This is discussed in detail in Section 4.2.1.
4.1.2 Written Question (Autumn 1998)
In the autumn quarter of 1998, to elicit a large number of students’ ideas about the
concept of internal thermal energy and their understanding of the energy transformation
during inelastic collisions, we showed the demonstration using the happy and unhappy
balls to a regular calculus-based introductory physics class (Physics 131). This ten-week
class covered the regular concepts of mechanics: kinematics, Newtonian dynamics,
momentum, work-energy, and some rotational dynamics. The happy and unhappy ball
demonstration was shown after the students had studied the concepts of work and energy,
momentum, as well as collisions. After observing the demonstration, the student was
asked to answer the question: Two “identical” black balls are dropped onto a table
surface from the same height. Provide one or more reasons why you think one of the balls
did NOT bounce back, but the other did?
156
Thirty-seven students handed in their responses to the question. Thirty-two
percent thought that the happy and unhappy balls were made of different materials. For
example, the unhappy ball was a metal one and the happy ball was a rubber one; or the
unhappy ball was made of denser material. Fourteen percent thought the two balls had
different elasticity. The happy ball was more elastic than the unhappy ball. Eleven
percent thought that the internal structures of the balls were different. For example, the
happy ball was a solid one, but the unhappy ball was a hollow one. Five percent did not
answer the question.
We also found that thirty-eight percent in total used “an energy idea” to explain
why the unhappy ball did not bounce back. Thirty percent used the term “internal energy”
or “molecules’ energy” to describe “to what the kinetic energy was lost” during the
unhappy ball’s collision with the table, while eight percent thought that the kinetic energy
of the unhappy ball was converted into “heat”, The proportion of the students who used
the term “internal energy” is larger than what we expected it. We noticed that the class
professor gave his explanation about the demonstration using the concept of internal
(thermal) energy. It appeared that some students might just copy down the professor’s
explanation, rather than trying to answer the question first themselves (although the
students were asked to do so). We did not think that the students acquired a meaningful
understanding of the concept, although they could use the term.
In summary, it appeared that the students used surface features, such as the
material, density, or structure differences, to reason about the elastic and inelastic
collisions. They did not use such a deep structure of knowledge as energy or momentum
ideas to explain what happened during the collisions. Even some students used the term

157
“internal energy” to describe “to what the kinetic energy was lost”, but they lacked a
meaningful mental picture of this abstract concept.
4.1.3 Discussion of Student Difficulties Understanding the Concept of Internal Thermal Energy
Overall, it is apparent that internal thermal energy is a very difficult concept for
many students. Lacking a meaningful understanding of it, students use surface features to
understand elastic and inelastic collisions. Also, some students use the term “heat” to
describe “to what the kinetic energy is lost”. In physics, heat is defined as transfer of
internal thermal energy [7], but not internal thermal energy itself. Heat is a process
quantity, but internal thermal energy is a state quantity. Clearly, introductory physics
students do not understand these distinctions between these two concepts. But it appears
that many students have no ideas about either of them. They just use the terms without
knowing them.
4.2 Development and Implementation of a Guided-Inquiry Student Learning Activity During the process of curriculum development to help students gain a meaningful
understanding of the concept of internal thermal energy, we need to consider the
following factors. First, in addition to being a not-easy-to-understand concept itself,
internal thermal energy is also associated with the definitions of heat and temperature,
two other abstract concepts. Teaching by telling these concepts would be useless to help
students gain a conceptual change. Second, we do not think it is vital to let students
know, by memorization, the differences and relationships among those complex concepts
in an introductory physics class. Third, in many daily-life situations and even in some
classrooms, “heat” or “heat energy” is often used as a substitute for the concept of

158
internal thermal energy. This misuse of the language would make it more difficult for
students to distinguish clearly between the concepts of internal thermal energy and heat.
However, it is important to help students visualize “where the kinetic energy goes”
during inelastic collisions. The visualization could help students develop a mental image
that makes the abstract concept of internal thermal energy meaningful—much as the
picture of an apple gives meaning to the word “apple.” Lack of a meaningful
understanding of “to what the kinetic energy is lost” is identified as a major students’
difficulty understanding inelastic collisions. Linking the abstract concept with a concrete
mental picture could help students address this difficulty. This could also help students
understand the conservation of energy during an inelastic collision and recognize an
inelastic collision from the point of view of the “internal energy” produced.
Helping students develop a mental image of the concept of internal thermal energy on a
molecular scale would be useful for them in learning thermodynamics. Therefore, we
developed a guided-inquiry learning activity, using the modified model carts, intended to
help students visualize the internal thermal energy produced during inelastic collisions
and to develop a mental model of this concept.
Below, we first describe in detail how to construct a pair of the modified model
carts. This is followed by an introduction to the development of student worksheets. Last,
we discuss how to use this guided-inquiry learning activity with students in a classroom.
4.2.1 Construction and Modification of Model Carts (Spring and Autumn 1998) Because of the different-looking structures of Ganeil’s model carts, we found that
it was not easy for students to visualize and understand the physics that the model carts

159
attempted to demonstrate. As shown in Figure 4.5, a new model cart was developed,
replacing the one shown in Figure 4.2. This modified rigid-rod cart has a structure and
mass distribution similar to those of the rubber-band cart in Figure 4.1. The detailed
information about how to make this new pair of model carts is shown in Figures 4.5 and
4.6.
4.2.2 Development of Student Worksheets
To have students be exposed to an inquiry-like learning activity, it is essential to
develop a written curriculum to guide them in developing their own understanding about
related concepts. In addition to two demonstrations using happy and unhappy balls and
using the model carts, we developed student worksheets. Questions on the worksheets
could be divided into three groups: 1) Questions about the demonstration using the happy
and unhappy balls; 2) questions about the demonstration using the model carts; and 3)
questions about the analogy between the model carts and the rubber balls.
4.2.2.1 Student Worksheets (Autumn 1998)
The worksheets developed in the autumn quarter of 1998 consisted of 12
carefully-constructed questions (see Appendix J) that could guide students through a
reasoning process to visualize the concept of internal energy and to develop a mental
model of it.
The first four questions asked students to observe the demonstration of the happy
and unhappy balls and to provide their explanations about how they made sense of what
they observed. The questions intended to elicit students’ common sense ideas about
internal energy. Questions 5 to 9, asking about the demonstration of the model carts, were
collisions and confront students’ common sense ideas about the concept of designed to

160
Figure 4.5: The information about how to construct the rigid-rod model cart, as shown in the picture (this model cart can be used for demonstrating elastic collisions).
The information about how to construct the model cart shown as above Base: Frame: Rectangular wood frame with 24 by 16 cm (1.8 cm thick) and in the center a rectangular cut off with 13 by 11 cm. Four wheels: With low friction and ordered from Frey Scientific. Spring Bumper: A steel strip with 16 by 2.5 cm bent to a bow (the strip is cut off from 0.025 t x 6’’w x 50’’ steel coil) Body: Four vertical rods: 20 cm high Eight horizontal (thinner) rods: 13 cm long each 16 Aluminum-hollow rods: On sides, 13 cm long each; on diagonals, about 19 cm each. Brass disks: 5 mm thick and the outer diameter of 24 mm; in the center of each disk, a hole with a diameter of 6 mm; a mass of 18 g each.

161
Figure 4.6: The information about how to construct the rubber-band model cart, as shown in the picture (this model cart can be used for demonstrating inelastic collisions).
The information about how to construct the model cart shown as above Base: Frame: Rectangular wood frame with 24 by16 cm (1.8 cm thick) and in the center a rectangular cut off with 13 by 11 cm. Four wheels: With low friction and ordered from Frey Scientific. Spring Bumper: A steel strip with 16 by 2.5 cm bent to a bow (the strip is cut off from 0.025 t x 6’’w x 50’’ steel coil) Body: Four vertical rods: 20 cm high Eight horizontal (thinner) rods: 13 cm long each Hooks: eight on each vertical rod Brass disks: 6 mm thick and the outer diameter of 24 mm; in the center of each disk, a hole with a diameter of 6 mm; a mass of 20 g each Rubber bands: some

162
help students visualize the energy transformation during elastic and inelastic internal
energy. Question 10 in the worksheets introduced students to the microscopic molecular
structure of a solid and asked them to use this model to explain what happened to the
initial energy of the rubber-band cart after the collision. This question intended to help
students make a link between the microscopic model of a solid and the model carts. By
explicitly asking about matching the carts with the balls, Question 11 attempted to help
students realize that “what happened to the carts” modeled “what happened to the balls at
the ‘invisible’ microscopic level,” and to visualize the energy transformation from the
model carts’ collisions. The last question introduced the definition of internal (thermal)
energy and asked students to use this concept to explain again why the unhappy ball did
not bounce back. Noticed that in this question, we did not explicitly introduce the internal
energy as internal thermal energy. We attempted to help students visualize molecules’
random kinetic energy as a type of internal energy and develop a mental image of it,
rather than to memorize the term. Questions 10 to 12, the last three, were designed to
help students resolve their common-sense ideas and develop a meaningful mental model
of the abstract concept of internal (thermal) energy.
4.2.2.2 Student Worksheets (Autumn 1999)
In the autumn quarter of 1999, we modified the worksheets developed in the
autumn 1998. In addition to minor wording revisions, comparing the version in the
autumn 1998, major modifications for the autumn 1999 version (see Appendix K) are
discussed below.
1) From student responses for Question 5 in the autumn 1998 version, we found that a
majority of the students predicted that the two carts would bounce back the same

163
distance. So this question did not serve well to elicit a variety of students’ ideas. We
revised this question to ask students to observe and to write down what happened to cart
A and cart B after they collided with a fixed block.
2) Question 10 in the autumn 1998 version was divided into two questions, questions 10
and 11 in the autumn 1999 version. This attempted to help students think explicitly about
why the rubber band model cart bounced back a significantly shorter distance than the
rigid-rod cart and to “see” clearly a link between the structures of the model carts and the
molecular model of a solid.
3) The concept of internal (thermal) energy was introduced while the molecular structure
inside a solid was introduced in Question 11. It seemed better than Question 12 in the
1998 version. When analyzing students’ responses to Question 12 in the 1998 version, we
found that many students just answered that the kinetic energy of unhappy ball was
converted into its internal energy but without further explanations. We thought that it
could result from the way that this question worded. The question introduced the concept
of internal energy first and then asked the students to use this concept to explain why the
unhappy ball did not bounce back, so this could mislead the students just to use the term
“internal energy” to answer the question. Thus, we revised Question 12 into Questions 11
and 12 in the 1999 version.
4) We added Question 13, the last question, in the autumn 1999 version of the
worksheets. This question explicitly asked students to apply the concept of internal
energy for collisions. It attempted to help students understand the energy transformation
during elastic and inelastic collisions.
164
4.2.3 Instruction
How can we implement these learning materials with students in a classroom? We
assembled the happy and unhappy ball demonstration, the model cart demonstration, and
the written worksheets into a coherent guided-inquiry learning activity, which aimed to
help students visualize the concept of internal thermal energy and understand the energy
transformation during collisions. After having exposed them to the concepts of energy,
momentum, and collisions, students actively learned this activity in a large classroom.
During the activity the students were required to write down their explanations on the
worksheets, which were collected at the end of the classes.
The only role that the professor played in the classroom was to show the
demonstrations, rather than to provide answers for the worksheet questions. Basically, in
the class, the happy and unhappy ball was demonstrated first. Then the students were
asked to answer, based on their observations and reasoning, the first four questions
related to this demonstration. By the time most students had written down their answers,
the professor asked for the students’ attention and showed the demonstration with the
model carts. The model carts with covers were first pushed to collide with fixed lead
bricks on the lecture table. While the students answered the related questions on the
worksheets, behind the lecture table, the professor took off the covers from the carts.
Then the demonstration using the model carts, without the covers, was shown again.
After observing this, the students were asked to answer the rest of the questions
themselves. The worksheets were collected for an evaluation purpose after the
instruction. Notice that, just for evaluating each individual student performance, during
the instruction the students were not encouraged to discuss their answers with their

165
neighbors or partners. This activity, however, was designed for students to work
interactively with their peers.
4.3 Assessment of the Effectiveness of the Guided-Inquiry Learning Activity In the autumn quarters of 1998 and 1999, honors engineering freshmen in a
calculus-based introductory mechanics class (Physics 131E) at OSU learned the guided-
inquired learning activity. This ten-week class covered the basic concepts of mechanics:
kinematics, Newtonian dynamics, momentum, work and energy, and some rotational
dynamics. The concept of internal energy was first introduced when the students learned
the multiple-representation strategy in the content of work-energy. They studied the
guided-inquiry learning activity after having learned the concepts of work and energy,
momentum, and collisions. Below we report the results of assessing the effectiveness of
this guided-inquired learning activity.
4.3.1 Evaluation Results (Autumn 1998)
In the autumn quarter of 1998, we collected the student worksheets after the
Physics 131E class learned the guided-inquiry activity. Students’ responses on the
worksheet questions were analyzed (see Section 4.3.1.1. for details). In addition, two
multipart problems, including inelastic collisions, appeared on a written test for this 131E
class at the end of the quarter. The test [8] was designed to assess whether students were
able to recognize and to divide some complex, multipart problems into simpler and
smaller sub-problems, which could be solved by applying single physics principles.
Student performance on these two written test questions are described in Section 4.3.1.2.

166
4.3.1.1 Student Responses to the Worksheet Questions
Seventy-five students handed in their worksheets after the guided-inquiry learning
activity. We randomly divided the worksheets into two equal sets and carefully analyzed
one set.
Of twelve questions on the worksheets (see Appendix J), the first four questions
asked about the demonstration using the happy and unhappy balls. In particular, Question
2 attempted to elicit student common-sense ideas about the elastic and inelastic
collisions, while Question 4 intended to explore what students thought about the concept
of internal energy and the energy transformation during the inelastic collision. Student
responses to these two questions are summarized in Tables 4.2 and 4.3.
For Question 2, some students provided more than one reason why they thought
one of the balls did not bounce back, but the other did. We counted each different reason
given by the same student separately. So in Table 4.2, the total proportion of student
responses exceeds one hundred percent
Table 4.2 shows that the students primarily relied on either surface features or
common-sense ideas to reason about happy and unhappy balls’ collisions. For example,
thirty percent thought that the two balls were made of different materials. This is true, but
the students did not understand what this difference was and why it could make the balls
behave differently. Some students thought that the happy ball was a rubber ball, while the
unhappy ball was a metal. Thirty-five percent thought that the difference could be
elasticity—the happy ball with high elasticity and the unhappy ball with low elasticity.
We did not think the introductory students really understood the concept of elasticity.
Twenty-seven percent thought that the unhappy ball was more massive than the happy

167
Student responses to Question 1 on the worksheet: Provide one or more reasons
why you think one of the balls did NOT bounce back, but the other did.
(Calculus-based honors engineering freshmen, N = 37, Autumn 1998) Students’ responses
35% Unhappy ball is less elastic than happy ball or the former with low elasticity and the latter with high elasticity
30% Two balls made of different materials 27% Unhappy ball is heavier than happy ball 16% Unhappy ball is denser than happy ball 14% Unhappy ball is harder than happy ball 16% Force is absorbed by table; unhappy ball’s initial energy or momentum is
lost into table 5% Unclear
Table 4.2: Students’ responses to the worksheet question: Provide one or more reasons why you think one of the balls did not bounce back, but the other did.
Student responses to Question 4 on the worksheet: What do you think happened to the energy of the “unhappy” ball just after the collision (the “unhappy” ball is the one that did not bounce)?
(Calculus-based honors engineering freshmen, N = 37, Autumn 1998) Students’ responses
32% Into the table 22% Heat and/or sound
19% Internal energy and/or sound 5% Absorbed by molecules inside the ball and/or table
27%
3% The ball and table became warmer 5% Lost to friction
14% Unclear, blank, or others Table 4.3: Students’ responses to the worksheet question: What do you think happened to the energy of the unhappy ball just after the collision?

168
ball, so the unhappy ball could not bounce back. This was a students’ common-sense
idea; an underlined reasoning could be that the unhappy ball was too heavy to be pushed
back by the table.
Question 4 explicitly asked the students to use an energy idea to explain what
happened to the initial energy of the unhappy ball just after the collision. Table 4.3 shows
that thirty-two percent thought that the initial (kinetic) energy of the unhappy ball went to
the table. Twenty-two percent thought it was converted to heat and/or sound. Twenty-
seven percent in total gave responses related to an internal energy idea. Nineteen percent
thought the unhappy ball’s initial energy was converted to internal energy of the ball
and/or the table. But they did not provided detailed explanations about what they meant
by “internal energy.” It appeared that few students could apply this concept to explain “to
what the initial kinetic energy was lost” during the unhappy ball’s collision. Five percent
thought that the initial energy of the unhappy ball was transferred to molecules either
inside the ball or the table.
After the students observed the model cart demonstration and answered Questions
5-10 on the worksheets, Questions 11 attempted to probe whether or not it was easy for
the students to match the model carts with the balls. All thirty-seven students thought that
the rubber-band cart modeled the unhappy ball and the rigid-rod cart modeled the happy
ball.
Finally, Question 12 attempted to investigate what the students thought happened
to the initial energy of the unhappy ball using the concept of internal (thermal) energy. As
shown in Table 4.4, a majority of the students used the concept to answer the question.
Forty-nine percent thought that the initial kinetic energy of the unhappy ball was

169
Student responses to Question 12 on the worksheet: Kinetic energy that individual molecules have is one example of internal energy. The faster molecules inside a solid move and rotate, the larger their internal energy, and the “hotter” the solid is. So now, using the concept of internal energy, explain why the “unhappy” ball did not bounce back, but the “happy” ball did.
(Calculus-based honors engineering freshmen, N = 37, Autumn 1998) Students’ responses
49% Internal energy 27% Internal energy to make molecules move or vibrate faster
81%
5% Unhappy ball became warmer 5% Heat 5% Structure different and dense different 9% Unclear, blank, or others
Table 4.4: Students’ responses to the worksheet question: Kinetic energy that individual molecules have is one example of internal energy. The faster molecules inside a solid move and rotate, the larger their internal energy, and the “hotter” the solid is. So now, using the concept of internal energy, explain why the “unhappy” ball did not bounce back, but the “happy” ball did.

170
converted to its internal energy, twenty-seven percent explicitly explained that the
unhappy ball’s initial energy was transferred to the kinetic energy of its molecules and to
make the molecules move or vibrate more. Here is an example of the students’ responses:
“The unhappy ball’s kinetic energy was transferred to its molecules which moved. The happy balls’ molecules don’t move as easily. So less energy was able to be transferred internally.”
4.3.1.2 Discussion of the Student Responses to the Worksheet Questions
When the students experienced this guided-inquiry learning activity, they had
already learned the concepts of collisions. The concept of internal energy was introduced
both in collisions and in work and energy using the multiple-representation strategy.
Apparently, before the model cart demonstration was shown, few students could apply
this concept to explain what happened to the initial kinetic energy of the unhappy ball
just after the collision. It appears that many students did not acquire a meaningful
understanding and a mental picture of this abstract concept before any visualization was
applied to help them learn this concept.
Comparing the students’ responses to the similar questions (i.e., Questions 4 and
12 on the worksheets), it is apparent that many more students, after experiencing the
model cart demonstration than before, applied the concept of internal energy to explain
why the unhappy ball did not bounce back. We also found that some students explicitly
stated that the initial kinetic energy of the unhappy ball was transferred to its’ molecules
thus making them vibrate more. Apparently, visualizing the vibration of the small disks
on the rubber-band cart after the cart’s collision helped students imagine what would
happen to the motion of unhappy ball’s molecules after the collision. This would help the

171
students develop a mental picture of the abstract concept of internal (thermal) energy and
make it meaningful.
Does the students’ mental image of internal energy help them better understand
the conservation of energy and be better able to recognize inelastic collisions? Two
written test questions, including inelastic collisions, were administered to both students
who learned the guided-inquiry learning activity using the modified model carts and to
students who did not experience this activity. Below, we report student performance on
the written test questions.
4.3.1.3 Student Performance on Written Questions
The Problem Decomposition Diagnostic test [8], developed by David Van
Domelen at OSU, was given to the honors engineering freshmen who learned the guided-
inquiry activity. The test, with six problems in total, asked the students to divide the
problems into small sub-problems and to indicate what each sub-problem is, either by
surface features such as “it is a spring problem” or by deep structures of physics such as
“it is a work-energy problem.” Two test problems, the Pendulum-Box Bash Problem (see
Figure 4.7) and the Block Catcher Problem (see Figure 4.8), include an inelastic collision
as a small sub-problem.
The test also was administered to a calculus-based introductory class for honors
physics and mathematics majors (Physics 131H), who had not experienced the guided-
inquiry activity. Taught by an experienced professor, this ten-week class also covered the
fundamental concepts of mechanics, but with an emphasis on logical arguments,
mathematical derivations, and problem solving.

172
Figure 4.7: The Pendulum-Box Bash Problem in the Problem Decomposition Diagnostic Test.
Intervals used for labeling sub-problems
Find µ between the box and the

173
Figure 4.8: The Block Catcher Problem in the Problem Decomposition Diagnostic Test.
Find the speed v0.

174
Ninety-three students from the honors engineering freshmen class (131E) and
forty-one students from the honors physics and mathematics majors class (131H) took the
test, and we analyzed their performance on the two problems shown in Figures 4.7 and
4.8. Table 4.5 shows the proportion of students who correctly recognized the collision as
a sub-problem. The results indicated that the students who learned the guided-inquiry
activity performed much better than the honors physics students after standard
instruction.
As discussed in Section 3.3.3.4, honors students from these two classes had
similar performance on pre-tests of the Force Concept Inventory [9] in the autumn
quarters of 1998 and 1999. On the basis of these test scores, it appeared that the students
in both classes had a similar initial understanding of Newtonian dynamics. It was seemly
fair to conclude that, in terms of student background and ability levels, the honors
students (majors in physics or mathematics) in the Physics 131H class were comparable
Students Pendulum-Box Bash Problem % correct
Block Catcher % correct
131E N = 93
78% 71%
131H N = 41
35% 14%
Table 4.5: Proportion of students who correctly recognized the collision as a small sub-problem in the two complex problems.

175
with the honors engineering freshmen in the Physics 131E class. The difference in
student performance shown in Table 4.5 could result from several reasons.
First, as discussed in Section 4.3.1.2, apparently, the guided-inquiry learning
activity helped the honors engineering freshmen visualize the internal energy produced
during the inelastic collisions. This could help them infer about the energy
transformations and recognize easily an inelastic collision.
Second, the honors engineering freshmen were taught explicitly about how to
solve multipart problems in the class. They could become more skillful in dividing this
type of problems into smaller parts than the honors physics majors who learned problem
solving with other approaches.
Third, a cooperative learning approach was used both in “lectures” and
“recitations” for the Physics 131E class. The honors engineering freshmen interactively
participated in learning activities and in problem solving.
Therefore, we need to conduct further investigations on assessment of the
effectiveness of the inquiry-learning activity on student understanding.
4.3.2 Evaluation Results (Autumn 1999)
In the autumn quarter of 1999, the honors engineering freshmen class (131E)
included two large classroom sections. The guided-inquiry activity using the model cart
was introduced in one of the two sections. Students in these two sections were very
comparable in terms of their academic background in high school and their pretest scores
on the Force Concept Inventory [9]. Two professors taught the two sections, but they
covered the same concepts. Three recitation instructors taught the students from both
sections, and all the students had the same laboratory activities and homework

176
assignments. A cooperative learning strategy was used as the basic format of the two
sections. After having learned the concepts of work and energy, momentum, and
collisions, the students in one section experienced the guided-inquiry learning activity,
while during the same day the other students learned to solve some complex multipart
problems involving inelastic collisions. The same professor taught these two sections
corresponding to these two different classroom activities.
We collected and analyzed students’ responses to the questions on the worksheets.
Additionally, a written question appeared on the class midterm examination asked about
the internal energy produced during an inelastic collision. Moreover, we gave a similar
problem including an inelastic collision on the final exams for both of these two sections.
Below, we discuss in detail student performance on the worksheets and on the written test
questions.
4.3.2.1 Student Responses to the Worksheet Questions
Of thirteen questions on the worksheets (see Appendix K), the first four questions
asked about the demonstration using the happy and unhappy balls. In particular, Question
2 attempted to elicit student common-sense ideas about the elastic and inelastic
collisions, while Question 4 attempted to explore what students thought about the concept
of internal energy and the energy transformation during the inelastic collision. Student
responses to these two questions are summarized in Tables 4.6 and 4.7.
For Question 2, some students provided more than one reasons why they thought
one of the balls did not bounce back, but the other did. We counted separately each
different reason given by the same student. So in Table 4.6 the total proportion of student
responses exceeds one hundred percent.

177
Overall, Table 4.6 shows similar results to that in Table 4.2, which we got from
the autumn quarter of 1998. A major difference between these results was that some
students (twenty-one percent) from the autumn quarter 1999 stated that because the
unhappy ball made an inelastic collision, it did not bounce back, while the happy ball
made an elastic collision, so it bounced back. We thought that this could result from the
time difference in learning this guided-inquiry learning activity for these two classes. In
the autumn quarter of 1998, this activity was introduced just after the students learned the
concepts of collisions. Being new with the concepts of collisions, the students might not
be comfortable to use these concepts to answer the questions. In the autumn quarter of
1999, the students learned the activity after the collision section was almost completed.
The students had practiced solving some complex collision problems, so they might be
more comfortable to use the terms “elastic collision” or “inelastic collision” to answer the
worksheet question.
We also analyzed the students’ responses to Question 4, which asked the students
to explain what happened to the unhappy ball’s initial energy just after the collision.
Results shown in Table 4.7 were similar to those obtained from the autumn quarter of
1998. But we found that twenty-three percent of the students form the 1999 class just
gave their explanations, as “the initial energy of the unhappy ball was absorbed by the
ball,” or “the initial energy of the unhappy ball was absorbed by the ball and the table.”
Without their detailed reasoning available, we did not know what they thought about “the
absorbed energy.” But it appeared that these students did not understand what happened
to this “absorbed energy.” In other words, the students might not know in what form the
“absorbed energy” existed inside the ball or table.

178
Student responses to Question 1 on the worksheet: Provide one or more reasons why you think one of the balls did NOT bounce back, but the other did.
(Calculus-based honors engineering freshmen, N = 39, Autumn 1999) Students’ responses
28% Unhappy ball is less elastic than happy ball or the former with low elasticity and the latter with high elasticity
21% Unhappy ball has an inelastic collision; happy ball has an elastic collision 36% Two balls made of different materials 18% Unhappy ball is heavier than happy ball 10% Unhappy ball is denser than happy ball 5% Unhappy ball is harder than happy ball 3% Unhappy ball’s energy is lost 3% Unclear
Table 4.6: Students’ responses to the worksheet question: Provide one or more reasons why you think one of the balls did NOT bounce back, but the other did.
Student responses to Question 4 on the worksheet: What do you think happened to the energy of the “unhappy” ball just after the collision (the “unhappy” ball is the one that did not bounce)?
(Calculus-based honors engineering freshmen, N = 39, Autumn 1999) Students’ responses
18% Into the table 5% Heat and/or sound
23% Absorbed by the ball 20% Internal energy and/or sound 30% 10% Internal energy and heat
10% Lost to friction 9% Unclear or others
Table 4.7: Students’ responses to the worksheet question: What do you think happened to the energy of the unhappy ball just after the collision?

179
Student responses to Question 12 on the worksheet: We can consider the two carts as a simple analogy for the two black balls. Now explain why the “unhappy” ball died on the surface after the collision.
(Calculus-based honors engineering freshmen, N = 39, Autumn 1999) Students’ responses
21% Internal energy 76% Internal Energy to make molecules move or vibrate faster
100%
3% Unhappy ball hotter Table 4.8: Student responses to Question 12 on the worksheet: We can consider the two carts as a simple analogy for the two black balls. Now explain why the “unhappy” ball died on the surface after the collision.
Question 12 asked the students to provide their reasoning again why the unhappy
ball “died” on the table just after its collision, after they observed the model cart
demonstration and answered related worksheet questions. As shown in Table 4.8,
seventy-six percent explicitly stated that because the unhappy ball’s initial energy was
converted into vibrating the ball’s molecules thus increasing its internal energy, so the
unhappy ball did not bounce back. Twenty one percent used the term “internal energy” to
describe “where the kinetic energy goes,” but they did not explicitly mention the
vibration of the ball’s molecules. Here was an example of the students’ responses:
“The unhappy ball’s atoms must have been allowed to vibrate must faster thus increasing the internal energy. However, the “happy” ball’s atoms must not have been allowed to vibrate as freely, thus the kinetic energy of the falling ball could not be transferred into internal energy during the collision with the table and the kinetic energy simply caused the ball to bounce back.”
Comparing to the students’ responses (in Table 4.4) to the similar question in the
autumn 1998, a larger number of students in the 1999 class explicitly stated that the
unhappy ball’s initial energy was transferred to internal energy and to make the ball’s

180
molecules to vibrate more. We thought that this could primarily result from the two
questions being worded differently. Question 12 used on the worksheet of the 1998
version directly asked the students to use the concept of internal energy to explain why
the unhappy ball did not bounce back. It could mislead some students to just use the term
“internal energy” to answer the question. So we revised this question, and it was apparent
that the 1999 version question was better able to let the students give their reasoning,
rather than to rephrase the term.
The data above show that after the students experienced the model cart
demonstration and answered the related questions on the worksheets, they could visualize
the vibration of small weights on the rubber band cart, and imagine this to model “what
happened to the unhappy ball at a molecular level.” Apparently, they gained a mental
picture of the internal (thermal) energy—vibrational energy of molecules.
4.3.2.2 Student Performance on a Midterm Examination Question
In this section, we discuss student responses to a test question related to their
understanding of the concept of internal energy. Of 78 students in this class, 38 students,
called the cart group, studied the guided-inquiry learning activity, while the other 40
students, called the non-cart group, learned to solve some complex, multipart problems,
which included an inelastic collision as a sub-problem. Except for this different learning
experience, these two groups of students participated in all the same learning activities
both in large classroom settings and in small classroom settings.
Of the five questions in the problem shown in Figure 4.9, question b) asked
students 1) to calculate how much the initial energy is “lost,” and 2) to explain what

181
Figure 4.9: The problem appeared on the midterm examination for one section of the honors engineering freshmen class in the autumn of 1999. Question b) asked the students 1) to calculate how much the initial energy is lost and 2) to explain what happens to the “lost” energy. In our research, student answers for the second part of question b) are analyzed and summarized in Table 4.9.
A 400 g rubber ball is dropped from a fourth floor window of Smith Lab., 15 meters above a sidewalk. Assume negligible loss due to air drag. a) What is the velocity of the ball just before it strikes the ground? b) If the speed is reduced by 5% upon rebounding, what fraction of the initial energy is lost and what happened to it? c) What will be the maximum height reached after the first bounce? d) What is the impulse acting on the ball during its collision with the sidewalk? e) If the ball is in contact with the ground for 12 milliseconds, what is the average force acting on the ball while in contact with the sidewalk?

182
happens to the “lost” energy. For our research, student responses for the second part of
question b) were analyzed and summarized in Table 4.9.
To make a reasonable comparison of the student responses from the cart group
and the non-cart group, we graphed distributions of the student final class letter grades
(i.e., A, B, and C & below) for both groups. In light of the bar graphs shown in Figure
4.10, it appeared that the students with different ability levels distributed very similarly in
these two groups. Students from these two groups also achieved similar mean scores on
the post-test of Force Concept Inventory [9].
Up to this point, we thought that the students in these two groups were “matched,”
and any differences in their performance on the second part of question b) should have
resulted from the different treatments (that is, the cart group learned the guided-inquiry
activity, while the non-cart group studied problem solving). Based on the results shown
in Table 4.9, we found that for the cart-group, of 38 students, fifty-five percent explained
that the “lost” energy was converted into internal energy, while thirteen percent described
that the “lost” energy was converted into heat or sound. Eight percent and eleven percent,
respectively, mentioned that the energy was lost due to friction or because of non-elastic
collision. For the non-cart group, on the other hand, of 40 students, ten percent used the
concept of internal energy to describe “where the ‘lost’ energy goes,” while about forty-
three percent thought the energy was “lost” into heat or sound. Also, about eighteen
percent explained that the energy was lost due to friction, and fifteen percent mentioned it
being due to the inelastic collision between the ball and the sidewalk.

183
AB
C & below
Cart Group
Non-Cart Group0
0.1
0.2
0.3
0.4
0.5
Figure 4.10: Distributions of students’ final class letter grades from the cart group and the non-cart group.
Students’ responses for the second part of question b) shown in Figure 5.9 N = 78, 131E, Autumn 1999
Lost to Due to Internal energy
Heat, sound, etc
Friction Inelastic collision
Other Unclear or blank
Cart Group N = 38
55% 13% 8% 11% 5% 8% Lost to Due to
Internal energy
Heat, sound, etc
Friction Inelastic collision
Other Unclear or blank
Non-Cart Group N = 40
10% 42.5% 17.5% 15% 2.5% 12.5% Table 4.9: Student responses for the second part of question b) of the problem shown in Figure 4.9. The cart group refers to the students who learned the guide-inquiry activity using the model carts, while the non-cart group refers to the students who learned how to solve some complex multipart problems including inelastic collisions.

184
4.3.2.3 Discussion of Student Performance on the Midterm Examination Question
It is apparent that forty-five percent more in the cart group than in the non-cart
group used the term “internal energy” to describe “to what the kinetic energy was lost”
during the ball’s collision with the sidewalk. On the basis of students’ responses to the
worksheet questions, we could tell that most students from the cart group gained a mental
image of the concept of internal (thermal) energy. It is reasonable to believe that the
students from the cart group used the term with a meaningful understanding, although
many of them did not give further explanations, maybe as a result of rushing through the
examination. In contrast, forty-two percent from the non-cart group used the term “heat”
to answer the same question. Apparently, the students misused this concept, but it
appeared that they had no ideas about the meaning of it (see Section 4.3.3.1 for details).
4.3.2.4 Student Performance on a Final Examination Question
It is apparent that the guided-inquiry learning activity helped students visualize
the concept of internal (thermal) energy and develop a meaningful mental picture of it.
Using the same time, the other students explicitly learned how to solve some complex,
multipart problems. Did visualization of the concept of internal energy help students
better solve an inelastic collision? Or did this conceptual activity hurt student problem
solving? To explore these questions, we analyzed student performance on the final
examination problem (see Figure 4.11), including an inelastic collision as a sub-problem.
Below, we discuss student performance on the inelastic collision part in the problem.
The problem shown in Figure 4.11 appeared on the final exami nation for the
section in which about half of the students learned the guided-inquiry learning activity,
while the other half were exposed to problem solving. This problem could be divided into

185
two small sub-problems. The first one included the interaction between the bullet and the
block—a momentum conservation problem. The second sub-problem included the
interaction between the bullet-block system with the table—an energy conservation
problem or a Newton’s law problem. To determine how far the block would travel after
the bullet hit, the students needed to solve both sub-problems correctly. Overall, of 80
students, 80% solved the problem correctly. Below we report in detail student
performance on the perfectly inelastic collision between the bullet and the block—a
momentum conservation problem.
Of 80 students in total, 38 learned the guided-inquiry activity using the model
cart, while 42 studied solving some complex, multipart problems including perfectly
inelastic collisions. By analyzing student solutions, shown in Table 4.10, we found that
these two groups of students performed similarly well on the inelastic collision part. The
results made it apparent that helping students understand the concept of internal energy
did not hurt their problem solving performance.
Figure 4.11: The problem appeared on the final examination for one section of the Physics 131E class, in which about half of the students studied the guided-inquiry learning activity using the model carts.
A bullet of mass 50 gram is moving horizontally at a speed of 150 m/s when it strikes a block of wood of mass 1.45 kg at rest on a table and becomes imbedded within it. The coefficient of kinetic friction between the block and the table is 0.25. How far will the block travel after being struck by the bullet before it again comes to rest on the table?

186
One section of the Physics 131E class
N = 80, Autumn 1999
Correct answer Not recognizing the inelastic collision
Cart group (N = 38)
90% 5%
Non-cart group
(N =42)
83% 10%
Table 4.10: Student performance on the inelastic collision part of the final examination for one section of the Physics 131E class. The cart group refers to the students who learned the guided-inquiry activity using the model cart, while the non-cart group refers to the students who did not learned this activity, but studied solving some multipart problems including perfectly inelastic collisions as sub-small parts. 4.3.3 Individual Student Demonstration Interviews (Spring 1999) In the spring quarter of 1999, we conducted individual student demonstration
interviews using the happy and unhappy balls and the modified model cart. We attempted
to investigate some research questions that had not been answered from the data
discussed above. As reported in Section 4.1.1, the different-looking structures of Ganiel’s
carts made it difficult for the student to visualize and realize “where the kinetic energy
goes.” Did students have similar difficulty or any other difficulties with the modified
model carts? We were also interested in probing what students understood about “heat.”
We did not expect that introductory physics students really understand the physics
meaning of “heat.” But, apparently, this term was often used by students to describe “to
what the kinetic energy is lost.” Understanding what students mean by “heat” could help
us address student difficulty with the concept of internal thermal energy. Note that the

187
interview did not emphasize helping students visualize the internal thermal energy
produced during the inelastic collisions. Instead, we were more interested in evaluating
the effectiveness of the modified model carts on demonstrating “where the kinetic energy
goes”.
Ten students were solicited from a regular calculus-based introductory physics
class (Physics 131) on a voluntary basis. They had been exposed to the concepts of work
and energy, momentum, and collisions, but not to the guided-inquiry learning activity
using the model carts. We carefully transcribed and analyzed verbal data from six
students. Below, we report interview tasks and student reasoning in detail.
4.3.3.1 Interview Demonstrations and Student Responses
Basically, two demonstrations were used during the interview: 1) A happy ball
and an unhappy ball were dropped onto a table from the same height, and 2) the two
model carts collided with a wall. Questions used to ask students during the interviews
were basically the same as the ones on the student worksheets (See Appendix K)
Demonstration of happy and unhappy balls: Most students predicted that the
two black balls would hit the table at the same time and bounce back to the same height,
since they were “identical.” After the demonstration was shown, students’ explanations
about the phenomenon they observed were interesting (see Table 4.11). A common
response from the six students was that the balls were made of different materials. For
example, one (happy ball) was rubber and the other one (unhappy ball) was plastic. Some
other explanations also appeared. For instance, that the happy ball was solid and the
unhappy ball was hollow; that the happy ball was lighter and the unhappy ball was

188
Student responses to questions related to the demonstration using happy and unhappy balls (Calculus-based introductory students, N = 6)
Student Could you provide one or more reasons why you think one of the balls did NOT bounce back, but the other did?
I The bouncing ball has an elastic collision, and the other one has an inelastic collision. They are made of different materials. The bouncing one is rubber, and the other is plastic. Or maybe one is solid, and the other is hollow.
II The bouncy one is elastic, and the other one is inelastic.
III I don’t know why. Maybe they are made of different materials. Maybe the energy (of the unhappy ball) goes to the table and sound.
IV I don’t know why. I remember that my professor demonstrated the balls similar to these. He (professor) explained that energy was transferred to heat, sound or something else, maybe. I cannot remember why. (Then the interviewer asked him to use his own ideas to try to explain.) They (the balls) are maybe made of different materials. Or maybe this is hollow (unhappy ball), and this one is solid (happy ball).
V The bouncing one is more rubbery, and the not-bouncing one is more plastic.
VI This one (happy ball) lost a little bit of energy; most were converted back. So it bounced back. But this one (unhappy ball), the potential energy was converted to kinetic energy, just before hitting. After the hit, the energy was lost to sound and heat.
Table 4.11: Student responses to interview questions related the demonstration using the happy and unhappy ball during the individual student interviews.
189
heavier; and that the happy ball had an elastic collision and the unhappy ball had an
inelastic collision.
Basically, the students did not use the concept of energy to explain why the happy
ball bounced high but the unhappy ball did not. When students were asked about what
kind(s) of energy each ball had right before and right after the collisions and further what
they thought happened to the energy of the unhappy ball after collision, their reasoning
appeared much more interesting. All six students more or less correctly explained that for
the happy ball, it had kinetic energy right before and after the collision (a reference point
on the table). But for the unhappy ball situation, they used the term “heat” to explain
about “to what the kinetic energy of the unhappy ball was lost” (see Table 4.12). But
when being asked to explain more about what they mean by “heat,” none could give any
scientific explanations. Five basically had no ideas about the meaning of this term. To
student V, “heat” meant more like the concept of “internal thermal energy.”
For the model cart demonstration, four students were asked to explain why one
bounced back a significantly shorter than the other one, after they observed the
demonstration. At this point, the two carts were covered, so the students could not see
structures inside the two carts. As shown in Table 4.13, three of them thought that the
difference in bouncing between the two model carts could result from the difference
between their inside structures: 1) the bouncing cart had the center of mass lower; 2) it
had more mass on the side toward the cart’s bouncing direction; 3) it had something like
a pendulum swinging or moving in the same direction as the cart’s motion direction; or 4)
it had something stationary. In a word, the students thought that either the different mass
distribution or something moving inside the carts made them bounce or not bounce much.

190
Student responses to questions related to the demonstration using happy and unhappy balls (Calculus-based introductory students, N = 6)
SS Student reasoning about what happened to the energy of the unhappy ball right after the collision
I After the collision, the unhappy ball had no kinetic energy and no potential energy. The energy was lost to friction, sound, or heat. (The interviewer asked her to explain more about what she meant by “heat.”) I am not sure. The lab TA told me “heat”. It is internal friction, maybe?
II For this ball (unhappy ball) kinetic energy was lost to sound and heat. (The interviewer asked him to explain more about what he meant by “heat.”) “Heat” is like “thermal energy.” It makes you feel warm, I guess. I am not sure.
III Before, it (unhappy ball) had kinetic energy. After, no kinetic energy, no potential energy. The energy went to the table, sound, and thermal energy, maybe. (The interviewer asked her to explain more about what she meant by “thermal energy.”) To be honest, I don’t know. In order to be elastic, it (unhappy ball) should bounce back to the same height. But it didn’t. Its energy had to be lost to somewhere—I called it “thermal energy”. I don’t know what I mean.
IV As I said, I cannot remember what my professor said about this. Maybe the energy is transferred to heat, sound or something else. (The interviewer asked him to explain more about what he meant by “heat.”) It means friction force. They say friction is always “heat.” I really don’t know. I just take the word.
V The energy goes to the table since it (unhappy ball) stays on the table. (The interviewer asked him to explain in what form he thought the energy existed in the table.) Internal thermal energy. I mean, like heat, sound, or friction. (The interviewer asked him to explain more about what he meant by “heat.”) It is something like that, internal particles start moving a little faster. Then the kinetic energy goes into internal thermal energy.
VI Just before the hit, this ball (unhappy ball) had kinetic energy. After the hit, it’s lost to sound and heat. (The interviewer asked him to explain more about what he meant by “heat.”) Heat would be outside sources to lose energy, like sound, or like friction. I really don’t know.
Table 4.12: Student reasoning about what happened to the initial kinetic energy of the unhappy ball right after its collision.

191
Student responses to questions related to the demonstration using the two model carts (Calculus-based introductory students, N = 6)
SS Student reasoning about why one cart bounced back a significantly shorter distance than the other one (before two covers of the carts were take off)
I Cart A* has more friction on its wheels. (The interviewer told her that the two carts had the same type of wheels.) Their masses may be distributed in different locations. For example, Cart B’s center of mass may be lower, so it moves faster.
II Maybe something inside the carts is like a pendulum. It can shift or move one way or another. It could make Cart A slow down, but make Cart B speed up. Or maybe the carts have different mass distributions. More mass on this side could make Cart B move fast (he pointed to the non-bumper side of Cart B. Notice that this side pointed toward the cart’s motion direction when it bounced back). But if more mass is on this side (he pointed to the bumper-side of Cart A. Notice that this side did not pointed toward the cart’s motion direction when it bounced back.), Cart A cannot move that fast. So it slows down.
III N/A
IV I don’t why. It’s like the balls’ case. One bounced; one stopped. I really cannot think of why it’s like that.
V N/A VI Maybe something inside Cart A moving around. It moves in this way (pointing to the
opposite direction of the Cart A’s motion), but Cart A bounced back in this way. So it slowed down. Something inside Cart B is stationary. Like jelly, it cannot move around much. So Cart B bounced back a long distance.
* Note that the rubber-band cart was labeled cart A and the rigid-rod cart was labeled cart B during the interview. Table 4.13: Student reasoning about why one cart bounced back a significantly shorter distance than the other one (before two covers of the carts were taken off).

192
After the covers were taken off from the carts, the students were shown again that the two
carts collided with a wall. This time, they could see that the rigid-rod cart bounced back
farther than the rubber-band cart. Without being asked to pay attention to observing what
would happen to small weights on the two carts before and after the collisions, the
students were asked to provide their reasoning about why the rubber-band cart bounced
back a significantly shorter distance than the rigid-rod cart. Table 4.14 indicates that all
six students observed that the small weights on the rubber bands vibrated more after the
collision, but the small weights on the rigid rods could not move. They all thought this
difference resulted in the rubber-band cart slowing down. But two used an energy idea to
explain this, and three used a motion idea to explain this. Student III’s response was not
understood.
Finally, the students were asked to match the balls with the carts. Students I and
III matched them in two ways. First, they matched the happy ball with the rubber-band
cart since the cart had rubber bands on it and the happy ball was made of rubber or
spring-like material; the unhappy ball was matched with the rigid-rod cart since the cart
was rigid and the unhappy ball was made of rigid material like plastic. But they also
thought that, on the basis of their behaviors, the happy ball should match with the rigid-
rod cart since they both bounced back high; the unhappy ball should match with the
rubber-band cart since they both could not bounced back that much. The four other
students just matched the balls with the carts in the latter way.
4.3.3.2 Discussion of the Interview Results
Of the six students interviewed, one received A, three received B, and the other
two receive C and D as their final class letter grades. On the basis of the data discussed,

193
Student responses and explanations on questions related to the demonstration using the two model carts (Calculus-based introductory students, N = 6)
SS Student reasoning about why the rubber-band cart bounced back a significantly shorter distance than the rigid-rod cart (after two covers of the carts were take off)
I The small weights on the rubber bands can move independently in all different directions. So they slow down this cart (rubber-band cart). But the weights attached to this cart (rigid-rod cart) only can move in the same direction as the whole cart’s.
II You can see that the small weights vibrate back and forth after the hit. So they make the cart (rubber-ban cart) slow down. But for this one (rigid-rod cart), the small weights cannot move around. So nothing can slow it down.
III This rigid cart bounced back longer. It had an elastic collision. Its mass is concentrated on the rods. But for this rubber-band one, forces from the hit push these little ones (i.e., small weights) to vibrate. Its mass is concentrated on the rubber bands. This is the difference between the two carts. I can visualize it, but I cannot put it in words.
IV The energy used up to move these small weights on the rubber bands. So the rubber-band cart slowed down.
V The energy was transferred to move these weights around. So the energy was lost to that; this cart (rubber-band cart) could not bounce back that much. But this one (rigid-rod cart) could not lose energy to move the weight around. So the energy just went to move the cart back.
VI The small weights can move around on this cart (rubber-band cart), but cannot move around on this rigid one. So one is slowed down, and the other is not.
Table 4.14: Student reasoning about why the rubber-band cart bounced back a significantly shorter distance than the rigid-rod cart (after two covers of the carts were taken off).

194
it is apparent that no matter whether they were high-ability or low-ability students, they
all had similar difficulties understanding the concept of internal thermal energy. A major
difficulty with this concept is that the students misused the term “heat” to describe “to
what the kinetic energy lost,” and had no idea about what the “heat” is.
It appears that the students had no difficulty with the structures of the modified
model carts. With similar structures and similar mass distributions, they were easy for the
students to catch the difference in motion of the small weights on them.
4.4 Discussion and Summary
Overall, internal (thermal) energy is an abstract and not-easy-to-understand
concept for introductory students. They consider “heat” as “internal thermal energy”, but
they do not understand either of them. Students lack a meaningful mental picture of the
concept of internal thermal energy. “Learning by passively listening” is not effective for
most students to understand and visualize this abstract concept. Without a meaningful
understanding of this concept, it is difficult for students to understand physical processes
of work-energy and collisions. Students either use surface features (e.g., material
difference or structure difference) or common-sense ideas (e.g., mass difference) to
understand about inelastic or partially inelastic collisions.
The guided-inquiry learning activity was developed to help students visualize this
“invisible” concept and to develop a meaningful mental picture of it through interactively
participating in the learning activity. This activity was developed on the basis of
investigations reported in this chapter and research by others.
A pair of modified model carts were developed based on empirical data that we
collected from students. Our investigation indicates that the model carts originally

195
developed by Uri Ganiel are not easy for students to visualize “where the kinetic energy
goes.” Some students thought that the difference in mass distributions between the two
carts could result in the two carts’ different behaviors (i.e., one bounces back a
significantly shorter than the other one). A pair of the modified model carts has similar
structures and mass distributions. There is empirical evidence that this modified pair is
easy for students to visualize “vibration of small weights”, which models a gain of
internal thermal energy during the cart’s collision.
We developed a guided-inquiry learning activity based on the approach—elicit,
confront, and resolve—used by the Physics Education Group at the University of
Washington [10]. This activity consisted of two parts: student worksheets and
demonstrations using unhappy and unhappy balls and the modified model carts. The ball
demonstration and the first several related questions on the worksheets attempted to elicit
students’ ideas about elastic and inelastic collisions, in particular, their reasoning about
“where the kinetic energy goes” during the inelastic collision. The model cart
demonstration and associated worksheet questions were intended to confront the students’
common-sense ideas and surface-features-based reasoning that elicited from the first part
of the activity. Questions asking to match the model carts with the atomic model of a solid
and to match the model carts with the balls aimed to resolve the students’ difficulty and to
visualize “where the kinetic energy goes” during the inelastic collision and to develop a
meaningful mental picture of the concept of internal thermal energy.
To evaluate the effectiveness of the guided-inquired learning activity, we
conducted a series of assessment activities, including written tests and in-depth individual
student demo nstration interviews. By analyzing students’ responses to the worksheet

196
questions, we found that after learned the activity, many students could imagine that the
initial kinetic energy of the unhappy ball must go to its internal energy—its molecules
inside vibrate or move more afterward. For example, seventy-six percent of the students
from the autumn 1999 provided such responses to explain why the unhappy ball did not
bounce back. Also, most students (seventy-six percent from the autumn 1998 and ninety-
seven percent from the autumn 1999) could use the concept of internal (thermal) concept
to explain “where the kinetic energy goes” during the unhappy ball’s inelastic collision.
Written test data have shown that students who learned the guided-inquiry
learning activity gain a better conceptual understanding of the conservation of energy
during inelastic collisions. Helping students build such a conceptual understanding does
not hurt their problem solving performance.
In summary, the research discussed in this chapter illustrates an example of how
to use visualization to help students gain a meaningful mental picture of the abstract
concept of internal thermal energy. Seeing “where the kinetic energy goes “ during
inelastic collisions could help students understand the conservation of energy. The mental
image of internal energy could help them in inelastic collision problem solving.
197
ENDNOTES OF CHAPTER 4
1. For instance, Fundamentals of Physics (5th ed., John Wiley & Sons, Inc, New York, 1997) by Halliday, Resnick, and Walker, is a widely-used textbook for introductory physics classes. In this book, the concept of internal energy is first introduced when the work done by a kinetic frictional force is discussed. Here is a quote from the book: “Thermal energy is said to be an internal energy of an object because it involves random motion of the atoms and molecules within the object…”(See Vol. 1, p. 166.) When the concept of an inelastic collision is introduced, the book says: “An inelastic collision is one in which the kinetic energy of the system of colliding bodies is not conserved…The kinetic energy that is lost in any inelastic collision is transferred to some other form of energy, perhaps thermal energy.” (See Vol.1 p. 222.) Just by reading these sentences, it is hard for a student to develop a meaningful understanding of the abstract concept of internal (thermal) energy and to visualize “where the kinetic energy goes” during an inelastic collision.
2. Ganiel, U., “Elastic and inelastic collisions: A model”, Phys. Teach. 30, 18-19 (1992).
3. Arbor Scientific (P.O.Box 2750 Ann Arbor, MI 48106-2750. Call toll-free 1-800-
367-6695). See more details on the Arbor Scientific web site. 4. Morton, M. (ed.), Rubber Technology (Van Nostrand Reinhold Company, New York,
1987), pp. 8-9, 14. 5. This phenomenon is very temperature dependent. A happy ball will not bounce well if
it is cooled down. 6. See the written material coming along with an order of the happy/unhappy balls from
the Education Innovation, Inc. (151 River Road, Cos Cob, CT 06807, and email: [email protected]).
7. Arons, A. B., Teaching Introductory Physics (John Wiley & Sons, Inc., New York,
1997), in part I, pp. 139-142, pp. 150-153 and in part III, pp. 67-81.
8. Van Domelen, D., The Development of the Problem Decomposition Diagnostic, Ph.D. dissertation, The Ohio State University, 2000.
9. Hestenes, D., Wells, M., and Swackhamer, G., “Force Concept Inventory,” Phys.
Teach. 30, 141-151 (1992).

198
10. Wosilait, K., Research as a guide for the development of tutorials to improve student understanding of geometrical and physical optics, Ph.D. dissertation, University of Washington, 1996.

199
CHAPTER 5
VISUALIZATION OF INTERNAL POTENTIAL ENERGY PRODUCED DURING INELASTIC COLLISIONS
In a solid, in addition to the internal thermal energy, atoms also have internal
potential energy, which is due to electrical and quantum mechanical interactions among
atoms. The interaction between two neutral atoms is approximately represented by the
Lennard-Jones potential energy function [1] (see Figure 6.1),
( ) ( )
−=
rrU LJ
σσε612
4 ,
where ε is the depth of the potential energy at its minimum, and σ is the distance at
which the potential energy is zero. Since the negative slope of the potential energy curve
is the force, the energy graph in Figure 6.1 shows that two neighbor neutral atoms attract
each other at some intermediate distances but repel each other strongly within a very
short distance. Inside a solid, this interaction makes one atom bond together with several
surrounding atoms. These bonded atoms could form a molecule and many of these
molecules constitute a macroscopic solid.
When a solid is compressed or stretched by a mechanical force (i.e., a certain
amount of work done on the solid), the separations between atoms, especially atoms near

200
Figure 5.1: Lennard-Jones potential energy function, which approximately describes the potential energy of two neutral atoms.
the surface of the solid, are changed (become shorter or longer). Correspondingly, the
potential energy of two neighboring atoms is changed. Therefore, in either situation, the
solid gains internal potential energy due to the mechanical work done on it.
This type of internal potential energy, associated with a change of the
configuration of the atoms, and internal thermal energy are commonly produced during
inelastic collisions. For example, in a car accident, two colliding cars very often become
deformed after bumping together. Some atoms inside deformed metal parts of the cars are
either stretched or compressed so that they have a gain of internal potential energy [2]. As
a result, the two-car system gains internal potential energy from the kinetic energy of the
two cars before their collision. Of course, as discussed in Chapter 4, the bent bodies of
the two cars can also become hot since some of the initial kinetic energy of the two-car
system is also converted to internal thermal energy (larger random kinetic energy of the
atoms). In addition to these two types of internal energy produced during the car
r
σ=r
ε
U

201
collision, a small amount of the initial kinetic energy of the system is also radiated away
as sound waves—the bang sound produced during the collision [2].
To help students develop a comprehensive mental picture of the internal energy
produced and the energy transformation during an inelastic collision, it is important for
them to be able to visualize internal potential energy, in addition to internal thermal
energy. The energy associated with the sound wave is not emphasized in this dissertation,
as 1) the sound energy, produced during macroscopic collisions usually accounts for only
a small fraction of the initial kinetic energy; 2) the sound can be heard so that it is not
difficult for a student to realize that it is produced during collisions; and 3) it appears that
many students do not have difficulty understanding sound energy (see Section 5.1.2 for
details).
This chapter reports research concerning student difficulties in understanding the
concept of internal potential energy. The chapter has four sections: 1) Investigating
students’ initial understanding, in particular, their difficulties with the internal potential
energy produced and the energy transformation during inelastic collisions; 2) Developing
and implementing an experiment problem as a hands-on laboratory activity to help
students visualize the internal potential energy produced during a partially inelastic
collision; 3) Assessing the effectiveness of the learning activity on student understanding;
and 4) Discussing results of the studies.

202
5.1 Investigation of students’ difficulties understanding the internal potential energy produced during inelastic collisions
We might hypothesize that the concept of internal potential energy could easily be
visualized, since it is associated with a change in the physical shape of a solid. But, does
a student really understand that a substance gains internal potential energy when it has a
change in its shape? To investigate this question, we conducted individual student
demonstration interviews with a small number of students and administered a written test
question to a large number of students. Below we report the details of these studies.
5.1.1 Individual Student Demonstration Interviews (Spring 1998)
In spring 1998 the individual student demonstration interviews, as discussed in
Section 4.1.1, were conducted to investigate what students understand about the concept
of internal energy (in particular, the concept of internal thermal energy) and energy
transformation during inelastic collisions. Among three major demonstrations used (see
Section 4.1.1.1), one involved dropping an unhappy ball and a modeling clay ball onto a
table from the same height. The students were informed that these two balls had identical
masses. Then they were asked to predict what would happen to the balls after being
dropped and to give their reasoning. This was followed by an actual demonstration, and
students were asked to explain their reasoning on the basis of their observations. Five
students, three honors engineering freshmen and two regular engineering students
participated in the interviews.
203
5.1.1.1 Student Responses and Reasoning on the Task
All five students predicted that the unhappy ball and the modeling clay ball would
not bounce back if they were dropped onto the table. For the unhappy ball, since the
students had seen from the first demonstration that it did not bounce back, it was not
surprising that they “predicted” (actually based on their previous observations) that the
unhappy ball would not bounce back (see Section 4.1.1 for more details). However, all
five students predicted that the clay ball would not bounce back either and they all
mentioned that the clay ball would have a change of its shape afterward. The two regular
students reasoned that the clay ball would absorb the force from the table since the clay
ball would be compressed or smashed in. One honors student explained that because the
clay ball had a lower density, it would get flat at its bottom. So the clay ball would stay on
the table. The other two honors students explained that because the clay ball would be
compressed, molecules inside the clay could not be pushed back to the original shape, so
the clay ball could not bounce back.
After the clay ball was actually dropped, the students could physically see that the
part of the clay ball touching the table was flattened or deformed. This was consistent
with the students’ prediction. Then the interviewer asked the students about what types of
energy the clay ball had right before it hit the table. All five students answered that the
clay ball had kinetic energy. Their responses to the question about “where the initial
kinetic energy of the clay ball goes after the collision” became interesting. Two regular
students believed that the kinetic energy was transferred to the force to change the clay
ball’s shape. One honors engineering student explained that some kinetic energy was
transferred to internal energy of the clay ball to make molecules inside bent and

204
compressed; some kinetic energy went to the table as well to compress molecules inside
the table. Another honors student proposed that the initial kinetic energy of the clay ball
was transferred to energy, at an atomic level, such as to breaking bonds between
molecules, to compressing, or to stretching molecules. The last student’s response was
that the initial kinetic energy of the clay ball went into deforming the clay ball. He said
that the table exerted a force on the clay ball and pushed molecules inside over some
distance.
5.1.1.2 Discussion of the Interview Results
It was apparent that all five students knew that clay ball would stay on the table
after the collision. But it appeared that the honors engineering students had a better
understanding in terms of the reason that the clay ball could not bounce back. The three
honors students more or less realized that the deformation of the clay ball was related to a
type of internal energy associated with separations of molecules or bonds between
molecules. But obviously, they did not know what term in physics to use to describe this
type of energy.
The two regular students used a force idea to explain why the clay ball stayed on
the table. Even after being explicitly asked to use an energy idea to explain “where the
kinetic energy goes,” they still reasoned that the kinetic energy was transferred to the
force needed to deform the clay ball. Apparently, they had difficulty understanding the
internal potential energy, modeled by the deformation of a clay ball, which was produced
during the inelastic collision. They were unable to link a change of the shape of a
substance with a gain in its internal potential energy. But it appeared that two students

205
somewhat realized that the initial kinetic energy was “something” related to the
deformation of the clay ball. But obviously they did not know what the “something” was.
5.1.2 Pretest Problem (Spring 1999)
In the spring quarter of 1999, a written test question (see Figure 5.2) was
administered to the physics 131 students in their laboratory sections. This 131 class,
including two lecture sections, was a regular calculus-based introductory physics class for
engineering and science students at OSU. The two lecture sections were taught by two
different professors, but covered the same content: kinematics, Newtonian dynamics,
momentum, work and energy, and some rotational dynamics. Students from these two
lecture sections were mixed together in sixteen laboratory sections, scheduled from
Mondays to Wednesdays. The problem shown in Figure 5.2 was administered to the
students at the beginning of each laboratory section during the last week of the quarter,
when the students had learned the concepts of work and energy, momentum, and
collisions. The question was called a pretest problem since it was given to the students
after standard instruction but before they were exposed to a research-based laboratory
activity.
5.1.2.1 A Multipart Problem Including a Partially Inelastic Collision
The physical process described in the pretest problem in Figure 5.2 included three
small sub-parts: 1) The pendulum bob swung down until just before hitting the box—a
conservation of energy problem; 2) the bob collided with the box—a conservation of
momentum problem; and 3) the box slid on the table until it comes to a stop—a

206
Figure 5.2: The pretest problem was administered to students in the OSU regular calculus-based physics 131 class in the spring quarter of 1999. When taking this test, the students had learned the concepts of work and energy, momentum, and collisions.
Just after the collision: The bob stops, and the block moves forward with speed u.
u
m M
Just before the collision: The bob has a speed v, and the block is at rest.
v m M
A pendulum bob is released horizontally from the rest and swings down to hit a block at rest on a table. The mass M of the block is larger than the mass m of the bob. Jut after the collision, the bob stops and the block starts to move.
(a) Is the kinetic energy of the pendulum bob just before the collision greater than, equal to or less than the kinetic energy of the block right after the collision? Please clearly explain your reasoning. (b) Is the magnitude of the momentum of the pendulum bob just before the collision greater than, equal to or less than the magnitude of the momentum of the block right after the collision? Please clearly explain your reasoning.

207
conservation of energy problem or a dynamics problem. The collision between the
pendulum bob and the box was partially inelastic since the bob and the box did not stick
together but some internal (thermal and potential) energy was produced during the
collision. The pendulum bob stopped after the collision. Some of its initial kinetic energy
was converted to the internal energy of the bob-block system and the rest was transferred
as the kinetic energy to the block so that the block started to slide just after the collision.
A problem such as the one discussed above is called a multipart problem since it could be
divided into two or more smaller, simpler sub-problems that could be solved by a single,
basic physics law [3].
During the collision part of many introductory physics courses, physics
instructors emphasize elastic collisions and completely inelastic collisions, which are
relatively simple ideal situations. However, in daily life, collisions such as traffic
accidents are neither elastic nor completely inelastic collisions (since some internal
energy is always produced and the colliding objects do not stick together after the
collisions). Such collisions are partially inelastic. To help students develop skills in
solving complex, real-world problems (see more details in Section 5.2.3.1), it is
important to expose students to real-life situations, such as partially inelastic collisions.
The pretest problem, including two sub-questions (a) and (b), emphasized
students’ understanding of the partially inelastic collision. Question (a) attempted to
probe what students understood about the concept of internal energy and about the energy
transformation during the partially inelastic collision. Question (b) investigated what
students understood about conservation of momentum. In our teaching, we found that
many students could recite the conservation of energy and momentum principles, but

208
were not able to apply them correctly in solving collision problems. (Similar results were
found in some previous studies as well—see Chapter 2 for more details.) Thus, to avoid
triggering some students to recite the laws when answering questions (a) and (b), we
attempted not to use terms or phrases such as “conservation,” “energy is conserved,” or
“momentum is conserved” in the pretest problem. Furthermore, the problem statement
explicitly mentioned that the mass M of the block was larger than the mass m of the bob.
We knew that students had learned head-on elastic collisions, especially a simple one, in
which the target and the projectile have equal mass and they just exchange velocities
(i.e., after the collision, the projectile stops but the target starts to move with the initial
velocity of the projectile). The partially inelastic collision described in the pretest
problem was very similar to a head-on elastic collision in which two colliding objects
have identical mass. To avoid confusion, the problem explicitly stated that the block had
larger mass than the bob. In this situation, only a partially inelastic or inelastic collision
can occur. Otherwise, the bob would bounce back if it were elastic.
5.1.2.2 Student Responses and Reasoning
Student responses and reasoning on questions (a) and (b), which came from 135
students in one lecture section of the physics 131 class, were analyzed and are
summarized in Tables 5.1 and 5.2.
For the 135 students answering question (a), forty-seven percent thought the
kinetic energy of the pendulum bob right before the collision was greater than the kinetic
energy of the block right after the collision. Forty percent thought the kinetic energy of
the bob was equal to the kinetic energy of the block right after the collision, and eleven

209
Calculus-based physics 131 in the spring quarter of 1999 N = 135
Answer Explanation 9% Due to friction 7% Energy is lost 7% Energy is lost to heat, sound, or other forms of energy
25%
2% Energy is lost to internal energy 7%
The bob has greater velocity before the collision. Although the mass of the block is greater, velocity square counts more than mass for the kinetic energy
4% Inelastic collision
Greater than
47%
11% Blank, unclear, or other reasoning 16% Elastic collision
17% Because energy is conserved or because the bob stops after the collision, all kinetic energy is transferred
Equal to
40%
7% Blank, unclear or other reasoning Less than
11% Inelastic collision or the block has more mass, and some other reasoning
Blank/ unclear
2%
Table 5.1: Students’ responses and explanations for question (a), shown in Figure 5.2, which asks to compare the kinetic energy of the pendulum bob just before the collision with the kinetic energy of the block just after the collision.

210
Calculus-based physics 131 students in the spring quarter of 1999 N = 135
Answer Explanation 4% Due to friction or energy lost Greater than 7% 3% Other reasoning 51% Momentum is always conserved 6% Conservation of energy 5% Mass and velocity are balanced out 4% No outside forces 3% Elastic collision
Equal to 85%
16% Blank or other reasoning 2% Due to friction or energy lost Less than 7% 5% Others
Blank/unclear 1% Table 5.2: Students’ responses and explanations for the question (b), shown in Figure 5.2, which asks to compare the magnitude of the momentum of the pendulum bob just before the collision with the magnitude of the momentum of the block just after the collision. percent thought the kinetic energy of the bob was less than the kinetic energy of the
block.
From the data in Table 5.1, about thirty-three percent of the students thought that
the kinetic energy of the bob before the collision equaled the kinetic energy of the block
after the collision. Since the bob and the block did not stick together after the collision,
many students thought that the collision between the bob and the block was not inelastic.
Hence, it had to be elastic and kinetic energy was conserved. In addition, some students
thought the collision was an elastic one since the bob stopped and the block started to
move afterward.
Second, of the forty-seven percent of the students who had the “correct” final
answers, most did not provide correct explanations. Nine percent mentioned that, due to
friction, the initial kinetic energy of the bob was greater than that of the block after the

211
collision, but they did not explain further how the friction caused that. Another nine
percent explicitly mentioned that during the collision some energy was lost to heat,
sound, internal energy, or to other forms of energy, then the initial kinetic energy of the
bob was greater than the final kinetic energy of the block. As discussed in Chapter 4,
these students could have just used these terms without meaningful understanding. In
other words, they lacked mental images for these abstract concepts.
For question (b), Table 5.2 shows that eighty-five percent answered that the
magnitude of the momentum of the bob right before the collision equaled that of the
block right after the collision. Seven percent thought that the magnitude of the
momentum of the bob was greater than that of the block right after the collision, and
another seven percent thought that the magnitude of the momentum of the bob was less
than that of block right after the collision.
It is interesting to see that fifty percent of the students held the idea that
momentum was always conserved for collisions. This was correct for dealing with simple
elastic and inelastic collision problems, but they did not develop a fundamental
understanding of why the momentum was conserved for these collisions. Only four
percent of the students explained that, due to absence of outside forces, the magnitude of
the initial momentum of the bob was equal to the magnitude of the momentum of the
block after the collision. This was the correct answer.
5.1.2.3 Discussion of Pretest Results
From the data shown in Tables 5.1 and 5.2, it appears that after standard
instruction very few students have acquired a deep understanding of the conservation of

212
energy and momentum principles, fundamental laws to be used to describe collision
processes. Most students had a variety of difficulties understanding collisions.
First, most students lacked a meaningful understanding about what “the loss” was
during inelastic collision. Some students comparing colliding bodies’ masses, velocities
or a combination of the two to decide whether or not the kinetic energy was conserved
during the collision. This result was similar to a research finding reported by Grimellini-
Tomasini et al. [4] (see detailed discussions in Chapter 2).
Second, some students attempted to use the idea of friction to explain “why the
kinetic energy was lost.” They did not understand how friction could reduce the kinetic
energy to be lost.
Third, the data in Table 5.1 indicate that some students seemingly knew that some
energy was lost during the collision. But it was apparent that they did not understand “to
what the energy was lost.”
Fourth, it was difficult for some students to distinguish conceptually energy and
momentum. It seemed to them that both the conservation of energy and the conservation
of momentum were decided by a single undefined mechanism. The data in Tables 5.1 and
5.2 show that some students thought that if the energy was conserved, momentum was
conserved as well; if energy was lost, momentum was lost too. This difficulty for students
in understanding of collisions was also identified by Grinellini-Tomasini et al. [4].
Fifth, some students used surface features to identify different types of collisions.
For instance, they considered the collision as elastic if colliding objects “not stick
together” or “one was moving and one stationary before and after the collision.”

213
Finally, many students just memorized phrases (e.g., momentum is always
conserved during collisions) to justify whether the momentum was conserved or not
during the collision. They lacked an understanding of the condition that was necessary for
the conservation of (linear) momentum held true (i.e., no net external force acting on a
closed or isolated system).
In summary, most students did not develop a meaningful understanding of “the
lost energy,” the internal thermal and potential energy, produced during inelastic
collisions. They had difficulty understanding the energy transformation conceptually
during inelastic collisions. Additionally, many students did not acquire a conceptual
understanding of the fundamental conditions that determine the conservation of
momentum and kinetic energy.
5.1.3 Discussion of Student Difficulties Understanding the Internal Potential Energy Produced during Inelastic Collisions
Overall, on the basis of the written test data from a large number of students and
the interview data from a small number of students, it is apparent that most introductory
physics students after standard instruction lack a conceptual understanding of internal
energy, which is a very abstract but critical concept involved in partially or completely
inelastic collisions. Student difficulties with the concept of internal potential energy could
be identified as: 1) Students lack a conceptual understanding of internal potential energy.
That is, students do not know how atoms interact at an atomic level. And they do not
know that the interaction is defined in one way by potential energy (e.g., Lennard-Jones
potential energy function) and the potential energy is a function of the separations
between atoms. 2) Students are unable to link a change of a solid’s shape at a

214
macroscopic level to a gain in its internal potential energy at a microscopic level. 3)
Students do not know what concept or term in physics should be used to describe the
energy associated with the deformation of a colliding object.
5.2 Development and Implementation of an Experiment Problem as a Laboratory Activity
Student difficulty could result from many reasons. For example, problems in the
text describe situations already simplified and often explicitly inform students that a
collision is either elastic or completely inelastic [5]. Students do not need to decide if the
conservation of kinetic energy law or the conservation of momentum is the most
appropriate concept needed to solve the problems. They could simply find associated
equations and plug numbers into them to solve the problems. There is ample evidence
from physics education research [6] that student deep conceptual understanding does not
often come as a result of solving standard, quantitative problems. Developing a mental
image of the concept of internal potential energy is very important to help students
develop a conceptual understanding of the conservation of energy principle and to
understand “to what the kinetic energy is lost” during inelastic collisions. Below we
report a curriculum development and implementation to help students visualize internal
potential energy.
5.2.1 Development of Pendulum-Box Bash Experiment Problem (Spring 1999)
On the basis of the investigation discussed above, an interactive laboratory
activity using a Pendulum-Box Bash (PBB) experiment problem was developed to
address student difficulties and to help students visualize internal potential energy
215
produced during a partially inelastic collision. A detailed setup of the PBB experiment
problem and student laboratory worksheets are shown in Appendixes L and M.
5.2.1.1 Problem Setup
The physical process for this PBB laboratory activity was similar to the pretest
problem. It can be divided into three small sub-parts: 1) The pendulum bob swings down
until just before hitting the stationary box—a conservation of energy problem; 2) the bob
collides with the box—a conservation of momentum problem; and 3) the box slides on
the table until it stops—a conservation of energy problem or a dynamics problem. The
collision between the pendulum bob and the box was partially inelastic (see the section
below for details). By adjusting the mass of the box, the bob could come to a stop after
the collision.
5.2.1.2 The Use of a Sandbag versus a Super ball as the Pendulum Bob
Two versions of the PBB laboratory activities were designed: one using a sandbag
as the pendulum bob, the other one using a super ball as the pendulum bob. The other
apparatus and the laboratory setup were identical.
Sandbag version: When a sandbag serving as the pendulum bob was released
from rest initially (with the string horizontal), it collided with the stationary box
(paperboard box) at the bottom of its swing. After the collision, the sandbag almost
stopped and was significantly deformed. A student could see the deformation, which
illustrated that some internal potential energy of the sandbag changed during the
collision.
Super ball version: Compared with a sandbag, after colliding with the box, a
super ball did not have a visible change of its shape. A student could not physically see

216
any deformation of the super ball. By adjusting the mass of the box, the super ball could
be made to come to a stop after the collision. There was still internal potential energy
produced (such as a small deformation of the paperboard box).
5.2.2 Development of Student Laboratory Worksheets
In addition, student laboratory worksheets (see Appendix M) were developed for
this PBB laboratory. The worksheets consisted of two parts: the problem statement and
follow-up questions. The problem statement, like telling a story, described the students’
task. The problem statement characterized a complex, multipart situation and was poorly
defined.
The follow-up questions attempted to address the student difficulties discussed in
Section 5.1. For example, questions (a) and (b) were intended to help students understand
that the initial kinetic energy was partly converted to internal potential energy (the energy
to deform the colliding objects, the sandbag–box system or the super ball-box system).
Using experimental data, students could calculate the kinetic energy of the pendulum bob
just before the collision and the kinetic energy of the box just after the collision and could
see if they were the same or different. Students could see that about 20%~30% of the
initial kinetic energy of the bob was converted to the internal potential energy of the ball-
box system when using a super ball as the pendulum bob and about 35%~45% of the
initial kinetic energy when using a sandbag as the pendulum bob [7].
Questions (c) to (e) attempted to help students understand the conservation of
momentum. From their calculations, students could see that the initial momentum of the
bob equaled that of the box just after the collision.

217
The last question, (f), aimed to help students recognize the collision as a partially
inelastic one (the momentum of the bob-box system was conserved, but not the kinetic
energy).
5.2.3 Instruction
Students were exposed to this experiment problem in a laboratory setting (the
Physics 131 lab) during the last week of the spring quarter of 1999. Of sixteen lab
sections, students in the first eight laboratory sections used a sandbag as the pendulum
bob, while students in the other eight laboratory sections used a super ball as the
pendulum bob.
Five graduate and undergraduate teaching associates taught these sections, and
each of them taught both laboratory versions. All the laboratory instructors attended a
training session in which they learned how to teach the laboratory activity from a
laboratory coordinator (another graduate student teaching associate).
5.2.3.1 Experiment Problem
The Pendulum-Box Bash laboratory, an experiment problem [8, 9, 10], consists of
a set of apparatus that can be used to perform some task that is stated as a problem. To
solve the experiment problem, a student usually needs to take the following major three
steps:
1) Plan a solution
• Draw a sketch;
• Organize and access conceptual knowledge;
• Define a poorly-defined problem;
• Divide a complex problem in smaller, simpler problems;

218
• Represent the parts in multiple representations; and
• Reassemble the parts together to get the solution to the complex problem.
2) Measure and estimate physical quantities
• Measure related quantities and record data;
• Make proper approximations and estimations; and
• Put solutions of the parts together with values and make a prediction for the
outcome of the experiment.
3) Evaluate the solution
• Perform the experiment;
• Enumerate and evaluate approximations; and
• Assess and modify the solution.
For solving the PBB experiment problem, students basically were exposed to the problem
solving procedure as above.
5.2.3.2 Sandbag versus Super Ball Laboratory
In a laboratory room, a group of three or four students worked together to
complete the laboratory task in a period of two hours. During laboratory sections in
which students were exposed to the PBB experiment problem using a super ball as the
pendulum bob, laboratory instructors found that they had to tell students that the collision
was partially inelastic. But for the laboratory activity using a sandbag as the pendulum
bob, students could see that the sandbag became significantly deformed during the
collision. The student realized that some initial kinetic energy was “lost” to the energy to
deform the sandbag. Major differences between these two versions of the laboratory
activity were summarized in Table 5.3.

219
Sandbag Super ball
Significant and apparent deformation No visible change of shape Differences
Deformation modeling internal potential energy production
Students were told some internal potential energy was produced
Table 5.3: Major differences in using a sandbag as the pendulum bob and using a super ball as the pendulum bob for the Pendulum-Box Bash Experiment Problem Laboratory activity. 5.3 Assessment of the Effectiveness of the Pendulum-Box
Bash Experiment Problem as the Laboratory Activity (Spring 1999)
In the spring quarter of 1999, we conducted a series of measurements, including
written test problems and individual student demonstration interviews, with regular 131
students who had performed the PBB experiment problem in the laboratory. The
assessment attempted to answer the following questions: 1) was it effective to use the
deformation of a sandbag in helping students visualize “to what the kinetic energy is lost
to” or “where the kinetic energy goes” during partially inelastic collisions? 2) does such a
visual aid (the change in shape of the sandbag) help students develop a mental image of
“a type of internal energy” produced during inelastic collisions? and 3) does student
visualization of “the kinetic energy goes to the internal energy associated with
deformation” affect their performance in recognizing and approaching a collision part of
complex problems. The next three sections report the assessment results of the written
tests and the student interviews, and the last section discusses the evaluation results.

220
5.3.1 Student Performance on Post-Test Problem
At the end of the PBB lab, a test problem was given to the 131 students to assess
their understanding about the concept of internal potential energy and the energy
transformation during a partially inelastic collision. The post-test problem, shown in
Figure 5.3, included two sub-questions, one that probed students’ understanding of
internal energy and the energy transformation during the collision and the other one
investigated students’ understanding of the conservation of momentum. The post-test
problem looked different in its surface features from the pretest problem shown in Figure
5.2 and the PBB experiment problem shown in Appendix M. A student could see a
deformation of the boxing bag after the collision. But in the problem statement, it did not
explicitly mention it. Furthermore, the post-test problem had an emphasis on the
collision, which was partially inelastic as well.
5.3.1.1 Student Responses and Reasoning
Of 135 students from one section of the Physics 131 course, 67 took the PBB
laboratory using the sandbag as the pendulum bob, while the other 68 took the PBB
laboratory using the super ball as the pendulum bob. Students’ responses on the post-test
questions (a) and (b) are summarized in Tables 5.4 and 5.5. Table 5.4 shows that, of 67
students in the sandbag laboratory, eighty-two percent answered that the initial kinetic
energy of the fist was greater than the kinetic energy of the bag right after the collision.
Sixteen percent answered that the initial kinetic energy of the fist was equal to the kinetic
energy of the bag right after the collision. Similarly, of 68 students in the super ball
laboratory, eighty-five percent answered that the initial kinetic energy of the fist was

221
Figure 5.3: The post-test problem was administered to students in one section of the calculus-based physics 131 course in the spring quarter of 1999. The students took this test at the end of the Pendulum-Box Bash Experiment Problem laboratory.
A karate expert strikes with his fist of mass m a free-hanging boxing bag of mass M. The mass M of the bag is larger than the mass m of his fist. (a) Is the kinetic energy of the karate expert’s fist just before the collision greater
than, equal to or less than the kinetic energy of the boxing bag just after the collision? Please clearly explain your reasoning.
(b) Is the magnitude of the momentum of the karate expert’s fist just before the
collision greater than, equal to or less than the magnitude of the momentum of the boxing bag just after the collision? Please clearly explain your reasoning.
Just before the collision: The fist has a speed v, and the bag is at rest.
v
M
u
Just after the collision: The fist stops, and the bag swings up with speed u.
M

222
Calculus-based physics 131 in the spring quarter of 1999 N = 135
Laboratory Student responses on the post-test problem 49% Deformation or a change in the shape of the
boxing bag 27% Heat, sound, or due to friction
Greater than
82%
6% Unclear or other reasoning Equal to
16% Energy was conserved, no friction, the bob stopped afterward, or no explanations
Sandbag (N = 67)
Unclear 2% 28% Deformation or a change in the shape of the
boxing bag 50% Heat, sound or due to friction
Greater than
85%
7% Unclear or other reasoning Equal to
12% Energy was conserved, no friction, the bob stopped afterward, or no explanations
Super ball (N = 68)
Unclear 3%
Table 5.4: Students responses and explanations, grouped by the sandbag and the super ball laboratory, on question (a) of the post-test problem shown in Figure 5.3, which asked to compare the kinetic energy of the karate expert’s fist just before the collision with the kinetic energy of the boxing bag just after the collision.

223
Calculus-based physics 131 in the spring quarter of 1999 N = 135
Laboratory Student responses on the post-test problem 79% Conserved or always conserved 2% No external forces 2% Conservation of energy
Equal to
97%
14% Blank, unclear or other reasoning
Sandbag (N = 67)
Greater than
3% Energy is lost or no reasoning
69% Conserved or always conserved 3% No external forces 2% Conservation of energy
Equal to
94%
20% Blank or unclear reasoning
Super ball (N = 68) Greater
than 6% Energy is not conserved or lost to deform the bag
Table 5.5: Students responses and explanations, grouped by the sandbag and the super ball laboratory, on question (b) of the post-test problem shown in Figure 5.3, which asked to compare the magnitude of the momentum of the karate expert’s fist just before the collision with the magnitude of the momentum of the boxing bag just after the collision.

224
greater than the kinetic energy of the bag right after the collision. Twelve percent
answered that the initial kinetic energy of the fist was equal to the kinetic energy of the
bag right after the collision.
However, when student explanations were analyzed in detail, some significant
differences appeared between these two groups. Among 67 students from the sandbag
laboratory, forty-nine percent [11] explained that some initial kinetic energy of the fist
was lost to “deformation of the boxing bag” or “a change in the shape of the boxing bag.”
Twenty-seven percent explained that some initial kinetic energy of the fist was “lost” to
“heat,” “sound,” or “due to friction.” But among 68 students from the super ball
laboratory, twenty-eight percent [11] explained that some initial kinetic energy of the fist
was “lost” to “deformation of the boxing bag” or “a change in the shape of the boxing
bag.” Half of them still explained that some initial kinetic energy of the fist was lost to
“heat,” “sound,” or “due to friction.”
Table 5.5 showed that student responses on question (b) of the post-test problem
were similar to each other for students from the sandbag and the super ball laboratory. It
appeared that most students from both groups believed that the momentum was
conserved during the collision, but few correctly understood why. To compare student
performance on the post-test problem more meaningfully, we also broke student
responses on the pretest questions into the sandbag and the super ball group. The results
for questions (a) and (b) were summarized in Tables 5.6 and 5.7, respectively. Data in
Table 6.6 showed that, among 67 students before taking the PBB laboratory using the
sandbag as the pendulum bob, forty-two percent answered that the initial kinetic energy

225
Calculus-based physics 131 in the spring quarter of 1999 N = 135
Laboratory Student responses on the pretest problem 21% Energy is lost to heat, sound, internal energy or due
to friction 8%
The bob has greater velocity before the collision. Although the mass of block is greater, velocity square counts more than mass for the kinetic energy
Greater than
42%
13% Unclear and other explanations 18% Elastic collision 16% Energy is conserved or all kinetic energy is
transferred 3% The bob stops after the collision, so all energy is
transferred to the block
Equal to
46%
9% Other explanation or blank Less than
11%
Sandbag (N = 67)
Unclear/ blank
0%
29% Energy is lost to heat, sound, internal energy or due to friction
6%
The bob has greater velocity before the collision. Although the mass of block is greater, velocity square counts more than mass for the kinetic energy
Greater than
52%
17% Unclear and other explanations 15% Elastic collision 7% Energy is conserved or all kinetic energy is
transferred 6% The bob stops after the collision, so all energy is
transferred to the block
Equal to 34%
6% Other explanation or blank Less than
12%
Super ball (N = 68)
Unclear/ blank
3%
Table 5.6: Students responses and explanations, grouped by the sandbag lab and the super ball laboratory, on question (a) of the pretest problem shown in Figure 5.2, which asked to compare the kinetic energy of the pendulum bob just before the collision with the kinetic energy of the block just after the collision.

226
Calculus-based physics 131 in the spring quarter of 1999 N = 135
Laboratory Student responses on the pretest problem 57% Conserved or always conserved 3% No external forces 4% Conservation of energy 0% Elastic collision 4% Mass and velocity are balanced out
Equal to
86%
18% Blank, unclear or other reasoning Greater than
5%
Sandbag (N = 67)
Less than
9%
46% Conserved or always conserved 4% No external forces 7% Conservation of energy 6% Elastic collision 6% Mass and velocity are balanced out
Equal to
84%
15% Blank or unclear reasoning Greater than
9%
Super ball (N = 68)
Less than
5%
Unclear/ Blank
2%
Table 5.7: Students responses and explanations, grouped by the sandbag lab and the super ball lab, on question (b) of the pretest problem shown in Figure 5.2, which asked to compare the magnitude of the momentum of the pendulum bob just before the collision with that of the block just after the collision.

227
of the bob was greater than the kinetic energy of the box right after the collision. Forty-
six percent answered that the initial kinetic energy of the bob was equal to the kinetic
energy of the box right after the collision. But among 68 students before taking the PBB
laboratory using the super ball as the pendulum bob, fifty-two percent answered that the
initial kinetic energy of the bob was greater than the kinetic energy of the box right after
the collision. Thirty-four percent answered that the initial kinetic energy of the bob was
equal to the kinetic energy of the box right after the collision.
Data in Table 5.7 showed that student responses on question (b) of the pre-test
problem were similar to each other for students from the sandbag and the super ball
laboratory. Eighty-six percent of the students who took the sandbag laboratory answered
that the magnitude of the initial momentum of the bob was equal to that of the box after
the collision, while eighty-four percent of the students who tool the super ball laboratory
answered that the magnitude of the initial momentum of the bob was equal to that of the
box after the collision.
Students’ final class letter grades also were analyzed. Among 67 students who
took the sandbag version laboratory, 27 (40%) received A and B (higher grades), 38
(57%) received C and D (lower grades), and 2 (3%) received E (failure). Similarly,
among 68 students who took the super ball version laboratory, 25 (37%) received A and
B, 40 (59%) received C and D, and 3 (4%) received E (failure). A distribution of the
number of students, from the sandbag and the super ball laboratory, who received final
class letter grades as A and B, C and D, as well as E is summarized in Figure 5.4.

228
A&BC&D
E
Sandbag
Super Ball0
5
10
15
20
25
30
35
40
SandbagSuper Ball
Figure 5.4: Distribution of the number of students, from the sandbag and the super ball laboratory, who received final class letter grades as A and B, C and D, as well as E.

229
5.3.1.2 Discussion of Post-Test Results
On the basis of data discussed above, it was interesting to see that some
differences in student performance on the post-test problem appeared between the
sandbag and the super ball group. First, it was apparent that more students from the
sandbag laboratory than from the super ball laboratory realized that some of the initial
kinetic energy of the fist was “lost” to the energy to make the boxing bag deformed.
About half of the students from the sandbag laboratory but less than one third of the
students from the super ball laboratory gave such answers. Second, half of the students
from the super ball laboratory used scientific words that they did not understand (for
example, “heat” or “due to friction”) to describe “how or to what the kinetic energy was
lost”. But less than one third of the students from the sandbag laboratory gave such
answers.
The two groups had similar responses to question (a) on the pretest. Thus, we
think that the difference in student responses to the post-test question (a) resulted from
two different versions of the PBB experiment problem. The deformation of a sandbag
helped students visualize “where the kinetic energy goes” during the inelastic collision.
Similar results appeared for these two groups for question (b). On an average,
about ninety-five percent students from each group answered that the magnitude of the
momentum of the fist before the collision equaled that of the boxing bag after the
collision. Seventy to eighty percent of the students said that the momentum was always
conserved. The sand bag and the super ball as the pendulum bob versions of the
experiment had the same effect on students’ understanding of why the conservation of
momentum principle was appropriate to apply for solving the partially inelastic collision.

230
5.3.2 Student Performance on a Final Examination Problem
This section discussed student performance on the final examination problem (see
Figure 5.5). The problem included three sub-parts, one of which was a partially inelastic
collision. The first part, the pendulum bob swinging down to the bottom, was a
conservation of energy problem. The second small part was the collision between
pendulums bobs A and B, a partially inelastic collision and conservation of momentum
problem. The third part was also a conservation of energy problem, the pendulum B
swinging up after the collision. This test problem differed in some surface features from
the PBB experiment problem, but was equal in terms of physics concepts.
This test problem primarily attempted to assess the effectiveness of the PBB
laboratory activity on student understanding of partially inelastic collisions. In particular,
it was intended to evaluate if it was helpful for students to recognize an inelastic collision
after they learned the deformation of a colliding body, which modeled internal potential
energy change. We hypothesized that the sandbag and the super ball version laboratory
activities had the same effect on student recognition of a partially inelastic collision.
Therefore, to avoid triggering students who took the sandbag version laboratory to recall
the deformation of the sandbag, the test problem did not explicitly indicate that either
pendulum A or pendulum B became deformed after the collision, nor did the problem
pictorial representation provide any visual aid about the deformation. When analyzing
student solutions on this problem, we counted the correctness of the solution. We also
considered carefully 1) if the solution included the collision as a separate part or a sub-
problem and 2) how the collision part was solved.

231
Figure 5.5: The problem appeared on the final examination for one section of the 131 class in the spring quarter of 1999. In this section, half of the students took the Pendulum-Box Bash laboratory using a sandbag as the pendulum bob and the other half took the same laboratory but using a super ball as the pendulum bob.
A pendulum bob A of mass 2m is released from rest from a height H so that it is initially horizontal. Bob A swings down and at the bottom, it collides with another stationary bob B of mass 3m. After the collision, bob A stops, and bob B swings up. What is the maximum height bob B swings up after the collision? Show all of your work and reasoning for credit.
A
B H
h A B

232
Half of the students from this Physics 131 section took the PBB lab activity using
a sandbag as the pendulum bob, and the other half undertook the same activity but using a
super ball as the pendulum bob. This was the only different learning experience of these
two groups of students.
5.3.2.1 Student Performance
Student performance on the problem shown in Figure 5.5 is reported in Table 5.8.
Of 135 students, seventy percent divided the problem into small parts and included the
collision as a sub-problem. Fifty three percent correctly applied the conservation of
momentum principle for solving the collision part. Among this half of students, it is
difficult to know why they chose to apply the conservation of momentum to solve the
collision part. As discussed in Section 5.3.1, it appeared that many students did not
develop a deep understanding of why the momentum was conserved during the collision,
even after they learned the PBB laboratory activity. To evaluate whether or not the use of
the deformation of a sandbag, which modeled the internal potential energy produced, had
any impact on student understanding of the energy transformation during the inelastic
collision, we carefully analyzed the problem solutions in which students incorrectly
applied the conservation of energy for the problem as a whole and incorrectly applied the
conservation of kinetic energy for the collision part. In addition, grouped by the sandbag
and the super ball laboratory and by student final class letter grades, a comparison was
made between those final exam solutions and the matched pretest solutions.
As summarized in Table 5.9, among 27 students who received either A or B for
their final class letter grades and also took the sandbag version laboratory, fifteen percent
incorrectly applied the conservation of energy to the final exam problem as a whole or

233
Physics 131 class in the spring quarter of 1999
N = 135 calculus-based students
24% Applied conservation of energy for the problem as a whole
6% Unclear or blank
53% (Correct)
Conservation of momentum
2% (Incorrect)
Conservation of momentum
6% (Incorrect)
Conservation of kinetic energy
7% (incorrect)
“Conservation of velocity”
70% Divided the problem into small parts and included the collision part
2% (Incorrect)
Velocity equations derived from the conservation of momentum and the conservation of kinetic energy for an elastic collision
Table 5.8: Student overall performance on the final examination problem shown in Figure 5.4.

234
Class grades Pretest question (a) Final exam problem
A & B students
% of students who incorrectly answered that the initial kinetic energy of the bob was equal to the kinetic energy of the box after the collision
% of students who incorrectly applied the conservation of energy to the problem as a whole or incorrectly applied the conservation of kinetic energy to the collision part
Sandbag (N = 27)
48% 15%
Super ball (N = 25)
40% 8%
Table 5.9: Proportion of students who incorrectly answered for pretest question (a) that the initial kinetic energy of the bob was equal to the kinetic energy of the box after the collision and percentage of students who incorrectly applied the conservation of energy to the problem as a whole or incorrectly applied the conservation of kinetic energy to the collision part. Those students received either A or B for their final class letter grades and were grouped by the sandbag and the super ball laboratory.
Class grades Pretest question (a) Final exam problem
C, D & E students
% of students who incorrectly answered that the initial kinetic energy of the bob was equal to the kinetic energy of the box after the collision
% of students who incorrectly applied the conservation of energy to the problem as a whole or incorrectly applied the conservation of kinetic energy to the collision part
Sandbag (N =40)
45% 30%
Super ball (N = 43)
30% 49%
Table 5.10: Proportion of students who incorrectly answered for pretest question (a) that the initial kinetic energy of the bob was equal to the kinetic energy of the box after the collision and percentage of students who incorrectly applied the conservation of energy to the problem as a whole or incorrectly applied the conservation of kinetic energy to the collision part. Those students received C, D or E for their final class letter grades and were grouped by the sandbag and the super ball laboratory.
235
incorrectly applied the conservation of kinetic energy to the collision part. But before
being exposed to the PBB sandbag laboratory, forty-eight percent incorrectly answered in
the pretest question (a) that the initial kinetic energy of the bob equaled the kinetic energy
of the box after the collision. Among 25 students who also received either A or B for
their final class letter grades but took the super ball version laboratory, eight percent
incorrectly applied the conservation of energy to the final exam problem as a whole or
incorrectly applied the conservation of kinetic energy to the collision part. But before
being exposed to the PBB super ball laboratory, forty percent incorrectly answered, for
the pretest question (a), that the initial kinetic energy of the bob was equal to the kinetic
energy of the box after the collision.
Table 5.10 showed that among 40 students who received C, D or E for their final
class letter grades and took the sandbag version laboratory, thirty percent incorrectly
applied the conservation of energy to the final exam problem as a whole or incorrectly
applied the conservation of kinetic energy to the collision part. But before being exposed
to the PBB sandbag laboratory, forty-five percent incorrectly answered in the pretest
question (a) that the initial kinetic energy of the bob equaled the kinetic energy of the box
after the collision. Among 43 students who also received C, D or E for their final class
letter grades but took the super ball version laboratory, forty-nine percent incorrectly
applied the conservation of energy to the final exam problem as a whole or incorrectly
applied the conservation of kinetic energy to the collision part. But before being exposed
to the PBB super ball laboratory, thirty percent incorrectly answered, for the pretest
question (a), that the initial kinetic energy of the bob was equal to the kinetic energy of
the box after the collision.

236
5.3.2.2 Discussion of Final Exam Results
It appeared that the PBB laboratory, when using either a sandbag or a super ball
as the pendulum bob, helped many above-average students overcome the difficulty of
incorrectly applying the conservation of kinetic energy for the partially inelastic collision.
But for average or below-average students, it appeared that the PBB laboratory using a
sandbag as the pendulum helped some of them overcome the difficulty. The PBB
laboratory using a super ball as the pendulum made some of them confused and even
caused some to incorrectly apply the conservation of energy principle to the final
examination problem as a whole or incorrectly applied the conservation of kinetic energy
to the collision part of the problem.
It was not surprising to find that there existed no significant difference in the use
of either the sandbag laboratory or the super ball laboratory to help the above-average
students address the difficulty. Top students seem to learn successfully no matter how
they were taught. For instance, a study [12] showed that top 25% of the students could
became Newtonian thinkers even after traditional instruction. But it was more difficult to
help a substantial fraction of the non-top students to master the physics knowledge that
was taught. There was a gap between what those students learned and what was taught
[6].
But it appeared that the deformation of a sandbag helped the average and under-
average students from the sandbag laboratory visualize the internal (potential) energy
produced during the partially inelastic collision. This visual aid could be effective for
them to recognized that the kinetic energy was not conserved during the collision and to
develop a mental image of “to what the kinetic energy was lost” On the other hand, the
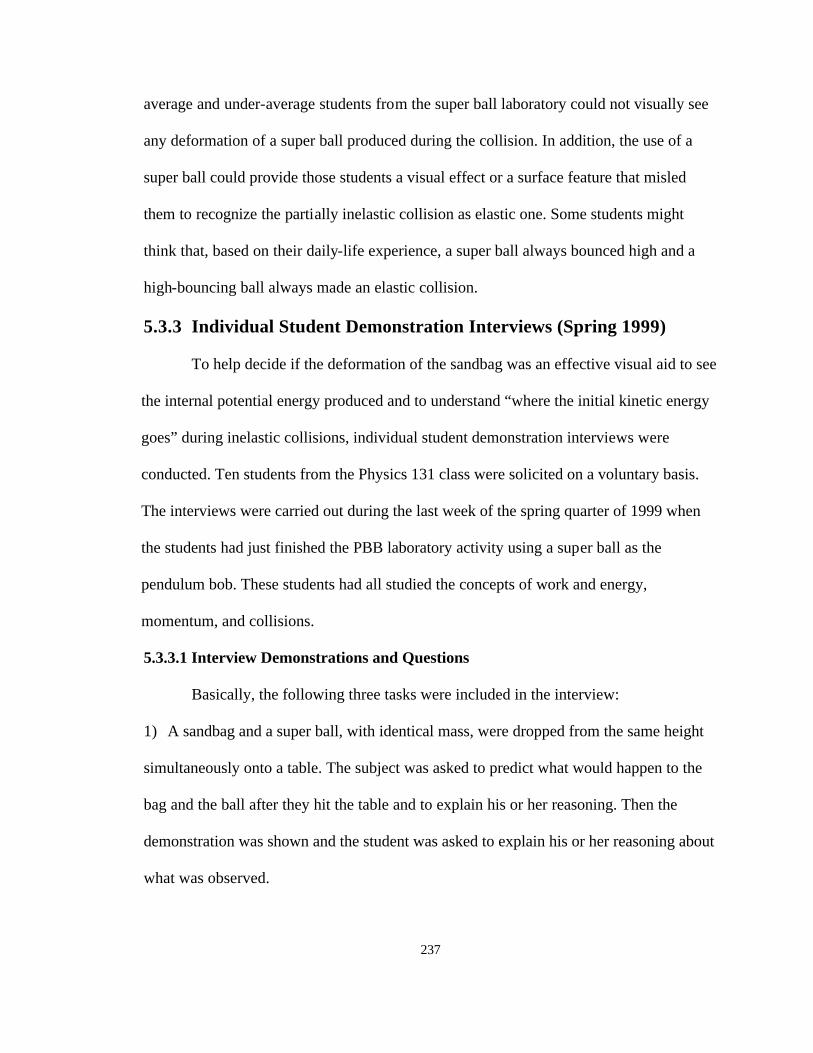
237
average and under-average students from the super ball laboratory could not visually see
any deformation of a super ball produced during the collision. In addition, the use of a
super ball could provide those students a visual effect or a surface feature that misled
them to recognize the partially inelastic collision as elastic one. Some students might
think that, based on their daily-life experience, a super ball always bounced high and a
high-bouncing ball always made an elastic collision.
5.3.3 Individual Student Demonstration Interviews (Spring 1999)
To help decide if the deformation of the sandbag was an effective visual aid to see
the internal potential energy produced and to understand “where the initial kinetic energy
goes” during inelastic collisions, individual student demonstration interviews were
conducted. Ten students from the Physics 131 class were solicited on a voluntary basis.
The interviews were carried out during the last week of the spring quarter of 1999 when
the students had just finished the PBB laboratory activity using a super ball as the
pendulum bob. These students had all studied the concepts of work and energy,
momentum, and collisions.
5.3.3.1 Interview Demonstrations and Questions
Basically, the following three tasks were included in the interview:
1) A sandbag and a super ball, with identical mass, were dropped from the same height
simultaneously onto a table. The subject was asked to predict what would happen to the
bag and the ball after they hit the table and to explain his or her reasoning. Then the
demonstration was shown and the student was asked to explain his or her reasoning about
what was observed.

238
2) After this, the interviewer showed the student a box and a super ball, which were used
during the PBB laboratory. The interviewer used the box and the super ball to show the
student the PBB experiment problem and to help him or her recall the PBB laboratory.
Then the student was asked to answer two questions: 1) “in the Pendulum-Box Bash
laboratory, was the kinetic energy of the super ball right before the collision greater than,
equal to, or less than the kinetic energy of the box right after the collision? Please explain
your reasoning;” 2) “in this Pendulum-Box Bash laboratory, was the magnitude of the
momentum of the super ball right before the collision greater than, equal to, or less than
the magnitude of momentum of the box right after the collision? Please explain your
reasoning.”
3) Last, the interviewer showed the subject a sandbag and a box. The student was
informed that the problem was repeated only with the sandbag as pendulum bob. The
student was asked to answer two questions on the basis of their predictions: 1) “in this
situation, would the kinetic energy of the sandbag right before the collision be greater
than, equal to, or less than the kinetic energy of the box right after the collision? Explain
your reasoning;” 2) “in the same situation, would the magnitude of the momentum of the
sandbag right before the collision be greater than, equal to, or less than the magnitude of
the momentum of the box right after the collision? Please explain your reasoning.”
Note that the students were asked to answer these two questions before the real
experiment was shown. But all the students had seen that the sandbag stayed on the table
and became deformed after it hit the table from the first demonstration. For research
purpose, it was interesting to investigate whether or not the students could imagine that a
deformation would happen to the sandbag during its collision with the box and whether

239
or not they could recognize that the initial kinetic energy would go to the energy to make
the sandbag deformed. If so, it would tell us that the students could develop a mental
image in which deformation of a sandbag led to internal energy production.
5.3.3.2 Student Responses and Reasoning
Demonstration of dropping sandbag and super ball: For this demonstration,
except for one student who was not asked to make a prediction, all nine students
predicted that the sandbag would stay on the table and the super ball would bounce back
after they were dropped and hit a table. Their explanations why the super ball would
bounce back could be summarized as the following four types: 1) The super ball was a
rubber one; 2) it had a solid, compact structure; 3) it made an elastic collision with the
table; and 4) its initial kinetic energy still stayed in the form of kinetic energy right after
the collision. However, student reasoning why the sandbag would not bounce back was
interesting. Three students explained that since the sandbag would get deformed or its
bottom would get flat after the collision, it stopped. Two students reasoned that since the
sandbag had a loose internal structure or less compact structure, it could not bounce back.
Another two students mentioned that the sandbag would stay on the table afterward since
its initial kinetic energy was transferred to moving around sand particles or molecules
inside and to reshaping them. For the rest of three students, one said that because the
sandbag made an inelastic collision with the table, its kinetic energy was not conserved.
So it did not have kinetic energy to bounce back after the collision. Another one indicated
that the kinetic energy of the sandbag before the collision was transferred to another type
of energy and not stayed in the form of kinetic energy after the collision. So it stayed on

240
the table afterward. The last student was not asked to make a prediction about the first
demonstration task.
After the demonstration was actually shown, that is, after the students actually
saw that the sandbag stayed on the table and its bottom flattened after hitting the table,
their responses to a question “where the kinetic energy of the sandbag goes” were very
interesting. As summarized briefly in Table 5.11, all the students realized that the initial
kinetic energy of the sandbag could be converted to the energy associated with the
deformation of the bag or a change of its shape. But it was apparent that they did not
know what term in physics should be used to describe this type of energy. One student
explained:
Student: “It [sandbag] stayed on the table afterward. So it had no kinetic energy since it’s not moving. It had no potential energy either since it stayed on the ground [table]. Of course, it had no spring-type energy because of no spring here. But the [kinetic] energy had to go somewhere. It may go to, U∆ , called internal thermal energy, because it’s [sandbag] flattened out.”
Task of the collision between a super ball and a box: It was also very
interesting to look at student responses to the question asking for a comparison of the
kinetic energy of the super ball right before the collision with that of the box right after
the collision. Of ten students, three explained that the kinetic energy of the super ball
before the collision was equal to the kinetic energy of the box after the collision. Here
was a typical response by one of these four students:
Student: “Kinetic energy is conserved, since the super ball from here has potential energy. It goes down here and has kinetic energy. Afterwards, it stops, the kinetic energy has to go somewhere—go to move the box. If it bounced back, the kinetic energy would have gone to the super ball there.” One student first answered that the kinetic energy of the super ball should be the
same as that of the box, since no external force exerted on the super ball and also it

241
Individual student demonstration interview, Spring 1999 Calculus-based students, N = 10
Student explanations about “where the kinetic energy of the sandbag goes” Student 1: The kinetic energy of the sandbag goes to deformation. Sand particles inside move from the bottom to the top, and there is friction against each other. Student 2: The kinetic energy of the sandbag goes to sound, heat, and to a change of the shape. Student 3: The kinetic energy of the sandbag goes to deforming the bag. Student 4: The kinetic energy of the sandbag is transferred to the force to change its shape. It’s called changing shape energy, maybe. I don’t know the term. Student 5: The energy of the sandbag goes into the sand. You see the bag is smashed in, deformed. So the energy goes to that internally. And maybe some goes into the table too. Student 6: The kinetic energy of the sandbag is transferred to a type of potential energy to make the bag flattened out and stretched out. Student 7: I don’t know where the kinetic energy of the sandbag goes. But the sandbag’s deformed, so it just stopped. Student 8: It (sandbag) stayed on the table afterward. The energy had to go somewhere. It may go to, U∆ , called internal thermal energy, because it’s flattened out. Student 9: The energy of the sandbag goes to change its shape. It is transferred to moving molecules inside to spread out or to reshape them. Student 10: The energy of the sandbag is transferred to another type of energy afterward. Its shape is changed, so the energy cannot stay in kinetic energy.
Table 5.11: Student explanations about “where the kinetic energy of the sandbag goes” during the collision between a sandbag and a table.

242
stopped after the collision. Then he added that some kinetic energy of the super ball may
be transferred to internal energy, sound or compression. So his conclusion was that he
was not sure whether or not the kinetic energy of the super ball should be equal to the
kinetic energy of the box after the collision.
Another student was also not sure whether or not the kinetic energy of the super
ball before the collision should be equal to or greater than the kinetic energy of the box
after the collision. But she believed that the kinetic energy of the box afterward should
not be greater than the initial kinetic energy of the super ball since the energy could not
be gained from nowhere.
Among the last five students, three answered that the kinetic energy of the super
ball before the collision could be slightly greater than the kinetic energy of the box since
a tiny bit of energy could be lost to friction, sound, or heat. But they believed that the
kinetic energy of the super ball should be close to that of the box after the collision. Only
two students said that the kinetic energy of the super ball before was greater than that of
the box after. One of them explained that because some initial kinetic energy could be
transferred to compress or stretch the ball and the cardboard box. But the other one gave
the following explanation:
Student: “The kinetic energy of the ball would be greater than the kinetic energy of the box after because it’s not a completely elastic collision. This is what I remembered from my lab (Pendulum-Box Bash lab using a super ball as the pendulum bob). First, I did think the kinetic energy will be equal because I just figured it’s an elastic. From the lab we found that it wasn’t. Some energy was lost to the sound, maybe. And…I don’t know.”
The result of the student responses is summarized in Table 5.12.
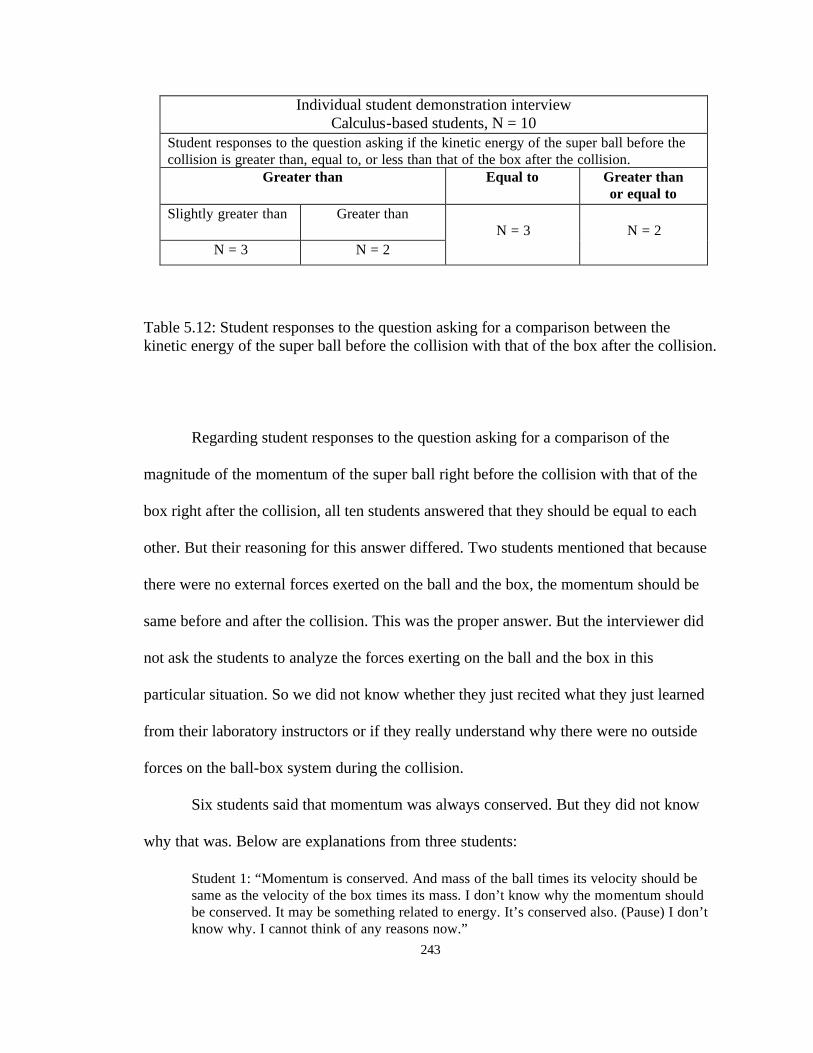
243
Individual student demonstration interview Calculus-based students, N = 10
Student responses to the question asking if the kinetic energy of the super ball before the collision is greater than, equal to, or less than that of the box after the collision.
Greater than Equal to Greater than or equal to
Slightly greater than Greater than
N = 3 N = 2
N = 3
N = 2
Table 5.12: Student responses to the question asking for a comparison between the kinetic energy of the super ball before the collision with that of the box after the collision.
Regarding student responses to the question asking for a comparison of the
magnitude of the momentum of the super ball right before the collision with that of the
box right after the collision, all ten students answered that they should be equal to each
other. But their reasoning for this answer differed. Two students mentioned that because
there were no external forces exerted on the ball and the box, the momentum should be
same before and after the collision. This was the proper answer. But the interviewer did
not ask the students to analyze the forces exerting on the ball and the box in this
particular situation. So we did not know whether they just recited what they just learned
from their laboratory instructors or if they really understand why there were no outside
forces on the ball-box system during the collision.
Six students said that momentum was always conserved. But they did not know
why that was. Below are explanations from three students:
Student 1: “Momentum is conserved. And mass of the ball times its velocity should be same as the velocity of the box times its mass. I don’t know why the momentum should be conserved. It may be something related to energy. It’s conserved also. (Pause) I don’t know why. I cannot think of any reasons now.”

244
Student 2: “Momentum should be equal. The teacher told us that momentum is always conserved. I never understand why or why not.” Student 3: “ Momentum should be equal, because momentum is always conserved no matter in elastic or inelastic collisions...This a an inelastic collision because a little bit of energy is lost. But momentum is conserved since it is always conserved.”
One student answered that the smaller mass of the ball times the bigger velocity
equaled to the bigger mass of the box times the smaller velocity of the box. Last, one
student said that the momentum was conserved since the kinetic energy was conserved
during the collision between the super ball and the box. She further explained that if the
kinetic energy was not conserved, the momentum was not conserved either.
Task of the collision between a sand ball and a box: It was even more
interesting to analyze students’ responses to the question asking for a comparison
between the kinetic energy of the sandbag just before the collision with that of the box
right after the collision. All ten students predicted that the kinetic energy of the sandbag
before the collision would be greater than the kinetic energy of the box just after the
collision. They all mentioned that this was due to the deformation of the sandbag. Again,
they were unable to name appropriately the type of energy associated with a change of
sandbag’s shape. Here are two examples of the students’ reasoning:
Student 1: “Sandbag would flatten out. The kinetic energy goes to that. I don’t know the physics term about this type of energy, but I can physically see this.” Student 2: “Kinetic energy of the bag does not all transfer to the box. Because the box’s heavy enough, the sandbag would deform again, and the energy will give into the bag. It (energy) loses when this (sandbag) starts deforming. Some work has been done during the collision. This work is to smash in the bag and to move the particles.” For the question asking for a comparison between the magnitude of the
momentum of the sandbag just before the collision with that of the box just after the
collision, student responses and reasoning were very similar to their answers to the
245
question asking for a comparison between the magnitude of the momentum of the super
ball just before the collision with that of the box just after the collision. Still two students
used a “no outside forces” idea to reason that the momentum should be conserved during
the collision between the sandbag and the box. Six students said that momentum was
always conserved. Again they did not know why that should be. One student still
answered that the smaller mass of the bag times the bigger velocity equaled the bigger
mass of the box times the smaller velocity of the box. Last, one student said that the
momentum was not conserved since the kinetic energy was not conserved during the
collision between the sandbag and the box. Below was the last student’s explanation:
Student: “Momentum would not be equal, since some energy would be lost to change the shape of the bag. For the super ball case, since a little bit of energy is lost to friction, kinetic energy after is just slightly less. So momentum is conserved. But for this situation [sandbag case], since the energy would be lost to change its shape, it is different. So I guess the momentum would not be equal.”
5.3.3.3 Discussion of Interview Results
Of the ten students interviewed, six received A and B final grades for the course
while the other four received C, D, and E. Thus, to some extent the data discussed above
reflected some detailed ideas of the understandings of different ability-level students.
First, it was apparent that the super ball version laboratory was not effective to
help students visualize “where the kinetic energy goes” during the partially inelastic
collision. There could be several reasons for this. During the PBB laboratory using a
super ball, students hardly saw any deformation of the ball or the cardboard box during
the collision. They were just told by their laboratory instructors that some initial kinetic
energy was transferred to the internal potential energy associated with a change of the
ball’s shape and the box’s shape. The use of a super ball could mislead some students to

246
reason that its collision with the box was elastic. In the light of students’ explanations
why the super ball would bounce back, apparently, some students believed that the super
ball was a rubber one and it made elastic collisions. Because the ball was moving and the
box at rest before the collision and the reverse after, students might recognize this
collision as elastic. Then they memorized that the kinetic energy was conserved during an
elastic collision.
Second, it appeared that deformation of a sandbag helped students visualize “to
what the kinetic energy was lost”. Visualizing a change of the sandbag’s shape helped
students understood why the kinetic energy was not conserved during the partially
inelastic collision.
Third, students did not know what quantity or concept in physics to use to
describe energy associated with the deformation. This was not surprising since they never
learned it. During the interview, the students did not receive any instruction about the
concept of internal potential energy.
Fourth, it was apparent that most students had difficulties understanding why the
conservation of momentum could be apply to the inelastic collision. As a result, some
students thought that if, during the collision, the kinetic energy was conserved, the
momentum was conserved. Otherwise, both were not conserved.
5.3.4 Discussion of Evaluation results
Overall, based on the written test data from a large number of students and the
detailed interview results from a small number of students, the deformation of a sandbag
is found helpful in letting students visualize “where the kinetic energy goes”. Visualizing
this aided students in understanding the energy transformation and in recognizing a

247
collision as partially inelastic, but did not help address student understanding of why the
conservation of momentum could be applied to the collision.
5.4 Discussion and Summary
Collisions, as fundamental physical phenomena, occur every day from the
microscopic scale of subatomic particles to the astronomic scale of colliding stars. In an
introductory mechanics course at the university level, students learn the content of
collisions as an important application of the conservation of momentum and energy
principles (including the conservation of kinetic energy). Student difficulties applying
these conservation laws in problem solving are known to anyone who teaches the
introductory course. The studies reported in this chapter have not only identified some
student difficulties which are documented by other researchers, but also have found some
undocumented difficulties that introductory physics students have in understanding
inelastic collisions.
Introductory physics students after standard instruction lack a conceptual
understanding of “where the kinetic energy goes” or “to what the kinetic energy is lost”
during inelastic collisions. They are unable to link a change of a solid’s shape with a gain
of its internal potential energy at an atomic level.
Most students also do not develop a meaningful understanding of the fundamental
condition that is necessary in order for momentum to be conserved during a collision.
They believe that momentum is always conserved during collisions.
The visual aid of a deformation of a sandbag is first used to help students
physically see “where the kinetic energy goes” and to understand the energy
transformation during inelastic collisions. Assessment results have shown that

248
deformation of a collision object, which models internal potential energy change, helps
students (especially weak students) visualize and better understand energy transformation
during an inelastic collision and help them develop a mental image about the abstract
concept of internal (potential) energy.
But it is apparent that visualizing the internal energy does not naturally help
students address the difficulty understanding the conservation of momentum. Research-
based learning materials are needed to address this student difficulty.

249
ENDNOTES OF CHAPTER 5
1. Chabay, R. W., and Sherwood, B. A., Matter & Interactions (Preliminary Edition, John Wiley & Sons, New York, 1999), pp. 202-203.
2. Chabay, R. W., and Sherwood, B. A., Matter & Interactions (Preliminary Edition,
John Wiley & Sons, New York, 1999), pp. 272. 3. Van Demelen, D., The development of problem decomposition diagnostic, Ph.D.
dissertation, The Ohio State University, 2000. 4. Grimellini-Tomasini, N., Pecori-Balandi, B., Pacca, J. L. A., and Villani, A.,
“Understanding conservation laws in mechanics: Students’ conceptual change in learning about collisions,” Science Education 77, 169 (1993).
5. The regular calculus-based introductory physics classes at the OSU use the text—
Fundamentals of Physics (5th Ed.) by D. Halliday, R. Resnick, and J. Walker. For the problems at the end of Chapter 10—Collisions, many are either about elastic or completely inelastic collisions. In addition, the problem statements explicitly inform students the types of collisions involved in the problems. Students do not need to make decisions themselves about what types of collisions occur, and they could just find associated equations to use and plug into numbers.
6. McDermott, L. C., “Guest comments: How we teach and how student learn—A
mismatch?” Am. J. Phys. 61, 295-298 (1993). 7. A small amount of internal thermal energy and wave energy was produced during the
collision between the pendulum bob and the box as well. But a major amount of the initial kinetic energy of the bob could be converted to the internal potential energy of the bob-box system.
8. Van Heuvelen, A., “Experiment Problems for Mechanics,” Phys. Teach. 33, 176-180
(1995). 9. Van Heuvelen, Allen, L., and Mihas, P. “Experiment Problems for Electricity and
Magnetism,” Phys. Teach. 37, 482-485 (1999). 10. A set of these experiment problems are available on the OSU Physics Education
Research web site: http://www.physics.ohio-state.edu/~physedu/index2.html.

250
11. Some students’ explanations, for instance, “the kinetic energy of the fist was ‘lost’ to deformation of the boxing bag, heat, or sound,” were also included.
12. Van Heuvelen, A., Bulletin of the American Physical Society, 36, 1359 (April, 1991).
251
CHAPTER 6
CONCLUSION
In the preceding chapters, studies concerning the use of the multiple
representations and visualizations in student learning of physics have been illustrated
with specific examples from work and energy. As a body of formal, complex knowledge,
physics is a difficult subject for many introductory students. To help them develop a
meaningful understanding and acquire expertise in problem solving, it is very important
to explore how to develop and use pedagogical representations and visualizations in
student learning.
As part of ongoing research by the Physics Education Research Group at The
Ohio State University (OSU), this dissertation project has been conducted to probe
student conceptual understanding of the abstract concept of internal energy and their
problem solving in the context of work and energy and to explore the use of
visualizations and multiple representations in enhancing student understanding and in
developing expert-like problem-solving skills. The investigations took place at OSU
primarily with engineering students in calculus-based introductory physics classes and
used the common methods of physics education research.
Individual student demonstration and think-aloud interviews were conducted to
gain an in-depth understanding of student reasoning and problem solving. We found that

252
the individual student demonstration interviews, in particular, were useful in exploring
student conceptual understanding of an individual topic. During the interview,
demonstrations using real equipment serve the basis of communication between the
researcher and the students. Students’ reasoning could be probed thoroughly because the
researcher was able to ask the students follow-up questions and to let them provide as
detailed reasoning as possible. Individual student think-aloud interviews were suitable for
probing student problem solving. In this setting, students verbalized aloud their thinking
while solving the problem. During the interview, to avoid interrupting student thinking
during the middle of the task, communication between the researcher and the students
was minimized. But it was found that after the students completes the task, it was useful
to ask them to report their thinking sequence experienced while solving the problem. This
could serve three purposes. First, retrospective data could provide the researcher useful
information on understanding students’ think-aloud data. Second, the students often
reported important, major thinking steps while being asked to recall what they
remembered during the problem solving. This was very helpful in getting insight into
higher-level problem solving cues that the student used. Third, the researcher had an
opportunity to ask follow-up questions if needed. We also found that it was important to
give the students warming-up problems, which could help them understand what they
were expected to do during the “think-aloud” interviews and to get comfortable with
verbalizing their thinking at the same time.
These interviews are useful tools to probe in-depth thinking from a small number
of students. We also used written tests to access to a large number of students’ ideas and
to assess their performance in classroom settings. Detailed interview data help develop

253
written test questions and help understand students’ reasoning that appeared in written
tests, which consist of students’ responses or solutions and often with less detailed
information about the students’ thinking. But written tests could be administered to a
large number of students in naturalistic classroom settings, and test data could be easily
analyzed. We used both research techniques in gaining an understanding of students’
reasoning and problem solving skills.
The model used in the studies consists of three components: the initial state of
student knowing, the desired state of student knowing, and the learning system
transformer that can help fulfill the transformation from the former to the latter.
To achieve insight into the student initial state ( Ψ0 ) of understanding, systematic
investigations, including testing and interviewing, were conducted either before or after
students experienced a particular topic in standard instruction. Understanding student’s
initial states of knowing, in particular, students’ difficulties, was essential for developing
the effective learning system transformer ( ε̂ ). The desired state ( Ψ ) of student learning
was carefully constructed so the learning system transformer was able to help students
transform from the initial state to the desired state. After students had been exposed to the
learning system, student understanding, as a final state, was investigated. The
effectiveness of the learning system was assessed by determining how students’ final
state of understanding compared to the desired state. On the basis of the assessment
results, combined with results of the research into the student initial state, the learning
system transformer was modified and revised. Then the new learning system transformer
interacted with students and a new cycle of this model began.

254
The concepts of work and energy consist of a fundamental and important part of
introductory physics. Empirical data in this dissertation have shown that beginning
introductory physics students solve work-energy problems using a numerical-
representation-centered technique: represent related energy concepts in numbers first,
assemble these numbers together based on the conservation of energy principle, and
calculate the values for the unknown variables. We have found that, using this naïve
approach, it is difficult for students to develop a conceptual understanding of the work-
energy processes.
A multiple-representation approach developed by Alan Van Heuvelen views a
work-energy problem as a physical process, which can be represented in verbal, pictorial,
work-energy bar chart, and mathematical representations. This strategy attempts to help
students develop expertise in problem solving—the use of physical representations to
understand and reason about the problem before any mathematical equations are applied.
Extensive assessment activities were conducted to evaluate the effectiveness of this
technique for student work-energy problem solutions. Empirical evidence has shown that
students do apply this strategy in their own problem solving. In particular, students use
the work-energy bar charts 1) to understand conceptually and reason qualitatively about
work-energy problems first, 2) to help set up the generalized work-energy equation
correctly, and 3) to make inferences and evaluate their solutions.
Apparently, the work-energy bar charts, as a physical representation to represent
work-energy processes, play a central role in student problem solving. Its function is like
a bridge, leading students to move easily with smaller steps from an abstract verbal
representation or a pictorial representation with surface features to a scientific,

255
mathematical representation. By connecting pictorial and mathematical representations
together, the work-energy bar charts also help students produce mental images for the
different energy quantities and to make mathematical symbols meaningful.
As part of the research effort to develop and assess this multiple-representation
strategy, student understanding of internal energy has been investigated. This is a very
abstract and difficult concept for introductory students. Without a meaningful
understanding of this concept, students use either surface features or common-sense ideas
to understand the energy transformation during inelastic collisions.
We have found that introductory physics students have difficulty in
conceptualizing “where the kinetic energy goes” during inelastic collisions. They
consider “heat” as “internal thermal energy,” but they do not understand either of them.
They are unable to link the change in a solid’s shape with a gain of its internal potential
energy at an atomic level. In a word, students lack meaningful mental pictures of the
concept of internal energy.
The use of visualizations is introduced to enhance student understanding of this
abstract concept. The guided-inquiry learning activity was developed to help students
visualize “invisible” internal thermal energy produced during inelastic collisions and the
hands-on interactive laboratory activity was developed to help students physically see
“the initial kinetic energy goes to internal potential energy” during a partially inelastic
collision.
The guided-inquiry learning activity consists of two parts: student worksheets and
demonstrations using a pair of rubber balls (happy and unhappy balls) and a pair of model
carts. The student worksheets were developed under a guide for inquiry learning—elicit,

256
confront, resolve—used by the Physics Education Group at the University of Washington.
The model carts were modified and constructed on the basis of Ganiel’s work and
empirical data collected in this dissertation. Assessment activities, including written tests
and individual student demonstration interviews, have shown that this learning activity is
helpful in students visualizing “internal thermal energy produced on a microscopic scale”
during inelastic collisions and in developing a mental picture of this concept. It has been
discovered that students’ visualization of this concept helps them conceptually understand
the conservation of energy during inelastic collisions.
In the hands-on interactive laboratory activity, the visual aid of a deformation of a
sandbag is used to help students physically see “where the kinetic energy goes” and to
understand the energy transformation during a partially inelastic collision. Assessment
results have shown that the deformation of the colliding object, which models internal
potential energy change, helps students (especially weak students) visualize and better
understand the energy transformation during a partially inelastic collision and helps them
develop a mental image about the abstract concept of internal (potential) energy.
In addition to curriculum development, classroom implementation is also an
important component of the systematic learning system transformer. “Learning by
passively listening” is not effective for most students in achieving a meaningful
understanding in physics classes. Active learning is an essential base of the learning
system. Also, students’ difficulties must be explicitly addressed. Moreover, students learn
to learn better if they understand the reasons for various pedagogical strategies.
In summary, this dissertation has demonstrated that it is possible to use multiple
representations and visualizations to help students develop a meaningful understanding of

257
abstract concepts and acquire expertise in problem solving. To understand naïve student
problem solving from a perspective of the multiple representations, two types of
mathematical representations—algebraic and numerical representations—are
distinguished for the first time in this dissertation. It has been discovered that naïve
students use a numerical-representation-centered approach to solve work-energy
problems. Empirical evidence has shown that the systematic strategy of representing
work-energy processes in the multiple representations can help students abandon this
naïve problem solving method and develop expertise in problem solving. This
dissertation also presents a way to use visual aids in helping students gain a meaningful
understanding of abstract concepts and in developing mental pictures. The visual aid of a
deformation of a sandbag is first used to help students physically see “where the kinetic
energy goes” and to understand the energy transformation during partially inelastic
collisions. A pair of model carts, constructed and modified based on previous research
and investigations done in this dissertation, is used to help students visualize the concept
of internal thermal energy on a molecular scale.

258
APPENDIX A
WARM-UP QUESTIONS AND A WORK-ENERGY EQUATION SHEET USED FOR THINK-ALOUD INDIVIDUAL STUDENT INTERVIEWS (AUTUMN 1999)
1. Warm-up questions
Problem 1: Estimate how far this room is above the ground in meters. Problem 2: Calculate 1234 time 56. Problem 3: If you were a skydiver and jumped out of a plane at 4000 meters, how long would it take you to fall 1000 meters before you opened your parachute.

259
2. A work-energy equation sheet
Kinetic Energy
K = ½ mv2
m = object mass v = object speed
Gravitational Potential Energy
(near the surface of Earth)
Ug = mgy
m = object mass g = 9.8 m/s2 y = the height of the object above or under the origin of the vertical direction
Elastic Potential Energy
Us = ½ kx2
k = force constant x = the compressed or stretched distances
Work
W = Fd F = force exerted on the object d = distance of the object moving in the force direction
Conservation of energy
Ei + W = Ef
Initial energy + Work = Final energy

260
APPENDIX B
THREE THINK-ALOUD INDIVIDUAL STUDENT PRE-INTERVIEW PROBLEMS (WITH WORK-ENERGY BAR CHARTS, AUTUMN 1999)

261
0
Question 1.0: Complete the following work-energy bar chart.
Question 1: What is the woman skier’s speed at B?
Question 2: A male skier of mass 100 kg descends along the same hill indicated in Fig. 1. He starts from rest at point A as well, and jumps off at the bottom point B. Would his speed at point B be greater than, equal to, or less than the woman skier’s speed at point B? Explain your reasoning.
Initial Energy +Work = Final Energy
Ko + Ugo + Uso + W = K + Ug + Us + ∆Uint(friction)
0
0
A
Earth B
Fig. 1
A woman skier of mass 60 kg descends along the hill indicated in Fig. 1. She starts from rest at the point A at a height 40.0 m above the bottom point B of the hill, and jumps off at the point B. (The effects of friction are neglected.)
Problem Statement
Question 3: If the woman skier jumped off at point C that is above point B (see Fig. 2 below), would her speed at point C be greater than, equal to, or less than her speed at point B? Explain your reasoning.
0 C
A
Earth B
Fig. 2
Problem 1

262
0
Problem 2
30 m/s
Earth
Fig. 1
Initial Energy +Work = Final Energy
Ko + Ugo + Uso + W = K + Ug + Us + ∆Uint(friction)
0
Question 3: If a lighter ball is thrown up vertically with initial speed of 30 m/s. Would the maximum vertical height that this lighter ball attains be greater than, equal to, or less than that of the ball of 0.05 kg? Explain your reasoning.
Question 1: What is the maximum vertical height that the ball achieves?
Question 2: If the initial speed is doubled, how does the maximum vertical height change? Explain your reasoning.
Problem Statement A golf ball of mass 0.05 kg is thrown up vertically (see Fig. 1 below). The initial speed of the ball is 30 m/s. (The effects of friction from the air are neglected.)

263
0
Ko + Ugo + Uso + W = K + Ug + Us + ∆Uint(friction)
Initial Energy +Work = Final Energy
0
Problem 3
Problem Statement
Question 3: If the spring is initially compressed more, how would the speed of the toy car just before landing on the floor change?
Fig. 1
0
1.0
0.8
Question 1: What is the speed of the toy car just before it hits the floor?
Question 2: If the height of the ramp is lowered, how would the speed of the toy car just before landing on the floor change? Explain your reasoning.
A HotWheelTM toy car of mass 0.05 kg is launched by a spring to slide up along the smooth ramp which is 2.0 m long and 0.8 m high. The spring has its force constant of 100 N/m, and it is compressed by 0.2 m. The spring is initially held at rest. The ramp is fixed and 1.0 m above the floor (see Fig. 1). After the spring is released, the toy car moves up the ramp, jumps off, and eventually lands on the floor. (The effects of friction are neglected.)

264
APPENDIX C
THREE THINK-ALOUD INDIVIDUAL STUDENT PRE-INTERVIEW PROBLEMS (WITHOUT THE WORK-ENERGY BAR CHARTS, AUTUMN 1999)
Problem 1
0
A
Earth B
Fig. 1
A woman skier of mass 60 kg descends along the hill indicated in Fig. 1. She starts from rest at the point A at a height 40.0 m above the bottom point B of the hill, and jumps off at the point B. (The effects of friction are neglected.)
Problem Statement
Question 1: What is the woman skier’s speed at B?
Question 2: A male skier of mass 100 kg descends along the same hill indicated in Fig. 1. He starts from rest at point A as well, and jumps off at the bottom point B. Would his speed at point B be greater than, equal to, or less than the woman skier’s speed at point B? Explain your reasoning.
Question 3: If the woman skier jumped off at point C that is above point B (see Fig. 2 below), would her speed at point C be greater than, equal to, or less than her speed at point B? Explain your reasoning.
0 C
A
Earth B
Fig. 2

265
Problem 2
30 m/s
Earth
Fig. 1
Question 3: If a lighter ball is thrown up vertically with initial speed of 30 m/s. Would the maximum vertical height that this lighter ball attains be greater than, equal to, or less than that of the ball of 0.05 kg? Explain your reasoning.
Question 1: What is the maximum vertical height that the ball achieves?
Question 2: If the initial speed is doubled, how does the maximum vertical height change? Explain your reasoning.
Problem Statement A golf ball of mass 0.05 kg is thrown up vertically (see Fig. 1 below). The initial speed of the ball is 30 m/s. (The effects of friction from the air are neglected.)

266
Problem 3
Problem Statement
Question 3: If the spring is initially compressed more, how would the speed of the toy car just before landing on the floor change?
Fig. 1
0
1.0
0.8
Question 1: What is the speed of the toy car just before it hits the floor?
Question 2: If the height of the ramp is lowered, how would the speed of the toy car just before landing on the floor change? Explain your reasoning.
A HotWheelTM toy car of mass 0.05 kg is launched by a spring to slide up along the smooth ramp which is 2.0 m long and 0.8 m high. The spring has its force constant of 100 N/m, and it is compressed by 0.2 m. The spring is initially held at rest. The ramp is fixed and 1.0 m above the floor (see Fig. 1). After the spring is released, the toy car moves up the ramp, jumps off, and eventually lands on the floor. (The effects of friction are neglected.)

267
APPENDIX D
DETAILED SOLUTIONS PRODUCED BY TWO STUDENTS FOR THE THINK-ALOUD INDIVIDUAL STUDENT PRE-INTERVIEW PROBLEMS
(WITH WORK-ENERGY BAR CHARTS, AUTUMN 1999)

268
Problem statement
Q2: Qualitative Question
Q3: Qualitative Question
Q1: Quantitative Question
Problem 1Problem statement and questions
Numerical Representation
Verbal Representation
Pictorial Representation
Representations that the studentused to answer each question
Pictorial Representation
Student detailed reasoning& performance
Read the statement, andlooked at the sketch.(Not make his own sketch)
Used work-energy formula in an equation sheet.Wrote down U = mgh, plugged in numbers, andcalculated U.Then wrote down K = 1/2mv^2 , plugged innumbers, and calculated v.
Q1.0: Qualitative Question Physical RepresentationUnderstood each term and the structureof the work-energy bar charts andcompleted the bar charts correctly.
Tried to recall and to usekinematics equations.
Asked by the interviewer to usethe concepts of work and energy
Looked at his numerical solution for the initialpotential energy, compared the woman's masswith the man's mass, and compared their initialpotential energy.
Found mass included in his numerical solution ofthe kinetic energy from question 1.Then used k=1/2mv^2, plugged in numbers,calculated man's & woman's speed, andconcluded that they were the same.
Used U = mgh, plugged in numbers, calculatedboth woman's and man's initial potential energy, andconcluded that man's kinetic energy at B wasgreater. So his speed was greater.(Incorrect answer.)
(Looked at the sketch given in the statement)Used kinematics ideas, broke v into x & ycomponents, reasoned that gravitational forcepulled down in y, decided y component of vat C less, and concluded that v at C was less
Numerical Representation
Numerical Representation
Found his own calculation error made inhis solution for question 1.
Numerical Representation

269
Problem statement
Q2: Qualitative Question
Q3: Qualitative Question
Q1: Quantitative Question
Problem 2Problem statement and
questions
NumericalRepresentation
Verbal Representation
PictorialRepresentation
Representations that thestudent
used to answer each question
Student detailedreasoning
& performance
Read the statement, and looked at thesketch(Not make his own sketch and not usethe work-energy bar chart)
Physical Representation
AlgebraicRepresentation
NumericalRepresentation
NumericalRepresentation
Used work-energy formula in worksheet.Wrote down K = 1/2mv^2, plugged in numbers,and calculated K (K = 22.5 J).Then wrote down 22.5 J = mgy , plugged innumbers, and calculated y.
Wrote down K = 1/2(0.05 kg)(60 m/s)^2, andcalculated out K (K = 90 J).Then wrote down 90 J = mgy , plugged innumbers, and calculated y.
"It is the best & easy way to calculate itmathematically."
(Given a number for lighter ball's mass = 0.02 kg) Wrote down K = 1/2mv^2 = 1/2(0.02 kg)(30)^2,and calculated K [K = 9 J].Then wrote down 9 J = mgy , plugged in numbers,and calculated y.
Then he had a long pause"Thinking about formula in my head, since I knowacceleration of gravity is the same on all objects .They could possibly have the same height. "
(He commented that "this is the concept learnedfrom school, but it is not something natural .)
(Internal) MathematicalRepresentation
"I guess what I am thinking qualitatively that Ithrow up a golf ball and baseball as height aspossible. I can throw the golf ball higher. Thelighter ball goes higher."
[After this, he realized that mass did not matter]He wrote down 1/2mv^2 = mgy, and cancelled outm."Mass does not matter. They all go the same height.
(Internal) PictorialRepresentation

270
Problem statement
Q2: Qualitative Question
Q3: Qualitative Question
Q1: Quantitative Question
Problem 3Problem statement and questions
Verbal Representation
Pictorial Representation
Representations that the studentused to answer each question
Student detailed reasoning& performance
Physical Representation
Algebraic Representation
Physical Representation
MathematicalRepresentation
Read the problem and used the given sketch tounderstand the problem (Not make his own sketch])
Read the given work-energy bar chart s andmatched bars with the concepts of energy in theinitial and final states .
Mathematical Representation
Numerical Representation
"I'm thinking what equations to be used." (He looked at the given equation sheet.)
Then looked at the sketch to try to understand what types of energy that car hadinitially. [He understood spring potential energy, but was confused withgravitational potential energy 1) if it should be zero since origin at initial position or2)if it should be NOT zero since it is ABOVE floor.]
Then found that in the given work-energy bar charts the final potential energy barwas negative. So he decided the potential energy must be zero initially.
Looked at the equation sheet, wrote down U = 1/2kx^2, and plugged in numbers.
Looked at given work-energy bar charts, and realized that the energy wasconserved.
Then wrote down E = 1/2mv^2 - mgy ,and plugged in numbers.
Pictorial Representation
Physical Representation
Physical Representation
Numerical Representation
Attempted to use his solution of question 1, but figured out he did notplug in the height of ramp in his solution.
Looked at the work-energy bar chart. "So it (height of ramp) does notmatter, but I doubt."
"But thinking qualitatively, v might be the same. Since I visualize if theramp height is lowered, its speed at top of ramp would be greater, andthe car can go farther horizontally, but slower in vertically. So they tradeoff. "
Used equations in his solution for question 1, reasoned that ,if elastic potential energy was increased, the speed of the carwas increased.
Looked and used the work-energy bar chart to check hisanswer.
(Internal) PictorialRepresentation
Physical Representation

271
Problem statement
Q2: Qualitative Question
Q3: Qualitative Question
Q1: Quantitative Question
Problem 1Problem statement and questions
Numerical Representation
Verbal Representation
Pictorial Representation
Representations that the studentused to answer each question
Pictorial Representation
Student detailed reasoning& performance
Read the statement, andlooked at the sketch(Not make his own sketch)
Wrote down Ug = 60(40)(10) = 24000 J.Then 24000 J = 1/2(60)v^2 , and calculated out v.
Q1.0: Qualitative Question
Physical Representation
Understood each term in the work-energy bar chart.
Calculated initial potential energy as: 60(10)40 = 24000 J.
"Each bar [unit] represents 6000J, so 4 bars forpotential energy. It's all converted to kineticenergy, and no friction, so energy is conserved. "
Looked at his numerical solution for the initialpotential energy.
"His initial potential energy is greater since itdepends on mass and his mass is greater. Sinceenergy is conserved, his final kinetic energy isgreater. So his speed is greater."
Numerical Representation
Numerical Representation
(Used the sketch given in the statement)
"Her initial potential same, 24000J. All turns to kineticenergy at B. Then she's back up a little bit, and thekinetic energy turns to potential energy. So her speedis less at C.

272
Problem statement
Q2: Qualitative Question
Q3: Qualitative Question
Q1: Quantitative Question
Problem 2Problem statement and questions
Numerical Representation
Verbal Representation
Pictorial Representation
Representations that the studentused to answer each question
Student detailed reasoning& performance
Read the statement, and looked atthe sketch(Not make his own sketch and notuse the work-energy bar charts)
Physical Representation
Numerical Representation
Numerical Representation
Looked at work-energy formula in the givenequation sheet.
Wrote down 1/2(0.05)(30)^2 = 22.5 J, (0.05)(10)(y) = 22.5 ,
and calculated out y
Wrote down K = 1/2(0.05 kg)(60 m/s)^2 = 90Then wrote down 90 = 0.05(10)(y), andcalculated y.
(Given a number for mass = 0.025 kg--half mass ofgolf ball)
Wrote down 1/2(0.025)(30)^2 = 11.25, 11.25 = (0.025)(10)(y),and calculated y.
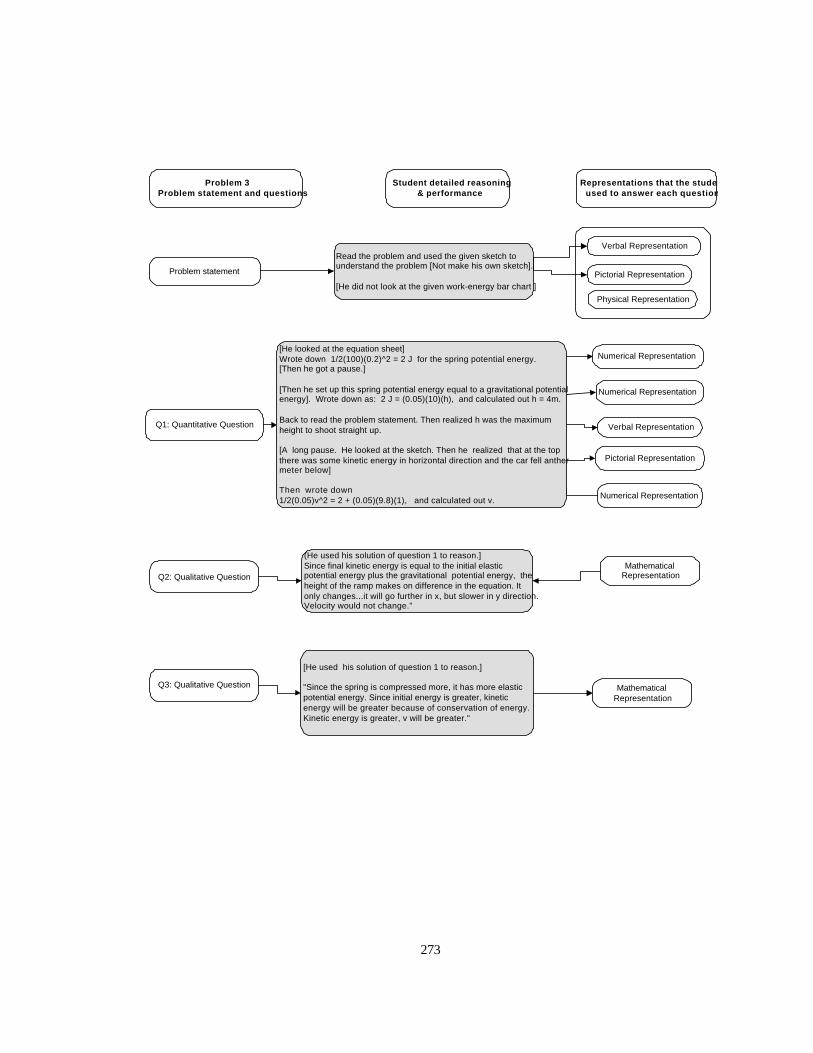
273
Problem statement
Q2: Qualitative Question
Q3: Qualitative Question
Q1: Quantitative Question
Problem 3Problem statement and questions
Verbal Representation
Pictorial Representation
Representations that the studentused to answer each question
Student detailed reasoning& performance
Physical Representation
MathematicalRepresentation
Read the problem and used the given sketch tounderstand the problem [Not make his own sketch].
[He did not look at the given work-energy bar chart ]
Numerical Representation
Numerical Representation
Verbal Representation
Pictorial Representation
Numerical Representation
[He looked at the equation sheet]Wrote down 1/2(100)(0.2)^2 = 2 J for the spring potential energy.[Then he got a pause.]
[Then he set up this spring potential energy equal to a gravitational potentialenergy]. Wrote down as: 2 J = (0.05)(10)(h), and calculated out h = 4m.
Back to read the problem statement. Then realized h was the maximumheight to shoot straight up.
[A long pause. He looked at the sketch. Then he realized that at the topthere was some kinetic energy in horizontal direction and the car fell anthermeter below]
Then wrote down1/2(0.05)v^2 = 2 + (0.05)(9.8)(1), and calculated out v.
(He used his solution of question 1 to reason.]Since final kinetic energy is equal to the initial elasticpotential energy plus the gravitational potential energy, theheight of the ramp makes on difference in the equation. Itonly changes...it will go further in x, but slower in y direction.Velocity would not change."
[He used his solution of question 1 to reason.]
"Since the spring is compressed more, it has more elasticpotential energy. Since initial energy is greater, kineticenergy will be greater because of conservation of energy.Kinetic energy is greater, v will be greater."
MathematicalRepresentation
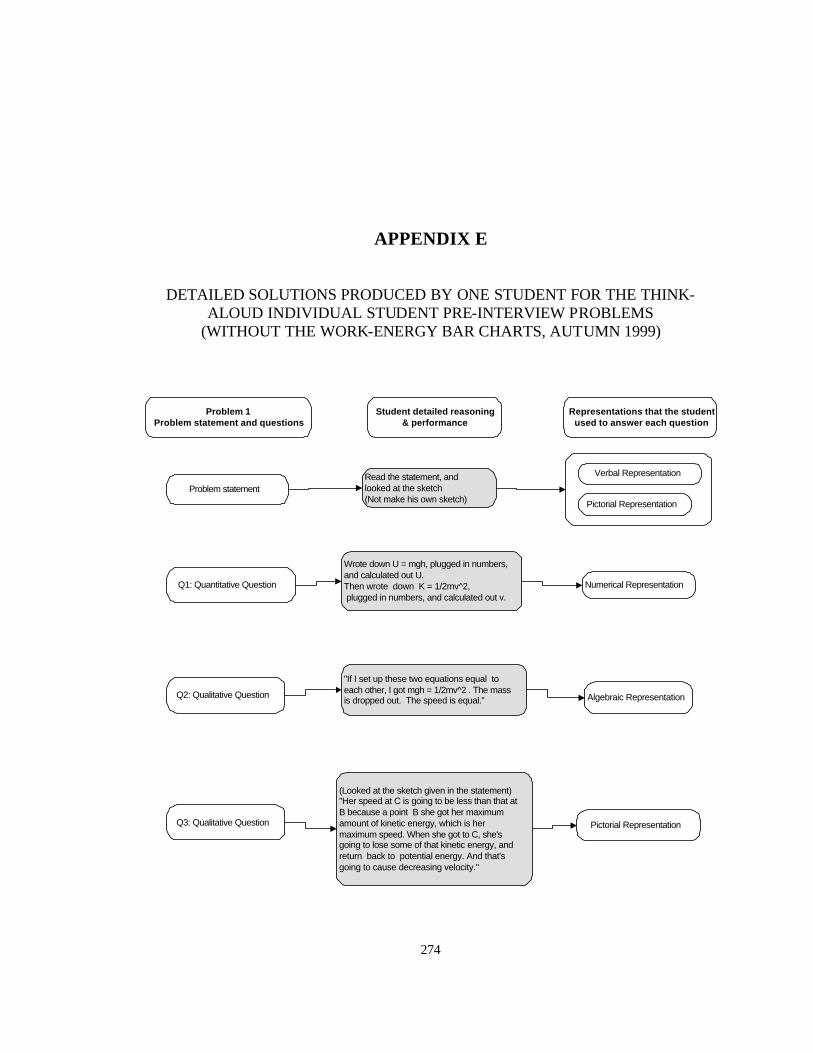
274
APPENDIX E
DETAILED SOLUTIONS PRODUCED BY ONE STUDENT FOR THE THINK-ALOUD INDIVIDUAL STUDENT PRE-INTERVIEW PROBLEMS
(WITHOUT THE WORK-ENERGY BAR CHARTS, AUTUMN 1999)
Problem statement
Q2: Qualitative Question
Q3: Qualitative Question
Q1: Quantitative Question
Problem 1Problem statement and questions
Algebraic Representation
Numerical Representation
Verbal Representation
Pictorial Representation
Representations that the studentused to answer each question
Pictorial Representation
Student detailed reasoning& performance
Read the statement, andlooked at the sketch(Not make his own sketch)
Wrote down U = mgh, plugged in numbers,and calculated out U.Then wrote down K = 1/2mv^2, plugged in numbers, and calculated out v.
"If I set up these two equations equal toeach other, I got mgh = 1/2mv^2 . The massis dropped out. The speed is equal."
(Looked at the sketch given in the statement)"Her speed at C is going to be less than that atB because a point B she got her maximumamount of kinetic energy, which is hermaximum speed. When she got to C, she'sgoing to lose some of that kinetic energy, andreturn back to potential energy. And that'sgoing to cause decreasing velocity."

275
Problem statement
Q2: Qualitative Question
Q3: Qualitative Question
Q1: Quantitative Question
Problem 2Problem statement and questions
Numerical Representation
Verbal Representation
Pictorial Representation
Representations that the studentused to answer each question
Algebraic Representation
Student detailed reasoning& performance
Read the statement, andlooked at the sketch(Not make his own sketch)
Wrote down K = 1/2mv^2, plugged innumbers, and calculated out K.Then wrote down K = mgh, plugged in numbers, and calculated out h.
"If we double the initial speed, it's going to have adouble... (looking at his solution) it's going to be four timesof initial kinetic energy. Kinetic energy is a squaredfunction, and potential energy is a linear function. So it isgoing to have... (a pause). The maximum height is goingto a lot higher. I am not going to say double, but 4 timespossible, but I am not sure".
Wrote down K = 1/2(0.05)(60)^2, and calculated out K.Then wrote down 90 = (0.05)(10)h, and calculated out h.
"The same situation. The initial energy is goingto be 1/2mv^2. That's all translated to potentialenergy mgh. The mass is cancelled out. It isgoing to have the same height."
Numerical Representation
Numerical Representation

276
Problem statement
Q2: Qualitative Question
Q3: Qualitative Question
Problem 3Problem statement and questions
Verbal Representation
Pictorial Representation
Representations that the studentused to answer each question
Pictorial Representation
Student detailed reasoning& performance
Read the statement, and looked at thesketch .Then made his own sketch & labeled it.
Pictorial Representation
Pictorial Representation
Q1: Quantitative Question
Numerical Representation
Numerical Representation
Calculated initial potential energy: U1 = (0.05)(10)(1) = 0.5Calculated potential energy at the top of the ramp: U2 = (0.05)(1.8)(10) = 0.9.Calculated spring potential energy: Us = 1/2kx^2= 1/2(100)(0.2) ^2 = 2.
"At the top of the hill, potential energy is going to be...[pause] I am trying tothink If the energy is going to be zero. it has potential energy up to here. italso has kinetic energy. This kinetic energy is going to equal to the differenceof these two potential energy, plus the work done by spring. "Then he wrote down : 2 - 0.4 = 1.6, 1.6 = 1/2(0.05)V^2 to calculate v.
Then he started to use kinematics equations to solve the projectile motion. Algebraic Representation
"If we lower the height, [looked at his sketch], you lower the potentialenergy. If you move down like that [drew it on the sketch], the ramp islowered. It is going to have... the spring is going to do less work toovercome this change of potential energy. Then it is going to have moreavailable for kinetic energy. [Pause].
"This height is 0.8 before, now assume 0.4. Then the potential energy athere [new ramp top] is going to be less. Overall the system is going to haveless energy. So I think the final velocity is going to be lower. "
Pictorial Representation
"If the spring is compressed more, more work done on thesystem. And more energy in the system. Automaticallyentire energy of the system eventually will convert tokinetic energy. So it has more kinetic energy, then greaterspeed."

277
APPENDIX F
THREE THINK-ALOUD INDIVIDUAL STUDENT FOLLOW-UP INTERVIEW PROBLEMS (AUTUMN 1999)
Problem 1
Problem Statement
Two snow sleds, A and B, are placed at rest on the starting line on a very icy lake. Sled A is four times as massive as sled B. Two identical engines fixed on the sleds supply equal forces to each sled, continuously pushing each sled towards the finish line.
Question 1: Which sled has the greater kinetic energy when it reaches the finish line? Explain your reasoning.
Question 2: Which sled has the greater speed when it reaches the finish line? Explain your reasoning.
Question 3: Now a new finish line for sled A is set four times farther. Sled A, starting at the same starting line, is pushed continuously by the same force towards the new finish line. When sled A reaches its new finish line, would the kinetic energy of sled A be same, greater, or less than the kinetic energy of sled B when it reaches the original finish line? Explain your reasoning.

278
Problem 2
A spring of force constant 100 N/m is horizontally fixed to a smooth table. The top of the table is 1.0 m above the floor. The spring is initially compressed 0.2 m. After the spring is released, a HotWheelTM toy car of mass 0.05 kg is launched by the spring. After the toy car moves 0.5 m away from the spring, the car goes up a smooth ramp fixed to the same table top. The ramp horizontally makes an angle of 300 with the table top, and the ramp top is 0.8 m above the table top. After the toy car moves up the ramp, it flies off the ramp top, and eventually lands on the floor. (The effects of friction are neglected. g = 10 m/s2)
Question 1: What is the speed of the toy car just before it hits the floor?
Question 2: If the angle that the ramp makes with the table top is decreased, will the speed of the toy car, just before it lands on the floor, be the same, greater, or less than the speed in Question 1? Explain your reasoning.
Question 3: If the height of the table is lowered, will the speed of the toy car, just before it lands on the floor, be the same, greater, or less than the speed in Question 1? Explain your reasoning.

279
APPENDIX G
Problem 3
Problem Statement A company hires you to design a new concept in roller coasters. They first ask you to test out the design in a lab setting. To do this, you are given the following information, equipment, and models of the design. A spring of force constant 80 N/m is fixed to a horizontal model plateau that is 1.0 m above the floor. The model track goes down from the plateau, and then forms two additional hills and a horizontal end part on the floor. Initially, the spring is compressed 0.2 m. After the compressed spring is released, a model cart of mass 0.1 kg is launched to move off the plateau and to ride on the track.
Question 1: The first hill top is 0.5 m tall above the floor. What maximum height could the second hill have so that the cart just makes it over the second hill? (The effects of friction can be neglected for this question. g = 10 m/s2)
Question 2: Now, let the second hill be 1.6 m tall. The first hill is still 0.5 m tall. The end part of the track is given 8.0 m long, laying flat on the floor. What is the minimum frictional force needed to make the cart come to a stop at the very end? (The effects of friction can be neglected, except for the end part of the track. g = 10 m/s2)
Question 3: If the height of the second hill in Question 2 is greater, will the minimum frictional force needed to stop the cart at the very end be the same, greater, or less than the minimum frictional force needed in Question 2? Explain you reasoning.

280
DETAILED SOLUTIONS PRODUCED BY ONE STUDENT FOR THE THINK-ALOUD INDIVIDUAL STUDENT FOLLOW-UP INTERVIEW PROBLEMS
(THIS STUDENT LEARNED THE CONCEPTS OF WORK AND ENERGY USING THE MULTIPLE-REPRESENTATION STRATEGY, AUTUMN 1999)
Problem statement
Q2: Qualitative Question
Q3: Qualitative Question
Q1: Qualitative Question
Problem 1(Problem statement and questions
Mathematicalrepresentation
Verbal Representation
Pictorial Representation
Representations that the studentused to answer each question
Student detailed reasoning& performance
Read the problem.
Constructed a sketch and labeled relatedvariables
Started with the definition of kinetic energy, 1/2mv^2.
Used the mathematical representation from hisanswer of question 1 to reason this question..(Correctly answered the question.)
Used the mathematical representation fromhis answer of question 1 to reason thisquestion.(Correctly answered the question.)
Applied Newton's 2nd law and kinematicsequations to derive speeds of Sleds Aand B at the finish line.
Plus the speeds into the kineticenergy equations and thencompared the kinetic energies.
(Correctly answered the question.)

281
Problem statement
Q2: Qualitative Question
Q3: Qualitative Question
Q1: Quantitative Question
Problem 2(Problem statement and questions
Numerical Representation
Verbal Representation
Pictorial Representation
Representations that the studentused to answer each question
Student detailed reasoning& performance
Physical Representation Construct the work-energy bar chart.
Followed the bars in the chart to set up the generalized thework-energy equation. Plugged in numbers and solved forthe unknown quantity.
(He correctly answered the question)
Read the problem.
Constructed a sketch and labeled relatedvariables
Algebraic Representation
Used the generalized work-energy equationfrom question 1to answer this question.(He correctly answered this question)
Used the work-energy bar chart to reasonabout this question.(he correctly answer this question)

282
Problem statement
Q2: Quantitative Question
Q3: Qualitative Question
Q1: Quantitative Question
Problem 3(Problem statement and questions
Numerical Representation
Verbal Representation
Pictorial Representation
Representations that the studentused to answer each question
Student detailed reasoning& performance
Physical Representation Construct the work-energy bar chart.
Followed the bars in the chart to set up the generalizedthe work-energy equation. Plugged in numbers andsolved for the unknown quantity.
(He correctly answered the question)
Read the problem.
Constructed a sketch and labeled relatedvariables
Algebraic Representation
Used the generalized work-energy equation forquestion 2 to reason about this question.(he correctly answered this question)
Construct the work-energy bar chart.
Followed the bars in the chart to set up the generalizedthe work-energy equation. Plugged in numbers andsolved for the unknown quantity.
(He correctly answered the question)Numerical Representation
Physical Representation
Algebraic Representation
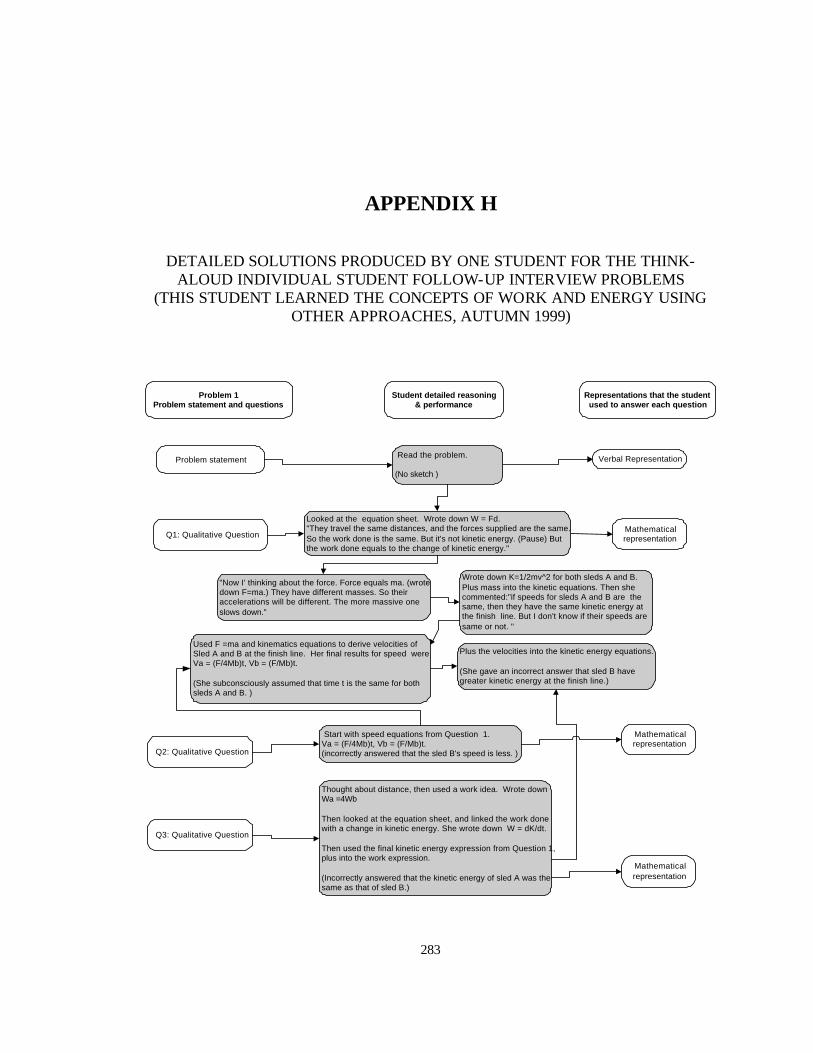
283
APPENDIX H
DETAILED SOLUTIONS PRODUCED BY ONE STUDENT FOR THE THINK-ALOUD INDIVIDUAL STUDENT FOLLOW-UP INTERVIEW PROBLEMS
(THIS STUDENT LEARNED THE CONCEPTS OF WORK AND ENERGY USING OTHER APPROACHES, AUTUMN 1999)
Problem statement
Q2: Qualitative Question
Q3: Qualitative Question
Q1: Qualitative Question
Problem 1Problem statement and questions
Mathematicalrepresentation
Verbal Representation
Representations that the studentused to answer each question
Student detailed reasoning& performance
Read the problem.
(No sketch )
Looked at the equation sheet. Wrote down W = Fd."They travel the same distances, and the forces supplied are the same.So the work done is the same. But it's not kinetic energy. (Pause) Butthe work done equals to the change of kinetic energy."
Start with speed equations from Question 1.Va = (F/4Mb)t, Vb = (F/Mb)t.(incorrectly answered that the sled B's speed is less. )
"Now I' thinking about the force. Force equals ma. (wrotedown F=ma.) They have different masses. So theiraccelerations will be different. The more massive oneslows down."
Wrote down K=1/2mv^2 for both sleds A and B.Plus mass into the kinetic equations. Then shecommented:"if speeds for sleds A and B are thesame, then they have the same kinetic energy atthe finish line. But I don't know if their speeds aresame or not. "
Used F =ma and kinematics equations to derive velocities ofSled A and B at the finish line. Her final results for speed wereVa = (F/4Mb)t, Vb = (F/Mb)t.
(She subconsciously assumed that time t is the same for bothsleds A and B. )
Plus the velocities into the kinetic energy equations.
(She gave an incorrect answer that sled B havegreater kinetic energy at the finish line.)
Thought about distance, then used a work idea. Wrote downWa =4Wb
Then looked at the equation sheet, and linked the work donewith a change in kinetic energy. She wrote down W = dK/dt.
Then used the final kinetic energy expression from Question 1,plus into the work expression.
(Incorrectly answered that the kinetic energy of sled A was thesame as that of sled B.)
Mathematicalrepresentation
Mathematicalrepresentation

284
Problem statement
Q2: Qualitative Question
Q3: Qualitative Question
Q1: Quantitative Question
Problem 2Problem statement and questions
Numerical Representation
Verbal Representation
Pictorial Representation
Representations that the studentused to answer each question
Student detailed reasoning& performance
Started with thinking about the goal: toy car's kinetic energyjust before hitting the floor, then looked the ramp."Using energy, at the top of the ramp there is only potentialenergy. At the floor level, only kinetic energy."
Wrote down P = mgy = (0.05 kg) (10 m/s^2) (1.8 m) = 0.9 J.Then wrote down K = 0.9 J, 1/2mV^2 = 0.9 J , and solved for v.
(Incorrect answered this question)
Read the problem.
Constructed a sketch and labeled related variables
She said:"I would have a hard time without drawing apicture."
Used her sketch to answer the questionqualitatively.
(Incorrectly answered this question.)
Used her sketch to answer the questionqualitatively.
(Incorrectly answered this question.)

285
Problem statement
Q2: Quantitative Question
Q3: Qualitative Question
Q1: Quantitative Question
Problem 3Problem statement and questions
Numerical Representation
Verbal Representation
Pictorial Representation
Representations that the studentused to answer each question
Student detailed reasoning& performance
Started with a work-energy idea. Tried to identifiedwhat types of energy that the model cart had at thepoint leaving the plateau, at the top of the first hill,and at the top of the second hill.
Read the problem.
Constructed a sketch and labeled relatedvariables
Used the numerical representation fromQuestion 2 to reason about this question.(Correctly answered this question)
Construct a sketch and labeled related information.Used U = 2.6 J from her solution for Question 1.Calculated the potential energy for the second hill with the new height: P = (1.6m)(10 m/s^2)(0.1 kg) = 1.6 J.Then wrote down K = 2.6 J for the kinetic energy at the beginning of the track.
Numerical Representation
P1 =mgh = (0.1 kg)(10 m/s^2)(1m) = 1 kg m/s^2 (1 m) = 1 J.
Us = 1/2 (80 N/m)(0.2 m)^2 = 40 N/m (0.04 m^2) = 1.6 J K = 1.6 J
P = 1 J + 1.6 J = 2.6 Jmgh = 2.6 Jh = 2.6 m(Correctly answered the question)
Wrote down1/2mv^2 = 2.6 Jmv^2 = 5.2 Jv^2 = 52 m^2/s^2Then realized that v was not thedesired variable.
Calculated the change in kinetic energy, and usedthe work-energy theorem to solve the question.Change of kinetic energy = 2.6 JW = 2.6 J, d = 8.0 m,W = Fd, F = W/d = 0.325 N.(Correctly answered the question)

286
APPENDIX I
INDIVIDUAL STUDENT DEMONSTRATION INTERVIEW PROTOCOLS (SPRING 1998)
Part 1. Introduction Part 2. Demonstrations and questions Demonstration 1: Drop a happy ball and an unhappy ball onto a table from the same height • These are two “identical-looking” black balls. If I drop them from this height
simultaneously, what would happen to them? Explain your reasoning.
• Please provide reasons why you think one of the balls did not bounce back, but the other did.
• What kind(s) of energy did each ball have just before they hit the table?
• What do you think happened to the energy of the non-bouncing ball just after the collision?
Demonstration 2: Drop an unhappy and a modeling clay ball from the same height
• If I drop this unhappy ball and this modeling clay ball from this height simultaneously, what would happen to them? Explain your reasoning.
• What happened to the shape of each ball after the collision?
• What kind(s) of energy did each ball have just before it hit the table?
• What do you think happened to the energy of each ball just after the collision?

287
Demonstration 3. Show the two model carts. They have identical mass, bumpers, and wheels
• If these two carts are pushed toward that wall with the same initial speed, what would happen to them? Explain your reasoning.
• Could you please provide reasons why you think one cart bounced back a
significantly shorter distance than the other one?
• What do you guess about inside of the carts? Demonstration 4. Take off the two covers from the model carts
• Again, if these two carts are pushed toward that wall with the same initial speed, which one would you predict bounce back a significantly shorter distance? Explain your reasoning.
• Could you please provide reasons why you think this rubber-band cart bounced back a significantly shorter distance than this rigid-rod cart did?
• What kinds of energy did each cart have just before they collided with the wall?
• Did you observe the small weights on the rubber bands randomly vibrate much faster after the collision than before? Where did the small weights get kinetic energy to vibrate?
• Now think about the carts modeling the molecular structure of a solid. Could you match the black balls with these two carts? Explain your reasoning.
• Consider the two carts as a simple analogy of the two black balls. Now explain again
why the “unhappy ball” died on the table after the collision.

288
APPENDIX J
STUDENT WORKSHEETS DEVELOPED IN THE AUTUMN QUARTER OF 1998

289
Name: Worksheets
1. Two “identical” black balls are dropped from some height onto a table surface. Write down what you see before and after the collisions.
2. Provide one or more reasons why you think one of the balls did NOT bounce back, but the other did.
3. What kind(s) of energy did each ball have just before they collided with the surface?
4. What do you think happened to the energy of the “unhappy” ball just after the collision (the “unhappy” ball is the one that did not bounce)?

290
5. Now we have two carts A and B, and each of them has the same total mass. They both have the same spring bumpers in the front of their base frames. Make a prediction about what will happen to each cart if they roll on a smooth table with the same initial speed and then collide with very heavy blocks in the way? Explain why this will happen.
6. Now watch the two carts hit the heavy blocks with the same initial speeds. Write down what you observed, and provide one or more reasons why that happened.
7. Now the instructor takes off the covers on the carts. Match the carts with your observation, that is, which cart bounced back a long distance, and which cart bounced back a very short distance? Provide your reasoning.
8. Now again watch the two carts roll on the smooth surface with the same initial speed and then collide with the heavy blocks. This time observe and write down what happens to the small brass disks on each cart before and after the collisions.

291
10.The microscopic molecular structure inside solids such as the balls can be modeled as molecules connected by bonds that are similar to springs (see the figure). For example, the bonds of some solids are so soft that individual molecules can move and rotate around easily. In contrast, the bonds inside some other solids are very stiff, and individual molecules can NOT easily move and rotate around. So now using this model, try to explain what happened to the initial energy of the rubber-band cart after the collision.
11. Now think about the “carts-model” for the molecular structure of the black balls above. Please match the carts with the balls, that is, which cart models which ball. Why?
12. Kinetic energy that individual molecules have is one example of internal energy. The faster molecules inside a solid move and rotate, the larger their internal energy, and the “hotter” the solid is. So now, using the concept of internal energy, explain why the “unhappy” ball did not bounce back, but the “happy” ball did.
9. Did you observe the brass disks on the rubber bands vibrate much faster just after the collision than before? Where did the brass disks get kinetic energy to vibrate? Did the brass disks on the other cart vibrate and have kinetic energy, too?

292
APPENDIX K
STUDENT WORKSHEETS DEVELOPED IN THE AUTUMN QUARTER OF 1999

293
Name: Worksheets
1. Two “identical” black balls are dropped from some height onto a table surface. Observe and write down what happens to the balls after the collisions.
2. Provide one or more reasons why you think one of the balls did NOT bounce back, but the other did.
3. What kind(s) of energy did each ball have right before they collided with the surface?
4. What do you think happened to the energy of the “unhappy” ball just after the collision (the “unhappy” ball is the one that did not bounce)?
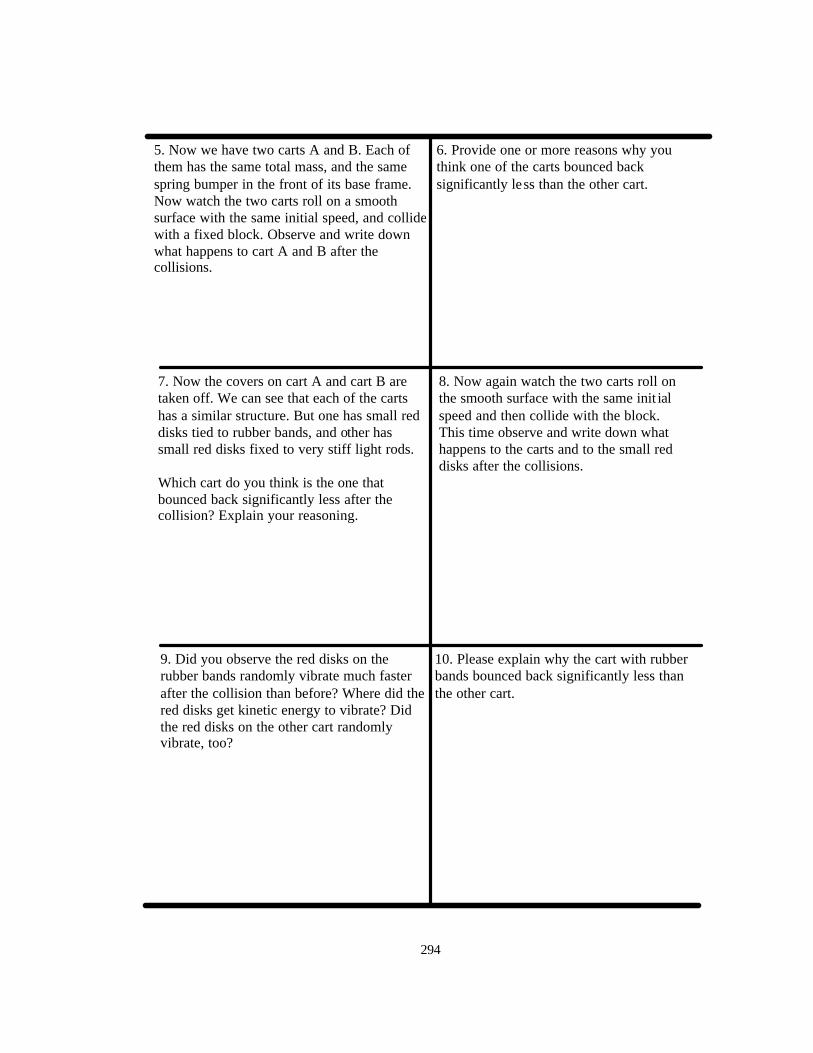
294
8. Now again watch the two carts roll on the smooth surface with the same init ial speed and then collide with the block. This time observe and write down what happens to the carts and to the small red disks after the collisions.
7. Now the covers on cart A and cart B are taken off. We can see that each of the carts has a similar structure. But one has small red disks tied to rubber bands, and other has small red disks fixed to very stiff light rods. Which cart do you think is the one that bounced back significantly less after the collision? Explain your reasoning.
5. Now we have two carts A and B. Each of them has the same total mass, and the same spring bumper in the front of its base frame. Now watch the two carts roll on a smooth surface with the same initial speed, and collide with a fixed block. Observe and write down what happens to cart A and B after the collisions.
6. Provide one or more reasons why you think one of the carts bounced back significantly less than the other cart.
9. Did you observe the red disks on the rubber bands randomly vibrate much faster after the collision than before? Where did the red disks get kinetic energy to vibrate? Did the red disks on the other cart randomly vibrate, too?
10. Please explain why the cart with rubber bands bounced back significantly less than the other cart.

295
12. We can consider the two carts as a simple analogy of the two black balls. Now explain why the “unhappy” ball died on the surface after the collision.
11. The molecular structure inside a solid can be simply modeled as molecules connected by bonds that are similar to springs (see the figure). The average random kinetic energy that individual atoms have is one example of internal energy. The faster the molecules inside a solid randomly move or vibrate, the greater its internal energy, and the “hotter” the solid is (i.e., the higher temperature the solid has). But if the molecules inside a solid lack freedom to vibrate, energy transfer into this type of internal energy cannot occur during a collision.
Now think about the carts modeling the molecular structure of a solid. Which cart gained the internal energy during the collision? Explain your reasoning.
13. Now using the concept of this type of the internal energy, explain which ball and cart have a more elastic collision and which have a more inelastic collision? Explain your reasoning.

296
APPENDIX L
PENDULUM-BOX BASH EXPERIMENT PROBLEM SETUP
1. A sketch of the setup
String
One-meter ruler on the lab table for students to use during the lab
Frame rods
Table
One-meter rulers Box
Sandbag
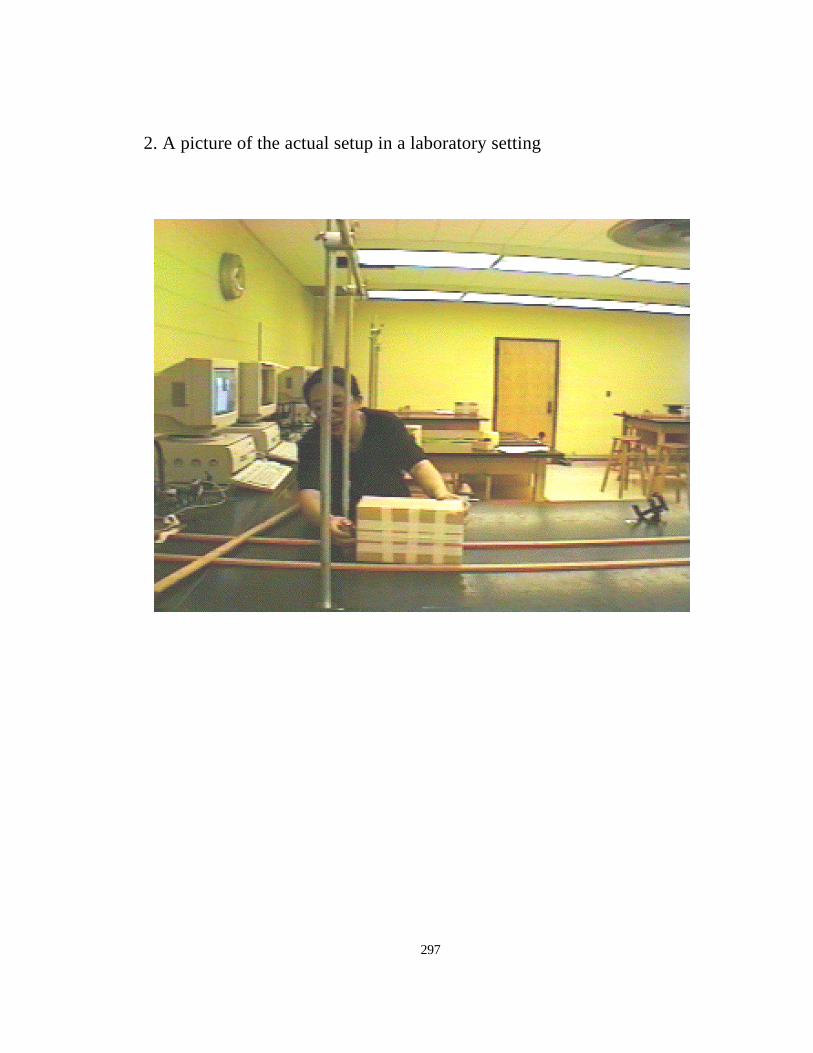
297
2. A picture of the actual setup in a laboratory setting

298
3. Detailed apparatus information Sandbag: Mass = 155 ~ 165 grams. Commercially-available “stress reliever” squeeze toys work well for this. Box: Mass = 290 ~ 310 grams. Use any convenient cardboard box and fill with masses until the correct mass is reached. The sandbag should stop after the collision, and not rebound or keep moving forward. String: Length = about 80 cm, measured from the pivot point to the center of mass of the sandbag. Tie one end of the sandbag to the pivot point (a rod or dowel), and have an alligator clip at the other end of the string. The clip holds the sandbag, and allows the sandbag to be removed for massing. Rulers: Three metersticks are needed for this lab. Two should be taped down parallel to each other on either side of the box, to create a track for the box. They should not be too close to the sides of the box, however. The zero end of these metersticks should be directly under the pivot point or the pendulum. The third meterstick is provided for measuring other quantities.

299
APPENDIX M
131 LAB MANUAL USED IN THE SPRING QUARTER OF 1999
PENDULUM-BOX BASH FRICTION MEASURER
A company wants to hire a group to design experiments to measure friction between
different surfaces. As part of the interview process, they give your group a specific task.
You are to determine the coefficient of kinetic friction between a box and a horizontal
table across which it will slide. The unusual part is that you have to determine it using the
following technique. A pendulum bob swings down and hits the box, which is resting on
the table. The box slides across the table and stops. Use any measurements you wish with
the provided apparatus and the theories of physics to determine the coefficient of kinetic
friction between the table and the box. (The determination has to be based on this
experiment and not on some other experiment of your own design.) Be sure to provide a
clear solution to this fun problem. After you have completed the solution, check your
work with the lab instructor. Then try to answer the questions on the next two
pages, and check your answers with your partners first and then with the lab
instructor.

300
Name: ____________________________________________
Answer the following questions based on your lab work. Please clearly give your explanations.
(a) Is the kinetic energy of the pendulum bob right before the pendulum-box collision greater than, equal to or less than the kinetic energy of the box right after the pendulum-box collision? Show all of your work and the reasoning to support your answer. (b) If the kinetic energy of the pendulum bob right before the pendulum-box collision is NOT equal to the kinetic energy of the box right after the pendulum-box collision, by how much did it change? Explain where it goes if getting less or explain where it comes from if gaining more.

301
(c) Is the magnitude of the momentum of the pendulum bob right before the pendulum-box collision greater than, equal to or less than to the magnitude of the momentum of the box right after the pendulum-box collision? Please clearly explain your reasoning.
(d) Is the direction of the momentum of the pendulum bob right before the pendulum-box collision the same as or opposite the direction of the momentum of the box right after the pendulum-box collision? Please clearly explain your reasoning.
(e) If the magnitude of the momentum of the pendulum bob right before the pendulum-box collision is NOT equal to the magnitude of the momentum of the box right after the pendulum-box collision, by how much did it change? Explain where it goes if getting less or explain where it comes from if gaining more.
(f) What physics term describes the kind of the pendulum-box collision in this case? Please briefly explain your choice.

302
Bibliography
“Shaping the future: New expectations for undergraduate education in science, mathematics, engineering, and technology”. This document is a report on the review of undergraduate education from the Committee for the Review to the National Science Foundation Directorate for Education and Human Resources (1996), and can be downloaded from http://www.ehr.nsf.gov/ehr/due/documents/review/96139/start.htm. ABET criteria 2000 documents can be downloaded from the ABET web site at http://www.abet.org/downloads.htm. Andre, K. M., “Cooperative Learning: An Inside Story,” Phys. Teach. 37, 356-358 (1999). Arons, A. B., Teaching Introductory Physics (John Wiley & Sons, New York, 1997). Bridgman, P. W., The Nature of Thermodynamics (Harvard University Press, Cambridge, MA, 1941). Burkhardt, H., “System physics: A uniform approach to the branches of classical physics,” Am. J. Phys. 55, 344-350 (1987). Carnevale, A. P., Gainer, L. J., and Meltzer, A.S., Workplace basics: The essential skills employers want (Jossey-Bass Publishers, San Francisco, 1990). Chabay, R. W., and Sherwood, B. A., Matter & Interactions (Preliminary Edition, John Wiley & Sons, New York, 1999). Chase, W. G. and Simon, H. A., “Perception in chess,” Cognitive Psychology 4, 55-81 (1973). Chi, M. T. H., Feltovich, P. J., and Glaser, R., “Categorization and representation of physics knowledge by expert and novices,” Cognitive Science 5, 121-152 (1981). Czujko, R., AIP Stat. Div., “Physics bachelors as a passport to the workplace: Recent research results”. De Groot, A. D., Thought and Choice in Chess (The Hague: Mouton, 1978), 2nd ed..

303
Ericsson, K. A. and Simon, H. A., Protocol analysis: Verbal report as data (The MIT Press, Cambridge, Massachusetts, 1996). Ganiel, U., “Elastic and inelastic collisions: A model”, Phys. Teach. 30, 18-19 (1992). Goldberg, F., “Tasks to elicit subject’s knowledge,” unpublished material, San Diego State University. Goldring, H. and Osborne, J., “Students’ difficulties with energy and related concepts,” Physics Education 29, 26-31, 1994. Grimellini-Tomasini, N., Pecori-Balandi, B., Pacca, J. L. A., and Villani, A., “Understanding conservation laws in mechanics: Students’ conceptual change in learning about collisions,” Science Education 77, 169 (1993). Hayes, J. R. and Simon, H. A., “Psychological differences among problem isomorphs,” In N. J. Castellan, D. B. Pisoni, and G. R. Potts (Eds.), Cognitive theory (Lawrence Erlbaum Associates, Hillsdale, NJ, 1977), Vol. 2, pp. 22-41. Hestenes, D., Wells, M., and Swackhamer, G., “Force Concept Inventory,” Phys. Teach. 30, 141-151 (1992). Kaput, J. J., “Representation and problem solving: Methodological issues related to modeling,” E. A. Silver (Ed.), Teaching and Learning Mathematical Problem Solving: Multiple Research Perspectives (Lawrence Erlbaum Associates, Hillsale, NJ, 1985), pp. 381-398. Larkin, J. and Simon, H. A., “Why a diagram is (sometimes) worth ten thousand words,” In H. A. Simon, Models of Thought (Yale University Press, New Haven, 1989), Vol. II, pp. 413-437. Larkin, J., “Skilled problem solving in physics: A hierarchical planning approach,” Journal of Structured Learning 6, 121-130 (1980). Larkin, J., “Cognition of learning physics,” Am. J. of Phys. 49(6), 534-541 (1981). Larkin, J., “The role of problem representation in physics,” In D. Gentner and A. L. Stevens (Eds.), Mental models (Lawrence Erlbaum, Hillsdale, NJ, 1983), pp. 75-98. Larkin, J., “Understanding, problem representations, and skill in physics” In S. F. Chipman, J. W. Segal and R. Glaser (Eds.), Thinking and learning skills (Lawrence Erlbaum, Hillsdale, NJ, 1985), Vol. 2, pp. 141-159. Larkin, J., McDermott, J., Simon, D. P., and Simon, H. A., “Expert and novice performance in solving physics problems,” Science 208, 1335-1362 (1980).

304
Lawson, R. A. and McDermott, L. C., “Student understanding of the work-energy and impulse-momentum theorems,” Am. J. Phys. 55, 811-817 (1987). Morton, M. (ed.), Rubber Technology (Van Nostrand Reinhold Company, New York, 1987), pp. 8-9, 14. McDermott, L. C. and Redish, E., “Resource letter: PER-1: Physics education research,” Am. J. Phys. 67, 755 (1999). This resource letter includes a comprehensive list of references on research in physics education. McDermott, L. C., “Guest comments: How we teach and how student learn—A mismatch?” Am. J. Phys. 61, 295-298 (1993). McDermott, L. C., “Millikan Lecture 1990: What we teach and what is learned—Closing the gap,” Am. J. Phys. 59, 301-315 (1991). McDermott, L. C., Shaffer, P. S., and the Physics Education Group of University of Washington, Tutorials in introductory physics (Prentice Hall, Upper Saddle River, New Jersey, 1998), preliminary ed. Norman, D. A., Things that make us smart (Addison-Wesley Publishing Company, 1993), p. 49. O’Brien Pride, T., Vokos, S. and McDermott, L. C., “The challenge of matching learning assessments to teaching goals: An example from the work-energy and impulse-momentum theorems,” Am. J. Phys. 66, 147-157 (1998). Plamer, S. E., “Fundamental aspects of cognitive representation,” In E. Rosch and B. B. Lloyd (Eds.), Cognition and categorization (Lawrence Erlbaum Associates, Hillsale, NJ, 1978), p. 262. Plotzner, R., The Integrative Use of Qualitative and Quantitative Knowledge in Physics Problem Solving (Peter Lang, Frankfurt am Main, 1994), pp. 33-53. In the book, he summarizes research findings on differences in problem solving between novices and experts. Redish, E., “Implications of cognitive studies for teaching physics,” Am. J. Phys. 62, 796-803 (1994). Reusser, K., “Tutoring Systems and pedagogical theory: Representational tools for understanding, planning, and reflection in problem solving,” In S. P. Lajoie and S. J. Derry (Eds.), Computer as Cognitive Tools (Lawrence Erlbaum, Hillsdale, NJ, 1993). Rosdil, D., “What are masters doing?” AIP Statistics Div., Pub.No. R-398.1, Sept. 1996. Sherwood, B. A., "Pseudowork and real work," Am. J. Phys. 51, 597-602 (1983).

305
Sherwood, B. A., and Bernard, W. H., "Work and heat transfer in the presence of sliding friction," Am. J. Phys. 52, 1001-1007 (1984). Simon, D. P. and Simon, H. A., “Individual differences in solving physics problems,” In R. Siegler (Ed.), Children’s Thinking: What develops? (Lawrence Erlbaum Associates, Hillsdale, NJ, 1978), pp. 325-348. Simon, H. A., “On the forms of mental representation,” In C. W. Savage (Ed.), Minnesota studies in the philosophy of science (University of Minnesota Press, Minneapolis, Minnesota, 1978), Vol. IX, Perception and cognition: Issues in the foundations of psychology. Simon, H. A., The sciences of the artificial (MIT Press, Cambridge, MA, 1981), 2nd ed.. Van Domelen, D., The Development of the Problem Decomposition Diagnostic, Ph.D. dissertation, 2000.
Van Heuvelen, A. and Maloney, D., “Playing physics Jeopardy,” Am. J. Phys. 67, 252-256 (1999). Van Heuvelen, A., “The Robert A. Millikan Award Lecture—Research about physics learning, linguistics, our mind, and the workplace,” Announcer 29, 88 (Summer 1999). Van Heuvelen, A., “Experiment Problems for Mechanics,” Phys. Teach. 33, 176-180 (1995). Van Heuvelen, A., “Learning to think like a physicist: A review of research-based instructional strategies,” Am. J. Phys. 59, 891-897 (1991). Van Heuvelen, A., “Overview Case Study Physics,” Am. J. Phys. 59, 898-907 (1991). Van Heuvelen, A., Active Learning Problem Sheets: Mechanics (Hayden-McNeil Publishing, Inc. Plymouth, Michigan, 1996). Van Heuvelen, A., ActivPhysics1 (Addison Wesley Longman, Palo Alto, CA, 1997). Van Heuvelen, A., and Zou, X., “ Multiple representations of work-energy processes,” Am. J. Phys. 68 (2000). Van Heuvelen, A., Bulletin of the American Physical Society 36, 1359 (1991).
Van Heuvelen, A., Mechanics Active Learning Problem Sheets (the ALPS Kits) (Hayden-McNeil Publishing, Inc., 1996). This set of the ALPS Kits is developed for college or high school students to learn mechanics in algebra-based and calculus-based introductory physics courses. Another set of the Electricity and Magnetism ALPS Kits can be used by students in the electricity and magnetism part of introductory physics courses.

306
Van Heuvelen, A., Allen, L., and Mihas, P. “Experiment Problems for Electricity and Magnetism,” Phys. Teach. 37, 482-485 (1999). Wittmann, M. C., Making sense of how students come to an understanding of physics: An example from mechanical waves, Ph.D. dissertation, University of Maryland, 1998. Wosilait, K., “Research as a guide for the development of tutorials to improve student understanding of geometrical and physical optics,” Ph.D. dissertation, University of Washington, 1996. Zhang, J. and Norman, D. A., “Representations in distributed cognitive tasks,” Cog. Sci., 18, 87-122 (1994). Zhang, J., “External representations in complex information processing tasks,” In A. Kent (ed), Encyclopedia of Library and Information Science (In print, Marcel Dekker, Inc, New York). Zhang, J., “The nature of external representations in problem solving,” Cog. Sci. 21, 179-217 (1997).