the use of real-time elastography in the assessment of ... 2013_h.a.m.brolmann_the... ·...
TRANSCRIPT
This article is protected by copyright. All rights reserved.
The use of real-time elastography in the assessment of uterine
disorders
B. Stoelinga*, W.J.K. Hehenkamp*, H.A.M. Brölmann*, J.A.F. Huirne*
*Department of Obstetrics and Gynecology, VU medical center (VUmc), The Netherlands
Correspondence to: B. Stoelinga, Department of Obstetrics and Gynecology, VU medical
Center, De Boelelaan 1117, 1081 HV Amsterdam, The Netherlands.
Email: [email protected], telephone: 0031 20 44443613
Keywords: Elastography, ultrasound, fibroids, adenomyosis.
This article has been accepted for publication and undergone full peer review but has not been through the copyediting, typesetting, pagination and proofreading process, which may lead to differences between this version and the Version of Record. Please cite this article as doi: 10.1002/uog.12519

This article is protected by copyright. All rights reserved.
Abstract
Objectives: Sono-elastography is an imaging technique added to sonography, measuring
tissue strain. The aim of this article is to systematically define specific sono-elastographic
characteristics of the myometrium, fibroids and adenomyosis and evaluate the feasibility of
sonoelastography in patients suspected of gynecological pathology and to compare it with
histology-based and MRI-based diagnoses.
Methods: We performed a prospective observational cohort study from 2009 to 2011 using a
Samsung Medison Accuvix V10 machine. Women included underwent routine transvaginal
ultrasound and additional real-time sonographic elastography. The acquirements of
elastographic images were standardized. We analyzed elastographic characteristics of
myometrium, fibroids and adenomyosis. An independent observer, unaware of clinical,
histological or MRI findings evaluated the recorded elastographic images and cine loops.
These elastographic-based diagnoses were compared with histology and/or MRI diagnosis.
Results: With elastography the uterus is well delineated from the surrounding bowels. The
myometrium was uniform in color in 49% of the cases, with a main color of purple or dark
blue. Both fibroids and adenomyosis have different elastographic characteristics with
different color patterns. In general fibroids were darker and adenomyosis brighter then
adjacent myometrium. The agreement between elastography based diagnosis of fibroids and
adenomyosis with MRI were excellent, and with histology it was also excellent for fibroids,
but less optimal for adenomyosis.
Conclusion: Elastography is able to identify clear discriminating characteristics of the
uterus, fibroids and adenomyosis and the elastographic based diagnosis are in excellent
agreement with MRI. Agreement between the elastography image of adenomyosis and
histology was less optimal.

This article is protected by copyright. All rights reserved.
Introduction
Elastography is an ultrasound technique measuring elasticity of tissue. It is based on
differences in elasticity of various tissues, both in physiological and pathological conditions.
To obtain an elastography image it is necessary that there is a source of stress which
provides deformation of the tissue. There are different types of elastography and the main
difference is the source of stress. This stress can be induced by (physical) compression,
vibration or acoustic pulse waves. In this study we use compression elastography. This
technique was first described by Ophir et. al.1 in 1991. For a compression elastography
image, the ultrasound machine is tracking the tissue displacement by tracking the
ultrasonographic speckles; comparing the condition before and after pressure applications.
The change in deformation is color-coded and is superimposed on the corresponding B-
mode image (Figure 1). An advantage of this technique is the possibility of making a 2D
ultrasound and elastographic image at the same time using the transducer to apply a certain
amount of pressure. An additional advantage is the relative easy interpretation of the
obtained pictures.2
Promising results about the use of elastography have been described in the assessment of
tumors of the breast, prostate and liver.3-7 Publications on the use of elastography in the field
of gynecology are scarce. One paper published on the feasibility of compression
elastography in the assessment of cervical dysplasia 8, one in the assessment of fibroids 9
and one in the assessment of adenomyosis.10 Another study reports on the use of
compression elastography of the cervix in order to predict the risk of premature delivery.11 In
these studies different machines have been used (Toshiba Aplio MX, 11 Hitachi logos HI
Vision 10 and Hitachi EUB-8500 ultra sound system.8;9) and standardized methods on settings
and probe handling were not reported for the interpretation of images, Some kind of
standardization is mandatory to compare the results of future studies and to assess its
clinical relevance.

This article is protected by copyright. All rights reserved.
The aim of this article is to systematically define specific sono-elastographic characteristics
of the myometrium, fibroids and adenomyosis and evaluate the feasibility of
sonoelastography in patients suspected of gynecological pathology and to compare it with
histology-based and MRI-based diagnoses.
Methods
Design and population
We performed a prospective observational cohort study using a Samsung Medison Accuvix
V10 machine with elastography software and a 4-9 MHz vaginal probe. This ultrasound
machine is using real-time displacement elastography also known as compression
elastography or strain elastography.
Patients enrolled in this study were all women with abnormal uterine blood loss,
dysmenorrhoea or fertility problems who visited our outpatient clinic between august 2009
and December 2011. All patients with a suspicion of adenomyosis or fibroids on normal grey
scale sonography underwent additional real time elastography when the machine was
available. Elastographic imaging was executed by one sonographist (J.H.) with expertise on
routine grayscale imaging. She performed the elastographic imaging in a standardized way
(Figure 2). Both the single mode grayscale images combined with dual imaging and real-time
recording were stored.
This study has been exempted from ethical approval granted by the Institutional Review
Board (13/89).
This article is protected by copyright. All rights reserved.
Settings
It is possible to make an elastographic image with both the abdominal and the vaginal probe.
We used the vaginal probe, given the best resolution of this probe to visualize the uterus.
The percentage grey mixed with the elastography image is variable, the so-called alpha
blending. We prefer a blending level up to 20%. This provides a clear color overlay on a grey
scale background, enabling the visualization of the basic pattern as well. There are different
options for the elastography color maps to superimpose over the B-mode image: black and
white, sepia and ascending colors. (Figure 3). We mostly used the ascending colors color
map, which enables some kind of quantification based on the ascending colors. In the
Samsung Medison Accuvix V10 ultrasound machine with Elastoscan™, the colors vary from
dark purple to red but other machines may display different colors. However, the
quantification is not absolute since it depends on the amount of pressure that has been
applied to the tissues. Therefore, the elastographic image should be considered as a relative
impression of the stiffness of the tissue in comparison to adjacent tissue that is exposed to
the same amount of pressure. It is not possible to compare a degree of stiffness between
different images or between different patients.
The frequency of refreshment of the dynamic images displayed on the screen, the so-called
persistence level, can be adjusted. The persistence level indicates the degree of correlation
of different individual elastographic images before an elastographic image is visualized on
the screen. The final image on the screen is a kind of average elastographic image.
At a low persistence level, few images are correlated. Advantages of a low persistence level
are a better time response and a better approximation of the actual size of a lesion, this is
useful for small lesions. With a high persistence level, an average image is produced from
more individual elastographic images. An advantage of a higher persistence level is a better
signal to noise ratio. The images look cosmetically better, but are lagging a little bit behind in
time. In the assessment of uteri, we mostly prefer a persistence level of 80%.

This article is protected by copyright. All rights reserved.
Besides the persistence level there is the frame rate, the amount of frames per second.
Depending on the frame rate per second of the screen, the image will be changed with an
adjusted frequency.
Probe handling: baseline steady state versus dynamic steady state.
Based on our experiences with elastography using a Samsung Medison Accuvix V10, in
patients visiting our outpatient department because of gynecological symptoms, we
formulated some basic principles in making an elastographic image using this machine. First
of all there should be a steady state: a clear delineation of the uterus from the intestines for
more than 40% of the surface and it is obligatory that the normal myometrium is equal in
color (figure 4, 5 and 6). Furthermore we used two standardized ways of probe manipulation
in all patients. We defined them as “baseline steady state” (figure 5a) and “dynamic steady
state” images (figure 5b).
To obtain a baseline steady state image the probe should be held gently to the cervix or
vagina without probe movements. The pulsations of the large abdominal arteries will induce
natural movements of the uterus and therefore apply a slight deforming pressure. With these
slight movements a stable picture will be obtained of the uterus with a regular serosa
delineated from the surrounding intestines and in case of fibroids, a capsule becomes slightly
visible, giving the first impression of the localization and delineation of fibroids. In order to
detect adenomyosis or other pathological conditions of the uterus which are associated with
softer tissue, the baseline steady state mode does not always have sufficient discriminatory
abilities. We defined that these conditions should be evaluated using the dynamic steady
state images.
The dynamic steady state image is defined as a more or less stable image that is acquired
during intermittent application of a certain amount of pressure and which can be reproduced.

This article is protected by copyright. All rights reserved.
The sonographer needs to vary the pressure by making intermittent movements with the
probe. Little pressure is followed by a release state with less pressure with a frequency of
approximately one to two times per second. The dynamic steady state creates a stable
image with a clearly visible serosa of more than 40% with several parallel lines and with
more color contrast than with the baseline steady state image. We considered such a
dynamic steady state image as obligatory for the evaluation of adenomyosis. The use of a
dynamic steady state image will reduce the risk of wrongful interpretation of movement
artifacts in normal endometrium as soft tissue. In case of excessive pressure or movements
of the uterus, bright colors can be induced even in normal myometrium (movement artifacts),
resembling the appearance of adenomyosis (figure 4). However in these cases, in contrast to
a dynamic steady state image, there will not be a clear delineation of the serosa with the
surrounding intestines and in these circumstances the images will not be easily reproduced.
An additional artifact the examiner has to be aware of is a probe contact artifact, visible in
most elastographic images as an illuminated area at the point of contact with the ultrasound
transducer mimicking softer areas (figure 4 and 6). This bright (yellow) area should not be
confused with the presence of adenomyosis. Due to this artifact it is difficult to study the
existence of adenomyosis in the low anterior part of the uterus.
Due to differences in the mobility of the uterus, the required pressure and frequency of
movement differs per patient to obtain a dynamic steady state image. In very mobile uteri, it
might be difficult to get a clear image. In these cases we fixated the uterus from form the
outside by the examiner’s hand or the hand of the patient.
Evaluation of the elastographic images
A second independent researcher (B.S.), who did not perform any of the examinations, and
was unaware of clinical information including MRI or histology outcomes, examined all stored
grayscale images and elastographic images that had been made and recorded between
This article is protected by copyright. All rights reserved.
2009 and 2011. This second researcher had to register the suspected diagnosis based on
elastographic findings (none, intrauterine fibroids or adenomyosis) in all patients. For the
diagnosis of adenomyosis we used the criteria as described by Dueholm.12
In addition, she registered elastographic characteristics of the serosa, myometrium and
eventual disorders in the uterus. In the midsagittal plane various parameters were registered.
Number and color of the lines were described and percentage of clear visualization of the
total serosa surface was estimated by the researcher. Of the myometrium the color and its
homogeneity of the largest area was registered. After scanning through the uterus in both
sagittal and transversal planes, the existence, the size and the localization of brighter or
darker areas were registered. In case of areas with another color then the general
myometrium, the existence of, the number and colors of the lines of a capsule were
registered. The suspected diagnosis and the registration of the availability of adenomyosis
were only based on dynamic steady state images.
Evaluation of the MRI images and histology samples
The used reference standard for the diagnosis of adenomyosis or intrauterine fibroids was
MRI and/or histology. MRI was performed with at 1.5 Tesla (Sonata or Avanto, Siemens,
Erlangen, Germany).
In case of histological examination the uterus was evaluated without fixation within 2-3 days
after hysterectomy. Histopathological slices were obtained at 3 mm interval. The
junctionalzone contours were measured. Adenomyosis was thought to be present if the
junctionalzone was more than 2.5 mm from the pre-existing endometrium and the presence
of ectopic endometrial gland or tissue within the myometrium beyond this line. Intrauterine
fibroids were thought to be present if there was a rounded spot of leiomyomateus tissue. In
case of fibroids the localization and size was measured.
This article is protected by copyright. All rights reserved.
Outcome parameters
Primary outcome: sono-elastographic characteristics of uteri with fibroids and or
adenomyosis.
Secondary outcome: level of agreement in diagnosis made on sono-elastographic findings
with a reference test (histology or MRI)
Statistical analyses
Patients that received a sono-elastography and who received a MRI or of whom histology
was obtained were included for analyses. Descriptive outcomes were registered.
For the evaluation of specific elastographic characteristics of fibroids and adenomyosis, we
analyzed elastography images of adenomyosis and fibroid images in those patients in whom
the elastographic diagnosis was confirmed by histology or MRI evaluation. We compared the
color scores between fibroids and adenomyosis using the Fisher Exact Test.
For the analyzes of the level of agreement (Cohen’s Kappa) between elastography based
diagnoses with the MRI-based or histology-based we included all patients that that received
a MRI or of whom histology was obtained independent of the diagnosis made. Scores over
0.75 can be interpret as excellent agreement, 0.40 to 0.75 as fair to good, and below 0.40 as
poor agreement.13
We used SPSS version 20, all tests were performed 2-sided. A p-value < 0.05 was
considered to be statistically significant.

This article is protected by copyright. All rights reserved.
Results
218 women received elastographic imaging. In 69 patients a reference test was preformed.
It was possible to achieve a steady state elastography image in 67 cases. From these
patients histology was obtained in 59 cases, and 23 underwent additional or only an MRI
Baseline characteristics of all patients with both saved elastographic images and histology or
MRI findings are shown in table 1.
Elastographic characteristics of fibroids and adenomyosis
The saved dynamic steady state images were analyzed by scoring the elastographic
characteristics of the uterus and intrauterine abnormalities that were confirmed by histology
(n=59) and/or MRI (n=23). In most cases myometrium and serosa of the uterus rendered a
uniform elastographic image. The uterus is well delineated from the surrounding bowels with
a couple of small bright parallel lines. The mean number of colored lines was 4.3, range 2-
13. In most cases (95%) the serosa starts with a purple line followed by a dark blue, light
blue one and a yellow line (Figure 6). The myometrium was uniform in color in 49% of the
cases, with a main color of purple or dark blue. Most elastographic images (87%) showed a
probe artifact (Figure 4 and 6).
Both fibroids and adenomyosis have different elastographic characteristics with different
color patterns. Examples elastographic images of intramural fibroids are illustrated in figure 6
and of adenomyosis in figure 7. In general fibroids were darker and adenomyosis brighter
than adjacent myometrium. Most fibroids had a regular shape with a clear visible and regular
capsule whereas adenomyosis was mostly irregular shaped and without a clear border. The
shape of fibroids was mostly regular whereas the shape of adenomyosis was mostly
irregular. The fibroid capsule started in most cases (in case of a dynamic steady state image)
with a purple line followed by a dark blue, light blue one and in some cases also a yellow and

This article is protected by copyright. All rights reserved.
red line (from inside out) (Figure 6). Adenomyosis started with a yellow line followed by a
green line and a light blue line from inside to outside (figure 7). The specific characteristics
and the main differences of fibroids and adenomyosis are presented in table 2. The
delineation of fibroids in case of multiple fibroids was mostly very clear in the elastography
image (figure 8)
Agreement between elastographic and MRI or histology findings
Based on elastography the majority of the patients (n=54) were suspected to have uterine
fibroids, 10 patients were suspected to have adenomyosis and 3 patients to have both
adenomyosis and fibroids.
All elastography-based diagnosis of uterine fibroids were confirmed with histology and/or
MRI. Resulting in a Cohen’s Kappa for the diagnosis of fibroids of 1.0 with MRI and 1.0 with
histology. Three patients with suspicion of uterine fibroids on elastography and MRI scan had
also histological signs of adenomyosis which was neither seen with elastography nor with
MRI.
All elastography-based diagnosis of adenomyosis were confirmed with MRI. Only in 7 cases
histology was obtained. In 5 out of these 7 cases adenomyosis was confirmed. One of the
patients with a negative histology for adenomyosis had several months of GnRH analogue
pretreatment before hysterectomy. Calculated Cohen’s Kappa for the diagnosis of
adenomyosis with MRI was 1.0 and with histology was 0.39.

This article is protected by copyright. All rights reserved.
Discussion
Main findings
Normal myometrium, endometrium, fibroids and adenomyosis can be visualized well with
elastography. We defined and used a standardized way of using elastography in the
diagnosis of fibroids and adenomyosis. Specific patterns and characteristics in terms of
shape and color can be recognized in association with these conditions and can be of use for
discrimination between these pathologies and normal uteri. The agreement between
elastography based diagnosis of fibroids and adenomyosis with MRI were excellent, and with
histology it was also excellent for fibroids, but less optimal for adenomyosis.
Strengths and weaknesses of the study
Before we started there were no standardized method on how to perform elastography in
gynecology and how to interpret the images under what conditions. We had to define them
first on our experiences before we started with the study. In this study we used the Samsung
Medison Accuvix 10. With other machines some principles may be similar, but we expect that
our recommendations on settings should be adjusted in case other machines are used.
An additional limitation of this study is that we were only able to verify the diagnosis in those
patients that underwent surgery or received an MRI scan. Thus by definition this is a selected
population and diagnostic accuracy can not be evaluated in these patients accurately. Future
studies should include patients with and without suspected pathology. An additional limitation
is that the number of included patients with adenomyosis and obtained histology is limited,
only seven and one of these patients histology was obtained after a long period of GnRH
suppression. With respect to adenomyosis it is difficult to define the golden standard.

This article is protected by copyright. All rights reserved.
Both MRI and histology have their own limitations. To overcome this problem both our
histology samples and our MRI images were evaluated by one experienced radiologist and
one experienced pathologist using standardized criteria.
In addition inter- and intra-observer variation of both the acquirement of the images and their
interpretation has not yet been evaluated yet. This study should be considered as a first
study exploring the elastographic characteristics in gynecology and in this way producing a
practical manual for its use in the diagnosis of fibroids and adenomyosis using the Samsung
Medison Accuvix V10.
Interpretation of the findings and comparison to published data
Within the field of gynecology little experience has been gained in this field. The feasibility of
elastography for the assessment of intrauterine fibroids and adenomyosis is described in a
few other studies.9;10 The identified characteristics of fibroids and adenomyosis are in line
with these papers, however these did not report the characteristics in detail as we did and did
not use standardized criteria to evaluate the images. Two other studies reported fibroids to
have a dark centre and a clear regular capsule reflected as softer tissue. 9;14 We could not
find any other papers reporting on the appearance of small bright spots, that we identified as
necrosis of the fibroid. In our study most fibroids had a color with the same intensity as the
adjacent myometrium, and only 25% had a darker color. The proportion of patients with a
reported darker centre than the myometrium was larger in two other small studies.9;14 The
amount of applied pressure by the probe in order to get a steady state image, different
settings or the use of a different machine could explain these differences. Adenomyosis has
a soft centre with a stiffer border and an irregular shape using elastography. This is in line
with a publication reporting on 15 patients with histology confirmed diagnosis of
adenomyosis.10
This article is protected by copyright. All rights reserved.
Clinical relevance
Due to the fact that elastography image is influenced by the amount of pressure applied, a
certain level of experience is required to obtain good quality and reproducible images and to
enable the interpretation of the images, in particular in the evaluation of adenomyosis. The
learning curve of elastography lies mainly in the fact that the mobility of the uterus varies per
patient. In addition, the pressure of the probe applied to the cervix and the frequency of
movements by the sonographer differs, leading to differing images which are more difficult to
reproduce. When more experience is gained, it becomes easier to reproduce images. We
examined about 300 patients in which we made a sono-elastography image, to develop the
standardized way of imaging and learn how to interpret the images. Using our standardized
way for the used settings and applied technique in the assessment of uterine pathology it
becomes easier to obtain reproducible images. The detailed description of specific
characteristics of fibroids and adenomyosis in dynamic state images resulted in a good
agreement with histology or MRI based images and could be of use for future studies
evaluating the diagnostic accuracy of this method and its additional value to normal grey
scale sonography with or without power-Doppler.
In other fields, elastography seems to be a promising technique, and in gynecology there are
some papers indicating some additional value. However, current evidence is not sufficient
enough to determine the exact additional value in gynecology. Future studies are required to
address current gaps in available evidence. These include inter and intra-observer variation
using the Samsung Medison Accuvix V10 in the same and other populations and preferably
in random patients with and without uterine pathology, but also using other machines.
Diagnostic accuracy of elastography should be compared to one reference test, for example
MRI, in all patients independent of the outcome of sonography to prevent verification bias.

This article is protected by copyright. All rights reserved.
Conclusion
Elastography is able to identify clear discriminating characteristics of the uterus, fibroids and
adenomyosis and the elastographic based diagnosis are in agreement with MRI or histology
based diagnoses, with a substantial agreement. More data are needed to confirm its utility in
gynecology, including reproducibility and accuracy in the diagnosis of intrauterine pathology.
Acknowledgments
We thank Julie Bartholomew for her critical review of all technical details and the English
language.
This study was funded by the Department of Obstetrics and Gynecology of the VU medical
center (VUmc). No other funding was received for this study. No conflict of interest.
The study was not supported financially by Samsung Medison. We do have a research
machine of Samsung Medison, however the availability of the ultrasound machine was not
related to this study.

This article is protected by copyright. All rights reserved.
References
1. Ophir J, Cespedes I, Ponnekanti H, Yazdi Y, Li X. Elastography: a quantitative method for imaging the elasticity of biological tissues. Ultrason Imaging 1991; 132: 111–134.
2. Parker KJ, Doyley MM, Rubens DJ. Imaging the elastic properties of tissue: the 20 year perspective. Phys Med Biol 2011; 561: R1–R29.
3. Dudea SM, Giurgiu CR, Dumitriu D, Chiorean A, Ciurea A, Botar-Jid C, Coman I. Value of ultrasound elastography in the diagnosis and management of prostate carcinoma. Med Ultrason 2011; 131: 45–53.
4. Sadigh G, Carlos RC, Neal CH, Dwamena BA. Accuracy of quantitative ultrasound elastography for differentiation of malignant and benign breast abnormalities: a meta-analysis. Breast Cancer Res Treat 2012; 1343: 923–31.
5. Stebbing J, Farouk L, Panos G, Anderson M, Jiao LR, Mandalia S, Bower M, Gazzard B, Nelson M. A meta-analysis of transient elastography for the detection of hepatic fibrosis. J Clin Gastroenterol 2010; 443: 214–9.
6. Varghese T. Quasi-Static Ultrasound Elastography. Ultrasound Clin 2009; 43: 323–38.
7. Wells PN, Liang HD. Medical ultrasound: imaging of soft tissue strain and elasticity. J R Soc Interface 2011; 864: 1521–49.
8. Thomas A, Kummel S, Gemeinhardt O, Fischer T. Real-time sonoelastography of the cervix: tissue elasticity of the normal and abnormal cervix. Acad Radiol 2007; 142: 193–200.
9. Ami O, Lamazou F, Mabille M, Levaillant JM, Deffieux X, Frydman R, Musset D. Real-time transvaginal elastosonography of uterine fibroids. Ultrasound Obstet Gynecol 2009; 344: 486–8.
10. Tessarolo M, Bonino L, Camanni M, Deltetto F. Elastosonography: a possible new tool for diagnosis of adenomyosis? Eur Radiol 2011; 217: 1546–52.
11. Molina FS, Gomez LF, Florido J, Padilla MC, Nicolaides KH. Quantification of cervical elastography: a reproducibility study. Ultrasound Obstet Gynecol 2012; 396:685–9.
12. Dueholm M. Transvaginal ultrasound for diagnosis of adenomyosis: a review. Best Pract Res Clin Obstet Gynaecol 2006; 204: 569–82.
13. Fleiss JL. Statistical methods for rates and proportions (2nd ed). Wiley InterScience, 1981.
14. Hobson MA, Kiss MZ, Varghese T, Sommer AM, Kliewer MA, Zagzebski JA, Hall TJ, Harter J, Hartenbach EM, Madsen EL. In vitro uterine strain imaging: preliminary results. J Ultrasound Med 2007; 267: 899–908.

Figure 1
Uterus
Schematic illustration of the use of real-time (sono) elastography. The probe is used to apply a certain amount of pressure on the uterus causing deformation of the tissue. Deformation due to compression dependents on the tissue stiffness. Deformation in soft tissue is high, whereas in stiff tissue there is little deformation. The change in deformation is color-coded and is superimposed on the corresponding B-mode image. We mostly used the ascending colors color map: dark purple or dark blue indicate harder tissue, green and yellow indicate moderate stiff tissue and orange and red indicate soft tissue.
C’
B’
A’
Uterus
Fibroid
Adenomyosis
Bowel
Uterus
Fibroid
Adenomyosis
Bowel
FORCE
D
C
B
A
D’
C’
B’
A’
D/D’<C/C’< B/B’<A/A’
SOFT
HARD D’
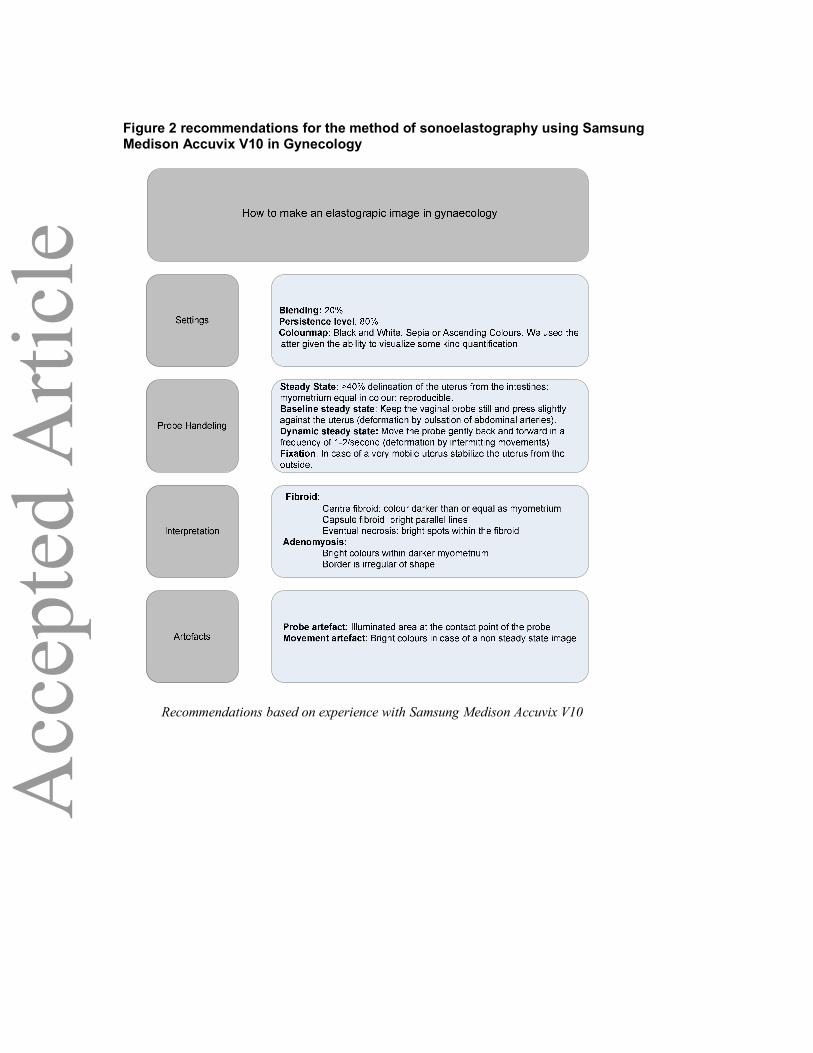
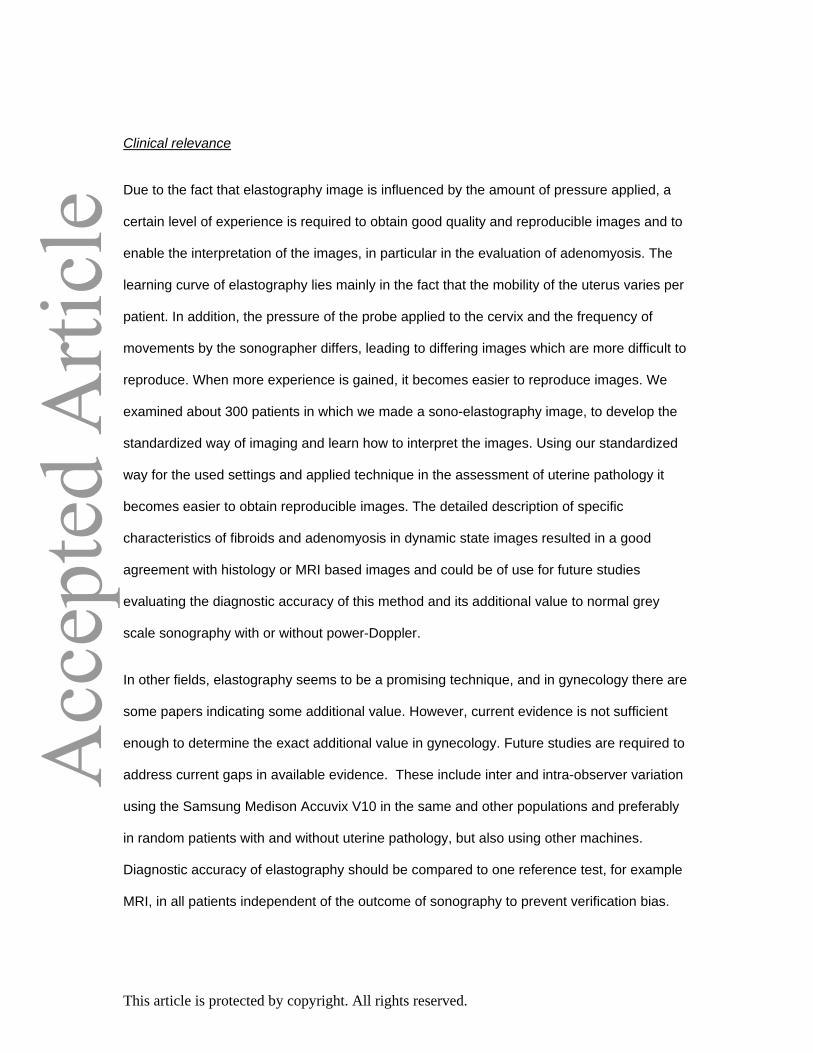
Figure 2 recommendations for the method of sonoelastography using Samsung Medison Accuvix V10 in Gynecology
Recommendations based on experience with Samsung Medison Accuvix V10
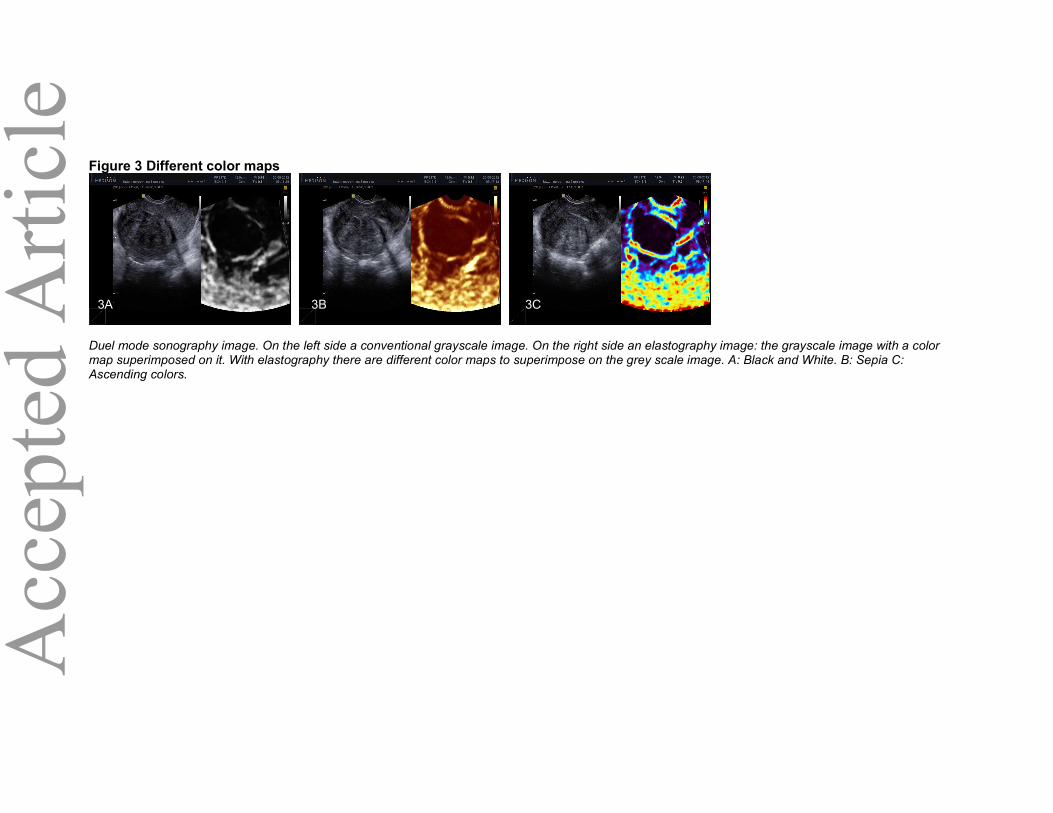
Figure 3 Different color maps
Duel mode sonography image. On the left side a conventional grayscale image. On the right side an elastography image: the grayscale image with a color map superimposed on it. With elastography there are different color maps to superimpose on the grey scale image. A: Black and White. B: Sepia C: Ascending colors.
3B 3A 3C

Figure 4 Steady State
Elastography images illustrating possible artefacts. The corresponding grayscale image is not shown. 5A: Image without a steady state: the lack of linear regular delineation of the serosa indicates that a steady state image is not acquired. The various bright colors should be considered as movement artifacts. After the adjustment of pressure and probe movements a steady state image is acquired in 5B given the clear delineation in the largest part of the serosa by straight lines. Now it becomes clear that the tissue of interest has a relatively high stiffness level as presented by the dark purple colors. A probe artifact (5B) is visible in most elastography images and shows an illuminated area at the point of contact with the ultrasound transducer mimicking softer tissue.
A B
Probe contact
artefacts
Movement
artefacts

FIGURE 5 Baseline and Dynamic steady state
Elastography images of baseline steady state and dynamic steady state images. The corresponding grayscale image is not shown. On the left side (4 A, B, C) the baseline steady state image is shown. On the right side (4 A”, B”, C”) the dynamic steady state of the same region of interest. 4A+A” and 4B+4B”: Intrauterine fibroids. 4C”: Adenomyosis. The baseline steady state does not always have sufficient discriminatory abilities to identify adenomyosis as is demonstrated in 4C.
5A 5A”
5B 5B”
5C 5C”
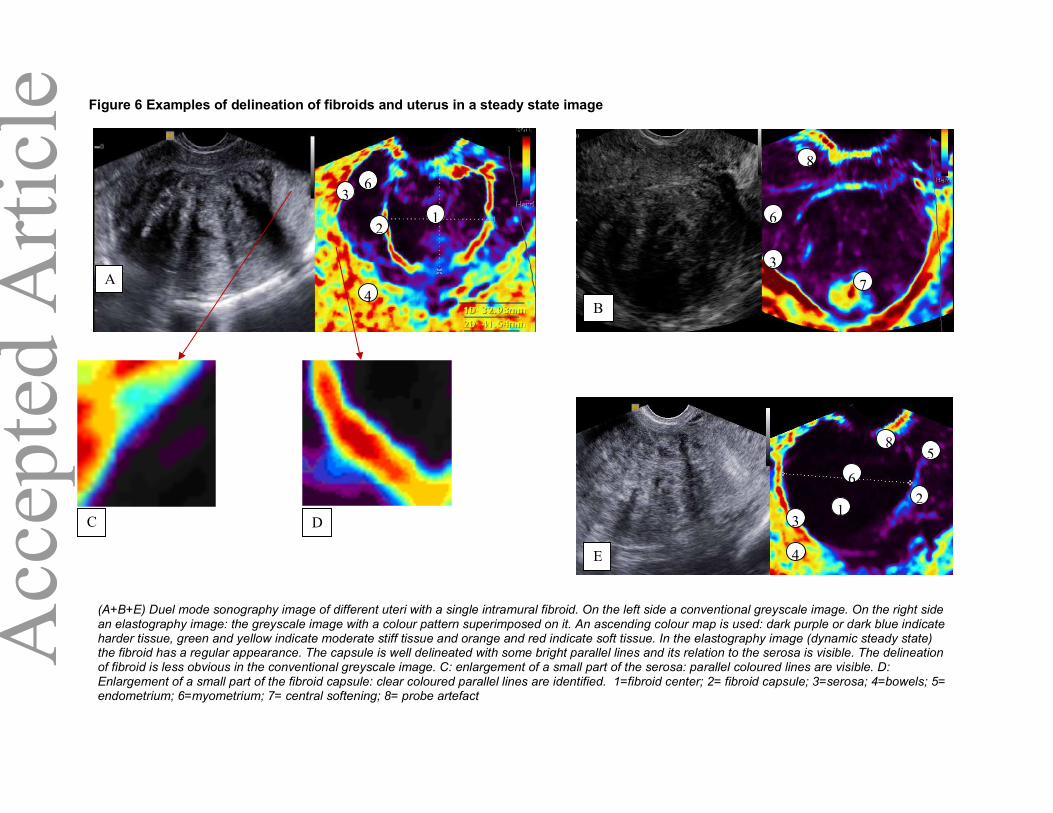
Figure 6 Examples of delineation of fibroids and uterus in a steady state image
1
A
B
D
E
C
1
31
2
4
5
3
1
4
6
7
8
6
3
(A+B+E) Duel mode sonography image of different uteri with a single intramural fibroid. On the left side a conventional greyscale image. On the right side an elastography image: the greyscale image with a colour pattern superimposed on it. An ascending colour map is used: dark purple or dark blue indicate harder tissue, green and yellow indicate moderate stiff tissue and orange and red indicate soft tissue. In the elastography image (dynamic steady state) the fibroid has a regular appearance. The capsule is well delineated with some bright parallel lines and its relation to the serosa is visible. The delineation of fibroid is less obvious in the conventional greyscale image. C: enlargement of a small part of the serosa: parallel coloured lines are visible. D: Enlargement of a small part of the fibroid capsule: clear coloured parallel lines are identified. 1=fibroid center; 2= fibroid capsule; 3=serosa; 4=bowels; 5= endometrium; 6=myometrium; 7= central softening; 8= probe artefact
2
6
8
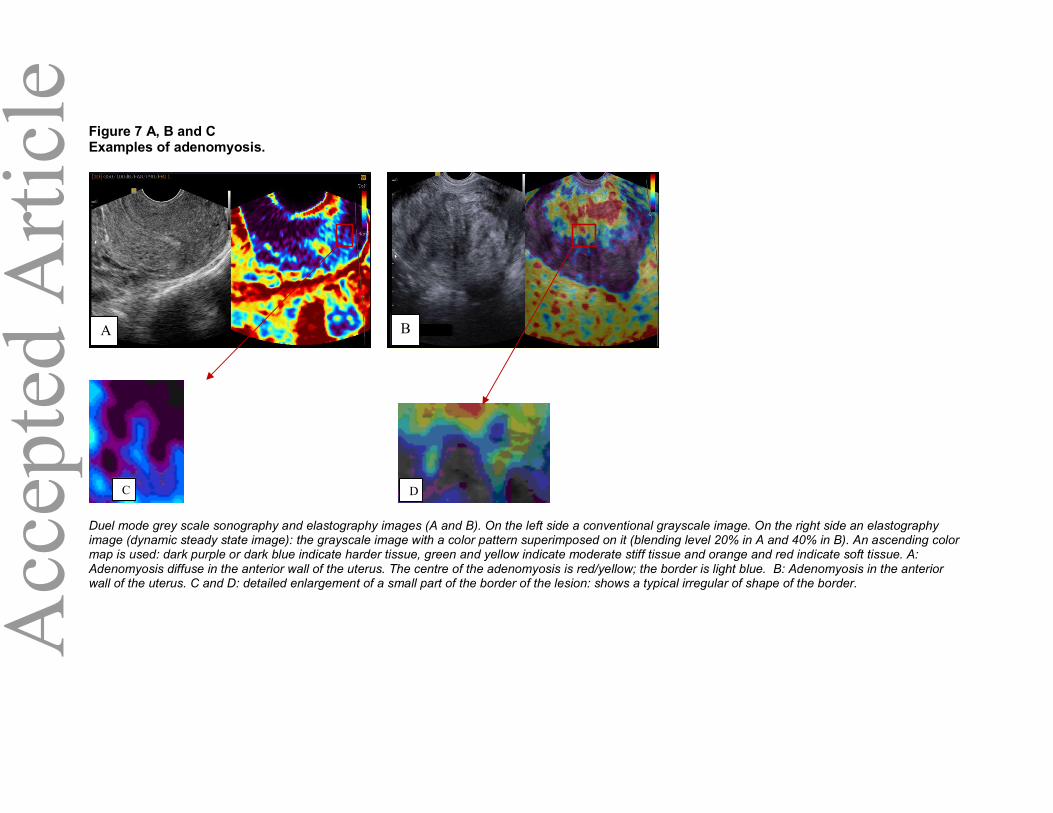
Figure 7 A, B and C Examples of adenomyosis.
Duel mode grey scale sonography and elastography images (A and B). On the left side a conventional grayscale image. On the right side an elastography image (dynamic steady state image): the grayscale image with a color pattern superimposed on it (blending level 20% in A and 40% in B). An ascending color map is used: dark purple or dark blue indicate harder tissue, green and yellow indicate moderate stiff tissue and orange and red indicate soft tissue. A: Adenomyosis diffuse in the anterior wall of the uterus. The centre of the adenomyosis is red/yellow; the border is light blue. B: Adenomyosis in the anterior wall of the uterus. C and D: detailed enlargement of a small part of the border of the lesion: shows a typical irregular of shape of the border.
A B
C D

Figure 8 Example improved fibroid mapping
Duel mode sonography image. On the left side a conventional grayscale image. On the right side an elastography image: the grayscale image with a color pattern superimposed on it, with a blending level of 20%. An ascending color map is used: dark purple or dark blue indicate harder tissue, green and yellow indicate moderate stiff tissue and orange and red indicate soft tissue. On the elastography image three well delineated fibroids are visible with a softer capsule, visualized as a lighter ring. The clear delineation of all individual fibroids is not visible in the conventional grayscale image.

Table 1 Baseline Characteristics of included patients, with histology or MRI as a reference test Characteristics
Total
69 (100)
Demographics Mean age (years ± SD) 42 ± 6,4 ¶ n (%) Nullipara 29 (42) Mean BMI (kg/m2 ± SD) 26.1 ± 5.6 ¶ Reason of visit Dysmenorrhoea 21 (30) n (%) AUB 47 (68) Pain not related with menstruation 23 (33) Other 11 (16)
Received MRI 34%
MRI based diagnosis (%) Fibroid 61
Adenomyosis 3 Fibroid and adenomyosis 9
Received histological examination
88%
Histology based diagnosis (%)
Fibroid Adenomyosis Fibroid and adenomyosis
88 5 3
Type of Surgery Fibroid enucleation 21 (30) n (%) TLH 16 (23) AUE 8 (12) TCRM 13 (19) Other ** 3 (4) BMI= Body Mass Index; AUB= Abnormal uterine bleeding; MRI= Magnetic resonance imaging; # Laparoscopic hysterectomy, vaginal hysteroscopy and abdominal hysterectomy; ¶Mean± Standard Deviation **Other= Diagnostic laparoscopy, diagnostic hysteroscopy

Table 2 Elastographic characteristics of uterine fibroids and adenomyosis**, based on their MRI or histology diagnosis
MRI or histology based diagnosis
Fibroids n (%)
Adenomyosis n (%)
p
Conclusion
Total 55 (100) 11 (100)
Uniform in shape 45 (79) 0 (0) <0.01 Fibroid: Uniform in shape Adenomyosis: irregular shape
>50% uniform in color 50 (88) 0 (0) <0.01 Fibroid: >50% uniform in color Adenomyosis: <50% uniform in color
Color centre versus Color myometrium
• Darker 14 (25) 0 (0) <0.01 Fibroid: mostly centre darker or equal to myometrium Adenomyosis: centre lighter then myometrium
• Equal 40 (70) 0 (0) <0.01
• Lighter 2 (3) 10 (90) <0.01 Local area of softer tissue in the fibroid 24 (42) - -
Ascending colors capsule/border from inside out?
Purple � dark blue � light blue (� yellow � red)
yellow � green � light blue
Fibroid: capsule brighter at border Adenomyosis: border darker then centre
Clear border/capsule 55 (96) 2 (18) <0.01
Fibroids: most have a clear capsule Adenomyosis: only minority have a visible border.
Regular capsule 24 (42) 1 (9) <0.01 Fibroids: regular capsule in 50% Adenomyosis: irregular border
Mean number of lines capsule (range) 5.3 (1-13) 1.5 (0-2) -
Fibroid: Capsule ≥ 5 lines Adenomyosis: Border 1-2 lines
* Patients with MRI or histology based diagnosis of fibroids or adenomyosis, characteristics were only assessed in dynamic steady state images.

Table 3 Agreement in diagnosis based on elastography, MRI and Histology Elastography based diagnosis
MRI based diagnosis Histology based diagnosis
Fibroids Adenomyosis Other* Fibroids Adenomyosis Other*
Fibroids 16 0 0 54 0 0
Adenomyosis 0 4 2 0 7 0
The agreement between the diagnosis of fibroids and adenomyosis made by MRI or histology compared with elastography. *Other = polyps