the utility of patent indicators for evaluation the
TRANSCRIPT

Aug. 2004Nr.22
TOPIC Patents & Evaluation
The Utility of Patent Indicators forEvaluationUlrich Schmoch
The Internationalisation of InnovativeActivities in AustriaBernhard DachsAndreas Schibany
Book Review Shapira / Kuhlmann: "Learning from Science and Technology Policy Evaluation"Anton Geyer
BUNDESMINISTERIUM FÜR BILDUNG, WISSENSCHAFT UND KULTUR, Minoritenplatz 5, A -1014 WienMag. Markus Pasterk [email protected] Suda [email protected]
ZIT – Zentrum für Innovation und Technologie GmbH,Ebendorferstrasse 4/DG, A-1010 WienRobert [email protected]
BUNDESMINISTERIUM FÜR VERKEHR, INNOVATION UND TECHNOLOGIE, Renngasse 5, A-1010 WienDr. Rupert Pichler [email protected]
JOANNEUM RESEARCH, Institut für Technologie- und Regionalpolitik, Wiedner Hauptstraße 76, A-1040 WienMag. Wolfgang Polt [email protected] Mag. Klaus Zinöcker [email protected]
ARC Systems Research, 2444 Seibersdorf Mag. Petra Wagner [email protected]
TECHNOPOLIS,Prinz Eugen Straße 80/12, A-1040 WienMag. Leonhard Jö[email protected]
TECHNOLOGIE IMPULSE GESELLSCHAFT TIG,Grillparzerstr. 7/8, A-1010 WienDr. Dorothea Sturn [email protected]
ÖSTERREICHISCHES INSTITUT FÜR WIRTSCHAFTSFORSCHUNG, PF 91, A-1103 WienMag. Hannes Leo [email protected]
WWTF – Wiener Wissenschafts-, Forschungs- und Technologiefonds,Währinger Straße 3 / 15a, A-1090 WienDr. Michael [email protected]
BUNDESMINISTERIUM FÜR WIRTSCHAFT UND ARBEIT, Stubenring 1, A-1010 WienMag. Wolfgang Neurath [email protected]
FWF-Fonds zur Förderung der wissenschaftlichen Forschung, Weyringergasse 35, A-1040 WienDr. Rudolf Nowak [email protected]
KMU Forschung Austria, Gusshausstrasse 8, A-1040 WienDr. Sonja Sheikh [email protected]
FFF-Forschungsförderungsfonds für die Gewerbliche Wirtschaft,Kärntnerstraße 21-23, A-1015 WienMag. Klaus Schnitzer [email protected]

no.2208.04
1
Rupert Pichler Klaus Zinöcker
Preface
Patents are an intellectual property right issued by authorized bodies to inventors to make use of and exploit their inventions for a limited period of time. A patent is thus a policy instrument intended to encourage the making of inventions as well as to procure information about the invention for the rest of the industry and the public generally.
The major patent offices, like the US Patent and Trademark Office (USPTO) or the European Patent Office (EPO) report a significant increase in the total number of patent applications over the last two decades. As patents are a key measure of innovative output, patent-based indicators are probably the most frequently used indicators of technology output. No national or international S&T report without a section on patents. And the scientific literature increasingly uses patent statistics as an important output indicator for innovative activities because the close relationship between patents and innovative output is widely recognised and also because patents are such a rich source of information. This makes patent data highly interesting for evaluation purposes.
There is no standard method of using or calculating indicators from patent data, often resulting in divergent analytical and political lessons that can be drawn from these exercises. Ulrich Schmoch discusses the general methodological framework of patent indicators in the first paper of this issue. The use of patent statistics in the context of evaluations requires considerable expertise. Ulrich Schmoch discusses the advantages of patent indicators for ex-post, in-time as well as ex-ante evaluations of publicly
subsidised technology programmes. However, he also indicates the limits of the use of patent data due to the time lag between the start of a programme and the first possibility to analyse relating patent activities. Patent data are nevertheless an useful instrument for an assessment of the status-quo and the potential development of a technology.
The use of patent statistics as an indicator for internationalisation of R&D is discussed by Dachs and Schibany. Patterns of internationalisation can be derived by using two types of information available in patent files: the address of the applicant(s) and the address of the inventor(s). Using the indicator of trans-border ownership of patents shows that internationalisation of R&D is not a one-way process, or even 'sell-out' of the intellectual capital of a country. Internationalisation also includes the use of the knowledge developed elsewhere - a fact that is frequently missed in the anti-globalism debate. Therefore, the papers in this edition of the newsletter present new and sophisticated approaches to the use of patenting as an innovation indicator and call for a more differentiated interpretation.
Authors Dr. Rupert Pichler BMVIT - Federal Ministry for Transport, Innovation and Technology A-1010 Vienna, Renngasse 5 Phone: +43 1 53464-3205 [email protected]
Mag. Klaus Zinöcker Joanneum Research & Plattform Forschungs- und Technologieevaluierung A-1040 Vienna, Wiedner Hauptstraße 76 Phone: +43 1 581 75 20-2827 [email protected] www.fteval.at

no.22 08.04
2
INTRODUCTION
Evaluation analyses of research and technology programmes are largely based on surveys at the evaluated institutions or programme participants. Thus such evaluations heavily rely on self-assessment with all problems of the subjectivity implied. Against this background, there is considerable demand for objective measures in evaluation. This article will examine whether and to which extent patent indicators can be used for evaluation purposes.
In the context of innovation, most evaluation studies examine the performance of programmes, supporting research and development. The evaluations are made at the end of the programmes with the purpose to analyse the effectiveness of the instruments applied (summative evaluation) and to support the conception of follow-up programmes. This type of evaluation is called ex post evaluation. Other evaluation studies start in parallel with programme activities in order to steadily observe the intermediate results for adjusting the support instruments to changing circumstances or for avoiding critical situations. This type of analysis is called in time, accompanying or formative evaluation. A third type of evaluation refers to the assessment of the basic assumptions of a projected programme. For instance, it is analysed whether the target groups of the programme really need external support or whether the technology area concerned will
develop in a dynamic way. This type of evaluation is called ex ante evaluation. In recent years, an increased interest for this
type of evaluation can be observed (Kuhlmann and Holland 1995: 233 ff; Kuhlmann 2003).
Evaluation can refer not only to programmes, but also to the performance of individual researchers, research institutions, firms, or even whole countries. This paper will focus on the utility of patent indicators for programme evaluation; many observations can be easily transferred to other evaluation targets.
In the first part, this paper briefly addresses general methodological issues of patent indicators. Then, the use of patent indicators for ex post and in time evaluation is discussed in more detail. In the third section, the potential of patent analyses in the context of ex ante analyses is shown by some examples.
METHODOLOGY OF PATENT ANALYSES
The appropriate use of patent indicators for measuring performance in technology and innovation requires considerable expertise. In this paper, it is not possible to address the complex methodology in more detail. In the present context, it is sufficient to know that patent indicators primarily refer to the output of applied research and development in contrast to publication indicators with a focus on science. As patent applications are quite costly, patents are primarily taken out by firms with distinct interests in commercial exploitation. The major methodological problems are different patent intensities by applicants and technologies. The differences in the behaviour of applicants are owing to their specific patent application policies. The differences of patent intensities by technology are due to specific technical characteristics. For instance, for innovations in mechanical engineering and chemistry, the necessary investments are quite different as well as the related markets, leading to different patent protection strategies.
Ulrich Schmoch
The Utility of Patent Indicators for Evaluation

no.2208.04
3
It is important to select an appropriate office of reference, because this choice has relevant impact on the findings (cf. Hinze and Schmoch 2004). In the European context, the analysis of European and international applications has proved to be a suitable tool. These applications are published quite early, 18 months after their first application, and are available through electronic databases at this time. Furthermore, the distribution of patent applications by country is quite balanced and reflects the distribution of other innovation indicators such as industrial research in an appropriate way. Many scholars use patents at the United States Patent and Trademark Office (USPTO), because the US market is the largest world market. However, the analysis of US patents has some relevant disadvantages. US applicants dominate US patents, an effect which is called domestic advantage, so that country comparisons are less meaningful. Furthermore, US patents are traditionally published at the time of grant which is quite late with reference to the first application date. In the year 2000, the US system was partly adapted to the European publication practice. But in the present situation appropriate analyses are extremely difficult due to the overlap of the two different publication regimes.
An important advantage of patent analysis is the broad coverage of the innovative actors. According to a recent survey in Germany, firms patent 75% of their patentable inventions (Blind
et al. 2003). Thus, samples of patent analyses are generally much larger than survey-based samples of firms.
PATENT INDICATORS FOR EX POST AND IN TIME EVALUATION
As to the use of patent indicators for programme evaluation, it is necessary to look at the timing of different programme steps and their reference to patent applications. In general, a support programme starts with a call for application and after that the selection of qualified participants. As a consequence, a time lag of about one year between the start of the programme and the start of the referring research activity can be generally observed (Figure 1). First research results can be expected at about one year after the start of the research activities, this implies a further time lag. If the outcome of the research is directly applied for a patent, we have to wait further 18 months until the applications are published and registered in databases. All in all, the time lag between the start of the programme and the possibility to analyse referring patents is considerable. Directly at the end of a programme, it is not possible to analyse the total output of a programme and to use the results of the patent assessment for the conception of follow-up programmes. Therefore, patent analysis cannot cover the need of immediate, in time information. However, for programmes with a length of more than five years, it can provide relevant information at least on the first stages.
Figure 1: Stages of innovation programmes and referring stages of patent applications
programme duration
sponsored projects
project results
patent applications
patent publicationstime (years)0 1 2 3 4 5 6 7 8
programme duration
sponsored projects
project results
patent applications
patent publicationstime (years)0 1 2 3 4 5 6 7 8 time (years)0 1 2 3 4 5 6 7 8
Source: Grupp et al. (1991)
no.22 08.04
4
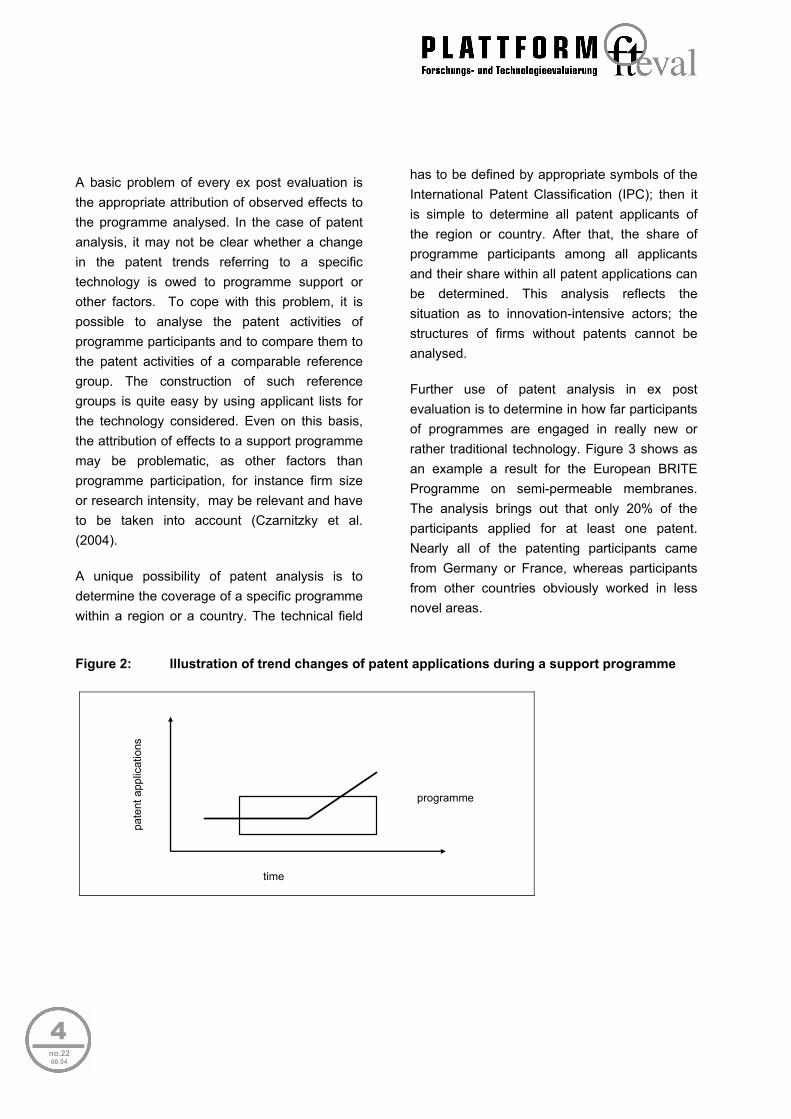
A basic problem of every ex post evaluation is the appropriate attribution of observed effects to the programme analysed. In the case of patent analysis, it may not be clear whether a change in the patent trends referring to a specific technology is owed to programme support or other factors. To cope with this problem, it is possible to analyse the patent activities of programme participants and to compare them to the patent activities of a comparable reference group. The construction of such reference groups is quite easy by using applicant lists for the technology considered. Even on this basis, the attribution of effects to a support programme may be problematic, as other factors than programme participation, for instance firm size or research intensity, may be relevant and have to be taken into account (Czarnitzky et al. (2004).
A unique possibility of patent analysis is to determine the coverage of a specific programme within a region or a country. The technical field
has to be defined by appropriate symbols of the International Patent Classification (IPC); then it is simple to determine all patent applicants of the region or country. After that, the share of programme participants among all applicants and their share within all patent applications can be determined. This analysis reflects the situation as to innovation-intensive actors; the structures of firms without patents cannot be analysed.
Further use of patent analysis in ex post evaluation is to determine in how far participants of programmes are engaged in really new or rather traditional technology. Figure 3 shows as an example a result for the European BRITE Programme on semi-permeable membranes. The analysis brings out that only 20% of the participants applied for at least one patent. Nearly all of the patenting participants came from Germany or France, whereas participants from other countries obviously worked in less novel areas.
Figure 2: Illustration of trend changes of patent applications during a support programme
pate
nt a
pplic
atio
ns
time
programme

no.2208.04
5
Figure 3: Share of participants with and without patents within the BRITE programme of the European Commission (reference: all participants)
0
10
20
30
40
DE FR GB NL BE IT DK GR ES LU IE PT Total
perc
ent
participants without patentsparticipants with patents
Source: Schmoch et al. (1993)
PATENT INDICATORS FOR EX ANTE EVALUATION
A major potential, but largely neglected of patent indicators for evaluation is the use for ex ante analysis. By patent indicators, it is possible to assess the strategic position of a region or a country at the starting point of an intended programme in order to assess its appropriateness. As electronic databases record many characteristics of patent applications, different types of analysis are possible:
• comparison of countries for a specific observation period
• calculation of specialisation profile • determination of main actors in a specific
field • determination of international cooperation • determination of the relevance of specific
target markets, for instance, national
European markets compared to the US or the Japanese market
• analysis of the stage of development of a specific technology
The first two and the last aspect will be explained in more detail. Figure 4 illustrates country comparisons by the example of genetic engineering in the observation period from 1996 trough 2000. The leading position of the United States may be expected by experts, but the patent analysis, however, shows a slow catching-up process of the EU countries. The most surprising result is the enormous increase of other countries since 1998 which reach the level of EU countries in the year 2000. A further breakdown by country shows that this is primarily owing to the patent activities of China.

no.22 08.04
6
Figure 4: PCT and direct EPO applications in genetic engineering
0
500
1000
1500
2000
2500
3000
1996 1997 1998 1999 2000
year
appl
icat
ions USA
JPEUEU Assoc.Other
Source: Noyons et al. (2003: 99)
The calculation of specialisation profiles is illustrated by the example of Germany (Figure 5). The specialisation index compares the shares of a specific country in a technology area compared to the world-wide average share of this technology. The exact formula is as follows:
RPAij = 100 tanh ln [(PATij / ∑i PATij) / (∑j PATij / ∑ij PATij)]
Therein, PATij denotes the number of patents of a country I in the technology area j. By the logarithm, a symmetric range with the neutral point 0 is introduced. The tangens hyperbolicus limits the range of values to ±1. The factor 100 is introduced for improved graphical representation. Indices above +15 can be considered as specialised above average, indices below -115 as specialised below average.
In the German profile, a clear orientation on transport is visible which even
increased during the 1990s, whereas in contrast, the orientation on micro-electronics and associated technologies was quite weak (Figure 5). Similar specialisation profiles can be calculated for subfields of a specific technology as well in order to determine in which way a projected programme should be focussed.

no.2208.04
7
Figure 5: Specialisation profile of Germany based on EPO applications
-80 -60 -40 -20 0 20 40 60 80
Chemical industry
Pharmaceuticals
Mechanical engineering
Office machines, computers
Electrical engineering
Electronics
Medical techn., instruments
Vehicles
Other transport
Other sectors
RPA index
1995-19971999-2001
Source: BMBF (2004: 506) with data provided by Fraunhofer ISI
For investigating the state of development of a specific technology, patents allow for a long-term observation of trends. This is feasible on the basis of the so-called European Patent Classification by which applications of former years are steadily reclassified according to the present status. For instance, it is possible to look at first patent activities in biotechnology already at the beginning of the 20th century. At that time, precursor versions of biotechnology were used for beer brewing.
Looking at the patent applications in robotics between 1970 and 2000, that is for a period of 30 years, we find a very characteristic curve for
complex, knowledge-based technologies (Figure 6). After the detection of the basic elements, the permanent increase of the patent application numbers can be observed, which is linked to considerable expectations in robotics. This early stage could be labelled euphoric. In the next stage, considerable problems to realise this technology appear, linked to a more realistic assessment of the perspectives. Many actors decided to give up their activities inducing a decrease of the application numbers. Then the crucial problems are solved and a second increase of the applications takes place. This development of complex technologies is not a strict law, but can be observed in many cases.

no.22 08.04
8
Figure 6: Long-term development of EPO applications in robotics
0
20
40
60
80
100
120
140
160
180
70 71 72 73 74 75 76 77 78 79 80 81 82 83 84 85 86 87 88 89 90 91 92 93 94 95 96 97 98 99 00year
num
ber
Appropriate stage for support of private research
Approproiate stage for support of public research
Source: PLUSPAT (Quest-Orbit)
Rickerby and Matthews (1991) already observed this phenomenon in a qualitative way for the area of surface technology. Schmoch (1993) showed this curve for laser technology and polyimides on a quantitative basis. The consultant office Gartner pointed to this characteristic development in the context of information technology since 1995 and called it 'hype cycle' with a focus on unrealistic expectations in the first increase stage. In contrast to this focus, it seems to be more appropriate to call this sequence of stages 'double boom cycle' which draws the attention to the second increase stage with substantial market return.
In the context of the conception of support programmes, it is interesting to look at such long-term developments for an improved assessment of the actual stage. The first increase stage is appropriate for primarily supporting public research institutions. In the following decrease stage, the support of applied research institutions and firms is more suitable. In the second increase stage, the development is generally self-
sustaining, so that public support programmes are less important.
As the double boom is not a strict law applying to all cases, it is still difficult to foresee the future development of a specific area. But the analysis of long-term trends clearly shows that the development of complex technologies generally takes much longer than ten years. Looking at technologies and not products, cycle lengths of 30 or even 50 years are normal, even in the present situation where many experts claim an acceleration of development cycles. A second result is that the boom of a new complex technology may be interrupted by an intermediate recession which should not be interpreted as a complete failure of public support. Rather, it is necessary to follow interesting technologies with more patience. Finally, it may be helpful to steadily observe boom technologies of former periods in order to look for a potential of second boom stages. A good indicator is that several actors are still active in a technology, although a distinct decrease of applications can be observed some years ago.
In any case, the standard assessment of technology activity based on simple growth rates

no.2208.04
9
is often not sufficient. This approach starts from the classic S curves which cannot be assumed for complex technologies. Therefore, the observation of decreases should not automatically lead to an exclusion of this technology from further public support.
This knowledge on the typical development of complex, science-based technologies can be used for the conception of support programmes by public bodies or foundations. If the strengthening of a certain area, say organic chemistry or telecommunications, is intended, this area can be broken down into 20 to 30 sub-fields based on groups or sub-classes of the International Patent Classification. For these sub-fields, the long-term trends can be investigated and classified according to typical development paths and the present stage of development. This allows for a first selection of interesting fields. In a second step, it is possible to ask experts to interpret the different trends of growth or decrease in view of potential bottlenecks or opportunities. In any case, the conception of a programme is based on improved information and is more rational than to exclusively rely on expert advice which may be biased.
CONCLUSIONS
To summarise, patent indicators should be used with caution in the context of ex post and in time evaluation because of the considerable time lag between the programme activities and the related patent output. But it is still possible, already in an early stage, to determine its breadth of coverage and to categorise the participants according to their orientation on new technology. In any case, patent indicators are useful for application-oriented programmes with a length of at least five years.
Patent indicators are an interesting instrument in ex ante evaluation, that is, the assessment of the status and the potential development of a
technology area which the planned programme aims at. In this context it is helpful, that patent indicators provide broad samples of innovative firms and various dimensions of disaggregation. For ex ante evaluation, it is possible to provide country comparisons, specialisation indices, or indicators of international cooperation or destination markets. A most interesting aspect is the long term analysis of patent applications in order to describe the present stage of development of complex technologies within double boom cycles.
REFERENCES
Blind, K., Edler, J., Frietsch; R., Schmoch, U. (2003): Erfindungen kontra Patente. Karlsruhe: Fraunhofer ISI.
BMBF (2004): Bundesbericht Forschung 2004. Berin / Bonn: BMBF.
Czarnitzki, D., Ebersberger, B., Fier, A. (2004): The relationship between R&D collaboration, subsidies and patenting activity; empirical evidence from Finland and Germany. ZEW discussion paper. Mannheim: ZEW, forthcoming.
Grupp, H., Schmoch, U., Kuntze, U. (1991): Patents as potential indicators of the utility of EC research programmes, in: Scientometrics, Vol. 21, No. 3, 417-445.
Hinze, S., Schmoch, U. (2004): Opening the black box. Analytical approaches and their impact on the outcome of statistical patent analyses, in: Moed, H., Glänzel, W., Schmoch, U. (eds.), Handbook of Quantitative Science and Technology Research. The Use of Publication and Patent Statistics in Studies on S&T Systems. Dordrecht: Kluwer, forthcoming.
Kuhlmann, S. (2003): Evaluation as a source of 'strategic intelligence', in: Shapira, P., Kuhlmann, S. (eds.), Learning from science and technology policy evaluation. Cheltenham, Northampton: Edward Elgar, 352-379.
Kuhlmann, S., Holland, D. (1995): Evaluation von Technologiepolitik in Deutschland. Heidelberg: Physica.
Moed, H., Glänzel, W., Schmoch, U. (eds.)

no.22 08.04
10
(2004): Handbook of Quantitative Science and Technology Research. The Use of Publication and Patent Statistics in Studies on S&T Systems. Dordrecht: Kluwer, forthcoming.
Noyons, E.; Buter, R.K.; van Raan, A.F.J., Schmoch, U., Heinze, T., Hinze, S., Rangnow, R. (2003): Mapping excellence in science and technology across Europe. Life sciences. Leiden: University of Leiden
Rickerby, D.S., Matthews, A. 1991: Market perspectives and future trends, in: Rickerby, D.S., Matthews, A. (eds.), Handbook of surface engineering. Glasgow/London, 343-364.
Schmoch, U., Grupp, H., Kuntze, U. (1993): Patents as indicators for the utility of EC research programmes. 2 volumes. Brussels: European Commission.
Schmoch, Ulrich (1993): Tracing the knowledge transfer from science to technology as reflected in patent indicators, in: Scientometrics, Vol. 26, No. 1, 193-211.
Author Ulrich Schmoch Fraunhofer Institut für Systemtechnik und Innovationsforschung (ISI) Breslauer Straße 48 76139 KARLSRUHE Phone +49 721 6809- [email protected] www.isi.fhg.de/

no.2208.04
11
INTRODUCTION
This paper measures the internationalisation of research and development (R&D) activities in Austria with patent data. It draws on a study undertaken by the policy consulting programme TIP on behalf of the Austrian Ministry of Transport, Innovation and Technology and the Austrian Ministry of Education, Science and Culture (Schibany an2003).
We will first briefly discuss the internationalisation of innovative activities in Austria and present the questions we want to answer in this paper. We will then explain the indicators used. The subsequent sections present our findings and sum up the results.
BACKGROUND
The continued internationalisation of economic activity is a distinctive feature of the world economy since the 1960s (Michie 2003). One important aspect of this development is the growing internationalisation in the generation and application of scientific and technological knowledge. This includes, among others, an increasing collaboration between enterprises, universities, and other research institutes, a higher mobility of researchers and students, and a trend towards a more intense policy coordination. Multinational enterprises (MNEs) play a key role in the internationalisation of science and technology by locating research and development facilities abroad. They do this for a number of reasons (Kuemmerle 1999; Narula and Zanfei
2004): First, to improve the way in which existing assets are used in different countries, to adopt existing products and services to local needs, consumer tastes, regulation etc. Second, MNEs go abroad to absorb new knowledge a strategy which has been described as ‘global sourcing’ of technology. A main source of this new knowledge are local spillovers which firms try to capture through geographical proximity to universities, clusters or single innovative enterprises. A third motive, very present in recent policy discussions, is the exploitation of wage differences for scientists and engineers between the MNE’s home countries and Eastern Europe and Asia.
Recent policy discussions about outsourcing may suggest that the main movement in the internationalisation of science and technology goes from Western Europe and the US towards India and China. However, also small European countries like Austria have been gaining substantially from this development in recent years. From the mid 1990s on the financial contribution of foreign sources to Austria’s gross domestic expenditure for research and development (GERD) soared from 107 Mio € (1994) to 1.13bn € in 2004. Today, every fifth Euro that is spent on R&D in Austria comes from sources from abroad, mainly from MNEs who finance R&D activities of their Austrian affiliates (Statistik Austria 2004).
Questions
The numbers presented above are impressive, but they represent only one side, the input side of innovative activities. Internationalisation, however, can also be measured in the output of innovative activity, in patent data1. Patent specifications name the applicant who is also the owner of the patent and the inventors. If a growing share of
1Schmoch discusses the advantages and disadvantages of patents as a measure of innovative activity in this issue of the fteval newsletter.
Bernhard Dachs Andreas Schibany
The Internationalisation of Innovative Activities in Austria Measured by Patent Data

no.22 08.04
12
R&D is financed by sources outside of Austria, we may also suspect that a growing share of patents based on inventions made in Austria is owned by organisations abroad.
By analyzing trans-border ownership of patents we want to answer three questions:
• How does the trans-border ownership of patents develop over time? Do we find internationalisation patterns similar to those in financing also in the patent data?
• To what degree is the Austrian System of Innovation internationalized compared to other countries?
• Is there evidence for R&D activities of Austrian companies on locations abroad, esp. in the Central and Eastern European Countries (CEEC)?
INDICATORS AND DATA
Patents have one distinctive feature that makes them very useful for the analysis of international technology flows: Each patent includes the applicant’s as well as the inventor’s country of residence. If the inventor’s and the applicant’s country differ, e.g. when a certain patent is invented by an Austrian resident and applied by a company located in Germany, we speak of trans-border ownership of a patent. This may be the case if a patent is the result of a co-operation with universities; in most of the cases, however, these patents are invented at research labs of MNEs abroad and applied for at the headquarter of the company.
Following Guellec and van Pottelsberghe de la Potterie (2001), we define two indicators for the measurement of trans-border ownership of patents2:
2 In contrast to Guellec and van Pottelsberghe de la Potterie (2001) we label the two indicators active and
Passive trans-border ownership of patents (passive TOP) refers to the number of patents which are granted to applicants from abroad and which have at least one Austrian inventor3 divided by the total number of Austrian patent inventions:
∑∑≠=
iiAT
ATiiAT
P
PTOPpassive
whereas iATP denotes all patents invented by
Austrians4 and owned by organisations regardless of their location.
Active trans-border ownership of patents (active TOP), in contrast, refers to the number of patents owned by Austrian organisations with at least one foreign inventor divided by the total number of patents owned by Austrians:
∑∑≠=
jATj
ATjATj
P
PTOPactive
whereas ATjP denotes all patents owned by
Austrian organisations regardless of the residence of the inventor.
The two indicators are calculated with patents filed at the European Patent Office (EPO) over the period 1978 – 2001. We derived the data from a database provided by the OECD. The dates refer to the priority
passive TOP instead of SHIA and SHAI to follow the terminology in foreign direct investment. 3 The database we use counts patent with several inventors residing in different countries fractionally. 4 Please note that the term ’Austrian’ does not refer to the nationality, but to the residence of the inventor. A Swiss researcher working in Austria, for example, will be counted as Austrian.

no.2208.04
13
date of the patent application, this is the first filing of the patent application worldwide, and should therefore best reflect the date of the invention.
RESULTS
Development over time
Our results show that both, active and passive TOP, remained rather stable during the 1980s and started to rise in the mid-1990s (see Chart 1). The strongest increase in foreign ownership can be found between 1992 and 1997. This pattern is similar to R&D financing by foreign sources, which took off in the second half of the 1990s and then stabilized at the end of the 1990s on a high level.
For the period 1998-2001, we find that 36% of all patents with the participation of at least one Austrian inventor are owned by organisations from abroad. This is higher than the overall share of R&D financed by foreign sources, but fits quite well with the financing figures of the enterprises sector where 30% of R&D expenditure are
financed from abroad in 2004. Moreover, the numbers seem to provide an even more realistic picture if we take into account that R&D of Austrian affiliates is not only financed by money transferred from the headquarter to the affiliate but also by the affiliate’s own means.
Our analysis also shows that Austrian enterprises increasingly patent inventions made abroad: the share of all patents with at least one foreign inventor owned by Austrian firms doubled from 10 to 20% in the last 20 years. This points to the fact that the internationalisation of the Austrian System of Innovation is not a one-way process, or even a ‘sell-out’; Instead, the competitiveness of Austrian firms and the protection of Austrian jobs is increasingly based on knowledge developed elsewhere, a fact that is frequently missed by anti-globalists.
Chart 1: Development of active and passive TOP, 1980-2001, EPO patents, application date, three year averages
0%
5%
10%
15%
20%
25%
30%
35%
40%
1978
-80
1979
-81
1980
-82
1981
-83
1982
-84
1983
-85
1984
-86
1985
-87
1986
-88
1987
-89
1988
-90
1989
-91
1990
-92
1991
-93
1992
-94
1993
-95
1994
-96
1995
-97
1996
-98
1997
-99
1998
-00
3-year average
as %
of a
ll Au
stria
n pa
tent
app
licat
ions
or i
nven
tions
active TOPpassive TOP
Source: EPO, OECD, own calculation

no.22 08.04
14
International comparison
Our results show that the level of internationalisation of the Austrian System of Innovation is high compared to other countries. With regard to foreign ownership of domestic inventions (passive TOP), Austria is well above the EU 15 average and in front of most EU members (see Chart 2). EU member countries with an equal or higher share of foreign ownership of home-based inventions than Austria are Ireland, Portugal, Belgium, Luxembourg and the UK. Moreover, we also find some of the new member states of the EU like the Slovak Republic, Poland, Hungary and the Czech Republic among the highest internationalized countries with respect to patent ownership. However, it should be noticed that the numbers for the new member countries are all based on a quite small number of patents and one single firm may have a disproportionate effect. These countries have a considerable higher number of patent inventions than applications at the EPO, a clear indicator for a lack of MNEs. Countries with a number of headquarters of MNEs, on the other side, are characterised by high active TOPs. The highest share of patent ownership on foreign inventions is found in Luxembourg Switzerland, the Nether-lands and Sweden.
The data also suggests that small countries seem to be more internationalized both in terms of higher active as well as passive TOPs than large countries. This observation corresponds with the higher internationalisation of small countries in trade and foreign direct investment.
Moreover, the individual shares of many countries can be explained by geographical and social factors, like the existence of one larger trade partner or a common language, although the hypothesis is not tested in this paper. Cultural proximity to the US may be the reason
for the high levels of passive TOPs in Ireland and the UK, the same is true for
Austria and the Benelux countries. In the case of Finland, we may assume that the relatively small degree of passive TOPs may the result of the geographical location and the absence of a larger country with common language, as in the Austrian case.
Chart 2: International comparisons of active and passive TOPs, EPO patents, application date, 1998-2000 average
0% 20% 40% 60% 80% 100%
JP
FI
EU15
US
DE
SE
IT
FR
NL
DK
CH
ES
GR
AT
UK
IE
PT
CZ
BE
HU
PL
LU
SK
as % of all patent applications or inventions
active TOPpassive TOP
Source: EPO, OECD, own calculations
Partner countries in international trans-border patent activities
A closer look at the partner countries of Austria in active and passive TOPs supports the assumption that cultural, together with geographical proximity, may result in a higher level of trans-border patent activity. Most of the active as well as the passive TOPs exist between Austria and Germany (see Chart 3). The second important partner country is Switzerland, followed by Liechtenstein. Other important partners in trans-border patent activity

no.2208.04
15
are the United States, France, Italy, and the United Kingdom, but none of them comes close to Germany’s position. The gap between the number of Austrian patent inventions hold by German (Ø 244; 1998-2000) and by Swiss companies (Ø 61; 1998-2000) illustrates the outstanding role of German companies in the Austrian System of Innovation.
Measured by active TOPs, Germany is also the preferred target country for research and development facilities of Austrian enterprises. Between 1998 and 2000, we find on average 80 patents per year that are owned by Austrian organisations and developed by at least one German-based inventor.
Countries in Central and Eastern Europe, on contrary, have only very little trans-border patent activities with Austria. This is somewhat surprising, given the large amount of Austrian active FDI in these countries. Austria is the fourth largest investor in the CEEC, and accounts for about 40% of the FDI in Slovenia, 25% in Croatia, 15% in Slovakia and 10% in the Czech Republic and Hungary (Hunya and Stankovsky 2003). These investments however, have not led to trans-border patents. Therefore, we may conclude that by now Austrian FDI in these countries mainly has a pure production character (because of the cost advantages of CEEC) or takes place in sectors with a low propensity to patent like the banking sector.
This finding is in contrast to the results of Marin (2004) who reports that “multinational firms in Germany and Austria are outsourcing the most skill intensive activities to Eastern Europe taking advantage of cheap abundant skilled labour in Eastern Europe” (Marin 2004). Moreover, we also find no evidence for a larger relocation of R&D activities from Austria to India or China.
Chart 3: Partner countries of Austria in trans-border patent activities, EPO patents, application date, 1998-2000 average
- 50 100 150 200 250
IN
JP
KR
LU
BE
CA
DK
FI
SE
NL
UK
IT
FR
US
LI
CH
DE
number of patents
foreign ownership
domestic ownership
Source: EPO, OECD, own calculations
CONCLUDING REMARKS
This paper presented evidence for the inter-nationalisation of the Austrian System of Inno-vation based on patent indicators. We calculated two indicators to measure how many patents invented in Austria are owned by abroad, and in turn, to what degree Austrian patent applications use inventions made abroad.
Our results suggest that, together with FDI and R&D financing from abroad, the foreign ownership of patent inventions has increased considerable since the early 1990s. But also Austrian enterprises tend to patent more knowledge developed elsewhere. Today, Austria

no.22 08.04
16
is among the most internationalized countries both in active and passive trans-border patent activities. With regard to the partner countries of these activities, we find a strong bias towards Germany, both on the active and the passive side. Our data show no evidence for a large outsourcing of R&D activities to the Central and Eastern European countries, China or India.
REFERENCES
Guellec, D. and van Pottelsberghe de la Potterie, B. (2001): The Internationalisation of Technology Analysed with Patent Data. Research Policy, 30(8), 1253-66.
Hunya, G. and Stankovsky, J. (2003): Foreign Direct Investment in CEECs and the Former Soviet Union - with Special Attention to Austrian FDI Activities. Vienna: Vienna Institute for International Economic Studies.
Kuemmerle, W. (1999): Foreign Direct Investment in Industrial Research in the Pharmaceutical and Electronics Industries--Results from a Survey of Multinational Firms. Research Policy, 28(2-3), 179-93.
Marin, D. (2004): ‘A Nation of Poets and Thinkers’ - Less So with Eastern Enlargement? Austria and Germany. Discussion Paper, Department of Economics, University of Munich 2004-06.
Michie, J. (Ed.) (2003): The Handbook of Globalisation. Cheltenham and Northampton, MA: Edward Elgar Publishers.
Narula, R. and Zanfei, A. (2004): Globalisation of Innovation: The Role of Multinational Enterprises. TEARI working paper 12.
Schibany, A. and Dachs, B. (2003): Patente - Ein Indikator für technologische Leistungsfähigkeit und Internationalisierung. Vienna: TIP - Technologie - Information - Politikberatung.
Statistik Austria (2004): Finanzierung der Ausgaben für Forschung und experimentelle Entwicklung in Österreich. Statistische Nachrichten, 2004(6), 500-510.
Authors Bernhard Dachs Department of Technology Policy, ARC systems research A-2444 Seibersdorf Phone: +43 (0)50 550 – 3892 [email protected] www.arcs.ac.at/
Andreas Schibany InTeReg, Joanneum Research A-1040 Vienna, Wiedner Hauptstrasse 76 Phone: +43 (01) 581 75 20 2823 [email protected] www.joanneum.at/InTeReg

no.2208.04
17
‘Learning from Science and Technology Policy Evaluation’ comprises a collection of 18 articles about recent US and European experiences and insights on research, innovation and technology (RIT) policy evaluation. The contributors to the collection are leading experts in the field, coming from both sides of the Atlantic. The main aim of the book is to analyse and contrast the need, demand and experience with RIT policy evaluation within the respective policy making frameworks. In the different chapters of the book the authors assess current evaluation practices and methods, suggest and discuss the use of new and innovative evaluation approaches and explore strategies that could improve RIT evaluation designs and policies.
The first chapters of the book discuss from different angles the rationale and emerging paradigms for evaluating RIT policies in the United States and in Europe. Irwin Feller uses the image of the ‘reporter’ to set and discuss the agenda of the evaluator. In order to write and present a convincing story, the policy analyst – similar to the approach a reporter takes – asks and links information about the where, who, when, why, what and how accurately and objectively. Feller demonstrates that broader political and societal factors influence evaluation priorities and approaches, an argument which is taken up by Arie Rip in the following chapter. He argues that the evaluation community faces new challenges, notably the increasing orientation towards strategic issues, providing intelligence to improve innovation systems, identifying the impacts of research, and the emergence of new
stakeholders as the traditional boundaries between science and society have begun to opening up. Consequently, the role of evaluators shift towards that of a competent commentator and constructive critic rather than just evaluating past, narrowly defined ‘performance’.
However, the following chapters of the volume suggest that this envisaged change is rather slow. The legacy of evaluation rules, values and practices constitute institutional rigidities which limit the pace of development of new and innovative evaluation practices. Susan E. Cozzens discusses this problem by analysing the culture clashes which emerged between research communities and policy makers as a result of the adoption of the 1993 US Government Performance and Results Act. Luke Georghiou stresses the importance of evaluators engaging with a wide range of socio-economic policy themes to be able to satisfy policy makers’ needs and expectations with regard to evaluation processes and results. He concludes that traditional evaluation tools (such as peer review and bibliometrics) without paying attention to the broader agenda are insufficient to create suitable policy learning frameworks. However, empirical evidence from the United States seems to point to a still increasing role of peer review in research policy. As David H. Guston shows in his contribution, over the 1990s the use of peer review expanded for the allocation of federal funds, in the evaluation of research programmes, in the evaluation of knowledge input to regulation, and in judicial decision making. The chapter by David F.J. Campbell on the comparison of evaluation models for university research in different European countries also confirms the dominant role of peer review and peer panels in the evaluation process, even though different evaluation systems have emerged. Joining the calls made by Cozzens and Georghiou, Guston
Anton Geyer Book Review Shapira/Kuhlmann: “Learning from Science and Technology Policy Evaluation”

no.22 08.04
18
advocates for greater scrutiny of the role and effectiveness of peer review in RIT policy evaluation.
The following three papers are concerned with the evaluation of European Union research programmes with focus on the evaluation of the Framework Programme impacts in Finland (Terttu Luukkonen), the evaluation of the specific programme BRITE/EURAM (Laurent Bach, Marc-Jacques Ledoux and Mireille Matt), and the assessment of whole RTD programme portfolios in the European Union (Ken Guy). Luukkonen highlights the problem of data availability and methodological weaknesses to identify valuable ‘soft effects’ of European research co-operation programmes such as theirs impacts on research management cultures and behavioural innovation. Bach and colleagues also admit that even with elaborate, sophisticated microeconomic methods to determine the quantitative effects of programme participation significant gaps remain. Guy illustrates that for the evaluation of complex programmes and research portfolios, the adoption of a multiple mixed method approach to evaluation, including the use of qualitative methods, seems to be helpful and most appropriate.
In his contribution, James S. Dietz examines the factors affecting the outcomes of industry-federal laboratory partnerships in the United States. The chapter concentrates on the role of companies’ characteristics, their research strategies, and the character of their relationships with the federal labs. He also compares the companies’ original expectations with the actual outcomes. Evidence from over 200 cooperation projects indicate that successful process and product development is not directly related to the original intentions of the firms, but likely to be associated with the performance of
development oriented research. In the following chapter, Louis G. Tornatzky
describes benchmarking methods in evaluations to assess university-industry relationships. His experience with benchmarking suggests an increasingly prominent role in research evaluation. Despite the limitations of the method benchmarking has gained considerable attention by the users and customers of evaluation research. Benchmarking seems to be a strong tool when RIT activities and the accompanying frameworks are relatively common among the evaluated entities.
Patries Boekholt shifts the focus to the regional level of innovation policy evaluation. She reports in her chapter on emerging evaluation cultures in European regions in the framework of the European Union funded regional innovation initiatives RTP, RIS and RITTS. Boekholt argues that there is a gap between policy planning and innovation processes in regions on the one side, and evaluation practices on the other side. A lot still needs to be done to develop appropriate evaluation tools for regional innovation policy. However, paying attention to improving evaluation practices alone might prove ineffective and unfruitful. Closing the gaps and creating new links within the regional policy learning network will be crucial to improve overall the effectiveness of evaluation activities of regional innovation policies in Europe.
Philip Shapira takes the case of the evaluation of the US Manufacturing Extension Partnership (MEP) to demonstrate the requirement for a multi-method evaluation approach that catches the different aspects of programme implementation, management, outcomes and impacts. Good evaluation should stimulate dialogue among stakeholders, he argues. Evaluation should be tasked not only as a means to justify programmes to funding sponsors, but also with promoting learning and programme improvement.
Elizabeth Corley, Barry Bozeman and Monica Gaughan present CV analysis as a tool for the

no.2208.04
19
evaluation of the impacts of grants on women scientist’s careers. Based on US data of interdisciplinary science centres the findings suggest that women receive smaller and fewer grants, though this does not seem to affect tenure and promotion patterns. CV analysis seems to offer a considerable potential to explore issues about gender specific research career and research network development more thoroughly. The following chapter by Gretchen B. Jordan and Devon Streit also deals with the evaluation of individual researchers’ performance, however the focus is on the elements of research environments that contribute to the scientists’ and engineers’ ability to perform excellent research. The authors suggest an analytical framework that draws on Competing Values theory to identify and investigate competing values related to human development, creativity, internal process and external performance. From this analysis balanced indicators for assessing and managing organisational performance can be derived.
Nicholas S Vonortas and Matt Lackey propose a model to prospectively assess uncertain research outcomes. They advocate their model for the use by funding agencies for project appraisal. The suggested method is based on private sector experience with ‘real options’ evaluation concepts as a means to improve strategy formulation processes.
In the concluding chapter of ‘Learning from Science and Technology Policy Evaluation’, Stefan Kuhlman writes about the potential of evaluation to guide and inform science and technology policy. He argues that in a world of complex, multi-actor innovation systems, evaluation serves as a mediating tool in the policy making process. Evaluation is one among other strategic policy intelligence tools (such as foresight, benchmarking, and technology assessment) that create and form part of emerging ‘distributed systems of intelligence’ to improve policy making processes.
In conclusion, the volume represents a good overview about the state of evaluation methodologies in the United States and Europe. However, the different contributions are very heterogeneous in aims and focus. Policy orientated chapters are next to presentations on the outcomes of specific evaluation exercises and discussions of new methodological approaches to science and technology policy evaluation. This fact does not compromise the quality of the individual contributions to the book, but it does not allow reaping synergies either. Perhaps, this is inevitable since the chapters of the book are based on workshop contributions to a US-European workshop which was held in Bad Herrenalb (Germany) in September 2000.
Contrasting the current RTI debate in Europe with the book’s chapters makes one realise the enormous pace of developments in science and technology policy making. Many of the currently most hotly discussed European RIT policy issues (e.g. Barcelona targets, FP 7 design, European RTD policy co-ordination, role of basic research, new innovation policies etc.) were even not on the horizon at the time the book was being designed. The policy makers have moved on; the RIT policy evaluation community hopefully will follow soon.
Author DI Anton Geyer Technopolis Austria Prinz Eugen-Straße 80/12 A-1040 Wien, Austria Phone: +43 1 503 95 92 –16 [email protected] http://www.technopolis-group.com/

no.22 08.04
20
LEARNING FROM SCIENCE AND TECHNOLOGY POLICY EVALUATION. Experiences from the United States and Europe.
Edited by Philip Shapira and Stefan Kuhlmann.
Contributors include L. Bach, P. Boekholt, B. Bozeman, D.F.J. Campbell, E. Corley, S.E. Cozzens, J.S. Dietz, I. Feller, M. Gaughan, L. Georghiou, D.H. Guston, K. Guy, G.B. Jordan, S. Kuhlmann, M. Lackey, M.-J. Ledoux, T. Luukkonen, M. Matt, A. Rip, P. Shapira, D. Streit, L.G. Tornatzky, N. Vonortas.
July 2003, 400 pp. Hardback 1 84064 875 9 (£ 75) Edgar Elgar Publishing Limited, Cheltenham. www.e-elgar.co.uk/

Der Newsletter der Plattform Forschungs- und Technologieevaluierung GesbRist ein unregelmäßig erscheinendes offenes Forum zur Diskussion methodischerund inhaltlicher Evaluierungsfragen in der Forschungs- und Technologiepolitik. © Wien 2004 ISSN: 1726-6629
Für den Inhalt dieser Ausgabe verantwortlich:Plattform Forschungs- und Technologieevaluierung GesbRMag. Klaus Zinöcker
Herausgabe und Versand:Dr. Rupert Pichler, Dr. Michael Stampfer, Mag. Klaus ZinöckerPlattform Forschungs- und Technologieevaluierung GesbR, A-1040 Wien, Wiedner Hauptstraße 76, [email protected]
PLATTFORM FORSCHUNGS- UND TECHNOLOGIEEVALUIERUNG
Die Plattform Forschungs- und Technologieevaluierung GesbR ist eineInitiative des österreichischen Bundesministeriums für Verkehr, Innovationund Technologie, des Bundesministeriums für Bildung, Wissenschaft undKultur, des Bundesministeriums für Wirtschaft und Arbeit, Joanneum Research,WIFO, Technopolis, WWTF, ARC Seibersdorf research, der KMU Forschung Austria,der Technologie Impulse Gesellschaft, der Zentrum für Innovation und Technologie GmbH, sowie den Fonds FFF und FWF. Im Rahmen der Plattform werden Themenstellungen zur Forschungs- und Technologieevaluierungerarbeitet und – z.T. unter Einbeziehung namhafter ExpertInnen – in einem Fachkreis diskutiert.Der Newsletter beinhaltet Fachbeiträge zu Fragen der forschungs- und technologiepolitischenEvaluierung. Die Herausgabe erfolgt in zeitlicher als auch inhaltlicher Abstimmung mit Plattform-Veranstaltungen, um die Synergiewirkungen eines breiten Austauschforums zu nutzen.

Plattform Forschungs- und Technologieevaluierung GesbR. Wiedner Hauptstr. 76 A-1040 Wien, Austria
www.fteval.at