bibliometrics and patent indicators for the science and … · 2016-01-14 · technical...
TRANSCRIPT

Task 21: Bibliometrics and Patent Indicators for
the Science and Engineering Indicators 2016
Technical Documentation
January 2016


Task 21: Bibliometrics and Patent Indicators for
the Science and Engineering Indicators 2016
Technical Documentation 14 January 2016
Submitted to:
SRI International Authors
Grégoire Côté
Guillaume Roberge
Philippe Deschamps
Project Leader
Grégoire Côté
By:
Science-Metrix
1.514.495.6505 1.800.994.4761
[email protected] www.science-metrix.com

Bibliometrics and Patent Indicators for the Science and Engineering Indicators 2016 Technical Documentation
January 2016 i
© Science-Metrix Inc.
Contents
Tables .......................................................................................................................................................... ii Figures ........................................................................................................................................................ ii 1 Introduction ...................................................................................................................................... 1 2 Bibliometric methods ...................................................................................................................... 2
2.1 Database implementation ........................................................................................................... 4 2.1.1 Filtering document and source types .......................................................................... 6
2.2 Data standardization .................................................................................................................... 6
2.2.1 Linking WebCaspar classification to the database .................................................... 6 2.2.2 Data standardization: country, country groups, regions ............................................ 7 2.2.3 Data standardization: U.S. states ................................................................................ 8 2.2.4 Data coding: U.S. sectors ............................................................................................. 9
2.3 Production database .................................................................................................................. 10
2.3.1 Computation of the citations ..................................................................................... 11 2.3.2 Production database structure .................................................................................. 12 2.3.3 Indexes ........................................................................................................................ 13
2.4 Indicators .................................................................................................................................... 13
2.4.1 Number of publications.............................................................................................. 13 2.4.2 Collaboration .............................................................................................................. 14 2.4.3 Index of collaboration ................................................................................................. 15 2.4.4 Scientific impact analysis – Citations and journal impact factors .......................... 15 2.4.5 Fractioning of citations .............................................................................................. 17 2.4.6 Relative citation index ................................................................................................ 18 2.4.7 International citations ................................................................................................ 20
3 Patenting indicators ...................................................................................................................... 21
3.1 Database ..................................................................................................................................... 21 3.2 Database implementation ......................................................................................................... 22 3.3 Data standardization .................................................................................................................. 23
3.3.1 Mapping of patents by technical fields ..................................................................... 23 3.3.2 Mapping of patents in clean technologies ................................................................ 24 3.3.3 Mapping of patents to NAICS codes .......................................................................... 25 3.3.4 Linking citations to non-patent literature to bibliometric database ........................ 26 3.3.5 Data standardization: country, country groups, regions .......................................... 29 3.3.6 Data standardization: U.S. states .............................................................................. 29 3.3.7 Data coding: U.S. sectors ........................................................................................... 30 3.3.8 Non-U.S. academic institutions ................................................................................. 30 3.3.9 EPO academic institutions ......................................................................................... 30
3.4 Indicators .................................................................................................................................... 31
3.4.1 Inventors versus applicants ....................................................................................... 31 3.4.2 Applications versus granted patents ......................................................................... 31 3.4.3 Kind codes .................................................................................................................. 32 3.4.4 Number of patents ..................................................................................................... 33
Appendix ................................................................................................................................................... 35

Bibliometrics and Patent Indicators for the Science and Engineering Indicators 2016 Technical Documentation
January 2016 ii
© Science-Metrix Inc.
Tables
Table I Link between XML items and columns in the “article” table in SQL .................................. 4 Table II Link between XML items and columns in the “author_address” table in SQL .................. 5 Table III Link between XML items and columns in the “references” table in SQL........................... 5 Table IV Combinations of source types and document types used for the production of
bibliometric indicators ........................................................................................................... 6 Table V Coding papers by sector ...................................................................................................... 10 Table VI Number of documents after each step of filtering ............................................................ 11 Table VII Example of citation fractioning on a pair of citing–cited articles ..................................... 18 Table VIII Citations counts between country pairs for a pair of citing–cited articles ....................... 20 Table IX Classification scheme for the production of SEI patenting indicators ............................. 23 Table X Example of a patent fractioned by technical fields according to IPC codes .................... 24 Table XI Clean technologies technical areas .................................................................................... 25 Table XII USPTO kind codes included for the production of statistics on granted patents ............ 32 Table XIII USPTO kind codes included for the production of statistics on applications .................. 32 Table XIV EPO kind codes included for the production of statistics on granted patents ................ 33
Figures
Figure 1 Bibliographic information for the computation of bibliometric indicators ......................... 3 Figure 2 NSF_Scopus database schema .......................................................................................... 12 Figure 3 NSF_production database schema .................................................................................... 13 Figure 4 LexisNexis database structure ............................................................................................ 22

Bibliometrics and Patent Indicators for the Science and Engineering Indicators 2016 Technical Documentation
January 2016 1
© Science-Metrix Inc.
1 Introduction
Science-Metrix has been commissioned by SRI to develop measures and indicators of research and patent activity using bibliometrics and patent data for inclusion in the Science and Engineering Indicators (SEI) 2016. This document details the various steps for the implementation of the databases, the cleaning and standardization of the data and the production of statistics. This documentation is accompanied by a collection of external files that are necessary complements to perform these tasks. The following is the list of accompanying external files:
External File 1: XML Parser Scopus (Folder) External File 2: Scopus_Import_SQL_Code_Generator.py External File 3: Scopus journal to WebCaspar classification.txt External File 4: Scopus_country.txt External File 5: Scopus US city to US state.txt External File 6: Scopus US Sector.txt External File 7: Impact_NSF_prod.sql External File 8: Create_Scopus_database_tables_index.sql External File 9: XML Parser LexisNexis (folder) External File 10: IPC Technology Concordance Table.txt External File 11: Patent number to clean technology.txt External File 12: US Class to NAICS.txt External File 13: Patent number to Scopus ID.txt External File 14: Patent number and SEQ to countries and regions.txt External File 15: Patent number and SEQ to American States.txt External File 16: US applicant to sector.txt External File 17: Non-US applicant to academic sector.txt External File 18: EPO US applicant to academic sector.txt External File 19: EPO non-US applicant to academic sector.txt External File 20: Create_LexisNexis_database_tables_index.sql
These external files are also introduced in the relevant section of this documentation.
The first section of the report presents the bibliometric methods based on scientific publications indexed in Scopus (Elsevier), while the second section presents the methods for the production of technometric data based on patents indexed in LexisNexis (Elsevier).

Bibliometrics and Patent Indicators for the Science and Engineering Indicators 2016 Technical Documentation
January 2016 2
© Science-Metrix Inc.
2 Bibliometric methods
Bibliometrics is basically the statistical analysis of written publications, such as books or articles. Bibliometrics comprises a set of methods used to derive new insights from existing databases of scientific publications and patents. In this study, the bibliometric indicators are not computed on the original and complete text of the publications, but rather on the bibliographic information of a very comprehensive set of scientific articles published in peer-reviewed journals and indexed in Scopus. As Figure 1 exemplifies, the information used for the computation of indicators is mostly derived from the bibliographic information contained in the first page of the document and in the list of references usually presented at the very end of the document.
Only two databases offer extensive coverage of international scientific literature and index the bibliographic information required to perform robust and extensive bibliometric analyses; both of these aspects are necessary for performing advanced bibliometric analyses on scientific activity. These databases are the Web of Science (WoS), which is produced by Thomson Reuters and currently covers about 12,000 peer-reviewed journals, and Scopus, which is produced by Elsevier and covers about 17,000 peer-reviewed journals.
The bibliometric indicators in this report were produced using an in-house implementation of the Scopus database from Elsevier that has been carefully conditioned for the production of large-scale comparative bibliometric analyses. The bibliometric indicators included in the previous editions of the SEI were computed based on data from the Science Citation Index (SCI) and the Social Sciences Citation Index (SSCI), two subsets of the Web of Science. The differences between Scopus and the SCI and SSCI database that was used for the previous editions of the SEI, and the implications of these differences for the production of bibliometric indicators for the SEI, will be discussed comprehensively in a separate report.
For this project, the indicators are computed on science and engineering scientific publications; this includes publications on the natural sciences, the applied sciences, the medical sciences and the social sciences, but excludes the arts and humanities. Only documents published in refereed scientific journals were retained (mostly articles, reviews and conference proceedings), as these documents were reviewed by peers prior to being accepted for publication. The peer-review process ensures that the research is of good quality and constitutes an original contribution to scientific knowledge. In the context of bibliometrics, these documents are collectively referred to as papers.

Bibliometrics and Patent Indicators for the Science and Engineering Indicators 2016 Technical Documentation
January 2016 3
© Science-Metrix Inc.
Figure 1 Bibliographic information for the computation of bibliometric indicators Source: Science-Metrix

Bibliometrics and Patent Indicators for the Science and Engineering Indicators 2016 Technical Documentation
January 2016 4
© Science-Metrix Inc.
2.1 Database implementation
Scopus’s data is provided by Elsevier on an external hard drive that contains a single gunzip archive (http://www.gzip.org/) per year of coverage, encrypted with GnuPG (https://www.gnupg.org/). Science-Metrix has developed a parser written in Python 2.7 (https://www.python.org/) to parse these files into tab-separated-values flat files suitable for import into a relational database.
The parser outputs a single directory per year, containing one file per table (article, author_address, reference, fts, author_keyword, etc.). The resulting text files are UTF8 encoded and, as such, may contain non-Latin characters, which is not desirable. Text files are therefore transliterated in the CP1252 encoding for clarity’s sake. Characters such as the German ß are converted (e.g., “ss”), while more-obscure characters are simply stripped from the data.
A small Python script is used to generate a bulk-import SQL file from the data files; running this file on Microsoft SQL Server loads all the data in the database.
Table I Link between XML items and columns in the “article” table in SQL
Column Data type XPATH
id bigint /xocs:doc/xocs:item/item/bibrecord/item-info/itemidlist/itemid attr=SGR
pmid int /xocs:doc/xocs:item/item/bibrecord/item-info/itemidlist/itemid attr=MEDL
sgr bigint /xocs:doc/xocs:item/item/bibrecord/item-info/itemidlist/itemid attr=SGR
year int /xocs:doc/xocs:item/item/ait:process-info/ait:date-sort attr=YEAR
month int /xocs:doc/xocs:item/item/ait:process-info/ait:date-sort attr=MONTH
day int /xocs:doc/xocs:item/item/ait:process-info/ait:date-sort attr=DAY
doi varchar(120) /xocs:doc/xocs:meta/xocs:doi
doc_type varchar(10) /xocs:doc/xocs:meta/cto:doctype
source_title varchar(500) /xocs:doc/xocs:item/item/bibrecord/head/source/sourcetitle
source_abbr varchar(200) /xocs:doc/xocs:item/item/bibrecord/head/source/sourcetitle-abbrev
source_id varchar(20) /xocs:doc/xocs:item/item/bibrecord/head/source attr=SRCID
issn varchar(50) /xocs:doc/xocs:item/item/bibrecord/head/source/issn
subject varchar(200) .../head/enhancement/classificationgroup/classifications/classification
source_type varchar(5) /xocs:doc/xocs:item/item/bibrecord/head/source attr=TYPE
title varchar(1000) /xocs:doc/xocs:item/item/bibrecord/head/citation-title/titletext
title_lang varchar(10) /xocs:doc/xocs:item/item/bibrecord/head/citation-title/titletext attr=XML:LANG
total_ref int /xocs:doc/xocs:item/item/bibrecord/tail/bibliography
volume varchar(50) /xocs:doc/xocs:item/item/bibrecord/head/source/volisspag/voliss attr=VOLUME
issue varchar(50) /xocs:doc/xocs:item/item/bibrecord/head/source/volisspag/voliss attr=ISSUE
first_page varchar(30) /xocs:doc/xocs:item/item/bibrecord/head/source/volisspag/pagerange attr=FIRST
last_page varchar(30) /xocs:doc/xocs:item/item/bibrecord/head/source/volisspag/pagerange attr=LAST
doc_type_sm varchar(1) Populate in a further step: see Section 2.1.1
scopus_year int /xocs:doc/xocs:item/item/bibrecord/head/source/publicationdate/year
scopus_zip varchar(80) Containing zip file
scopus_xml varchar(80) Containing xml file
nsf_subfield varchar(128) Populate in a further step: see Section 2.2.1

Bibliometrics and Patent Indicators for the Science and Engineering Indicators 2016 Technical Documentation
January 2016 5
© Science-Metrix Inc.
Table II Link between XML items and columns in the “author_address” table in
SQL
Column Data type XPATH
id bigint /xocs:doc/xocs:item/item/bibrecord/item-info/itemidlist/itemid attr=SGR
ordre_address int Automatically incremented by parsing script
country varchar(50) /xocs:doc/xocs:item/item/bibrecord/head/author-group/affiliation
attr=COUNTRY
city varchar(200) /xocs:doc/xocs:item/item/bibrecord/head/author-group/affiliation/city-
group
afid varchar(15) /xocs:doc/xocs:item/item/bibrecord/head/author-group/affiliation attr=AFID
dptid varchar(15) /xocs:doc/xocs:item/item/bibrecord/head/author-group/affiliation
attr=DPTID
full_address varchar(800) /xocs:doc/xocs:item/item/bibrecord/head/author-group/affiliation/ce:text
++ …affiliation/address-part ++ …affiliation/city-group
ordre_author int Automatically incremented by parsing script
auid varchar(15) /xocs:doc/xocs:item/item/bibrecord/head/author-group/author attr=AUID
indexed_name varchar(400) /xocs:doc/xocs:item/item/bibrecord/head/author-group/author/ce:indexed-
name
given_name varchar(400) /xocs:doc/xocs:item/item/bibrecord/head/author-group/author/ce:given-
name
author_initials varchar(50) /xocs:doc/xocs:item/item/bibrecord/head/author-group/author/ce:initials
surname varchar(400) /xocs:doc/xocs:item/item/bibrecord/head/author-group/author/ce:surname
pref_indexed_name varchar(400) /xocs:doc/xocs:item/item/bibrecord/head/author-group/author/preferred-
name/ce:indexed-name
pref_given_name varchar(400) /xocs:doc/xocs:item/item/bibrecord/head/author-group/author/preferred-
name/ce:given-name
pref_author_initials varchar(50) /xocs:doc/xocs:item/item/bibrecord/head/author-group/author/preferred-
name/ce:initials
pref_surname varchar(400) /xocs:doc/xocs:item/item/bibrecord/head/author-group/author/preferred-
name/ce:surname
ordre_affil int Automatically incremented by parsing script
affiliation varchar(800) /xocs:doc/xocs:item/item/bibrecord/head/author-group/affiliation/ce:text
city_group varchar(100) /xocs:doc/xocs:item/item/bibrecord/head/author-group/affiliation/city-
group
email varchar(120) /xocs:doc/xocs:item/item/bibrecord/head/author-group/author/ce:e-
address attr=EMAIL
epays_sm varchar(50) Populate in a further step: see Section 2.2.2
epays_sm_harmonized varchar(50) Populate in a further step: see Section 2.2.2
Table III Link between XML items and columns in the “references” table in SQL
Column Data type XPATH
id bigint /xocs:doc/xocs:item/item/bibrecord/item-info/itemidlist/itemid
ordre int Automatically incremented by parsing script
id_ref bigint /xocs:doc/xocs:item/item/bibrecord/tail/bibliography/reference/ref-info/refd-itemidlist/itemid
External File 1: XML Parser Scopus (Folder)
External File 2: Scopus_Import_SQL_Code_Generator.py

Bibliometrics and Patent Indicators for the Science and Engineering Indicators 2016 Technical Documentation
January 2016 6
© Science-Metrix Inc.
2.1.1 Filtering document and source types
Scopus records the information on the type of media (source type) and the document type. The types of media included in Scopus are categorized into six categories: Journal, Conference Proceeding, Book Series, Trade Publication, Book and Report. These include documents that are categorized into 15 categories: Article, Conference Paper, Review, Letter, Book Chapter, Editorial, Note, Short Survey, In Press, Erratum, Book, Conference Review, Report, Abstract Report, and Business Article.
For this project, the goal was to keep only documents that are peer reviewed and that present new scientific results. The classification of document by source type and document type in Scopus is perfectible and cannot be used directly to identify precisely all peer-reviewed papers in the database. An empirical approach has been developed by Science-Metrix to filter documents based on the source types and document types, and to maximize the recall of peer-reviewed papers while trying to minimize the inclusion of non-peer-reviewed documents. The approach is based on the documentation available on the Internet and statistics on the number of references and citations per document for each combination of source type and document type.
Table IV details the combinations that have been kept for the bibliometric analyses.
Table IV Combinations of source types and document types used for the
production of bibliometric indicators
Source Type Document Type
Book Series Article, Conference Paper, Review, Short Survey
Conference Proceeding Article, Review, Conference Paper
Journal Article, Conference Paper, Review, Short Survey
This filter is applied before subsequent steps of data standardization.
2.2 Data standardization
2.2.1 Linking WebCaspar classification to the database
In previous editions of the SEI, a concordance table between the journals indexed in the WoS and the WebCaspar has been developed and used for the production of bibliometric indicators by field of research. In this system, journals are classified in a single field (mutually exclusive classification) and all the papers published in the journal are classified in this field. In order to produce the indicators for this edition, a concordance table has been developed to match the Scopus database with the WebCaspar classification system. The two main challenges of adapting this implementation in Scopus are as follows:
1. To remap the journals in the WoS to the equivalent in Scopus. This is a challenge given the variations in journal names, and the relative lack of data standardization in Scopus.
2. To map the journals that are covered in Scopus but that were not included in the concordance table prepared in the previous editions.
The algorithm used to classify Scopus’s journals to the WebCaspar database can be expressed thusly:
Using T-SQL, entries in the WebCaspar database were linked to Scopus’s article on an exact match of
the “ISSN” field.
Using T-SQL, entries in the WebCaspar database were linked to Scopus’s article on an exact match of
the “journal name” field.

Bibliometrics and Patent Indicators for the Science and Engineering Indicators 2016 Technical Documentation
January 2016 7
© Science-Metrix Inc.
Using T-SQL, entries in the WebCaspar database were linked to Scopus’s article on an exact match of
the “journal abbreviation” field.
Using the partially classified Scopus database and Science-Metrix’s own Scopus implementation, articles
were linked by “eid” (Elsevier’s document unique ID), and the distribution of WebCaspar’s subfield for
every Science-Metrix subfield (based on the journal classification of Science-Metrix) was studied. For
example:
SM_subfield PB Subfield Name count SM_subfield_total ratio
Marketing Economics 546 21441 3%
Marketing Management & Business 20204 21441 94%
Marketing Social Psychology 691 21441 3%
Of all articles in the subfield “Marketing” in Science-Metrix’s implementation of the Scopus database
for which a classifying match was made in the contract version of Scopus, 94% were attributed to
“Management & Business”. After studying this data and assessing the average potential mismatch risk,
a threshold value of 80% was selected. Therefore, in cases where the threshold value was equaled or
surpassed, all papers classified in a specific Science-Metrix subfield and not otherwise assigned to a
WebCaspar subfield were thus attributed to the “popular” WebCaspar subfield.
Lastly, following the philosophy that a non-perfect match is more useful than no match at all, the very
last few unassigned journals were classified by studying the distribution of the subfields of the paper
they are referencing. Therefore, the most popular subfield between all the papers cited by all the papers
published in an unclassified journal was attributed to that journal.
It is important to note that a journal-based classification is inherently less precise than a classification that would be performed at the article level. For example, generalist journals such as Nature and Science don’t fit in a single Caspar category. Papers from these two journals have been classified in the biological sciences, for continuity with previous SEI editions. Also, some areas of research are very complex blends of different fields and hardly fit into a traditional ontology. The classification at journal level is widely used because classifying single papers is computationally expensive.
External File 3: Scopus journal to WebCaspar classification.txt
2.2.2 Data standardization: country, country groups, regions
Match of the country ISO 3166-1 alpha-3 codes provided in the Scopus code with the English short
country names officially defined by the ISO 3166 Maintenance Agency (ISO 3166/MA).
Some regions/economies/constituent countries/overseas departments are grouped under main
jurisdiction. (e.g., Puerto Rico is included in the U.S., Guadeloupe is included in France).
Scopus’s entries lacking a country code were attributed to a country using an in-house heuristic based
on the other information contained in the address (city, affiliation, AFID, DPTID). This algorithm
clusters articles on other discriminating fields and looks for a suitable match based on both a frequency
(at least 10 occurrences) and a ratio (at least 90%) threshold. For example, if an address lacks the
country, but lists a city (e.g., Chicago) that in more than 90% of the cases is associated with a given
country (e.g., United States), then this country will be associated with this address.

Bibliometrics and Patent Indicators for the Science and Engineering Indicators 2016 Technical Documentation
January 2016 8
© Science-Metrix Inc.
A correspondence table was developed between the English short country names and the country
names as they were defined in SEI 2014.
Most matches were straightforward (e.g., exact match or variations such as Myanmar = Burma).
Some matches required more elaborate approaches, as follows.
Countries are grouped and presented in the same way they were in the previous edition, except for
Croatia, which is now part of the European Union.
External File 4: Scopus_country.txt
2.2.3 Data standardization: U.S. states
Unfortunately, the Scopus database does not contain a specific field that holds information about the state or province in which an author wrote a paper. The information about the city, the postal code and the state are all contained in a single field named “city”. Although the city is most often present in this field, the postal code and the state are not systematically recorded and are presented in an inconsistent format. However, for U.S. papers, most addresses somewhat fit the following convention: city name, state abbreviation, zip code.
The algorithm used by Science-Metrix to identify the state in the U.S. addresses can be expressed thusly:
A regular expression (Python 2.7 script) is used to extract the longest word that does not contain any
digits from the city field. This word is a candidate for the city name.
A regular expression (Python 2.7 script) is used to extract the first encounter of a five-digit number
from the city field. This is assumed to be the zip code.
A regular expression (Python 2.7 script) is used to extract the first encounter of a two-capital-letter
word that exists in the list of U.S. states common abbreviations.
The zip codes and city names are checked against a U.S. zip code/city database (http://www.zip-
codes.com/zip-code-database.asp) to produce up to two candidate states per address.
Each address now has up to three candidate states. All cases where two or three states converge are
concluded to be from that state and are considered valid.
Ambiguous addresses are fixed by hand in reverse order of frequency.
Extensive manual coding was performed on the remaining addresses with unknown states.
Country not in Scopus Action
Gaza Strip
West Bank
St. Lucia
Senegambia
Kosovo
No formal entry for these countries / economies in Scopus. A query using the city
and the original country was used to identify the relevant papers from these
entities in Scopus (e.g. If city = 'Taipei' and country = 'China' then country_nsf =
'Taiwan')

Bibliometrics and Patent Indicators for the Science and Engineering Indicators 2016 Technical Documentation
January 2016 9
© Science-Metrix Inc.
In the end, the state remains unknown for 8% of the U.S. addresses.1 For a majority of these remaining addresses, there is no information available that allows for coding at the state level.
External File 5: Scopus US city to US state.txt
2.2.4 Data coding: U.S. sectors
All U.S. addresses were coded into one of the following sectors: Academic, Federal Government, State/Local Government, Private Nonprofit, FFRDC, and Industry. The Academic sector was also further divided between Private Academic and Public Academic.
The coding was based on the organization provided in the addresses of authors using the following method:
Use conversion table provided by Elsevier. The table provides a match between a unique ID (AFID)
for each address and a sector (not the sector used in the study but based on an specific ontology used
by Elsevier). There are many errors in the attribution of AFID to organizations in Scopus, several
errors also occur in the coding of AFID to sector, and finally many addresses with lower frequency are
not classified. However, this was a good first step to start coding the 15 million U.S. addresses in the
database.
All the highest frequencies (approx. first 500 organizations) were verified manually. These 500
organizations account for 68% of the U.S. addresses in the database, so a large proportion of the
coding was manually validated at this step.
The remaining untested matched and remaining unknown sectors were validated and/or coded following various approaches that can be synthetized as follows:
1 A paper may contain more than one U.S. address. In a fictive example, with 10 papers having 10 U.S. addresses each, there are 100 U.S. addresses in total. If the state cannot be determined for 8 of these addresses, then the state remains unknown for 8% of the U.S. addresses.

Bibliometrics and Patent Indicators for the Science and Engineering Indicators 2016 Technical Documentation
January 2016 10
© Science-Metrix Inc.
Table V Coding papers by sector
Elsevier Final Sector Note
Academic
Private Academic
• Manual validation of automatic coding in "Academic"
• Manual coding (e.g., searches for univ*, polytech*)
• Use NSF HERD file and then IPEDS and then Carnegie to code
between Private/Public Academic.
• Manual verification of automatic coding between Private/Public
(e.g., institution's website and Wikipedia)
• Some automatic coding of remaining Academic using keywords
(e.g., mainly looking for "state" in the name) Public Academic
Government
Federal Government Manual coding of Federal vs. State & Local, with the help of some
filters (e.g., national, federal, U.S., army, navy for the Federal, and
state, regional and state/city names for the State/Local) State/Local Government
Other Private nonprofit • Manual validation of automatic coding (Elsevier's conversion table)
• Use several lists of nonprofit organizations for automatic coding
Corporate Industry
• Manual validation of automatic coding (Elsevier's conversion table)
• Additional coding based on a list of company names
• Additional coding with the help of some filters (e.g., Inc., Corp.,
Ltd.)
Medical
Private Academic
Public Academic
Federal Government
State / Local Government
Private nonprofit
•Use Medicare to split between sectors (Industry, Federal,
State/Local Gov., Private nonprofit)
• Extensive manual validation to identify hospitals that are affiliated
to an academic institution, and coding in Private or Public Academic
•Additional manual validation and coding of hospitals
FFRDC SQL queries and manual coding of FFRDCs
External File 6: Scopus US Sector.txt
2.3 Production database
Two databases were developed for this project: a basic Scopus database containing all the “original” data from Scopus, with minimal filtering and data transformation, and a production version of the database (NSF_production). The first database has been named NSF_Scopus and contains three tables, one for basic bibliographic information about each article, one presenting the information on authors and their addresses (author_address) and one presenting the references listed in each article.

Bibliometrics and Patent Indicators for the Science and Engineering Indicators 2016 Technical Documentation
January 2016 11
© Science-Metrix Inc.
The production database is leaner as it contains only the necessary information to produce basic bibliometric indicators and is limited to relevant articles and journals. Essentially the production database has been obtained using the following filters:
Document types: only peer-reviewed documents presenting new scientific results (see section 2.1.1)
Field of research: only documents classified into one of the 13 Caspar fields (see section 2.2.1)
Only documents for which it was possible to identify the country of at least one author
Finally, documents from journals that are not listing any references have been removed from the
analysis (because chances are high that these are not peer-reviewed scientific publications)
Table VI presents the number of papers remaining after each step of filtering. About 80% of the documents are kept for the analysis, and this is fairly consistent for all years except for 2001–2003, where more documents are filtered out. This can largely be explained by more missing addresses in Scopus in this period.
Table VI Number of documents after each step of filtering
2.3.1 Computation of the citations
The Scopus database contains the original printed reference string for every paper but it also conveniently contains this information in a ready-to-use relational list of article identifiers. The schema for this “reference” table is presented in Figure 2. This set of references is smaller than in the original data as it only contains information about references to article that are also indexed in Scopus. Indeed, references to articles not present in the database are of little interest in computing basic bibliometric indicators.
Once the Scopus database is loaded, a query can be run to pre-compute various variables at article level based on references. These variables are necessary for the computation of the bibliometric indicators computed for the SEI and presented in sections 2.4.4 to 2.4.7.
External File 7: Impact_NSF_prod.sql
Year → → → →
1999 1,179,771 100% 1,091,431 93% 1,017,682 86% 943,964 80% 943,962 80%
2000 1,244,056 100% 1,135,497 91% 1,064,759 86% 991,458 80% 991,448 80%
2001 1,344,168 100% 1,180,192 88% 1,094,539 81% 1,011,052 75% 1,011,043 75%
2002 1,398,606 100% 1,229,647 88% 1,142,369 82% 1,051,972 75% 1,051,962 75%
2003 1,475,429 100% 1,295,599 88% 1,208,778 82% 1,117,870 76% 1,117,866 76%
2004 1,616,782 100% 1,433,398 89% 1,342,553 83% 1,260,489 78% 1,260,482 78%
2005 1,849,041 100% 1,610,927 87% 1,508,826 82% 1,436,824 78% 1,436,815 78%
2006 1,950,667 100% 1,702,234 87% 1,602,881 82% 1,532,408 79% 1,532,369 79%
2007 2,062,433 100% 1,800,399 87% 1,699,261 82% 1,624,473 79% 1,624,353 79%
2008 2,163,004 100% 1,899,147 88% 1,794,049 83% 1,717,596 79% 1,717,542 79%
2009 2,274,372 100% 2,008,174 88% 1,892,909 83% 1,823,662 80% 1,823,614 80%
2010 2,405,906 100% 2,115,812 88% 1,988,754 83% 1,920,848 80% 1,920,840 80%
2011 2,554,518 100% 2,253,182 88% 2,118,839 83% 2,058,361 81% 2,058,361 81%
2012 2,647,515 100% 2,322,613 88% 2,196,242 83% 2,140,387 81% 2,140,386 81%
2013 2,702,305 100% 2,378,920 88% 2,253,379 83% 2,199,704 81% 2,199,704 81%
2014 2,585,590 100% 2,215,633 86% 2,107,771 82% 2,062,763 80% 2,062,762 80%
All years 31,454,163 100% 27,672,805 88% 26,033,591 83% 24,893,831 79% 24,893,509 79%
Good Doc Type S&E Only Country is available Final datasetAll documents
Bibliometrics and Patent Indicators for the Science and Engineering Indicators 2016 Technical Documentation
January 2016 12
© Science-Metrix Inc.
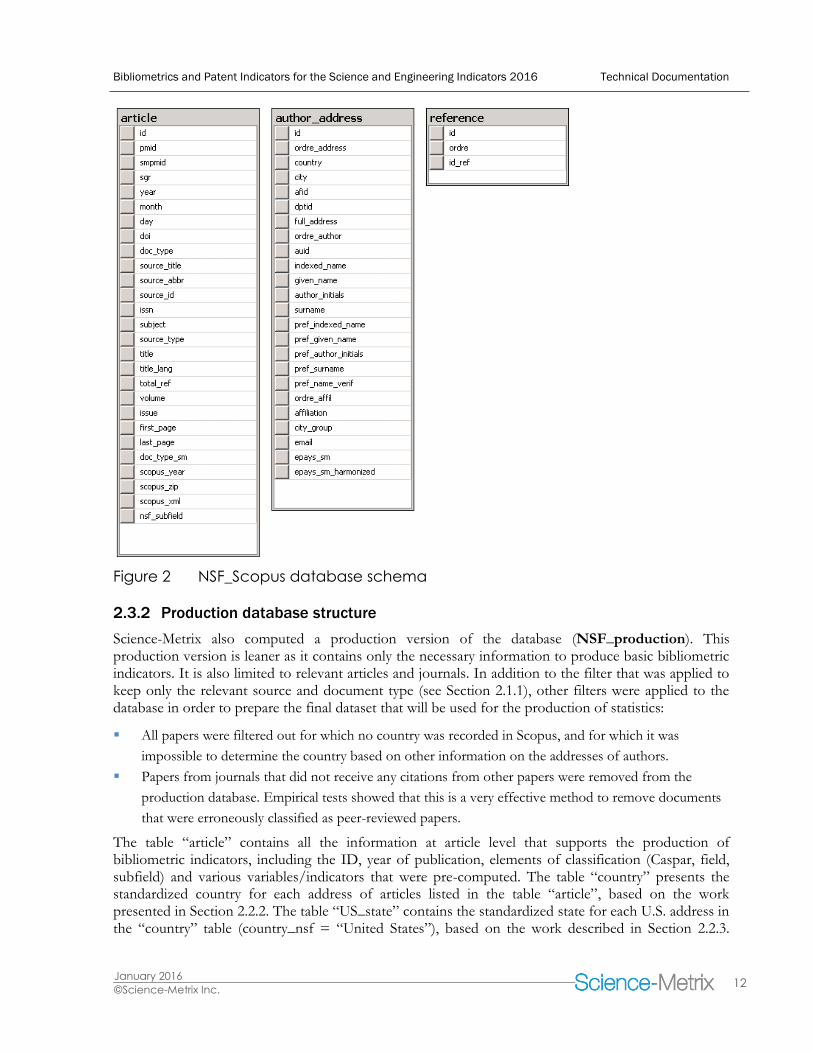
Figure 2 NSF_Scopus database schema
2.3.2 Production database structure
Science-Metrix also computed a production version of the database (NSF_production). This production version is leaner as it contains only the necessary information to produce basic bibliometric indicators. It is also limited to relevant articles and journals. In addition to the filter that was applied to keep only the relevant source and document type (see Section 2.1.1), other filters were applied to the database in order to prepare the final dataset that will be used for the production of statistics:
All papers were filtered out for which no country was recorded in Scopus, and for which it was
impossible to determine the country based on other information on the addresses of authors.
Papers from journals that did not receive any citations from other papers were removed from the
production database. Empirical tests showed that this is a very effective method to remove documents
that were erroneously classified as peer-reviewed papers.
The table “article” contains all the information at article level that supports the production of bibliometric indicators, including the ID, year of publication, elements of classification (Caspar, field, subfield) and various variables/indicators that were pre-computed. The table “country” presents the standardized country for each address of articles listed in the table “article”, based on the work presented in Section 2.2.2. The table “US_state” contains the standardized state for each U.S. address in the “country” table (country_nsf = “United States”), based on the work described in Section 2.2.3.

Bibliometrics and Patent Indicators for the Science and Engineering Indicators 2016 Technical Documentation
January 2016 13
© Science-Metrix Inc.
Finally, the table “US_Sector” contains the results of the coding by sector of U.S. organizations (see Section 2.2.4).
Figure 3 NSF_production database schema
2.3.3 Indexes
A database index is a data structure that improves the speed of data retrieval operations on a database table at the cost of additional writes and storage space to maintain the index data structure. Indexes are used to quickly locate data without having to search every row in a database table every time a database table is accessed. Indexes can be created using one or more columns of a database table, providing the basis for both rapid random lookups and efficient access of ordered records.
The following is the SQL script used to produce all database indexes (for both NSF_Scopus and NSF_production).
External File 8: Create_Scopus_database_tables_index.sql
2.4 Indicators
This section presents the bibliometric indicators computed as part of this study.
2.4.1 Number of publications
The traditional, widespread publication count is one means of measuring and comparing the production of various aggregates (e.g., organizations, regions and countries). It can also be used to evaluate output

Bibliometrics and Patent Indicators for the Science and Engineering Indicators 2016 Technical Documentation
January 2016 14
© Science-Metrix Inc.
in individual disciplines, such as philosophy and economics, and to track trends in research fields, collaborative research and many other aspects of research output. A number of other indicators can also be derived from these simple counts. Full and fractional counting are the two principal ways of counting the number of papers.
Full counting
In the full counting method, each paper is counted once for each entity listed in the address field. For example, if a paper is authored by two researchers from the University of Oslo, one from the University College London (UCL) and one from the University of Washington, the paper will be counted once for the University of Oslo, once for UCL and once for the University of Washington. It will also be counted once for Norway, once for the U.K. and once for the U.S. When it comes to groups of institutions (e.g., research consortia) or countries (e.g., the European Union), double counting is avoided. This means that if authors from Croatia and France co-publish a paper, when counting papers for the European Union this paper will be credited only once, even though each country will have been credited with one publication count.
Fractional counting
Fractional counting is used to ensure that a single paper is not counted several times. This approach avoids the use of total numbers across entities (e.g., researcher, institution, region, country) that add up to more than the total numbers of papers, as is the case with full counting. Ideally, each author on a paper should be attributed a fraction of the paper that corresponds to his or her level of participation in the experiment. Unfortunately, no reliable means exists for calculating the relative effort of authors on a paper, and thus each author is granted the same fraction of the paper.
For this study, fractions were calculated at the level of researchers. In the example presented for full counting (two authors from the University of Oslo, one from UCL and one from the University of Washington), half of the paper can be attributed to Norway and one quarter each to the U.K. and the U.S. when the fractions are calculated at the level of researchers. Using the same approach for institutions, half of the paper would be counted for the University of Oslo and one quarter would be attributed each to UCL and the University of Washington.
This approach diverges from that used in the previous edition of the SEI because the dataset from SCI and SSCI does not allow for fractionation at the author level. In the previous edition, the fractions were calculated at the institution level. Therefore, in the previous counting scheme, the University of Oslo, UCL and the University of Washington would all have been attributed a third of the paper.
2.4.2 Collaboration
In the context of bibliometrics, scientific collaboration is measured by co-publications. A co-publication is defined as a publication that was co-authored by at least two authors. When a publication involves only authors from one country, it is defined as a national collaboration. When at least two different countries are identified among the addresses of authors on the publication, it is defined as an international collaboration. A publication can involve national and international partnerships simultaneously if more than two countries are involved with at least one of the countries being represented by more than one author on the publication. In some tables, the statistics have been presented for different types of co-authorship:
With multiple institutions: Articles with two or more institutional addresses.
With domestic institutions only: Articles with one or more institutional address all within a single
country/economy.

Bibliometrics and Patent Indicators for the Science and Engineering Indicators 2016 Technical Documentation
January 2016 15
© Science-Metrix Inc.
With international institutions: Articles with institutional addresses from more than one
country/economy.
2.4.3 Index of collaboration
The Index of collaboration (IC) provides an indication of the preference of two countries to collaborate. It compares the number of papers co-authored between the two countries with the number of co-authored articles that would have resulted from a random selection of partnering countries. The index is calculated as follows:
( ) (
)⁄
where
ICxy Index of collaboration between country x and country y
Cxy Number of papers co-authored between country x and country y
Cx Total number of international co-authorship by country x
Cy Total number of international co-authorship by country y
Cw Total number of international co-authorship in the database
2.4.4 Scientific impact analysis – Citations and journal impact factors
An important part of scientific excellence is gaining recognition from colleagues for one’s scientific accomplishments. Although this recognition can be expressed in many different ways, references to scientific publications are often considered to be explicit acknowledgements of an intellectual contribution. As such, the more a scientific article or publication is cited, the greater its impact on the scientific community, and the more likely it is to be a work of great quality. This is the basic assumption that underlines the various indicators grouped here under “citation analysis” (i.e., citation counts, journal impact factors, and the various ways to normalize them).
Before going into the details of specific indicators, it is important to highlight a number of issues related to the act of citing itself. One issue of contention regarding citation analysis concerns what exactly is being measured through citation analysis. As mentioned above, it is often believed that citation analysis measures the impact or the quality of an article. References are the practice of acknowledging previous work that has been important in the production of the referencing article. However, the notion that measuring citations will be a good indication of the quality of a paper has been widely debated. Motivations for citing can be unclear, which would undermine the idea that papers are cited because they make an important contribution to science. A variety of reasons can explain why a citation is given by one scientific article to another, and not all of them are linked to the quality of the work in the cited article. Critics have thus questioned the validity of citations as measures of research visibility, impact or scientific quality,2,3 but these measures remain widely used as few alternatives exist that would be more objective and cost-effective. When the law of large numbers are maintained and studies are correctly designed, the idiosyncratic uses of citations are largely mitigated and citations can therefore be used with a high level of confidence.
2 Tijssen, R. J. W., Visser, M.,S. & Van Leeuwen, T. N. (2002). Benchmarking international scientific excellence: Are highly cited research papers an appropriate frame of reference? Scientometrics. 54(3), 381–397.
3 Van Dalen, H. P., & Henkens, K. (2001). What makes a scientific article influential? The case of demographers. Scientometrics. 50(3), 455–482.

Bibliometrics and Patent Indicators for the Science and Engineering Indicators 2016 Technical Documentation
January 2016 16
© Science-Metrix Inc.
Citation count
The number of citations received by a scientific article or publication is considered a measure of the impact of that contribution on the scientific community, and the higher the number of citations, the greater the scientific impact. The number of citations can be aggregated to establish citation counts for an individual scientist, a research group, a department, an institution or a country. A number of problems can be associated with absolute citation counts. Citation practices are different between sub-fields of science, such as physical chemistry and colloidal chemistry.4,5 It thus seems the validity of comparing scientists’ performance working in different fields is uncertain. This is particularly true considering the fact that citations accrue at different rates depending on the field. Citation counts are indeed affected by the time period over which they are counted, and the importance of this factor has been characterized by a number of authors.6,7,8
Absolute citation counts are a very imprecise way to benchmark scientific performance, as some of the above critiques demonstrate. The preferred way to use citations to rank scientific impact are through the use of normalized, relative citation counts.
Average of relative citations (ARC)
A high-quality paper in a field where fewer citations are given could receive fewer citations than an average paper in a field with heavy citing practices. It would not be rigorous to compare these papers on absolute terms. A number of indicators have been developed to take these field specificities into account. They are called average relative citation measures.
One way to increase the finesse of citation counts is to calculate them relative to the size of the publication pool analyzed, or better, to the citation performance expected for the scientific field or sub-field. In the first instance, the number of citations accrued by an individual scientist, an institution or a country for a specific set of articles is divided by the number of articles in that set. The assumption here is that the number of citations received by the individual, institution or country is closely linked to the number of articles published. To further increase the finesse of the citation analysis, the results of this citation per publication ratio can be compared to an expected citation rate, which is the citation per publication ratio of all articles in the journal or the subfield where the research unit publishes. This additional sophistication is based on the assumption that practices in different scientific subfields have an impact on the citations normally received in that field, and that comparison of the unmodified citation to publication ratio between different fields is unrigorous.
The average of relative citations (ARC) used by Science-Metrix is an indicator of the scientific impact of papers produced by a given entity (e.g., a country, an institution) that takes into consideration the fact that citation behavior varies between fields. For a paper in a given subfield (based on the classification of journals described previously in this section), the citation count is then divided by the average count of all papers in the relevant subfield (e.g., astronomy & astrophysics) to obtain a relative citation count (RC). The ARC of a given entity (e.g., a country, an institution) is the average of the RC of papers belonging to it. When the ARC is above 1, an entity (e.g., country, institution, researcher) scores better
4 Braun, T. (2003). The reliability of total citation rankings. Journal of Chemical Information and Computer Sciences, 43(1), 45–46. 5 Frandsen, T. F. (2005). Journal interaction. A bibliometric analysis of economics journals. Journal of Documentation, 61(3), 385–401. 6 Frandsen, T.F., & Rousseau R. (2005). Article impact calculated over arbitrary periods. Journal of the American Society for Information Science and
Technology, 56(1), 58–62. 7 Moed, H. F., Burger, W. J. M., Frankfort, J. G., & Van Raan, A. J. F. (1985). The use of bibliometric data for the measurement of university
research performance. Research Policy, 14(3), 131–149. 8 Van Raan, A.J.F. (2003). The use of bibliometric analysis in research performance assessment and monitoring of interdisciplinary scientific
developments. Technikfolgenabschätzung, 12(1), 20–29.

Bibliometrics and Patent Indicators for the Science and Engineering Indicators 2016 Technical Documentation
January 2016 17
© Science-Metrix Inc.
than the world on average; when it is below 1, an entity publishes papers that are not cited as often as the world on average. The ARC is calculated as follows:
T
iT
k yj
k
i
yjyj
yj
tyj
tyj
T
C
CARC
1
1 ,
,,
,
,
,
where
ij,y Paper from an entity which falls in a specific subfield j and published in
period y Cij,y Citations to paper ij,y
T Total number of papers from a given entity Ckj,yt
Citations to paper kj,y during the period yt which falls in a specific
subfield j and published in period y Tj,y Total number of papers from subfield j published in period y
yt Years where citations to paper ij,y are considered
Highly cited publications and citation percentiles
In order to compute the proportion of papers of an entity that are in the top x% most cited papers, the top x% most cited papers at the world level must first be determined. In order to take into account the variations in citation behavior between the disciplines and over time, the top x% for the whole database is composed of the top x% for each discipline for each given year. Because some publications are tied based on their citation score, including all publications in the database that have a citation score equal to or greater than the x% threshold would often lead to the inclusion of slightly more than x% of the database. To insure that the proportion of publications in the x% most cited publications in the database is exactly equal to x% of the database, publications tied at the threshold citation score are each given a fraction of the number of remaining places within the top x%; for example, if a database contains 100 publications then the top 10% should contain 10 publications. Ranked in descending order of their citation score, if the 9th, 10th, 11th and 12th publications all have the same score, they are each given a quarter of the remaining two places in the top 10% (0.5 publications of the top 10% each). In addition, in some cases the number of places in the top 10% most cited publications is not an integer (e.g., if there are 11 publications in the database, there should be 1.1 publications in the top 10%). In this case, there is a dual fractionation in the case of ties at the threshold. For example, if there are no ties in the citation score of papers at the threshold, the paper with the highest score is given a count of 1 and the second paper is given a count of 0.1. If three papers are tied in second place behind the first paper, they are each given a weight of 0.033 (i.e., 0.1*1/3); if the top two papers are tied, they are each given a count of 0.55 (i.e., 1.1/2); and so on.
Following this process, the proportion of papers of a given entity that are in the world’s top x% most cited papers can be computed. An entity with x% of its papers in the top x% most cited papers would be considered to be on a par with the world level. Both full and fractional counting of publications can be used. In fractional counting, there could thus be a triple fractionation (i.e., a tie on the citation score, the x% is not an integer and the paper is co-authored).
2.4.5 Fractioning of citations
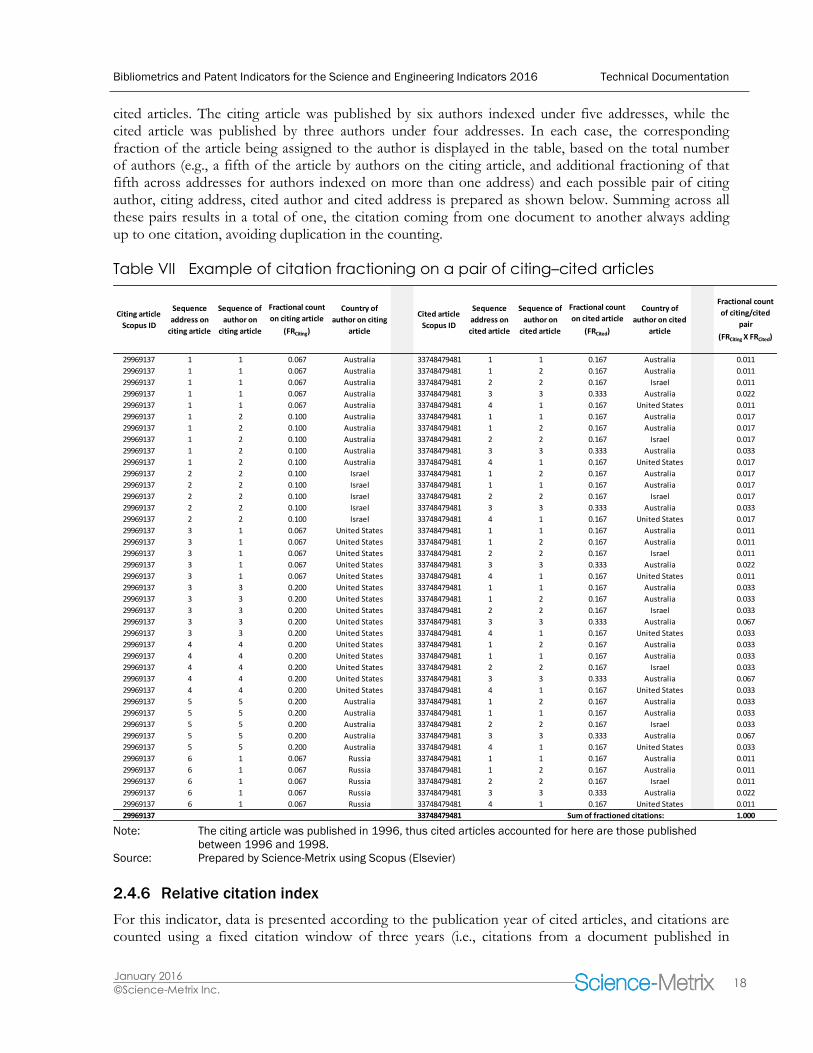
The preparation of the next two indicators requires performing the fractioning of citations across both citing and cited articles using double fractioning counts—that is, by fractioning citing articles and their corresponding cited articles at the same time at the author level (see Section 2.4.1 for details on how to fraction articles). Doing so enables allocating the rightful fractions of citations to each pair of citing author–cited author. Indeed, after performing the fractioning of citing articles and cited articles, the final fraction associated with each pair of citing author–cited author is then simply the product of the fractions associated with each author. Table VII presents the case of one citing article and one of its
Bibliometrics and Patent Indicators for the Science and Engineering Indicators 2016 Technical Documentation
January 2016 18
© Science-Metrix Inc.
cited articles. The citing article was published by six authors indexed under five addresses, while the cited article was published by three authors under four addresses. In each case, the corresponding fraction of the article being assigned to the author is displayed in the table, based on the total number of authors (e.g., a fifth of the article by authors on the citing article, and additional fractioning of that fifth across addresses for authors indexed on more than one address) and each possible pair of citing author, citing address, cited author and cited address is prepared as shown below. Summing across all these pairs results in a total of one, the citation coming from one document to another always adding up to one citation, avoiding duplication in the counting.
Table VII Example of citation fractioning on a pair of citing–cited articles
Note: The citing article was published in 1996, thus cited articles accounted for here are those published
between 1996 and 1998.
Source: Prepared by Science-Metrix using Scopus (Elsevier)
2.4.6 Relative citation index
For this indicator, data is presented according to the publication year of cited articles, and citations are counted using a fixed citation window of three years (i.e., citations from a document published in
Citing article
Scopus ID
Sequence
address on
citing article
Sequence of
author on
citing article
Fractional count
on citing article
(FRCiting)
Country of
author on citing
article
Cited article
Scopus ID
Sequence
address on
cited article
Sequence of
author on
cited article
Fractional count
on cited article
(FRCited)
Country of
author on cited
article
Fractional count
of citing/cited
pair
(FRCiting X FRCited)
29969137 1 1 0.067 Australia 33748479481 1 1 0.167 Australia 0.011
29969137 1 1 0.067 Australia 33748479481 1 2 0.167 Australia 0.011
29969137 1 1 0.067 Australia 33748479481 2 2 0.167 Israel 0.011
29969137 1 1 0.067 Australia 33748479481 3 3 0.333 Australia 0.022
29969137 1 1 0.067 Australia 33748479481 4 1 0.167 United States 0.011
29969137 1 2 0.100 Australia 33748479481 1 1 0.167 Australia 0.017
29969137 1 2 0.100 Australia 33748479481 1 2 0.167 Australia 0.017
29969137 1 2 0.100 Australia 33748479481 2 2 0.167 Israel 0.017
29969137 1 2 0.100 Australia 33748479481 3 3 0.333 Australia 0.033
29969137 1 2 0.100 Australia 33748479481 4 1 0.167 United States 0.017
29969137 2 2 0.100 Israel 33748479481 1 2 0.167 Australia 0.017
29969137 2 2 0.100 Israel 33748479481 1 1 0.167 Australia 0.017
29969137 2 2 0.100 Israel 33748479481 2 2 0.167 Israel 0.017
29969137 2 2 0.100 Israel 33748479481 3 3 0.333 Australia 0.033
29969137 2 2 0.100 Israel 33748479481 4 1 0.167 United States 0.017
29969137 3 1 0.067 United States 33748479481 1 1 0.167 Australia 0.011
29969137 3 1 0.067 United States 33748479481 1 2 0.167 Australia 0.011
29969137 3 1 0.067 United States 33748479481 2 2 0.167 Israel 0.011
29969137 3 1 0.067 United States 33748479481 3 3 0.333 Australia 0.022
29969137 3 1 0.067 United States 33748479481 4 1 0.167 United States 0.011
29969137 3 3 0.200 United States 33748479481 1 1 0.167 Australia 0.033
29969137 3 3 0.200 United States 33748479481 1 2 0.167 Australia 0.033
29969137 3 3 0.200 United States 33748479481 2 2 0.167 Israel 0.033
29969137 3 3 0.200 United States 33748479481 3 3 0.333 Australia 0.067
29969137 3 3 0.200 United States 33748479481 4 1 0.167 United States 0.033
29969137 4 4 0.200 United States 33748479481 1 2 0.167 Australia 0.033
29969137 4 4 0.200 United States 33748479481 1 1 0.167 Australia 0.033
29969137 4 4 0.200 United States 33748479481 2 2 0.167 Israel 0.033
29969137 4 4 0.200 United States 33748479481 3 3 0.333 Australia 0.067
29969137 4 4 0.200 United States 33748479481 4 1 0.167 United States 0.033
29969137 5 5 0.200 Australia 33748479481 1 2 0.167 Australia 0.033
29969137 5 5 0.200 Australia 33748479481 1 1 0.167 Australia 0.033
29969137 5 5 0.200 Australia 33748479481 2 2 0.167 Israel 0.033
29969137 5 5 0.200 Australia 33748479481 3 3 0.333 Australia 0.067
29969137 5 5 0.200 Australia 33748479481 4 1 0.167 United States 0.033
29969137 6 1 0.067 Russia 33748479481 1 1 0.167 Australia 0.011
29969137 6 1 0.067 Russia 33748479481 1 2 0.167 Australia 0.011
29969137 6 1 0.067 Russia 33748479481 2 2 0.167 Israel 0.011
29969137 6 1 0.067 Russia 33748479481 3 3 0.333 Australia 0.022
29969137 6 1 0.067 Russia 33748479481 4 1 0.167 United States 0.011
29969137 33748479481 Sum of fractioned citations: 1.000
Bibliometrics and Patent Indicators for the Science and Engineering Indicators 2016 Technical Documentation
January 2016 19
© Science-Metrix Inc.
publication year up until publication year + 2). This is in contrast to the data prepared for the SEI 2014, for which data was instead presented based on the citation year, and for which a lag of two years was applied before counting citations to articles from the past in a three-year citation window (i.e., data for 2012 counted citations made in 2012 articles to articles published during the 2008–2010 period). A three-year citation window has been used here in order to keep some grounds for comparability with the indicators produced for SEI 2014. However, as the scores are normalized with the average for the subfield in the same year, a longer window could have been used. This could be implemented in subsequent editions of the SEI.
Normalizing citation counts by a country’s publication output is essential for correct interpretation of the data. The expected share of citations that one country receives from another depends on the number of articles that the cited country produces. For instance, assuming that the U.S. had authored about 22% of all 2010 articles, it would be assumed that, all thing being equal, each country should make 22% of their citations to 2010 papers of U.S. publications for the pool of articles covered during this period, those above this level showing a preference for citing the U.S. and those below citing the country less frequently than expected. Dividing the share of a country’s references to U.S. articles by the expected share given the size of output of the U.S. in 2010 results in a relative citation index. For instance, if 25% of all China’s citations to publications published in 2010 are to U.S. publications, and the U.S. published 22% of all articles released in 2010, China’s RCI towards the U.S. would stand at 25%/22%=1.14.
To account for all citations between country pairs, the fractioning presented above at Table VII needs to be prepared for every pair of citing–cited articles in the database. Note that both citing and cited articles have to be peer-reviewed documents to be included in this analysis. Producing such data requires heavy computation power as fractioning both citing and cited articles and looking all the possible combinations in the database results in billions of pairs. In the end, the number of citations made from one country to another is simply the sum of fractioned scores associated with each pair, with the sum across all possible pairs adding up to the total number of citations made at the world level. Table VIII presents the total per country pair for the case presented above at Table VII. Just as it is supposed to be, the sum of citations across all pairs of countries do add up to a count of one citation.

Bibliometrics and Patent Indicators for the Science and Engineering Indicators 2016 Technical Documentation
January 2016 20
© Science-Metrix Inc.
Table VIII Citations counts between country pairs for a pair of citing–cited articles
Note: The calculation refers to the case presented at Table VII.
Source: Prepared by Science-Metrix using Scopus (Elsevier)
The share of citations of a country at the end of the process is simply the sum of citations received from all countries divided by the total number of citations at the world level. In the cases presented in Table VIII, Australia’s share of the citations stands at 66.67%, that of Israel at 16.67% and that of the U.S. at 16.67%, which adds up to 100%.
2.4.7 International citations
The share of citations to a given country/region that are from abroad is an indicator allowing the identification of the origin of its citations. This indicator is prepared using the same fractioning presented above and detailed in an example at Table VII. The difference is that instead of only adding up all citation counts to a country across pairs to obtain the number of citations, a total is also compiled for citations coming from outside the country. The ratio of both citation counts results in the share of a country’s citations that are from international sources. In the example presented in Table VIII, Australia’s share of international citations would stand at 63.33% (0.067+0.044+0.311/0.667) for this pair of citing–cited articles.
Cited Country Citing Country Fraction of Citation
Australia Australia 0.244
Israel 0.067
Russia 0.044
United States 0.311
Australia Total 0.667
Israel Australia 0.061
Israel 0.017
Russia 0.011
United States 0.078
Israel Total 0.167
United States Australia 0.061
Israel 0.017
Russia 0.011
United States 0.078
United States Total 0.167
World All countries 1.000

Bibliometrics and Patent Indicators for the Science and Engineering Indicators 2016 Technical Documentation
January 2016 21
© Science-Metrix Inc.
3 Patenting indicators
The patenting indicators in this report were produced using an in-house implementation of the LexisNexis patent database from Elsevier, which provides data from multiple patent offices. These offices include the United States Patent and Trademark Office (USPTO) and the European Patent Office (EPO), both of which were used to prepare the analyses for the SEI indicators. To accomplish such a task, the LexisNexis database has been carefully conditioned for the production of large-scale comparative patenting analyses. The patenting indicators included in the previous editions of the SEI were produced by the Patent Board using data from the USPTO and EPO. The differences between the two databases and the implications of these differences for the production of bibliometric indicators for the SEI will be briefly summarized further in this section.
For this project, the indicators are computed on all granted utility patents; at the USPTO this included documents classified under kind codes A (i.e., for patents granted before 2 January 2001), and B1 (i.e., for patents granted starting on 2 January 2001 with no previously published pre-grant publication) and B2 (i.e., for patents granted starting on 2 January 2001 having a previously published pre-grant publication and available March 2001). Other types of granted patents were excluded from the analysis, including design patents (S), and plant patents (P). At the EPO, granted patents that were used in the analysis included code types B1 (i.e., European patent specification for granted patents), B2 (i.e., new European patent amended specification after opposition procedure) and B3 (i.e., European patent specification after limitation procedure). In the context of technometrics, these documents are collectively referred to as patents.
3.1 Database
The analyses were mostly prepared using data from the USPTO indexed in LexisNexis. The database provides details on patents such as full titles and abstracts, the country and state (when available) of the inventors and applicants, as well as names of the inventors and applicants Applicants are organizations in most cases, but are sometimes individuals when the patent is not assigned to any organization. The database also provides information on three classification schemes: the U.S. national classes (USPC classes), the World Intellectual Property Organization (WIPO) International Patent Classes (IPC), and classes from the European Classification System (ECLA). LexisNexis is suitable for the production of technometric data from 1996, whereas patent data in the previous round of the SEI were largely prepared from 1992 to the present.
It is important to note that the preparation of patenting indicators using USPTO data results in a positive bias in favor of the U.S., as a larger share of inventors at the office are from the U.S. compared to the U.S. share of world population. This is common at patent offices as inventors from a geographical area more frequently tend to protect inventions in their own regional market. The same phenomenon is observed in Canada, where the vast majority of patents at the Canadian Intellectual Property Office (CIPO) are allocated to Canadians, and also at the European Patent Office (EPO), where Germany, France and the U.K. all have many more patents than any other countries.
Finally, as previously mentioned, EPO data in LexisNexis were also required to prepare a few of the 2016 indicators. Overall, the information available for the EPO patents is mostly similar to that available for the USPTO patents.

Bibliometrics and Patent Indicators for the Science and Engineering Indicators 2016 Technical Documentation
January 2016 22
© Science-Metrix Inc.
3.2 Database implementation
The LexisNexis patent data is provided by Elsevier on an external hard drive containing a single directory for every patent office. Considering the scope of this report, only the U.S. and EPO patent offices are of interest. Each patent office’s directory contains sub-directories for every year of coverage and these directories in turn contain a sub-directory named “Xml”. All patents for the specific office/year combination are archived in “ZIP” files, each containing 5,000 patent entries.
In order to read and process the patent data, all archives files are first inflated. Science-Metrix has developed a parser written in C++ (http://en.wikipedia.org/wiki/C%2B%2B_Standard_Library) to parse this data into tab-separated-values flat files suitable for import into a relational database. The mapping of xml tags SQL columns is presented in the Appendix. The resulting database is structured as follows:
Figure 4 LexisNexis database structure Source: Science-Metrix
The parser comes as a package contained in the following folder:
External File 9: XML Parser LexisNexis (folder)

Bibliometrics and Patent Indicators for the Science and Engineering Indicators 2016 Technical Documentation
January 2016 23
© Science-Metrix Inc.
3.3 Data standardization
3.3.1 Mapping of patents by technical fields
In SEI 2014, patents were matched on a classification scheme of 35 technical fields developed by the Patent Board. This mutually exclusive classification assigned IPC patent codes to technical fields defined by the Patent Board, and this classification utilized existing classification schemes, including one developed by the World Intellectual Property Organization (WIPO). Given the similarities between both classification schemes, NSF and Science-Metrix decided that the indicators for the current edition would be prepared based on the freely disseminated WIPO classification scheme instead of the proprietary one developed by the Patent Board.
The WIPO classification scheme consists of 35 technical fields.9 The main objective behind the development of such a classification was to provide a tool for country comparisons.10 The technical fields defined by this classification are listed at Table IX.
Table IX Classification scheme for the production of SEI patenting indicators
Source: IPC Technology Concordance Table
This classification scheme is mutually exclusive; that is, no IPC code is assigned to more than one technical field. Furthermore, all IPC codes are assigned to one technical field, the few unmatched codes left behind mostly the product of errors in the assignment of IPC codes to patents. In rare cases, these
9 Classification scheme from IPC8 codes to technical fields. Available at http://www.wipo.int/ipstats/en/statistics/technology_concordance.html 10 Concept of a Technology Classification for Country Comparisons. Available at
http://www.wipo.int/edocs/mdocs/classifications/en/ipc_ce_41/ipc_ce_41_5-annex1.pdf
Analysis of biological materials Macromolecular chemistry, polymers
Audio-visual technology Materials, metallurgy
Basic communication processes Measurement
Basic materials chemistry Mechanical elements
Biotechnology Medical technology
Chemical engineering Micro-structural and nano-technology
Civil engineering Optics
Computer technology Organic fine chemistry
Control Other consumer goods
Digital communication Other special machines
Electrical machinery, apparatus, energy Pharmaceuticals
Engines, pumps, turbines Semiconductors
Environmental technology Surface technology, coating
Food chemistry Telecommunications
Furniture, games Textile and paper machines
Handling Thermal processes and apparatus
IT methods for management Transport
Machine tools
Technical Fields

Bibliometrics and Patent Indicators for the Science and Engineering Indicators 2016 Technical Documentation
January 2016 24
© Science-Metrix Inc.
IPC codes were assigned to an additional category entitled Unclassified so that the sum of patents across technical fields would add up to the total number of patents.
Additionally, to make sure that the sum of patents across technical fields added up to the total number of patents, it was necessary to prepare patents counted fractionally by technical field as more than one IPC code can be assigned to patents, resulting in patents matching more than one technical field. As such, patents were fractioned according to the number of IPC codes to which they are assigned, using WIPO’s advanced classification scheme (i.e., the more complete scheme compared to the code classification scheme), each IPC code receiving an equal weight. For instance, a patent assigned to three different IPC codes would see each of these codes receive a third of the patent count. Then, following the matching of these IPC codes to the technical fields, the total per technical field was simply prepared as the sum across the IPC codes matching to each corresponding technical field. The following example in Table X details this process for one patent.
Table X Example of a patent fractioned by technical fields according to IPC
codes
Source: Prepared by Science-Metrix using the IPC Technology Concordance Table
(http://www.wipo.int/ipstats/en/statistics/technology_concordance.html)
External File 10: IPC Technology Concordance Table.txt
or online at : http://www.wipo.int/ipstats/en/statistics/technology_concordance.html
3.3.2 Mapping of patents in clean technologies
The SEI report presents statistics according to a set of patents associated with clean technologies. The statistics are based on categories developed by the Patent Board under an NSF contract, using keyword queries in titles, abstracts, claims and the full text version of patents. The categories are also defined using patent codes (e.g., IPC codes, ECLA codes and USPC codes), as well as applicants’ names. Overall, four main categories are defined: alternative energy technologies, energy storage technologies, pollution mitigation technologies, and smart grid technologies. These four categories comprise 28 subcategories, which are detailed in Table XI.
However, even though the statistics for the current edition of the SEI are based on this classification, notable differences exist between both editions. The first reason behind these changes is the information available in LexisNexis. While the original patent mapping on clean technologies by the
Section Class Subclass Main group Subgroup IPC Concordance
B 5 B 13 6 B05B% Chemical engineering 0.125
B 5 C 19 4 B05C% Surface technology, coating 0.125
B 5 D 1 12 B05D% Surface technology, coating 0.125
B 5 D 3 2 B05D% Surface technology, coating 0.125
B 5 D 1 2 B05D% Surface technology, coating 0.125
F 16 B 39 34 F16B% Mechanical elements 0.125
F 16 B 33 6 F16B% Mechanical elements 0.125
F 16 B 39 22 F16B% Mechanical elements 0.125
Total fraction of patent by technical field
Chemical engineering 0.125
Surface technology, coating 0.500
Mechanical elements 0.375
Total 1.000
IPC CodesTechnical Field Patent fraction
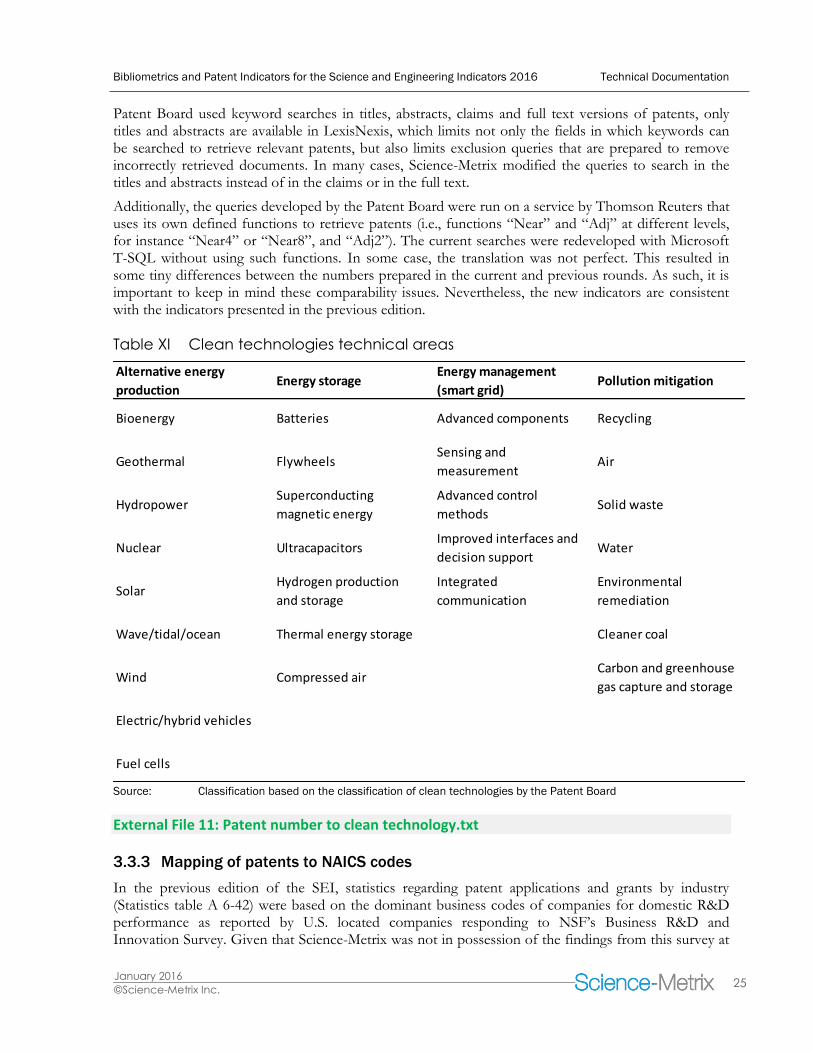
Bibliometrics and Patent Indicators for the Science and Engineering Indicators 2016 Technical Documentation
January 2016 25
© Science-Metrix Inc.
Patent Board used keyword searches in titles, abstracts, claims and full text versions of patents, only titles and abstracts are available in LexisNexis, which limits not only the fields in which keywords can be searched to retrieve relevant patents, but also limits exclusion queries that are prepared to remove incorrectly retrieved documents. In many cases, Science-Metrix modified the queries to search in the titles and abstracts instead of in the claims or in the full text.
Additionally, the queries developed by the Patent Board were run on a service by Thomson Reuters that uses its own defined functions to retrieve patents (i.e., functions “Near” and “Adj” at different levels, for instance “Near4” or “Near8”, and “Adj2”). The current searches were redeveloped with Microsoft T-SQL without using such functions. In some case, the translation was not perfect. This resulted in some tiny differences between the numbers prepared in the current and previous rounds. As such, it is important to keep in mind these comparability issues. Nevertheless, the new indicators are consistent with the indicators presented in the previous edition.
Table XI Clean technologies technical areas
Source: Classification based on the classification of clean technologies by the Patent Board
External File 11: Patent number to clean technology.txt
3.3.3 Mapping of patents to NAICS codes
In the previous edition of the SEI, statistics regarding patent applications and grants by industry (Statistics table A 6-42) were based on the dominant business codes of companies for domestic R&D performance as reported by U.S. located companies responding to NSF’s Business R&D and Innovation Survey. Given that Science-Metrix was not in possession of the findings from this survey at
Alternative energy
productionEnergy storage
Energy management
(smart grid)Pollution mitigation
Bioenergy Batteries Advanced components Recycling
Geothermal FlywheelsSensing and
measurementAir
HydropowerSuperconducting
magnetic energy
Advanced control
methodsSolid waste
Nuclear UltracapacitorsImproved interfaces and
decision supportWater
SolarHydrogen production
and storage
Integrated
communication
Environmental
remediation
Wave/tidal/ocean Thermal energy storage Cleaner coal
Wind Compressed airCarbon and greenhouse
gas capture and storage
Electric/hybrid vehicles
Fuel cells

Bibliometrics and Patent Indicators for the Science and Engineering Indicators 2016 Technical Documentation
January 2016 26
© Science-Metrix Inc.
the time of data production, patents were instead matched to the North American Industry Classification System (NAICS) industrial codes based on a concordance table between the U.S. classification of patents and NAICS codes. This conversion table has been developed by the USPTO Patent Technology Monitoring Team and is available at: http://www.uspto.gov/web/offices/ac/ido/oeip/taf/naics/naics_toc.htm
The new statistics for SEI 2016 are not comparable with those of the previous edition for the following reasons:
In SEI 2014, the NAICS was attributed to the applicant based on its type of industry. In this table, the
NAICS are attributed to each patent based on a conversion table between the U.S. classification and
the NAICS classification. For example, a patent by Burger King on a novel plastic container would be
classified in food (311) in SEI 2014 (based on the sector of activity of Burger King), but would be
classified in Plastics and Rubber Products (326) in the present table (based on the U.S. patent class).
These are two appropriate approaches, but do not measure the same parameters.
After careful examination, the correspondence table between U.S. classes and NAICS codes has
signficant problems. Several U.S. classes do not match any NAICS codes, and thus several patents can’t
be classified into a NAICS sector. The correspondence between U.S. class and NAICS code is often
far-stretched or is very general, allowing for less disaggregated statistics to be prepared with this
approach than with the previous method.
Only about half of USPTO applications have a U.S. class available in LexisNexis. Again, this means
that several applications can’t be linked to a NAICS code.
External File 12: US Class to NAICS.txt
Or: http://www.uspto.gov/web/offices/ac/ido/oeip/taf/naics/naics_toc.htm
3.3.4 Linking citations to non-patent literature to bibliometric database
This section presents the various tasks that were performed in order to link patents with scientific publications by using the references made to scientific publications within patents.
Extracting references
All references tagged as “non-patent literature” from patents from the USPTO dated 2008 and up were first extracted from the LexisNexis patent database. This represents 19,557,755 reference strings.
Although named “non-patent literature”, the field contains a large amount of references to patent literature. It also contains numerous references to non-scientific literature such as handbooks, instruction manuals, Wikipedia pages, and so forth. Here are a few examples of reference strings to patent literature, wrongly tagged as “non-patent literature” in the LexisNexis database:
International Searching Authority, International Search Report [PCT/ISA/210] issued in International
Application No. PCT/JP2004/017961 on Feb. 1, 2005.
Israeli Patent Office, Office Action issued in Israeli Application No. 187840; dated Mar. 10, 2010.
New Zealand Patent Office, Office Action in NZ Application No. 563863; issued Jul. 1, 2010.
Russian Patent Office, Office Action in Russian Application No. 2007148992; issued Jun. 23, 2010.
European Patent Office, Supplementary European Search Report dated Feb. 12, 2010 in European
Application No. 04819909.5.

Bibliometrics and Patent Indicators for the Science and Engineering Indicators 2016 Technical Documentation
January 2016 27
© Science-Metrix Inc.
And a few examples of reference strings leading to material that is neither peer-reviewed scientific or patent literature:
Webpage CLEAT from http://ezcleat.com/gallery.html dated Apr. 19, 2011.
Automotive Handbook, 1996, Robert Bosch GmbH, 4th Edition, pp. 170-173.
Periodic Table of the Elements, version published in the Handbook of Chemistry and Physics,
50thEdition, p. B-3, 1969-1970.
Microsoft aggressive as lines between Internet, TV blur dated Jul. 29,
Here is an example of a proper reference string to peer-reviewed scientific literature with the various elements of bibliographic information indicated in different colors:
Grinspoon, et al., Body Composition and Endocrine Function in Women with Acquired Immunodeficiency Syndrome Wasting, J. Clin Endocrinol Metab, May 1997, 82(5): 1332–7.
Authors, Title, Journal, Date, Volume, Issue, Pages
Pre-processing: References not containing a date
In order to ease the highly computing-intensive process and to enable the production of valid statistics in regard to the performance of the matching algorithm, this data must first be reduced to references to scientific material only. The first step eliminates all reference strings not containing a date, or more specifically, a year. Moreover, the Scopus database only indexes scientific material from 1996 and up, rendering matches for material prior to 1996 impossible. By removing reference strings not containing a year or containing a year prior to 1996, the pool of matchable references is reduced to 13,101,891 references.
Pre-processing: Removing references to patent literature and generic material
Identifying references to peer-reviewed scientific literature within this pool is an easy task if recall is not a concern. If, however, the goal is to identify all references to peer-reviewed scientific literature within the pool, the task becomes extremely arduous. It is easier and much more efficient to eliminate reference strings that are obviously patent related or point to generic material and deem the remainder valid candidates for a match.
N-grams are contiguous sequences of n items from a given sequence. In this case, items are words and sequences are reference strings. Studying high-frequency n-grams is a very efficient way of separating noise from useful data in a corpus. For example, the 10 most frequent 2-grams in the original pool of 19,557,755 reference strings are as follows:
RANK 2-GRAMS FREQUENCY
1 ET AL 9057092
2 U S 2385810
3 APPL NO 2036765
4 S APPL 2024620
5 OF THE 1492354
6 OFFICE ACTION 1159499
7 JOURNAL OF 954351
8 APPLICATION NO 800897
9 NO 11 794935
10 SEARCH REPORT 760949

Bibliometrics and Patent Indicators for the Science and Engineering Indicators 2016 Technical Documentation
January 2016 28
© Science-Metrix Inc.
In this small subset of 2-grams, there are six expressions that are obvious smoking guns for patent literature (U S, APPL NO, S APPL, OFFICE ACTION, APPLICATION NO, SEARCH REPORT), two expressions very common with scientific literature (ET AL, JOURNAL OF) and two other expressions that are so generic as to be useless in this context (OF THE, NO 11).
Using this information combined with the know-how of experienced Science-Metrix analysts, a black list was created. This black list contains phrases and expressions that identify non-scientific literature with a high degree of confidence. By running this list against the pool of reference strings and removing any that contain at least one black-listed expression, the pool was reduced from 13,101,891 to 5,577,941.
Matching references to scientific literature
Using advanced fuzzy matching algorithms, these references were tested against article entries in the Scopus database.
Numerous techniques, including direct string matching, bag-of-words models, candidate clustering and supervised machine learning were used to match the reference strings to actual articles. The matching algorithm was tuned to favor precision at the expense of recall. A total of 3,536,647 (67%) references were matched with high confidence to scientific literature in the Scopus database. The complete matching table is provided in an external .txt file.
External File 13: Patent number to Scopus ID.txt
A large share of the remaining references are non-scientific references, references to scientific articles not indexed in the Scopus database, or references lacking information to confidently match them to a publication. Here are examples of unmatched references:
Cohen et al. Microphone Array Post-Filtering for Non-Stationary Noise, source(s): IEEE, May 2002.
Mizumachi, Mitsunori et al. Noise Reduction by Paired-Microphones Using Spectral Subtraction,
source(s): 1998 IEEE. pp. 1001-1004.
Demol, M. et al. Efficient Non-Uniform Time-Scaling of Speech With WSOLA for CALL
Applications, Proceedings of InSTIL/ICALL2004 NLP and Speech Technologies in Advanced
Language Learning Systems Venice Jun. 17-19, 2004.
Laroche, Jean. Time and Pitch Scale Modification of Audio Signals, in Applications of Digital Signal
Processing to Audio and Acoustics , The Kluwer International Series in Engineering and Computer
Science, vol. 437, pp. 279-309, 2002.
Tekkno Trading Project Brandnews, NSP, Jan. 2008, p. 59.
Merriam-Webster Online Dictionary, Definition of Radial (Radially), accessed Oct. 27, 2010.
Merriam-Webster Online Dictionary: definitions of uniform and regular, printed Jul. 8, 2006.
Article: Mictrotechnology Opens Doors to the Universe of Small Space, Peter Zuska Medical Device &
Diagnostic Industry, Jan. 1997.
Article: For lab chips, the future is plastic. IVD Technology Magazine, May 1997.
Affinity Siderails Photographs dated Dec. 2009, numbered 1-6.
Information Disclosure Statement By Applicant dated Jan. 24, 2013.
Merriam-Webster's Collegiate Dictionary, published 1998 by Merriam-Webster, Incorporated, p. 924.

Bibliometrics and Patent Indicators for the Science and Engineering Indicators 2016 Technical Documentation
January 2016 29
© Science-Metrix Inc.
3.3.5 Data standardization: country, country groups, regions
To provide comparisons across countries and regions, data at the regional and national levels are presented in the SEI. It is fairly simple to identify publications at the national level in USPTO patents since two-letter country codes of inventors and applicants are provided in LexisNexis. The LexisNexis documentation includes a conversion table from country codes to country names. Science-Metrix matched country groups and regions using the LexisNexis conversion table, which allows quick identification of all countries included under each country group or region. Note that the aggregation of country groups and regions described above was performed after implementing corrections to country codes in the database. These corrections are detailed below.
During data production, it was discovered that information on country affiliation in the tables providing details on inventors and applicants was missing, with most of applicants and inventors being unassigned for the period 2001–2004. To correct this, freely available online data from the USPTO were used to fill these gaps in LexisNexis. This data was made available to the public free of charge following an agreement between Google and the USPTO.11 During importation of this data, some problems regarding the alignment of both databases were found (i.e., LexisNexis and online data). An algorithm was developed to resolve these problems.
Science-Metrix applied an additional correction for addresses of applicants or inventors that lacked country information in the database but for which state information matched that of one of the 50+1 two-letter codes for American states and the District of Columbia. In these cases, country information was forced to “US” in the Science-Metrix production database, which corrected this problem (see Section 3.3.6 for details on the standardization of U.S. states). Similar corrections were applied for data on Puerto Rico and the U.S. Virgin Islands. These were included under “Central and South America” in the last round of the SEI, and this was done again this time. However, to do so, country information had to be corrected for both of these countries as although they often appear under their proper country code in the database (i.e., PR and VI), in many cases the country code is instead set to “US”, with “PR” and “VI” being instead displayed in the state information. As such, all country codes set to “US” for which the state code is displayed as “PR” or “VI” were reassigned to “PR” or “VI” respectively to provide the valid number of patents for both, and to make it possible to assign these to the region of “Central and South America”.
Some country codes were impossible to link to a countries presented in the previous SEI edition. The patents associated with these codes have beeen coded as “Unclassified”.
External File 14: Patent number and SEQ to countries and regions.txt
3.3.6 Data standardization: U.S. states
Information regarding states for inventors and applicants on USPTO patents is provided in LexisNexis, but is mostly absent for most countries with the exception of the U.S. After filling in the missing state information for U.S. patents (see Section 3.3.5 for more details) using the USPTO Bulk Downloads on Google, Science-Metrix matched the two-letter U.S. state codes to U.S. state names. The only remaining corrections were patent records linked to Puerto Rico and the U.S. Virgin Islands, which are sometimes coded under the country code field in the database or under the state field as U.S. states (i.e., country code =“US”, state code =“PR/VI”. In these latter cases, countries for these inventors or applicants were reassigned to Puerto Rico or the U.S. Virgin Islands instead of the U.S. These are not included in
11 United States Patent and Trademark Office Bulk Downloads. Available at http://www.google.com/googlebooks/uspto.html

Bibliometrics and Patent Indicators for the Science and Engineering Indicators 2016 Technical Documentation
January 2016 30
© Science-Metrix Inc.
the total for the U.S., which resulted in U.S. states being limited to one of the 50+1 states (including the District of Columbia), or to be assigned as “unclassified” for those where state information was missing or invalid (i.e., not among the 51 U.S. state codes).
External File 15: Patent number and SEQ to American States.txt
3.3.7 Data coding: U.S. sectors
Coding of U.S. sectors was prepared using information about applicants for which the country code is “US”. U.S. applicants were assigned to three different sectors:
Government
Private
Academic
Automated coding was used to assign non-ambiguous forms of applicant names (e.g., “Univ” in the academic sector, “inc.” in Private) to the corresponding sector. After this first matching step, manual coding was performed to assign the remaining applicants’ names that could not be automatically assigned.
In some cases, the coding resulted in the same applicant being assigned to more than one sector because the applicants are duplicated in the LexisNexis database under different data formats (e.g., docdb, docdba). In many of these cases, this was because one of the forms provided more information than the others regarding this applicant (e.g., “Brigham and Women’s Hospital Inc.” and “Brigham and Women’s Hospital”).
The academic and government sectors have far lower patenting output than the private sector. Because it was decided that it was important to get accurate output estimates of these two sectors, Science-Metrix prioritized the crediting of patents to the academic and government sectors in cases of multiple matches. If these sectors had not been prioritized, it is believed that inaccurate and much lower estimates of patenting activity for these two sectors would have been obtained. Also, because many applicants were assigned to both sectors because of university-affiliated companies, this guided the decision toward prioritizing the academic sector when dual assignments with the private sector were detected.
External File 16: US applicant to sector.txt
3.3.8 Non-U.S. academic institutions
As with the coding of U.S. sectors (see 3.3.7), automatic and manual coding of applicants from the academic sector outside the U.S. was performed. Generic forms of academic institutions in different languages were looked for in the applicants’ names to retrieve all academic applicants across countries (e.g., Hochschule, ETH, Ecole).
External File 17: Non-US applicant to academic sector.txt
3.3.9 EPO academic institutions
As with the coding of the U.S. academic sector (see 3.3.7 and 3.3.8), Science-Metrix conducted automatic and manual coding of applicants from the academic sector at the EPO for both U.S. and non-U.S. applicants. Generic forms of academic institutions in different languages were looked for in the applicants’ names to retrieve all academic applicants across countries (e.g., Hochschule, ETH, Ecole).

Bibliometrics and Patent Indicators for the Science and Engineering Indicators 2016 Technical Documentation
January 2016 31
© Science-Metrix Inc.
External File 18: EPO US applicant to academic sector.txt
External File 19: EPO non-US applicant to academic sector.txt
Indexes have been created to increase computation performance.
External File 20: Create_LexisNexis_database_tables_index.sql
3.4 Indicators
This section presents the patenting indicators computed as part of this study.
3.4.1 Inventors versus applicants
Most of the indicators prepared for this project are based on data pertaining to inventors. Science-Metrix assigned country and state affiliations to addresses on patents linked to the inventors (not the organization owning the rights on the patents, i.e., applicants/assignees). Statistics based on sectors were prepared using information on applicants because the coding of sectors of activity requires assigning organizations to their corresponding sector (e.g., a university to the academic sector, a company to the private sector), and there is no information available on inventors’ affiliation. To avoid any potential confusion between both concepts, footnotes below delivered statistics tables always clearly indicate whether the data presented is based on inventors or applicants.
In cases where information on applicants was not available, the information on inventors was used to assign patents to countries or regions, assuming that these individuals owned the patents.
3.4.2 Applications versus granted patents
Most of the statistics compiled were based on granted patents. A single table presents statistics based on patent applications. One important distinction between applications and patents grants is the considerable time lag. While the application is closer to the time of invention, the granted patent is closer to the commercial return of the invention. Useful and complementary statistics can be derived from both approaches. However, several limitations in the quality of data on applications reduce its potential for the development of indicators. This is particularly true for U.S. applications, and Science-Metrix usually tries to avoid producing statistics for these. There are two main reasons for this:
Applicants can ask that the application not be published. Currently, only about 70% of patent
applications are published. This proportion varies by type of industry, PCT versus non-PCT, size of
company, country and over time. Science-Metrix is not aware of any statistics on these variations.
Importantly, once patents are granted, applications become public. So, this subsequently adds to the
number of applications that were made public at the moment of application. Therefore, the exact
number of applications is not known until at least 7–8 years later because of the time lapse between
application and grant. These results have at least two implications: (1) statistics are always incomplete in
more recent years, and (2) because of the variability in application-to-grant time, statistics for the most
recent years are biased.
The quality of data for applications is poor. Several applications don’t have any information on the
country and/or the state and/or the applicant name and/or the U.S. class. This information is sparse,
and the quality varies from one provider to another.

Bibliometrics and Patent Indicators for the Science and Engineering Indicators 2016 Technical Documentation
January 2016 32
© Science-Metrix Inc.
3.4.3 Kind codes
Kind codes are a classification system used across patent offices to classify document types. Each office has its own system and although similar codes are often used across offices, these systems are independent and thus not related to one another. One cannot assume that an identical kind code means the same thing across different offices.
The patenting indicators in this report were produced using set of kind codes that select granted utility patents and applications. Kind codes associated with utility patents at the USPTO were limited to three documents types: A, B1 and B2. Kind code A applies for granted patents before 2001, while B1 and B2 replaced this kind code starting 2 January 2001. Details about these document types are presented in Table XII.
Table XII USPTO kind codes included for the production of statistics on granted
patents
Source: Kind codes included on the USPTO Patent Documents (http://www.uspto.gov/learning-and-
resources/support-centers/electronic-business-center/kind-codes-included-uspto-patent)
Other types of granted patents were excluded from the analysis (e.g., design patents (S), and plant patents (P)) as the analysis focuses on utility patents.
On the other hand, statistics on applications were prepared using the kind codes A1, A2 and A9. Details about these document types are presented at Table XIII.
Table XIII USPTO kind codes included for the production of statistics on
applications
Source: Kind Codes included on the USPTO Patent Documents (http://www.uspto.gov/learning-and-
resources/support-centers/electronic-business-center/kind-codes-included-uspto-patent)
Statistics based on EPO granted patents were also prepared for the 2016 indicators. For this office, granted patents under kind codes B1, B2 and B3 were included in the analysis. Details about these document types are presented at Table XIV.
WIPO ST.16 Kind Codes Kind of document Comments
A Patent (Granted) No longer used as of January 2, 2001 (Kind code replaced by B1 or B2)
B1 Patent (Granted) No previously published pre-grant publication
B2 Patent (Granted) Having a previously published pre-grant publication and available March 2001
WIPO ST.16 Kind Codes Kind of document Comments
A1 Patent Application Publication Pre-grant publication available March 2001
A2Patent Application Publication
(Republication)Pre-grant publication available March 2001
A9Patent Application Publication
(Corrected Publication)Pre-grant publication available March 2001

Bibliometrics and Patent Indicators for the Science and Engineering Indicators 2016 Technical Documentation
January 2016 33
© Science-Metrix Inc.
Table XIV EPO kind codes included for the production of statistics on granted
patents
Source: Kind Codes included on the EPO Patent Documents
(http://ep.espacenet.com/help?topic=kindcodes&locale=EN_ep&method=handleHelpTopic)
Note that LexisNexis provides a pre-computed field (i.e., pat_type) that identifies patent documents that are either grants or applications. This field was used in combination with the kind codes listed above to limit the final sets of patents (e.g., for USPTO granted patents, pat_type=“Grant” and kind code= A, B1 or B2; for USPTO applications, pat_type=“Application” and kind code= A1, A2 or A9; for EPO granted patents, pat_type=“Grant” and kind code= B1, B2 or B3).
3.4.4 Number of patents
As opposed to the multiple indicators prepared using scientific articles, patent counts were the only indicators prepared using patent data. Full and fractional counting are the two principal ways of counting the number of papers.
Full counting
In the full counting method, each patent is counted once for each entity listed in the address field (either for inventors or applicants depending on the statistic prepared). For example, if two inventors from the U.S. and one from Canada were awarded a patent, the patent will be counted once for the U.S. and once for Canada. The same method applies for applicants. If a patent is assigned to Microsoft in the U.S., IBM in the U.S. and Siemens in Germany, the patent will be counted once for Microsoft, once for IBM and once for Siemens. It will also be counted once for the U.S. and once for Germany. When it comes to groups of institutions (e.g., research consortia) or countries (e.g., the European Union), double counting is avoided. This means that if inventors from Croatia and France are co-awarded a patent, when counting patents for the European Union this patent will be credited only once, even though each country will have been credited with one patent count.
Fractional counting
Fractional counting is used to ensure that a single patent is not counted several times. This approach avoids the use of total numbers across entities (e.g., inventors, organizations, regions, countries) that add up to more than the total number of patents, as is the case with full counting. Ideally, each inventor/applicant on a patent should be attributed a fraction of the patent that corresponds to his or her level of participation in the experiment compared to the other inventors/applicants. Unfortunately, no reliable means exists for calculating the relative effort of inventors/applicants on a patent, and thus each is granted the same fraction of the patent.
For this study, fractions were calculated at the address level for the production of data based on inventors. In the example presented for full counting (two inventors with addresses in the U.S., one inventor located in Canada) two thirds of the patent can be attributed to the U.S. and one third to Canada when the fractions are calculated at the level of addresses. Using the same approach for applicants in the other example (one address for Microsoft in the U.S., one for IBM in the U.S. and one for Siemens in Germany), each organization would be attributed one third of the patent.
WIPO ST.16 Kind Codes Kind of document Comment
B1 Patent (Granted) European patent specification (granted patent)
B2 Patent (Granted) New European patent specification (amended specification after opposition procedure)
B3 Patent (Granted) European patent specification (after limitation procedure)

Bibliometrics and Patent Indicators for the Science and Engineering Indicators 2016 Technical Documentation
January 2016 34
© Science-Metrix Inc.
While this approach is straightforward for most addresses indexed in the database, a very small fraction of addresses (a few hundred out of millions of addresses) are duplicated in the database and present contradictory information (e.g., two different countries for the same address). In these cases, the only way to address this problem would have been to look for all the patents online to correct the data; this was not possible within the given time frame. In the end, the country indexed under the first appearance of the address for a given patent was kept as the final country information for the production of the statistics. This enabled a single country assignation of addresses in the database. Given the very small fraction of affected addresses, it did not have a significant impact in any way on the final statistics prepared.
Fractional counting was also used to prepare data on EPO granted patents for the academic sector. As such, fractioning was only needed for applicants and was prepared in the same manner as that for the USPTO, with only one exception. While preparing the fractional counts with EPO applicants’ data, it was discovered that more than one organization was assigned to a single address (i.e., a single SEQ) for a limited but not negligible number of addresses, which was not the case in the USPTO data. Because of this, calculating fractional counts only at the level of addresses could not work properly, as more than one country could be associated with each address. To solve this problem, Science-Metrix partitioned the weight of an address between the different organizations on the address.

Bibliometrics and Patent Indicators for the Science and Engineering Indicators 2016 Technical Documentation
January 2016 35
© Science-Metrix Inc.
Appendix
Table Field Data type XPATH
PRORITY_CLAIMS pat_number varchar(50) bibliographic-data/publication-reference/document-id/doc-number
PRORITY_CLAIMS seq varchar(50) Automatically Incremented by parser
PRORITY_CLAIMS country varchar(50) bibliographic-data/priority-claims/priority-claim/country
PRORITY_CLAIMS doc_number varchar(50) bibliographic-data/priority-claims/priority-claim/doc-number
PRORITY_CLAIMS doc_kind varchar(50) bibliographic-data/priority-claims/priority-claim/pat_kind
PRORITY_CLAIMS doc_date varchar(50) bibliographic-data/priority-claims/priority-claim/pat_date
PATENT pat_number varchar(50) bibliographic-data/publication-reference/document-id/doc-number
PATENT pat_kind varchar(50) bibliographic-data/publication-reference/document-id/kind
PATENT pat_date varchar(50) bibliographic-data/publication-reference/document-id/date
PATENT pat_type varchar(50) bibliographic-data/publication-reference).attribute(publ-type)
PATENT appl_number varchar(50) bibliographic-data/application-reference/document-id/doc-number
PATENT appl_kind varchar(50) bibliographic-data/application-reference/document-id/kind
PATENT appl_date varchar(50) bibliographic-data/application-reference/document-id/date
PATENT appl_type varchar(50) bibliographic-data/application-reference).attribute(appl-type)
PATENT title varchar(8000)
bibliographic-data/invention-title
PATENT abstract varchar(MAX)
abstract
PATENT uuid int Unique identifier needed for Tull-Text Searching (see details)
PATCIT pat_number varchar(50) bibliographic-data/publication-reference/document-id/doc-number
PATCIT seq varchar(50) Automatically incremented by parser
PATCIT ref_number varchar(50) bibliographic-data/references-cited/citation/patcit/document-id/doc-number
PATCIT ref_kind varchar(50) bibliographic-data/references-cited/citation/patcit/document-id/kind
PATCIT ref_country varchar(50) bibliographic-data/references-cited/citation/patcit/document-id/country
PATCIT red_date varchar(50) bibliographic-data/references-cited/citation/patcit/document-id/date
PATCIT ref_appl_date varchar(50) bibliographic-data/references-cited/citation/patcit/application-date/date
NPLCIT pat_number varchar(50) bibliographic-data/publication-reference/document-id/doc-number
NPLCIT seq varchar(50) Automatically incremented by parser
NPLCIT ref varchar(8000)
bibliographic-data/references-cited/citation/nplcit/text
NATIONAL CLASS pat_number varchar(50) bibliographic-data/publication-reference/document-id/doc-number
NATIONAL CLASS seq varchar(50) Automatically incremented by parser
NATIONAL CLASS main_class varchar(50) bibliographic-data/classification-national/main-classification/class
NATIONAL CLASS main_subclass varchar(50) bibliographic-data/classification-national/main-classification/subclass
NATIONAL CLASS main_text varchar(50) bibliographic-data/classification-national/main-classification/text
NATIONAL CLASS class varchar(50) bibliographic-data/classification-national/further-classification/class
NATIONAL CLASS subclass varchar(50) bibliographic-data/classification-national/further-classification/subclass
NATIONAL CLASS text varchar(50) bibliographic-data/classification-national/further-classification/text
MAIN FAMILY pat_number varchar(50) bibliographic-data/publication-reference/document-id/doc-number

Bibliometrics and Patent Indicators for the Science and Engineering Indicators 2016 Technical Documentation
January 2016 36
© Science-Metrix Inc.
Table Field Data type XPATH
MAIN FAMILY seq varchar(50) Automatically incremented by parser
MAIN FAMILY doc_number varchar(50) bibliographic-data/patent-family/complete-family/family-member/document-id/doc-number
MAIN FAMILY kind varchar(50) bibliographic-data/patent-family/complete-family/family-member/document-id/kind
MAIN FAMILY country varchar(50) bibliographic-data/patent-family/complete-family/family-member/document-id/country
MAIN FAMILY date varchar(50) bibliographic-data/patent-family/complete-family/family-member/document-id/date
MAIN FAMILY appl_date varchar(50) bibliographic-data/patent-family/complete-family/family-member/application-date/date
MAIN FAMILY family_id varchar(50) bibliographic-data/patent-family/main-family.attribute(family-id)
APPLICANTS pat_number varchar(50) bibliographic-data/publication-reference/document-id/doc-number
APPLICANTS seq varchar(50) bibliographic-data/parties/applicants/applicant.attribute(sequence)
APPLICANTS orgname varchar(4000)
bibliographic-data/parties/applicants/applicant/adressbook/orgname
APPLICANTS orgname_std varchar(4000)
bibliographic-data/parties/applicants/applicant/adressbook/orgname-standardized
APPLICANTS orgname_std_type varchar(50) bibliographic-data/parties/applicants/applicant/adressbook/orgname-standardized.attribute(type)
APPLICANTS orgname_normalized varchar(4000)
bibliographic-data/parties/applicants/applicant/adressbook/orgname-normalized
APPLICANTS orgname_normalized_key
varchar(50) bibliographic-data/parties/applicants/applicant/adressbook/orgname-normalized.attribute(key)
APPLICANTS state varchar(50) bibliographic-data/parties/applicants/applicant/adressbook/address/state
APPLICANTS country varchar(50) bibliographic-data/parties/applicants/applicant/adressbook/address/country
APPLICANTS data_format varchar(50) bibliographic-data/parties/applicants/applicant.attribute(data-format)
APPLICANTS state2 varchar(50) Populated in further step, see 3.3.6
COMPLETEFAMILY
pat_number varchar(50) bibliographic-data/publication-reference/document-id/doc-number
COMPLETEFAMILY
seq varchar(50) Automatically incremented by parser
COMPLETEFAMILY
doc_number varchar(50) bibliographic-data/patent-family/complete-family/family-member/document-id/doc-number
COMPLETEFAMILY
kind varchar(50) bibliographic-data/patent-family/complete-family/family-member/document-id/kind
COMPLETEFAMILY
country varchar(50) bibliographic-data/patent-family/complete-family/family-member/document-id/country
COMPLETEFAMILY
date varchar(50) bibliographic-data/patent-family/complete-family/family-member/document-id/date
COMPLETEFAMILY
appl_date varchar(50) bibliographic-data/patent-family/complete-family/family-member/application-date/date
COMPLETEFAMILY
family_id varchar(50) bibliographic-data/patent-family/main-family.attribute(family-id)
CPC CLASS pat_number varchar(50) bibliographic-data/publication-reference/document-id/doc-number
CPC CLASS seq varchar(50) Automatically incremented by parser
CPC CLASS section varchar(50) bibliographic-data/classifications-cpc/classification-cpc/section
CPC CLASS class varchar(50) bibliographic-data/classifications-cpc/classification-cpc/class
CPC CLASS subclass varchar(50) bibliographic-data/classifications-cpc/classification-cpc/subclass
CPC CLASS main_group varchar(50) bibliographic-data/classifications-cpc/classification-cpc/main-group
CPC CLASS subgroup varchar(50) bibliographic-data/classifications-cpc/classification-cpc/subgroup
CPC CLASS symbol_position varchar(50) bibliographic-data/classifications-cpc/classification-cpc/symbol-position
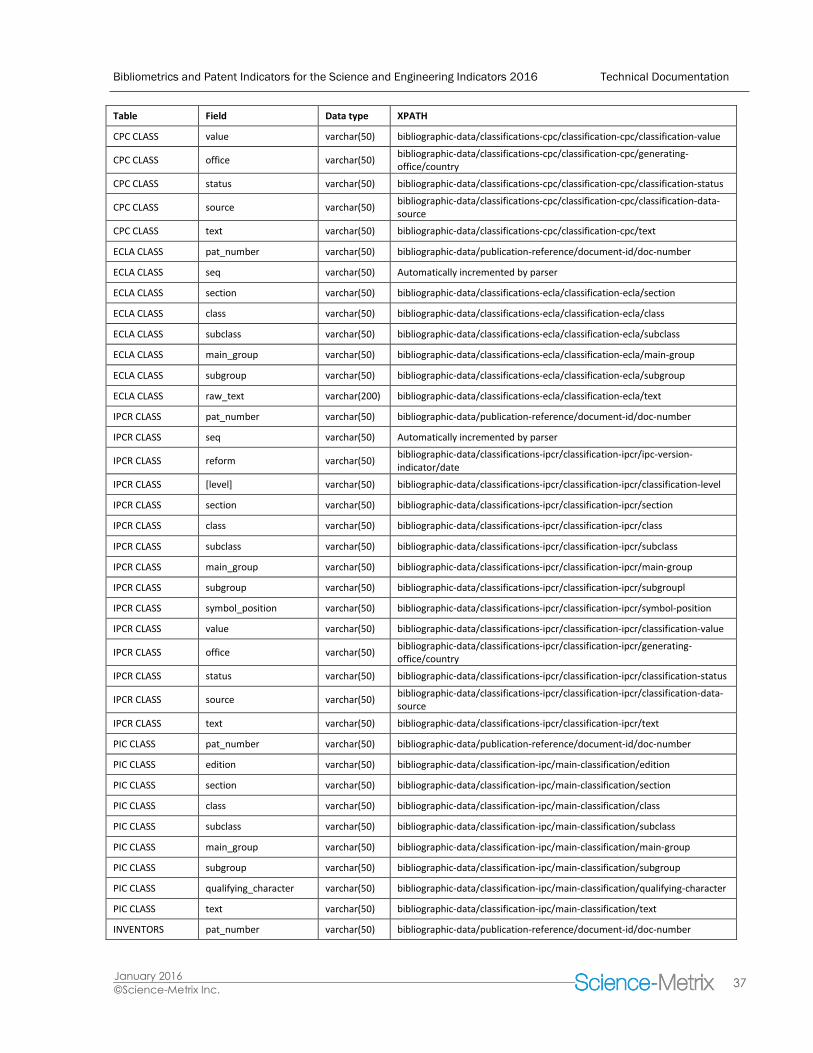
Bibliometrics and Patent Indicators for the Science and Engineering Indicators 2016 Technical Documentation
January 2016 37
© Science-Metrix Inc.
Table Field Data type XPATH
CPC CLASS value varchar(50) bibliographic-data/classifications-cpc/classification-cpc/classification-value
CPC CLASS office varchar(50) bibliographic-data/classifications-cpc/classification-cpc/generating-office/country
CPC CLASS status varchar(50) bibliographic-data/classifications-cpc/classification-cpc/classification-status
CPC CLASS source varchar(50) bibliographic-data/classifications-cpc/classification-cpc/classification-data-source
CPC CLASS text varchar(50) bibliographic-data/classifications-cpc/classification-cpc/text
ECLA CLASS pat_number varchar(50) bibliographic-data/publication-reference/document-id/doc-number
ECLA CLASS seq varchar(50) Automatically incremented by parser
ECLA CLASS section varchar(50) bibliographic-data/classifications-ecla/classification-ecla/section
ECLA CLASS class varchar(50) bibliographic-data/classifications-ecla/classification-ecla/class
ECLA CLASS subclass varchar(50) bibliographic-data/classifications-ecla/classification-ecla/subclass
ECLA CLASS main_group varchar(50) bibliographic-data/classifications-ecla/classification-ecla/main-group
ECLA CLASS subgroup varchar(50) bibliographic-data/classifications-ecla/classification-ecla/subgroup
ECLA CLASS raw_text varchar(200) bibliographic-data/classifications-ecla/classification-ecla/text
IPCR CLASS pat_number varchar(50) bibliographic-data/publication-reference/document-id/doc-number
IPCR CLASS seq varchar(50) Automatically incremented by parser
IPCR CLASS reform varchar(50) bibliographic-data/classifications-ipcr/classification-ipcr/ipc-version-indicator/date
IPCR CLASS [level] varchar(50) bibliographic-data/classifications-ipcr/classification-ipcr/classification-level
IPCR CLASS section varchar(50) bibliographic-data/classifications-ipcr/classification-ipcr/section
IPCR CLASS class varchar(50) bibliographic-data/classifications-ipcr/classification-ipcr/class
IPCR CLASS subclass varchar(50) bibliographic-data/classifications-ipcr/classification-ipcr/subclass
IPCR CLASS main_group varchar(50) bibliographic-data/classifications-ipcr/classification-ipcr/main-group
IPCR CLASS subgroup varchar(50) bibliographic-data/classifications-ipcr/classification-ipcr/subgroupl
IPCR CLASS symbol_position varchar(50) bibliographic-data/classifications-ipcr/classification-ipcr/symbol-position
IPCR CLASS value varchar(50) bibliographic-data/classifications-ipcr/classification-ipcr/classification-value
IPCR CLASS office varchar(50) bibliographic-data/classifications-ipcr/classification-ipcr/generating-office/country
IPCR CLASS status varchar(50) bibliographic-data/classifications-ipcr/classification-ipcr/classification-status
IPCR CLASS source varchar(50) bibliographic-data/classifications-ipcr/classification-ipcr/classification-data-source
IPCR CLASS text varchar(50) bibliographic-data/classifications-ipcr/classification-ipcr/text
PIC CLASS pat_number varchar(50) bibliographic-data/publication-reference/document-id/doc-number
PIC CLASS edition varchar(50) bibliographic-data/classification-ipc/main-classification/edition
PIC CLASS section varchar(50) bibliographic-data/classification-ipc/main-classification/section
PIC CLASS class varchar(50) bibliographic-data/classification-ipc/main-classification/class
PIC CLASS subclass varchar(50) bibliographic-data/classification-ipc/main-classification/subclass
PIC CLASS main_group varchar(50) bibliographic-data/classification-ipc/main-classification/main-group
PIC CLASS subgroup varchar(50) bibliographic-data/classification-ipc/main-classification/subgroup
PIC CLASS qualifying_character varchar(50) bibliographic-data/classification-ipc/main-classification/qualifying-character
PIC CLASS text varchar(50) bibliographic-data/classification-ipc/main-classification/text
INVENTORS pat_number varchar(50) bibliographic-data/publication-reference/document-id/doc-number

Bibliometrics and Patent Indicators for the Science and Engineering Indicators 2016 Technical Documentation
January 2016 38
© Science-Metrix Inc.
Table Field Data type XPATH
INVENTORS seq varchar(50) bibliographic-data/parties/inventors/inventor.attribute(sequence)
INVENTORS name varchar(4000)
bibliographic-data/parties/inventors/inventor/addressbook/name
INVENTORS state varchar(4000)
bibliographic-data/parties/inventors/inventor/addressbook/address/state
INVENTORS country varchar(50) bibliographic-data/parties/inventors/inventor/addressbook/address/country
INVENTORS data_format varchar(4000)
bibliographic-data/parties/inventors/inventor/data-format
INVENTORS state2 nchar(10) Populated in further step, see 3.3.6
LEGAL EVENTS pat_number varchar(50) bibliographic-data/publication-reference/document-id/doc-number
LEGAL EVENTS seq varchar(50) Automatically incremented by parser
LEGAL EVENTS pub_date varchar(50) legal-data/egal-event/publication-date/date
LEGAL EVENTS event_code varchar(50) legal-data/egal-event/event-code-1
LEGAL EVENTS effect varchar(50) legal-data/egal-event/effect
LEGAL EVENTS description varchar(500) legal-data/egal-event/legal-description
LEGAL EVENTS status varchar(50) legal-data/egal-event/status identifier
LEGAL EVENTS docdb varchar(50) legal-data/egal-event/docdb-publication-number
EXAMINERS pat_number varchar(50) bibliographic-data/publication-reference/document-id/doc-number
EXAMINERS primary_examiner varchar(500) bibliographic-data/examiners/primary-examiner/name
EXAMINERS assistant_examiner varchar(500) bibliographic-data/examiners/assistant-examiner/name