the value of control: implications for control premia...
TRANSCRIPT

1
1
The Value of Control: Implications for Control Premia, Minority
Discounts and Voting Share Differentials
Aswath Damodaran
Stern School of Business
June 2005
2
2
The Value of Control It is not uncommon in private company and acquisition valuations to see large
premiums attached to estimated value to reflect the “value of control’. But what, if any, is
the value of control in a firm, and if it exists, how do we go about estimating it? In this
paper, we examine the ingredients of the control premium. In particular, we argue that the
value of controlling a firm has to lie in being able to run it differently (and better).
Consequently, the value of control will be greater for poorly managed firms than well run
ones. The value of control has wide ranging implications beyond acquisitions. We show
that the expected likelihood of control changing is built into the price of every publicly
traded company and that this provides a way of measuring the payoff to strong corporate
governance. We also argue that getting a better handle on the value of control can allow
us to better explain the differences between voting and non-voting share prices and the
minority discount in private company valuations.

3
3
What is the value of controlling a business? The answer to this question has wide-
ranging implications for how stocks are priced and the premiums that should be paid in
acquisitions. In this paper, we examine why there may be value to controlling a firm and
how to go about measuring this value. We then consider the wide range of cases where
the value of control applies ranging from the premiums that you would pay for voting
shares (as opposed to non-voting shares) and the minority discounts in private company
valuations.
Measuring the Expected Value of Control The value of controlling a firm derives from the fact that you believe that you or
someone else would operate the firm differently from the way it is operated currently. We
will begin this section by considering the dimensions on which management decisions
can affect the value of the firm and how to measure the effect of the change. We will
follow up by considering the probability that existing management policies can be
changed. The expected value of control is the product of these two variables: the change
in value from changing the way a firm is operated and the probability that this change
will occur.
The Value of Control The value of a business is determined by decisions on made by the managers of
that business on where to invest its resources, how to fund these investments and how
much cash to return to the owners of the business. Consequently, when we value a
business, we make implicit or explicit assumptions about both who will run that business
and how they will run it. In other words, the value of a business will be much lower if we
assume that it is run by incompetent managers rather than by competent ones. When
valuing an existing company, private or public, where there is already a management in
place, we are faced with a choice. We can value the company run by the incumbent
managers and derive what we can call a status quo value. We can also revalue the
company with a hypothetical “optimal” management team and estimate an optimal value.
The difference between the optimal and the status quo values can be considered the value
of controlling the business.

4
4
The Determinants of Firm Value
The value of any asset is a function of the cash flows generated by that asset, the
life of the asset, the expected growth in the cash flows and the risk associated with the
cash flows. Building on one of the first principles in finance, the value of an asset can be
viewed as the present value of the expected cash flows on that asset, where the asset has a
life of N years and r is the discount rate that reflects both the riskiness of the cash flows
and financing mix used to acquire it.
Value of Asset = E(Cash Flowt)
(1 + r) t
t =1
t = N
!
If we view a firm as a collection of assets, this approach can be extended to value a firm,
using cash flows to the firm over its life and a discount rate that reflects the collective
risk of the firm’s assets. This process is complicated by the fact that while some of the
assets of a firm have already been made, and are thus assets-in-place, a significant
component of firm value reflects expectations about future investments. Thus, to value a
firm, we need to measure not just the cash flows from investments already made, but also
estimate the expected value from future growth. In the following section, we will
consider some of the basic principles that should guide our estimates of cash flows,
growth and discount rates.
I. Cash Flow to the Firm
The cash flow to the firm that we would like to estimate should be both after taxes
and after all reinvestment needs have been met. Since a firm is composed both debt and
equity investors, the cash flow to the firm should be before interest and principal
payments on debt and can be measured in two ways. One is to add up the cash flows to
all of the different claim holders in the firm. Thus, the cash flows to equity investors
(which take the form of dividends or stock buybacks) are added to the cash flows to debt
holders (interest and net debt payments) to arrive at the cash flow. The other approach to
estimating cash flow to the firm, which should yield equivalent results, is to estimate the
cash flows to the firm prior to debt payments but after reinvestment needs have been met:
EBIT (1 - tax rate)
5
5
– (Capital Expenditures - Depreciation)
– Change in Non-cash Working Capital
= Free Cash Flow to the Firm
The difference between capital expenditures and depreciation (net capital expenditures)
and the increase in non-cash working capital represents the reinvestment made by the
firm to generate future or contemporaneous growth.
Another way of presenting the same equation is to add the net capital
expenditures and working capital change to arrive at total reinvestment, and state it as a
percentage of the after-tax operating income. This ratio of reinvestment to after-tax
operating income is called the reinvestment rate, and the free cash flow to the firm can be
written as:
Free Cash Flow to the Firm = EBIT (1-t) (1 – Reinvestment Rate)
Note that the reinvestment rate can exceed 100%1, if the firm has substantial reinvestment
needs. If that occurs, the free cash flow to a firm will be negative even though after-tax
operating income is positive.
II. Expected Growth
In valuation, it is expected future cash flows that determine value. While the
definition of the cash flow, described in the last section, still holds, it is the forecasts of
earnings, net capital expenditures and working capital that will yield these cash flows.
One of the most significant inputs into any valuation is the expected growth rate in
operating income. While one could use past growth or consider analyst forecasts to make
this estimate, the fundamentals that drive growth are simple.
The first component is growth from new investments, which is the product of a firm's
reinvestment rate, i.e., the proportion of the after-tax operating income that is invested in
net capital expenditures and changes in non-cash working capital, and the quality of these
reinvestments, measured by the return on the capital invested.
Expected GrowthNew Investments = Reinvestment Rate * Return on Capital
where,
1 In practical terms, this firm will have to raise external financing, from debt or equity or from both, to cover the excess reinvestment.

6
6
Reinvestment Rate =Capital Expenditure - Depreciation + ! Non - cash WC
EBIT (1 - tax rate)
Return on Capital = EBIT (1-t) / Capital Invested
Both measures should be forward looking and the return on capital should represent the
expected return on capital on future investments. In practice, it is often based upon the
firm's return on capital on assets in place, where the book value of capital is assumed to
measure the capital invested in these assets. Implicitly, we assume then that the current
accounting return on capital is a good measure of the true returns earned on assets in
place, and that this return is a good proxy for returns that will be made on future
investments.
The second component is the growth from managing existing investments more
efficiently. Consider a simple example. Assume that you have a firm that earns a return
on capital of 5% on its existing investments. If it can double the return on capital to 10%
next year, it will double its earnings and report a 100% growth rate in operating income
for the year. In general, the growth rate from generating a higher return on capital from
existing investments can be written as follows:
Expected GrowthEfficiency = (ROCt, Existing Investments- ROCt-1, Existing Investments)/ ROCt-1, Existing Investments
If the improvement in return on capital on existing investments occurs over multiple
years, this growth rate has to be spread over the period.2
The key difference between the two components of growth lies in their
sustainability. Growth from new investments can continue in the long term, as long as the
company continues to reinvest at the specified return on capital. Growth from existing
assets can occur only in the short term, since there is a limit to how efficiently you can
utilize existing assets.
III. Discount Rate
The expected cash flows need to be discounted back at a rate that reflects the cost of
financing these assets. The cost of capital is a composite cost of financing that reflects the
costs of both debt and equity, and their relative weights in the financing structure:
2 If the doubling in return on capital occurs over 5 years, for instance, the growth rate each year can be estimated as follows: Annual growth rate = {1 +(ROCt,- ROCt-1)/ ROCt-1}1/n-1 = (1 +(.10-.05)/.05)1/5-1 = .1487

7
7
Cost of Capital = kequity (Equity/(Debt+Equity) + kdebt (Debt/(Debt + Equity)
where the cost of equity(kequity) represents the rate of return required by equity investors
in the firm, and the cost of debt (kdebt ) measures the current cost of borrowing, adjusted
for the tax benefits of borrowing. The weights on debt and equity have to be market value
weights. Without getting into the specifics of models of risk and return in finance, the
cost of equity for a publicly traded company should reflect the risk added on by an
investment to a diversified portfolio and can be measured with a beta (in the single-factor
model) or betas (in multi factor models).
A firm’s cost of capital will be determined by the mix of debt and equity it
chooses to use, and whether the debt reflects the assets of the firm; long term assets
should be funded with long term debt and short term assets by short term debt. Using a
sub-optimal mix of debt and equity to fund its investments or mismatching debt to assets
can result in a higher cost of capital and a lower firm value.
IV. Asset Life
Publicly traded firms do not have finite lives. Given that we cannot estimate cash
flows forever, we generally impose closure in valuation models by stopping our
estimation of cash flows sometime in the future and then computing a terminal value that
reflects all cash flows beyond that point. A number of approaches exist for computing the
terminal value, including the use of multiples. The approach that is most consistent with a
discounted cash flow model is one where we assume that cash flows, beyond the terminal
year, will grow at a constant rate forever, in which case the terminal value can be
estimated as follows:
Terminal valuen = FCFFn+1 / (Cost of Capitaln+1 - gn)
The cost of capital and the growth rate in the model are sustainable forever. It is this fact,
i.e., that they are constant forever that allows us to put some reasonable constraints on
them. Since no firm can grow forever at a rate higher than the growth rate of the economy
in which it operates, the stable growth rate cannot be greater than the overall growth rate
of the economy. In the same vein, stable growth firms should be of average risk. Finally,
The compounded annual growth rate will be 14.87%.
8
8
the relationship between growth and reinvestment rates that we noted earlier can be used
to generate the free cash flow to the firm in the first year of stable growth:
Terminal Value =
EBITn+1(1 ! t) 1 -gn
ROCn
"
# $
%
& '
(WACCn ! gn )
where the ROCn is the return on capital that the firm can sustain in stable growth. In the
special case where ROC is equal to the cost of capital3, this estimate simplifies to become
the following:
Terminal Value ROC= WACC = EBITn+1(1 ! t)
WACCn
Thus, in every discounted cash flow valuation, there are two critical assumptions we need
to make on stable growth. The first relates to when the firm that we are valuing will
become a stable growth firm, if it is not one already. The second relates to what the
characteristics of the firm will be in stable growth, in terms of return on capital and cost
of capital.
Bringing it All Together
In summary, then, to value any firm, we begin by estimating how long high
growth will last, how high the growth rate will be during that period and the cash flows
during the period. We end by estimating a terminal value and discounting all of the cash
flows, including the terminal value, back to the present to estimate the value of the firm.
Figure 1 summarizes the process and the inputs in a discounted cash flow model.
3 This assumes that a firm cannot make positive excess returns in perpetuity, since competition will be attracted by these returns.

9
9
Cashflow to FirmEBIT (1-t)- (Cap Ex - Depr)- Change in WC= FCFF
Expected GrowthReinvestment Rate* Return on Capital
FCFF1 FCFF2 FCFF3 FCFF4 FCFF5
Forever
Firm is in stable growth:Grows at constant rateforever
Terminal Value= FCFF n+1/(r-gn)
FCFFn.........
Cost of Equity Cost of Debt(Riskfree Rate+ Default Spread) (1-t)
WeightsBased on Market Value
Discount at Cost of Capital (WACC) = Cost of Equity (Equity/(Debt + Equity)) + Cost of Debt (Debt/(Debt+ Equity))
Firm Value- Value of Debt= Value of Equity
Riskfree Rate :- No default risk- No reinvestment risk- In same currency andin same terms (real or nominal as cash flows
+Beta- Measures market risk X
Risk Premium- Premium for averagerisk investment
Type of Business
Operating Leverage
FinancialLeverage
Base EquityPremium
Country RiskPremium
Figure 1: Firm Value

10
10
Ways of Increasing Value
A firm can increase its value by increasing cash flows from current operations,
increasing expected growth and the period of high growth and by reducing its composite
cost of financing. In reality, however, none of these is easily accomplished and whether
these changes can be made is a function of all of the qualitative factors that we are often
accused of ignoring in valuation - the quality of management, the strength of brand name,
strategic decisions and good marketing.
1. Increase Cash Flows From Assets In Place
The first place to look for value is in the assets in place of the firm. These assets
reflect investments that have already been made by the firm that generate the current
operating income for the firm. To the extent that these investments earn less than the cost
of capital, or are earning less than they could, if optimally managed, there is potential for
value creation. In general, actions taken to increase cash flows from assets in place can
be categorized into the following groups:
• Asset Redeployment: To the extent that the assets of a business are poorly
invested, you can increase the cash flows and value of the firm by divesting
poorly performing assets4 or by moving assets from their existing uses to ones
that generate higher value. One example would be a retail firm that owns its stores
deciding that the store spaces would be worth more developed as commercial real
estate instead of being used in retailing.
• Improved operating efficiency: When a firm’s operations are riddled with
inefficiencies, reducing or eliminating these inefficiencies will translate into an
increase in operating cash flows and value. Thus, a telecommunications firm that
is overstaffed should be able to generate value by reducing the size of its
workforce. A steel company that is losing money because of outdated equipment
in its plants may be able to increase its value by replacing them with newer, more
efficient equipment. In recent years, manufacturing companies in developed
4 At first sight, divesting businesses that are earning poor returns or losing money may seem like the ticket to value creation. However, the real test is whether the divestiture value exceeds the value of continuing in

11
11
markets like the United States and Western Europe have been able to generate
substantial savings in costs by moving their operations to emerging markets
where labor costs are lower.
• Reduce tax burden: It is every firm’s obligation to pay its rightful due in taxes but
not to pay more than its fair share. If a firm can legally reduce its tax burden, it
should do so. A multinational firm may be able to reduce its taxes by moving
more of its operations (and the ensuing earnings) to lower tax locales. Risk
management can also play a role in reducing taxes by smoothing out earnings
over periods; spikes in income can subject a firm to higher taxes.
• Reduce capital maintenance and working capital investments: A significant
portion of after-tax operating income is often reinvested in the firm not to
generate future growth but to maintain existing operations. This reinvestment
includes capital maintenance (which is capital expenditure designed to maintain
and replace existing assets) and investments in inventory or accounts receivable.
Much of this reinvestment may be unavoidable, because assets age and firms need
working capital to generate sales. In some firms, though, there may be potential
for savings, especially in working capital. A retail firm that maintains inventory at
10% of sales, when the average for the sector is only 5%, can increase cash flows
substantially if it can bring its inventory levels down to industry standards.
2. Increase Expected Growth
A firm with low current cash flows can still have high value if it is able to grow
quickly during the high growth period. As noted earlier, higher growth can come either
from new investments or from more efficiently utilizing existing assets.
• With new investments, higher growth has to come from either a higher
reinvestment rate or a higher return on capital on new investments or both. Higher
growth does not always translate into higher value, since the growth effect can be
offset by changes elsewhere in the valuation. Thus, higher reinvestment rates
usually result in higher expected growth but at the expense of lower cash flows,
the business; if it is, divestiture makes sense. After all, when a business is earning poor returns, it is unlikely that a potential buyer will pay a premium price for it.

12
12
since more reinvestment reduces free cash flows at least in the near term.5 To the
extent that the return on capital on the new investments is higher (lower) than the
cost of capital, the value of the business will increase (decrease) as the
reinvestment rate rises. Similarly, higher returns on capital also cause expected
growth to increase, but value can still go down if the new investments are in
riskier businesses and there is a more than proportionate increase in the cost of
capital.
• With existing assets, the effect is more unambiguous, with higher returns on
capital translating into higher growth and higher value. A firm that is able to
increase its return on capital on existing assets from 2% to 8% over the next 5
years will report healthy growth and higher value.
Which of these two avenues offers the most promise for value creation? The answer will
depend upon the firm in question. For mature firms with low returns on capital
(especially when less than the cost of capital), extracting more growth from existing
assets is likely to yield quicker results, at least in the short term. For smaller firms with
relatively few assets in place, generating reasonable returns, growth has to come from
new investments that generate healthy returns.
3. Lengthen the Period of High Growth
As noted above, every firm, at some point in the future, will become a stable growth
firm, growing at a rate equal to or less than the economy in which it operates. In addition,
growth creates value only if the return on investments exceeds the cost of capital. Clearly,
the longer high growth and excess returns last, other things remaining equal, the greater
the value of the firm. Note, however, that no firm should be able to earn excess returns
for any length of period in a competitive product market, since competitors will be
attracted by the excess returns into the business. Thus, implicit in the assumption that
there will be high growth, in conjunction with excess returns, is also the assumption that
there exist some barriers to entry that prevent firms from earning excess returns for
extended time periods. 5 Acquisitions have to be considered as part of capital expenditures for reinvestment. Thus, it is relatively easy for firms to increase their reinvestment rates but very difficult for these firms to maintain high returns
13
13
Given this relationship between how long firms can grow at above-average rates and
the existence of barriers to entry, one way firms can increase value is by increasing
existing barriers to entry and coming up with new barriers to entry. Another way of
saying the same thing is to note that companies that earn excess returns have significant
competitive advantages. Nurturing these advantages can increase value.
4. Reduce the cost of financing
The cost of capital for a firm was defined earlier to be a composite cost of debt
and equity financing. The cash flows generated over time are discounted back to the t at
the cost of capital. Holding the cash flows constant, reducing the cost of capital will
increase the value of the firm. There are four ways in which a firm can bring its cost of
capital down, or more generally, increase its firm value by changing both financing mix
and type.
• Make products/services less discretionary: The operating risk of a firm is a direct
function of the products or services it provides and the degree to which these
products/services are discretionary to its customers. The more discretionary they
are, the greater the operating risk faced by the firm. Consequently, firms can
reduce their operating risk by making their products and services less
discretionary to their customers. Advertising clearly plays a role, but coming up
with new uses for a product/service may be another.
• Reduce operating leverage: The operating leverage of a firm measures the
proportion of its costs that are fixed. Other things remaining equal, the greater the
proportion of the costs of a firm that are fixed, the more volatile its earnings will
be, and the higher its cost of equity/capital will be. Reducing the proportion of the
costs that are fixed will make a firm less risky and reduce its cost of capital. 6
• Changing financing mix: Debt is always cheaper than equity, partly because
lenders bear less risk than equity investors and partly because of the tax advantage
associated with debt. Offsetting this advantage is the fact that borrowing money
increases the risk and the cost of both debt (by increasing the probability of
on capital as they do so.
14
14
bankruptcy) and equity (by making earnings to equity investors more volatile).
The net effect will determine whether the cost of capital will increase or decrease
if the firm takes on more debt. One way of defining the optimal financing mix is
to define it as the mix at which the cost of capital is minimized.
• Match financing to assets: The fundamental principle in designing the financing
of a firm is to ensure that the cash flows on the debt match as closely as possible
the cash flows on the asset. Firms that mismatch cash flows on debt and cash
flows on assets (by using short term debt to finance long term assets, debt in one
currency to finance assets in a different currency or floating rate debt to finance
assets whose cash flows tend to be adversely impacted by higher inflation) will
end up with higher default risk, higher costs of capital and lower firm values. To
the extent that firms can use derivatives and swaps to reduce these mismatches,
firm value can be increased.
5. Manage non-operating Assets
In the first four components of value creation, we have focused on ways in which
a firm can increase its value from operating assets. A significant chunk of a firm’s value
can derive from its non-operating assets – cash and marketable securities, holdings in
other companies and pension fund assets (and obligations). To the extent that these assets
are sometimes mismanaged, there is potential for value enhancement here.
5.1. Cash and Marketable Securities
In conventional valuation, we assume that the cash and marketable securities that
are held by a firm are added on to the value of operating assets to arrive at the value of
the firm. Implicitly, we assume that cash and marketable securities are neutral
investments (zero NPV investments), earning a fair rate of return, given the risk of the
investments. Thus, a cash balance of $ 2 billion invested in treasury bills and commercial
paper may earn a low rate of return but that return is what you would expect to earn on
these investments.
6 Outsourcing and more flexible wage contracts, both phenomena that have been widely reported on over the last decade, can be viewed as attempts by firms to reduce their fixed costs.
15
15
There are, however, two scenarios where large cash balance may not be value
neutral and thus provide opportunities for value enhancement. The first is when cash is
invested at below market rates. A firm with $ 2 billion in a cash balance held in a non-
interest bearing checking account is clearly hurting its stockholders. The second is when
investors are concerned that the cash will be misused by management to make poor
investments (or acquisitions). In this case, there will be a discount applied to cash to
reflect the likelihood that management will misuse the case the consequences of such
misuse. Reverting back to the example of the company with $ 2 billion in cash, assume
that investors believe that there is a 25% chance that this cash will be used to fund an
acquisition and that the firm will over pay by $ 500 million on this acquisition. The value
of cash at this company can be estimated as follows:
Value of Cash = Stated Cash Balance – Probability of Poor Investment * Cost of Poor
Investment = $ 2 billion – 0.25* 0.5 billion = $ 1.875 billion
In either of these scenarios, returning some or all of this cash to stockholders in the form
of dividends or stock buybacks will make stockholders better off.
5.2. Holdings in other companies
When firms acquire stakes in other firms, the value of these holdings will be
added on to the value of operating assets to arrive at the value of the equity of the firm. In
conventional valuation, again, these holdings have a neutral effect on value. As with
cash, there are potential problems with these cross holdings that can cause them to be
discounted (relative to their true value) by markets. Cross holdings are difficult to value,
especially when they are in subsidiary firms with different risk and growth profiles than
the parent company. It is not surprising that firms with substantial cross holdings in
diverse businesses often find these holdings being undervalued by the market. In some
cases, this undervaluation can be blamed on information gaps, caused by the failure to
convey important details on growth, risk and cash flows on cross holdings to the markets.
In other cases, the undervaluation may reflect market skepticism about the parent
company’s capacity to manage its cross holding portfolio; consider this a conglomerate

16
16
discount.7 If such a discount applies, the prescription for increased value is simple.
Spinning off or divesting the cross holdings and thus exposing their true value should
make stockholders in the parent company better off.
5.3. Pension fund Obligations (and Liabilities)
Most firms have large pension obligations and matching pension assets. To the
extent that both the obligations and assets grow over time, they offer both threats and
opportunities. A firm that mismanages its pension fund assets may find itself with an
unfunded pension obligation, which reduces the value of its equity. On the other hand, a
firm that generates returns that are higher than expected on its pension fund assets could
end up with an over-funded pension plan and higher equity value.
There are ways of creating value from pension fund investments, though some are
more questionable from an ethical perspective than others. The first is to invest pension
fund assets better, generating higher risk-adjusted returns and higher value for
stockholders. The second (and more questionable approach) is to reduce pension fund
obligations, either by renegotiating with employees or by passing the obligation on to
other entities (such as the government) while holding on to pension fund assets.
The Value of Changing Management
If we consider value to be the end result of the investment, financing and dividend
decisions made by a firm, the value of firm will be a function of how optimal (or sub-
optimal) we consider a firm’s management to be. If we estimate a value for the firm,
assuming that existing management practices continue, and call this a status quo value
and re-estimate the value of the same firm, assuming that it is optimally managed, and
call this estimate the optimal value, the value of changing management can be written as:
Value of management change = Optimal firm value – Status quo value
The value of changing management will be a direct consequence of how much we can
improve the way the firm is run. The value of changing management will be zero in a
firm that is already optimally managed and substantial for a firm that is badly managed.
7 Studies looking at conglomerates conclude that they trade at a discount of between 5 and 10% on the value of the pieces that they are composed of.
17
17
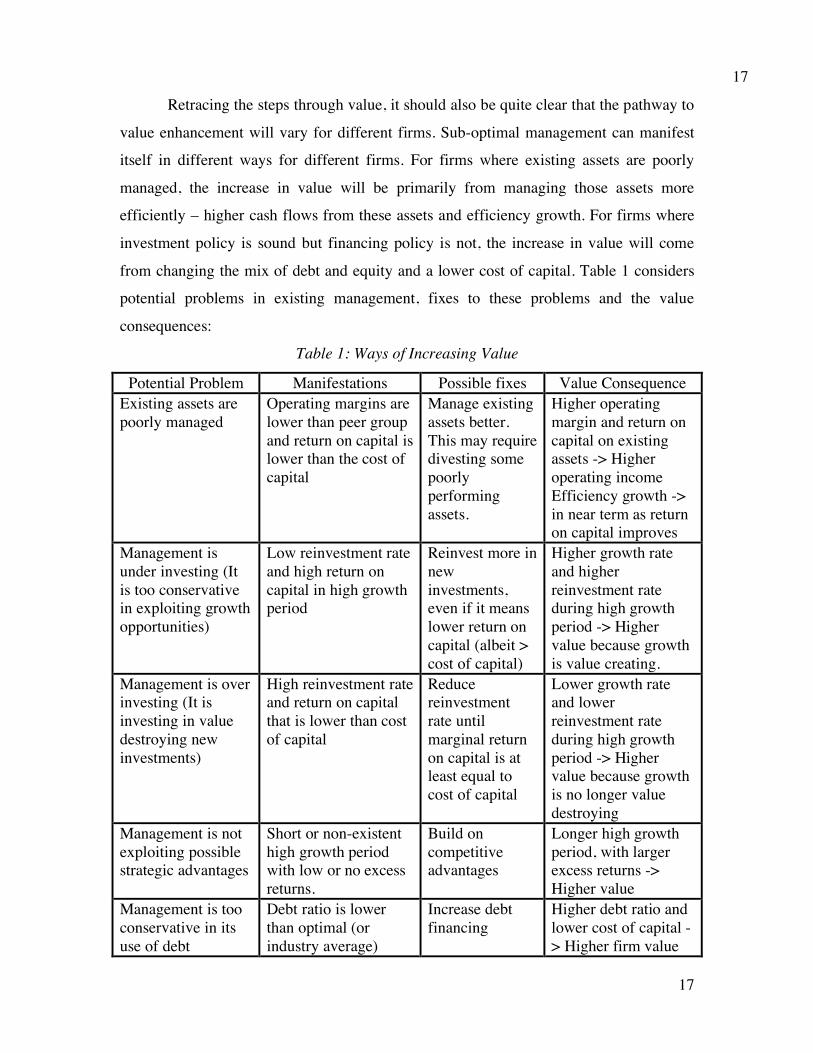
Retracing the steps through value, it should also be quite clear that the pathway to
value enhancement will vary for different firms. Sub-optimal management can manifest
itself in different ways for different firms. For firms where existing assets are poorly
managed, the increase in value will be primarily from managing those assets more
efficiently – higher cash flows from these assets and efficiency growth. For firms where
investment policy is sound but financing policy is not, the increase in value will come
from changing the mix of debt and equity and a lower cost of capital. Table 1 considers
potential problems in existing management, fixes to these problems and the value
consequences:
Table 1: Ways of Increasing Value
Potential Problem Manifestations Possible fixes Value Consequence Existing assets are poorly managed
Operating margins are lower than peer group and return on capital is lower than the cost of capital
Manage existing assets better. This may require divesting some poorly performing assets.
Higher operating margin and return on capital on existing assets -> Higher operating income Efficiency growth -> in near term as return on capital improves
Management is under investing (It is too conservative in exploiting growth opportunities)
Low reinvestment rate and high return on capital in high growth period
Reinvest more in new investments, even if it means lower return on capital (albeit > cost of capital)
Higher growth rate and higher reinvestment rate during high growth period -> Higher value because growth is value creating.
Management is over investing (It is investing in value destroying new investments)
High reinvestment rate and return on capital that is lower than cost of capital
Reduce reinvestment rate until marginal return on capital is at least equal to cost of capital
Lower growth rate and lower reinvestment rate during high growth period -> Higher value because growth is no longer value destroying
Management is not exploiting possible strategic advantages
Short or non-existent high growth period with low or no excess returns.
Build on competitive advantages
Longer high growth period, with larger excess returns -> Higher value
Management is too conservative in its use of debt
Debt ratio is lower than optimal (or industry average)
Increase debt financing
Higher debt ratio and lower cost of capital -> Higher firm value

18
18
Management is over using debt
Debt ratio is higher than optimal
Reduce debt financing
Lower debt ratio and lower cost of capital -> Higher firm value
Management is using wrong type of financing
Cost of debt is higher than it should be, given the firm’s earning power
Match debt up to assets, using swaps, derivatives or refinancing
Lower cost of debt and cost of capital -> Higher firm value
Management holds excess cash and is not trusted by the market with the cash.
Cash and marketable securities are a large percent of firm value; Firm has poor track record on investments.
Return cash to stockholders, either as dividends or stock buybacks
Firm value is reduced by cash paid out, but stockholders gain because the cash was discounted in the firm’s hands.
Management has made investments in unrelated companies.
Substantial cross holdings in other companies that are being undervalued by the market.
As a first step, try to be more transparent about cross holdings. If that is not sufficient, divest cross holdings
Firm value is reduced by divested cross holdings but increased by cash received from divestitures. When cross holdings are under valued, the latter should exceed the former.
Illustration 1: The Value of Changing Management – SAP
SAP is a business software manufacturing company, headquartered in Germany.
It has a well-deserved reputation for good management, especially when it comes to new
investments; it reinvested 57.42% of its after-tax operating income back into the
company and generated a return on capital of 19.93% in 2004. On both dimensions, it did
considerably better than its peer group. The management is, however, extremely
conservative when it comes to the use of debt and has a debt ratio of 14%; its resulting
cost of capital is 8.68%. In figure 2, we value the company assuming that it will continue
its current investment policy (maintaining its reinvestment rate and return on capital from
2004 for the next 5 years) and its conservative financing policy. The value per share that
we arrive at is 106.12 Euros.
19
19
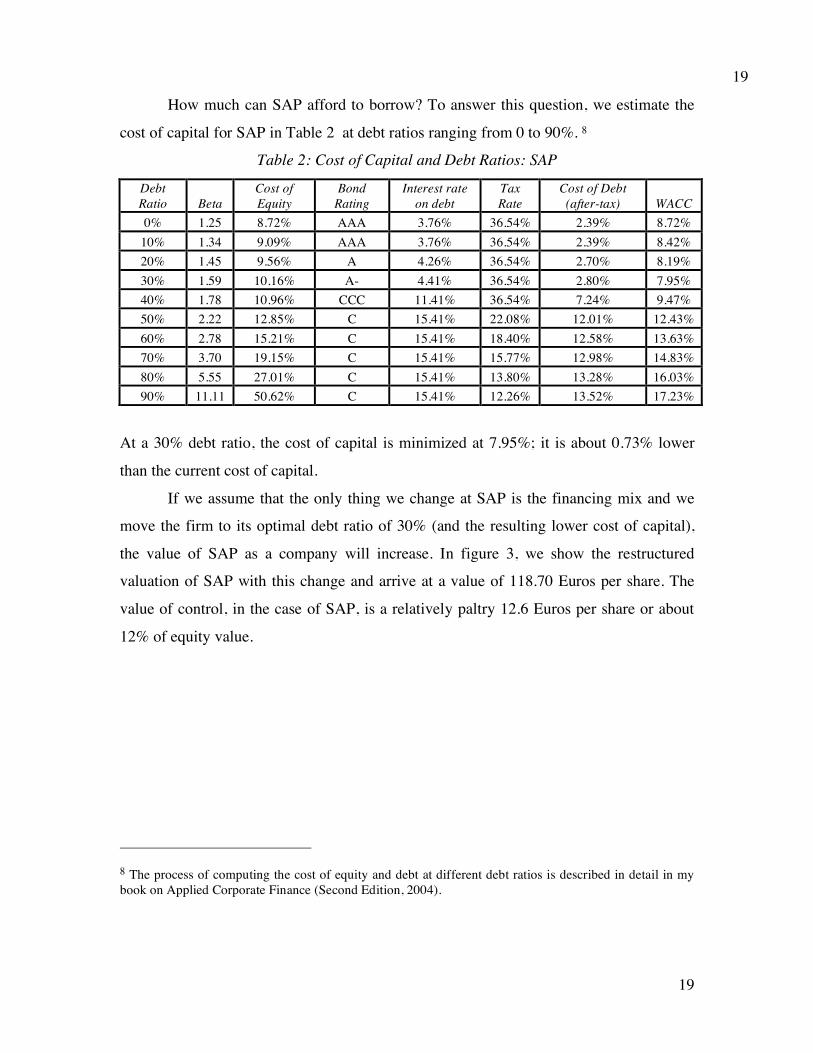
How much can SAP afford to borrow? To answer this question, we estimate the
cost of capital for SAP in Table 2 at debt ratios ranging from 0 to 90%. 8
Table 2: Cost of Capital and Debt Ratios: SAP
Debt Ratio Beta
Cost of Equity
Bond Rating
Interest rate on debt
Tax Rate
Cost of Debt (after-tax) WACC
0% 1.25 8.72% AAA 3.76% 36.54% 2.39% 8.72% 10% 1.34 9.09% AAA 3.76% 36.54% 2.39% 8.42% 20% 1.45 9.56% A 4.26% 36.54% 2.70% 8.19% 30% 1.59 10.16% A- 4.41% 36.54% 2.80% 7.95% 40% 1.78 10.96% CCC 11.41% 36.54% 7.24% 9.47% 50% 2.22 12.85% C 15.41% 22.08% 12.01% 12.43% 60% 2.78 15.21% C 15.41% 18.40% 12.58% 13.63% 70% 3.70 19.15% C 15.41% 15.77% 12.98% 14.83% 80% 5.55 27.01% C 15.41% 13.80% 13.28% 16.03% 90% 11.11 50.62% C 15.41% 12.26% 13.52% 17.23%
At a 30% debt ratio, the cost of capital is minimized at 7.95%; it is about 0.73% lower
than the current cost of capital.
If we assume that the only thing we change at SAP is the financing mix and we
move the firm to its optimal debt ratio of 30% (and the resulting lower cost of capital),
the value of SAP as a company will increase. In figure 3, we show the restructured
valuation of SAP with this change and arrive at a value of 118.70 Euros per share. The
value of control, in the case of SAP, is a relatively paltry 12.6 Euros per share or about
12% of equity value.
8 The process of computing the cost of equity and debt at different debt ratios is described in detail in my book on Applied Corporate Finance (Second Edition, 2004).

20
20
Current Cashflow to FirmEBIT(1-t) : 1414- Nt CpX 831 - Chg WC - 19= FCFF 602Reinvestment Rate = 812/1414
=57.42%
Expected Growth in EBIT (1-t).5742*.1993=.114411.44%
Stable Growthg = 3.41%; Beta = 1.00;Debt Ratio= 20%Cost of capital = 6.62% ROC= 6.62%; Tax rate=35%Reinvestment Rate=51.54%
Terminal Value10= 1717/(.0662-.0341) = 53546
Cost of Equity8.77%
Cost of Debt(3.41%+..35%)(1-.3654)= 2.39%
WeightsE = 98.6% D = 1.4%
Cost of Capital (WACC) = 8.77% (0.986) + 2.39% (0.014) = 8.68%
Op. Assets 31,615+ Cash: 3,018- Debt 558- Pension Lian 305- Minor. Int. 55=Equity 34,656-Options 180Value/Share106.12
Riskfree Rate:Euro riskfree rate = 3.41%
+Beta 1.26 X
Risk Premium4.25%
Unlevered Beta for Sectors: 1.25
Mature riskpremium4%
Country Equity Prem0.25%
Figure 2: SAP: Status Quo
Reinvestment Rate 57.42%
Return on Capital19.93%
Term Yr5451354318261717
Avg Reinvestment rate = 36.94%
On May 5, 2005, SAP was trading at 122 Euros/share
First 5 yearsGrowth decreases
gradually to 3.41%
Debt ratio increases to 20%
Beta decreases to 1.00
Year 1 2 3 4 5 6 7 8 9 10EBIT 2,483 2,767 3,083 3,436 3,829 4,206 4,552 4,854 5,097 5,271EBIT(1-t) 1,576 1,756 1,957 2,181 2,430 2,669 2,889 3,080 3,235 3,345 - Reinvestm 905 1,008 1,124 1,252 1,395 1,501 1,591 1,660 1,705 1,724 = FCFF 671 748 833 929 1,035 1,168 1,298 1,420 1,530 1,621

21
21
Current Cashflow to FirmEBIT(1-t) : 1414- Nt CpX 831 - Chg WC - 19= FCFF 602Reinvestment Rate = 812/1414
=57.42%
Expected Growth in EBIT (1-t).5742*.1993=.114411.48%
Stable Growthg = 3.41%; Beta = 1.00;Debt Ratio= 30%Cost of capital = 6.10% ROC= 6.10%; Tax rate=35%Reinvestment Rate=55.95%
Terminal Value10= 1567/(.0610-.0341) = 58348
Cost of Equity10.17%
Cost of Debt(3.41%+1.00%)(1-.3654)= 2.80%
WeightsE = 70% D = 30%
Cost of Capital (WACC) = 10.17% (0.70) + 2.80% (0.30) = 7.96%
Op. Assets 35,577+ Cash: 3,018- Debt 547- Pension Lian 305- Minor. Int. 55=Equity 37,689-Options 180Value/Share118.70
Riskfree Rate:Euro riskfree rate = 3.41%
+Beta 1.59 X
Risk Premium4.25%
Unlevered Beta for Sectors: 1.25
Mature riskpremium4%
Country Equity Prem0.25%
Figure 3: SAP: Value with Changed Financing
Reinvestment Rate 57.46%
Return on Capital19.93%
Term Yr5471355719901567
Avg Reinvestment rate = 36.94%
On May 5, 2005, SAP was trading at 122 Euros/share
First 5 yearsGrowth decreases
gradually to 3.41%
Debt ratio remains at 30%
Beta decreases to 1.00
D/E Ratio = 42%
Year 1 2 3 4 5 6 7 8 9 10EBIT 2,487 2,772 3,091 3,446 3,841 4,220 4,568 4,872 5,116 5,291EBIT(1-t) 1,578 1,759 1,961 2,187 2,438 2,678 2,899 3,092 3,247 3,358 - Reinv 907 1,011 1,127 1,256 1,401 1,531 1,648 1,748 1,826 1,878 = FCFF 671 748 834 930 1,037 1,147 1,251 1,343 1,421 1,479
22
22
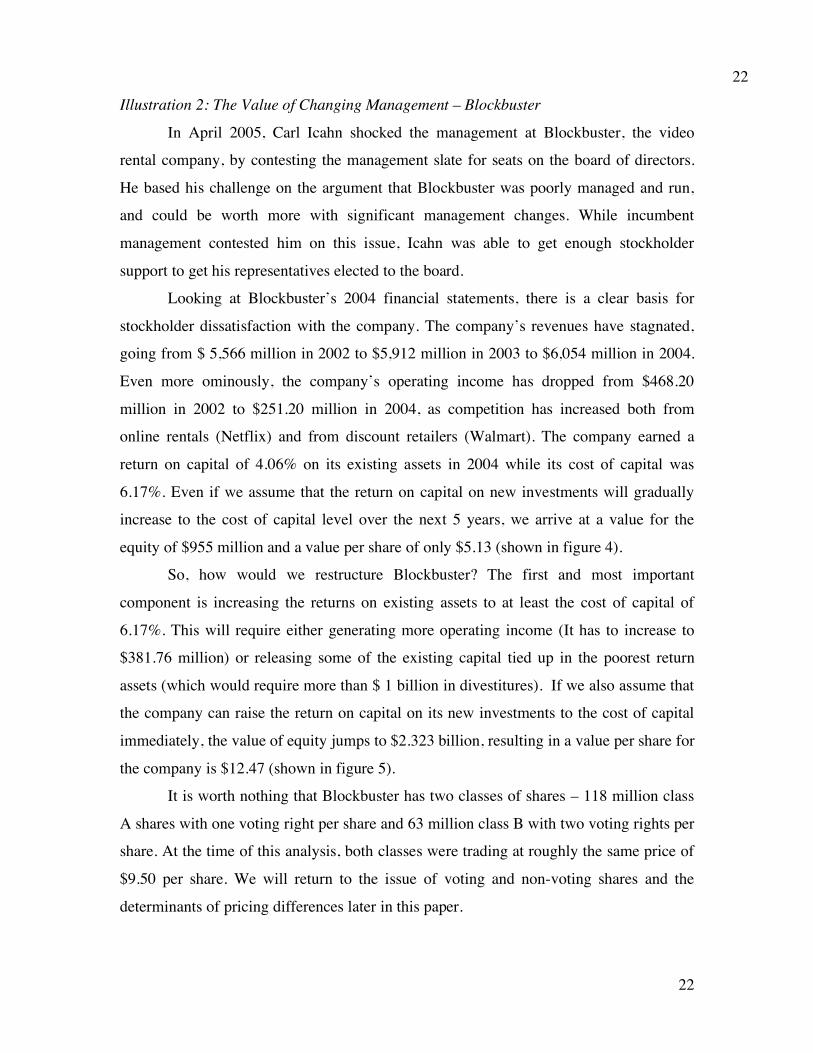
Illustration 2: The Value of Changing Management – Blockbuster
In April 2005, Carl Icahn shocked the management at Blockbuster, the video
rental company, by contesting the management slate for seats on the board of directors.
He based his challenge on the argument that Blockbuster was poorly managed and run,
and could be worth more with significant management changes. While incumbent
management contested him on this issue, Icahn was able to get enough stockholder
support to get his representatives elected to the board.
Looking at Blockbuster’s 2004 financial statements, there is a clear basis for
stockholder dissatisfaction with the company. The company’s revenues have stagnated,
going from $ 5,566 million in 2002 to $5,912 million in 2003 to $6,054 million in 2004.
Even more ominously, the company’s operating income has dropped from $468.20
million in 2002 to $251.20 million in 2004, as competition has increased both from
online rentals (Netflix) and from discount retailers (Walmart). The company earned a
return on capital of 4.06% on its existing assets in 2004 while its cost of capital was
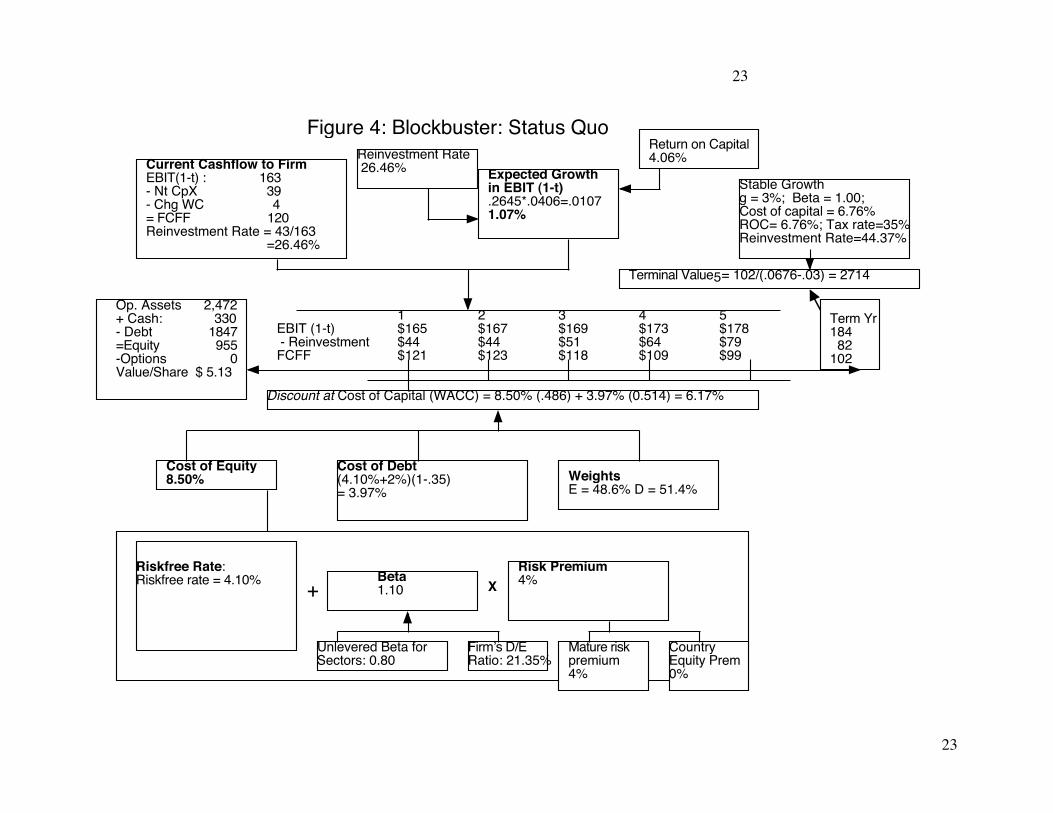
6.17%. Even if we assume that the return on capital on new investments will gradually
increase to the cost of capital level over the next 5 years, we arrive at a value for the
equity of $955 million and a value per share of only $5.13 (shown in figure 4).
So, how would we restructure Blockbuster? The first and most important
component is increasing the returns on existing assets to at least the cost of capital of
6.17%. This will require either generating more operating income (It has to increase to
$381.76 million) or releasing some of the existing capital tied up in the poorest return
assets (which would require more than $ 1 billion in divestitures). If we also assume that
the company can raise the return on capital on its new investments to the cost of capital
immediately, the value of equity jumps to $2.323 billion, resulting in a value per share for
the company is $12.47 (shown in figure 5).
It is worth nothing that Blockbuster has two classes of shares – 118 million class
A shares with one voting right per share and 63 million class B with two voting rights per
share. At the time of this analysis, both classes were trading at roughly the same price of
$9.50 per share. We will return to the issue of voting and non-voting shares and the
determinants of pricing differences later in this paper.
23
23
Current Cashflow to FirmEBIT(1-t) : 163- Nt CpX 39 - Chg WC 4= FCFF 120Reinvestment Rate = 43/163
=26.46%
Expected Growth in EBIT (1-t).2645*.0406=.01071.07%
Stable Growthg = 3%; Beta = 1.00;Cost of capital = 6.76% ROC= 6.76%; Tax rate=35%Reinvestment Rate=44.37%
Terminal Value5= 102/(.0676-.03) = 2714
Cost of Equity8.50%
Cost of Debt(4.10%+2%)(1-.35)= 3.97%
WeightsE = 48.6% D = 51.4%
Discount at Cost of Capital (WACC) = 8.50% (.486) + 3.97% (0.514) = 6.17%
Op. Assets 2,472+ Cash: 330- Debt 1847=Equity 955-Options 0Value/Share $ 5.13
Riskfree Rate:Riskfree rate = 4.10%
+Beta 1.10 X
Risk Premium4%
Unlevered Beta for Sectors: 0.80
Firm!s D/ERatio: 21.35%
Mature riskpremium4%
Country Equity Prem0%
Figure 4: Blockbuster: Status Quo Reinvestment Rate 26.46%
Return on Capital4.06%
Term Yr184 82102
1 2 3 4 5EBIT (1-t) $165 $167 $169 $173 $178 - Reinvestment $44 $44 $51 $64 $79 FCFF $121 $123 $118 $109 $99

24
24
Current Cashflow to FirmEBIT(1-t) : 249- Nt CpX 39 - Chg WC 4= FCFF 206Reinvestment Rate = 43/249
=17.32%
Expected Growth in EBIT (1-t).1732*.0620=.01071.07%
Stable Growthg = 3%; Beta = 1.00;Cost of capital = 6.76% ROC= 6.76%; Tax rate=35%Reinvestment Rate=44.37%
Terminal Value5= 156/(.0676-.03) = 4145
Cost of Equity8.50%
Cost of Debt(4.10%+2%)(1-.35)= 3.97%
WeightsE = 48.6% D = 51.4%
Discount at Cost of Capital (WACC) = 8.50% (.486) + 3.97% (0.514) = 6.17%
Op. Assets 3,840+ Cash: 330- Debt 1847=Equity 2323-Options 0Value/Share $ 12.47
Riskfree Rate:Riskfree rate = 4.10%
+Beta 1.10 X
Risk Premium4%
Unlevered Beta for Sectors: 0.80
Firm!s D/ERatio: 21.35%
Mature riskpremium4%
Country Equity Prem0%
Figure 5: Blockbuster: Restructured Reinvestment Rate 17.32%
Return on Capital6.20%
Term Yr280124156
1 2 3 4 5EBIT (1-t) $252 $255 $258 $264 $272 - Reinvestment $44 $44 $59 $89 $121 FCFF $208 $211 $200 $176 $151

25
25
Illustration 3: The Value of Changing Management – Nintendo
Nintendo, the Japanese manufacturer of video games, presented an interesting
picture at the start of 2005. The company reported 443 billion yen in revenues for the
year ended March 2005, roughly the same as its revenues three years earlier. Its operating
income for the year was approximately 100 billion yen. The company had a market value
of equity of about 1600 billion yen, no debt outstanding and a cash balance of 717 billion
yen (about 45% of overall firm value).
Over the last few years, Nintendo has reinvested very little money into its
operating assets and its reinvestment rate for the most recent year was about 5%. Cutting
costs has allowed the company to generate a healthy return on capital of 8.54% on its
existing assets, well above its cost of capital of 6.80%. If we assume that it can maintain
this return on capital and reinvestment rate, the expected growth rate is only 0.43%.
Expected Growth Rate = Reinvestment Rate * Return on capital
= .05*.0854 = .0043 or 0.43%
Valued as a stable growth firm, we arrive at a value for the operating assets of 999 billion
yen.
Value of Nintendo’s operating assets = EBIT (1-t) (1 – Reinvestment Rate)/ (Cost
of capital – Stable growth rate) = 100 (1- .33) (1 -.05)/ (.068-.0043) = 999 billion
Adding on the cash balance of 717 billion and dividing by the number of shares
outstanding, we estimate a status quo value of 12115 yen/share, about 8% higher than the
prevailing market price of 11300 yen/share. The lower market price can be partially
attributable to the market’s skepticism about whether Nintendo can maintain the excess
returns it makes now forever (which is what we assumed in the valuation) and partially to
its mistrust of the large cash balance (and what it can be utilized for).
Looking at this firm for potential value enhancement, there are three possible
changes we could make. The first would be a more aggressive growth posture; the video
game business is a fast-growing business that requires substantial reinvestment.
Increasing the reinvestment rate, even if it means settling for a lower return on capital on
new investments would increase growth and value. The second is the use of more debt in
financing the firm; the firm is all equity funded now and could easily support a debt ratio

26
26
of 20% without exposing itself to significant default risk. The third is a reduction in the
cash balance. We revalued Nintendo with the following changes to fundamentals:
a. An increased reinvestment rate of 40% for the next 5 years in conjunction with a
return on capital of 7.50%. This will increase the annual growth rate over the
period to 3%. After year 5, we will assume a growth rate of 2%, with a consistent
reinvestment rate.9
b. A debt ratio of 20%, together with a pre-tax cost of debt of 3%, lowers the cost of
capital for the next 5 years to 6.49% and in perpetuity to 5.84%.
c. A significant reduction in the cash balance to about 200 billion yen. At this level,
the discount that the market is attaching to cash should decrease or dissipate.
With these changes, the value of equity per share increases to 14107 yen, an increase of
about 18.5% from the status quo value of 12,115 yen. (See Figure 6)
9 To compute the reinvestment rate, we use a return on capital of 7.50% in perpetuity: Reinvestment rate = Growth rate/ Return on capital = 2%/7.50% = 26.67%

27
27
Current Cashflow to FirmEBIT(1-t) : 67- Nt CpX 2 - Chg WC 1= FCFF 63Reinvestment Rate = 3/63
=5%
Expected Growth in EBIT (1-t).40*.075=.033%
Stable Growthg = 2%; Beta = 1.20;Cost of capital = 5.84% ROC= 7.50%Reinvestment Rate=26.67%
Terminal Value5= 58/(.0584-.02) = 1505
Cost of Equity7.60%
Cost of Debt(2%+1%)(1-.33)= 2.01%
WeightsE = 80% D = 20%
Discount at Cost of Capital (WACC) = 7.60% (.80) + 2.01% (0.20) = 6.49%
Op. Assets 1281+ Cash: 718- Debt 0=Equity 1999-Options 0Value/Share 14107
Riskfree Rate:Riskfree rate = 2%
+Beta 1.40 X
Risk Premium4%
Unlevered Beta for Sectors: 0.80
Firm!s D/ERatio: 21.35%
Mature riskpremium4%
Country Equity Prem0%
Figure 6: Nintendo: Restructured Reinvestment Rate 40%
Return on Capital7.50%
Term Yr 79 21 58
1 2 3 4 5EBIT (1-t) $69 $71 $73 $75 $77 - Reinvestment $27 $28 $29 $30 $31 FCFF $41 $42 $44 $45 $46

28
28
The Probability of Changing Management While the value of changing management in a badly managed firm can be
substantial, the increased value will be created only if management policies are changed.
While this change can sometimes be accomplished by convincing existing managers to
modify their ways, all too often it requires replacing the managers themselves. If the
likelihood of management change happening is low, the expected value of control will
also be low. In this section, we first consider the mechanisms for changing management,
and then some of the factors that determine the likelihood of management change.
Mechanisms for changing management
It is difficult to change the way a company is run, but in general, there are four
ways in which it can be done. The first is a variation of moral or at least economic
suasion, where one or more large institutional investors introduce shareholder proposals
designed primairly to improve corporate governance, holding the threat of more extreme
action over the heads of managers. The second is a proxy contest, where incumbent
managers are challenged by an investor who is unhappy with the way the firm is run, for
proxy votes; with sufficient votes, the investor can get representation on the board and
may be able to change management policy. The third is to try to replace the existing
managers in the firm with more competent managers; in publicly traded firms, this will
require a board of directors that is willing to challenge management. The fourth and most
extreme is a hostile acquisition of the firm by an investor or another firm; the incumbent
management is usually replaced after the acquisition and management policy is
revamped.
a. Activist Investors
Most institutional and large investors are passive and choose to sell and move on
when they dislike the way a company is run. A mix of pension funds and private
investors have shown a willingness to confront incumbent managers. These activist
investors, with the weight of their large stockholdings, are able to present proposals to
stockholders to change policies that they feel are inimical to shareholder interests. Often,
these proposals are centered on corporate governance; changing the way the board of

29
29
directors is chosen and removing anti-takeover clauses in the corporate charter are
common examples. Activist investing is a recent phenomenon and it is still rare; between
1986 and the early 1990s, five institutional investors (Calpers, CREF. CalSTERS, NYCERS, SWIB) accounted for almost 20% of all stockholder proposals.10 It should be noted, though, that the record of activist investors in changing management policies and improving operating performance is mixed. While the success rate has improved over recent years, less than a fifth of all shareholder proposals on corporate governance get majority support, and even when passed, boards often ignore them. While there is evidence that activist investors target poorly managed firms with low insider holdings, there is little evidence that they succeed in improving performance at these firms.
b. Proxy Contests
At large publicly traded firms with widely dispersed stock ownership, annual
meetings are lightly attended. For the most part, stockholders in these companies tend to
stay away from meetings and incumbent managers usually get their votes by default, thus
ensuring management approved boards. In some companies, activist investors compete
with incumbent managers for the proxies of individual investors, with the intent of
getting their nominees for the board elected. While they may not always succeed at
winning majority votes, they do put managers on notice that they are accountable to
stockholders. There is evidence that proxy contests occur more often in companies that
are poorly run, and that they create significant changes in management policy and
improvements in operating performance.11
c. Forced CEO Turnover
CEO turnover at most firms is usually a consequence of retirement or death and
the successor usually follows in the incumbent’s footsteps. This is not surprising since
boards of directors are usually handpicked to support the CEO. In some cases, though,
the CEO is forced out by the board, because of displeasure over his or her performance,
and an outsider is brought in to head the firm. This provides an opening for a
10 Del Guercio, D. and J. Hawkins, 1999, The Motivation and Impact of Pension Fund Activism, Journal of Financial Economics, v52. 11 Mulherin, J.H. and A. B. Poulsen, 1998, Proxy Contests and Corporate Change: Implications for Shareholder Wealth, Journal of Financial Economics, v47, 279-313. They find that the bulk of the wealth from proxy contests stems from firms that are subsequently acquired or where management is changed.

30
30
reassessment of the firm’s current management policies and for significant changes. In
the United States, forced CEO turnover has ebbed and flowed with investor activism,
rising in the 1980s, dropping off in the 1990s and rising again in the aftermath of the
corporate scandals at Enron and WorldCom. While forced CEO turnover was uncommon
outside the United States until recent years, it is becoming more frequent. In fact, more
CEOs were forcibly removed in Europe in 2004 than in the United States.
d. Hostile acquisitions
Investor pressure, CEO turnover and proxy contests represent internal processes
for management discipline. When these fail, the only weapon that stockholders have left
is to hope that the firm will become the target of a hostile acquisition, where the acquirer
will take over the company and change the way it is run. For hostile acquisitions to be
effective as management disciplining mechanism, several pieces have to fall into place.
First, firms that are badly managed and run should be targeted for acquisitions. Second,
the system should give potential hostile acquirers a reasonable chance of success; the bias
towards incumbency should be negligible or small. Third, the acquirer has to change both
the managers and the management policies of the target company after the acquisition.
We will consider the empirical evidence on each of these later in this paper.
Determinants of Management Change
There is a strong bias towards preserving incumbent management at firms, even
when there is widespread agreement that the management is incompetent or does not
have the interests of stockholders at heart. Some of the difficulties arise from the
institutional tilt towards incumbency and others are put in place to make management
change difficult, if not impossible.
a. Institutional Constraints
The first group of constraints on challenging incumbent management in
companies that are perceived to be badly managed and badly run is institutional. Some of
these constraints can be traced to difficulties associated with raising the capital needed to
fund the challenge, some to state restrictions on takeovers and some to inertia.

31
31
Capital Constraints
You need to raise capital to acquire firms that are poorly managed and any
constraints on that process can impede hostile acquisitions. It should come as no surprise
that hostile acquisitions are rare in economies where capital markets – equity and debt -
are not well developed. In fact, for much of the last century, badly managed companies in
Europe were at least partially shielded from hostile acquisitions by the absence of an
active corporate bond market and the reliance of companies on bank loans. The
acquisition of Telecom Italia by Olivetti in 1999, which was one of the very first large
hostile acquisitions in Europe, was facilitated by Olivetti’s use of the nascent Euro bond
market. It is entirely possible that Olivetti would have failed in its bid, if it had to
approach Italian banks for the same funding.
In general, then, we would argue that the likelihood of changing the management
in badly managed firms is greater when financial markets are open and funds are
accessible at low cost to a wide variety of investors (and not just to large corporations in
good credit standing). Even in the United States, the likelihood of hostile acquisitions
increased dramatically in the 1980s when Michael Milken and his compatriots at Drexel
Burnham opened up the junk bond market, allowing hostile acquirers like T. Boone
Pickens and Carl Icahn to issue bonds with little or no security to fund hostile takeovers.
Capital constraints do have a disproportionate effect, providing greater protection
for larger market cap companies than for smaller ones. After all, a hostile acquirer, even
in a restricted capital market, may be able to raise $ 1 billion to fund an acquisition but is
unlikely to come up with $ 15 or $ 20 billion. Thus, it should come as no surprise that the
managers of larger firms in closed capital markets often have a vested interest in keeping
the markets closed.
State Restrictions
Many financial markets outside the United States impose significant legal and
institutional restrictions on takeover activity. While few markets forbid takeovers
altogether, the cumulative effect of the restrictions is to make hostile takeovers just about
impossible. Even in the United States, many states imposed restrictions on takeovers in
the 1980s, in response to the public and political outcry against hostile takeovers. One
example of state-imposed restrictions is the Pennsylvania law passed in 1990, which
32
32
contained three provisions to make takeovers more difficult. First, bidders who crossed
ownership thresholds of 20, 33, or 50% without management approval were required to
gain the approval of other shareholders to use their voting rights. This approval was made
even more difficult to obtain because voting was restricted to only those shareholders
who had held stock for more than 12 months. Second, the board of directors was allowed
to weigh the effect of the takeover on all stakeholders, including customers, employees,
and local community groups, in accepting or rejecting a takeover, thus providing
members of the board with considerable leeway in rejecting hostile bids. Third, bidders
were forced to return any profits made from any sale of stock in the target corporation
within 18 months of the takeover attempt, thus increasing the cost of an unsuccessful bid.
There are similar laws on the books in many countries.
Inertia and Conflicts of Interest
There is one final factor to consider in whether managers in badly managed firms
feel the heat from stockholders. If the stockholders in these firms are passive and don’t
respond to the pleas of acquirers or other investors by tendering their shares in an
acquisition or their proxies in a proxy contest, it is very likely that incumbent managers
will stay entrenched. Institutional investors who own about 70% of the outstanding stock
at large, publicly traded firms are more likely to be passive than activist investors, voting
with their feet (by selling stock in firms that they believe are not well managed) rather
than against management.12 In many cases, they tend to go along with the incumbent
managers of the firms that they own stock in, rather than take issue with their decisions.13
Why do investors in many firms stick with managers in the midst of poor
performance? For some institutional investors, like Fidelity, which own stock in hundreds
of firms, it may be the only practical solution. After all, activist investing is time and
resource consuming and it may not be feasible for a fund with holdings in 200 companies
12 Parrino, R, R.W. Sias and L.T. Starks, 2003, Voting with their Feet: Institutional Ownership changes around Forced CEO Turnover, Journal of Financial Economics, v69, 3-46. They find that aggregate institutional ownership drops by about 12% in the year prior to a forced CEO change and that individual ownership increases. Institutional investors who are better informed and more concerned about prudent stocks are more likely to sell during this period. 13 In 2001, for example, Hewlett Packard announced its intent to acquire Compaq. Two of Hewlett Packard’s directors, including David Hewlett, resigned, arguing that the acquisition did not make sense.

33
33
to do it. . For others, like investment and commercial banks, there are side benefits that
are obtained by maintaining good relations with incumbent managers. These benefits can
overwhelm the potential gains from being more active stockholders.
b. Firm-specific Constraints
There are some firms where incumbent managers, no matter how incompetent, are
protected from stockholder pressure by actions taken by these firms. This protection can
take the form of anti-takeover amendments to the corporate charter, elaborate cross
holding structures and the creation of shares with different voting rights. In some cases,
the incumbent managers may own large enough stakes in the firm to stifle any challenge
to their leadership.
Corporate Charter Amendments
In response to a wave of hostile takeovers in the 1980s, many firms changed their
corporate charters to make takeovers more difficult. Many reasons were offered for for
these changes. First, they would release managers from the time-consuming tasks of
having to deal with hostile takeovers and enable them to spend their time making
productive decisions. Second, they would give managers additional tools to extract a
higher price from hostile bidders in a takeover by increasing their bargaining power.
Third, they would enable managers to focus on maximizing 'long-term' value as opposed
to the 'short-term' value maximization supposedly implicit in most takeovers. The
managers of these firms offered a range of anti-takeover amendments to this end. Among
them were staggered board elections, whereby only a portion of the board could be
replaced each year, making it more difficult for a shareholder to gain control,
supermajority clauses requiring more than majority approval for a merger (typically 70 to
80%), and the barring of two-tier offers14.
In theory, these anti-takeover amendments should affect the stock price
negatively, because they make takeovers less likely and entrench incumbent
However, Ms. Fiorina, the CEO of Hewlett Packard, was able to convince enough institutional investors to stick with her on the final vote. 14 In two tier tender offers, acquirers offer a higher price for the first 51% of the shares tendered, and a lower price for the remaining 49% that are not. By doing so, they hope to increase the number of stockholders who do tender.

34
34
management. By passing anti-takeover amendments, firms reduce the probability of a
takeover and, hence, their market prices. The net effect on value will vary across firms,
however; firms with the most inefficient management are most likely to experience a
drop in value on the passage of these amendments, while firms with more efficient
management are not likely to show any noticeable change in value.
There is a surprising lack of consensus on the effects of anti-takeover
amendments on stock prices. Linn and McConnell (1983) studied the effects of anti-
takeover amendments on the stock price and found positive but insignificant reactions to
anti-takeover amendments15. DeAngelo and Rice (1983) investigated the same
phenomenon and found a negative, albeit insignificant, effect.16 Dann and DeAngelo
(1983) examined standstill agreements17 and negotiated premium buybacks18 and
reported negative stock price reactions around their announcements, a finding consistent
with the loss of shareholder wealth.19 Dann and DeAngelo (1988) extended their study to
anti-takeover measures passed not in response to a takeover attempt, but in advance of a
takeover as a defensive measure.20 They reported a stock price decline of 2.33% around
the announcement of these measures. Comment and Schwert (1995) updated these studies
and provided one possible explanation for the mixed conclusions of previous studies.
They concluded that anti-takeover amendments provide relatively little protection against
hostile acquisitions and often increase premiums paid to target company stockholders in
acquisitions.21
15 Linn, S. and J.J. McConnell, 1983, An Empirical Investigation of the Impact of Anti-Takeover Amendments on Common Stock Prices, Journal of Financial Economics, v11, 361-399. 16 DeAngelo, H. and E.M. Rice, 1983, Antitakeover Charter Amendments and Stockholder Wealth, Journal of Financial Economics, v11, 329-360 17 In a standstill agreement, a firm enters into an agreement with a potential hostile acquirer whereby the acquirer agrees not to acquire any more shares. In return, the acquirer receives cash or other compensation. 18 This is a fancy name for greenmail, whereby the stake acquired by a potential acquirer is bought back by the company at a substantial premium over the price paid. In return, the raider signs a 'standstill' agreement not to acquire shares in the company for a specific time period. 19 Dann, L.Y. and H. DeAngelo, 1983, Standstill Agreements, Privately Negotiated Stock Repurchases, and the Market for Corporate Control, Journal of Financial Economics, v11, 275-300 20 Dann, L.Y. and H. DeAngelo, 1988, Corporate Financial Policy and Corporate Control: A study of Defensive Adjustments in Asset and Ownership Structure, Journal of Financial Economics, v20, 87-128 21 Comment. R and G.W. Schwert, 1995, Poison or Placebo? Evidence on the deterrence and wealth effects of antitakeover measures, Journal of Financial Economics, 39, 3-43.
35
35
Voting Rights
The time-honored way for protecting incumbent management is to issue shares
with different voting rights. In its most extreme form, the incumbent managers hold all of
the shares with voting rights and issue only non-voting shares to the public. This is the
rule rather than the exception in much of Latin America and Europe22, where companies
routinely issue non-voting shares to the public and withhold voting shares for the
controlling stockholders and managers. In effect, this allows the insiders in these firms to
control their destiny with a small percentage of all outstanding stock. More generally,
firms can accomplish the same objective by issuing shares with different voting rights.
To compensate for the lack of voting rights, many companies either pay higher
dividends on non-voting shares or give them a prior claim on cash flows. This does
complicate the comparison on prices on these shares, since the value of the higher
dividends may offset some or all of the value lost from not having voting rights. In a twist
on this concept, there are some firms where voting rights vest only with shareholders who
have held stock for more than a specified period of time, say, three years. This
presumably gives long-term shareholders a greater say in how companies are run than
short-term stockholders (who are viewed as speculators rather than investors). The net
effect, however, is to empower incumbent managers and reduce the power of
stockholders, both short term and long term.
Corporate Holding Structures
Control can be maintained over firms with a variety of corporate structures
including pyramids and cross holdings. In a pyramid structure, an investor uses control in
one company to establish control in other companies. For instance, company X can own
50% of company Y and use the assets of company Y to buy 50% of company Z. In
effect, the investor who controls company X will end up controlling companies Y and Z,
as well. Studies indicate that pyramids are a common approach to consolidating control in
22 Faccio, M. and L. Lang, 2002, The Ultimate Ownership of European corporations, Journal of Financial Economics, v65, 365-396. They analyze 5232 firms in Europe and find that while 37% are widely held, 44% are family controlled., with dual class shares and pyramid structures. Smaller firms on continental Europe are more likely to be family controlled whereas larger firms in the UK and Ireland are more likely to be widely held.

36
36
family run companies in Asia and Europe.23 In a cross holding structure, companies own
shares in each other, thus allowing the group’s controlling stockholders to run all of the
companies with less than 50% of the outstanding stock.24 The vast majority of Japanese
companies (keiretsus) and Korean companies (chaebols) in the 1990s were structured as
cross holdings, immunizing management at these companies from stockholder pressure.
Large Shareholder/Managers
In some firms, the presence of a large stockholder as a manager is a significant
impediment to a hostile acquisition or a management change. Consider, a firm like
Oracle, where the founder/CEO, Larry Ellison, owns almost 30% of the outstanding
stock. Even without a dispersion of voting rights, he can effectively stymie hostile
acquirers. Why would such a stockholder/manager mismanage a firm when it costs him
or her a significant portion of market value? The first reason can be traced to hubris and
ego. Founder CEOs, with little to fear from outside investors, tend to centralize power
and can make serious mistakes. The second is that what is good for the inside
stockholder, who often has all of his or her wealth invested in the firm may not be good
for the other investors in the firm.
What may cause the likelihood of management changing to shift?
If there is one constant in markets, it is change. Managers who were viewed as
impervious to outside challenge can find their authority challenged. In this section, we
consider some of the factors that may cause this shift.
• The first is that the rules governing corporate governance do change over time,
sometimes in favor of incumbent managers and sometimes in favor of
stockholders. In recent years, for instance, many emerging market economies
have made it easier for stockholders in companies to challenge managers. A
23 Bebchuk, L, R. Kraakman and G. Triantis, 2000, Stock Pyramids, Cross Ownership and Dual Class Equity: The Mechanisms and Agency Costs of Separating Control from Cash Flow Rights, Working Paper, Harvard Law School. For pyramiding, they offer the example of the Hong-Kong based Li Ka-shing group , which owns 35% of Cheung Kong Company, which, in turn, owns 44% of Hutchison Whampoa, which owns Cavendish International, which controls Hong Kong Electric. 24 As an example, consider the Lippo Group, comprised of three Indonesian companies – Lippo Bank, Lippo Life and Lippo Securities – all controlled by the Riady family. Though the family divested itself of its holders in Lippo Bank in the 1990s, it controls all three companies through its holdings in Lippo Securities, which holds 27% of Lippo Life, which holds 40% of Lippo Bank.
37
37
similar trend can be seen in Europe, where incumbent managers clearly had the
upper hand until a few years ago. The impetus for this reform has come from
institutional investors who have grown tired of being ignored by managers, when
confronted with clear evidence of poor decisions.
• Even when the rules allow investors to challenge management decisions, most
investors take the passive route of voting with their feet. It is here that the
presence of activist investors who are willing to take large positions in companies
and use these holdings as a platform to challenge and change management
practices makes a difference. In the United States, these investors made their
presence felt in the 1980s.25 While it has taken a little longer in the rest of the
world, activist investors are part of the investment landscape in more and more
countries now.
• Nothing changes the perceptions of management vulnerability to an outside
challenge more than a well publicized hostile takeover or the ouster of a CEO of a
large firm in the same market. In the late 1990s, for instance, the hostile
acquisition of Telecom Italia by Olivetti changed the landscape in Europe and
changed the perception that the managers at large European firms were immune
from stockholder challenges.
Estimating the probability of management change
While the determinants of management change can be listed, it is far more
difficult to quantitatively estimate the probability that it will occur. One statistical
approach that is promising is a logit or probit, where we assess the probability of
management change by contrasting the characteristics of firms where management has
changed in the past with firms where that has not occurred. Researchers have applied this
technique to look at both acquisitions and forced CEO change.
In one of the first papers to assess the likelihood of takeovers by comparing target
firms in acquisitions to firms that were not targets, Palepu (1986) noted that target firms
25 Del Guercio, D. and J. Hawkins, 1999, The Motivation and Impact of Pension Fund Activism, Journal of Financial Economics, v52, 293-340. The authors study five activist pension funds – CREF, CALPERS, CALSTRS, SWIB and NYC – which account for 20% of all pension fund investment between 1987 and
38
38
in takeovers were smaller than non-target firms and invested inefficiently.26 In a later
paper, North (2001) concluded that firms with low insider/managerial ownership were
more likely to be targeted in acquisitions27. Neither paper specifically focused on hostile
acquisitions, though. Nuttall (1999) found that target firms in hostile acquisitions tended
to trade at lower price to book ratios than other firms and Weir (1997) added to this
finding by noting that target firms in hostile acquisitions also earned lower returns on
invested capital28. Finally, Pinkowitz (2003) finds no evidence to support the
conventional wisdom that firms with substantial cash balances are more likely to become
targets of hostile acquisitions.29 In summary, then, target firms in hostile acquisitions tend
to be smaller, trade at lower multiples of book value and earn relatively low returns on
their investments.30
While many CEO changes are either voluntary (retirement or job switching),
some CEOs are forced out by the board. In recent years, researchers have examined when
forced CEO turnover is most likely to occur.
• The first factor is stock price and earnings performance, with forced turnover
more likely in firms that have performed poorly relative to their peer group and to
expectations.31 One manifestation of poor management is overpaying on
acquisitions, and there is evidence that CEOs of acquiring firms that pay too much
1993 and conclude that companies that they own stock in are more likely to be targets of hostile takeovers and management change than other companies. 26 Palepu, K.G. “Predicting Take-Over Targets : A Methodological and Empirical Analysis.” Journal of Accounting and Economics, 8 (1986), 3-35. 27 North, D.S. 2001, The Role of Managerial Incentives in Corporate Acquisitions: the 1990s Evidence, Journal of Corporate Finance, 7 , 125-149. 28 Nuttall, R. “Take-Over Likelihood Models for UK Quoted Companies.” Nuffield College working paper, Oxford University (1999) and Weir, C. “Corporate Governance, Performance and Take-Overs: An Empirical Analysis of UK Mergers.” Applied Economics, 29 (1997), 1465-1475. 29 Pinkowitz, L. , 2003, “The Market for Corporate Control and Corporate Cash Holdings”, Working Paper, SSRN. His study of hostile acquisitions between 1985 and 1994 concludes that firms with large cash balances are less (not more) likely to be targets of hostile acquisitions. 30 In a contrary finding, Franks and Mayer (1996) find no evidence of poor performance in target firms in hostile acquisitions in the UK, Franks, J. and C. Mayer, “ Hostile Takeovers and the Correction of Management Failure”, Journal of Financial Economics, v40, 163-181. 31 Warner, J., R. Watts and K. Wruck, 1988, Stock Prices and Top Management Changes, Journal o Financial Economics, v20, 461-492; Murphy, K and J. Zimmerman, 1993, Financial Performance surrounding CEO Turnover, Journal of Accounting and Economics, v16, 273-316; Puffer, S. and J.B. Weintrop, 1991, Corporate Performance and CEO Turnover: The Role of Performance Expectations, Administrative Science Quarterly, v36, 1-19;
39
39
on acquisitions are far more likely to be replaced than CEOs who do not do such
acquisitions.32
• The second factor is the structure of the board, with forced CEO changes more
likely to occur when the board is small33, is composed of outsiders34 and when the
CEO is not also the chairman of the board of directors.35
• The third and related factor is the ownership structure; forced CEO changes are
more common in companies with high institutional and low insider holdings.36
They also seem to occur more frequently in firms that are more dependent upon
equity markets for new capital.37
• The final factor is industry structure, with CEOs more likely to be replaced in
competitive industries.38
In summary, firms where you see forced CEO change share some characteristics with
firms that are targets of hostile acquisitions – they are poorly managed and run – but they
tend to have much more effective boards of directors and more activist investors who are
able to change management without turning over the firm to a hostile acquirer.
Manifestations of the Value of Control If the value of control is derived from changing the way a business is run and the
expected value of control is a function of the value of control and the likelihood that you
can change the management of a company, it has implications for almost every aspect of
valuation, from valuing publicly traded firms for acquisitions to valuing a stake in a
32 Lehn, K. and M. Zhao, 2004, CEO Turnover after Acquisitions: Do Bad Bidders get fired?, Working Paper, University of Pittsburgh. 33 Faleye, O., 2003, Are large boards poor monitors? Evidence from CEO turnover, Working Paper, SSRN. Using a proportional hazard model, he finds that every additional director on the board reduces the probability of a forced CEO change by 13%. 34 Weisbach, M., 1988, Outside Directors and CEO Turnover, Journal of Financial Economics, v20, 431-460. 35 Goyal. V.K., and C.W. Park, 2001, Board Leadership Structure and CEO Turnover, Journal of Corporate Finanee, v8, 49--66. 36 Dennis, D.J., D.K. Dennis and A. Sarin, 1997, Ownership Structure and Top Executive Turnover, Journal of Financial Economics, v45, 193-221. 37 Hillier, D., S. Linn and P. McColgan, 2003, Equity Issuance, Corporate Governance Reform and CEO Turnover in the UK, Working Paper, SSRN. They find that CEO are more likely to be forced out just before new equity issues or placings.
40
40
private business. In this section, we consider the range of applications where the value of
control plays a role.
a. Hostile Acquisitions While any merger can have a component of its value derived from control, hostile
acquisitions offer the clearest example of control premiums at work, since the managers
of the target firm are put on notice by the acquirer that they will be replaced after the
acquisition.
Valuing Control Premiums in Acquisitions
Valuing control premiums in an acquisition is a three-step process that closely
mirrors our analysis in the last section. The first step is a status quo valuation of the target
firm, with the existing management policies on investing, financing and dividend policy.
The second step is a “restructured” valuation with the changes that the acquiring firm is
planning to make in the way the target company is run. The difference between the
restructured and the status quo valuations is the value of control. The third step is
determining what portion of this premium should be paid on the acquisition. Note that
paying a price that reflects the entire premium gives the entire value of control to the
target company stockholders.
It is also worth noting that this process has nothing to do with the other widely
quoted motive for acquisitions, which is synergy. In other words, if there is value from
potential synergy in a merger, it will be in addition to the value of control. A key
difference is that synergy requires two entities – an acquiring firm and a target firm – to
exist, since it accrues as an advantage (cost or growth) to the combined firm. Control
resides entirely with the target firm and does not require an acquiring entity; an individual
can acquire a poorly run firm and change the way it is run.
Implications
If the value of control is the difference between the status quo value of a firm and
the value of the firm optimally run, we can derive the following implications about it:
38 DeFondt, M.L. and C.W. Park, 1999, The effect of competition on CEO Turnover, Journal of Accounting
41
41
a. The value of control will vary across firms: Since the control premium is the difference
between the status-quo value of a firm and its optimal value, it follows that the premium
should be larger for poorly managed firms and smaller for well managed firms. In fact,
the control premium should be zero for firms where management is already making the
right decisions.
b. There can be no rule of thumb on control premium: Since control premium will vary
across firms, there can be no simple rule of thumb that applies across all firms. Thus, the
notion that control is always 20-30% of value cannot be right.39
c. The control premium should vary depending upon why a firm is performing badly: The
control premium should be higher when a firm is performing badly because of poor
management decisions than when a firm’s problems are caused by external factors over
which management has limited or no control. Thus, the value of control will not be as
high in a gold mining company whose earnings are depressed because gold prices have
dropped as it would be at a manufacturing company where earnings are low because of
management misjudgments about what customers want.
d. The control premium should be a function of the ease of making management changes:
Not all changes are easy to make or quick to implement. It is far easier to change the
financing mix of an under levered company than it is to modernize the plant and
equipment of a manufacturing company with old and outdated plants. We would expect
the value of control to be higher in the former because the changes can be made quickly
and the savings will show up in cash flows sooner.
Empirical Evidence
Evidence supportive of the hypothesis that hostile acquisitions are primarily
motivated by control can be categorized into three groups. The first relate to the
premiums paid for target firms in hostile acquisitions since they reflect the acquirer’s
and Economics, v27, 35-56. 39 This number is often obtained by looking at what acquiring firms typically pay in acquisitions as a premium over the market price (from a data source like Mergerstat). There are two problems with this approach. The first is that the premium paid on an acquisition can be for a number of different reasons, including synergy. In fact, we can safely argue that if the typical premium paid in acquisitions is 25%, the value of control has to be much smaller. The second is that there is a danger of a self-fulfilling prophecy; if the control premium is based upon what other acquirers have paid rather than on the specific characteristics of the target firm, there may be little or no reason for the premium.

42
42
expectations of the value of control. The second are centered on the types of firms that
are typical target firms in hostile acquisitions: if control is the motive, the typical target
firm should be poorly managed and poorly run. The third look at what happens after
hostile acquisitions: control motivated acquisitions should be followed by management
turnover, changed financing and investment policies and improved performance.
a. Premiums paid for target firms in acquisitions: Researchers have used the premium
paid by acquirers in mergers as a measure of a control but this premium is an amalgam of
all of the motives behind acquisitions including synergy. The premium paid in an
acquisition as a composite value of control, synergy and overpayment. Given this reality,
how can we narrow our analysis down to only control? To begin with, we can focus only
on hostile acquisitions rather than look at all acquisitions. If the essence of the value of
control is that you can change the way a company is managed, it is unlikely that the
incumbent managers of a target firm will assent to a friendly takeover when the primary
motive is control. Next, we can eliminate all hostile acquisitions where the acquirer is
another firm. After all, synergy requires the existence of two organizations and cannot
exist if the target firm stands alone after the acquisitions. By looking at hostile
acquisitions where the target firm remains independent after the deal, we at least narrow
the premium paid to just control and over payment. While the average premium40 paid
for target firms in acquisitions in the United States has been between 20 and 30% in the
1980s and 1990s, the premiums tend to be slightly higher for hostile acquisitions.41 In
addition, bidding firm returns which tend to be negligible or slightly negative across all
acquisitions are much more positive on hostile acquisitions. In summary, the perceived
benefits from control in hostile acquisitions are large and markets tend to view such
acquisitions favorably.
b. Target firm characteristics: The strongest support for the existence of a market for
corporate control lies in the types of firms that are typically acquired in hostile takeovers.
Earlier in this paper, we noted that poor operating and stock price performance are good
40 Jarrell, G. and A. Poulsen, 1989. The returns to acquiring firms in tender offers: evidence from three decades, Financial Management 18, 12-19. 41 Lang, L.H.P., Stulz, R. and Walkling, R.A., 1989. Managerial performance, Tobin’s Q and the gains from successful tender offers. Journal of Financial Economics 24, 137-154.
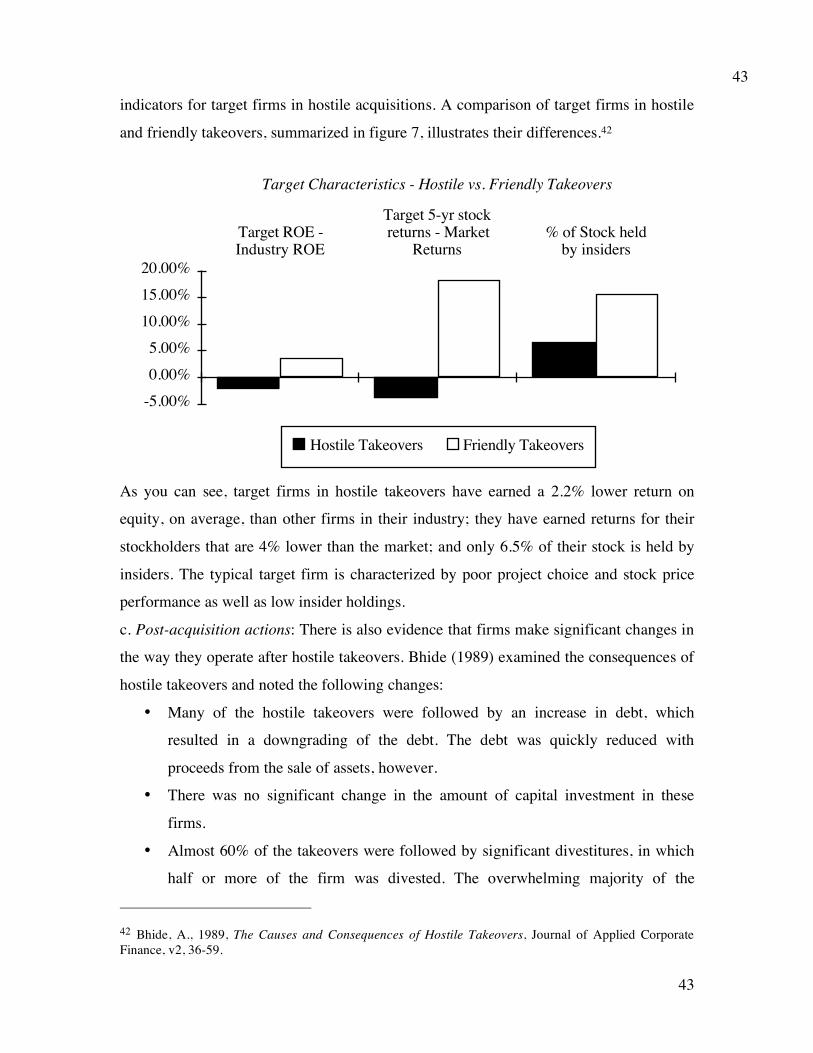
43
43
indicators for target firms in hostile acquisitions. A comparison of target firms in hostile
and friendly takeovers, summarized in figure 7, illustrates their differences.42
Target Characteristics - Hostile vs. Friendly Takeovers
-5.00%
0.00%
5.00%
10.00%
15.00%
20.00%
Target ROE -Industry ROE
Target 5-yr stockreturns - Market
Returns% of Stock held
by insiders
Hostile Takeovers Friendly Takeovers
As you can see, target firms in hostile takeovers have earned a 2.2% lower return on
equity, on average, than other firms in their industry; they have earned returns for their
stockholders that are 4% lower than the market; and only 6.5% of their stock is held by
insiders. The typical target firm is characterized by poor project choice and stock price
performance as well as low insider holdings.
c. Post-acquisition actions: There is also evidence that firms make significant changes in
the way they operate after hostile takeovers. Bhide (1989) examined the consequences of
hostile takeovers and noted the following changes:
• Many of the hostile takeovers were followed by an increase in debt, which
resulted in a downgrading of the debt. The debt was quickly reduced with
proceeds from the sale of assets, however.
• There was no significant change in the amount of capital investment in these
firms.
• Almost 60% of the takeovers were followed by significant divestitures, in which
half or more of the firm was divested. The overwhelming majority of the
42 Bhide, A., 1989, The Causes and Consequences of Hostile Takeovers, Journal of Applied Corporate Finance, v2, 36-59.

44
44
divestitures were units in business areas unrelated to the company's core business
(i.e., they constituted reversal of corporate diversification done in earlier time
periods).
• There were significant management changes in 17 of the 19 hostile takeovers,
with the replacement of the entire corporate management team in seven of the
takeovers.
Another study of acquisitions of 288 distressed firms by “vulture investors” provides
evidence of improved operating performance after the acquisitions.43 Thus, contrary to
popular view44, most hostile takeovers are not followed by the acquirer stripping the
assets of the target firm and leading it to ruin. Instead, target firms refocus on their core
businesses and often improve their operating performance.
b. Valuing publicly traded companies There is a widely held misconception that control is an issue only when you do
acquisitions. To the contrary, we would argue that the stock price of every publicly traded
firm includes an expected value for control, reflecting both the likelihood that the
management of the firm will be changed and the value of making that change.
Expectations and Stock Prices
To see how the expected value of control shows up in stock prices, assume that
you live in a world where management change never happens and that the market is
reasonably efficient about assessing the values of the firms that it prices. In this scenario,
every company will trade at its status quo value, reflecting both the strengths and
weaknesses of existing management. Now assume that you introduce the likelihood of
management change into this market, either in the form of hostile acquisitions or CEO
changes. If the market remains reasonably efficient, the stock price of every firm should
rise to reflect this likelihood:
43 Vulture investors are usually individuals who buy poorly managed firms and restructure them. Hotchkiss, E.S. and R.M. Mooradian, 1997, Vulture Investors and the Market for Control of Distressed Firms, Journal of Financial Economics, v43, 401-432. 44 Even if it is not the popular view, it is the populist view that has found credence in Hollywood, in movies like Wall Street, Barbarians at the Gate and Other People’s Money.

45
45
Market value = Status quo value + (Optimal value – Status quo value)*
Probability of management changing
The degree to which this will affect stock prices will vary widely across firms, with the
expected value of control being greatest for badly managed firms where there is a high
likelihood of management turnover and lowest for well managed firms and for firms
where there is little or no chance of management change.
There are many who will be skeptical about the capacity of markets to make these
assessments with any degree of accuracy and whether investors actually try to estimate
the expected value of control. The evidence that we will present later in this section
indicates that while markets may not use sophisticated models to make these assessments,
they do try to value and price in control.
Implications
Markets are not prescient or all knowing but they do build in expectations into
prices. To the extent that the expected value of control is already built into the market
value, there are important implications for acquirers, investors and researchers:
a. Paying a premium over the market price can result in over payment: If the current
market price incorporates some of all of the value of control, the effect of management
change on market value (as opposed to status quo value) will be small or non-existent. In
a firm where the market already assumes that management will be changed and builds it
into the stock price, acquirers should be wary of paying a premium on the current market
price even for a badly managed firm. Consider an extreme example. Assume that you
have a firm with a status quo value of $ 100 million and an optimally managed value of $
150 million and that the market is already building in a 90% chance that the management
of the firm will change in the near future. The market value of this company will be $ 145
million. If an acquirer decides to pay a substantial premium (say $ 40 million) for this
firm, based upon the fact that the company is badly managed, he will overpay
substantially; in this example, he will pay $ 185 million for a company with a value of $
150 million.
b. Anything that causes market perception of the likelihood of management change to
shift can have large effects on all stocks. A hostile acquisition of one company, for

46
46
instance, may lead investors to change their assessments of the likelihood of management
change for all companies and to an increase in stock prices. Since hostile acquisitions
often are clustered in a particular sector – oil companies in the 1980s, for instance – it is
not surprising that a hostile acquisition of a single company often leads to increases in
stock prices of companies in its peer group.
c. Poor corporate governance = Lower stock prices: The price of poor corporate
governance can be seen in stock prices. After all, the essence of good corporate
governance is that it gives stockholders the power to change the management of badly
managed companies. Consequently, stock prices in a market where corporate governance
is effective will reflect a high likelihood of change for bad management and a higher
expected value for control. In contrast, it is difficult, if not impossible, to dislodge
managers in markets where corporate governance is weak. Stock prices in these markets
will therefore incorporate lower expected values for control. The differences in corporate
governance are likely to manifest themselves most in the worst managed firms in the
market.
Empirical Evidence
The only way to empirically test the proposition that the stock prices of all firms
incorporate the expected value of control is to look at events that change that expected
value. We have already pointed to three events that cause this to happen –hostile
acquisitions of other firms, CEO replacements and corporate governance reforms.
a. Hostile Acquisitions
If the prices of all stocks reflect the expected value of control, any actions that
make hostile acquisitions more or less likely will affect stock prices. An obvious example
is when the state passes laws that make acquisitions more or less likely. Earlier in the
paper, we referenced the law passed by the state of Pennsylvania in 1989 to restrict
takeovers of companies in that state. Karpoff and Malatesta (1990) examined the
consequences of this law, and found that the stock prices of Pennsylvania-based firms
dropped (after adjusting for market movements), on average, 1.58% on October 13, 1989,
the first day a news story on the law appeared. Over the entire period, from the first news
story to the introduction of the bill into the Pennsylvania legislature, these firms saw their

47
47
stock prices decline 6.90%.45 A subsequent study reinforced their findings and estimated
a total loss in market value of $ 4 billion as a consequence of the law, though companies
opting out of the law recovered a significant portion of this lost value.46
It should also be noted that it is not only the firm that is the target of a hostile
takeover that is affected by its occurrence. All other firms like it are put on notice and we
would expect their stock prices to reflect the higher likelihood of takeovers. In a study of
312 large British firms, Weir, Laing and McKnight (2004) find that firms that are in
sectors where takeover intensity (measured by the number of mergers that took place in
it) trade at higher market values, relative to replacement cost or book value.47
b. Management Changes
Earlier in this paper, we looked at the probability of forced CEO turnover. If the
market price reflects the expected value of control in a company, the conditions under
which a CEO is removed and how a successor is picked should affect the stock price. In
badly managed firms, a forced CEO turnover with an outside successor should have the
most positive consequences, especially when the outsider is viewed as someone capable
of changing the way the firm is run. Khurana and Nohria present four possible scenarios,
built around whether CEO turnover is forced or natural (retirement or death) and whether
the successor is an insider or an outsider:48 Looking at these scenarios from the
perspective of management change, we would expect the outcomes listed in table 3:
Table 3: CEO Turnover and Successor Identity
Successor is insider Successor is outsider
Natural CEO Turnover Status Quo No change in likelihood of
management change but may
45 Karpoff, J.M. and P.H. Malatesta, 1990, The Wealth Effects of Second-Generation State Takeover Legislation, Journal of Financial Economics, v25, 291-322. The controversy provoked by the Pennsylvania anti-takeover law created a strong counter-movement among institutional investors, who threatened to sell their holdings in Pennsylvania companies that opted to be covered by the law. Faced with this ultimatum, many Pennsylvania firms chose to opt out of the anti-takeover law. 46 Szewczyk, S.H. and G.T. Tsetsekos, 1992, State Intervention in the Market for Corporate Control: The Case of the Pennsylvania Senate Bill 1310, Journal of Financial Economics, v31, 3-24. 47 Weir, C., D. Laing and P.J. McKnight, 2002, “An Empirical Analysis of the impact of corporate governance mechanisms on the performance of UK firms,” Working Paper, Cardiff Business School. 48 Khurana, R. and N. Nohria, 2002, The Performance Consequences of CEO Turnover, Working Paper, SSRN.

48
48
change current management
policy.
Forced CEO Turnover Increase likelihood of change
but no immediate change in
management policy
Most likely to change
management policy and to
increase likelihood of future
change
A forced CEO change increases the likelihood of management change in the future
because it suggests that the board of directors will actively challenge management.
Choosing an outsider as a replacement is more likely to lead to a change in current
management policies. The expected value of control, which is the product of the two, is
likely to be increase the most when an existing CEO is forced out and an outsider is
hired.
c. Corporate Governance
Gompers, Ishi and Metrick studied the effect of corporate governance on stock
prices by developing a corporate poor governance index, based upon 24 factors, for 1500
firms; higher scores on the index translated into weaker corporate governance.49 They
found that the stocks with the weakest stockholder power earned 8.4% less in annual
returns than stockholders with the strongest stockholder power. They also found that an
increase of 1% in the poor governance index translated into a decline of 2.4% in the
firm’s Tobin’s Q, which is the ratio of market value to replacement cost. The fact that
poor corporate governance is correlated with poor stock returns and lower stock prices is
by itself not conclusive evidence that there is an expected value of control built into the
stock price, since companies with better corporate governance may be better run and
deliver superior operating results. In their study, Gompers et al. do control for firm
specific characteristics such as reinvestment and growth and find that corporate
governance continues to affect stock prices. We would take that as evidence that markets
do try to build in an expected value of control into stock prices. In other words, we would
expect a firm where stockholders have strong powers to replace and change managers to

49
49
trade at a higher market value than an otherwise similar firm (in terms of risk, growth and
cashflow characteristics) where stockholders have limited or no power over managers.
Black, Jang and Kim did a similar study for just Korean companies and their conclusions
are similar – firms with weak corporate governance have lower returns and trade at a
lower Tobin’s Q than firms with strong corporate governance.50 In a related result, Baek,
Kang and Park found that cross held (chaebol) firms with concentrated family ownership
in Korea had much bigger declines in equity values during the Korean financial crisis in
1997, which they attribute to the weaker corporate governance at these firms.
Corporate governance systems are stronger in some countries than others and there
have been a few studies that have looked at the relationship between firm
performance/value and corporate governance across countries. Klapper and Love looked
at 14 emerging markets with wide differences in corporate governance and legal systems.
They find that countries with weaker legal systems tend to have weaker corporate
governance systems. They also conclude that firms with stronger corporate governance
systems have higher market values and report better operating performance51. Finally,
they find that the strength of corporate governance matters matter more in countries with
weak legal systems.
In an interesting twist on this concept, Bris and Cabolis look at target firms in 9277
cross-border mergers, where the corporate governance system of the target is in effect
replaced by the corporate governance system of the acquirer. Since corporate governance
systems vary across countries, this gives them an opportunity to examine the effect of
changing the corporate governance system on stock prices. They find that the Tobin’s Q
increases for firms in an industry when a firm or firms in that industry are acquired by
foreign firms from countries with better corporate governance.52
49 Gompers, P.A., J.L. Ishi and A. Metrick, 2003, Corporate Governance and Equity Prices, Quarterly Journal of Economics, vol. 118, pp. 107-155. 50 Black, B.S., H. Jang and W. Kim, 2004, “Does Corporate Governance predict Firms’ market values? Evidence from Korea, Working Paper, University of Texas School of Law (SSRN)) 51 Klapper, Leora F. and Inessa Love (2004), “Corporate Governance, Investor Protection and Performance in Emerging Markets,” Journal of Corporate Finance, vol. 10, pp. 703-728. 52 Bris, A. and C. Cabolis, 2002, “Corporate Governance Convergence by Contract: Evidence from Cross Border Mergers, Yale Working Paper No 02-32. Firms of English or Scandinavian origin tend to score higher on corporate governance measures.

50
50
Illustration 4: Market Prices and the Expected Value of Control
Consider the valuation of Blockbuster in illustration 2. We estimated both the
status quo and the optimal value of the equity in the company and arrived at the following
results:
Value of Equity Value per share
Status Quo $ 955 million $ 5.13 per share
Optimally managed $2,323 million $12.47 per share
The market price per share at the time of the valuation (May 2005) was roughly $9.50.
While there are a number of different explanations for the difference between the values
that we arrived at and the market price, there is one possible interpretation that has
intuitive appeal. Assuming that both the market price and our values per share are correct,
the market price can be written in terms of a probability of control changing and the
expected value of control:
Expected value per share = Status Quo Value + Probability of control changing *
(Optimal Value – Status Quo Value)
$ 9.50 = $ 5.13 + Probability of control changing ($12.47 - $5.13)
The market is attaching a probability of 59.5% that management policies can be changed.
This was after Icahn’s successful challenge of management. Prior to his arriving on the
scene, the market price per share was $8.20, yielding a probability of only 41.8% of
management changing.
c. Voting and non-voting shares In many markets, it is common for the voting rights to vary across different
classes of shares. The shares that carry no or fewer voting rights should be worth less
than shares that carry more voting power and the difference in price should be a function
of the expected value of control.
The Premium for Voting Shares
To link the premium on voting shares to the expected value of control, let us
begin with an extreme and very simplistic example. Assume that you have a company
51
51
with nv voting and nnv non-voting shares and that the voting shareholders have complete
and total control of the business. Thus they are free to ignore the views of non-voting
shares in the event of a hostile takeover and negotiate the best deal that they can for
themselves with the acquirer.53 Assume further that this firm has a status quo value of Vb
and an optimal value of Va and that the likelihood of management changing in this firm is
π. Since the non-voting shares have absolutely no say in whether the management can be
changed, the value per non-voting share will be based purely upon the status quo value:
Value per non-voting share = Vb/ (nv + nnv)
The voting shares will trade at a premium that reflects the expected value of control:
Value per voting share = Vb/ (nv + nnv) + (Va - Vb) π/ nv
The premium on voting shares should therefore be a function of the probability that there
will be a change in management at that firm (π) and the value of changing management
(Va - Vb).
To the extent that non-voting shareholders are protected or can extract come of
the expected value of control, the difference between voting and non-voting shares will
be lower. It is possible, for instance, for non-voting shares to gain some of the value of
control if it is accomplished by changing managers, rather than by a hostile takeover. In
that case, the value of the firm will increase and all shareholders will benefit.
There is one special category of voting shares called golden shares that we
sometimes see in government-owned firms that have been privatized. These shares are
retained by the government after the privatization and essentially give the government
veto power over major decisions made by the firm. In effect, they allow the government
to retain some or a great deal of control over how the firm is run. While golden shares are
not traded, they will affect the values of shares that are traded by reducing the expected
value of control.
Implications
If the primary reason for the voting share premium is the value of control, there
are several conclusions that follow:
53 In reality, even non-voting shareholders are provided at least partial protection in the event of a takeover and will share in some of the benefits.
52
52
a. The difference between voting and non-voting shares should go to zero if there is no
chance of changing management/control. This will clearly be a function of the
concentration of ownership of the voting shares. If there are relatively few voting shares,
held entirely by insiders, the probability of management change may very well be close
to zero and voting shares should trade at the same price as non-voting shares. If, on the
other hand, a significant percentage of voting shares is held by the public, the probability
of management change should be higher and the voting shares should reflect this
premium.
b. Other things remaining equal, voting shares should trade at a larger premium on non-
voting shares at badly managed firms than well-managed firms. Since the expected value
of control is close to zero in well-managed firms, voting shares and non-voting shares
should trade at roughly the same price in these firms. In a badly managed firm, the
expected value of control is likely to be higher, as should the voting share premium.
c. Other things remaining equal, the smaller the number of voting shares relative to non-
voting shares, the higher the premium on voting shares should be. Since the expected
value of control is divided by the number of voting shares to get the premium, the smaller
that number, the greater the value attached to each share. This has to be weighed off
against the reality that when the number of voting shares is small, it is more likely to be
held entirely by incumbent managers and insiders, thus reducing the likelihood of
management change.
d. Other things remaining equal, the greater the percentage of voting shares that are
available for trading by the general public (float), the higher the premium on voting
shares should be. When voting shares are entirely or predominantly held by managers
and insiders, the probability of control changing is small and so is the expected value of
control.
e. Any event that illustrates the power of voting shares relative to non-voting shares is
likely to affect the premium at which all voting shares trade. The expected value of
control is a function of perceptions that management at these firms can be changed. In a
market where incumbent managers are entrenched, voting shares may not trade at a
premium because investors assess no value to control. A hostile acquisition in this market
53
53
or a regulatory change providing protection to non-voting shareholders can increase the
expected value of control for all companies and, with it, the voting share premium.
In summary, then, we would expect the voting share premium to be highest in
badly managed firms where voting shares are dispersed among the public. We would
expect it to be smallest in well managed firms and in firms where the voting shares are
concentrated in the hands of insiders and management.
Empirical Evidence
Shares with different voting rights are unusual in the United States, especially
among larger market capitalization companies. Notwithstanding this fact, the earliest
studies of voting share premiums were done with companies with different voting share
classes in the United States. Lease, McConnell and Mikkelson (1983) found that voting
shares in that market trade, on average, at a relatively small premium of 5-10% over non-
voting shares.54 They also found extended periods where the voting share premium
disappeared or voting shares traded at a discount to non-voting shares, a surprising
finding that can be explained partially by the relative illiquidity of voting shares (since
only a small percentage is available for public trading). The small premium commanded
by voting shares was confirmed by Zingales in a study in 1995.55 Studies in recent years
have expanded the analysis of voting share premiums to other markets, where differential
voting rights are more common. Premiums of a magnitude similar to those found in the
United States (5-10%) were found in the United Kingdom and Canada. Much larger
premiums are reported in Latin America (50-100%), Israel (75%) and Italy (80%). In a
comparative study of voting premiums across 661 companies in 18 countries, Nenova
(2000) concludes that the legal environment was the key factor in explaining differences
across countries and that the voting premium is smaller in countries with better legal
protection for minority and non-voting stockholders and larger for countries without such
protection.56
54 Lease, R.C., J.J. McConnell and W.H. Mikkelson 1983, “The market value of control in publicly-traded corporations”, Journal of Financial Economics, 11, 439-471. 55 Zingales, L., 1995, “What determines the value of corporate votes?”, Quaterly Journal of Economics, 4, 1047-1073. 56 Nenova, T., 2000, “The Value of Corporate Votes and Corporate Control: A Cross Country analysis”, Working Paper, SSRN.

54
54
Some of the studies mentioned above also hypothesize (and test) for why voting
premiums may vary within the same market. Zingales, in a study of Italian stocks,
concludes that some of the voting premium differences across Italian shares can be
explained by the proportion of shares that are voting shares (lower proportions translate
into larger premiums per share) and the dividend privileges of non-voting shares (the
greater the privileges, the smaller the premium).57 However, he also concludes a large
proportion of the differences in voting share premiums cannot be explained by these
variables, and given the low likelihood of hostile takeovers, he attributes the differences
to private benefits that accrue to voting shareholders.
In an attempt to isolate the effect of control on voting share premiums, Linciano
examined the effects of changes in takeover law and corporate governance on Italian
voting and non-voting shares. A “mandatory bid” rule, introduced in 1992 in Italy,
allowed small voting shareholders to receive the same price in an acquisition as large
voting shareholders but did not extend to non-voting shareholders. Not surprisingly, the
premium on voting shares increased marginally (about 2%) after this rule. A subsequent
corporate governance reform law in 1997, which increased the power of non-voting
shareholders, decreased the premium by about 7%. Nenova (2001) reports similar results
from Brazil, where decreased protection for minority stockholders in a 1997 law doubled
the premium on voting shares and a subsequent reform of the law in 1999 reversed both
effects.58
In summary, the premium for voting shares reflects at least some of the expected
value of control. The relatively large premiums in some markets suggest that the private
benefits of control are large in those markets and may very well overwhelm the value of
control.
Illustration 5: Valuing voting and non-voting shares
To value voting and non-voting shares, we will consider Embraer, the Brazilian
aerospace company. As is typical of most Brazilian companies, the company has
common (voting) shares and preferred (non-voting shares).
57 Zingales, L. (1994), “The value of the voting right: A study of the Milan Stock Exchange experience”, The Review of Financial Studies, 1, 125-148. 58 Nenova, T., 2001, Control values and Changes in Corporate Law in Brazil, Working paper, SSRN.
55
55
We valued the company twice, first under the status quo and next under optimal
management. With existing management in place, we estimated a value of 12.5 billion $R
for the equity; this was based upon the assumption that the company would continue to
maintain its conservative (low debt) financing policy and high returns on investments
(albeit with a low reinvestment rate) at least for the near term. We then revalued the firm
at 14.7 billion $R, assuming that the firm would be more aggressive both in its use of
debt and in its reinvestment policy.
There are 242.5 million voting shares and 476.7 non-voting shares in the company
and the probability of management change is relatively low, partly because the bulk of
the voting shares are held by insiders59 and partly because the Brazilian government has
significant influence in the company.60 Assuming a probability of 20% that management
will change, we estimated the value per non-voting and voting share:
Value per non-voting share = Status Quo Value/ (# voting shares + # non-voting shares)
= 12,500/(242.5+476.7) = 17.38 $R/ share
Value per voting share = Status Quo value/sh + Probability of management change *
(Optimal value – Status Quo Value) = 17.38 + 0.2* (14,700-12,500)/242.5 = 19.19
$R/share
With our assumptions, the voting shares should trade at a premium of 10.4% over the
non-voting shares. If the probability of management change increases, we would expect
the premium to increase.
It should be noted that the non-voting shares in Embraer do have some advantages
that may offset some or all of the control premium. Non-voting shares have a prior claim
to dividends over voting shares and they also pay higher dividends. In addition, a higher
percentage of the non-voting shares are available to the public and traded, thus leading to
higher liquidity; only 19% of the voting shares are traded whereas 90% of the non-voting
shares are traded either on the Bovespa (34%) or on the New York Stock Exchange
(56%).
59 Of the 242.5 million voting shares, 80% is equally held by four entities – Cia Bozano, Previ, Sistel and the European Group. Effectively, they control the company. 60 The Brazilian government owns only 0.8% of the voting shares but a significant portion of Embraer’s customer financing is provided by the Brazilian development bank (BNDES), which also owns 9.6% of the non-voting shares.

56
56
d. Private Company Valuations A solely owned private company is usually run by its owner and its value will
reflect the quality of his or her decisions. Since a hostile acquisition of such a company is
not feasible, the expected value of control will become an issue only when the private
company is fully or partially sold. With partnerships or multiple investors owning shares
of a private business, the expected value of control can be an issue in valuing a ownership
stake, with larger controlling stakes commanding a premium over smaller minority
stakes. Finally, with private companies where there is separation of ownership and
management – the private owner hires a management team to run the firm – the expected
value of control can be a factor in whether management is replaced.61
Minority Discounts and Control Premiums
If we accept the premise that holding 51% of the outstanding equity at a private
business gives the owner effective control of such a business, there will be a significant
difference between selling 51% or more of a business and 49% or less of the same
business. With the first, you get effective control of the business, and with the latter, you
do not. In private company valuation parlance, the latter (buying 49% or less) is termed a
minority holding and is usually valued at a discount. While the discount is often
substantial, it is also arbitrary in practice. We may be able to get a more reasonable
estimate of the discount, using the expected value of control framework that we have
developed in this paper.
If you are able to buy a majority and controlling stake of a firm, the maximum
you should be willing to pay for your share should reflect the optimal value for the firm,
reflecting the changes you think you can make to the firm after you take it over. Thus,
when acquiring a 51% stake of a firm, you should be willing to pay 51% of the optimal
value for that firm. If you are setting for minority stake with no control in the firm, the
maximum you should be willing to pay will reflect the status quo value for the firm.
61 Coles, J.L., M.L. Lemmon and L. Naveen, 2003, A Comparison of Profitability and CEO Turnover Sensitivity in Large Private and Public Firms, Working Paper, SSRN. They note that the CEO of a private firm is much more likely to be fired when profitability declines than the CEO of a similar publicly traded firm.

57
57
The difference between a majority and minority stake (the minority discount) can
be very larger for companies where the value of control is high. For instance, if we
assume that the status quo value for the firm is $ 100 million and the optimal value is $
150 million, you would be willing to pay 51% of optimal value ($150 million) for a
controlling stake and only 49% of the status quo value ($ 100 million) for a minority
stake. The difference of 2% in voting rights translates into a difference of $26.5 million
in value:
Value of 51% of optimal value = 51% of $ 150 million = $ 76.5 million
Value of 49% of status quo value = 49% of 100 million = $ 49.0 million
Minority discount = = $27.5 million
Why does this same reasoning not apply to publicly traded firms where most of us
buy small stakes, with no obvious controlling power? It does, but in more subtle ways. As
we noted in an earlier section, the stock price of a publicly traded firm already reflects the
expected value of control. When you buy a small stake in a publicly traded firm, say 1000
shares of Cisco or IBM, you pay for this expected value of control in the market price. In
other words, you take the market’s assessment of the likelihood of control changing and
the value of that change as a given. When you buy a larger stake in the firm, where you
presumably can affect control, you are in a position to alter both the likelihood of
management changing and how it will be changed (and thus the value of change).
Consequently, the expected value of control to you as a large block stockholder may be
much higher than the market’s assessment and will translate into a premium for the
block. Once you acquire the block, the small stockholders in the firm will be able to
piggyback on your success at changing the way the company is run and share in the
increased value.
Implications
a. The minority discount should vary inversely with management quality: If the minority
discount reflects the value of control (or lack thereof), it should be larger for firms that
are poorly run and smaller for well-run firms. As with control premiums, there is no
simple rule of thumb that can be applied to minority discounts.
58
58
b. Control may not always require 51%: While it is true that you need 51% of the equity
to exercise control of a private firm when you have only two co-owners, it is possible to
effectively control a firm with s smaller proportion of the outstanding stock when equity
is dispersed more investors. In fact, an investor may be effectively able to control a firm
with only 35% of the outstanding equity, if there are multiple investors in the private firm
and the minority discount may not materialize until acquisitions become a much smaller
percentage of the equity. In a publicly traded firm with widely dispersed holdings, control
may be feasible with an even smaller stake in the firm.
c. The value of an equity stake will depend upon whether it provides the owner with a say
in the way a firm is run: Private firms often approach outside investors to raise additional
equity to fund their expansion and growth opportunities. These investors, who include
private equity and venture capital investors, can demand a share of control in return for
their investments. For instance, venture capitalists often get representation on the board
of directors and some power over subsequent rounds of equity financing. Many play an
active role in the management of the firms that they invest in and the value of their equity
stake should reflect this power. In effect, the expected value of control is built into the
equity value. In contrast, a passive private equity investor who buys and holds stakes in
private firms, without any input into the management process, should value her equity
stakes at a lower value.
Empirical Evidence
There is clear evidence that practitioners apply control premiums in private
company transactions, ranging from 15 to 20% for a majority stake; conversely, this
translates into an equivalent discount for a minority stake. The origins of these premiums
are mysterious and there have been relatively few attempts to back up these values
because it is difficult to estimate the precise extent of the minority discount in private
transactions since there is no market value to compare the transaction price to.
Hanouna, Sarin and Shapiro (2001) attempt to estimate the extent of the minority
discount by classifying 9566 transactions in publicly traded companies into minority and
majority transactions based upon ownership before and after the transaction; a minority
transaction is one where the acquirer has less than 30% of the outstanding equity both

59
59
before and after the transaction whereas a majority transaction is one where the acquirer
has 30% or less before the transaction and more than 50% after the transaction. They find
that minority transactions are valued at a discount of 20-30% on majority transactions in
“market oriented” economies like the UK and the US but that the discount is smaller in
“bank oriented” economies like Germany, Japan, France and Italy. 62
More generally, there is evidence that investors are willing to pay premiums to
acquire large blocks of shares, even though when they are well below the majority
threshold of 50%. Barclay and Holderness (1989, 1991) report premiums in excess of
10% for large negotiated block transactions in the United States.63 Nicodano and
Sembenelli (2000) extend the analysis to look at block transactions in Italy and conclude
that the average premium across large block trades is 27%; the premium increases with
block size with premiums of 31% for blocks larger than 10% and 24% for blocks smaller
than 10%.64
Illustration 5: Estimating the Minority Discount
Assume that you are valuing Kristin Kandy, a privately owned candy business for
sale in a private transaction. You have estimated a value of $ 1.6 million for the equity in
this firm, assuming that the existing management of the firm continues into the future and
a value of $ 2 million for the equity with new and more creative management in place.65
To estimate the value a majority stake (say 51%) of this value, we would use the
latter value:
Value of 51% of the firm = 51% of optimal value = 0.51* $ 2 million = $1.02 million
To value a minority stake in the same firm, we would use the status quo value:
Value of 49% of the firm = 49% of status quo value = 0.49 * $1.6 million = $784,000
62 Harouna, P., A. Sarin and A.C. Shapiro, 2001. Value of Corporate Control: Some International Evidence, Working Paper, USC Working paper series. 63 Barclay M.J. and C. Holderness, Private Benefits from Control of Public Corporations, Journal of Financial Economics, 25, 1989, 371-395; Barclay M.J. and C. Holderness, Negotiated Block Trades and Corporate Control, Journal of Finance, 56(3), 1991, 861-878. 64 Nicodano, G. and A. Sembenelli, 2000, Private Benefits, Block Transaction Premiums and Ownership Structure, Working Paper, SSRN. 65 The existing management has been conservative in assessing and going after growth opportunities, settling for a high return on capital and a low reinvestment rate. We assumed that the new management would be more aggressive, reinvesting more at a lower return on capital (though still higher than the cost of capital).

60
60
Note that a 2% difference in ownership translates into a large difference in value because
one stake (51%) ensures control and the other does not.
Conclusion The value of control in a firm should lie in being able to run that firm differently
and better. Consequently, the value of control should be greater in poorly performing
firms, where the primary reason for the poor performance is the management. In this
paper, we first consider how the management of a firm can affect its value and then the
likelihood that incumbent management in the firm can be changed. It is our contention
that the market value of every firm reflects the expected value of control, which is the
product of the probability of management changing and the effect on value of that
change. This has far ranging implications. In acquisitions, the premiums paid should
reflect how much the price already reflects the expected value of control; in a market that
already reflects a high value for expected control, the premiums should be smaller. With
companies with voting and non-voting shares, the premium on voting shares should
reflect the expected value of control. If the probability of control changing is small and/or
the value of changing management is small (because the company is well run), the
expected value of control should be small and so should the voting stock premium. In
firms where there is potential for changing the way management is run, the expected
value of control and the voting share premium should be large. Finally, in private
company valuation, the discount applied to minority blocks should be a reflection of the
value of control.