the value of wind power forecasting
TRANSCRIPT

NREL is a national laboratory of the U.S. Department of Energy, Office of Energy Efficiency & Renewable Energy, operated by the Alliance for Sustainable Energy, LLC.
Contract No. DE-AC36-08GO28308
The Value of Wind Power Forecasting Preprint Debra Lew and Michael Milligan National Renewable Energy Laboratory
Gary Jordan and Richard Piwko GE Energy
Presented at the 91st American Meteorological Society Annual Meeting, the Second Conference on Weather, Climate, and the New Energy Economy Washington, DC January 26, 2011
Conference Paper NREL/CP-5500-50814 April 2011

NOTICE
The submitted manuscript has been offered by an employee of the Alliance for Sustainable Energy, LLC (Alliance), a contractor of the US Government under Contract No. DE-AC36-08GO28308. Accordingly, the US Government and Alliance retain a nonexclusive royalty-free license to publish or reproduce the published form of this contribution, or allow others to do so, for US Government purposes.
This report was prepared as an account of work sponsored by an agency of the United States government. Neither the United States government nor any agency thereof, nor any of their employees, makes any warranty, express or implied, or assumes any legal liability or responsibility for the accuracy, completeness, or usefulness of any information, apparatus, product, or process disclosed, or represents that its use would not infringe privately owned rights. Reference herein to any specific commercial product, process, or service by trade name, trademark, manufacturer, or otherwise does not necessarily constitute or imply its endorsement, recommendation, or favoring by the United States government or any agency thereof. The views and opinions of authors expressed herein do not necessarily state or reflect those of the United States government or any agency thereof.
Available electronically at http://www.osti.gov/bridge
Available for a processing fee to U.S. Department of Energy and its contractors, in paper, from:
U.S. Department of Energy Office of Scientific and Technical Information
P.O. Box 62 Oak Ridge, TN 37831-0062 phone: 865.576.8401 fax: 865.576.5728 email: mailto:[email protected]
Available for sale to the public, in paper, from:
U.S. Department of Commerce National Technical Information Service 5285 Port Royal Road Springfield, VA 22161 phone: 800.553.6847 fax: 703.605.6900 email: [email protected] online ordering: http://www.ntis.gov/help/ordermethods.aspx
Cover Photos: (left to right) PIX 16416, PIX 17423, PIX 16560, PIX 17613, PIX 17436, PIX 17721
Printed on paper containing at least 50% wastepaper, including 10% post consumer waste.

1
The Value of Wind Power Forecasting
1. Introduction With increasing penetration of wind generation on interconnected power systems, system operators are faced with increased levels of variability and uncertainty. Given that the power output of wind plants is a function of wind speed, the level of wind generation on a power system varies from hour-to-hour and from day-to-day. And given that wind speed is a function of the weather, the amount of wind that a power system operator can expect for the next day is subject to the level of uncertainty in weather-related forecasts for the next day. Power system operators presently use day-ahead load forecasts to predict how much energy must be delivered for each hour of the next day. This forecast enables day-ahead commitment of generation resources, some of which may need many hours advance notice to be ready to generate power during the next day. Power systems with high penetrations of wind generation use day-ahead wind forecasts to predict how much of the wind power will be available for each hour of the next day. Combining the wind forecast with the load forecast enables operators to commit the balance of the generation fleet to economically and securely serve load on the next day. Forecasts are not perfect. Load forecasting is a very mature science since power system operators have been using day-ahead load forecasts in their security-constrained unit commitment (SCUC) processes for several decades. Day-ahead hourly load forecast errors are typically in the range of 1% to 3% (GE Energy, 2009). Today’s wind forecasts typically have errors in the range of 15% to 20% mean absolute error (MAE) for a single wind plant. Wind integration studies are now routinely undertaken by utilities and ISO’s to determine the impact of wind variability and uncertainty on the power system. Cost impacts are typically determined by considering the cost of increased operating reserves needed to accommodate the variability and uncertainty. For many studies, the uncertainty, or wind forecast error, is a significant driver in these integration costs (DeMeo, 2007). Even with imperfect forecasts, large-scale wind integration studies have demonstrated that using day-ahead wind power forecasts for unit commitment can dramatically improve system operation by reducing overall operating costs, reducing unserved energy, and reducing wind curtailment, while maintaining required levels of system reliability. This paper analyzes the potential benefits of improving the accuracy (reducing the error) of day-ahead wind forecasts on power system operations, assuming that wind forecasts were used for day-ahead security constrained unit commitment. In this paper, State-of-the-art (SOA) forecasts refer to current forecasting technology. When wind forecasts are lower than actual wind plant output, more conventional generation is committed in the day ahead than is actually needed. This means that the committed conventional generation will be operated at lower power output than planned, which would be a less efficient operating point for the system (primarily due to lower efficiency at lower power levels for thermal units). If the wind forecast error is large enough, it may be necessary to curtail some of the excess wind (or other) generation.

2
When wind forecasts are higher than actual wind plant output, less conventional generation is committed in the day ahead than is actually needed during the day of operation. Turning on quick-start peaking units normally mitigates the shortage in committed generation, but this drives up system operating cost significantly because of their lower efficiency. If the wind forecast error is large enough, there is also a risk of operating reserve shortfalls or possibly load-shedding. This paper builds on the extensive models developed for the Western Wind and Solar Integration Study (WWSIS) which examined the operating impact of large amounts of wind and solar energy in the Western Electricity Coordinating Council (WECC) (GE Energy, 2010). WWSIS examined up to 35% wind and solar energy penetration in the WestConnect portion of WECC (See Figure 1) and up to 23% wind and solar energy penetration in the rest of WECC. Averaged across WECC, this totaled up to 27% wind and solar energy penetration. This study uses these WECC models to evaluate the operating cost impacts of improved day-ahead wind forecasts. In order to estimate the potential impacts for the entire U.S. power grid, the WECC results are extrapolated according to the relative sizes of the WECC and U.S. power grids, as measured by annual load energy. 2. Study Scenarios The siting scenario used in this analysis is the “In-Area” scenario of the WWSIS (GE Energy, 2010). Table 1 summarizes the wind plant capacities and wind energy penetration levels for each case. Cases in this study examined WECC wind energy penetration levels of 0%, 3%, 10%, 14%, and 24%. Additionally, increasing levels of solar energy were also included in these cases.
Figure 1 − All of WECC was modeled, with higher wind penetrations in the WestConnect region.
3TIER Group developed the modeled wind plant outputs for each of the wind sites by running the Numerical Weather Prediction model WRF over the western U.S. using the National Center for Environmental Protection/National Center for Atmospheric Research Global Reanalysis input dataset (3TIER, 2010). This 3-dimensional model of the atmosphere essentially recreated the weather patterns over the years 2004-2006 and this model was sampled at a 2-km spatial resolution and 10-minute temporal resolution to develop the wind plant output dataset. These modeled wind plant outputs are called actuals in this paper.

3
WestConnect Wind Energy Penetration
WECC Wind
Energy Penetration
Wind Capacity
(MW)
Wind Energy (GWh)
0% 0% 0 0
3% 3% 10,230 22,526
10% 10% 33,240 93,339
20% 14% 42,900 122,336
30% 24% 75,390 214,381 Table 1 − Total wind plant capacity and wind energy penetrations for study cases.
3TIER Group also developed day-ahead wind forecasts for each wind plant for each hour of the following day (3TIER, 2010). The forecasts exhibited MAE in the range of 12% to 16% when aggregated on a state-by-state basis (i.e., calculated by aggregating the hourly day-ahead forecasts and hourly actual outputs for all wind plants in a given state). Section 5.6 of the WWSIS report details more information about the SOA wind forecast data (GE Energy, 2010). These modeled wind plant forecasts are called SOA forecasts in this paper. 3. Analysis Approach This paper builds upon the methods and models developed during the WWSIS project. The same Multi-Area Production Simulation (MAPS) model used to simulate hourly operation of the WECC system for WWSIS was used for this paper. Chapter 6 of the WWSIS report explains the details of that model (GE Energy, 2010). In this paper, the wind generation forecast improvements are expressed in power (MW), not wind speed (meters/second). For typical pitch-controlled wind turbines, power output varies as the cube of wind speed over a significant portion of the power output curve (see Figure 2). In this region, small improvements in forecasted wind speed would lead to significantly larger improvements in wind power forecasts. Wind forecasting is an active area of research and development. It is not yet clear how future wind forecasts will be improved. Future forecasting improvements may target extreme events, or may provide slight increases in accuracy at all times.
Figure 2 − Example of wind turbine power output curve.
0
200
400
600
800
1,000
1,200
1,400
1,600
0 5 10 15 20 25
Wind Speed (m/s)
Elec
tric
al P
ower
(kW
)
Power proportional to (wind speed)3

4
In this paper, forecasting improvements were modeled by reducing the day-ahead SOA wind generation forecast errors by 0%, 10%, 20%, and 100% for each hour of the year. This effectively modeled SOA, 10% improvement, 20% improvement, and perfect forecasts respectively. The production simulations of the entire WECC system were then repeated to evaluate operating impacts. Wind generation and load profiles from the years 2004, 2005, and 2006 were analyzed.
Figure 3 − SOA and improved wind forecasts for Arizona wind plants for two days in January.
Figure 3 shows forecast and actual aggregated wind plant output for a region of Arizona with 1920 MW of wind generation, for the 24% WECC wind penetration case, and for two days in January. The black curve represents the actual wind plant output. The red curve is the base SOA forecast. The blue and green curves represent the SOA forecast with a reduction in forecast error of 10% and 20% respectively. Figure 4 shows the errors in each of the three wind generation forecasts, calculated as the difference between the forecast value and the actual value. For 80% of the hours of the year, the forecast errors are less than 500 MW. But there are a few hours each year in which forecast errors can be plus or minus 1500 MW. In this paper, the day-ahead unit commitment process assumed that the forecasted wind generation would be available, and committed other generation resources to cover the net load (load minus forecasted wind generation) plus reserves.
Figure 4 − Wind forecast errors for Arizona wind plants for two days in January.
0
200
400
600
800
1,000
1,200
1,400
1,600
1,800
2,000
0 6 12 18 24 30 36 42 48
Hour
Gen
erat
ion
(MW
)
ActualSOA Forecast10% Improvement20% Improvement
-1,000
-800
-600
-400
-200
0
200
400
600
800
1,000
0 6 12 18 24 30 36 42 48
Hour
Erro
r (M
W)
SOA Error10% Error Reduction20% Error Reduction

5
4. Results The potential benefits of improved day-ahead wind generation forecasts were evaluated with respect to three critical metrics: operating costs, unserved energy, and wind curtailment. 4.1 Operating Costs For this analysis, operating costs include the variable costs associated with operating the WECC power system for a year, including fuel costs, unit start-up costs, and unit variable operation and maintenance (O&M) costs. Operating costs exclude capital costs, debt service costs, and other fixed costs. Figure 5 shows the annual operating cost savings for the WECC system averaged over the years 2004-2006, for a 10% and 20% reduction in the day-ahead wind forecast error. As expected, savings increase with improved forecasts. Forecasting improvements of 20% provide roughly twice the savings of improvements of 10%. At low penetration levels (up to 15%), savings are modest. There is a nonlinear increase in savings at higher penetration levels (e.g., 24%), which reflects a general result of WWSIS that shows a much greater impact of higher penetration levels [GE Energy, 2010]. At these penetration levels, there were hours in which the day-ahead forecast errors were nearly half of the installed capacity. WWSIS examined the use of increased reserves or storage to address these hours and ultimately came to the conclusion that these hours may be better addressed through demand response or smarter, more dynamic reserve requirements.
Figure 5 − Average annual operating cost savings versus wind penetration, for 10 and 20% wind forecast
improvements. At a 14% wind energy penetration in WECC, the results show:
A 10% improvement in day-ahead wind generation forecasts yields an average of $28M savings in annual operating costs.
A 20% improvement in day-ahead wind generation forecasts yields an average of $52M savings in annual operating costs.
With a 24% wind energy penetration in WECC, the results show:
A 10% improvement in day-ahead wind generation forecasts yields an average of $100M savings in annual operating costs.
0
50
100
150
200
250
0 10 20Savi
ngs
over
SO
A F
orec
ast (
$M)
Wind Energy Penetration Level (%)
20% improvement
10% improvement

6
A 20% improvement in day-ahead wind generation forecasts yields an average of $195M savings in annual operating costs.
Figure 6 shows how operating cost savings vary with improvements in forecasting. The data for the 100% improved, or perfect, forecast shows the maximum possible benefit to the WECC operating cost from wind forecasts. Although a perfect wind forecast is not realistically possible, the data serves as a calibration for the amount of benefit gained from more realistic levels of forecast improvements.
Figure 6 − Average annual operating cost savings versus wind forecast improvements, shown for 3, 10,
14, and 24% WECC wind energy penetrations. A critical observation here is that the slope of the curves becomes lower as the level of forecast improvement increases, indicating that there is a diminishing benefit for greater forecast improvements. The initial 10% or 20% improvements in wind forecasts provide the greatest relative benefits. Further improvement will provide diminishing marginal benefits, approaching the perfect forecast. 4.1.1 Extrapolation to entire U.S. power grid According to historical data for year 2009 in the Ventyx database (from WWSIS), annual energy demand for WECC was 714 TWh and annual energy demand for the entire United States was 3836 TWh. Therefore, the WECC system serves slightly less than 20% of the total U.S. electrical energy demand. Assuming that the operational characteristics of the WECC system are generally representative of other operating areas in the U.S., it is reasonable to roughly estimate the operating cost impacts of improved wind forecasts on the entire U.S. by multiplying the WECC results by a factor of 5. With 14% wind energy penetration in the U.S., extrapolation of the WECC results implies that:
A 10% improvement in day-ahead wind generation forecasts yields an average of $140M savings in annual operating costs.
A 20% improvement in day-ahead wind generation forecasts yields an average of $260M savings in annual operating costs.
0
100
200
300
400
500
600
0% 25% 50% 75% 100%
Ann
ual O
pera
ting
Cos
t S
avin
gs ($
M)
Percentage Improvement in Forecast Error
3% wind
24% wind
14% wind
10% wind

7
With 24% wind energy penetration in the U.S., extrapolation of the WECC results implies that:
A 10% improvement in day-ahead wind generation forecasts yields an average of $500M savings in annual operating costs.
A 20% improvement in day-ahead wind generation forecasts yields an average of $975M savings in annual operating costs.
4.2 Operating Reserve Shortfalls A shortfall in operating reserves occurs when there is insufficient generation available to serve the load and meet operating reserve requirements. When a reserve shortfall occurs, there is still adequate generation to serve the load, but there is not enough generation to supply all required reserves. The magnitude of the reserve shortfall is the cumulative shortage in reserve energy for all hours over a calendar year of operation. In a system that has adequate installed capacity margin, reserve shortfall events are extremely rare. When such an event does occur, a likely cause is a large error in the day-ahead forecast used for unit commitment. These events would typically develop in the following sequence: The day-ahead unit SCUC commits adequate generation to meet the forecast load for the next
day using forecasted wind generation and other dispatchable generation resources. The commitment also includes required operating reserves.
When the next day arrives, actual wind generation falls significantly below the forecasted level, or actual load is significantly above the forecasted load, or both.
Quick start generation is committed and dispatched to fill the shortfall to the extent possible, but there is still not enough generation available to completely meet operating reserve requirements.
Study results indicate that improved day-ahead wind generation forecasts have no significant impact on reserve shortfalls if WECC wind energy penetration is below 14% because there were sufficient quick-start generators available to cover the forecast errors. With wind energy penetration of 24%, improved wind forecasts significantly reduce reserve shortfalls (see Figure 7). For the three calendar years analyzed, average annual operating reserve shortfalls would be reduced from 43 GWh to 24 GWh with a 10% wind forecast improvement. Reserve shorfalls would be further reduced to 15 GWh with a 20% wind forecast improvement.
Figure 7 − Reserve shortfalls with improved wind generation forecasts for the 24% WECC wind energy
penetration case.
0
10
20
30
40
50
60
2004 2005 2006 Average
Res
erve
Sho
rtfa
lls (G
Wh)
SOA Forecast10% Improvement20% Improvement
8
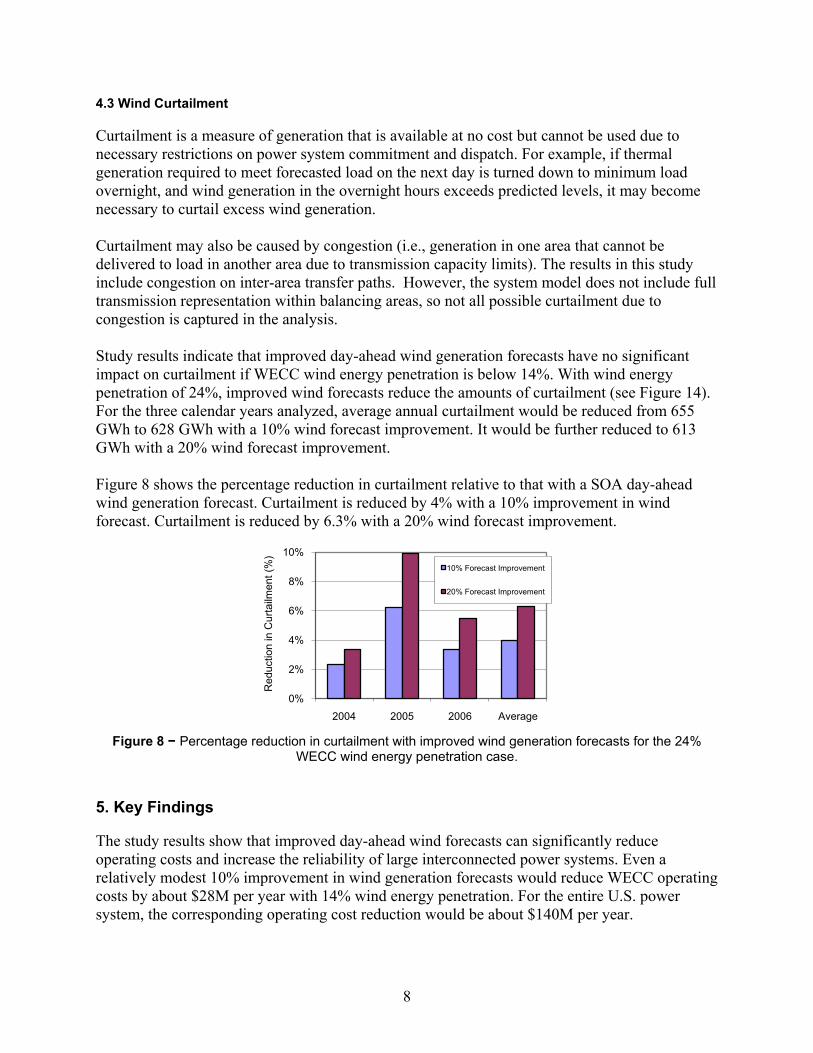
4.3 Wind Curtailment Curtailment is a measure of generation that is available at no cost but cannot be used due to necessary restrictions on power system commitment and dispatch. For example, if thermal generation required to meet forecasted load on the next day is turned down to minimum load overnight, and wind generation in the overnight hours exceeds predicted levels, it may become necessary to curtail excess wind generation. Curtailment may also be caused by congestion (i.e., generation in one area that cannot be delivered to load in another area due to transmission capacity limits). The results in this study include congestion on inter-area transfer paths. However, the system model does not include full transmission representation within balancing areas, so not all possible curtailment due to congestion is captured in the analysis. Study results indicate that improved day-ahead wind generation forecasts have no significant impact on curtailment if WECC wind energy penetration is below 14%. With wind energy penetration of 24%, improved wind forecasts reduce the amounts of curtailment (see Figure 14). For the three calendar years analyzed, average annual curtailment would be reduced from 655 GWh to 628 GWh with a 10% wind forecast improvement. It would be further reduced to 613 GWh with a 20% wind forecast improvement. Figure 8 shows the percentage reduction in curtailment relative to that with a SOA day-ahead wind generation forecast. Curtailment is reduced by 4% with a 10% improvement in wind forecast. Curtailment is reduced by 6.3% with a 20% wind forecast improvement.
Figure 8 − Percentage reduction in curtailment with improved wind generation forecasts for the 24%
WECC wind energy penetration case. 5. Key Findings The study results show that improved day-ahead wind forecasts can significantly reduce operating costs and increase the reliability of large interconnected power systems. Even a relatively modest 10% improvement in wind generation forecasts would reduce WECC operating costs by about $28M per year with 14% wind energy penetration. For the entire U.S. power system, the corresponding operating cost reduction would be about $140M per year.
0%
2%
4%
6%
8%
10%
2004 2005 2006 Average
Red
uctio
n in
Cur
tailm
ent (
%)
10% Forecast Improvement
20% Forecast Improvement

9
Reduction in
Forecast Error
Wind Energy
Penetration
WECC Annual
Operating Cost
Savings ($M)
Estimated US Annual
Operating Cost Savings
($M)
10% 14% $28M $140M
20% 14% $52M $260M
10% 24% $100M $500M
20% 24% $195M $975M
Table 2 − Annual operating cost reductions due to improved day-ahead wind generation forecasts. The impacts are even greater at higher penetrations of wind energy. A 10% wind forecast improvement would reduce WECC operating costs by about $100M per year with 24% wind energy penetration. For the entire U.S. power system, the corresponding operating cost reduction would be about $500M per year. These findings are summarized in Table 2. Improved wind generation forecasts can reduce the amount of curtailment by up to 6%, thereby increasing the overall energy efficiency of the power system. Improved wind forecasts also increase the reliability of power systems by reducing operating reserve shortfalls. A 20% wind forecast improvement could decrease reserve shortfalls by as much as 2/3 with 24% wind energy penetration. 6. Future Work The study results suggest several areas that could warrant further exploration: 1. This study assumed that wind power forecasts were improved by the same percentage in all
hours of the year. But what if it was possible to obtain bigger improvements for periods with the biggest forecast errors? Large forecast errors lead to most of the problems and costs with system operations, so reducing the largest errors would be very beneficial.
2. In general, over-forecasting wind power causes more severe problems for system operations than under-forecasting wind power. When wind is over-forecast (predicting more wind power than actually occurs), the power grid experiences a shortage in unit commitment and expensive peaking units are turned on to fill the gap. There is also the risk of reserve shortfalls. Would it be possible to improve wind forecasts such that over-forecast errors are reduced by a greater amount? What would be the value of such an improvement?
3. Wind forecast providers are moving towards ensemble forecasts and other methods that enable confidence bands to be placed around forecast values. How would improved wind forecast techniques affect those confidence values? And how could forecast confidence data be used in the unit commitment process?
7. Acknowledgements The authors graciously acknowledge support from the DOE Wind Program.

10
8. References
GE Energy, Enernex, AWS Truewind, 2009: Technical Requirements for Wind Generation Interconnection and Integration. For ISO-New England, 118 pp.
DeMeo, E.A., G.A. Jordan, C. Kalich, J. King, M.R. Milligan, C. Murley, B. Oakleaf, and M.J. Schuerger, Nov/Dec. 2007: Accommodating Wind’s Natural Behavior. IEEE Power & Energy Magazine, vol. 5(6) pp. 59-67.
GE Energy, 2010: Western Wind and Solar Integration Study. NREL/SR-550-47434, 317 pp.
3TIER, 2010: Development of Regional Wind Resource and Wind Plant Output Datasets. NREL/SR-550-47676, 23 pp.

F1147-E(10/2008)
REPORT DOCUMENTATION PAGE Form Approved OMB No. 0704-0188
The public reporting burden for this collection of information is estimated to average 1 hour per response, including the time for reviewing instructions, searching existing data sources, gathering and maintaining the data needed, and completing and reviewing the collection of information. Send comments regarding this burden estimate or any other aspect of this collection of information, including suggestions for reducing the burden, to Department of Defense, Executive Services and Communications Directorate (0704-0188). Respondents should be aware that notwithstanding any other provision of law, no person shall be subject to any penalty for failing to comply with a collection of information if it does not display a currently valid OMB control number. PLEASE DO NOT RETURN YOUR FORM TO THE ABOVE ORGANIZATION. 1. REPORT DATE (DD-MM-YYYY)
April 2011 2. REPORT TYPE
Conference Paper 3. DATES COVERED (From - To)
4. TITLE AND SUBTITLE
The Value of Wind Power Forecasting 5a. CONTRACT NUMBER
DE-AC36-08GO28308
5b. GRANT NUMBER
5c. PROGRAM ELEMENT NUMBER
6. AUTHOR(S) Debra Lew and Michael Milligan, NREL Gary Jordan and Richard Piwko, GE Energy
5d. PROJECT NUMBER NREL/CP-5500-50814
5e. TASK NUMBER WE11.0810
5f. WORK UNIT NUMBER
7. PERFORMING ORGANIZATION NAME(S) AND ADDRESS(ES) National Renewable Energy Laboratory 1617 Cole Blvd. Golden, CO 80401-3393
8. PERFORMING ORGANIZATION REPORT NUMBER NREL/CP-5500-50814
9. SPONSORING/MONITORING AGENCY NAME(S) AND ADDRESS(ES)
10. SPONSOR/MONITOR'S ACRONYM(S) NREL
11. SPONSORING/MONITORING AGENCY REPORT NUMBER
12. DISTRIBUTION AVAILABILITY STATEMENT National Technical Information Service U.S. Department of Commerce 5285 Port Royal Road Springfield, VA 22161
13. SUPPLEMENTARY NOTES
14. ABSTRACT (Maximum 200 Words) This study, building on the extensive models developed for the Western Wind and Solar Integration Study (WWSIS), uses these WECC models to evaluate the operating cost impacts of improved day-ahead wind forecasts.
15. SUBJECT TERMS WECC; WWSIS; day-ahead; power grid operations; power grid modeling; wind power forecasts
16. SECURITY CLASSIFICATION OF: 17. LIMITATION OF ABSTRACT
UL
18. NUMBER OF PAGES
19a. NAME OF RESPONSIBLE PERSON a. REPORT
Unclassified b. ABSTRACT Unclassified
c. THIS PAGE Unclassified 19b. TELEPHONE NUMBER (Include area code)
Standard Form 298 (Rev. 8/98) Prescribed by ANSI Std. Z39.18