wind and solar power forecasting - wasaproject.info te… · short term forecasting wind and solar...
TRANSCRIPT

DISCLAIMER:This document is proprietary and strictly confidential. The contents of this document should not be copied, distributed or reproduced in whole or in part, nor passed to any third party without the prior written consent of ENFOR.
Short term forecastingWind and solar power forecasting
Henrik Aalborg Nielsen, Ph.D., Director of Analysis and Modelling, ENFOR A/S
Weather forecasting and power generation seminar, SANEDI, Sandton, South Africa, 2017-09-19
Weather forecasting and power generation
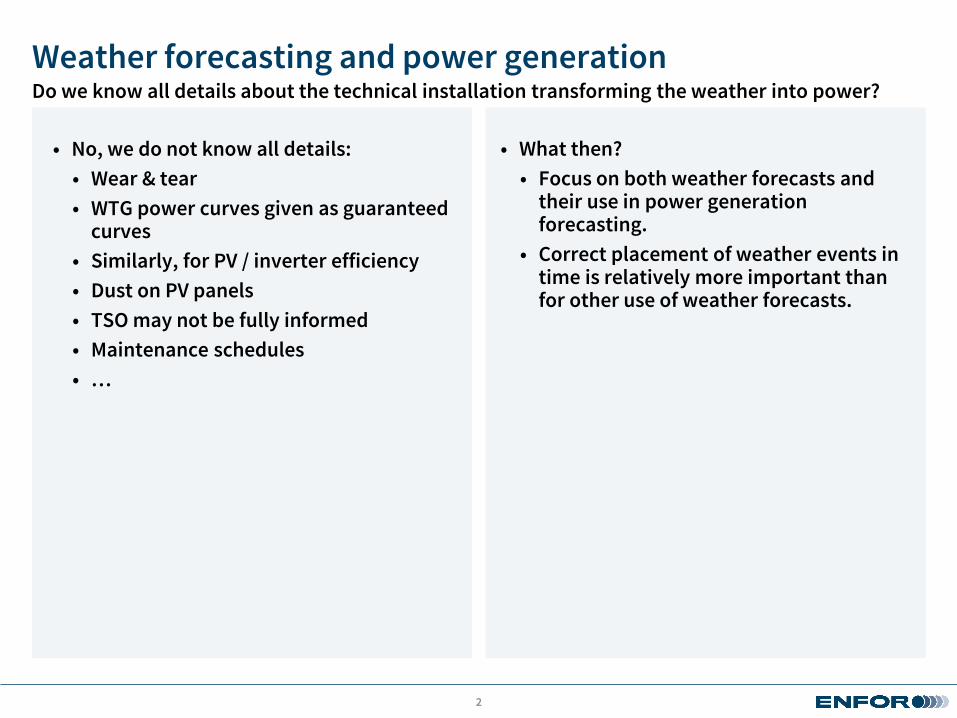
• What then?
• Focus on both weather forecasts and their use in power generation forecasting.
• Correct placement of weather events in time is relatively more important than for other use of weather forecasts.
• No, we do not know all details:
• Wear & tear
• WTG power curves given as guaranteed curves
• Similarly, for PV / inverter efficiency
• Dust on PV panels
• TSO may not be fully informed
• Maintenance schedules
• …
2
Do we know all details about the technical installation transforming the weather into power?

Agenda
Forecast principle2
Integration into EMS3
Performance4
Recommendations / final remarks5
3
History and presentation of ENFOR1
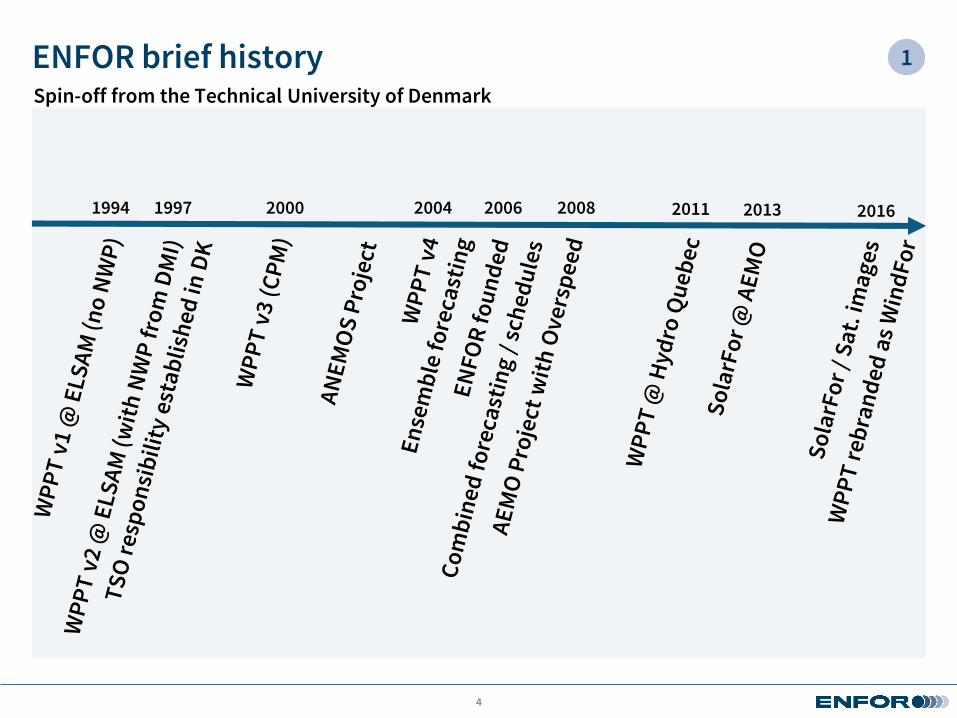
ENFOR brief history
4
1994 1997 2000 2004 2006 2008 2013 20162011
Spin-off from the Technical University of Denmark
1

ENFOR – Company presentation
ENFOR
Delivers software systems and services for operational energy forecasting and optimization, based on more than 25 years of research
Systems have operational track record of almost 20 years
Software systems and services based on the three quality parameters; accuracy, flexibility and reliability Accuracy – State-of-the-art machine learning
delivers market leading forecast accuracy
Flexibility - Customer orientation, business understanding and adaption to customer needs
Reliability – High availability, fault tolerant systems and effective fall back procedures
Delivers both standard software systems, specialized tailor made solutions and consultancy services
5
Selected customer references
TSO’s, energy traders and asset owners in more than thirteen countries around the world us
AEMO (Australia)
Hydro Quebec (Canada)
E.ON (Multiple European countries)
Vattenfall (Multiple European countries)
DONG Energy (Multiple European countries)
EirGrid (Ireland)
LitGrid (Lithuania)
HOPS (Croatia)
Energinet.dk (Denmark)
and many more…

Forecasting and optimization software platform
6
ENFOR solution portfolio
Software platform with a number of specialized solutions:
Consists of the following key solutions:
WindFor - Forecasting of wind power
SolarFor – Forecasting of solar power
LoadFor – Forecasting of power load/demand
PMON – Statistical quality control of the production from wind and solar farms
Additional solutions for other energy applications:
HeatFor - Forecasting of heat demand
HeatTO - Optimization of district heating networks
MetFor: Locally optimized weather forecasts
PriceFor – Forecasting of electricity prices
ChargeME – Forecasting and charge management of electric vehicles
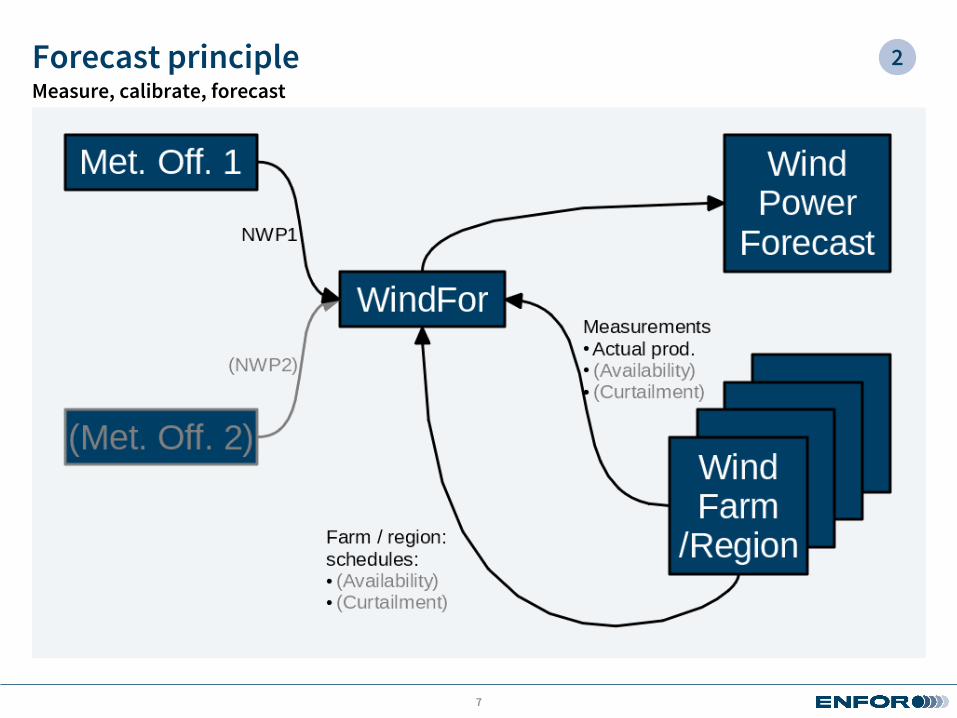
Forecast principle
7
Measure, calibrate, forecast
2
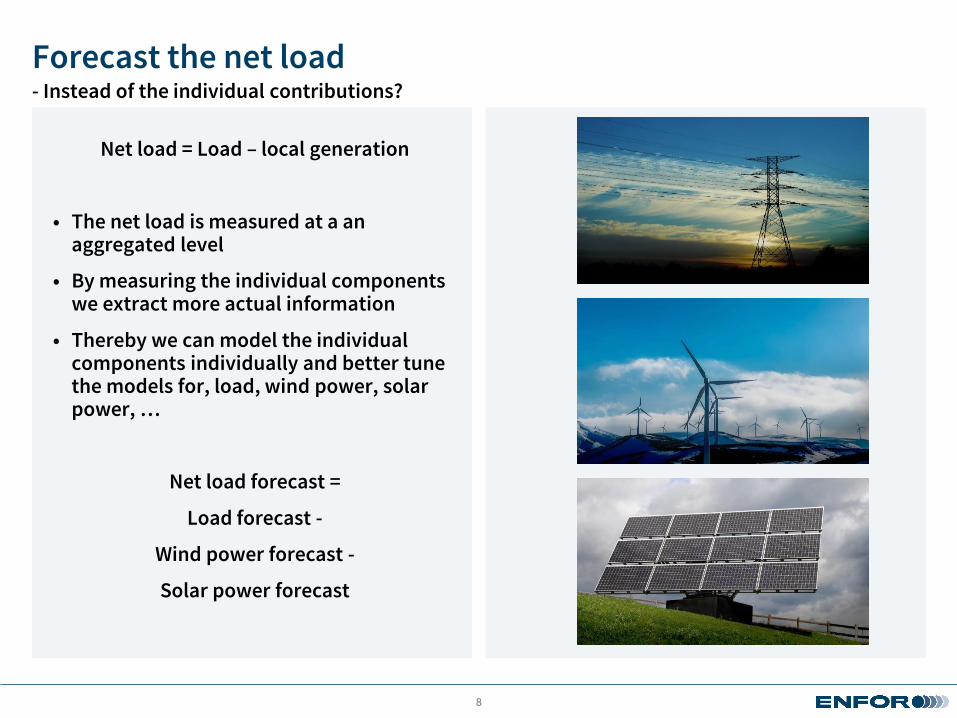
Forecast the net load
Net load = Load – local generation
• The net load is measured at a an aggregated level
• By measuring the individual components we extract more actual information
• Thereby we can model the individual components individually and better tune the models for, load, wind power, solar power, …
Net load forecast =
Load forecast -
Wind power forecast -
Solar power forecast
8
- Instead of the individual contributions?
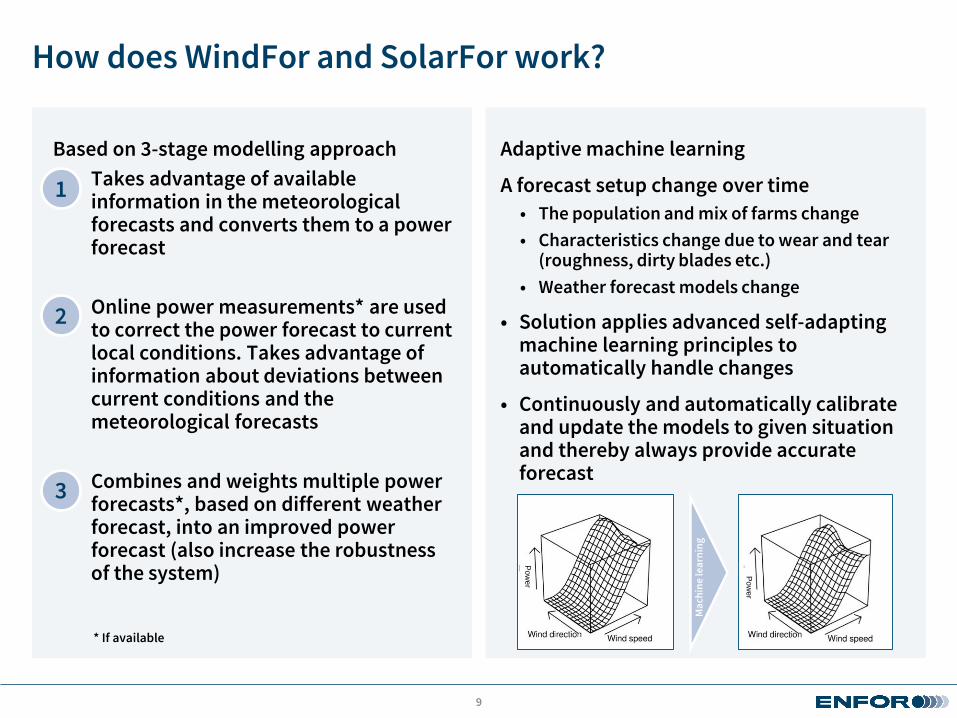
How does WindFor and SolarFor work?
Adaptive machine learning
A forecast setup change over time
• The population and mix of farms change
• Characteristics change due to wear and tear (roughness, dirty blades etc.)
• Weather forecast models change
• Solution applies advanced self-adapting machine learning principles to automatically handle changes
• Continuously and automatically calibrate and update the models to given situation and thereby always provide accurate forecast
Based on 3-stage modelling approach
• Takes advantage of available information in the meteorological forecasts and converts them to a power forecast
• Online power measurements* are used to correct the power forecast to current local conditions. Takes advantage of information about deviations between current conditions and the meteorological forecasts
• Combines and weights multiple power forecasts*, based on different weather forecast, into an improved power forecast (also increase the robustness of the system)
9
Po
we
r
2
1
3
* If available
Po
we
r
Ma
chin
e le
arn
ing

WindFor and SolarFor - configurations
Runs in off-line mode, on-line mode or combination
Online mode with real time production and availability data for optimal short term predictions
Offline mode for a more simple setup when short term or intra-day forecasting is less important
Combination mode, when only some farms can deliver online data. (Upscaling module can be used to improve total forecast using online data)
10
Advanced statistical modules for enhanced output
Different configurations for different needs
Accurate point forecast for standard trading and operations
Ensemble forecast module for generating quantiles and uncertainty bands which can be used for optimizing trading strategies or operational risk assessment
Scenario generation. Fully compliant with statistical distribution across the time dimension – especially useful for optimizing storage strategy or other state dependent issues
* Mean absolute error (MAE) normalized with installed capacity of wind farms
time
po
we
r
time
time
po
we
rp
ow
er
Horizon5h 2d
NM
AE
*
Advanced forecast products
Using advanced forecast products
• The decision process should be able to handle multiple scenarios of the future wind power production.
• Given that the scenarios are probabilistic correct the decision process can be set in a stochastic framework, where e.g. expected revenues are maximised.
• For some decision problems analysis show that we don’t need scenarios –quantiles are enough
Why use advanced forecast products?
• Point forecasts, i.e. regular forecasts, are simple to understand and use because they can be used in standard (deterministic) calculations.
We should all aim at providing the most precise point forecasts and indeed WPPT often outperform competitors.
• However, still point forecasts of wind and solar power production are uncertain and we should investigate how this uncertainty can be handled.
11
Point forecasts, quantiles, or scenarios/ensembles

Imbalance scenariosScenarios of deviations from the current plan
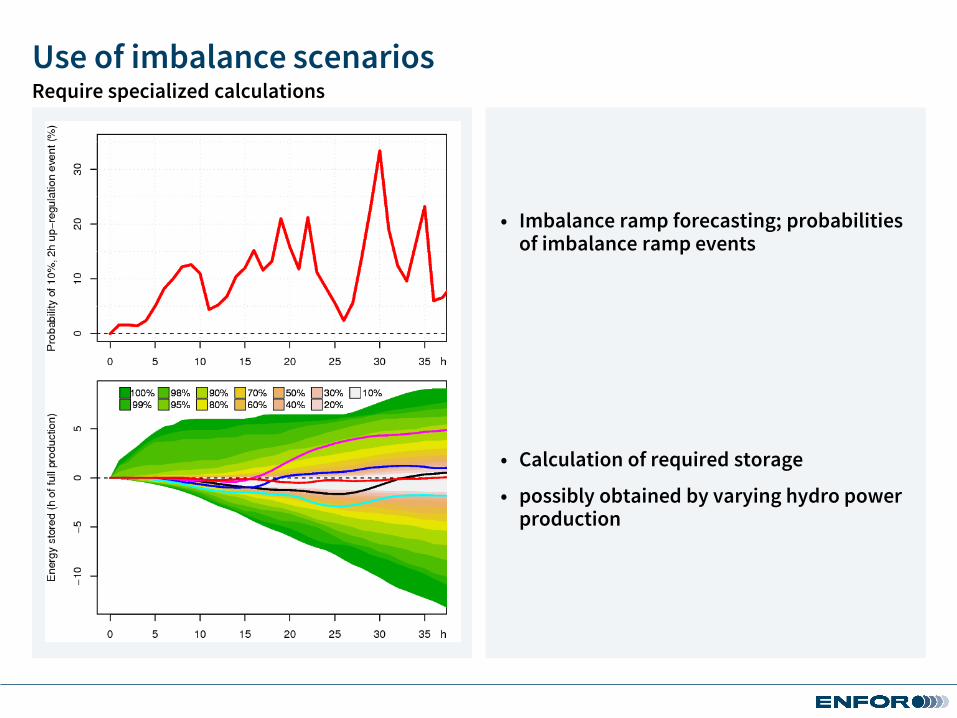
Use of imbalance scenarios
• Imbalance ramp forecasting; probabilities of imbalance ramp events
Require specialized calculations
• Calculation of required storage
• possibly obtained by varying hydro power production

WindFor and SolarFor integration
Fully configurable forecast frequency, forecast horizon, time resolution and spatial resolution
Typically time resolution is 15 minutes or 1 hour, but 5 minutes resolution also fairly common
Forecast frequency should match data update frequency (weather and production update)
Forecast horizon from hours and up to two weeks
Dedicated ultra short term forecasting (minutes) module
Dedicated module based on ensemble weather forecasts for more reliable long term forecasts (weeks)
Forecast provided with any given spatial (geographic) resolution
Typically forecasts are provided per wind farm and as a total, but any other aggregation is also available
Easy integration of in- and output data
Integrates with major global numerical weather providers (NWP) and local mesoscale models
Production data and forecast output are easily integrated to client systems through support for multiple formats, webservices, FTP, sFTP and flat files
All data are validated throughout the data flow and error correction will automatically be applied by the system if issues are detected
14
User interface and reporting module
Highly configurable browser based user interface for monitoring operations and tracking real time performance
Highly configurable performance reporting module for following performance trends, identification of improvement areas and issues
Highly flexible and configurable forecasting platform
3

WindFor and SolarFor – special features
WindFor special features
Handles all types of terrain and condition
Extensive operational experience from both on-shore and off-shore farms
Module for “downscaling” weather forecast to local condition is ideal for forecasting of farms in mountainous regions or similar complex conditions
Dedicated modules for events of special interest
Estimation of probability of ramping
Provides the probability of ramping for a given time period as a function of the weather forecasts
Estimation of probability of cut-out at high wind speed
Estimation of lost production during curtailment
For internal reporting and loss assessment
For claims towards system/market operators who ordered the curtailment
Ice detection and estimation of ice decay
15
SolarFor special features
Support for fixed, single, and dual axis tracking panels
Manage limitations imposed by inverter setup
Models temperature dependent panel efficiency
Calculation and tracking of maximal (clear sky) production
Improved short term forecasting using satellite images
Highly flexible and configurable with special modules to match specific needs
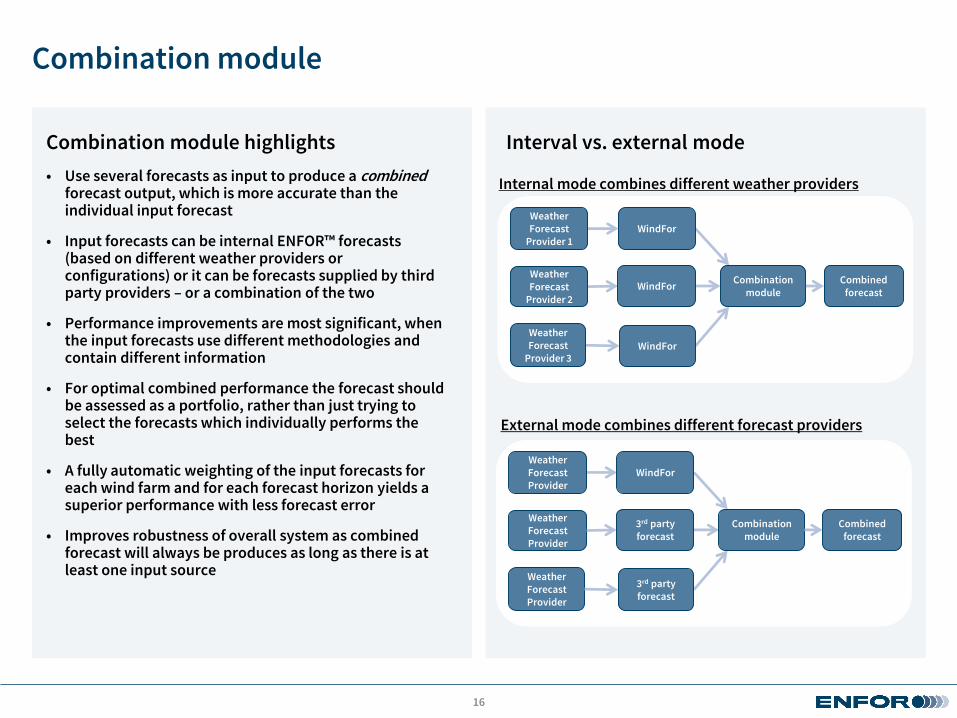
Combination module
Combination module highlights
• Use several forecasts as input to produce a combinedforecast output, which is more accurate than the individual input forecast
• Input forecasts can be internal ENFOR™ forecasts (based on different weather providers or configurations) or it can be forecasts supplied by third party providers – or a combination of the two
• Performance improvements are most significant, when the input forecasts use different methodologies and contain different information
• For optimal combined performance the forecast should be assessed as a portfolio, rather than just trying to select the forecasts which individually performs the best
• A fully automatic weighting of the input forecasts for each wind farm and for each forecast horizon yields a superior performance with less forecast error
• Improves robustness of overall system as combined forecast will always be produces as long as there is at least one input source
16
Interval vs. external mode
Weather Forecast
Provider 1
Weather Forecast
Provider 2
Weather Forecast
Provider 3
WindFor
WindFor
WindFor
Combination module
Combined forecast
Weather Forecast Provider
Weather Forecast Provider
Weather Forecast Provider
WindFor
3rd party forecast
3rd party forecast
Combination module
Combined forecast
Internal mode combines different weather providers
External mode combines different forecast providers
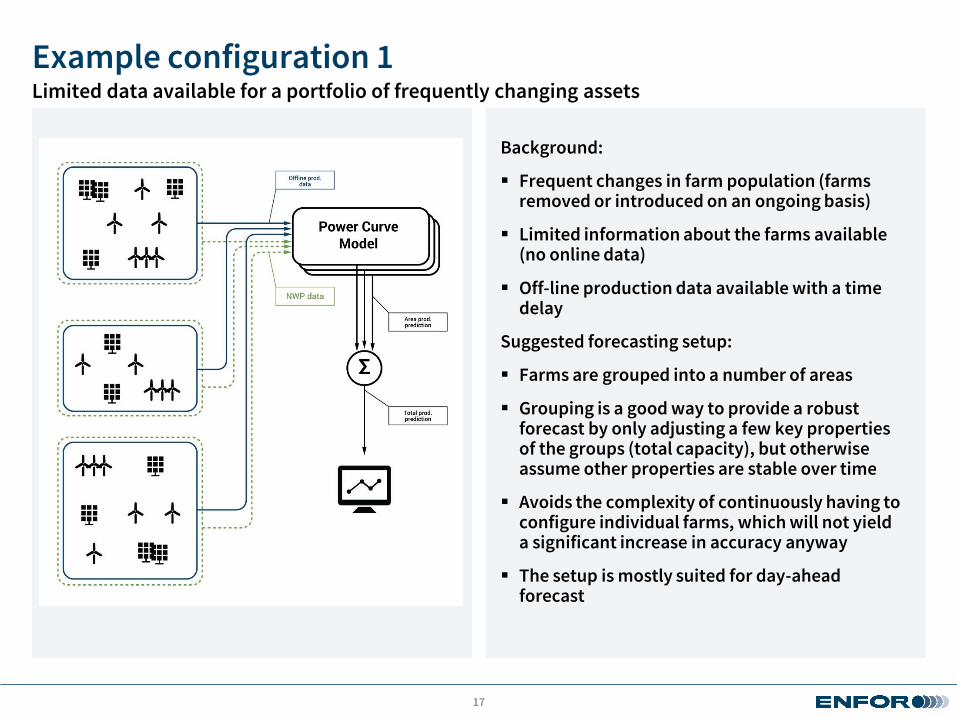
Example configuration 1
Background:
Frequent changes in farm population (farms removed or introduced on an ongoing basis)
Limited information about the farms available (no online data)
Off-line production data available with a time delay
Suggested forecasting setup:
Farms are grouped into a number of areas
Grouping is a good way to provide a robust forecast by only adjusting a few key properties of the groups (total capacity), but otherwise assume other properties are stable over time
Avoids the complexity of continuously having to configure individual farms, which will not yield a significant increase in accuracy anyway
The setup is mostly suited for day-ahead forecast
17
Limited data available for a portfolio of frequently changing assets
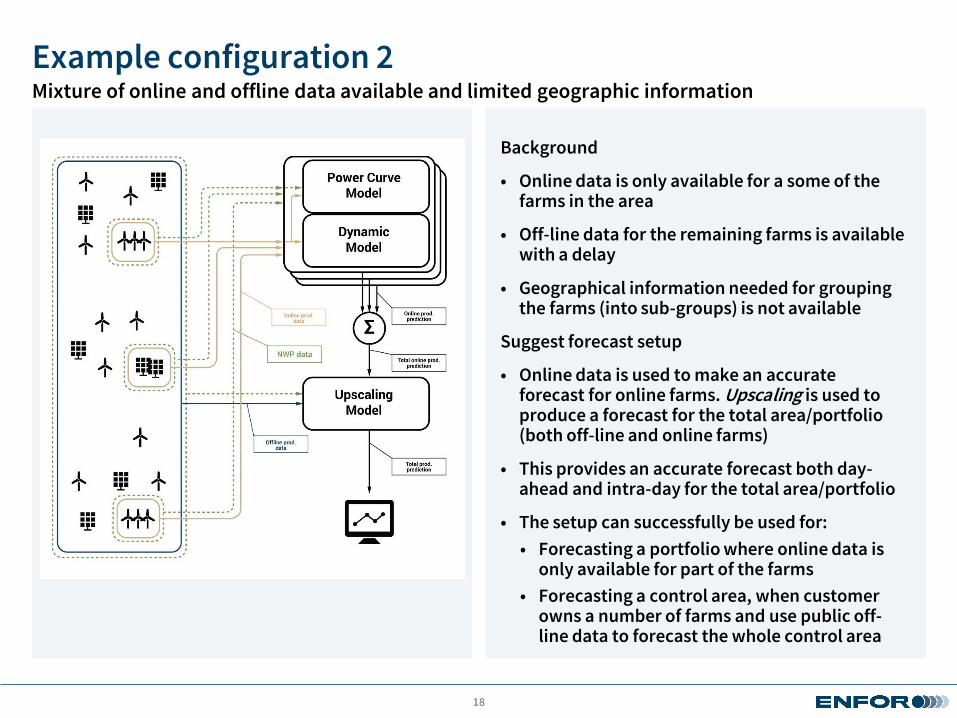
Example configuration 2
Background
• Online data is only available for a some of the farms in the area
• Off-line data for the remaining farms is available with a delay
• Geographical information needed for grouping the farms (into sub-groups) is not available
Suggest forecast setup
• Online data is used to make an accurate forecast for online farms. Upscaling is used to produce a forecast for the total area/portfolio (both off-line and online farms)
• This provides an accurate forecast both day-ahead and intra-day for the total area/portfolio
• The setup can successfully be used for:
• Forecasting a portfolio where online data is only available for part of the farms
• Forecasting a control area, when customer owns a number of farms and use public off-line data to forecast the whole control area
18
Mixture of online and offline data available and limited geographic information

Example configuration 3
Background
• Offline production data is available for farms in the portfolio
• Online data available for some farms in the portfolio
• Geographical information is available to group farms into sub-groups
Suggested forecasting setup
• Farms are divided into sub-groups
• Online data is used to forecast for each area in the portfolio and off-line data is then used to upscale the forecast for the whole sub-group
• Sub-groups are aggregated to total forecast
• Setup provides accurate forecasts for both intra-day and day-ahead
19
Mixture of offline and online farms with geographical information to create sub-groups

WindFor is integrated into the ANEMOS system
20
AEMO as example (slides from Dr. Hans-Peter (Igor) Waldl, Overspeed, Germany)
What is ANEMOS?
• Leading edge research and development, initiated by ARMINES: Anemos, anemos.plus,
SafeWind
… and spin-off from this research
• Prediction models and modules
• High-availability IT platform
• Prediction system
• Partnership (over 70 GW wind, over 45 GW solar worldwide)
• Commercial activities world-wide
• Allow integration of customer / 3rd party models, where ANEMOS handles NWP and
measurements.
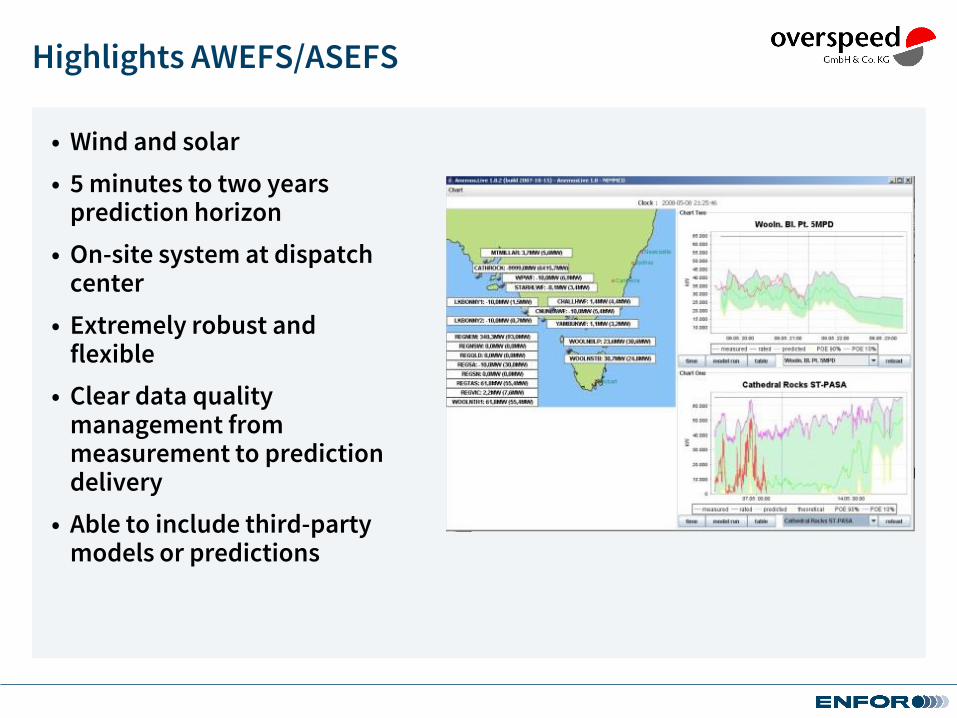
Highlights AWEFS/ASEFS
• Wind and solar
• 5 minutes to two years prediction horizon
• On-site system at dispatch center
• Extremely robust and flexible
• Clear data quality management from measurement to prediction delivery
• Able to include third-party models or predictions

Australian Wind Energy Forecasting System
• Fully integrated into market system
• Running locally at dispatch centers
• Fully automated market, 5-min bids
• „Market-system-proof“ No Single point of failure, intrusion analysis, …
• High-availability design
• 24/7 operation
• 100% availability (8 years)
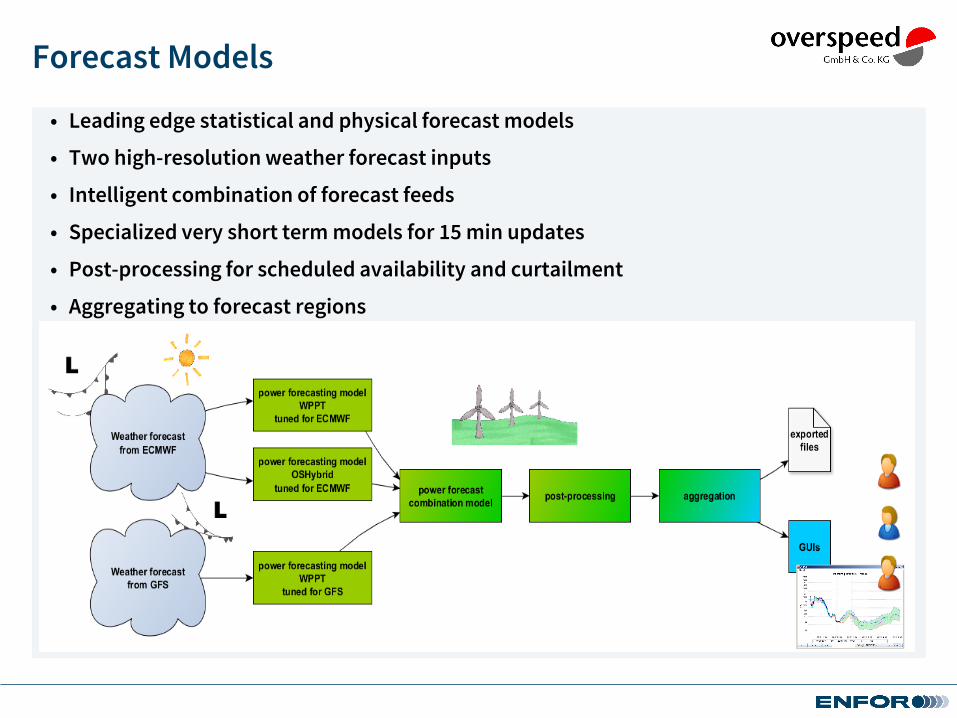
Forecast Models
• Leading edge statistical and physical forecast models
• Two high-resolution weather forecast inputs
• Intelligent combination of forecast feeds
• Specialized very short term models for 15 min updates
• Post-processing for scheduled availability and curtailment
• Aggregating to forecast regions

WindFor / SolarFor forecasting performance
Proven and tested technology with market leading accuracy
Software system with market leading accuracy for prediction of wind and solar power production
One of the most proven systems in the industry with an operational track record from 1998
Implemented under a wide range of condition all over the world
Highly flexible setup catering for a wide range of costumer requirements and needs
Robust, low maintenance system with a minimal requirement for customer interaction and interference
Available as a software package installed locally at the customer or as a service hosted by ENFOR
24
Competitive performance and price
Typical day-ahead Mean Average Error (MAE):
2-4% for countries or large portfolios
4-6% for regions or medium sized portfolios
8-12% for individual wind farms
Pricing and system setup is tailored to customers cost/performance preferences
* Mean Absolute Error (MAE) normalized with installed capacity of wind farms
What can be expected?
4

Wind power forecast performance
• Aggregation level (farms, area, region, country)
• Capacity factor
• Complexity of terrain, including on-/off-shore
• NWP quality
• In complex terrain and for short horizons advanced LAM may perform better than ECMWF…
25
What does it depend on?
Correlation of forecast errors
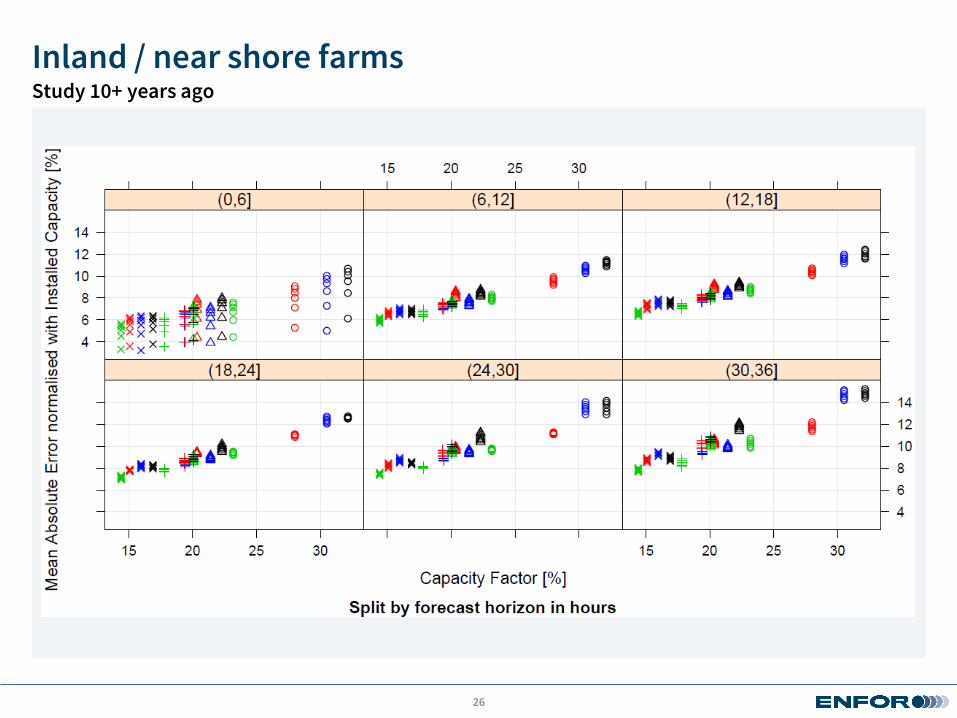
Inland / near shore farms
26
Study 10+ years ago
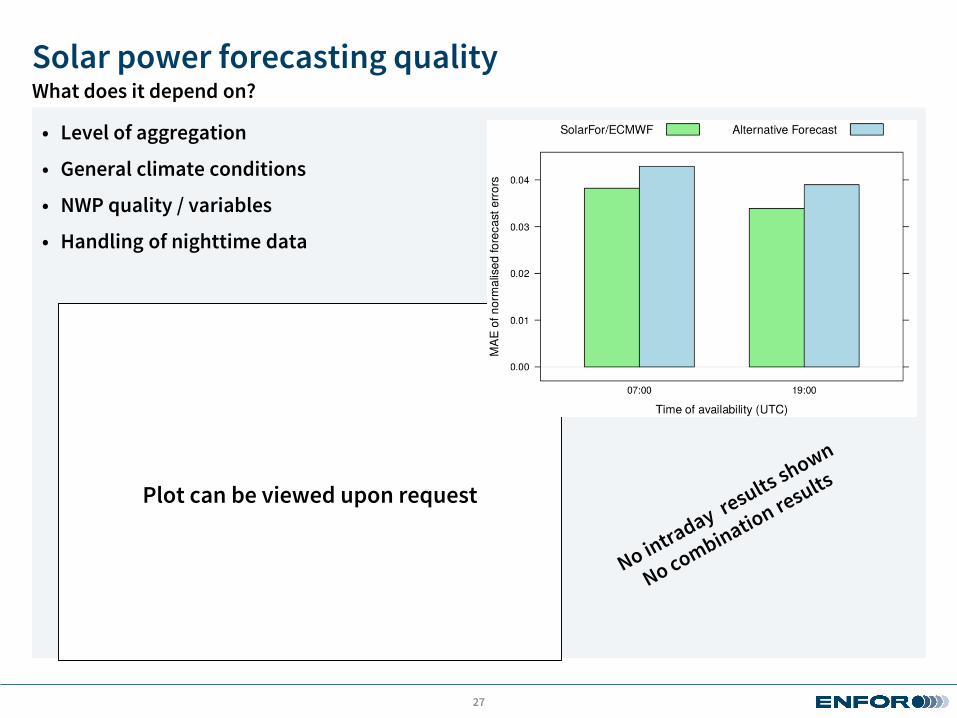
Plot can be viewed upon request
Solar power forecasting quality
27
What does it depend on?
• Level of aggregation
• General climate conditions
• NWP quality / variables
• Handling of nighttime data

SolarFor using ECMWF and GFS-HD
28
Illustration of benefit of combination for a single plant.

Recommendations
29
How to get good forecasts fast?
• For up to moderately complex terrain much is achieved using global NWP models, especially ECMWF
• Use measurements of actual power production to adapt to local conditions as done by WindFor
• A significant effort in tuning / setup of local area NWP models may result in further improvements – especially for the shorter horizons.
• Data quality … measurements of actual availability / curtailment and schedules of these improve forecast performance
• Alternatively, use special modules e.g. estimating curtailment
• A hosted solution is a quick way to start out
• Improve along the way by close cooperation with forecast providers
5

Thank you for your attention!
30
Questions are welcome!