the virginia tech– usda forest service housing commentary
TRANSCRIPT

Return TOC
The Virginia Tech – U.S. Forest Service October 2018
Housing Commentary: Section I
Delton Alderman
Forest Products Marketing Unit
Forest Products Laboratory
U.S. Forest Service
Madison, WI
304.431.2734
2018 Virginia Polytechnic Institute and State University VCE-CNRE42NP
Virginia Cooperative Extension programs and employment are open to all, regardless of age, color, disability, gender, gender identity, gender expression, national origin, political affiliation, race, religion, sexual orientation, genetic information, veteran status, or any other basis protected by law. An equal opportunity/affirmative action employer. Issued in furtherance of Cooperative Extension work,
Virginia Polytechnic Institute and State University, Virginia State University, and the U.S. Department of Agriculture cooperating. Edwin J. Jones, Director, Virginia Cooperative Extension, Virginia Tech, Blacksburg; M. Ray McKinnie, Administrator, 1890 Extension Program, Virginia State University, Petersburg.
Urs Buehlmann
Department of Sustainable Biomaterials
College of Natural Resources & Environment
Virginia Tech
Blacksburg, VA
540.231.9759
Return TOC
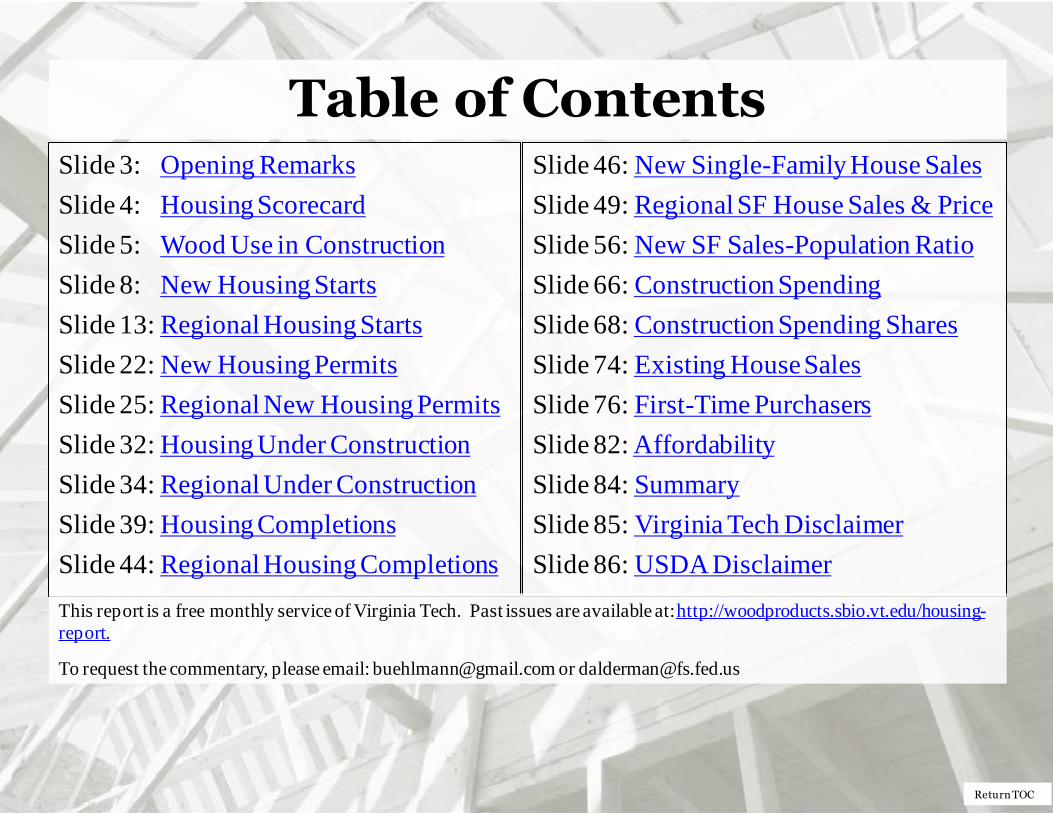
Table of Contents Slide 3: Opening Remarks
Slide 4: Housing Scorecard
Slide 5: Wood Use in Construction
Slide 8: New Housing Starts
Slide 13: Regional Housing Starts
Slide 22: New Housing Permits
Slide 25: Regional New Housing Permits
Slide 32: Housing Under Construction
Slide 34: Regional Under Construction
Slide 39: Housing Completions
Slide 44: Regional Housing Completions
Slide 46: New Single-Family House Sales
Slide 49: Regional SF House Sales & Price
Slide 56: New SF Sales-Population Ratio
Slide 66: Construction Spending
Slide 68: Construction Spending Shares
Slide 74: Existing House Sales
Slide 76: First-Time Purchasers
Slide 82: Affordability
Slide 84: Summary
Slide 85: Virginia Tech Disclaimer
Slide 86: USDA Disclaimer
This report is a free monthly service of Virginia Tech. Past issues are available at: http://woodproducts.sbio.vt.edu/housing-
report.
To request the commentary, please email: [email protected] or [email protected]
Return TOC
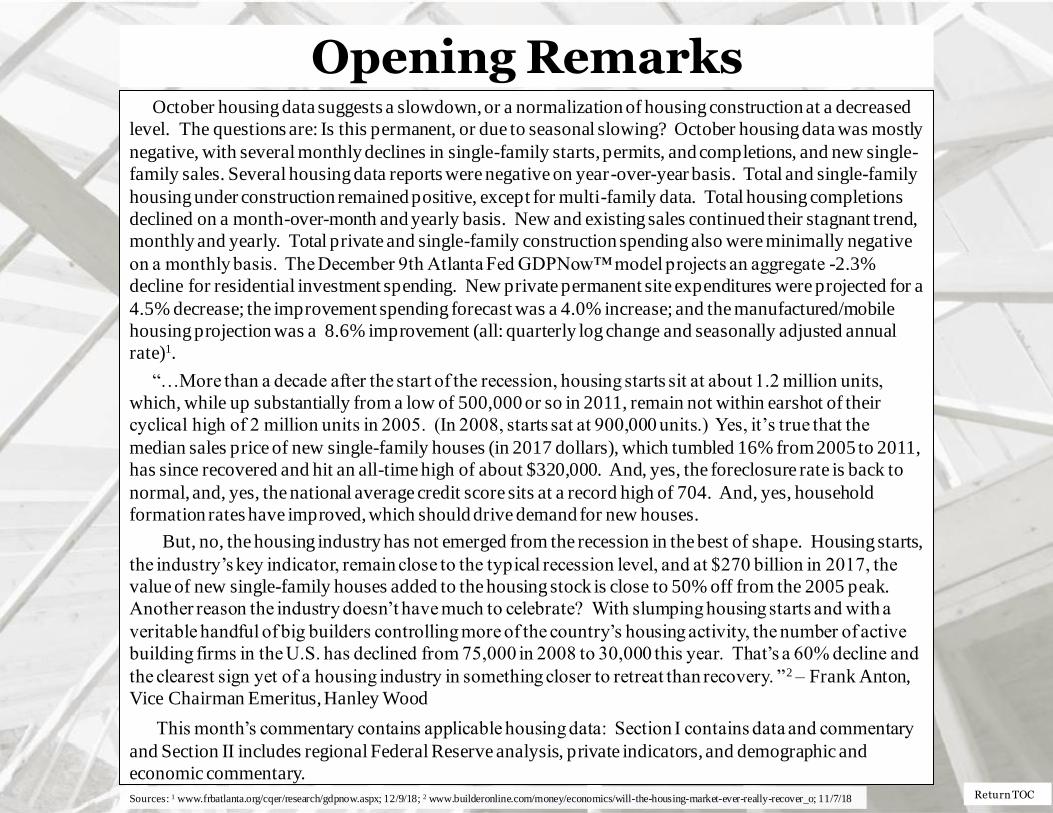
Opening Remarks October housing data suggests a slowdown, or a normalization of housing construction at a decreased
level. The questions are: Is this permanent, or due to seasonal slowing? October housing data was mostly
negative, with several monthly declines in single-family starts, permits, and completions, and new single-
family sales. Several housing data reports were negative on year-over-year basis. Total and single-family
housing under construction remained positive, except for multi-family data. Total housing completions
declined on a month-over-month and yearly basis. New and existing sales continued their stagnant trend,
monthly and yearly. Total private and single-family construction spending also were minimally negative
on a monthly basis. The December 9th Atlanta Fed GDPNow™ model projects an aggregate -2.3%
decline for residential investment spending. New private permanent site expenditures were projected for a
4.5% decrease; the improvement spending forecast was a 4.0% increase; and the manufactured/mobile
housing projection was a 8.6% improvement (all: quarterly log change and seasonally adjusted annual
rate)1.
“…More than a decade after the start of the recession, housing starts sit at about 1.2 million units,
which, while up substantially from a low of 500,000 or so in 2011, remain not within earshot of their
cyclical high of 2 million units in 2005. (In 2008, starts sat at 900,000 units.) Yes, it’s true that the
median sales price of new single-family houses (in 2017 dollars), which tumbled 16% from 2005 to 2011,
has since recovered and hit an all-time high of about $320,000. And, yes, the foreclosure rate is back to
normal, and, yes, the national average credit score sits at a record high of 704. And, yes, household
formation rates have improved, which should drive demand for new houses.
But, no, the housing industry has not emerged from the recession in the best of shape. Housing starts,
the industry’s key indicator, remain close to the typical recession level, and at $270 billion in 2017, the
value of new single-family houses added to the housing stock is close to 50% off from the 2005 peak.
Another reason the industry doesn’t have much to celebrate? With slumping housing starts and with a
veritable handful of big builders controlling more of the country’s housing activity, the number of active
building firms in the U.S. has declined from 75,000 in 2008 to 30,000 this year. That’s a 60% decline and
the clearest sign yet of a housing industry in something closer to retreat than recovery. ”2 – Frank Anton,
Vice Chairman Emeritus, Hanley Wood
This month’s commentary contains applicable housing data: Section I contains data and commentary
and Section II includes regional Federal Reserve analysis, private indicators, and demographic and
economic commentary.
Sources: 1 www.frbatlanta.org/cqer/research/gdpnow.aspx; 12/9/18; 2 www.builderonline.com/money/economics/will-the-housing-market-ever-really-recover_o; 11/7/18

Return TOC Sources: U.S. Department of Commerce-Construction; 1 FRED: Federal Reserve Bank of St. Louis
M/M = month-over-month; Y/Y = year-over-year; NC = no change
October 2018 Housing Scorecard
∆
∆
∆
∆
∆
∆
M/M Y/Y
Housing Starts ∆ 1.5% 2.9%
Single-family Starts 1.8% 2.6%
Housing Permits 0.6% 6.0%
Single-family Permits 0.6% 0.6%
Housing Under Construction ∆ 0.5% ∆ 3.6%
Single-family Under Construction ∆ 1.0% ∆ 8.4%
Housing Completions 3.3% 6.5%
Single-family Completions 1.2% ∆ 4.3%
New Single-family House Sales 8.9% 12.0%
Private Residential
Construction Spending 0.5% ∆ 1.8%
Single-family Construction Spending 0.5% ∆ 2.4%
Existing House Sales
1 ∆ 1.4% 5.1%
∆
∆
∆
∆
∆
∆ ∆
∆
∆
∆
∆
∆
∆
∆
∆

Return TOC
New Construction’s Percentage of Wood Products Consumption
Source: U.S. Forest Service. Howard, J. and D. McKeever. 2017. U.S. Forest Products Annual Market Review and Prospects, 2013 -2017
56%
69%
36%
All Sawnwood Structural panels Non-structural panels

Return TOC
New SF Construction Percentage of Wood Products Consumption
Source: U.S. Forest Service. Howard, J. and D. McKeever. 2017. U.S. Forest Products Annual Market Review and Prospects, 2013 -2017
14%
86%
Non-structural panels:
New Housing
Other markets
25%
75%
All Sawnwood: New housing
Other markets
40% 60%
Structural panels:
New housing
Other markets
Return TOC
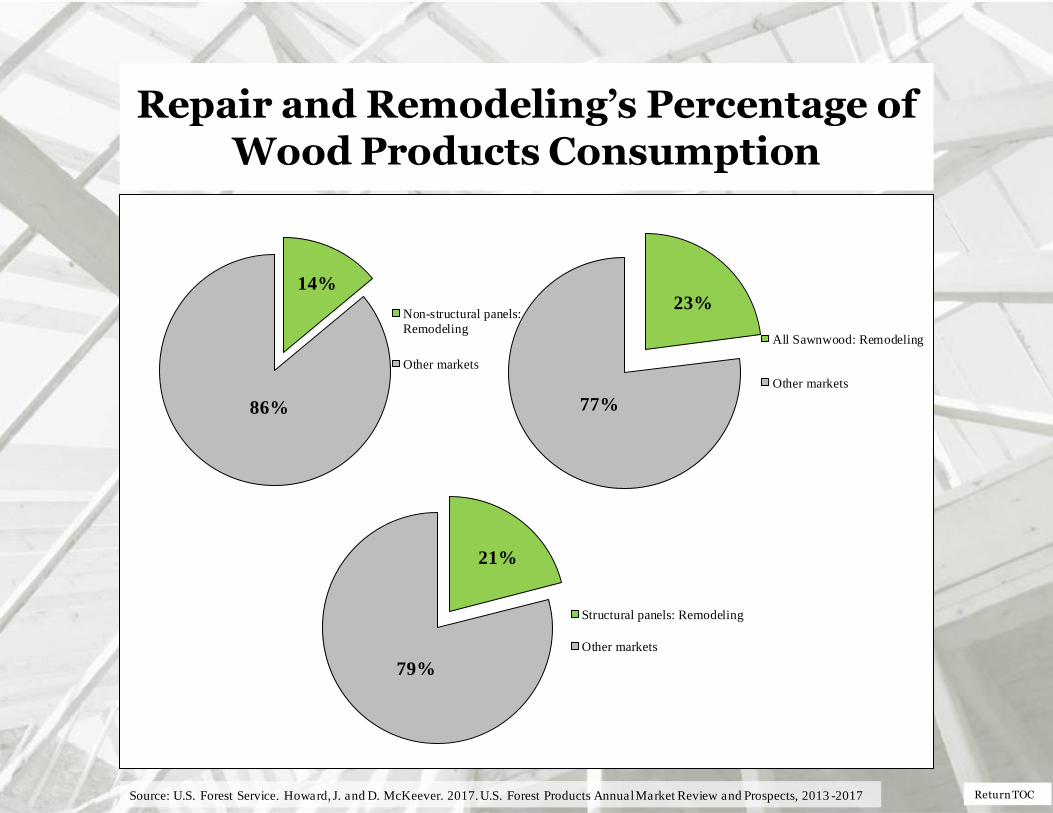
Repair and Remodeling’s Percentage of Wood Products Consumption
Source: U.S. Forest Service. Howard, J. and D. McKeever. 2017. U.S. Forest Products Annual Market Review and Prospects, 2013 -2017
14%
86%
Non-structural panels:
Remodeling
Other markets
23%
77%
All Sawnwood: Remodeling
Other markets
21%
79%
Structural panels: Remodeling
Other markets

Return TOC
New Housing Starts
* All start data are presented at a seasonally adjusted annual rate (SAAR).
** US DOC does not report 2 to 4 multifamily starts directly, this is an estimation
((Total starts – (SF + 5 unit MF)).
Source: http://www.census.gov/construction/nrc/pdf/newresconst.pdf; 11/20/18
Total Starts* SF Starts MF 2-4 Starts** MF ≥5 Starts
October 1,228,000 865,000 20,000 343,000
September 1,210,000 881,000 6,000 323,000
2017 1,265,000 888,000 18,000 359,000
M/M change 1.5 -1.8 233.3 6.2
Y/Y change -2.9 -2.6 11.1 -4.5

Return TOC
Total Housing Starts
* Percentage of total starts.
US DOC does not report 2 to 4 multifamily starts directly, this is an estimation: ((Total starts – (SF + Total MF)).
0
200
400
600
800
1,000
1,200
1,400
1,600
1,800
2,000
SF Starts 2-4 MF Starts ≥5 MF Starts
Total starts 58-year average: 1,439 m units
SF starts 58-year average: 1,022 m units
MF starts 53-year average: 420 m units
SAAR = Seasonally adjusted annual rate; in thousands
Total SF 865,000 70.4%
Total 2-4 MF 20,000 1.6%
Total ≥ 5 MF 343,000 27.9%
Total Starts
1,228,000
Source: http://www.census.gov/construction/nrc/pdf/newresconst.pdf; 11/20/18

Return TOC
New SF Starts
Sources: http://www.census.gov/construction/nrc/pdf/newresconst.pdff and The Federal Reserve Bank of St. Louis; 11/20/18
New SF starts adjusted for the US population
From October 1959 to October 2007, the long-term ratio of new SF starts to the total US non-institutionalized
population was 0.0066; in October 2018 it was 0.0033 – a slight decrease from September. The long-term ratio of
non-institutionalized population, aged 20 to 54 is 0.0103; in October 2018 was 0.0059 – no change from
September. From a population worldview, new SF construction is less than what is necessary for changes in
population (i.e., under-building).
0.0000
0.0020
0.0040
0.0060
0.0080
0.0100
0.0120
0.0140
0.0160
0.0180
0.0200
Ratio: SF Housing Starts/Civilian Noninstitutional Population
Ratio: SF Housing Starts/Civilian Noninstitutional Population (20-54)
Total non-institutionalized/Start ratio: 1/1/59 to 7/1/07: 0.0066 Total: 10/18 ratio: 0.0033
20 to 54 population/SF starts: 1/1/59 to 7/1/07 ratio: 0.0103
20 to 54 year old classification: 10/18 ratio: 0.0059

Return TOC
Total Housing Starts: Six-Month Average
1,228
1,235
1,000
1,050
1,100
1,150
1,200
1,250
1,300
1,350
1,400
Total Starts: (monthly) Total Starts: 6-month Ave.
Total Starts
SAAR; in thousands
Source: http://www.census.gov/construction/nrc/pdf/newresconst.pdf; 11/20/18

Return TOC
SF Housing Starts: Six-Month Average
865
881
700
750
800
850
900
950
1,000
SF Starts: (monthly) SF Starts: 6-month Ave.
SAAR; in thousands
SF Starts
Source: http://www.census.gov/construction/nrc/pdf/newresconst.pdf; 11/20/18

Return TOC
New Housing Starts by Region
NE = Northeast, MW = Midwest, S = South, W = West
US DOC does not report 2 to 4 multi-family completions directly, this is an estimation (Total completions – SF completions).
* Percentage of total starts.
0
200
400
600
800
1,000
1,200
Total NE Starts Total MW Starts Total S Starts Total W Starts
SAAR; in thousands
Total NE 87,000 7.1%
Total MW 210,000 17.1%
Total S 596,000 48.5%
Total W 335,000 27.3%
Total Regional Starts
Source: http://www.census.gov/construction/nrc/pdf/newresconst.pdf; 11/20/18

Return TOC
New Housing Starts by Region
All data are SAAR; NE = Northeast and MW = Midwest.
** US DOC does not report multifamily starts directly, this is an estimation (Total starts – SF starts).
NE Total NE SF NE MF**
October 87,000 70,000 17,000
September 132,000 61,000 71,000
2017 145,000 64,000 81,000
M/M change -34.1 14.8 -76.1
Y/Y change -40.0 9.4 -79.0
MW Total MW SF MW MF
October 210,000 127,000 83,000
September 158,000 129,000 29,000
2017 200,000 144,000 56,000
M/M change 32.9 -1.6 186.2
Y/Y change 5.0 -11.8 48.2
Source: http://www.census.gov/construction/nrc/pdf/newresconst.pdf; 11/20/18
Return TOC
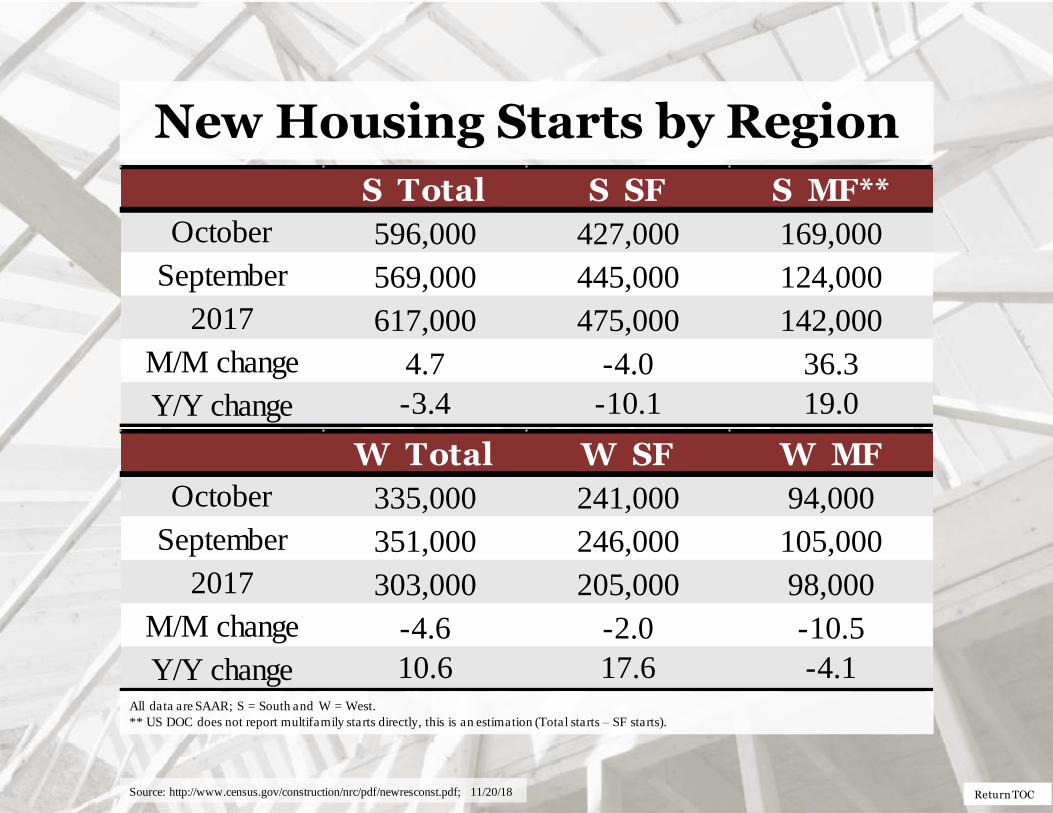
New Housing Starts by Region
All data are SAAR; S = South and W = West.
** US DOC does not report multifamily starts directly, this is an estimation (Total starts – SF starts).
S Total S SF S MF**
October 596,000 427,000 169,000
September 569,000 445,000 124,000
2017 617,000 475,000 142,000
M/M change 4.7 -4.0 36.3
Y/Y change -3.4 -10.1 19.0
W Total W SF W MF
October 335,000 241,000 94,000
September 351,000 246,000 105,000
2017 303,000 205,000 98,000
M/M change -4.6 -2.0 -10.5
Y/Y change 10.6 17.6 -4.1
Source: http://www.census.gov/construction/nrc/pdf/newresconst.pdf; 11/20/18
Return TOC
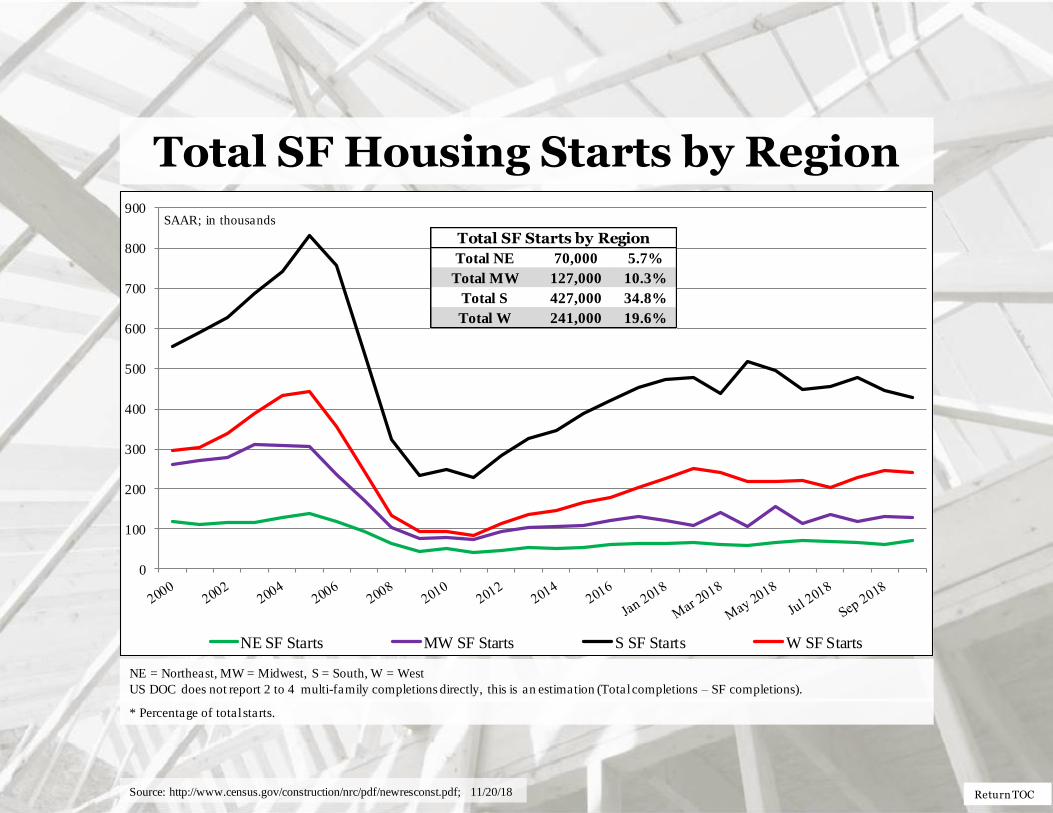
Total SF Housing Starts by Region
* Percentage of total starts.
NE = Northeast, MW = Midwest, S = South, W = West
US DOC does not report 2 to 4 multi-family completions directly, this is an estimation (Total completions – SF completions).
0
100
200
300
400
500
600
700
800
900
NE SF Starts MW SF Starts S SF Starts W SF Starts
SAAR; in thousands
Total NE 70,000 5.7%
Total MW 127,000 10.3%
Total S 427,000 34.8%
Total W 241,000 19.6%
Total SF Starts by Region
Source: http://www.census.gov/construction/nrc/pdf/newresconst.pdf; 11/20/18
Return TOC
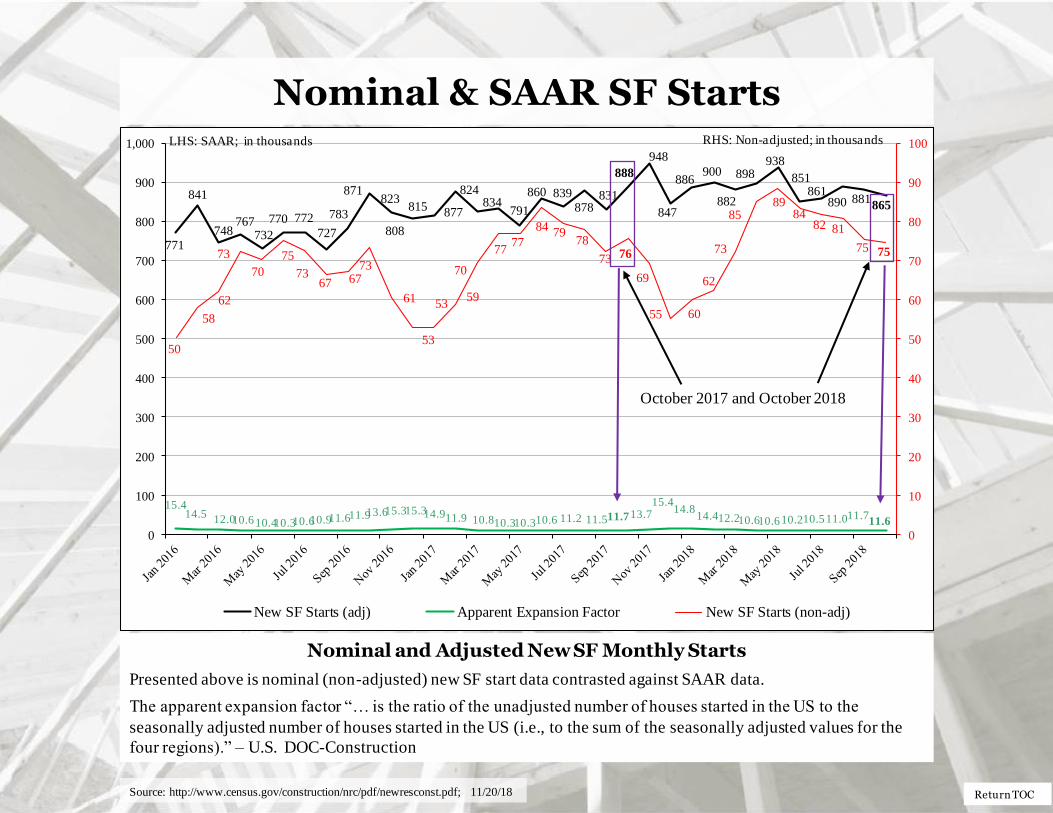
Nominal & SAAR SF Starts
Nominal and Adjusted New SF Monthly Starts
Presented above is nominal (non-adjusted) new SF start data contrasted against SAAR data.
The apparent expansion factor “… is the ratio of the unadjusted number of houses started in the US to the
seasonally adjusted number of houses started in the US (i.e., to the sum of the seasonally adjusted values for the
four regions).” – U.S. DOC-Construction
771
841
748767
732
770 772
727
783
871823
808
815877
824834
791
860 839878
831
888
948
847
886900
882
898938
851861
890 881865
15.414.5
12.010.610.410.310.610.911.611.913.615.315.314.911.9 10.810.310.310.6 11.2 11.511.713.715.4
14.814.412.210.610.610.210.511.011.7
11.6
50
58
62
73
70
75
7367 67
73
61
53
5359
70
7777
84 7978
73 76
69
55 60
62
73
8589
8482 81
75 75
0
10
20
30
40
50
60
70
80
90
100
0
100
200
300
400
500
600
700
800
900
1,000
New SF Starts (adj) Apparent Expansion Factor New SF Starts (non-adj)
October 2017 and October 2018
RHS: Non-adjusted; in thousands LHS: SAAR; in thousands
Source: http://www.census.gov/construction/nrc/pdf/newresconst.pdf; 11/20/18
Return TOC
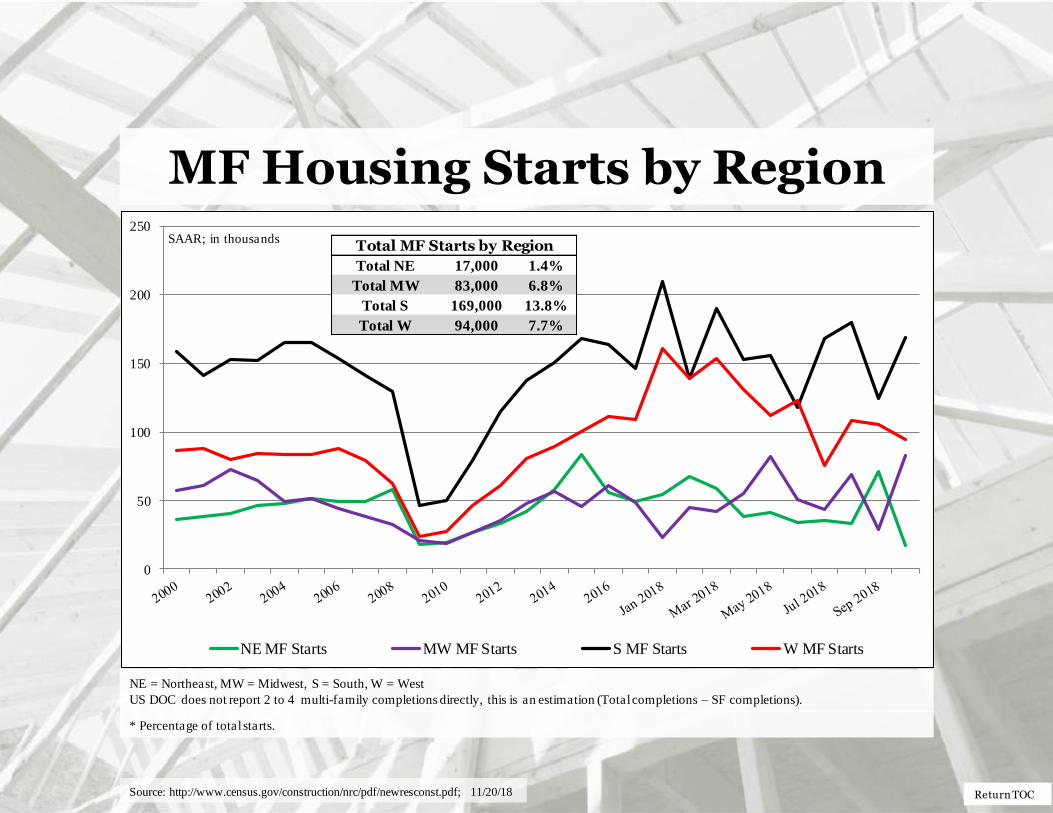
MF Housing Starts by Region
* Percentage of total starts.
NE = Northeast, MW = Midwest, S = South, W = West
US DOC does not report 2 to 4 multi-family completions directly, this is an estimation (Total completions – SF completions).
0
50
100
150
200
250
NE MF Starts MW MF Starts S MF Starts W MF Starts
SAAR; in thousands
Total NE 17,000 1.4%
Total MW 83,000 6.8%
Total S 169,000 13.8%
Total W 94,000 7.7%
Total MF Starts by Region
Source: http://www.census.gov/construction/nrc/pdf/newresconst.pdf; 11/20/18

Return TOC
SF & MF Housing Starts (%)
78.5%
70.4%
21.5% 27.9%
0.0%
10.0%
20.0%
30.0%
40.0%
50.0%
60.0%
70.0%
80.0%
90.0%
100.0%
Single-Family Starts: % Multi-Family Starts: %
Source: http://www.census.gov/construction/nrc/pdf/newresconst.pdf; 11/20/18

Return TOC
Railroad Lumber & Wood Shipments vs.
U.S. SF Housing Starts
Sources: Association of American Railroads (AAR), Rail Time Indicators report 11/8/18; U.S. DOC-Construction; 11/20/18
0
200
400
600
800
1,000
1,200
1,400
0
1,000
2,000
3,000
4,000
5,000
6,000
7,000
8,000
9,000
10,000
Lumber & Wood Shipments (U.S. + Canada) SF Starts
LHS: Lumber shipments – carloads (weekly average/month) RHS: SF Starts-in thousands
“Data are average weekly originations for each month, are not seasonally adjusted, and do not include intermodal.” – AAR

Return TOC
Railroad Lumber & Wood Shipments vs. U.S. SF Housing Starts: 6-month Offset
In this graph, January 2007 lumber shipments are contrasted with October 2007 SF starts, and continuing through
October 2018 SF starts. The purpose is to discover if lumber shipments relate to future single -family starts. Also,
it is realized that lumber and wood products are trucked; however, to our knowledge comprehensive trucking data
is not available.
0
200
400
600
800
1,000
1,200
1,400
0
1,000
2,000
3,000
4,000
5,000
6,000
7,000
8,000
9,000
10,000
Lumber & Wood Shipments (U.S. + Canada) SF Starts (6-mo. offset)
RHS: SF Starts-in thousands
LHS: Lumber shipments – carloads (weekly average/month)
“Data are average weekly originations for each month, are not seasonally adjusted, and do not include intermodal.” – AAR
Sources: Association of American Railroads (AAR), Rail Time Indicators report 11/8/18; U.S. DOC-Construction; 11/20/18

Return TOC
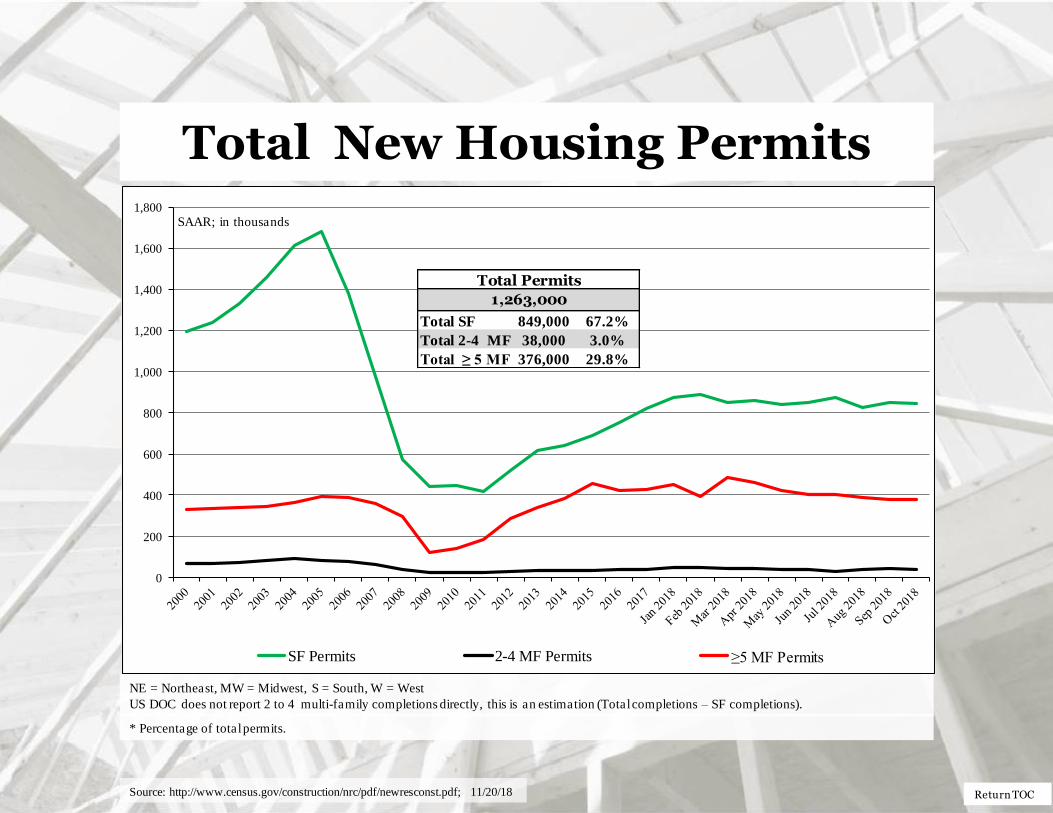
New Housing Permits
* All permit data are presented at a seasonally adjusted annual rate (SAAR).
Total
Permits*
SF
Permits
MF 2-4 unit
Permits
MF ≥ 5 unit
Permits
October 1,263,000 849,000 38,000 376,000
September 1,270,000 854,000 40,000 376,000
2017 1,343,000 854,000 35,000 454,000
M/M change -0.6 -0.6 -5.0 0.0
Y/Y change -6.0 -0.6 8.6 -17.2
Source: http://www.census.gov/construction/nrc/pdf/newresconst.pdf; 11/20/18
Return TOC
Total New Housing Permits
* Percentage of total permits.
NE = Northeast, MW = Midwest, S = South, W = West
US DOC does not report 2 to 4 multi-family completions directly, this is an estimation (Total completions – SF completions).
0
200
400
600
800
1,000
1,200
1,400
1,600
1,800
SF Permits 2-4 MF Permits ≥5 MF Permits
SAAR; in thousands
Total SF 849,000 67.2%
Total 2-4 MF 38,000 3.0%
Total ≥ 5 MF 376,000 29.8%
Total Permits
1,263,000
Source: http://www.census.gov/construction/nrc/pdf/newresconst.pdf; 11/20/18
Return TOC
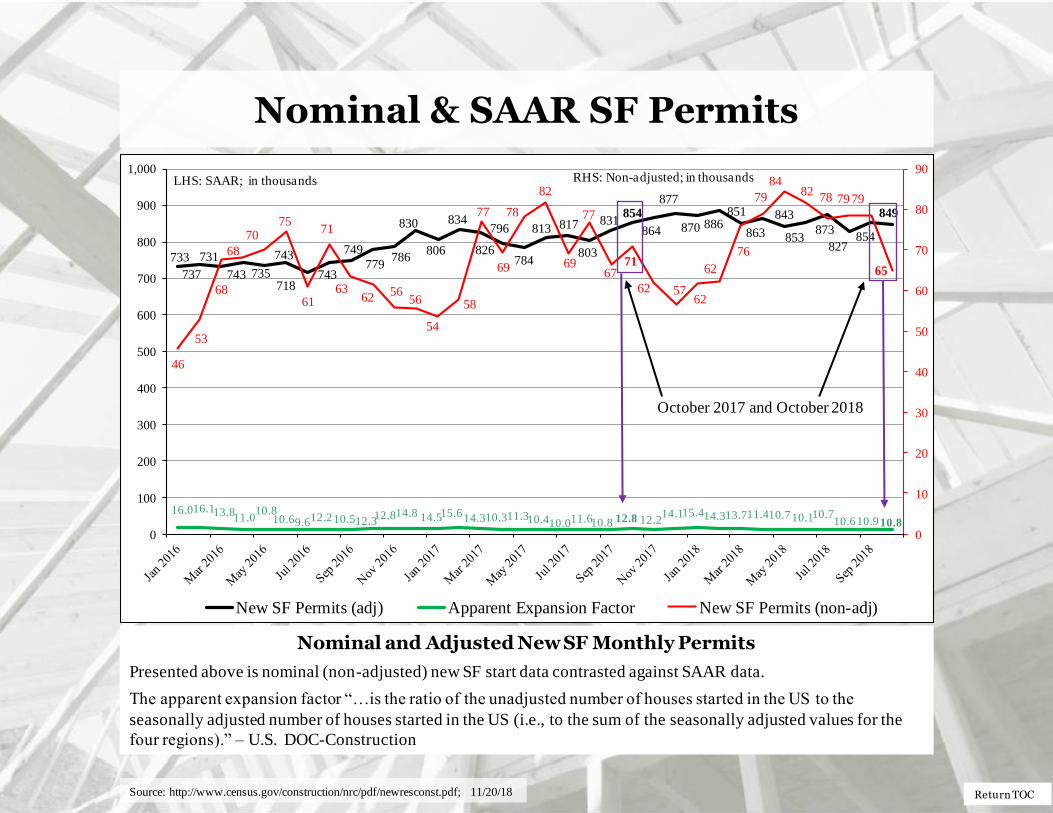
Nominal & SAAR SF Permits
Nominal and Adjusted New SF Monthly Permits
Presented above is nominal (non-adjusted) new SF start data contrasted against SAAR data.
The apparent expansion factor “…is the ratio of the unadjusted number of houses started in the US to the
seasonally adjusted number of houses started in the US (i.e., to the sum of the seasonally adjusted values for the
four regions).” – U.S. DOC-Construction
733
737
731
743 735
743
718743
749
779786
830
806
834
826
796
784
813 817
803
831854
864
877
870 886851
863
843
853873
827854
849
16.016.113.811.0
10.810.69.612.210.512.3
12.814.8 14.515.614.310.311.310.410.011.610.8 12.8 12.214.115.414.313.711.410.710.110.7
10.610.9 10.8
46
53
68
68
7075
61
71
6362
5656
54
58
77
69
78
82
69
77
6771
62 5762
62
76
79
8482
78 79 79
65
0
10
20
30
40
50
60
70
80
90
0
100
200
300
400
500
600
700
800
900
1,000
New SF Permits (adj) Apparent Expansion Factor New SF Permits (non-adj)
October 2017 and October 2018
LHS: SAAR; in thousands RHS: Non-adjusted; in thousands
Source: http://www.census.gov/construction/nrc/pdf/newresconst.pdf; 11/20/18
Return TOC
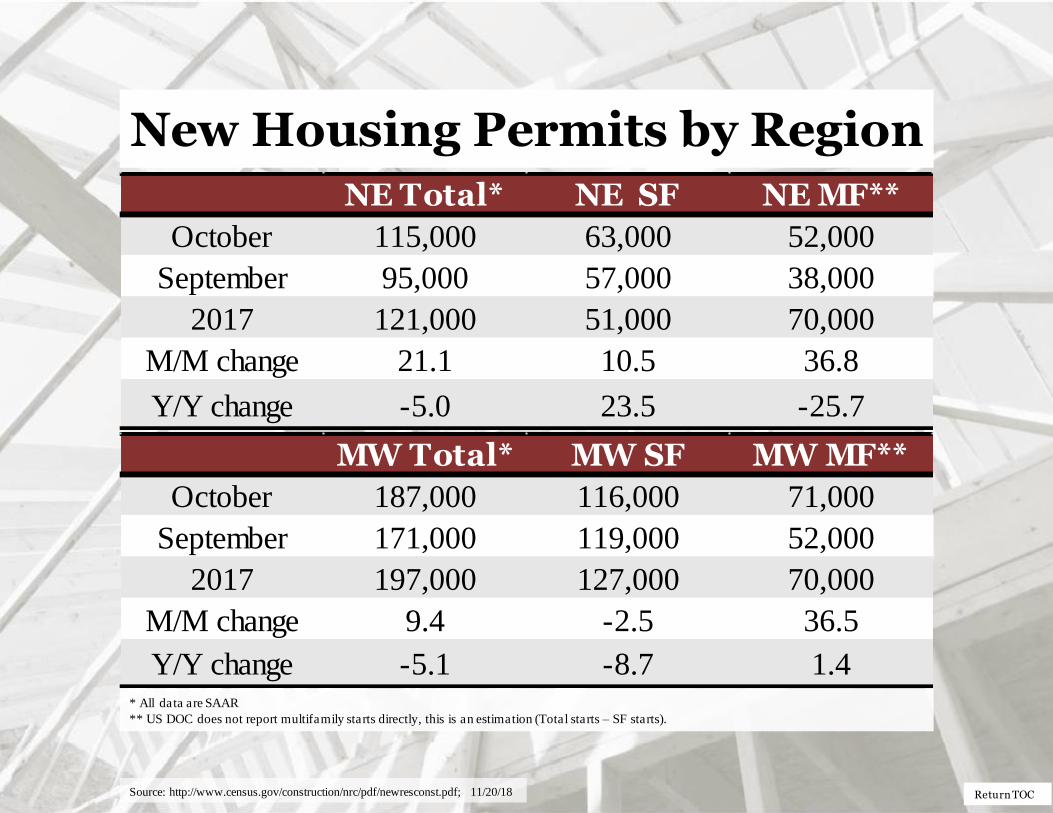
New Housing Permits by Region
* All data are SAAR
** US DOC does not report multifamily starts directly, this is an estimation (Total starts – SF starts).
NE Total* NE SF NE MF**
October 115,000 63,000 52,000
September 95,000 57,000 38,000
2017 121,000 51,000 70,000
M/M change 21.1 10.5 36.8
Y/Y change -5.0 23.5 -25.7
MW Total* MW SF MW MF**
October 187,000 116,000 71,000
September 171,000 119,000 52,000
2017 197,000 127,000 70,000
M/M change 9.4 -2.5 36.5
Y/Y change -5.1 -8.7 1.4
Source: http://www.census.gov/construction/nrc/pdf/newresconst.pdf; 11/20/18

Return TOC
New Housing Permits by Region
All data are SAAR
** US DOC does not report multifamily starts directly, this is an estimation (Total starts – SF starts).
S Total* S SF S MF**
October 648,000 463,000 185,000
September 664,000 459,000 205,000
2017 647,000 461,000 186,000
M/M change -2.4 0.9 -9.8
Y/Y change 0.2 0.4 -0.5
W Total* W SF W MF**
October 313,000 207,000 106,000
September 340,000 219,000 121,000
2017 378,000 215,000 163,000
M/M change -7.9 -5.5 -12.4
Y/Y change -17.2 -3.7 -35.0
Source: http://www.census.gov/construction/nrc/pdf/newresconst.pdf; 11/20/18

Return TOC
Total Housing Permits by Region
* Percentage of total permits.
0
200
400
600
800
1,000
1,200
NE Permits MW Permits S Permits W Permits
SAAR; in thousands
NE = Northeast, MW = Midwest, S = South, W = West
US DOC does not report 2 to 4 multi-family completions directly, this is an estimation (Total completions – SF completions).
Total NE 115,000 9.1%
Total MW 187,000 14.8%
Total S 648,000 51.3%
Total W 313,000 24.8%
Total Regional Permits
Source: http://www.census.gov/construction/nrc/pdf/newresconst.pdf; 11/20/18
Return TOC
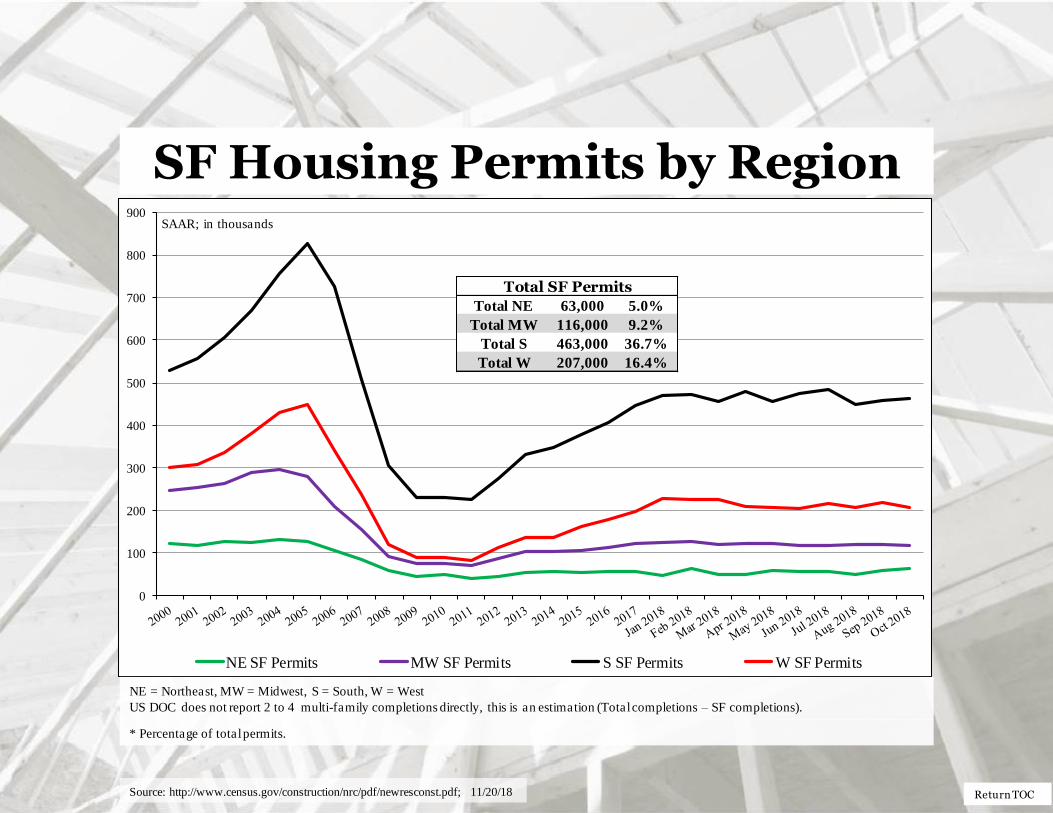
SF Housing Permits by Region
* Percentage of total permits.
0
100
200
300
400
500
600
700
800
900
NE SF Permits MW SF Permits S SF Permits W SF Permits
SAAR; in thousands
NE = Northeast, MW = Midwest, S = South, W = West
US DOC does not report 2 to 4 multi-family completions directly, this is an estimation (Total completions – SF completions).
Total NE 63,000 5.0%
Total MW 116,000 9.2%
Total S 463,000 36.7%
Total W 207,000 16.4%
Total SF Permits
Source: http://www.census.gov/construction/nrc/pdf/newresconst.pdf; 11/20/18
Return TOC
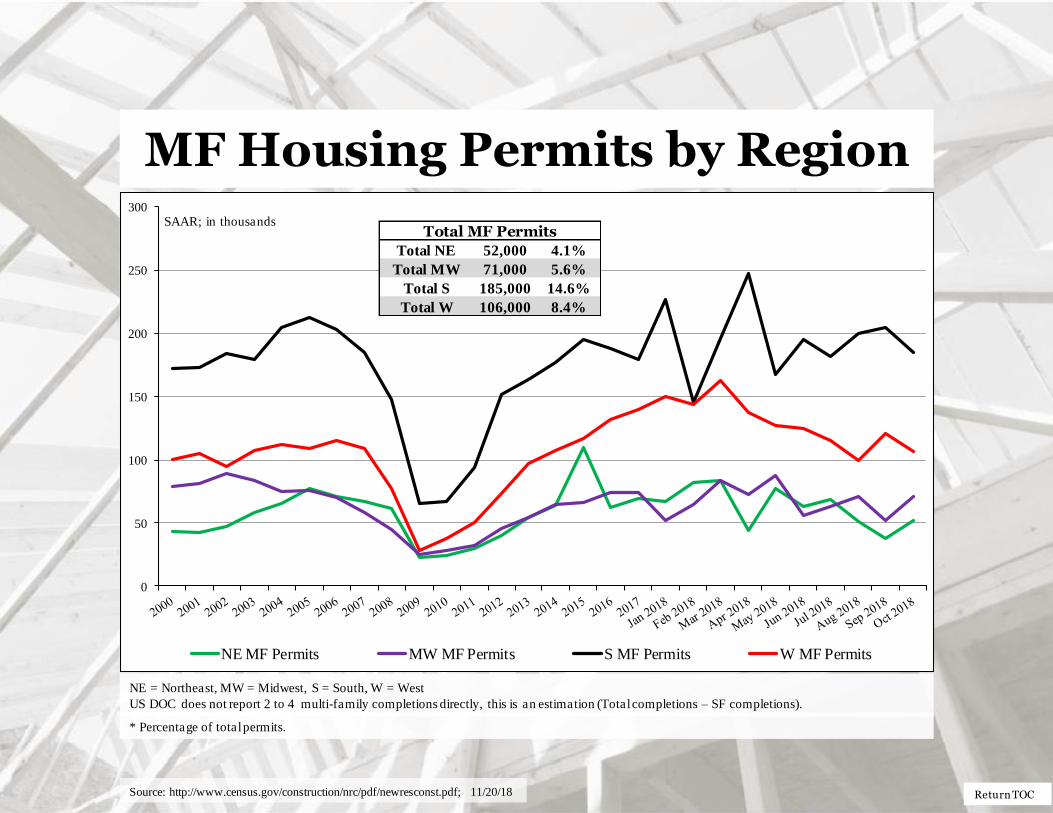
MF Housing Permits by Region
* Percentage of total permits.
0
50
100
150
200
250
300
NE MF Permits MW MF Permits S MF Permits W MF Permits
SAAR; in thousands
NE = Northeast, MW = Midwest, S = South, W = West
US DOC does not report 2 to 4 multi-family completions directly, this is an estimation (Total completions – SF completions).
Total NE 52,000 4.1%
Total MW 71,000 5.6%
Total S 185,000 14.6%
Total W 106,000 8.4%
Total MF Permits
Source: http://www.census.gov/construction/nrc/pdf/newresconst.pdf; 11/20/18

Return TOC
Railroad Lumber & Wood Shipments vs. U.S. SF Housing Permits
0
200
400
600
800
1,000
1,200
0
1,000
2,000
3,000
4,000
5,000
6,000
7,000
8,000
9,000
10,000
Lumber & Wood Shipments (U.S. + Canada) SF Permits
RHS: SF permits-in thousands
LHS: Lumber shipments – carloads (weekly average/month)
“Data are average weekly originations for each month, are not seasonally adjusted, and do not include intermodal.” – AAR
Sources: Association of American Railroads (AAR), Rail Time Indicators report 11/8/18; U.S. DOC-Construction; 11/20/18
Return TOC
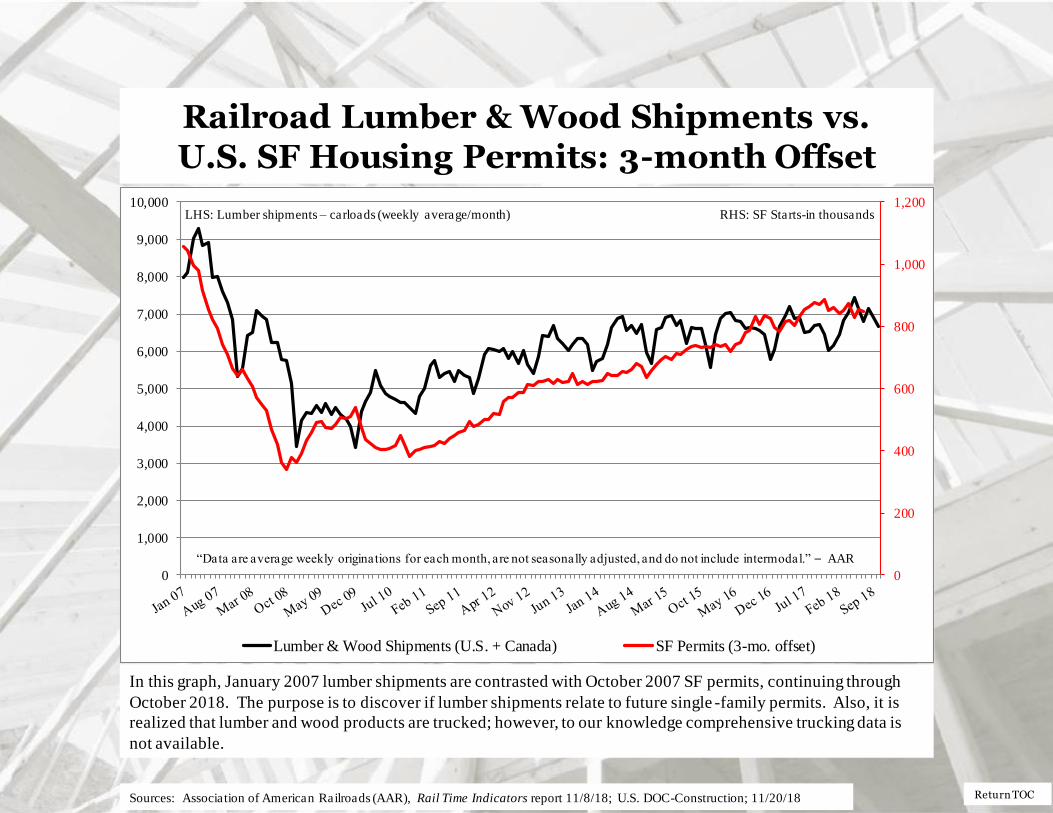
Railroad Lumber & Wood Shipments vs. U.S. SF Housing Permits: 3-month Offset
In this graph, January 2007 lumber shipments are contrasted with October 2007 SF permits, continuing through
October 2018. The purpose is to discover if lumber shipments relate to future single -family permits. Also, it is
realized that lumber and wood products are trucked; however, to our knowledge comprehensive trucking data is
not available.
0
200
400
600
800
1,000
1,200
0
1,000
2,000
3,000
4,000
5,000
6,000
7,000
8,000
9,000
10,000
Lumber & Wood Shipments (U.S. + Canada) SF Permits (3-mo. offset)
“Data are average weekly originations for each month, are not seasonally adjusted, and do not include intermodal.” – AAR
LHS: Lumber shipments – carloads (weekly average/month) RHS: SF Starts-in thousands
Sources: Association of American Railroads (AAR), Rail Time Indicators report 11/8/18; U.S. DOC-Construction; 11/20/18

Return TOC
New Housing Under Construction (HUC)
All housing under construction data are presented at a seasonally adjusted annual rate (SAAR).
** US DOC does not report 2-4 multifamily units under construction directly, this is an estimation
((Total under construction – (SF + 5 unit MF)).
Total Under
Construction*
SF Under
Construction
MF 2-4 unit**
Under
Construction
MF ≥ 5 unit Under
Construction
October 1,137,000 527,000 13,000 597,000
September 1,131,000 522,000 12,000 597,000
2017 1,097,000 486,000 12,000 599,000
M/M change 0.5 1.0 8.3 0.0
Y/Y change 3.6 8.4 8.3 -0.3
Source: http://www.census.gov/construction/nrc/pdf/newresconst.pdf; 11/20/18
Return TOC
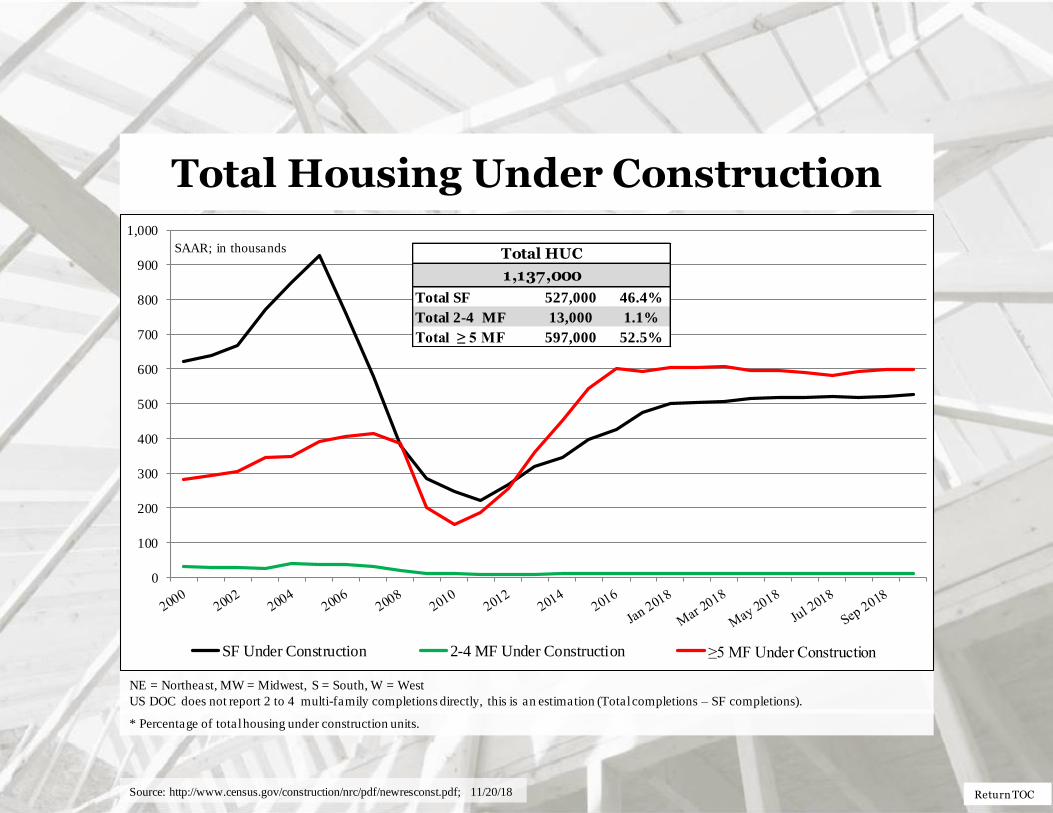
Total Housing Under Construction
* Percentage of total housing under construction units.
NE = Northeast, MW = Midwest, S = South, W = West
US DOC does not report 2 to 4 multi-family completions directly, this is an estimation (Total completions – SF completions).
0
100
200
300
400
500
600
700
800
900
1,000
SF Under Construction 2-4 MF Under Construction ≥5 MF Under Construction
SAAR; in thousands
Total SF 527,000 46.4%
Total 2-4 MF 13,000 1.1%
Total ≥ 5 MF 597,000 52.5%
Total HUC
1,137,000
Source: http://www.census.gov/construction/nrc/pdf/newresconst.pdf; 11/20/18
Return TOC
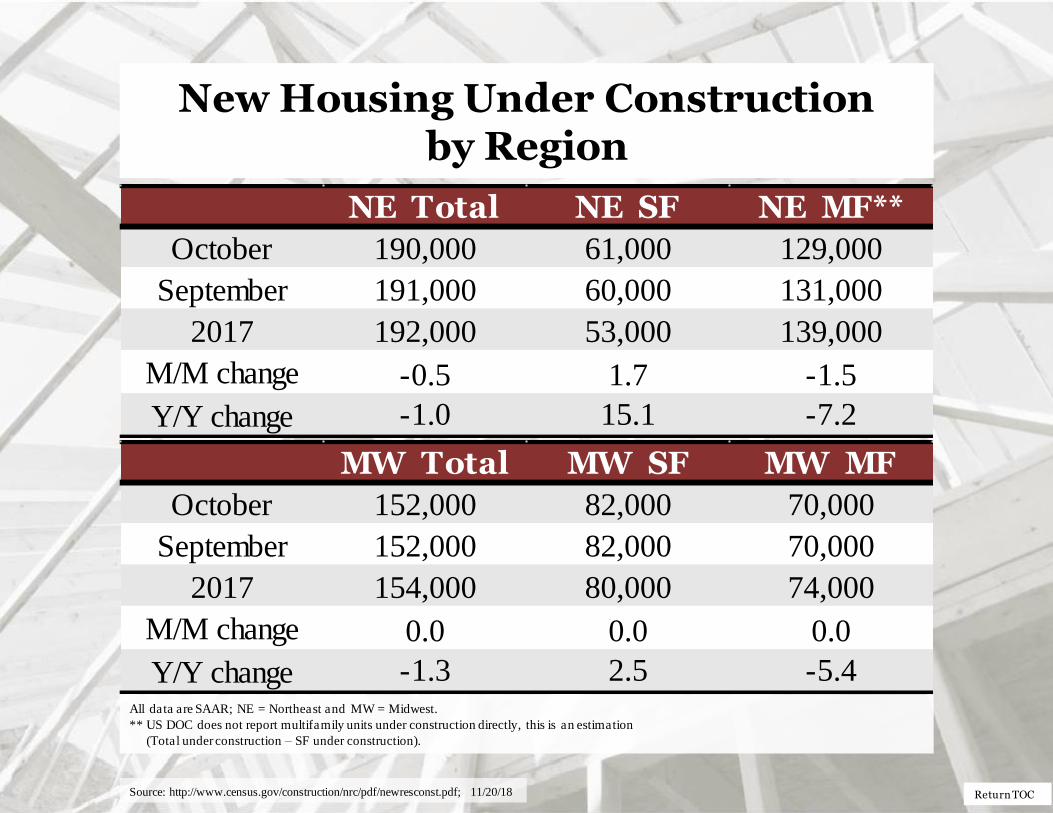
New Housing Under Construction by Region
All data are SAAR; NE = Northeast and MW = Midwest.
** US DOC does not report multifamily units under construction directly, this is an estimation
(Total under construction – SF under construction).
NE Total NE SF NE MF**
October 190,000 61,000 129,000
September 191,000 60,000 131,000
2017 192,000 53,000 139,000
M/M change -0.5 1.7 -1.5
Y/Y change -1.0 15.1 -7.2
MW Total MW SF MW MF
October 152,000 82,000 70,000
September 152,000 82,000 70,000
2017 154,000 80,000 74,000
M/M change 0.0 0.0 0.0
Y/Y change -1.3 2.5 -5.4
Source: http://www.census.gov/construction/nrc/pdf/newresconst.pdf; 11/20/18
Return TOC
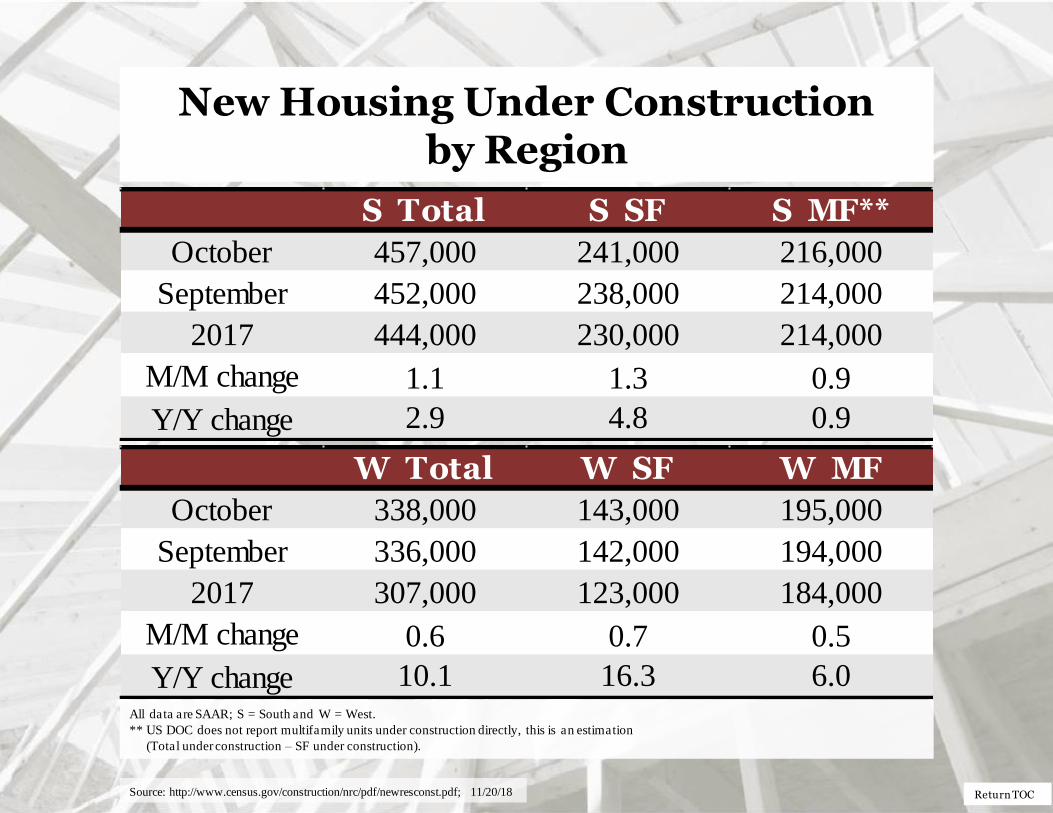
New Housing Under Construction by Region
All data are SAAR; S = South and W = West.
** US DOC does not report multifamily units under construction directly, this is an estimation
(Total under construction – SF under construction).
S Total S SF S MF**
October 457,000 241,000 216,000
September 452,000 238,000 214,000
2017 444,000 230,000 214,000
M/M change 1.1 1.3 0.9
Y/Y change 2.9 4.8 0.9
W Total W SF W MF
October 338,000 143,000 195,000
September 336,000 142,000 194,000
2017 307,000 123,000 184,000
M/M change 0.6 0.7 0.5
Y/Y change 10.1 16.3 6.0
Source: http://www.census.gov/construction/nrc/pdf/newresconst.pdf; 11/20/18

Return TOC
Total Housing Under Construction by Region
* Percentage of total housing under construction units.
NE = Northeast, MW = Midwest, S = South, W = West
US DOC does not report 2 to 4 multi-family completions directly, this is an estimation (Total completions – SF completions).
0
100
200
300
400
500
600
700
NE Under Construction MW Under Construction S Under Construction W Under Construction
SAAR; in thousands
Total NE 190,000 16.7%
Total MW 152,000 16.7%
Total S 457,000 40.2%
Total W 338,000 29.7%
Total Regional HUC
Source: http://www.census.gov/construction/nrc/pdf/newresconst.pdf; 11/20/18
Return TOC
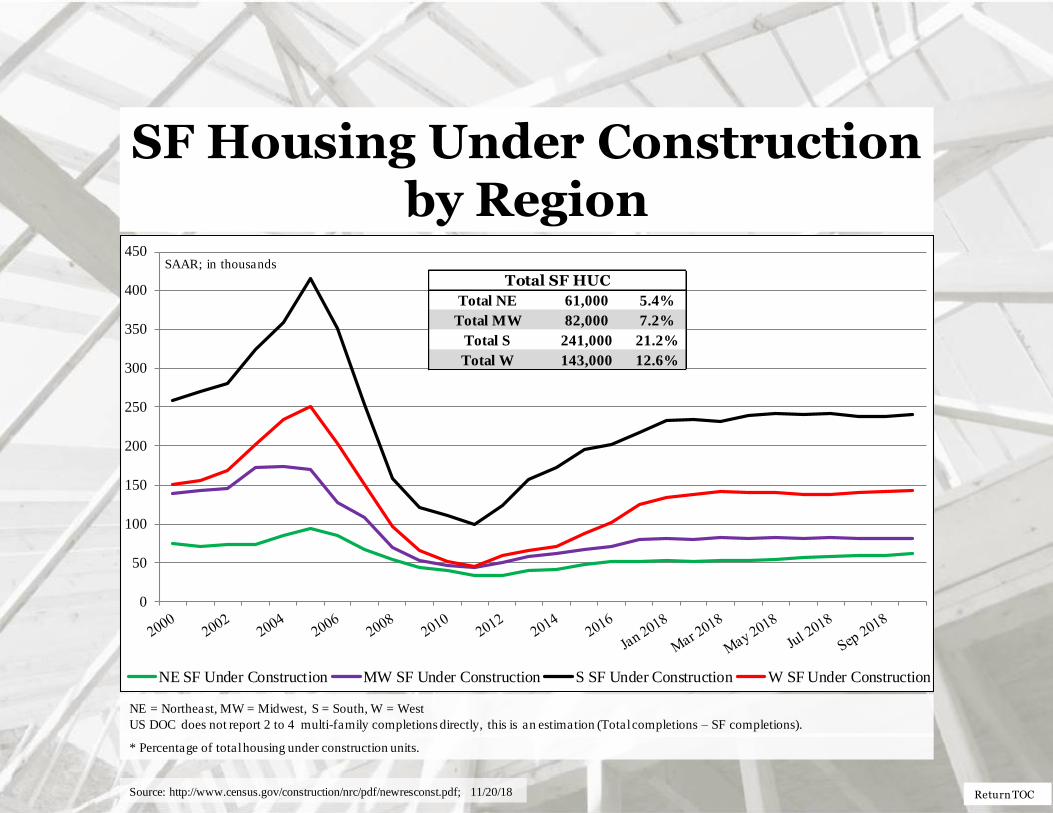
SF Housing Under Construction by Region
* Percentage of total housing under construction units.
NE = Northeast, MW = Midwest, S = South, W = West
US DOC does not report 2 to 4 multi-family completions directly, this is an estimation (Total completions – SF completions).
0
50
100
150
200
250
300
350
400
450
NE SF Under Construction MW SF Under Construction S SF Under Construction W SF Under Construction
SAAR; in thousands
Total NE 61,000 5.4%
Total MW 82,000 7.2%
Total S 241,000 21.2%
Total W 143,000 12.6%
Total SF HUC
Source: http://www.census.gov/construction/nrc/pdf/newresconst.pdf; 11/20/18

Return TOC
MF Housing Under Construction by Region
* Percentage of total housing under construction units.
NE = Northeast, MW = Midwest, S = South, W = West
US DOC does not report 2 to 4 multi-family completions directly, this is an estimation (Total completions – SF completions).
0
50
100
150
200
250
NE MF Under Construction MW MF Under Construction S MF Under Construction W MF Under Construction
SAAR; in thousands Total NE 129,000 11.3%
Total MW 70,000 6.2%
Total S 216,000 19.0%
Total W 195,000 17.2%
Total MF HUC
Source: http://www.census.gov/construction/nrc/pdf/newresconst.pdf; 11/20/18

Return TOC
New Housing Completions
* All completion data are presented at a seasonally adjusted annual rate (SAAR).
** US DOC does not report multifamily completions directly, this is an estimation ((Total completions – (SF + 5 unit MF)).
Total
Completions*
SF
Completions
MF 2-4 unit**
Completions
MF ≥ 5 unit
Completions
October 1,111,000 832,000 10,000 269,000
September 1,149,000 842,000 8,000 299,000
2017 1,188,000 798,000 7,000 383,000
M/M change -3.3% -1.2% 25.0% -10.0%
Y/Y change -6.5% 4.3% 42.9% -29.8%
Source: http://www.census.gov/construction/nrc/pdf/newresconst.pdf; 11/20/18

Return TOC
Total Housing Completions
* Percentage of total housing completions
US DOC does not report 2 to 4 multi-family completions directly, this is an estimation (Total completions – SF completions).
0
200
400
600
800
1,000
1,200
1,400
1,600
1,800
Total SF Completions Total 2-4 MF Completions Total ≥ 5 MF Completions
SAAR; in thousands
Total SF 832,000 74.9%
Total 2-4 MF 10,000 0.9%
Total ≥ 5 MF 269,000 24.2%
Total Completions
1,111,000
Source: http://www.census.gov/construction/nrc/pdf/newresconst.pdf; 11/20/18
Return TOC
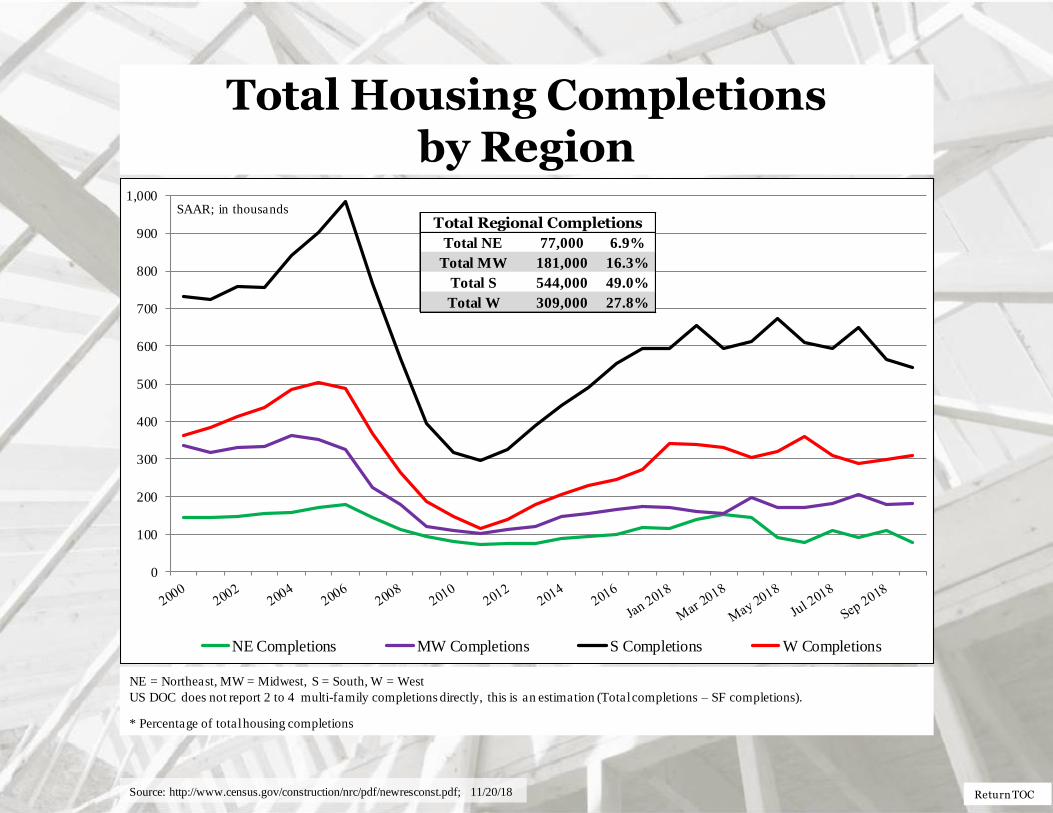
Total Housing Completions by Region
NE = Northeast, MW = Midwest, S = South, W = West
US DOC does not report 2 to 4 multi-family completions directly, this is an estimation (Total completions – SF completions).
* Percentage of total housing completions
0
100
200
300
400
500
600
700
800
900
1,000
NE Completions MW Completions S Completions W Completions
SAAR; in thousands
Total NE 77,000 6.9%
Total MW 181,000 16.3%
Total S 544,000 49.0%
Total W 309,000 27.8%
Total Regional Completions
Source: http://www.census.gov/construction/nrc/pdf/newresconst.pdf; 11/20/18
Return TOC
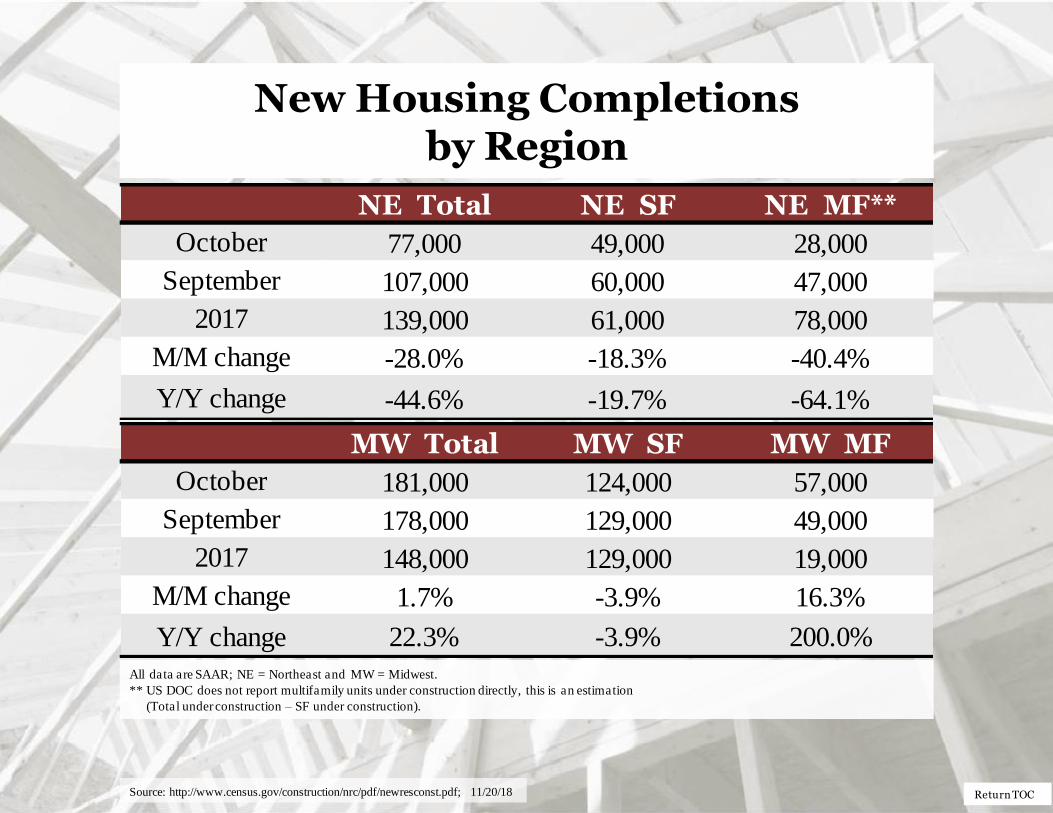
New Housing Completions by Region
All data are SAAR; NE = Northeast and MW = Midwest.
** US DOC does not report multifamily units under construction directly, this is an estimation
(Total under construction – SF under construction).
NE Total NE SF NE MF**
October 77,000 49,000 28,000
September 107,000 60,000 47,000
2017 139,000 61,000 78,000
M/M change -28.0% -18.3% -40.4%
Y/Y change -44.6% -19.7% -64.1%
MW Total MW SF MW MF
October 181,000 124,000 57,000
September 178,000 129,000 49,000
2017 148,000 129,000 19,000
M/M change 1.7% -3.9% 16.3%
Y/Y change 22.3% -3.9% 200.0%
Source: http://www.census.gov/construction/nrc/pdf/newresconst.pdf; 11/20/18
Return TOC
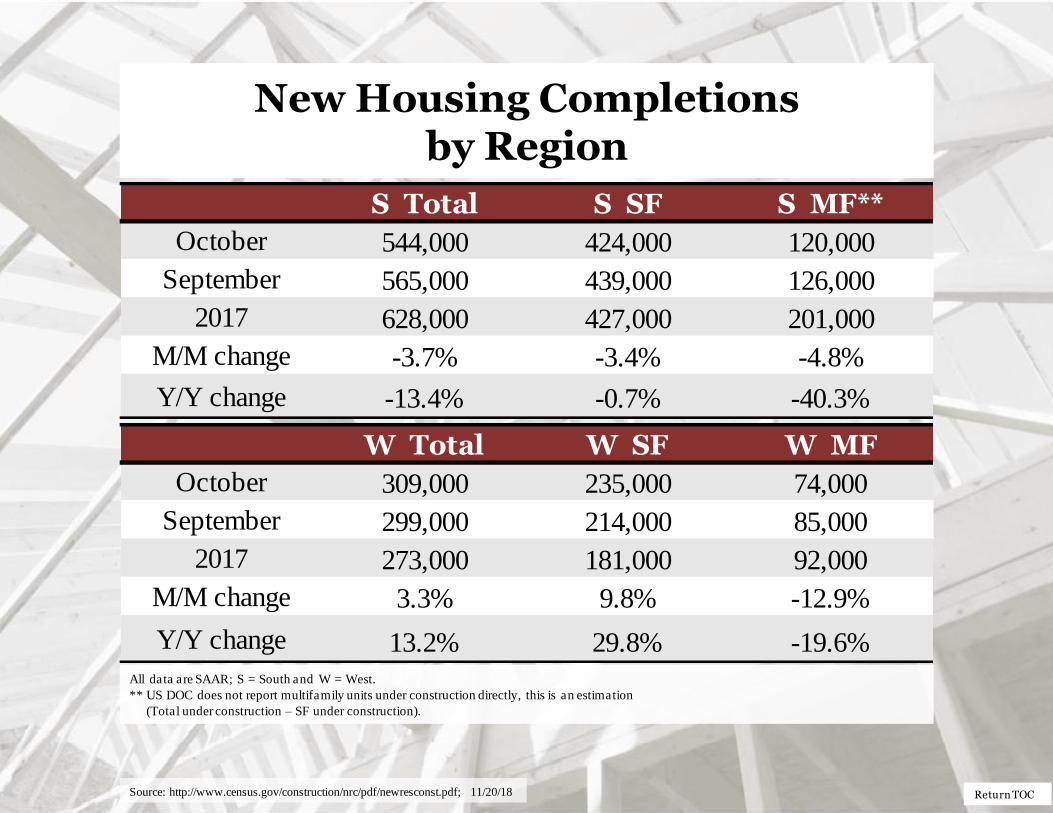
All data are SAAR; S = South and W = West.
** US DOC does not report multifamily units under construction directly, this is an estimation
(Total under construction – SF under construction).
New Housing Completions by Region
S Total S SF S MF**
October 544,000 424,000 120,000
September 565,000 439,000 126,000
2017 628,000 427,000 201,000
M/M change -3.7% -3.4% -4.8%
Y/Y change -13.4% -0.7% -40.3%
W Total W SF W MF
October 309,000 235,000 74,000
September 299,000 214,000 85,000
2017 273,000 181,000 92,000
M/M change 3.3% 9.8% -12.9%
Y/Y change 13.2% 29.8% -19.6%
Source: http://www.census.gov/construction/nrc/pdf/newresconst.pdf; 11/20/18
Return TOC
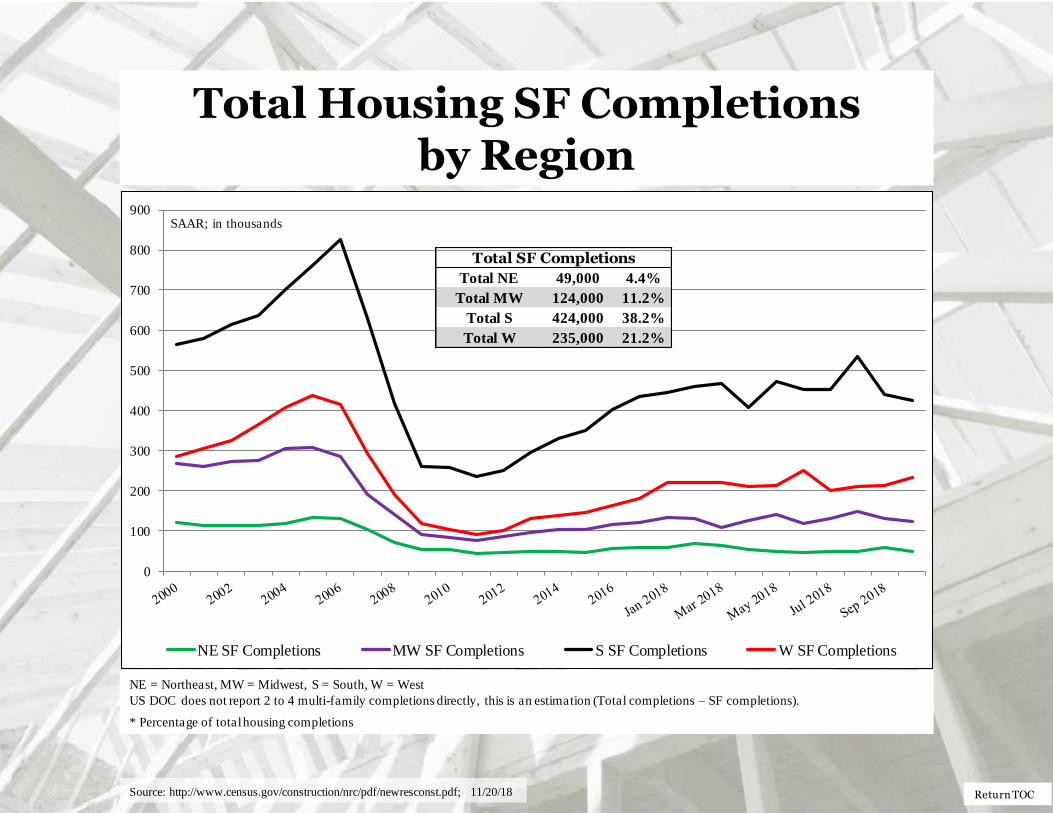
Total Housing SF Completions by Region
NE = Northeast, MW = Midwest, S = South, W = West
US DOC does not report 2 to 4 multi-family completions directly, this is an estimation (Total completions – SF completions).
* Percentage of total housing completions
0
100
200
300
400
500
600
700
800
900
NE SF Completions MW SF Completions S SF Completions W SF Completions
SAAR; in thousands
Total NE 49,000 4.4%
Total MW 124,000 11.2%
Total S 424,000 38.2%
Total W 235,000 21.2%
Total SF Completions
Source: http://www.census.gov/construction/nrc/pdf/newresconst.pdf; 11/20/18

Return TOC
New Housing MF Completions by Region
All data are SAAR; NE = Northeast and MW = Midwest; * Percentage of total housing completions.
NE = Northeast, MW = Midwest, S = South, W = West
US DOC does not report 2 to 4 multi-family completions directly, this is an estimation (Total completions – SF completions).
* Percentage of total housing completions
0
50
100
150
200
250
NE MF Completions MW MF Completions S MF Completions W MF Completions
SAAR; in thousands
Total NE 28,000 2.5%
Total MW 57,000 5.1%
Total S 120,000 10.8%
Total W 74,000 6.7%
Total MF Completions
Source: http://www.census.gov/construction/nrc/pdf/newresconst.pdf; 11/20/18

Return TOC
New Single-Family House Sales
* All new sales data are presented at a seasonally adjusted annual rate (SAAR)1 and housing prices are adjusted at irregular intervals2.
Sources: 1http://www.census.gov/construction/nrc/pdf/newresconst.pdf; 11/28/18; 2 https://www.census.gov/construction/cpi/pdf/descpi_sold.pdf 3 http://mam.econoday.com/byshoweventfull.asp; 11/28/18
New SF sales were markedly less than the consensus forecast3 of 575 m. The past three
month’s new SF sales data also were revised downward:
July initial: 654 m revised to 606 m;
August initial: 609 m revised to 591 m;
September initial: 693 m revised to 597 m.
New SF
Sales*
Median
Price
Mean
Price
Month's
Supply
October 544,000 $309,700 $395,000 7.4
September 597,000 $321,300 $379,000 6.5
2017 618,000 $319,500 $394,000 5.6
M/M change -8.9% -3.6% 4.2% 13.8%
Y/Y change -12.0% -3.1% 0.3% 32.1%

Return TOC
New SF House Sales
0
200
400
600
800
1,000
1,200
1,400
Total New SF Sales
October 2018: 544,000
1963-2016 average: 650,963 units
1963-2000 average: 633,895 units
SAAR; in thousands
Source: http://www.census.gov/construction/nrc/pdf/newresconst.pdf; 11/28/18
Return TOC
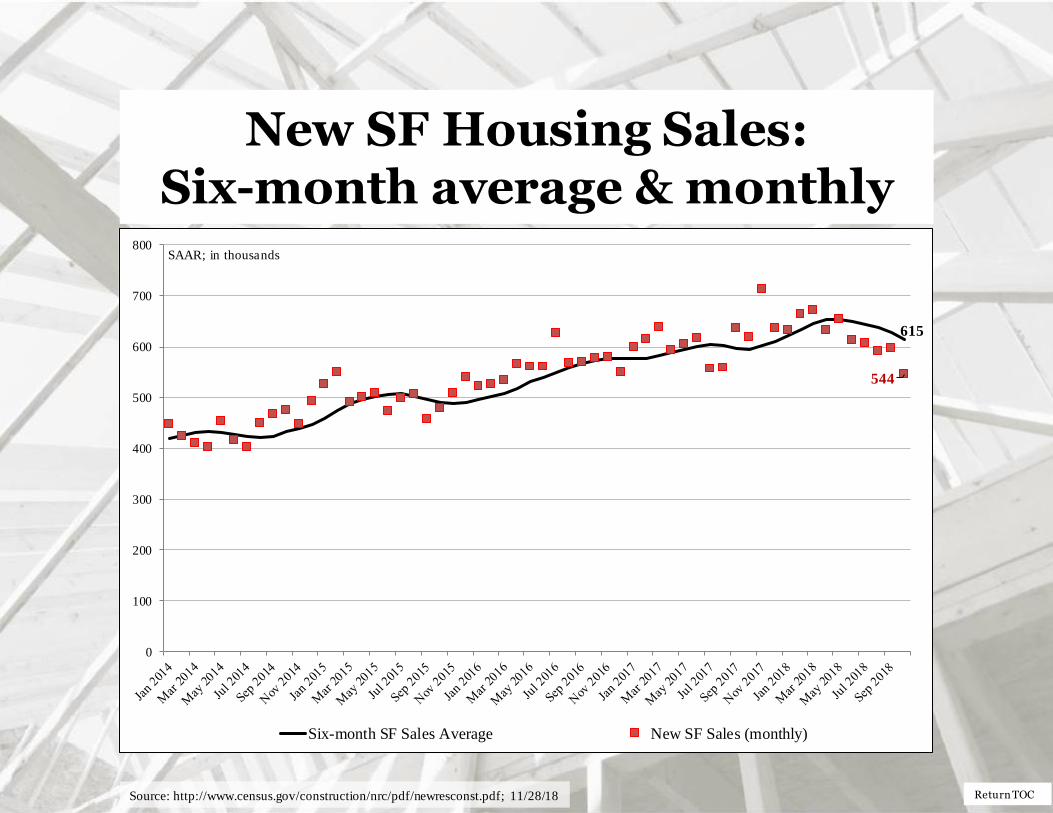
New SF Housing Sales: Six-month average & monthly
544
615
0
100
200
300
400
500
600
700
800
Six-month SF Sales Average New SF Sales (monthly)
SAAR; in thousands
Source: http://www.census.gov/construction/nrc/pdf/newresconst.pdf; 11/28/18

Return TOC
New SF House Sales by Region and Price Category
1 All data are SAAR 2 Houses for which sales price were not reported have been distributed proportionally to those for which sales price was report ed; 3 Detail may not add to total because of rounding. 4 Housing prices are adjusted at irregular intervals.
Sources: 1,2,3 http://www.census.gov/construction/nrc/pdf/newresconst.pdf; 11/28/18; 4https://www.census.gov/construction/cpi/pdf/descpi_sold.pdf
NE SF Sales MW SF Sales S SF Sales W SF Sales
October 22,000 60,000 313,000 149,000
September 27,000 77,000 339,000 154,000
2017 41,000 72,000 354,000 151,000
M/M change -18.5% -22.1% -7.7% -3.2%
Y/Y change -46.3% -16.7% -11.6% -1.3%
≤ $150m
$150 -
$199.9m
$200 -
299.9m
$300 -
$399.9m
$400 -
$499.9m
$500 -
$749.9m ≥ $750m
October1,2,3,4 2,000 3,000 15,000 10,000 5,000 4,000 3,000
September 1,000 3,000 16,000 11,000 8,000 5,000 2,000
2017 2,000 4,000 17,000 11,000 8,000 5,000 3,000
M/M change 100.0% 0.0% -6.3% -9.1% -37.5% -20.0% 50.0%
Y/Y change 0.0% -25.0% -11.8% -9.1% -37.5% -20.0% 0.0%
New SF sales: % 4.8% 7.1% 35.7% 23.8% 11.9% 9.5% 7.1%
Return TOC
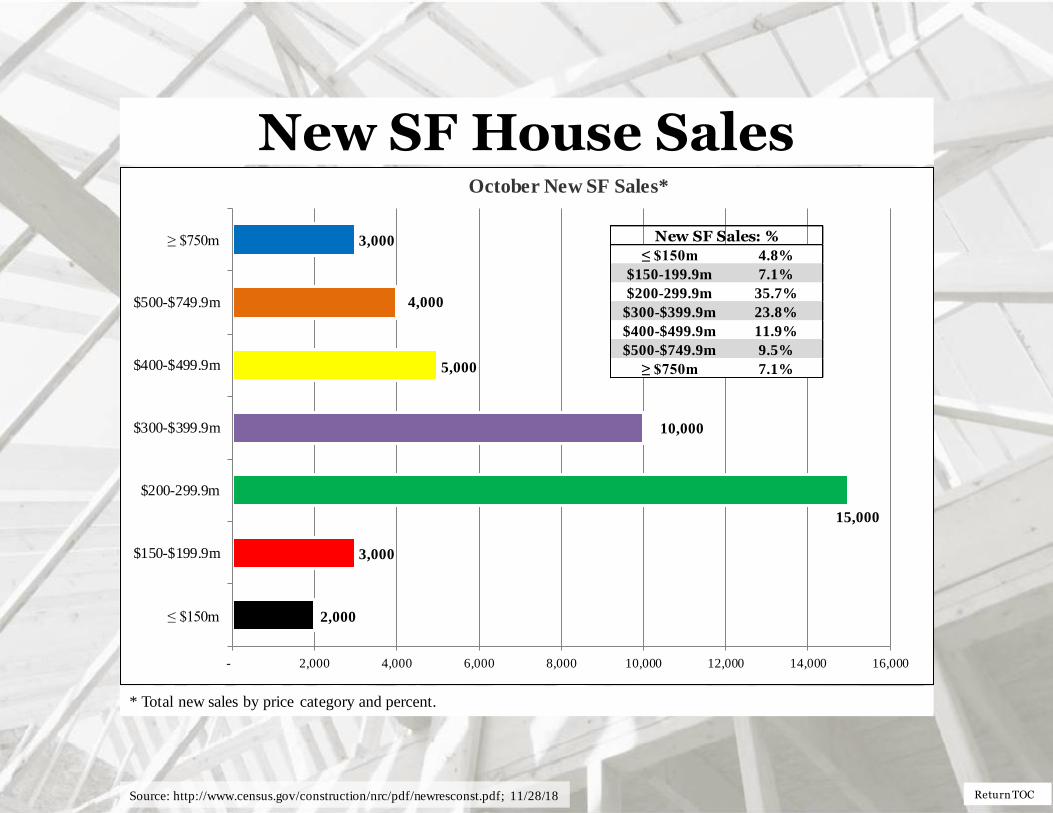
New SF House Sales
* Total new sales by price category and percent.
2,000
3,000
15,000
10,000
5,000
4,000
3,000
- 2,000 4,000 6,000 8,000 10,000 12,000 14,000 16,000
≤ $150m
$150-$199.9m
$200-299.9m
$300-$399.9m
$400-$499.9m
$500-$749.9m
≥ $750m
October New SF Sales*
≤ $150m 4.8%
$150-199.9m 7.1%
$200-299.9m 35.7%
$300-$399.9m 23.8%
$400-$499.9m 11.9%
$500-$749.9m 9.5%
≥ $750m 7.1%
New SF Sales: %
Source: http://www.census.gov/construction/nrc/pdf/newresconst.pdf; 11/28/18

Return TOC
New SF House Sales by Region
* Percentage of total new sales.
0
100
200
300
400
500
600
700
NE SF Sales MW SF Sales S SF Sales W SF Sales
SAAR; in thousands
Total NE 22,000 4.0%
Total MW 60,000 11.0%
Total S 313,000 57.5%
Total W 149,000 27.4%
Total SF Sales
Source: http://www.census.gov/construction/nrc/pdf/newresconst.pdf; 11/28/18

Return TOC
New SF House Sales by Price Category
* Sales tallied by price category.
186
147
88
79
32
0
50
100
150
200
250
300
350
400
2002 2003 2004 2005 2006 2007 2008 2009 2010 2011 2012 2013 2014 2015 2016 2017
Sales_Cat!#REF!
Sales_Cat!#REF!
$200-299.9
$300-$399.9
$400-$499.9
$500-$749.9
> $750
2017 Total New SF Sales*: 612 m units
2002-2017; in thousands, and thousands of dollars; SAAR
Source: http://www.census.gov/construction/nrc/pdf/newresconst.pdf; 3/23/18

Return TOC
New SF House Sales
New SF Sales $400m houses: 2002 – October 2018
The sales share of $400 thousand plus SF houses is presented above1, 2. Since the beginning of 2012, the
upper priced houses have and are garnering a greater percentage of sales. A decreasing spread indicates
that more high-end luxury homes are being sold. Several reasons are offered by industry analysts; 1)
builders can realize a profit on higher priced houses; 2) historically low interest rates have indirectly
resulted in increasing house prices; and 3) purchasers of upper end houses fared better financially coming
out of the Great Recession.
Source: 1 http://www.census.gov/construction/nrc/pdf/newresconst.pdf; 2 https://www.census.gov/construction/cpi/pdf/descpi_sold.pdf 11/28/18
92.4%
71.4%
7.6%
28.6%
0.0%
10.0%
20.0%
30.0%
40.0%
50.0%
60.0%
70.0%
80.0%
90.0%
100.0%
% of Sales: ≤ $400m % of Sales: ≥ $400m

Return TOC
New SF House Sales
New SF Sales: ≤ $ 200m and ≥ $500m: 2002 to October 2018
The number of ≤ $200 thousand plus SF houses has declined dramatically since 2002 1, 2. Subsequently,
from 2012 onward, the ≥ $500 thousand class has soared (on a percentage basis) in contrast to the
≤ $200m class. One of the most oft mentioned reasons for this occurrence is builder net margins.
Note: Sales values are not adjusted for inflation.
Source: 1 http://www.census.gov/construction/nrc/pdf/newresconst.pdf; 2 https://www.census.gov/construction/cpi/pdf/descpi_sold.pdf 11/28/18
7.5%
58.3%
92.5%
41.7%
0.0%
10.0%
20.0%
30.0%
40.0%
50.0%
60.0%
70.0%
80.0%
90.0%
100.0%
< $199.999m (%) > $500m (%)
LHS: ≤ $200m; thousands of units; SAAR RHS: ≥ $500m; thousands of units; SAAR

Return TOC
New SF House Sales by Square Feet of Floor Area
New SF Sales: ≤ 1,400 square feet and ≥ 4,000 square feet: 1999 to 2017
The number of SF houses sold (≥ 4,000 sq ft) has risen dramatically since 2010 .. Some of the most oft
mentioned reasons for this is builder net margins; regulations, and finance availability.
Source: https://www.census.gov/construction/chars/pdf/soldsquarefeet.pdf ; 11/28/18
119
21
37
55
0
20
40
60
80
100
120
140
1999 2000 2001 2002 2003 2004 2005 2006 2007 2008 2009 2010 2011 2012 2013 2014 2015 2016 2017
≤ 1,400 sq ft ≥ 4,000 sq ft
in thousands of units; SAAR

Return TOC
New SF House Sales
New SF sales adjusted for the US population
From October 1963 to November 2007, the long-term ratio of new house sales to the total US non-
institutionalized population was 0.0039; in October 2018 it was 0.0021 – a decrease from September (0.0023).
The non-institutionalized population, aged 20 to 54 long-term ratio is 0.0062; in October 2018 it was 0.0037 –
also decrease from September (0.0040). All are non-adjusted data. From a population viewpoint, construction is
less than what is necessary for changes in the population (i.e., under-building).
0.000
0.001
0.002
0.003
0.004
0.005
0.006
0.007
0.008
0.009
0.010
0.011
Ratio of New SF Sales/Civilian Noninstitutional Population
Ratio of New SF Sales/Civilian Noninstitutional Population (20-54)
20 to 54 year old population/New SF sales: 1/1/63 to 12/31/07 ratio: 0.0062 20 to 54: 7/18 ratio: 0.0037
Total US non-institutionalized population/new SF sales: 1/1/63 to 12/31/07 ratio: 0.0039
All new SF sales: 7/18 ratio: 0.0021
Sources: http://www.census.gov/construction/nrc/pdf/newresconst.pdff and The Federal Reserve Bank of St. Louis; 11/28/18
Return TOC
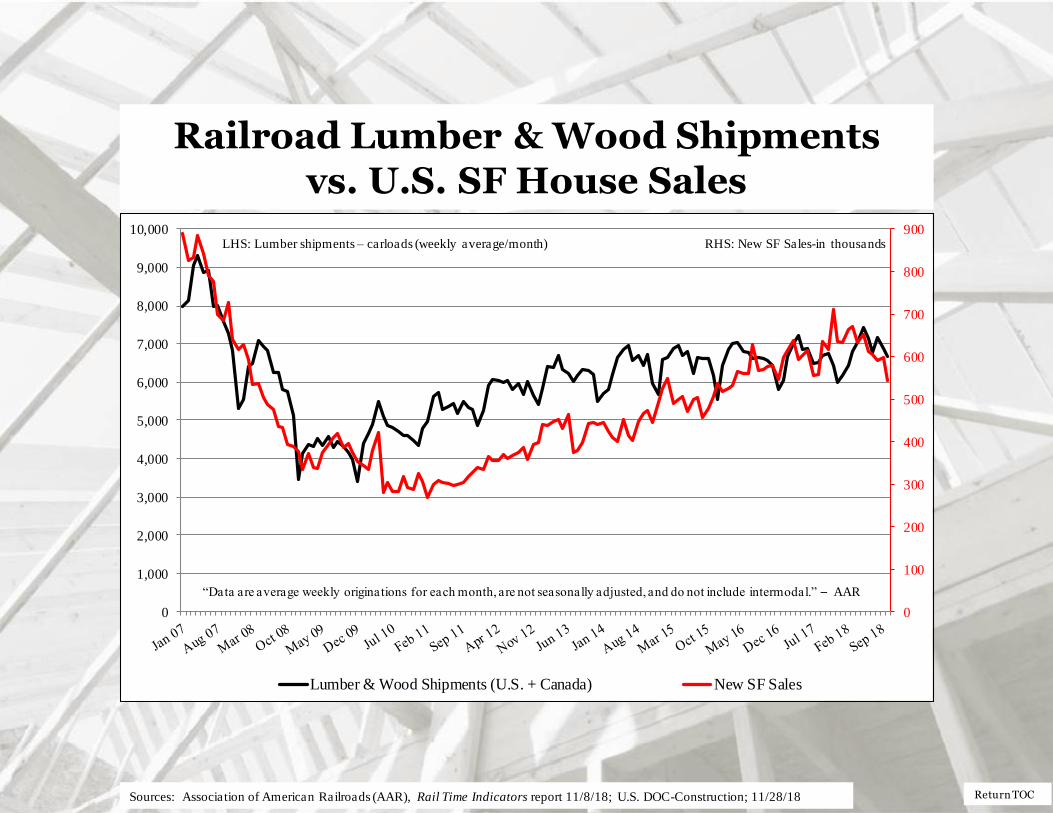
Railroad Lumber & Wood Shipments vs. U.S. SF House Sales
0
100
200
300
400
500
600
700
800
900
0
1,000
2,000
3,000
4,000
5,000
6,000
7,000
8,000
9,000
10,000
Lumber & Wood Shipments (U.S. + Canada) New SF Sales
RHS: New SF Sales-in thousands
LHS: Lumber shipments – carloads (weekly average/month)
“Data are average weekly originations for each month, are not seasonally adjusted, and do not include intermodal.” – AAR
Sources: Association of American Railroads (AAR), Rail Time Indicators report 11/8/18; U.S. DOC-Construction; 11/28/18
Return TOC
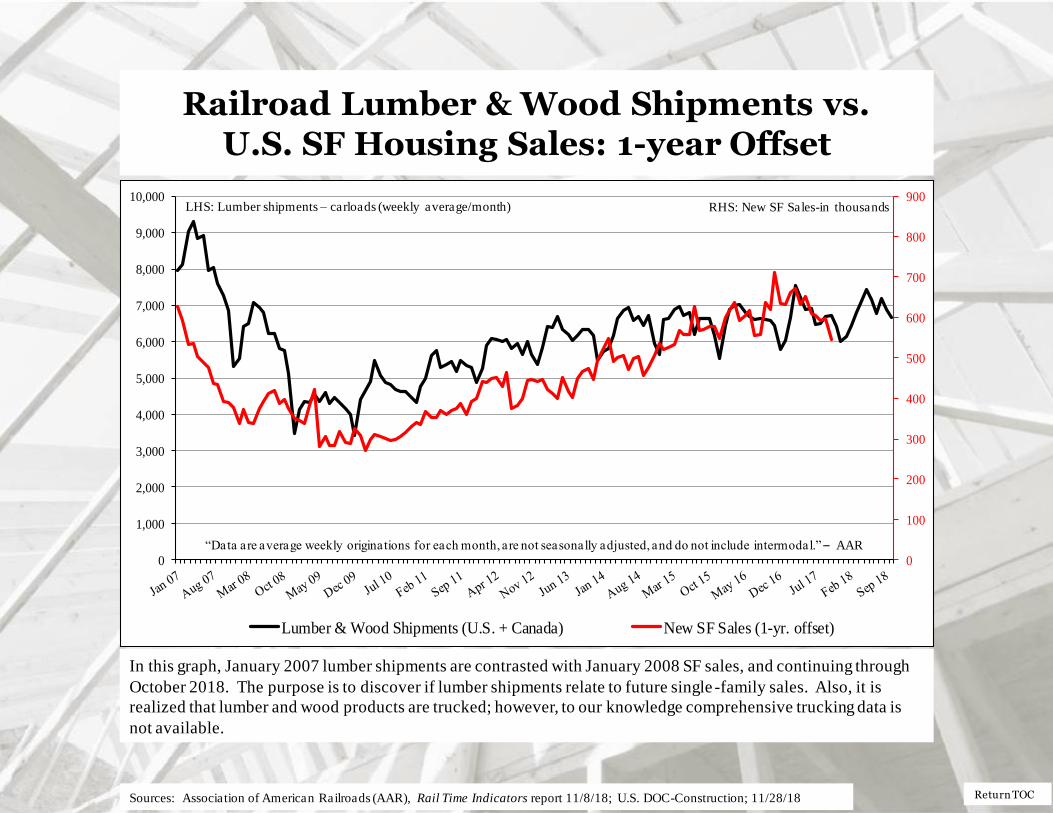
Railroad Lumber & Wood Shipments vs. U.S. SF Housing Sales: 1-year Offset
In this graph, January 2007 lumber shipments are contrasted with January 2008 SF sales, and continuing through
October 2018. The purpose is to discover if lumber shipments relate to future single -family sales. Also, it is
realized that lumber and wood products are trucked; however, to our knowledge comprehensive trucking data is
not available.
0
100
200
300
400
500
600
700
800
900
0
1,000
2,000
3,000
4,000
5,000
6,000
7,000
8,000
9,000
10,000
Lumber & Wood Shipments (U.S. + Canada) New SF Sales (1-yr. offset)
RHS: New SF Sales-in thousands LHS: Lumber shipments – carloads (weekly average/month)
“Data are average weekly originations for each month, are not seasonally adjusted, and do not include intermodal.” – AAR
Sources: Association of American Railroads (AAR), Rail Time Indicators report 11/8/18; U.S. DOC-Construction; 11/28/18
Return TOC
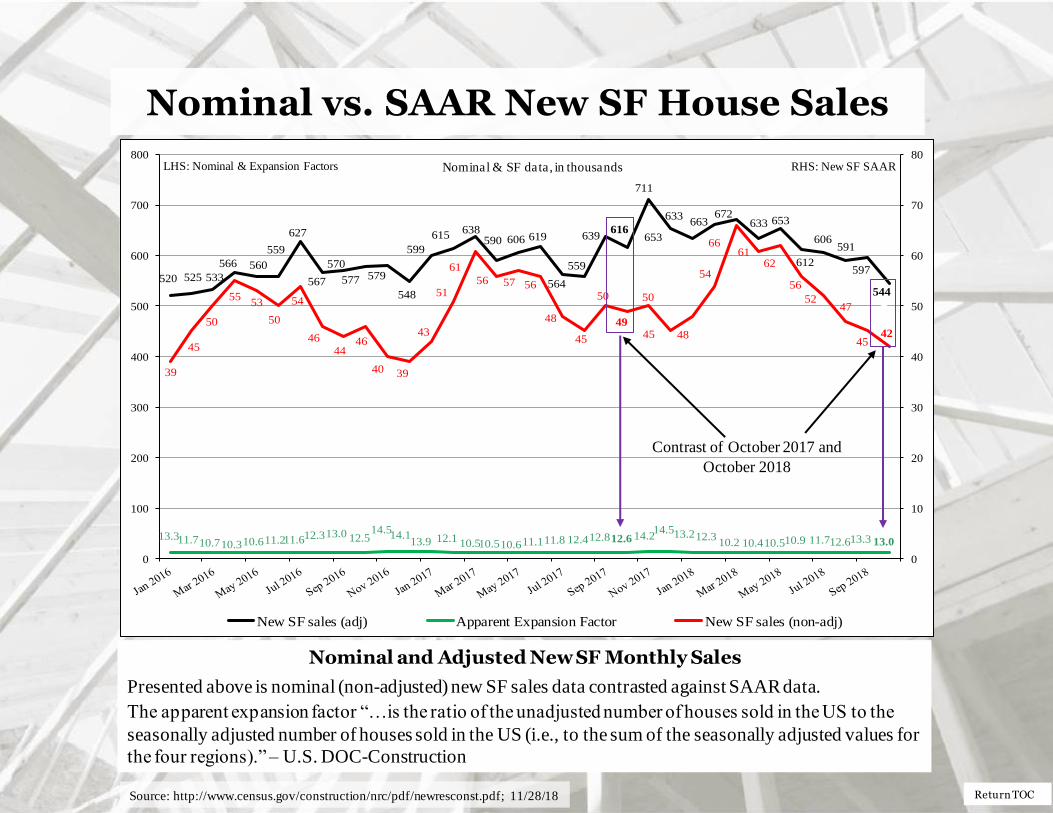
Nominal vs. SAAR New SF House Sales
Nominal and Adjusted New SF Monthly Sales
Presented above is nominal (non-adjusted) new SF sales data contrasted against SAAR data.
The apparent expansion factor “…is the ratio of the unadjusted number of houses sold in the US to the
seasonally adjusted number of houses sold in the US (i.e., to the sum of the seasonally adjusted values for
the four regions).” – U.S. DOC-Construction
520 525 533
566 560
559
627
567
570
577 579
548
599
615638
590 606 619
564
559
639616
711
653
633663
672633 653
612
606591
597
544
13.311.710.710.310.611.211.612.313.0 12.514.5
14.113.9 12.1 10.510.510.611.111.8 12.412.812.6 14.2
14.513.212.310.2 10.410.510.9 11.712.613.3 13.0
39
45
50
5553
50
54
46
4446
40 39
43
51
61
56 57 56
48
45
50
49
50
45 48
54
6661
62
56
5247
4542
0
10
20
30
40
50
60
70
80
0
100
200
300
400
500
600
700
800
New SF sales (adj) Apparent Expansion Factor New SF sales (non-adj)
Nominal & SF data, in thousands RHS: New SF SAAR LHS: Nominal & Expansion Factors
Contrast of October 2017 and
October 2018
0
Source: http://www.census.gov/construction/nrc/pdf/newresconst.pdf; 11/28/18

Return TOC
New SF House Sales
New SF Houses Sold During Period
In October 2018, a substantial portion of new sales – 32.5% – have not been started; an
increase of 2.5% from September.
* Not SAAR
Total
Not
started
Under
Construction Completed
October 544,000 177,000 196,000 171,000
September 597,000 178,000 204,000 215,000
2017 618,000 182,000 218,000 218,000
M/M change -8.9% -0.6% -3.9% -20.5%
Y/Y change -12.0% -2.7% -10.1% -21.6%
Total percentage 32.5% 36.0% 31.4%
New SF Houses Sold During Period
Source: http://www.census.gov/construction/nrc/pdf/newresconst.pdf; 11/28/18

Return TOC
New SF House Sales
0
100
200
300
400
500
600
Not started Under Construction Completed
Thousands of units; not SAAR
Not SAAR
Source: http://www.census.gov/construction/nrc/pdf/newresconst.pdf; 11/28/18
Total
Not
started
Under
Construction Completed
544,000 177,000 196,000 171,000
New SF Houses Sold During Period

Return TOC
New SF House Sales
Not SAAR
Total
Not
started
Under
Construction Completed
October 336,000 65,000 197,000 74,000
September 322,000 58,000 193,000 71,000
2017 289,000 48,000 176,000 65,000
M/M change 4.3% 12.1% 2.1% 4.2%
Y/Y change 16.3% 35.4% 11.9% 13.8%
Total percentage 19.3% 58.6% 22.0%
New SF Houses for Sale at the end of the Period
Source: http://www.census.gov/construction/nrc/pdf/newresconst.pdf; 11/28/18

Return TOC
New SF House Sales
0
50
100
150
200
250
300
350
Not started Under construction Completed
Thousands of units; not SAAR
Not SAAR
Source: http://www.census.gov/construction/nrc/pdf/newresconst.pdf; 11/28/18
Total
Not
started
Under
Construction Completed
336,000 65,000 197,000 74,000
New SF Houses for Sale at the end of the Period

Return TOC
New SF House Sales
* Not SAAR
Total NE MW S W
October 341,000 28,000 43,000 179,000 91,000
September 326,000 27,000 41,000 172,000 86,000
2017 289,000 25,000 39,000 152,000 73,000
M/M change 4.6% 3.7% 4.9% 4.1% 5.8%
Y/Y change 18.0% 12.0% 10.3% 17.8% 24.7%
New SF Houses for Sale at the end of the Period by Region*
Source: http://www.census.gov/construction/nrc/pdf/newresconst.pdf; 11/28/18

Return TOC
New SF Houses Sale at End of Period by Region
0
50
100
150
200
250
300
NE MW S W
Thousands of units; not SAAR
Northeast 28,000 8.2%
Midwest 43,000 12.6%
South 179,000 52.5%
West 91,000 26.7%
For sale at end of period
341,000
Source: http://www.census.gov/construction/nrc/pdf/newresconst.pdf; 11/28/18
Return TOC
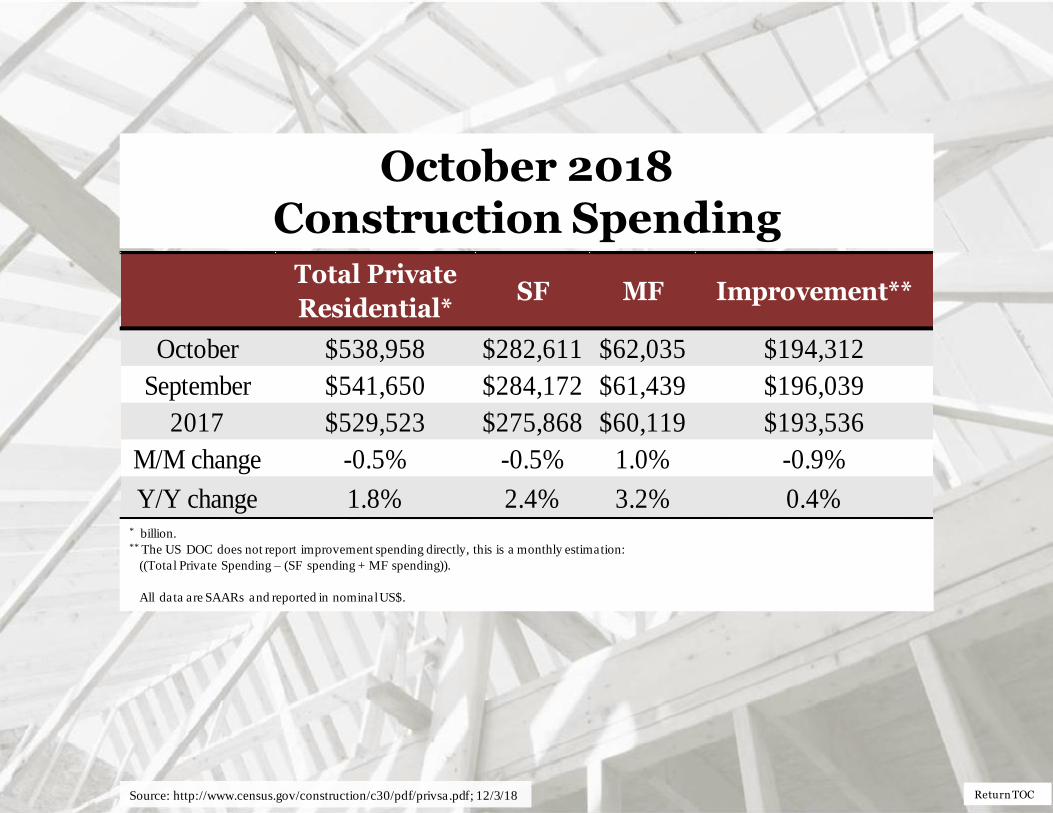
October 2018 Construction Spending
* billion. ** The US DOC does not report improvement spending directly, this is a monthly estimation:
((Total Private Spending – (SF spending + MF spending)).
All data are SAARs and reported in nominal US$.
Source: http://www.census.gov/construction/c30/pdf/privsa.pdf; 12/3/18
Total Private
Residential*SF MF Improvement**
October $538,958 $282,611 $62,035 $194,312
September $541,650 $284,172 $61,439 $196,039
2017 $529,523 $275,868 $60,119 $193,536
M/M change -0.5% -0.5% 1.0% -0.9%
Y/Y change 1.8% 2.4% 3.2% 0.4%

Return TOC
Total Construction Spending (nominal): 1993 – October 2018
Reported in nominal US$.
The US DOC does not report improvement spending directly, this is a monthly estimation for 2018.
Source: http://www.census.gov/construction/c30/pdf/privsa.pdf; 12/3/18
$0
$100,000
$200,000
$300,000
$400,000
$500,000
$600,000
$700,000
Total Residential Spending (nominal) SF Spending (nominal)
MF Spending (nominal) Remodeling Spending (nominal)
Total Private Nominal Construction Spending: $538,958 bil
SAAR; in millions

Return TOC
Total Construction Spending (adjusted): 1993-2018*
Reported in adjusted US$: 1993 – 2017 (adjusted for inflation, BEA Table 1.1.9); *January 2018 to October 2018 reported in nominal US$.
Source: http://www.census.gov/construction/c30/pdf/privsa.pdf; 12/3/18
$0
$100,000
$200,000
$300,000
$400,000
$500,000
$600,000
$700,000
$800,000
Total Residential Spending (adj.) SF Spending (adj.) MF Spending (adj.) Remodeling Spending (adj.)
SAAR; in millions of US dollars (adj.)
Return TOC
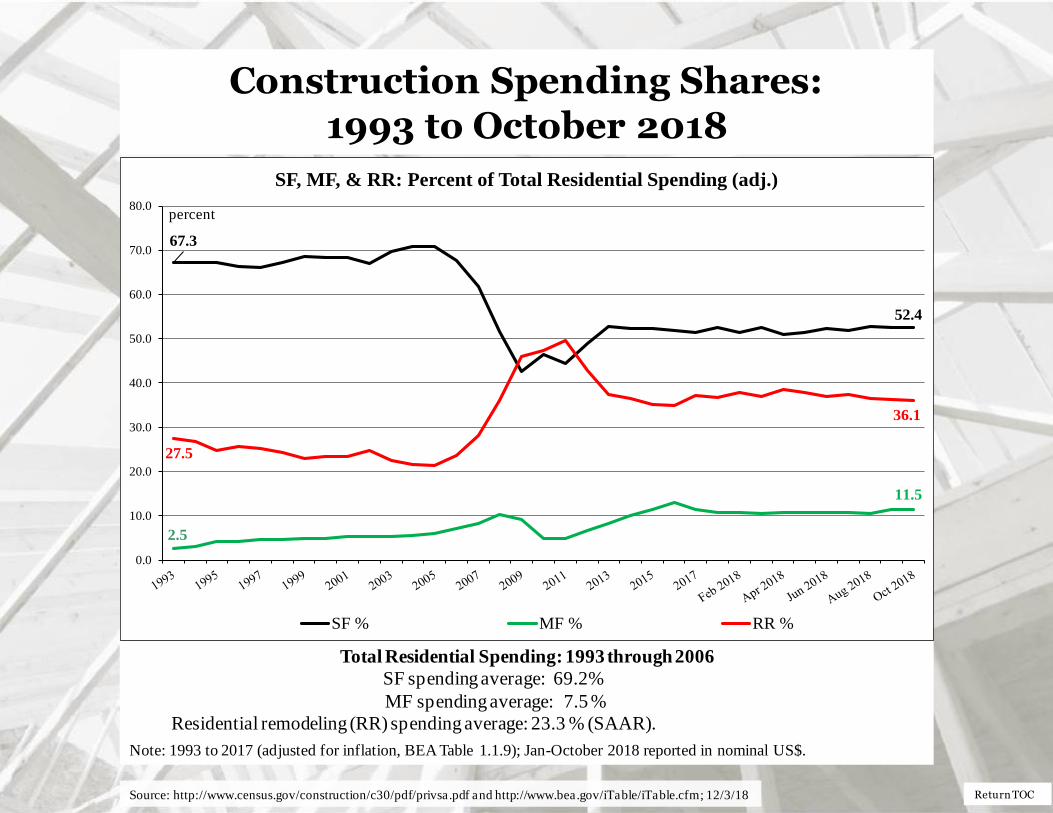
Construction Spending Shares:
1993 to October 2018
Total Residential Spending: 1993 through 2006
SF spending average: 69.2%
MF spending average: 7.5 %
Residential remodeling (RR) spending average: 23.3 % (SAAR).
Note: 1993 to 2017 (adjusted for inflation, BEA Table 1.1.9); Jan-October 2018 reported in nominal US$.
Source: http://www.census.gov/construction/c30/pdf/privsa.pdf and http://www.bea.gov/iTable/iTable.cfm; 12/3/18
67.3
52.4
2.5
11.5
27.5
36.1
0.0
10.0
20.0
30.0
40.0
50.0
60.0
70.0
80.0
SF, MF, & RR: Percent of Total Residential Spending (adj.)
SF % MF % RR %
percent
Return TOC
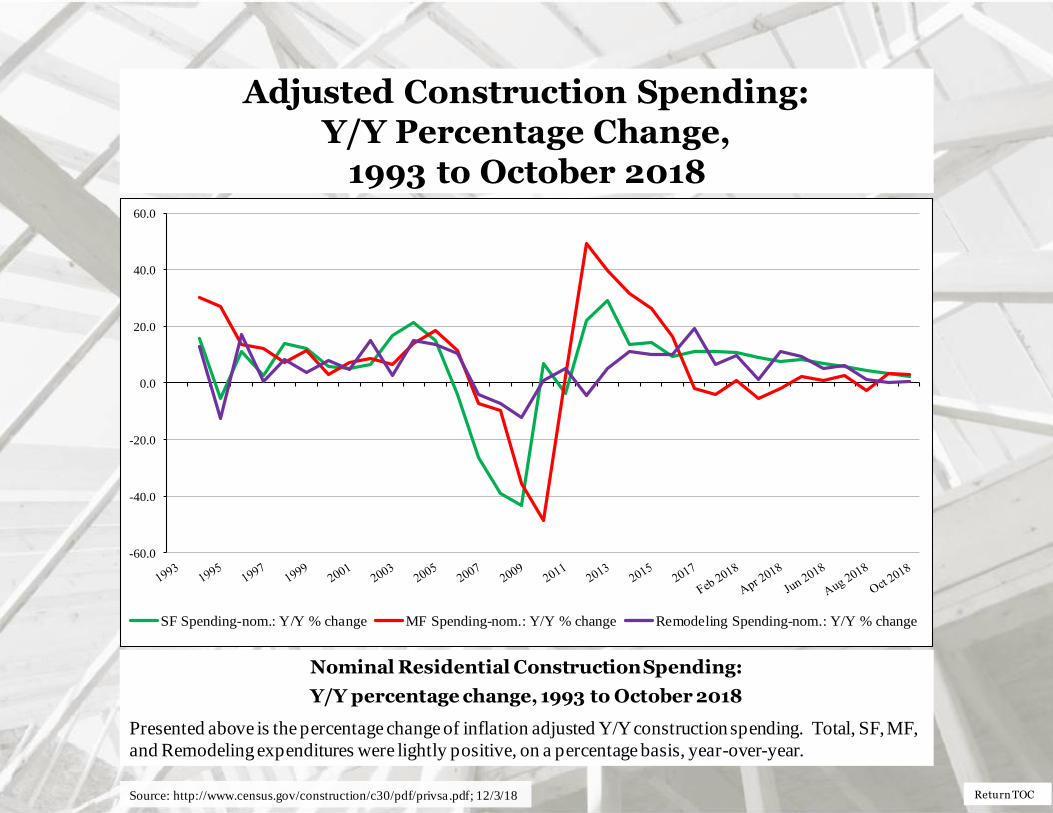
Adjusted Construction Spending: Y/Y Percentage Change,
1993 to October 2018
Nominal Residential Construction Spending:
Y/Y percentage change, 1993 to October 2018
Presented above is the percentage change of inflation adjusted Y/Y construction spending. Total, SF, MF,
and Remodeling expenditures were lightly positive, on a percentage basis, year-over-year.
Source: http://www.census.gov/construction/c30/pdf/privsa.pdf; 12/3/18
-60.0
-40.0
-20.0
0.0
20.0
40.0
60.0
SF Spending-nom.: Y/Y % change MF Spending-nom.: Y/Y % change Remodeling Spending-nom.: Y/Y % change

Return TOC
Adjusted Construction Spending: Y/Y Percentage Change,
2000 to October 2018
Source: http://www.census.gov/construction/c30/pdf/privsa.pdf; 12/3/18
-60.0
-40.0
-20.0
0.0
20.0
40.0
60.0
Total Residential Spending Y/Y % change (adj.) SF Spending Y/Y % change (adj.)
MF Spending Y/Y % change (adj.) Remodeling Spending Y/Y % change (adj.)
Return TOC
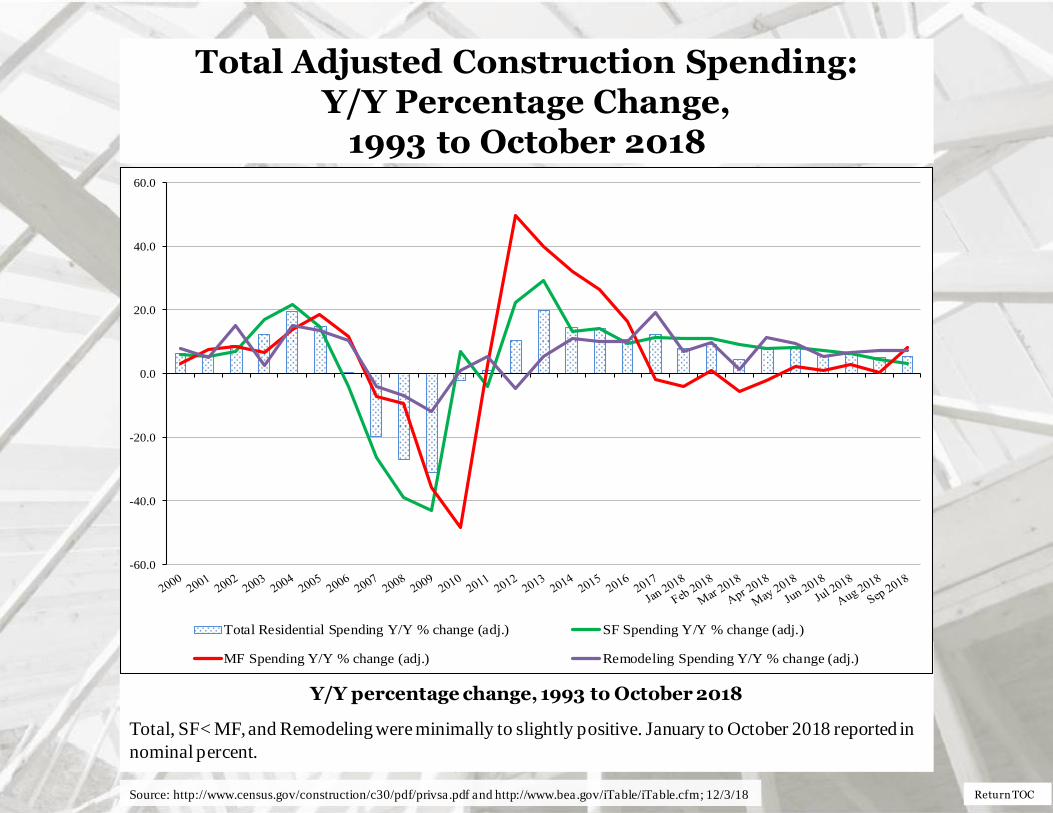
Total Adjusted Construction Spending: Y/Y Percentage Change,
1993 to October 2018
Inflation Adjusted Residential Construction Spending:
Y/Y percentage change, 1993 to October 2018
Total, SF< MF, and Remodeling were minimally to slightly positive. January to October 2018 reported in
nominal percent.
Source: http://www.census.gov/construction/c30/pdf/privsa.pdf and http://www.bea.gov/iTable/iTable.cfm; 12/3/18
-60.0
-40.0
-20.0
0.0
20.0
40.0
60.0
Total Residential Spending Y/Y % change (adj.) SF Spending Y/Y % change (adj.)
MF Spending Y/Y % change (adj.) Remodeling Spending Y/Y % change (adj.)
Return TOC
Remodeling
BuildFax Housing Health Report
A sharp spike in maintenance activity sees direct impact from 2017 hurricane season
“BuildFax research revealed the annual rate of single-family housing authorizations picks up
pace, while the annual rate of single-family housing starts begins to slow in October.
Existing U.S. housing maintenance project volume and spend are still showing annual rate
increases at progressively larger margins. However, the pace of remodeling – a subset of
maintenance that includes renovations, alterations, and additions to a structure – has shown
for a third month in a row that it is leveling out after a few years of steep increases. Gains in
remodel and maintenance spend demonstrate continued improvements to the health of the
existing housing supply as homeowners look to maintain their properties instead of investing
in new homes.
Typically, we see dips in maintenance and remodeling activity immediately following a
natural disaster, as we saw in Florida following Hurricane Irma, which caused $10 billion in
insured losses. Irma’s impact on Florida in October 2017 directly contributed to last
month’s 5.06 percent increase in maintenance activity,. Hurricane Harvey is a different
story. Harris County's non-traditional permitting strategies spiked maintenance activity
shortly after landfall. This will likely impact remodeling and maintenance activity well into
2019 and we'll be tracking these trends in depth over time.” – Jonathan Kanarek, COO,
BuildFax
Source: https://www.buildfax.com/wp-content/uploads/2018/10/BuildFax-Housing-Health-Report_Sept-18.pdf; 10/15/18

Return TOC
Existing House Sales National Association of Realtors October 2018 sales: 5.220 thousand
* All sales data: SAAR
Source: https://fred.stlouisfed.org/series/EXHOSLUSM495S; 11/24/18
Existing
Sales*
Median
Price
Mean
Price
Month's
Supply
October 5,220,000 $255,400 $294,200 4.3
September 5,150,000 $256,900 $296,000 4.4
2017 5,500,000 $246,000 $287,600 3.9
M/M 1.4% -0.6% -0.6% -2.3%
Y/Y change -5.1% 3.8% 2.3% 10.3%

Return TOC
0
1,000
2,000
3,000
4,000
5,000
6,000
7,000
8,000
U.S. NE MW S W
SAAR; in thousands
Existing House Sales
Total NE 690,000 13.2%
Total MW 1,270,000 24.3%
Total S 2,150,000 41.2%
Total W 1,110,000 21.3%
Total Existing Sales5,220,000
Source: https://fred.stlouisfed.org/series/EXHOSLUSM495S; 11/24/18

Return TOC
First-Time Purchasers
Urban Institute
“In August 2018, the first time homebuyer share of purchase loans fell for both FHA and
conventional mortgages, reflecting seasonal factors. FHA, which has always been more
focused on first time homebuyers, remains near their record-high first time homebuyer share
with 82.7 percent in August 2018; the FHA share has traditionally hovered around 80
percent. The GSE share in August 2018 was 47.2 percent. The next table shows that based
on mortgages originated in August 2018, the average first-time homebuyer was more likely
than an average repeat buyer to take out a smaller loan and have a lower credit score and
higher LTV and DTI, thus requiring a higher interest rate.” – Laurie Goodman, et al., Co-
director, Housing Finance Policy Center
Sources: https://www.urban.org/research/publication/housing-finance-glance-monthly-chartbook-november-2018; 11/29/18

Return TOC
First-Time Purchasers
Sources: https://www.urban.org/research/publication/housing-finance-glance-monthly-chartbook-november-2018; 11/29/18
Comparison of First-Time and Repeat Homebuyers, GSE and FHA Originations

Return TOC
First-Time Purchasers
Sources: www.AEI.org/housing; 11/27/18
AEI, Center on Housing Markets and Finance
“The Agency First-time Buyer MRI (FBMRI) stood at 16.7% in August, up 0.1 ppt from a year earlier and
up 2.6 ppts. from 5 years ago. The Agency RBMRI is virtually unchanged since August 2013 (down 0.1
ppts.). The Agency FBMRI is 7.5 ppts higher than the Agency RBMRI, 0.5 ppt. wider than the gap a year
earlier. If the FBMRI trend continues, it will reach almost 20% by August 2022.” – Edward Pinto and
Tobias Peter; AEI, Center on Housing Markets and Finance
Note: Calculated for primary owner-occupied home purchase mortgages..
Source: AEI, Center on Housing Markets and Finance
Punchbowl 2: Eased Underwriting Standards Only Available to Agency First-time Buyers

Return TOC
First-Time Purchasers
Sources: www.AEI.org/housing; 11/27/18
AEI, Center on Housing Markets and Finance
“The housing market is largely segmented by price. FTBs, or entry level buyers, traditionally buy at
lower price points than RBs, or move-up buyers. Lately, FTBs have reduced the gap to RBs, an indication
that recipients used added buying power from looser lending to bid up FTB homes, ironically made more
expensive by FTB leverage, as RBs have had to make downward quality adjustments.” – Edward Pinto
and Tobias Peter; AEI, Center on Housing Markets and Finance
Note: Data are for primary owner occupied properties only.
Source: AEI, Center on Housing Markets and Finance
Market Segmentation: Median Sales Price for First-time and Repeat Buyers

Return TOC
First-Time Purchasers
AEI, Center on Housing Markets and Finance
“Agency FTB share for August stood at 57.8%, up 0.3 ppt from a year ago. FTB share has likely reached
saturation with tight inventory holding back buyers. An expanding economy and further credit easing will
help maintain current levels as they offset higher prices and higher mortgage rates.” – Edward Pinto and
Tobias Peter; AEI, Center on Housing Markets and Finance
Agency First-Time Buyer Purchase Loan Share
Sources: www.AEI.org/housing; 11/27/18
Note: First-time buyer volume not available before February 2013.
Source: AEI, Center on Housing Markets and Finance
Source: AEI, Center on Housing Markets and Finance
Return TOC
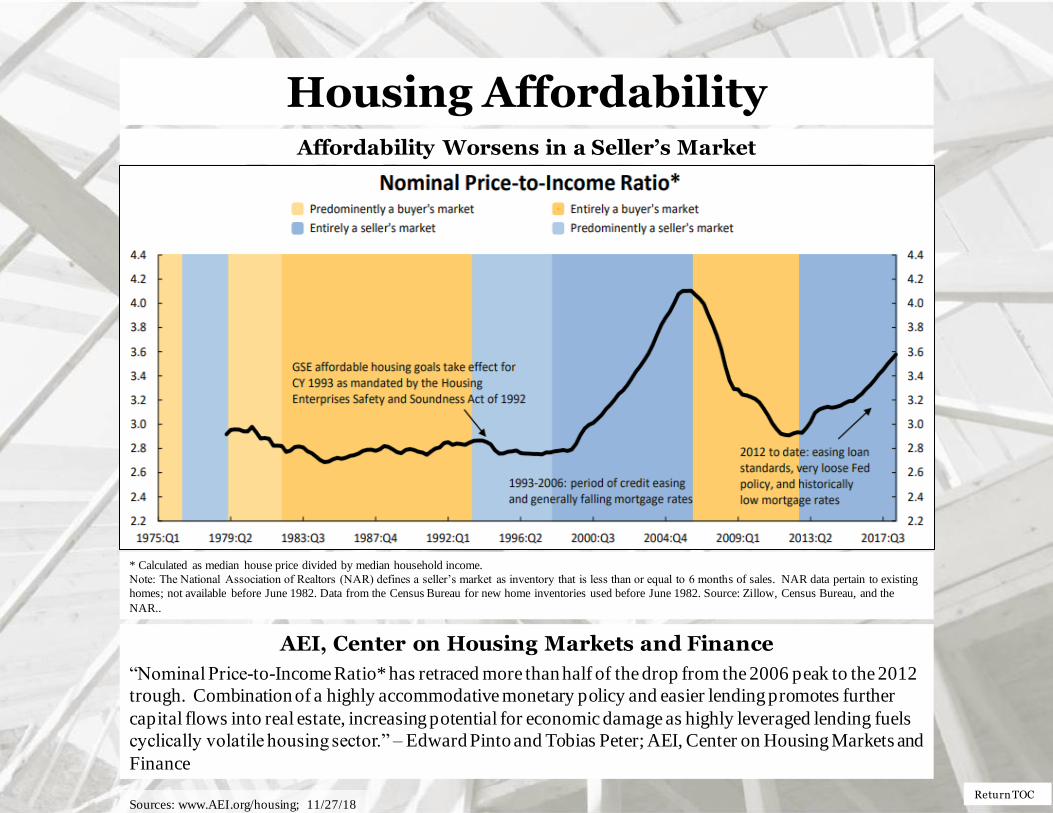
Housing Affordability Affordability Worsens in a Seller’s Market
AEI, Center on Housing Markets and Finance
“Nominal Price-to-Income Ratio* has retraced more than half of the drop from the 2006 peak to the 2012
trough. Combination of a highly accommodative monetary policy and easier lending promotes further
capital flows into real estate, increasing potential for economic damage as highly leveraged lending fuels
cyclically volatile housing sector.” – Edward Pinto and Tobias Peter; AEI, Center on Housing Markets and
Finance
* Calculated as median house price divided by median household income.
Note: The National Association of Realtors (NAR) defines a seller’s market as inventory that is less than or equal to 6 months of sales. NAR data pertain to existing
homes; not available before June 1982. Data from the Census Bureau for new home inventories used before June 1982. Source: Zillow, Census Bureau, and the
NAR..
Sources: www.AEI.org/housing; 11/27/18
Return TOC
Housing Affordability
Urban Institute
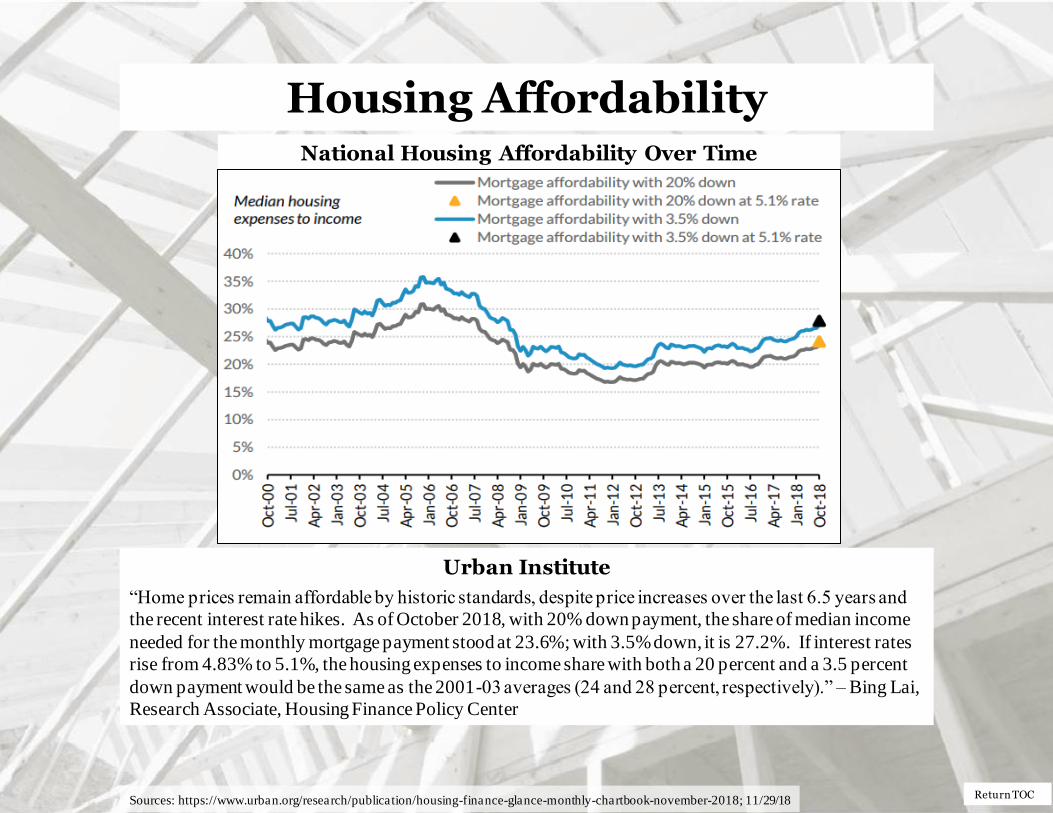
“Home prices remain affordable by historic standards, despite price increases over the last 6.5 years and
the recent interest rate hikes. As of October 2018, with 20% down payment, the share of median income
needed for the monthly mortgage payment stood at 23.6%; with 3.5% down, it is 27.2%. If interest rates
rise from 4.83% to 5.1%, the housing expenses to income share with both a 20 percent and a 3.5 percent
down payment would be the same as the 2001-03 averages (24 and 28 percent, respectively).” – Bing Lai,
Research Associate, Housing Finance Policy Center
National Housing Affordability Over Time
Sources: https://www.urban.org/research/publication/housing-finance-glance-monthly-chartbook-november-2018; 11/29/18

Return TOC
Mortgage Credit Availability
Source: https://www.mba.org/2018-press-releases/november/mortgage-credit-availability-increased-in-october; 12/6/18
Mortgage Credit Availability Increased in November
“Mortgage credit availability increased in November according to the Mortgage Credit
Availability Index (MCAI), a report from the Mortgage Bankers Association (MBA) which
analyzes data from Ellie Mae's AllRegs® Market Clarity® business information tool.
The MCAI increased 1.1 percent to 188.8 in November. A decline in the MCAI indicates
that lending standards are tightening, while increases in the index are indicative of loosening
credit. The index was benchmarked to 100 in March 2012. The Conventional MCAI
increased (2.4 percent) and the Government MCAI decreased (0.1 percent). Of the
component indices of the Conventional MCAI, the Jumbo MCAI increased by 1.1 percent,
while the Conforming MCAI increased by 4.0 percent.
The supply of credit continues to drift higher, driven once again by growth in the
conventional credit space, while credit supply in government loans was essentially
unchanged from the previous month. There were more mortgage programs offered with
high LTV and low credit score characteristics – likely attributable to rising demand from
first-time buyers. As seen in our weekly mortgage applications survey, average purchase
loan amounts have moved lower in the second half of the year, which also supports first-
timers' increased presence in the market.” – Joel Kan, Vice President of Economic and
Industry Forecasting, MBA
Return TOC
Summary In summary:
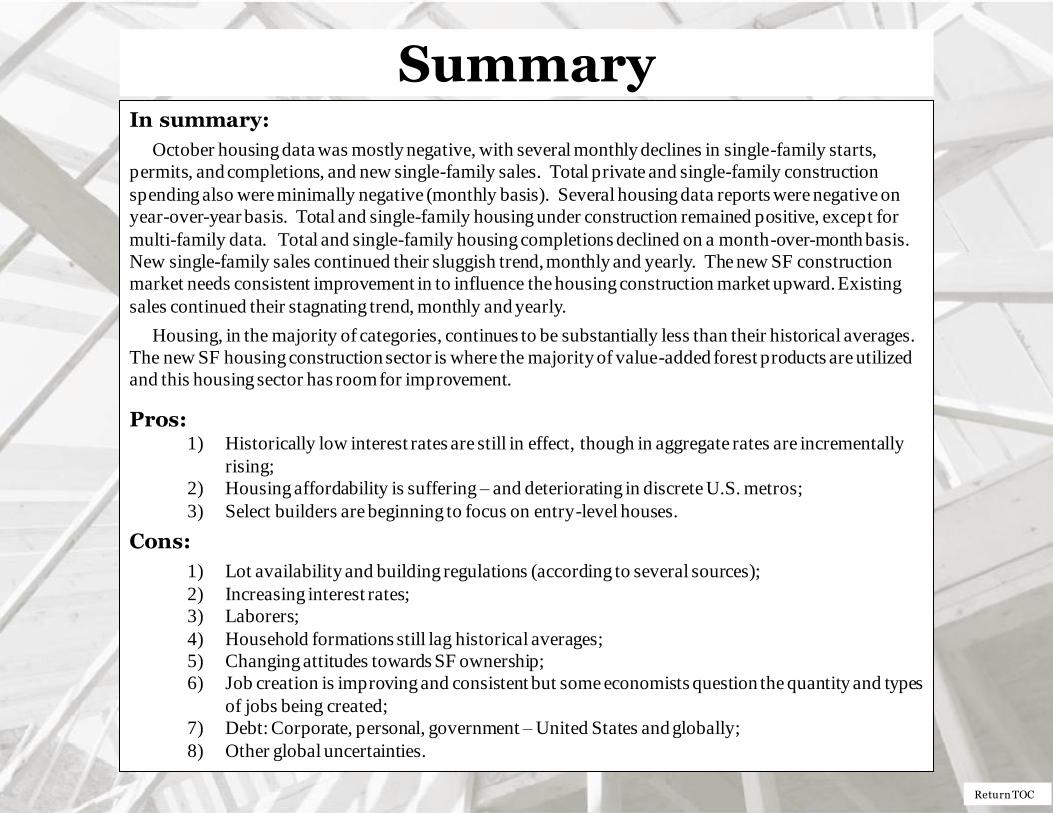
October housing data was mostly negative, with several monthly declines in single-family starts,
permits, and completions, and new single-family sales. Total private and single-family construction
spending also were minimally negative (monthly basis). Several housing data reports were negative on
year-over-year basis. Total and single-family housing under construction remained positive, except for
multi-family data. Total and single-family housing completions declined on a month-over-month basis.
New single-family sales continued their sluggish trend, monthly and yearly. The new SF construction
market needs consistent improvement in to influence the housing construction market upward. Existing
sales continued their stagnating trend, monthly and yearly.
Housing, in the majority of categories, continues to be substantially less than their historical averages.
The new SF housing construction sector is where the majority of value-added forest products are utilized
and this housing sector has room for improvement.
Pros: 1) Historically low interest rates are still in effect, though in aggregate rates are incrementally
rising;
2) Housing affordability is suffering – and deteriorating in discrete U.S. metros;
3) Select builders are beginning to focus on entry-level houses.
Cons:
1) Lot availability and building regulations (according to several sources);
2) Increasing interest rates;
3) Laborers;
4) Household formations still lag historical averages;
5) Changing attitudes towards SF ownership;
6) Job creation is improving and consistent but some economists question the quantity and types
of jobs being created;
7) Debt: Corporate, personal, government – United States and globally;
8) Other global uncertainties.

Return TOC
Virginia Tech Disclaimer
Disclaimer of Non-endorsement
Reference herein to any specific commercial products, process, or service by trade name, trademark, manufacturer, or
otherwise, does not constitute or imply its endorsement, recommendation, or favoring by Virginia Tech. The views and
opinions of authors expressed herein do not necessarily state or reflect those of Virginia Tech, and shall not be used for
advertising or product endorsement purposes.
Disclaimer of Liability
With respect to documents sent out or made available from this server, neither Virginia Tech nor any of its employees,
makes any warranty, expressed or implied, including the warranties of merchantability and fitness for a particular
purpose, or assumes any legal liability or responsibility for the accuracy, completeness, or usefulness of any information,
apparatus, product, or process disclosed, or represents that its use would not infringe privately owned rights.
Disclaimer for External Links
The appearance of external hyperlinks does not constitute endorsement by Virginia Tech of the linked web sites, or the
information, products or services contained therein. Unless otherwise specified, Virginia Tech does not exercise any
editorial control over the information you November find at these locations. All links are provided with the intent of
meeting the mission of Virginia Tech’s web site. Please let us know about existing external links you believe are
inappropriate and about specific additional external links you believe ought to be included.
Nondiscrimination Notice
Virginia Tech prohibits discrimination in all its programs and activities on the basis of race, color, national origin, age,
disability, and where applicable, sex, marital status, familial status, parental status, religion, sexual orientation, genetic
information, political beliefs, reprisal, or because all or a part of an individual's income is derived from any public
assistance program. Persons with disabilities who require alternative means for communication of program information
(Braille, large print, audiotape, etc.) should contact the author. Virginia Tech is an equal opportunity provider and
employer.

Return TOC
U.S. Department of Agriculture Disclaimer
Disclaimer of Non-endorsement
Reference herein to any specific commercial products, process, or service by trade name, trademark, manufacturer, or otherwis e,
does not necessarily constitute or imply its endorsement, recommendation, or favoring by the United States Government. The
views and opinions of authors expressed herein do not necessarily state or reflect those of the United States Government, and shall
not be used for advertising or product endorsement purposes.
Disclaimer of Liability
With respect to documents available from this server, neither the United States Government nor any of its employees, makes an y
warranty, express or implied, including the warranties of merchantability and fitness for a particular purpose, or assumes an y legal
liability or responsibility for the accuracy, completeness, or usefulness of any information, apparatus, product, or process
disclosed, or represents that its use would not infringe privately owned rights.
Disclaimer for External Links
The appearance of external hyperlinks does not constitute endorsement by the U.S. Department of Agriculture of the linked web
sites, or the information, products or services contained therein. Unless otherwise specified, the Department does not exerci se any
editorial control over the information you November find at these locations. All links are provided with the intent of meetin g the
mission of the Department and the Forest Service web site. Please let us know about existing external links you believe are
inappropriate and about specific additional external links you believe ought to be included.
Nondiscrimination Notice
The U.S. Department of Agriculture (USDA) prohibits discrimination in all its programs and activities on the basis of race, c olor,
national origin, age, disability, and where applicable, sex, marital status, familial status, parental status, religion, sexu al
orientation, genetic information, political beliefs, reprisal, or because all or a part of an individual's income is derived from any
public assistance program. (Not all prohibited bases apply to all programs.) Persons with disabilities who require alternativ e means
for communication of program information (Braille, large print, audiotape, etc.) should contact USDA's TARGET Center at
202.720.2600 (voice and TDD). To file a complaint of discrimination write to USDA, Director, Office of Civil Rights, 1400
Independence Avenue, S.W., Washington, D.C. 20250-9410 or call 800.795.3272 (voice) or 202.720.6382 (TDD). The USDA is an
equal opportunity provider and employer.