the west’s renewable energy future: a contribution by
TRANSCRIPT

The West’s Renewable Energy Future: A Contribution by National Grid

The West’s Renewable Energy Future A Contribution by National Grid July 2008
Page 1
THE WEST’S RENEWABLE ENERGY FUTURE
A CONTRIBUTION BY NATIONAL GRID
TABLE OF CONTENTS List of Acronyms ...................................................................................................................... 2 1 Executive Summary ............................................................................................... 3 2 Introduction ............................................................................................................. 5 3 Regional Environmental Goals and Needs ............................................................ 6 3.1 Western US Population Growth ............................................................................. 6 3.2 Electricity Sales Growth and Energy Efficiency ...................................................... 7 3.3 Western States RPS Based Renewable Energy Demand ..................................... 8 3.4 2020 GHG Emission Reduction Targets .............................................................. 10 3.5 Range of Renewable Energy Needs .................................................................... 12 3.6 Potential GHG Emission Costs ............................................................................ 13 3.7 Section Summary and Conclusions ..................................................................... 15 4 Potential Renewable Resource Solutions ............................................................ 16 4.1 DSW Region Renewable Resource Availability ................................................... 16 4.2 Wyoming Wind Resource Potential ...................................................................... 19 4.3 Section Summary and Conclusions ..................................................................... 24 5 Transmission Solutions ........................................................................................ 25 5.1 Background .......................................................................................................... 25 5.2 Transmission Solutions and Costs ....................................................................... 25 5.3 TWE Energy Transmission Costs ........................................................................ 26 5.4 Transmission Grid Operations .............................................................................. 27 5.5 Section Summary and Conclusions ..................................................................... 28 6 Economic and Other Objectives ........................................................................... 29 6.1 Summary of Resource Costs ............................................................................... 29 6.2 Backing Up Intermittent Energy Sources ............................................................. 31 6.3 Land and Water Use Considerations ................................................................... 31 6.4 Section Summary and Conclusions ..................................................................... 32 7 Summary and Conclusions .................................................................................. 33 Appendix A – Major DSW Electric Utilities ............................................................................. 36 Appendix B – RETI Phase 1A Technology Cost Summary ................................................... 37 Appendix C – Representative TWE Map ............................................................................... 38 Appendix D – Plant Assumptions ........................................................................................... 39 Appendix E – Overview of Economic Analysis Results ......................................................... 40 Appendix F – Natural Gas Price Assumptions ....................................................................... 41 Appendix G – Natural Gas Price Volatility ............................................................................. 42 Appendix H – GHG Cost Sensitivities .................................................................................... 43 Bibliography ........................................................................................................................... 44
The West’s Renewable Energy Future A Contribution by National Grid July 2008
Page 2
LIST OF ACRONYMS
AC Alternating Current APS Arizona Public Service Company AWEA American Wind Energy Association BAU Business-As-Usual CCS Carbon Capture and Storage CDEAC Clean and Diversified Energy Advisory Committee CEC California Energy Commission CO2e Carbon Dioxide Equivalent CPUC California Public Utilities Commission CSP Concentrating Solar Power DSM Demand Side Management DSW Desert Southwest (Arizona, Nevada and Southern California) EPA Environmental Protection Agency GHG Greenhouse Gas GWh Gigawatt Hour HVDC High Voltage Direct Current IOU Investor Owned Utility IRP Integrated Resource Plan ITC Investment Tax Credit KV Kilovolt LCOE Levelized Cost of Energy MMtCO2e Million Metric Tons of Carbon Dioxide Equivalent MW Megawatt MWh Megawatt Hour NREL National Renewable Energy Laboratory PTC Production Tax Credit PV Photovoltaic RETI Renewable Energy Transmission Initiative RMATS Rocky Mountain Area Transmission Study RPS Renewable Portfolio Standard TTP Tehachapi Transmission Project TWE TransWest Express TWRA Tehachapi Wind Resource Area WCI Western Climate Initiative WECC Western Electricity Coordinating Council WGA Western Governors’ Association WREZ Western Renewable Energy Zones

The West’s Renewable Energy Future A Contribution by National Grid July 2008
Page 3
1 EXECUTIVE SUMMARY
This Report has been prepared by National Grid and Energy Strategies, LLC. National Grid owns and operates significant electric transmission assets in the Northeast and the UK and is a leading contributor on electric transmission policy issues.i Energy Strategies is an energy consulting firm based in Salt Lake City, Utah that has supported National Grid’s development efforts in the West. This Report has been prepared to contribute to the current debate on the West’s renewable energy future, including the recently initiated Western Governors’ Association (WGA) sponsored Western Renewable Energy Zones (WREZ) project. It builds on National Renewable Energy Laboratory (NREL) databases of renewable energy resources and compliments the work already undertaken by the California state agencies and public utilities with Phase 1A of the Renewable Energy Transmission Initiative (RETI) study. Population in the West is growing rapidly which is, in turn, driving an increasing demand for energy in the region. In addition, many states have implemented Renewable Portfolio Standards (RPSs) requiring a certain percentage of electricity sales to come from renewable resources. This Report concludes that the US portion of the Western Electricity Coordinating Council (WECC) region will require 116,000 GWh per year of new renewable energy sources to meet 2020 RPS goals, requiring an investment in excess of $100 billion. The Desert Southwest (DSW) region (that, for the purpose of this Report, consists of Arizona, Nevada and Southern California) will require approximately 50 percent of this total, or about 55,000 GWh by 2020. The analysis in this Report also considers the impact of the Western Climate Initiative (WCI) and possible federal greenhouse gas (GHG) legislation on the electricity sector. While it is still not entirely clear how the WCI will affect the electricity sector, this Report concludes that it is credible to assume that the WCI could stimulate even greater demand for new renewable energy resources than RPSs. Similarly, there is some uncertainty about the design and extent of federal GHG legislation, but the prospect of such legislation has already sent market signals to Western utilities, many of which have begun to evaluate a cost associated with carbon dioxide emissions in their resource plans. This acts as a further stimulus to develop new renewable energy. Between RPS requirements and GHG reduction goals the demand for new renewable energy is considerable. The RETI report recognized wind and solar as two of the more viable, large scale renewable technologies. Based on NREL data, the potential of Arizona, California and Nevada’s concentrating solar power (CSP) and wind resources is 2.2 million GWh per year and 85,000 GWh per year, respectively. The potential of Wyoming’s Class 6 and 7 wind energy resources is 235,000 GWh per year and the potential of Wyoming’s Class 4 and above wind energy resources is 944,000 GWh per year. These potential energy figures are all highly theoretical and overlook various practical and cost issues. However, they serve to illustrate that these are the two jewels of the region’s resource potential and that they dwarf the potential capacity for all other renewable technologies and resources in the region combined. A further illustration of Wyoming’s wind potential is that NREL data shows that over 50 percent of the best quality (Class 6 and 7) wind resources in the continental US are located in Wyoming. This vast Wyoming resource is, however, remote from large load centers and new long-distance transmission is required to move this power to market. National Grid has been the lead developer of the TransWest Express (TWE) transmission project. TWE is a proposed 3,000 MW, $3B, 500 kV, HVDC transmission line that will run from wind rich southeast Wyoming to a terminal in southern Nevada from where the markets

The West’s Renewable Energy Future A Contribution by National Grid July 2008
Page 4
in Arizona, Nevada1 and Southern California can be accessed. The project is due to be operational by 2014. Because Wyoming wind is remote from the DSW markets this Report considers the costs and issues associated with building new interstate transmission (based on the TWE project) and compares the delivered cost of Wyoming wind against CSP and other generation solutions for the DSW. This Report concludes that:
• The best Wyoming wind is the lowest cost renewable energy solution for the DSW, with a delivered cost range of $72 to $101 per MWh (2008$).
• Wyoming wind, delivered to the DSW, is significantly less expensive than CSP resources. As a less mature industry the future cost of CSP in the DSW is harder to predict but is forecasted to remain a more expensive solution in the range of $143 to $220 per MWh (2008$).
• Under nearly all scenarios evaluated wind is competitive with natural gas fired generation as an energy resource.
The Report concludes, therefore, that Wyoming wind is the lowest cost, largest volume, renewable energy solution available for the DSW region. The Report further observes that wind generation requires no water and uses land more efficiently than other resource options. This makes Wyoming wind an obvious choice for the DSW markets that will need significant amounts of renewable energy in the coming years. However, the Report also explains that wind, as an intermittent resource, can place stresses on the operation of the grid. As the level of wind penetration in the WECC region increases additional studies on the operational and cost implications will be required. A project such as TWE has the ability to deliver 13,500 GWh per year of Wyoming wind. This is a significant addition (12 percent and 25 percent of US portion of WECC’s and the DSW’s 2020 RPS needs, respectively) given the scale of the need for renewables and the scale of Wyoming’s potential to satisfy that need. While TWE will substantially help meet RPS requirements, the large size of the need suggests that multiple large scale projects are required to meet the demands of the region. This Report concludes that the utilization of Wyoming’s wind resources provides an optimum solution in helping the West meet its renewable energy and GHG reduction targets. It also concludes that TWE could play a fundamental role in providing transmission capacity to deliver Wyoming’s wind resources to the DSW markets.
1 TWE will deliver energy to the Marketplace Hub in southern Nevada. Although, southern Nevada and northern Nevada are not currently linked, Sierra Pacific Resources is in the process of developing a 250 mile transmission line to link the two areas. The authors expect this transmission line to be completed before TWE, and thus TWE would be able to meet the needs of both northern and southern Nevada.

The West’s Renewable Energy Future A Contribution by National Grid July 2008
Page 5
2 INTRODUCTION
The West is the fastest growing region in the United States. It is expected to grow by more than 45 percent in population between 2000 and 2030. In addition, many Western states are adopting aggressive renewable energy standards and GHG reduction goals. These three factors combine to create a significant demand for investment in renewable energy infrastructure. Because most renewable generation is located far from load, a significant portion of this investment will need to be in new transmission capacity. Even before the Western states established ambitious climate change goals the limitations of the region’s transmission infrastructure were recognized by policymakers. In 2001, the WGA sponsored a report that concluded that significant transmission investment was required in the West. In 2004 regional Governors sponsored the Rocky Mountain Area Transmission Study (RMATS) and in 2006 the WGA sponsored the Clean and Diversified Energy Advisory Committee (CDEAC). These reports concluded that significant investment in transmission is required. This Report looks deeper into this transmission question with a focus on connecting remote renewable energy resources to major load centers. This Report has been co-authored by National Grid and Energy Strategies, LLC to compliment the work already undertaken by several California state agencies with Phase 1A of the RETI study. Together, these reports serve as a starting point for the broader regional review of renewable energy needs for the forthcoming WGA sponsored WREZ project. Many studies on renewable energy options invariably focus on transmission, as this has historically been the largest single barrier to delivering remote renewables. National Grid has been developing transmission in the West since 2004 and has led the development of the proposed TWE transmission project since 2006. The team is, therefore, familiar with the issues and costs associated with interstate transmission development in the West. This Report evaluates several energy solutions that could meet the needs of the DSW markets (Arizona, Nevada and Southern California). The economic scenarios developed in this Report compare the scale and cost of potential incremental resources in Wyoming to the scale and cost of potential incremental resources elsewhere in the region. Resource cost comparisons are provided using the levelized cost of energy (LCOE) per MWh in 2008$. This economic analysis is a preliminary screening analysis and is not intended to be a comprehensive production cost, market simulation, or detailed integration analysis. It should be noted, however, that National Grid commissioned PA Consulting Group to perform an independent production cost economic analysis of the DSW market to verify the conclusions for the TWE project. Their analysis reached similar conclusions as found within this Report. National Grid and Energy Strategies hope that readers view this Report as an important contribution to the debate on the West’s (and particularly the DSW’s) energy future. With comments or questions regarding this Report please contact: Rob McKenna – Energy Strategies [email protected] Caitlin Collins – Energy Strategies [email protected] David Smith – National Grid [email protected]

The West’s Renewable Energy Future A Contribution by National Grid July 2008
Page 6
3 REGIONAL ENVIRONMENTAL GOALS AND NEEDS This section examines the environmental goals and energy needs of the Western United States and the DSW region. This discussion specifically addresses:
• Regional population growth • Increases in energy demand • Regional RPS goals • Regional GHG reduction goals
3.1 WESTERN US POPULATION GROWTH According to the US Census Bureau, the Western United States is the fastest growing region in the United States and is expected to grow by more than 45 percent between 2000 and 2030. The West2 and the three state region of Nevada, Arizona and California will account for 35 percent and 25 percent, respectively, of the expected US population growth during that same time period (Figure 1).ii Nevada and Arizona are the two fastest growing states in the country and are expected to grow nearly 3 to 4 times faster than the national population growth rate. While California is not in the top ten states for expected growth rates, it accounts for over 15 percent of the expected absolute US population growth with more than 12.5 million new residents expected by 2030 (Table 1). iii
Figure 1
5.07.4
52.4
35.2
7.6 9.5
42.9 45.8
0.0
10.0
20.0
30.0
40.0
50.0
60.0
Northeast Midwest South West
Percent Distribution of Population Growth and Percent Growth by Region of the United States, 2000 to 2030
Distribution of Growth% Growth
Source: Energy Strategies, adapted from U.S. Census Bureau, Population Division, Interim State Population Projections, 2005
2 The US Census Bureau’s definition of the West differs from this Report’s definition of the West or the Western United States, in that the US Census Bureau’s definition of the West includes Alaska and Hawaii, while this Report’s does not. For the US Census Bureau’s definition of US regions see: http://www.census.gov/const/regionmap.pdf.

The West’s Renewable Energy Future A Contribution by National Grid July 2008
Page 7
Table 1 - US Census Bureau, Interim Population Projections, 2005
State2000 Census Population
2030 Projected Population
Change: 2000 to 2030 Number
Change: 2000 to 2030 Percent
Change: 2000 to 2030 Rank in
Percent Change
Nevada 1,998,257 4,282,102 2,283,845 114% 1Arizona 5,130,632 10,712,397 5,581,765 109% 2California 33,871,648 46,444,861 12,573,213 37% 13
United States 281,421,906 363,584,435 82,162,529 29%
Total Region (AZ, CA, NV) 41,000,537 61,439,360 20,438,823 50%
Regional as a % of Total US 25%
3.2 ELECTRICITY SALES GROWTH AND ENERGY EFFICIENCY The primary utilities serving the three state region of Arizona, California and Nevada are highlighted in Appendix A. The utilities identified in Appendix A represent 87 percent of electricity sales in this three state region.iv According to forecasts compiled from these utilities and various state regulatory commissions, Arizona, California and Nevada will experience the following average annual growth rates in energy sales between 2007 and 2016, compared to actual growth rates experienced between 2000 and 2006 (Table 2). While growth rates in California and Nevada are expected to decrease, the overall demand for energy is still expected to grow substantially (Figure 2).
Table 2
Historic & Forecasted Average Annual Sales Growth AZ CA NV
2000‐2006 3.5% 1.7% 4.0% 2007‐2016 4.0% 1.2% 2.7%
In terms of annual electricity sales this would mean that the three state region is forecasted to grow from 370,000 GWh in 2006 to nearly 570,000 GWh in 2030 (Figure 2). This implies that per capita consumption in the region will increase from about 8,200 kWh to nearly 9,300 kWh by 2030.
Figure 2
0
100,000
200,000
300,000
400,000
500,000
600,000
2006 2010 2015 2020 2025 2030
Electricity Load
(GWh)
NV
AZ
CA
Source: Energy Strategies adapted from state regulatory agency and utility forecasts

The West’s Renewable Energy Future A Contribution by National Grid July 2008
Page 8
Energy efficiency is the most effective way to combat climate change and affect forecasted increases in energy use. A recent analysis, sponsored in part by National Grid and undertaken by McKinsey & Company, illustrated that energy efficiency initiatives are among the most economic options for reducing GHG emissions.v Each of the states and utilities represented in Figure 2 has demand side management (DSM) and energy efficiency programs which are captured within their energy forecasts. These programs are integral to helping utilities meet the rising demand for energy. In fact, in California’s long-term planning process the first priority is given to energy efficiency resources.vi Energy efficiency is factored into the forecast in Figure 2. It is possible, however, that energy efficiency measures may have a greater impact on demand than these forecasts predict, or that growth in the region may be less than forecasted. This report tests these possibilities by evaluating a 15 percent decrease in forecasted energy use is realized in 2020 and continues on through 2030. The result is a decrease in forecasted energy sales of 85,000 GWh in 2030 compared to Figure 2. This scenario demonstrates that even with greater than expected improvements in energy efficiency and/or slower than forecasted growth there is still a significant demand for new energy resources.
3.3 WESTERN STATES RPS BASED RENEWABLE ENERGY DEMAND Figure 3
Figure 3vii identifies states in the West that have established state level RPSs. California has led the way with a requirement that 20 percent of electricity sales come from renewable energy sources by 2010. This equates to more than 55,000 GWh of renewable energy per year by 2010, nearly 30,000 GWh more than is currently produced in California. California also has a more aggressive goal of 33 percent by 2020 which was recognized in the Energy Action Plan II published in 2005.viii While this goal is not
legislated, the 2008 Energy Action Plan Update indicated that the regulators “are committed to working together to evaluate the potential for making 33 percent of the power delivered in California renewable by 2020.”ix Furthermore, in June 2008, a privately backed citizens’ initiative to target a 50 percent RPS by 2025 was certified and will be on the ballot for voters to accept or reject in November 2008. California’s more aggressive 33 percent goal combined with other mandated RPS requirements and the forecasted regional sales growth will require renewable energy sales for the US portion of the WECC region of close to 150,000 GWh by 2020. The incremental renewable energy required, after accounting for existing renewable resources, will exceed 116,000 GWh (Table 3). At the 33 percent goal, California would comprise 70 percent of the US WECC-wide RPS need in 2020. The forecasted need does not include Idaho, Utah and Wyoming, states that have not yet established mandatory standards. Utah has, however,
Renewable Portfolio Standards in the West
UT 20% by 2025*
NM 20% by 2020 (IOUs)10% by 2020 (co-ops)
AZ 15% by 2025
CO 20% by 2020 (IOUs)10% by 2020 (co-ops and large munis)
WY
MT 15% by 2015
ID
NV 20% by 2015
CA 20% by 2010
OR 25% by 2025 (large utilities)5-10% by 2025 (smaller utilities)
WA 15% by 2020
*Utah’s requirement is for 20% economic “clean energy” by 2025Minimumsolar or customer sited generation requirement
Source: Energy Strategies adapted from information from DSIRE, www.dsire.org
State RPS
State Clean Energy Standard

The West’s Renewable Energy Future A Contribution by National Grid July 2008
Page 9
established a “clean energy goal” of 20 percent by 2025, requiring utilities to acquire cost-effective clean energy to meet the goal. Incorporating Utah’s clean energy goal increases the renewable energy required in the WECC region by almost 9,000 GWh in 2025. California’s renewable energy demands drive renewable development in the West. Figure 4 compares California’s installed renewable resources to the state’s renewable energy goals. California needs to add significant amounts of renewable resources regardless of the ultimate level mandated.
Figure 4
Requirements for incremental renewable capacity for the US portion of the WECC region, assuming an average renewable capacity factorx of 30 percent, will be nearly 45,000 MW by 2020. Assuming 80 percent of this capacity is wind and 20 percent is utility scale solar, the capital investment necessary to meet the RPS requirements in 2020 ranges from $100 to $130 billion or $8 to $11 billion per year.3 The DSW will account for nearly 50 percent of the WECC region’s 2020 incremental RPS requirement, requiring nearly 55,000 GWh of incremental renewable energy production by 2020 (Table 3). The US as a whole needs to triple renewable energy generation under current RPS requirements, while the US portion of WECC will need to increase renewable energy generation nearly fivefold in order to meet current RPS obligations.
3 Capital costs range from $3,800/kW to $4,800/kW (2008$) for CSP projects and from $1,900 to $2,400 (2008$) for wind, per the California RETI Analysis Phase 1A Report.
The West’s Renewable Energy Future A Contribution by National Grid July 2008
Page 10
LocationRPS as a Percent of Energy Sales (2020)
Renewable Energy Sales Required to Meet
RPS (2020 GWh)
Existing Renewable Generation (2006
GWh)
Incremental Renewable Energy Required (2020
GWh)
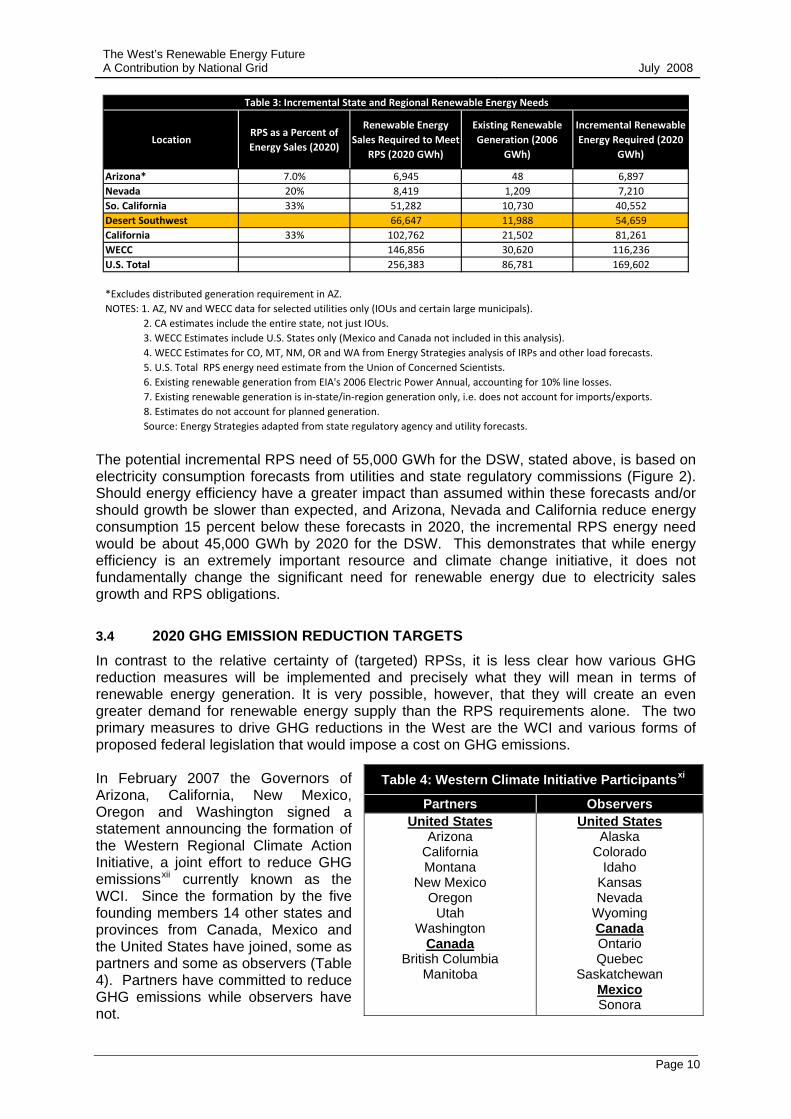
Arizona* 7.0% 6,945 48 6,897Nevada 20% 8,419 1,209 7,210So. California 33% 51,282 10,730 40,552Desert Southwest 66,647 11,988 54,659California 33% 102,762 21,502 81,261WECC 146,856 30,620 116,236U.S. Total 256,383 86,781 169,602
*Excludes distributed generation requirement in AZ.NOTES: 1. AZ, NV and WECC data for selected utilities only (IOUs and certain large municipals).
2. CA estimates include the entire state, not just IOUs.3. WECC Estimates include U.S. States only (Mexico and Canada not included in this analysis).4. WECC Estimates for CO, MT, NM, OR and WA from Energy Strategies analysis of IRPs and other load forecasts.5. U.S. Total RPS energy need estimate from the Union of Concerned Scientists.6. Existing renewable generation from EIA's 2006 Electric Power Annual, accounting for 10% line losses.
8. Estimates do not account for planned generation.Source: Energy Strategies adapted from state regulatory agency and utility forecasts.
Table 3: Incremental State and Regional Renewable Energy Needs
7. Existing renewable generation is in‐state/in‐region generation only, i.e. does not account for imports/exports.
The potential incremental RPS need of 55,000 GWh for the DSW, stated above, is based on electricity consumption forecasts from utilities and state regulatory commissions (Figure 2). Should energy efficiency have a greater impact than assumed within these forecasts and/or should growth be slower than expected, and Arizona, Nevada and California reduce energy consumption 15 percent below these forecasts in 2020, the incremental RPS energy need would be about 45,000 GWh by 2020 for the DSW. This demonstrates that while energy efficiency is an extremely important resource and climate change initiative, it does not fundamentally change the significant need for renewable energy due to electricity sales growth and RPS obligations.
3.4 2020 GHG EMISSION REDUCTION TARGETS In contrast to the relative certainty of (targeted) RPSs, it is less clear how various GHG reduction measures will be implemented and precisely what they will mean in terms of renewable energy generation. It is very possible, however, that they will create an even greater demand for renewable energy supply than the RPS requirements alone. The two primary measures to drive GHG reductions in the West are the WCI and various forms of proposed federal legislation that would impose a cost on GHG emissions. In February 2007 the Governors of Arizona, California, New Mexico, Oregon and Washington signed a statement announcing the formation of the Western Regional Climate Action Initiative, a joint effort to reduce GHG emissionsxii currently known as the WCI. Since the formation by the five founding members 14 other states and provinces from Canada, Mexico and the United States have joined, some as partners and some as observers (Table 4). Partners have committed to reduce GHG emissions while observers have not.
Table 4: Western Climate Initiative Participantsxi
Partners Observers United States
Arizona California Montana
New Mexico Oregon
Utah Washington
Canada British Columbia
Manitoba
United States Alaska
Colorado Idaho
Kansas Nevada
Wyoming Canada Ontario Quebec
Saskatchewan Mexico Sonora

The West’s Renewable Energy Future A Contribution by National Grid July 2008
Page 11
In August of 2007 the WCI announced a regional GHG reduction goal of 15 percent below 2005 GHG emission levels by 2020. The 2020 goal is based on the aggregation of each WCI partner’s GHG emission goal. The following chart summarizes each state/provincial goal (Table 5). Table 6 includes the relative GHG reduction targets based on a 2020 business as usual (BAU) case for each partner.
Table 6: 2020 State/Provincial Goals Compared to Historic and Forecasted GHG Emissions (Estimates as of July 2007)xiv
2020 Goal Relative to
1990
2020 Goal Relative to
2000
2020 Goal Relative to
2005xv
2020 Goal Relative to 2020 BAU
Absolute Reductions from BAU
(MMtCO2e)xvi
1990-2020 BAU
Growth
Arizona 35% 0% -11% -45% 72 144%
British Columbia -9% -27% -30% -46% 40 69%
California 0% -10% -14% -28% 173 40%
Manitoba -6% -16% -17% TBD TBD TBD
New Mexico 14% -10% -14% -31% 28 65%
Oregon -10% -29% -32% -44% 40 61%
Utah TBD TBD TBD TBD TBD TBD
Washington 0% -16% -11% -28% 33 40%
Total 2% -12% -16% -33% 383 54%
Figure 5 Figure 5 illustrates the 2020 goal relative to the business-as-usual cases developed by the WCI. The WCI accounts for electricity sector emissions on an in-state consumption basis rather than an in-state generation basis. Electricity consumption related emissions accounted for 38 percentxvii and 25 percentxviii of the total Arizona and California GHG emissions in 2006, respectively. While Nevada has
Table 5: State and Provincial Goals for GHG Reductionsxiii
State/Province Short Term (2010-12) Medium Term (2020) Long Term (2040-50)
Arizona not established 2000 levels by 2020 50% below 2000 by 2040
British Columbia not established 33% below 2007 by 2020 not established
California 2000 levels by 2010 1990 levels by 2020 80% below 1990 by 2050
Manitoba 6% below 1990 not established not established
New Mexico 2000 levels by 2012 10% below 2000 by 2020 75% below 2000 by 2050
Oregon arrest emissions growth 10% below 1990 by 2020 >75% below 1990 by 2050
Utah 2005 levels by 2020
Washington not established 1990 levels by 2020 50% below 1990 by 2050
Source: Western Climate Initiative, Statement of Regional Goal, August 22, 2007

The West’s Renewable Energy Future A Contribution by National Grid July 2008
Page 12
not adopted a GHG reduction goal (and is therefore excluded from the tables above), for purposes of this Report it has been assumed that Nevada will adopt the WCI GHG reduction goal. Nevada’s electricity sector emissions accounted for 40 percentxix of statewide GHG emissions in 2006. Assuming that the electricity sector will be expected to reduce GHG emissions to meet each state’s goal on a proportionate basis (i.e. to historic level according to each state’s goal), states in the DSW would target at least the following GHG emission reductions from the electricity sector by 2020 (Table 7).
Arizona So. CA Nevada DSW Total2020 Target GHG Reductions from BAU (MMtCO2e) 72 88 28 188Electricity Sector Reductions Necessary to Meet Target (MMtCO2e) 38 11 15 64Projected Average Emission Rates (MtCO2e/MWh) 0.5562 0.4434 0.7071Renewable Energy (RE) Required to Meet Electricty Sector GHG Mitigation Target (GWh)Case 1: 100% Mitigation from RE 67,785 25,505 21,778 115,068Case 2: 50% Mitigation from RE, 50% from Nuclear and CCS 33,893 12,753 10,889 57,534
Table 7: GHG Emission Reduction Targets by State from 2020 BAU Case
According to the methodology of this Report, California’s goal to reduce GHG emissions to 1990 levels by 2020 will require a 22 million metric ton carbon dioxide equivalent (MMtCO2e) reduction from emissions created as a result of electricity consumed in the state. It should be noted that the electricity sector may be required to reduce emissions beyond its proportionate share. For example, the Climate Change Draft Scoping Plan, recently released by the California Air Resource Board, requires the electricity sector to reduce GHG emissions by much more than 22 MMtCO2e through both increased deployment of renewables and increased energy efficiency. The same Report expects the implementation of the 33 percent RPS to reduce GHG emissions by about 21.2 MMtCO2e in 2020. xx The WCI partners are planning to announce a “regional market-based multi-sector mechanism, such as a load-based cap and trade program, to help achieve the GHG reduction goal”xxi by August 2008. The WCI partners have adopted The Climate Registry’s methodology as the accepted GHG accounting methodology. Each WCI partner will be required to provide an update to the other partners every two years on GHG reduction progress to “ensure that actions are underway at levels consistent with full achievement of the 2020 goal.”xxii One way for a WCI partner to achieve the GHG reduction goal for emissions from electricity use is to use renewable energy to offset other generation sources. If the WCI used 100 percent renewable energy to meet GHG reduction goals for the electricity sector the DSW would need nearly 115,000 GWh of incremental renewable energy (Figure 6). If other options were used to mitigate GHG reduction goals, e.g. nuclear generation or carbon capture and storage (CCS), and only 50 percent of the GHG target was met by the use of renewable energy the DSW would need nearly 58,000 GWh of incremental renewable energy (Figure 6). If the entire US portion of the WCI used 100 percent renewable energy to offset GHG emissions from electricity use the region would need an estimated 167,000 GWh of additional renewable energy by 2020.
3.5 RANGE OF RENEWABLE ENERGY NEEDS The above sited factors, i.e. RPS requirements and GHG targets, will be the major factors driving the implementation of renewable energy in the DSW and the West. If the impact of energy efficiency measures is greater than expected and/or growth is slower than expected and the DSW reduces energy use 15 percent below forecasted levels in 2020 (as described in Section 3.2) it would reduce the RPS requirements for that region from 55,000 GWh to about 45,000 GWh, illustrating that even with significant gains in energy efficiency and/or slower than expected growth the need to access new renewable resources remains.
The West’s Renewable Energy Future A Contribution by National Grid July 2008
Page 13
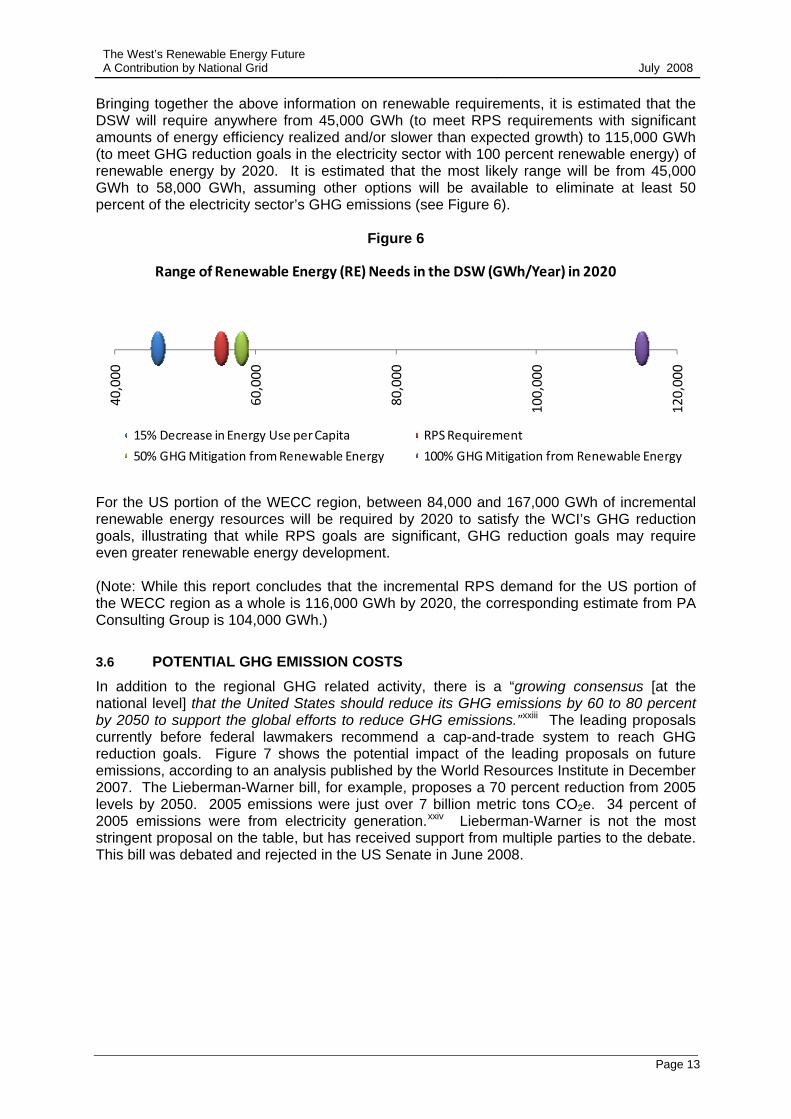
Bringing together the above information on renewable requirements, it is estimated that the DSW will require anywhere from 45,000 GWh (to meet RPS requirements with significant amounts of energy efficiency realized and/or slower than expected growth) to 115,000 GWh (to meet GHG reduction goals in the electricity sector with 100 percent renewable energy) of renewable energy by 2020. It is estimated that the most likely range will be from 45,000 GWh to 58,000 GWh, assuming other options will be available to eliminate at least 50 percent of the electricity sector’s GHG emissions (see Figure 6).
Figure 6
40,000
60,000
80,000
100,000
120,000
Range of Renewable Energy (RE) Needs in the DSW (GWh/Year) in 2020
15% Decrease in Energy Use per Capita RPS Requirement
50% GHG Mitigation from Renewable Energy 100% GHG Mitigation from Renewable Energy
For the US portion of the WECC region, between 84,000 and 167,000 GWh of incremental renewable energy resources will be required by 2020 to satisfy the WCI’s GHG reduction goals, illustrating that while RPS goals are significant, GHG reduction goals may require even greater renewable energy development. (Note: While this report concludes that the incremental RPS demand for the US portion of the WECC region as a whole is 116,000 GWh by 2020, the corresponding estimate from PA Consulting Group is 104,000 GWh.)
3.6 POTENTIAL GHG EMISSION COSTS In addition to the regional GHG related activity, there is a “growing consensus [at the national level] that the United States should reduce its GHG emissions by 60 to 80 percent by 2050 to support the global efforts to reduce GHG emissions.”xxiii The leading proposals currently before federal lawmakers recommend a cap-and-trade system to reach GHG reduction goals. Figure 7 shows the potential impact of the leading proposals on future emissions, according to an analysis published by the World Resources Institute in December 2007. The Lieberman-Warner bill, for example, proposes a 70 percent reduction from 2005 levels by 2050. 2005 emissions were just over 7 billion metric tons CO2e. 34 percent of 2005 emissions were from electricity generation.xxiv Lieberman-Warner is not the most stringent proposal on the table, but has received support from multiple parties to the debate. This bill was debated and rejected in the US Senate in June 2008.

The West’s Renewable Energy Future A Contribution by National Grid July 2008
Page 14
Figure 7xxv
There is a great deal of uncertainty surrounding the impact of GHG legislation on the cost of carbon emissions. The Environmental Protection Agency (EPA) has published various reports identifying potential costs of GHG allowances under the different legislative scenarios. Figure 8 highlights some of the scenarios evaluated in this analysis. The low end estimates cluster around $15 (2005$/tCO2e) in 2012 growing to $55 (2005$/tCO2e) in 2050, while the high end estimates cluster around $45 (2005$/tCO2e) in 2012 growing to more than $200 (2005$/tCO2e) by 2050, with an extreme case under the Lieberman-Warner bill where prices would reach more than $400 (2005$/tCO2e) by 2050 if no offsets were allowed.xxvi,xxvii,xxviii
Figure 8
$0
$50
$100
$150
$200
$250
$300
2015 2020 2025 2030 2035 2040
Sample GHG Allowance Price Comparisons (2005 $/tCO2e)
S. 2191, EPA, ADAGE
S. 2191 w/ Unlimited Offsets, EPA, IGEM
S. 2191 w/ No Offsets, EPA, IGEM
S. 2191 w/ Constrained Nuclear, Biomass and CCS, EPA, ADAGES. 1766, EPA, ADAGE
S. 1766, No Technology Accelerator Payment (TAP), EPA, ADAGES.280 Senate Scenario, EPA, ADAGE
Scenario, Source, ModelHigh Carbon Cost
Low Carbon Cost
Source: Energy Strategies adapted from EPA cost estimates Although GHG regulations are not currently in place, many utilities in the West include a “cost estimate” for carbon dioxide emissions in their Integrated Resource Plans (IRPs) as they evaluate future resource alternatives. In California, for example, pursuant to California Public Utilities Commission (CPUC) Decision 05-04-024 utilities use a GHG adder (cost) of $8.00 per ton of CO2 for energy delivered in 2004, with a five percent per year escalation factor. This equates to $17.46/ton by 2020. PacifiCorp, in its 2007 IRP, uses a medium case inflation adjusted CO2 allowance price of $8/ton (2008$).xxix Other utilities in the West (including, Idaho Power, Avista, Northwestern, Portland General Electric, Puget Sound

The West’s Renewable Energy Future A Contribution by National Grid July 2008
Page 15
Energy, and Seattle City Light)xxx use similar figures for the cost of carbon dioxide, although some utilities fail to account for a carbon dioxide price in the planning process. As shown in Figure 8 the national estimates for GHG allowance prices, in most cases, are much higher than the prices assumed by utilities in the West. This wide range of estimates illustrate that the full legislative and regulatory impact on the cost of producing electricity with fossil fuels is unknown. Therefore, energy resource options that allow for the flexibility to choose from a portfolio of reasonably priced, low or no GHG emitting renewable resources become an increasingly attractive economic option.
3.7 SECTION SUMMARY AND CONCLUSIONS
• The population of the three state region of Arizona, Nevada and California is forecasted to grow by 45 percent between 2000 and 2030. This represents 25 percent of total US population growth for this period.
• Despite improvements in energy efficiency and DSM, population growth and other factors are forecasted to drive an increase in electricity sales for this three state region from 370,000 GWh to 570,000 GWh from 2006 to 2030.
• Led by California, many states in the West have committed to challenging RPS goals that will require incremental development of 116,000 GWh of renewable energy resources by 2020. The equivalent figure for the DSW is 55,000 GWh by 2020.
• In order to test the possibility that greater than forecasted gains in energy efficiency are realized and/or growth is slower than expected this Report has evaluated the RPS requirement if the region’s incremental energy need was reduced to 113,000 GWh. The incremental RPS requirement would still be close to 45,000 GWh in 2020.
• To meet these targets, over 9,600 MWh of renewable generation needs to be added every year from 2009 to 2020. Total capital investment in the US portion of WECC is projected to be greater than $100B and annual capital investment is estimated to be between $8 and $11B. To meet the RPS goals of the DSW about 4,500 MWh of renewable generation needs to be added every year from 2009 to 2020. Annual capital investment is estimated to be between $4 and $6 billion to develop these resources in the DSW.
• While less targeted and not yet fully interpreted, GHG reduction goals will likely have an even greater impact on the region than RPS requirements. If 100 percent of the electricity sector’s proportionate share of GHG reduction goals were to be met by renewables, the DSW’s 2020 need for renewables becomes 115,000 GWh per year and the US portion of the WCI would require 167,000 GWh. Based on the assumption that 50 percent of the electricity sector’s proportionate share of GHG reductions is met by nuclear, CCS, or other non-renewable GHG reducing options this will require 58,000 GWh of new renewables by 2020 for the DSW or 84,000 GWh for the broader region.
• As a reference, the current electricity consumption for the City of Los Angeles is 24,000 GWh (according to Los Angeles Department of Water and Power’s 2006 electricity sales). Therefore, the forecasted need for additional renewable energy across the West, driven by RPSs alone, is approximately five times current consumption in the city.

The West’s Renewable Energy Future A Contribution by National Grid July 2008
Page 16
4 POTENTIAL RENEWABLE RESOURCE SOLUTIONS This section of the Report reviews the scale of potential renewable resource options available to help meet the environmental and energy objectives of the DSW region.
4.1 DSW REGION RENEWABLE RESOURCE AVAILABILITY
The states of Arizona, Nevada and California need significant renewable resources to meet RPS requirements and GHG reduction goals (Section 3 for details). Figure 9 provides the context of each state’s current resource mix. Currently only seven percent of the generation within the three state region is from renewable sources, of which nearly 95 percent is produced in California. California currently imports 27 percent of the electricity used in the state, of which only one percent is from renewables. xxxi
Figure 9
Utilities across the DSW are aggressively trying to acquire new renewable resources. The RPS Procurement Status Report published in January 2008 by the CPUC, illustrates that California investor owned utilities (IOUs) have a significant number of contracts and plans to meet their growing RPS needs. While the report shows promising progress towards meeting RPS goals the CPUC report also states that:
While the RPS procurement process has resulted in dozens of contracts for new renewable capacity, project development continues to lag….The slow pace of project development despite strong solicitations underscores the fact that projects face a number of challenges beyond simply getting a contract with an IOU to coming online. These barriers include, but are not limited to, transmission, permitting challenges and developer inexperience. The CPUC is working with the range of stakeholders, market participants, and public entities that play a role in bringing renewable resources online to ensure that RPS projects remain on track.xxxii

The West’s Renewable Energy Future A Contribution by National Grid July 2008
Page 17
California currently has 220 MW of wind, geothermal, biomass and pumped storage projects under construction.xxxiii The Tehachapi Transmission Project (TTP) is a $1.8 billion project sponsored by Southern California Edison to connect the Tehachapi Wind Resource Area (TWRA) to the transmission network. TWRA is viewed as “California’s largest wind resource area.”xxxiv Utilities in California are also investigating long-distance transmission lines to British Columbia, Canada to access potential large scale renewable energy developments. Arizona and Nevada utilities have similarly been pursuing renewable energy resources. Arizona Public Service (APS) is part of a consortium that recently issued a Request for Proposals seeking 250 MW of CSP capacity.xxxv APS also recently signed a power purchase contract for the output of a 280 MW CSP facility.xxxvi Nevada Power has a power purchase agreement to purchase 64 MW from a solar thermal project. There are a number of small scale geothermal projects being developed in Nevada with an estimated 500 MW currently securing a PPA, final permits or under construct xxxviiion. The DSW states are mostly pursuing in-state renewable resources but it may be necessary for utilities and policymakers to look outside the DSW region to acquire the scale of renewable resources required to meet RPS and GHG reduction objectives cost effectively. The recently published, California RETI Phase 1A Final Reportxxxviii is an excellent step towards a better understanding of the potential renewable resources available to serve the California market. Phase 1A evaluated the renewable energy potential of Arizona, Nevada, California, Oregon, Washington, British Columbia, Canada and Baja, Mexico. Future RETI steps include the prioritization of renewable energy regions and development of transmission plans to access those regions. Figure 10 and 11 below illustrate the estimated renewable resource potential available in the RETI study region for the resources that have been recommended for further consideration in Phase 1B of the RETI process. Figure 10 focuses on non-solar renewable technologies and Figure 11 on estimated CSP resources available in each state. In addition to the resources captured in these two figures there is an order of magnitude larger amount of potential solar photovoltaic (PV) energy identified in the RETI report. Solar PV is unique among renewable energy resources in that small scale distributed PV systems have similar economics to large scale PV systems. With its relatively higher costs, deployment will mostly be on a distributed basis and of a scale that should not materially impact the analysis within this Report. It should be noted, however, that federal legislation was proposed in July of 2008, by Senator Bernie Sanders and others, which would promote the creation of 10 million solar PV systems by 2018.xxxix If PV systems were ever implemented on this scale this would have an impact on the underlying assumptions of this Report. With the significantly lower costs of wind energy, however, (for those states that have access to resources of the quality found in Wyoming), the more likely policy approach would be to implement solar PV systems in such a way that does not discourage development of cost effective utility scale wind energy resources. Both the RETI Phase 1A Report’s review of potential resources and this Report’s review of Wyoming’s wind resources are derived from various NREL databases. NREL essentially uses “desk-top” screening criteria in identifying land suitable for development. In practice, a more vigorous screening would be required to explore the limits of potential developable land. For instance, for wind and solar resources NREL’s exclusions include urban areas, national parks, wetlands and land with a slope greater than 20 percent and 1 percent, respectively. Factors NREL has not addressed include cost, transmission availability, resource accessibility and other environmental considerations. Phase 1B of the RETI analysis “will use a more detailed set of screening criteria” in evaluating developable resources.xl

The West’s Renewable Energy Future A Contribution by National Grid July 2008
Page 18
Figure 10
Figure 11

The West’s Renewable Energy Future A Contribution by National Grid July 2008
Page 19
The RETI Phase 1A Report tabulated potential renewable resources in the study region and found that wind and solar have the largest scale. The McKinsey report (Reducing US GHG Emissions: How Much at What Cost?) also identified wind and solar as the primary renewable resources to help reduce GHG emissions. Wind and solar are the two resources that have the potential to make a major impact on the needs of California. Each has its own unique development issues, transmission needs, availability and costs. Figure 12 from the RETI Phase 1A Report illustrates, that the cost of CSP, or solar thermal, resources are significantly higher than other renewable resources evaluated in the RETI report. Appendix B, also from the RETI report, provides additional detail on the underlying cost assumptions used to develop Figure 12. It is important to note, however, that while wind has become a relatively mature technology, with relatively predictable costs, CSP is a relatively young technology. Therefore, estimated CSP costs may not be as certain as estimated wind costs. As CSP technology evolves and economies-of-scale are realized these advances may lead to reductions in CSP costs over the next 10 to 20 years.
Figure 12xli
In order to meet renewable resource objectives, policymakers will need to consider numerous factors including relative costs, location, quality, scale and other environmental factors. Policymakers have recognized the potential of remote renewable resources in the West and that significant transmission investment is necessary to deliver those resources to market. However, the original scope of the RETI analysis did not include the wind resources of Wyoming and other intermountain states, principally because large scale transmission to deliver those resources to markets does not yet exist.
4.2 WYOMING WIND RESOURCE POTENTIAL NREL assessed the quality of renewable resources available in the United States and the map below (Figure 13) highlights the concentration of Class 6 and Class 7 onshore wind resources in Wyoming. Wyoming’s concentration of high quality wind is well suited to support the development of a large scale transmission solution.

The West’s Renewable Energy Future A Contribution by National Grid July 2008
Page 20
Figure 13

The West’s Renewable Energy Future A Contribution by National Grid July 2008
Page 21
The American Wind Energy Association (AWEA) ranks Wyoming 7th in the US for potential wind capacity (Table 8) and 2nd among all Western states for wind energy potential. While ranked only 7th in total wind potential, Wyoming’s concentration of Class 6 and Class 7 wind is better than any other region in the country. In fact, NREL’s data shows that southeastern Wyoming has over 50 percent of the onshore Class 6 and 7 wind in the continental US. According to NREL, this high quality wind region is:
An area of high wind energy (which) extends across southern Wyoming from the Utah border on the west to the Nebraska border on the east. This zone of high wind energy can be attributed to a major gap, about 150 km (90 mi) wide, in the north-south barrier of the Rocky Mountains. Prevailing westerly and southwesterly winds blow with little resistance through this gap across the relatively high plains and uplands of southern Wyoming.xlii
California, on the other hand, ranks 2nd in installed wind capacity (Table 8) but only ranks 17th in wind energy potential and has already utilized more than one-third of the potential wind capacity. As more of the in-state potential capacity in California is utilized the remaining sites become lower in quality and hence, higher in cost. Furthermore, with its higher population density and pattern of private land ownership, locating future wind farms in California may not always be viewed as appropriate and thus may be difficult to permit. .
Table 8: Wind Potential by State
State Wind Energy Potential Ranking
Wind Energy Potential: Average
Power Output (MW)
Wind Energy Potential:
Annual GWh (000's)
Installed Capacity Ranking
Installed Wind
Capacity (MW)
North Dakota 1 138,400 1,210 14 179
Texas 2 136,000 1,190 1 3,150
Kansas 3 121,900 1,070 10 364
South Dakota 4 117,200 1,030 22 44
Montana 5 116,000 1,020 15 146
Nebraska 6 99,100 868 18 73
Wyoming 7 85,000 747 12 288
Oklahoma 8 82,700 725 6 535
Minnesota 9 75,000 201 4 895
Iowa 10 62,900 551 3 936
Colorado 11 54,900 481 11 291
New Mexico 12 49,700 435 7 497
Idaho 13 8,290 73 17 75 California 17 6,770 59 2 2,361 Nevada 21 5,740 50 35 0 Utah 26 2,770 24 32 1 Arizona 30 1,090 10 35 0 Source: Energy Strategies: adapted from AWEA Wind Energy Projects, Updated Mar 31, 2007

The West’s Renewable Energy Future A Contribution by National Grid July 2008
Page 22
Wind resource information made available by NRELxliii provides high quality data on wind resources in the West. While this database is not an exhaustive inventory of the best wind sites in the Western US, it highlights the richness of Wyoming’s wind resources. Figure 14 illustrates and compares the distribution of the NREL grid points by capacity factor in Wyoming, California, Arizona and Nevada, demonstrating that Wyoming’s wind sites have significantly higher capacity factors. Over 43 percent of Wyoming grid points have a capacity factor of 40 percent or more, while only seven percent of California’s and less than one percent of Arizona and Nevada’s have a capacity factor of 40 percent or more.
Figure 14
0%
5%
10%
15%
20%
25%
30%
35%
0% to
4%
4% to
7%
7% to
10%
10% to
13%
13% to
16%
16% to
19%
19% to
22%
22% to
25%
25% to
28%
28% to
31%
31% to
34%
34% to
37%
37% to
40%
40% to
43%
43% to
46%
46% to
49%
49% to
52%
% of G
rid Points
Capacity Factor Range
NREL Grid Point Distribution by Capacity Factor (%)
CF≥40%WYCAAZNV
Source: Energy Strategies, adapted from NREL 3Tier Wind Mesomodel Dataset
Maximum CF
Minimum CF
% of Sites w/ CF > 40%
WY 52.0% 14.7% 43.1%CA 44.3% 2.0% 6.9%AZ 38.2% 14.3% 0.1%NV 38.6% 15.2% 0.1%
The RETI analysis utilized the NREL’s WinDS wind resource database to identify potential wind resources. This Report uses the same database to identify potential Wyoming wind resource capacity. This identifies a potential Wyoming wind resource of more than 250,000 MW (Class 4 or higher) or more than 50,000 MW (Class 6 and 7 – located in southeastern Wyoming). Figure 15 below illustrates this against the types and quantity of non-solar resources (GWh) potentially available per the RETI analysis. Wyoming wind Class 4 and above has three times more potential wind capacity than the entire RETI analysis study region and two and a half times as much as all of the non-solar renewable resources identified in the RETI analysis. Wyoming’s highest quality (and lowest cost) Class 6 and 7 wind energy potential (GWh) 4 is nearly three times greater than the wind energy potential of Arizona, Nevada and California combined.
4 NREL data provides MW of wind energy potential in Wyoming. The capacity of Wyoming’s wind was converted into GWh using typically capacity factors for each wind Class (4-7).

The West’s Renewable Energy Future A Contribution by National Grid July 2008
Page 23
Figure 15
Figure 16 compares the identified CSP potential from the RETI report to the potential Wyoming wind resource from Figure 15. This illustrates that Wyoming wind and DSW solar resources are the only renewable resources that have the scale to make a significant impact on the renewable energy needs of the West.

The West’s Renewable Energy Future A Contribution by National Grid July 2008
Page 24
Figure 16
4.3 SECTION SUMMARY AND CONCLUSIONS
• A significant amount of new renewable development is underway in the DSW. At this time, however, this is mostly focused on in-state resources.
• The West has significant renewable resources. However, the only resources that have the scale to address the large scale renewable needs are Wyoming wind and DSW solar.
• The NREL data shows that Arizona, Nevada and California’s potential CSP resources are 2,229,000 GWh/year. CSP potential in Arizona, Nevada and California is so vast it could theoretically meet 19 times the 2020 RPS need for the US portion of the WECC region.
• NREL data shows that over 50 percent of the best quality (Class 6 and 7) wind capacity in the continental US is located in Wyoming. This Class 6 and 7 wind resource has an energy potential of 235,000 GWh/year. Wyoming’s Class 4 and above wind resource has a potential of 944,000 GWh/year.
• Wyoming wind has two and a half times more energy potential than all the non-solar resources within the RETI analysis study area and could meet eight times the RPS need in the US portion of WECC in 2020.

The West’s Renewable Energy Future A Contribution by National Grid July 2008
Page 25
5 TRANSMISSION SOLUTIONS This section describes the need for transmission investment in the West. It also evaluates transmission solutions and costs, focusing on the proposed TWE project. Finally it considers the implications of adding significant amounts of renewable generation on grid operations.
5.1 BACKGROUND National Grid has suggested that, by international standards, the nation’s transmission system is underinvested. Numerous explanations have been offered, with most quoting lack of long term planning at a regional level, difficulty with cost allocation on multi-state projects and permitting issues. Furthermore, there are additional risks associated with long-distance transmission projects that are not as pronounced in shorter distance projects. These risks include increased permitting and political risks and a longer lead time for development. A significant amount of long-distance, large scale transmission was built in the West in the 1970s and 1980s. Since then, several regional studies have recognized the need to develop new transmission. In 2001, the WGA sponsored a report that concluded that significant transmission investment was required. In 2004 regional Governors sponsored RMATS and in 2006 the WGA sponsored the CDEAC effort. All of these reports support the conclusion that significant investment in transmission is required. With the exception of the CDEAC report, the findings in these reports were mostly based on accessing the most cost effective conventional thermal generation resources. Resources such as wind and solar are location constrained, meaning that transmission is an even greater barrier to renewable development. A substantial expansion of the transmission system in the West is essential if the region’s GHG reduction goals are to be met. California has led the way in recent transmission expansion and is poised to spend $1.8B on transmission upgrades in the Tehachapi area to interconnect 4,200 MW of wind. The California Energy Commission (CEC) has estimated that required in-state transmission system upgrades alone, to meet the 2020 33 percent RPS target, at $6.4B.xliv
5.2 TRANSMISSION SOLUTIONS AND COSTS The primary consideration in evaluating new interstate transmission is whether the economic or other benefits of providing access to a remote resource can offset the substantial capital costs, as well as the operating losses, of a long-distance transmission line.
To achieve the best possible unit ($/MWh) delivery costs, TWE’s designers favored HVDC technology (the breakeven point between HVDC and AC technologies is usually around 400 miles of point to point interconnection). The designers also favored a 3,000 MW design, which is the largest single element of transmission infrastructure that can be added to the WECC system without modification to the WECC reliability criteria. The criteria are based on the regional system’s ability to withstand an unexpected outage. In general, introduction of an element larger than the current single largest system element would require substantial system upgrades that could be very costly.
For this Report, therefore, a “reference” transmission solution of a 3,000 MW, 500 kV, two-terminal, bi-pole HVDC transmission line from southeast Wyoming to southern Nevada is used – as adopted by TWE. TWE’s northern terminal will be in southeast Wyoming, near the planned Aeolus substation. The southern terminal will be the Marketplace Hub south of Las Vegas, from where Southern California, Arizona and Nevada markets can be reached (see Appendix C for a representative map). This reference transmission solution is used to provide indicative costs of transmission necessary to deliver Wyoming wind resources to the DSW and compare the costs with the other resource alternatives evaluated.

The West’s Renewable Energy Future A Contribution by National Grid July 2008
Page 26
It should be noted that while HVDC has cost and other significant operational benefits, it is essentially a “point to point” technology with intermediate drop off or pick up points either not cost effective or operationally restrictive. In the case of TWE, however, the project is planned to be developed, or ‘co-developed’, in parallel with, and in the same corridor as, PacifiCorp’s Gateway South project, providing the combined benefits of both long-distance point to point and intermediate distance transmission capacity out of Wyoming.
Estimated TWE capital costs take into account “development” costs (design, right-of-way acquisition, environmental permitting, regulatory approvals, etc.) and “construction” costs (equipment, materials and labor). Details of the cost estimate for TWE are available in a separate Conceptual Technical Report developed by Black & Veatch for the project.xlv At this stage, estimates are intended for conceptual purposes only.
Table 9: TWE Cost Summary
Name Market Description WY Export (MW)
Total Project Cost ($MM)
TransWest Express (TWE)
So. CA, AZ, NV
Wyoming-LV Marketplace HVDC 500 kV 3,000 $3,080
5.3 TWE ENERGY TRANSMISSION COSTS In order to determine a total cost to deliver energy ($/MWh) “financing” costs (based on a typical utility finance structure); “operational losses” (see below) and “operational costs” (maintenance and operations) were added to the TWE capital costs listed above. The line utilization factor is an important additional factor that affects per unit energy delivery costs. Figure 17 below illustrates how the delivery cost is inversely related to the utilization of the line. At full utilization the delivery cost is estimated to be $15/MWh. At an (unlikely) 20 percent utilization the delivery cost approaches $100/MWh. This is, therefore, a key variable in determining transmission costs. Wind generation is an intermittent resource and cannot, on its own, fully use the capacity of a dedicated line. Conversely, a wind and natural gas fired generation mix might use over 90 percent of the line capacity. Line utilization is, therefore, largely a function of the type of generation mix. TWE has used two “bookend” scenarios and these produce transmission cost estimates of $16/MWh and $28/MWh. The lower cost estimate assumes that a mix of wind and natural gas generation is developed which will result in a 91 percent line utilization factor. The higher cost estimate assumes that Wyoming Class 5 wind is the sole generation source and that this resource will have a 43 percent average annual capacity factor (net of a very small percentage of curtailment that may be necessary during peak wind hours). In order to more economically utilize the transmission line the nameplate wind generation capacity exceeds the nameplate transmission line capacity by 33 percent, giving a line utilization factor of 51 percent. Figure 17 illustrates the range of delivery costs. The actual generation mix will likely result in a line utilization factor and, consequently, costs somewhere in between these two bookend scenarios.

The West’s Renewable Energy Future A Contribution by National Grid July 2008
Page 27
Figure 17
Furthermore, line losses need to be factored in as they represent a cost of transmitting energy. Line losses are a function of the diameter of conductor bundle and, therefore, designers balance the lower losses and the additional capital costs of a larger conductor bundle to achieve an optimum design. Line losses are also a function of the level of power flow through the line. Details on the estimated line losses and assumptions are available in the Conceptual Technical Report. For the costs used in this Report the assumption is that line losses will amount to a total of ten percent for the entire 900 mile length. This is a conservative simplifying assumption, particularly in lieu of the line utilization factor (51 percent) used for the all Wyoming wind case. Factoring in losses the scenario used for Wyoming wind, of 4,000 MW of nameplate installed units, in this analysis would deliver 13,500 GWh of renewable energy to the DSW. 5
5.4 TRANSMISSION GRID OPERATIONS As the major grid system incidents in California and the Northwest in 1996 and the Northeast in 1965, 1977 and 2003 remind us, the transmission grid is a complex, interconnected and sometimes fragile system. For all of its positive characteristics, the intermittency of wind and the performance of wind generators during stressed periods present some of the most difficult challenges in integrating the significant levels required to meet policy goals.
5 It is possible that TWE could deliver more wind energy. This scenario assumes 4,000 MW of Wyoming wind with an average 43 percent capacity factor (net of a very small percentage of curtailment that may be necessary during peak wind hours) is delivered on TWE. TWE is rated as 3,000 MW. However, to more economically utilize the transmission line the authors have assumed that under a scenario where TWE transmitted only wind energy, 4,000 MW of wind generation would be built in Wyoming to feed into TWE and increase the line utilization factor.

The West’s Renewable Energy Future A Contribution by National Grid July 2008
Page 28
Current reserve margins and unit ramp rate standards were largely developed in an environment where generation resources were non-intermittent and designed to meet foreseeable fluctuations in demand or an unanticipated failure of a large generator or transmission link. The introduction of wind, a relatively volatile class of resource, at large scales, increases this potential imbalance and requires a system that can accommodate these greater fluctuations. As the potential imbalance increases, system operators will need to rely more on the highly reliable and fast acting generating units (e.g. hydroelectric, natural gas units, etc.). Numerous studies have been conducted to study wind integration issues at various levels of penetration in different regions of Europe and North America.xlvi, xlvii These studies suggest an exponential relationship between the level of penetration and the cost of integration. A report recently released by the Department of Energy concluded that the wind energy could provide for 20 percent of the US’s electricity needs by 2030, but that “significant changes in transmission, manufacturing and markets would be required.”xlviii While the level of penetration seems to be the most studied factor, there are additional factors that impact the cost of integration. They include the overall size of the balancing area and the capacity and utilization of interconnections with neighboring regions. Mitigating factors such as geographical diversity of numerous wind resources are not yet fully understood due to the lack of site specific data. As better wind data becomes available analysis of the diversity effect can be better understood. To account for wind integration costs, $3.25/MWh was added to the delivered wind energy costs within this analysis. This value was recently cited in a Northern Arizona University wind integration study commissioned by APS. The ultimate extent of overall wind penetration, the correlated overall system costs, and the method of allocating these costs will ultimately influence the appropriate integration costs associated with delivering Wyoming wind energy.
5.5 SECTION SUMMARY AND CONCLUSIONS
• The West’s transmission system is underinvested and the limitations of the region’s transmission system have been recognized by policymakers for years.
• Remote renewable energy resources, especially the highest quality wind, need large scale transmission to reach energy markets.
• TWE is a proposed 3,000 MW, $3B, 500 kV, HDVC transmission line that will run from wind rich southeast Wyoming to southern Nevada. It will help the DSW access large quantities of renewable energy.
• The TWE project has the potential to deliver energy from Wyoming to the DSW with prices in the range of $16/MWh (wind and natural gas) to $28/MWh (all wind).
• A project like TWE could deliver up to 13,500 GWh of Wyoming wind to the DSW, under one all wind scenario.
• Integrating high concentrations of wind into the grid system is a challenge and the cost of integration may increase significantly with increased levels of integration. This Report does not attempt to identify the overall integration costs for the deployment of resources beyond the scale of TWE.

The West’s Renewable Energy Future A Contribution by National Grid July 2008
Page 29
6 ECONOMIC AND OTHER OBJECTIVES This section examines the costs, in dollars, as well as water and land use, of various renewable resource options available to the DSW.
6.1 SUMMARY OF RESOURCE COSTS Figure 18 is an assessment of the busbar costs of several resource alternatives available to meet the load growth and renewable energy needs of the DSW. In order to assess how these resources can compete in the DSW markets, Figure 19 takes these same costs and, for Wyoming wind and natural gas generation, adds the cost of transmission from Wyoming to the Marketplace substation. It includes the cost of transmission line losses from Wyoming and wind integration (for all wind resources) to compare delivered costs on a LCOE per MWh basis for multiple alternatives. This analysis has utilized transmission costs derived from the TWE cost estimates described in Section 5.6 The results of the analysis (Figure 18 and Figure 19) modeled a range of capital costs, GHG costs and natural gas prices, as well as capacity factors for renewable resources (see Appendix D, E, F and H). One key assumption for renewable resources is that the Production Tax Credit (PTC) for wind and the Investment Tax Credit (ITC) for solar will be extended throughout the period evaluated. One key assumption for natural gas generation prices is a delivered gas price of $8.63/MMBtu in California in 2015 rising to $14.73/MMBtu in 2030 (Appendix F). A range of plus or minus 20 percent of these natural gas prices was used in order to help account for some of the volatility in natural gas prices (Appendix G). Another key assumption for natural gas generation is an $8/ton (2008$) cost of carbon dioxide emissions. Other GHG costs modeled were the EPA’s estimates of costs under the Lieberman-Warner and Bingamen-Specter bills (see Appendix H for details).
Figure 18
WY Wind (45‐50%)
WY Wind (35‐44%)
CA Wind
AZ GasNV Gas
CA GasWY Gas
CA Solar (CSP)
AZ Solar (CSP)
NV Solar (CSP)
High $64 $88 $121 $121 $121 $130 $131 $220 $220 $220
Low $40 $48 $75 $90 $90 $97 $97 $143 $143 $143
$0 $20 $40 $60 $80
$100 $120 $140 $160 $180 $200
LCOE (200
8 $/MWh)
Busbar Resource Costs
Source: Energy Strategies, see Appendix D for background assumptions.
6 The cost estimates for Wyoming wind delivered to the DSW assume the same “overbuild” assumption from Section 5, i.e. that 4,000 MW of nameplate wind capacity is built to more economically utilize the 3,000 MW TWE transmission line.

The West’s Renewable Energy Future A Contribution by National Grid July 2008
Page 30
Figure 19
WY Wind (45‐50%)
CA Wind (30‐35%)
WY Wind (35‐44%)
AZ GasNV Gas
CA GasWY Gas
CA Solar (CSP)
AZ Solar (CSP)
NV Solar (CSP)
High $101 $124 $136 $121 $121 $130 $150 $220 $220 $220
Low $72 $78 $84 $90 $90 $97 $116 $143 $143 $143
$0
$50
$100
$150
$200
$250 LCOE (200
8 $/MWh)
Regional Resource Costs
Source: Energy Strategies, see Appendix D for background assumptions. Several conclusions can be reached:
• The best quality Wyoming wind is the most economic renewable resource available to California and the DSW (other than some biomass, hydro and geothermal resources, not shown here because of their limited scale);
• The best California wind is within the cost range of delivered Wyoming wind (the issue is that California lacks an abundance of high class wind, as noted in Section 4);
• Wind, whether in California or Wyoming, has a significant cost advantage over CSP as an energy product;
• The best California and Wyoming wind is competitive with natural gas fired generation as an energy product, under nearly every scenario evaluated.
Possibly the more significant of these conclusions is that wind generation is competitive with natural gas fired generation in nearly every scenario evaluated. It should be noted, however, that this is on an energy basis. In developing a future resource mix broader issues, such as capacity value (where both natural gas fired generation and CSP have an advantage) and grid integration issues (Section 5.4) have to be considered, both of which are beyond the scope of this Report. It should also be noted that there are scenarios where natural gas fired generation would be less expensive than wind generation, such as if capital costs for wind resources climbed higher while natural gas prices dropped significantly. Notwithstanding that observation, the natural gas price assumptions used in this analysis have been demonstrated in the last few months to be conservative. If gas prices maintain (or continue escalating at) current rates, wind will become even more economically attractive. This highlights one significant benefit of wind and solar energy - their isolation from the volatility of fuel prices (see Appendix G for more information on volatility in natural gas prices). These findings, therefore, support the view that wind powered generation technology has matured to the point that Wyoming wind could be developed as an economic energy solution regardless of RPS levels. It should be added that in 2008 National Grid commissioned the PA Consulting Group to conduct an independent evaluation of the comparative economics of various resource options for the DSW. This analysis was prepared using a simulated production cost model, which accounted for capacity values, and reached similar conclusions to this analysis.xlix

The West’s Renewable Energy Future A Contribution by National Grid July 2008
Page 31
6.2 BACKING UP INTERMITTENT ENERGY SOURCES As both CSP and wind are intermittent resources, it may be necessary to “back up” a portion of wind and CSP with a firm resource, such as natural gas fired generation (although some types of CSP include thermal storage, which serves as a back-up system within the CSP plant). Furthermore, solar resources typically produce the most energy in the summer, while Wyoming wind often produces the most energy during the winter. CSP energy production tends to peak when the DSW needs the most energy, in the peak hours of hot summer days, when the wind may be least reliable. There may, therefore, be an opportunity for CSP and wind resources to supplement each other to provide for both the energy and capacity needs of the system. Similarly, it is possible that California’s (coastal) wind could provide support for Wyoming’s wind. At this time, however, the West has not completed a comprehensive technical and economic assessment of backing up one renewable resource with another renewable resource and such analysis is beyond the scope of this Report. Wyoming is a major producer of natural gas and it would be feasible to site new natural gas fired generation in Wyoming for the purpose of backing up the state's wind resources. The economic issues include increased line utilization and the lower cost of natural gas at the wellhead, these advantages are offset by transmission line losses and the lower efficiency of natural gas fired generation at higher altitudes. As intermittent renewables continue to provide a greater percentage of the DSW’s energy needs, the need for additional natural gas (or other, non intermittent) resources to “back-up” these renewables will become a key factor that will affect the incremental costs of additional wind resources. Analysis of these issues is beyond the scope of this Report but further analysis is required.
6.3 LAND AND WATER USE CONSIDERATIONS The energy demands outlined in Section 3 demonstrate that energy resource development needs are significant. Due to the large scale of these needs, it is appropriate that the additional “costs” of land and water use are recognized. The best wind generation sites are typically on elevated or exposed uplands and require approximately 5 acres per MW of capacity. In practice, however, only two percent of this is required for siting the wind turbines with the balance of 98 percent remaining available for wildlife habitat, ranching or agriculture.l At an effective 0.1 acres per MW, wind generation is a highly efficient use of land. CSP generation requires approximately 8 acres per MW of capacity, none of which can exceed a slope greater than one percent. CSP is therefore a relatively inefficient use of land. Conventional thermal generation requires significant water use for cooling purposes. CSP plants have a similar need for water cooling, supply of which is made more challenging by the fact that they may be installed in a desert location that lacks water. There is an alternative to conventional cooling for thermal and solar resources often referred to as “dry” cooling. Dry cooling consumes less than ten percent of the water of a conventional system, but at a significant increase in cost. A significant advantage of wind generation, therefore, is that its water usage is zero. The land and water use requirements for wind, CSP, and combined cycle natural gas generation technologies are described below (Figure 20 and 21). For CSP and natural gas water consumption with both wet and dry cooling technologies is shown.
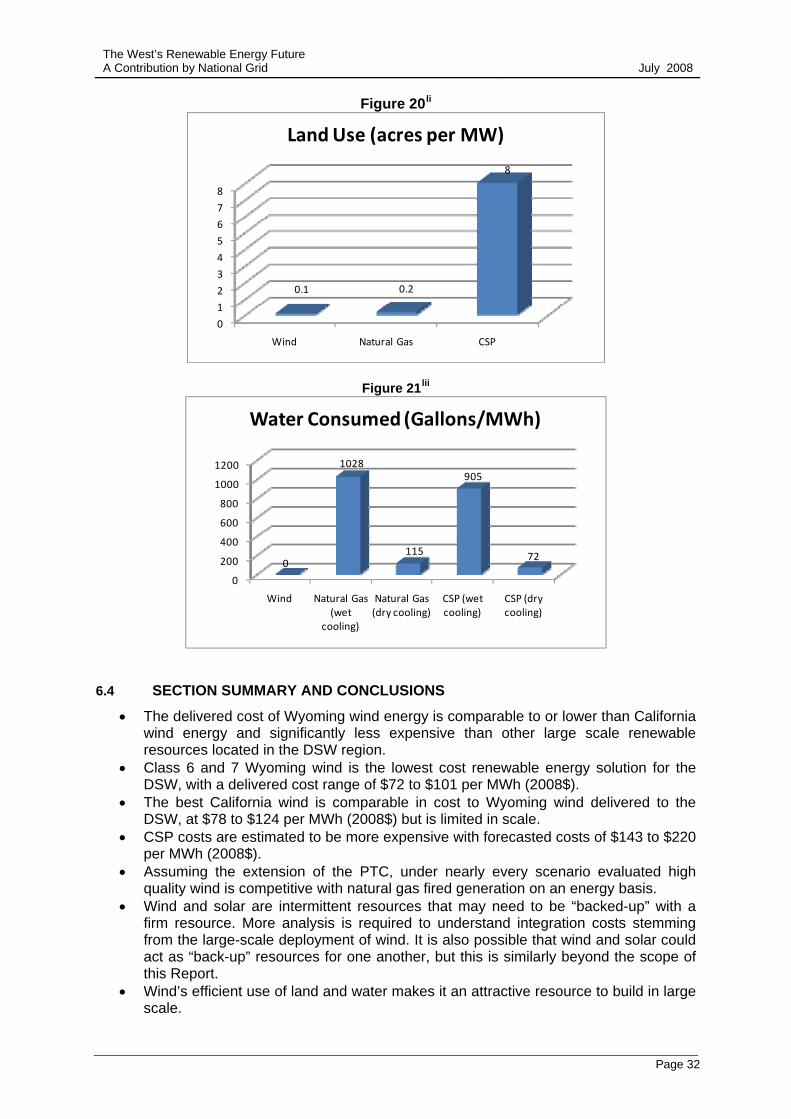
The West’s Renewable Energy Future A Contribution by National Grid July 2008
Page 32
Figure 20li
0
1
2
3
4
5
6
7
8
Wind Natural Gas CSP
0.1 0.2
8
Land Use (acres per MW)
Figure 21lii
0
200
400
600
800
1000
1200
Wind Natural Gas (wet
cooling)
Natural Gas (dry cooling)
CSP (wet cooling)
CSP (dry cooling)
0
1028
115
905
72
Water Consumed (Gallons/MWh)
6.4 SECTION SUMMARY AND CONCLUSIONS
• The delivered cost of Wyoming wind energy is comparable to or lower than California wind energy and significantly less expensive than other large scale renewable resources located in the DSW region.
• Class 6 and 7 Wyoming wind is the lowest cost renewable energy solution for the DSW, with a delivered cost range of $72 to $101 per MWh (2008$).
• The best California wind is comparable in cost to Wyoming wind delivered to the DSW, at $78 to $124 per MWh (2008$) but is limited in scale.
• CSP costs are estimated to be more expensive with forecasted costs of $143 to $220 per MWh (2008$).
• Assuming the extension of the PTC, under nearly every scenario evaluated high quality wind is competitive with natural gas fired generation on an energy basis.
• Wind and solar are intermittent resources that may need to be “backed-up” with a firm resource. More analysis is required to understand integration costs stemming from the large-scale deployment of wind. It is also possible that wind and solar could act as “back-up” resources for one another, but this is similarly beyond the scope of this Report.
• Wind’s efficient use of land and water makes it an attractive resource to build in large scale.

The West’s Renewable Energy Future A Contribution by National Grid July 2008
Page 33
7 SUMMARY AND CONCLUSIONS The ‘need’ section of the Report, Section 3, examined the impact of Western states RPS and GHG policy goals, in the context of forecasted population and electricity sales growth. RPS and electricity sales growth requirements alone will create a need for an increase of 116,000 GWh of renewable energy supplies across the West by 2020. The need is most acute in the DSW, where RPS and electricity sales growth requirements are forecasted to create a need for an increase of 55,000 GWh by 2020, or nearly half of the total requirement for the US portion of the WECC region. As aggressive as these RPS goals are, they could yet be on the low end of 2020 requirements to meet GHG reduction targets depending on how policymakers and the market work out how best to measure, allocate and achieve GHG reduction targets. Section 3 analyzes the impact of the WCI and possible federal GHG legislation on the electricity sector. While it is still not entirely clear how the regional GHG reductions goals of the WCI will affect the electricity sector, the Report concludes that these measures will stimulate demand for new renewable energy resources between 84,000 and 167,000 GWh for the US portion of the WECC region or between 58,000 and 115,000 GWh for the DSW region. Regional GHG reduction measures, therefore, have the potential to stimulate even greater demand for new renewable infrastructure than RPS requirements. Federal GHG legislation is a distinct possibility in the near future. While the design of any such legislation is uncertain, the growing consensus that the US should reduce GHG emissions through a market mechanism has already sent a price signal to the electricity sector. If a federal program is implemented it will become an additional driver for meeting the aforementioned challenging levels of renewable energy deployment. The good news is that the West is blessed with adequate renewable energy resources that can meet this energy gap. Section 4 of the Report concluded that two resources stand out as having the scale to meet this level of additional demand – solar in the DSW and wind in southeast Wyoming. The West is extremely fortunate to have these two excellent renewable energy resources within its footprint – in fact NREL estimates show that potential solar power is so vast it could theoretically provide for all the energy needs of the region. Additionally, southeast Wyoming contains over 50 percent of the best (Class 6 and 7) wind sites in the entire continental US. Estimates suggest that CSP in the DSW and Wyoming wind could, in theory, meet 19 times and 8 times the 2020 RPS need of the US portion of the WECC region, respectively. The most significant barrier to developing wind resources is lack of transmission, which is one reason why DSW utilities have initially focused on the deployment of CSP resources. Section 5 of the Report examines the cost of building a 900 mile long, interstate transmission line between Wyoming and the load centers of the DSW, based upon National Grid’s data from TWE. The conclusion is that, provided this is done in scale (3,000 MW being the largest rating allowed by WECC without significant system-wide upgrades), the delivery costs can be in the range of $16 to $28/MWh (2008$). Wind and solar are intermittent resources, however, and Section 5 also discusses broader transmission issues, such as the integration of wind into the grid system. Section 6 of the Report adds TWE forecasted delivery costs to forecasted generation costs in order to draw a comparison between various renewable and conventional generation resources. The conclusion is that the best quality Wyoming wind can be delivered at lower costs than California wind. Furthermore, Wyoming wind can be delivered at significantly lower costs than local CSP and, assuming the PTC is extended throughout the study period, is competitive with natural gas fired generation on an energy basis. Section 6 also looks at

The West’s Renewable Energy Future A Contribution by National Grid July 2008
Page 34
additional “cost” factors and concludes that wind generation uses land and water resources very efficiently. Policymakers and the industry should focus their attention on Wyoming’s wind resources as a key resource for the DSW. Wyoming wind has the potential to help the DSW region meet RPS and GHG reduction goals without imposing a cost premium on customers. It was beyond the scope of this Report, however, to look at several key issues that will influence any final policy or investment decision. Solar and natural gas fired generation resources are a better capacity product than wind resources. Additional production cost and economic analysis is required to fully understand the system wide impacts and mitigation costs of integrating large amounts of wind energy into the system. This further analysis should also examine the diversity effect of renewable resources including the potential for solar, California (coastal) wind, and Wyoming wind to back each other up. The potential clean energy delivered on TWE can make a significant impact on the region’s RPS and GHG reduction goals. Figure 22 illustrates TWE’s potential impact on regional RPS goals and Figure 23 illustrates TWE’s impact on the region’s potential need for renewables as driven by GHG reduction initiatives. TWE has the potential to meet 25 percent of the incremental renewable energy goals for the DSW in 2020 or 11 percent of the DSW’s GHG goals for emissions associated with electricity use. This highlights that while TWE’s impact can be significant, it is only one of multiple large scale solutions that will be necessary to meet the needs of the region.

The West’s Renewable Energy Future A Contribution by National Grid July 2008
Page 35
Figure 227
75% 71%
33%
52%46%
25%
38% 36%
17%
30%
22%
12%
0%
10%
20%
30%
40%
50%
60%
70%
80%
2013 2016 2020 ‐33% CA
TWE Impact on Regional RPS Goals
So. California Desert Southwest (So CA, NV, AZ) California WECCSource: Energy Strategies adapted from state regulatory agency and utility forecasts
Figure 23
62%
53%
27%
20%
11%
0%
10%
20%
30%
40%
50%
60%
70%
NV So. CA CA AZ Desert Southwest (So. CA, NV, AZ)
Percen
t of Electricity Sector GHG Red
uction
Goal Satisfie
d by
TWE
TWE Impact by Geography
Source: Energy Strategies adapted from state GHG inventories and forecasts
7 Data in Figure 21 and 22 is generated using the assumption that TWE will transmit 100 percent renewable energy to the geography in question. Furthermore it is assumed that 4,000 MW of wind, with an average capacity factor of 43 percent (net of a very small percentage curtailment that may be necessary during peak wind hours). This represents a 51 percent line utilization factor.

The West’s Renewable Energy Future A Contribution by National Grid July 2008
Page 36
APPENDIX A – MAJOR DSW ELECTRIC UTILITIES
Major Load Serving Entities by State and Associated 2006 Energy Sales
State Utility Name Ownership 2006 Sales (MWh)
% of 2006 State Sales
AZ Arizona Public Service Co Investor Owned 27,970,397 38% AZ Salt River Project Political Subdivision 26,249,636 36% AZ Tucson Electric Power Co Investor Owned 9,201,419 13% CA Southern California Edison Co Investor Owned 88,728,720 34% CA Pacific Gas & Electric Co Investor Owned 84,785,198 32% CA Los Angeles Dept of Water and Power Municipal 24,313,734 9% CA San Diego Gas & Electric Co Investor Owned 20,236,492 8% CA Sacramento Municipal Utility Dist Municipal 10,799,230 4% NV Sierra Pacific Resources (SP and NP) Investor Owned 30,540,830 89%
Source: Energy Strategies adapted from FERC Form 1 data.

The West’s Renewable Energy Future A Contribution by National Grid July 2008
APPENDIX B – RETI PHASE 1A TECHNOLOGY COST SUMMARY
Source: Black & Veatch, Renewable Energy Transmission Initiative Phase 1A Final Report, May 2008, Table 1-1.
Page 37

The West’s Renewable Energy Future A Contribution by National Grid July 2008
Page 38
APPENDIX C – REPRESENTATIVE TWE MAP
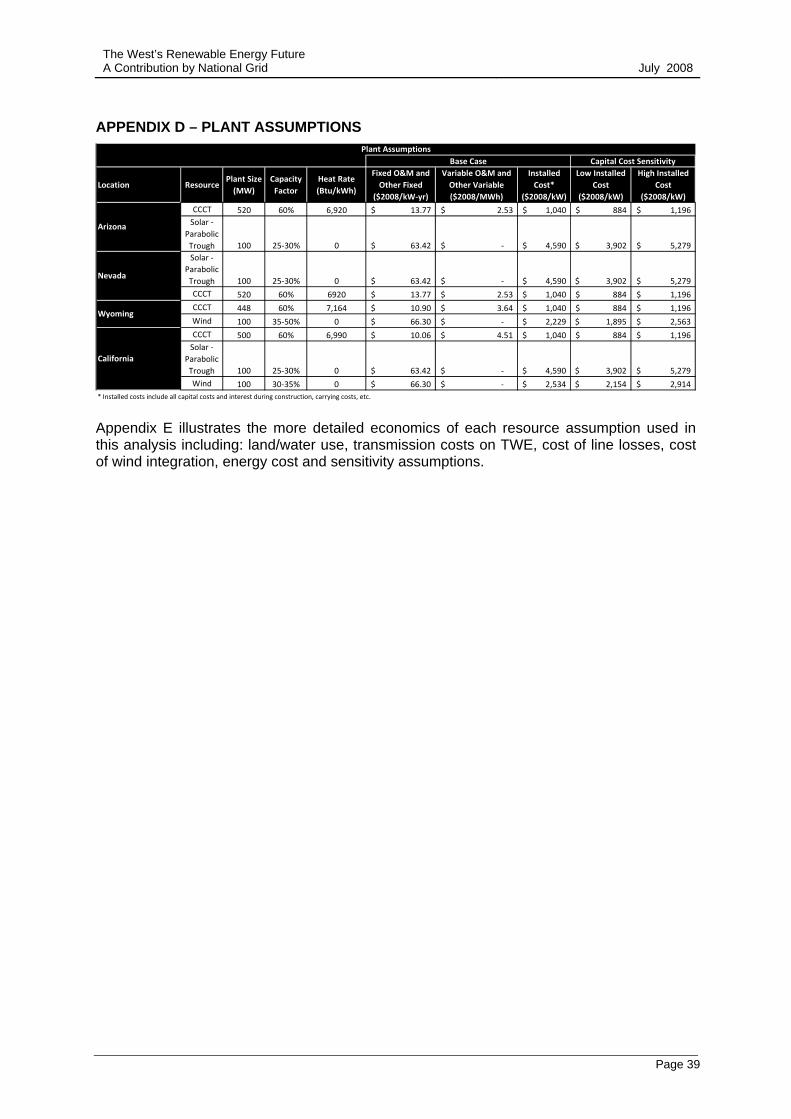
The West’s Renewable Energy Future A Contribution by National Grid July 2008
Page 39
APPENDIX D – PLANT ASSUMPTIONS
Location ResourcePlant Size (MW)
Capacity Factor
Heat Rate (Btu/kWh)
Fixed O&M and Other Fixed
($2008/kW‐yr)
Variable O&M and Other Variable ($2008/MWh)
Installed Cost*
($2008/kW)
Low Installed Cost
($2008/kW)
High Installed Cost
($2008/kW)CCCT 520 60% 6,920 13.77$ 2.53$ 1,040$ 884$ 1,196$ Solar ‐
Parabolic Trough 100 25‐30% 0 63.42$ ‐$ 4,590$ 3,902$ 5,279$ Solar ‐
Parabolic Trough 100 25‐30% 0 63.42$ ‐$ 4,590$ 3,902$ 5,279$ CCCT 520 60% 6920 13.77$ 2.53$ 1,040$ 884$ 1,196$ CCCT 448 60% 7,164 10.90$ 3.64$ 1,040$ 884$ 1,196$ Wind 100 35‐50% 0 66.30$ ‐$ 2,229$ 1,895$ 2,563$ CCCT 500 60% 6,990 10.06$ 4.51$ 1,040$ 884$ 1,196$ Solar ‐
Parabolic Trough 100 25‐30% 0 63.42$ ‐$ 4,590$ 3,902$ 5,279$ Wind 100 30‐35% 0 66.30$ ‐$ 2,534$ 2,154$ 2,914$
* Installed costs include all capital costs and interest during construction, carrying costs, etc.
Plant Assumptions
Wyoming
California
Nevada
Base Case Capital Cost Sensitivity
Arizona
Appendix E illustrates the more detailed economics of each resource assumption used in this analysis including: land/water use, transmission costs on TWE, cost of line losses, cost of wind integration, energy cost and sensitivity assumptions.

The West’s Renewable Energy Future A Contribution by National Grid July 2008
APPENDIX E – OVERVIEW OF ECONOMIC ANALYSIS RESULTS
Resource Type Location
Water Consumed (Gallons/
MWh)1
Land
(Acres/MW)1,2Transmission4 Losses
Wind
Integration5Energy
Total Base Case
No Carbon Price
S.1766 EPA, ADAGE
S.2191 EPA, ADAGE
‐15% 15% ‐20% 20%
CA @ 30% 0 0.1 ‐$ ‐$ 3.25$ 106.17$ 109.42$ ‐$ ‐$ ‐$ 94.50$ 124.33$ ‐$ ‐$ CA @ 35% 0 0.1 ‐$ ‐$ 3.25$ 87.75$ 91.00$ ‐$ ‐$ ‐$ 78.22$ 103.78$ ‐$ ‐$ WY @ 35% 0 0.1 34.11$ 8.94$ 3.25$ 77.22$ 123.52$ ‐$ ‐$ ‐$ 111.22$ 135.83$ ‐$ ‐$ WY @ 40% 0 0.1 29.85$ 7.57$ 3.25$ 64.83$ 105.50$ ‐$ ‐$ ‐$ 94.73$ 116.27$ ‐$ ‐$ WY @ 45% 0 0.1 26.53$ 6.49$ 3.25$ 55.20$ 91.47$ ‐$ ‐$ ‐$ 81.90$ 101.05$ ‐$ ‐$ WY @ 50% 0 0.1 23.88$ 5.64$ 3.25$ 47.49$ 80.26$ ‐$ ‐$ ‐$ 71.65$ 88.87$ ‐$ ‐$ AZ @ 25% 905 / 72 8.0 ‐$ ‐$ ‐$ 195.90$ 195.90$ ‐$ ‐$ ‐$ 171.60$ 220.21$ ‐$ ‐$ AZ @ 30% 905 / 72 8.0 ‐$ ‐$ ‐$ 163.25$ 163.25$ ‐$ ‐$ ‐$ 143.00$ 183.51$ ‐$ ‐$ CA @ 25% 905 / 72 8.0 ‐$ ‐$ ‐$ 195.90$ 195.90$ ‐$ ‐$ ‐$ 171.60$ 220.21$ ‐$ ‐$ CA @ 30% 905 / 72 8.0 ‐$ ‐$ ‐$ 163.25$ 163.25$ ‐$ ‐$ ‐$ 143.00$ 183.51$ ‐$ ‐$ NV @ 25% 905 / 72 8.0 ‐$ ‐$ ‐$ 195.90$ 195.90$ ‐$ ‐$ ‐$ 171.60$ 220.21$ ‐$ ‐$ NV @ 30% 905 / 72 8.0 ‐$ ‐$ ‐$ 163.25$ 163.25$ ‐$ ‐$ ‐$ 143.00$ 183.51$ ‐$ ‐$ Arizona 1028 / 115 0.2 ‐$ ‐$ ‐$ 105.05$ 105.05$ 100.92$ 108.98$ 120.78$ 101.95$ 108.16$ 90.32$ 119.78$ California 1028 / 115 0.2 ‐$ ‐$ ‐$ 113.43$ 113.43$ 109.26$ 117.40$ 129.32$ 110.70$ 116.17$ 96.87$ 130.00$ Nevada 1028 / 115 0.2 ‐$ ‐$ ‐$ 105.05$ 105.05$ 100.92$ 108.98$ 120.78$ 101.95$ 108.16$ 90.32$ 119.78$ Wyoming 1028 / 115 0.2 19.10$ 11.26$ ‐$ 101.36$ 131.72$ 126.96$ 136.24$ 149.81$ 128.27$ 135.17$ 116.37$ 147.07$
3. Capital Cost, permitting and O&M expenses are assumed to be the same for wind resources in that state, but they will likely be vary based on the wind resource.
* Renewable cost estimates are based on the assumption the PTC and ITC are renewed.
5. Wind integration costs from "Arizona Public Service Wind Integration Cost Impact Study," 4% penetration case, prepared by Northern Arizona University. September 2007.
1. Wet cooling data shown first followed by dry cooling data (if applicable). Land and water use data from CEC's 2007 Environmental Performance Report of California's Electrical Generation System, Table 9 and Figure 13. CSP water use from Solar Thermal Parabolic Trough Electric Power Plants for Electric Utilities in California prepared by Solargenix Energy, November 2005, P.48.
2. Land estimates for wind represent the actual area occupied by the turbines, 2% of the total (Source: NREL). The area required for an entire wind farm (5.4 acres/MW) can serve a dual purpose, e.g. farming.
4. Transmission costs from Wyoming do not include the cost of wheeling the power from the Marketplace substation. Likewise, AZ, CA and NV resources do not include local transmission, which will be necessary to move the resources to load. Transmission costs for wind are for 4,000 MW of installed wind capacity and for WY gas assume 75% line utilization.
Comparison of Resource Alternatives
Fuel Price Sensitivity
Wind3
Gas (CC)
GHG Allowance Sensitivity
Levelized Cost of Energy (2008$/MWh)
Base Case
Solar (Parabolic Trough)
Capital Cost Sensitivity
Page 40

The West’s Renewable Energy Future A Contribution by National Grid July 2008
Page 41
APPENDIX F – NATURAL GAS PRICE ASSUMPTIONS
AZ & NV CA WY2015 $8.23 $8.63 $7.682016 $8.48 $8.72 $8.402017 $8.87 $8.80 $9.062018 $8.90 $9.38 $9.672019 $9.48 $9.98 $10.292020 $10.11 $10.16 $10.562021 $10.42 $10.34 $10.772022 $10.80 $10.86 $10.972023 $11.16 $11.39 $11.182024 $11.58 $11.81 $11.382025 $11.93 $12.23 $11.592026 $12.34 $12.67 $11.792027 $12.75 $13.15 $11.992028 $13.79 $13.68 $12.052029 $13.63 $14.21 $12.12
Gas ($/MMBtu)
2030 $14.09 $14.73 $12.18 Appendix F illustrates the fuel prices used in the analysis in Appendix E. Price sensitivities were evaluated by taking plus and minus 20 percent of the values in Appendix F.

The West’s Renewable Energy Future A Contribution by National Grid July 2008
Page 42
APPENDIX G – NATURAL GAS PRICE VOLATILITY The figure below illustrates the historic pricing of natural gas dating back to January 1998.
$0.000
$2.000
$4.000
$6.000
$8.000
$10.000
$12.000
$14.000
$16.000
$18.000
Jan‐98
Jun‐98
Nov
‐98
Apr‐99
Sep‐99
Feb‐00
Jul‐0
0
Dec‐00
May‐01
Oct‐01
Mar‐02
Aug
‐02
Jan‐03
Jun‐03
Nov
‐03
Apr‐04
Sep‐04
Feb‐05
Jul‐0
5
Dec‐05
May‐06
Oct‐06
Mar‐07
Aug
‐07
Jan‐08
NYMEX
Questar, Rocky Mountains
Northwest, Wyo. Pool
Kern River, Opal plant
CIG, Rocky Mountains
El Paso, San Juan Basin
El Paso, Permian Basin
SoCal Gas
SoCalGas: $16.390 (Jan‐2001)
NYMEX: $13.907 (Oct‐2005)
To capture some of the uncertainty illustrated in this graph, the resource cost sensitivity table (Appendix E) incorporates plus or minus 20 percent of the Appendix F values to help identify the potential range of LCOE uncertainty associated with fossil fuels.

The West’s Renewable Energy Future A Contribution by National Grid July 2008
Page 43
APPENDIX H – GHG COST SENSITIVITIES The future cost of GHG emissions is uncertain but critically important to evaluate in any resource cost comparison. With federal legislation pending, estimates of future GHG allowance prices range from about $10/ton in 2015 to over $425/ton in 2050. Figure 17 below illustrates the cost curves that were used in the GHG price sensitivity estimates in Appendix E. S.2191 is the proposed Lieberman-Warner bill. S.1766 is the proposed Bingaman-Specter bill. The base case assumes a constant GHG price of about $8/ton of CO2e, similar to the costs used by many Western utilities in their IRPs. The cost curves for the Lieberman-Warner and Bingamen-Specter bills were developed by the EPA. Current coal technologies emit approximately one metric ton of carbon dioxide per MWh of energy produced. Under the high GHG cost case, if no technology improvements are made, one MWh of coal energy in 2040 could potentially cost $100 more than it does today solely due to the potential cost of GHG allowances. Natural gas plants emit approximately half as much CO2 as coal plants and therefore the cost of GHG emissions per MWh would be about half this figure.
$0
$10
$20
$30
$40
$50
$60
$70
$80
$90
$100
2015 2020 2025 2030 2035 2040
GHG Allowance Prices Used in Analysis (2005 $/tCO2e)
S. 2191, EPA, ADAGE
S. 1766, EPA, ADAGE
Base Case Assumptions
Base Case Carbon Cost
High Carbon Cost
Medium Carbon Cost
Source: Energy Strategies adapted from EPA cost estimates
Scenario, Source, Model

The West’s Renewable Energy Future A Contribution by National Grid July 2008
Page 44
BIBLIOGRAPHY
i Transmission and Wind Energy: Capturing the Prevailing Winds for the Benefit of Customers, National Grid, September 2006, (available at: http://www.nationalgridus.com/non_html/c3-3_NG_wind_policy.pdf). ii Table 6: Interim Projections: Total Population for Regions, Divisions, and States: 2000 to 2030, U.S. Census Bureau, released April 21, 2005. iii Table 1: Interim Projections: Ranking of Census 2000 and Projected 2030 State Population and Change: 2000 to 2030, U.S. Census Bureau, released April 21, 2005. iv Form EIA-861 Final Data File for 2006, file 2, http://www.eia.doe.gov/cneaf/electricity/page/eia861.html, visited November 2007. v Reducing U.S. Greenhouse Gas Emissions: How Much at What Cost?. McKinsey & Company, December 2007, (available at: http://www.mckinsey.com/clientservice/ccsi/pdf/US_ghg_final_report.pdf). vi Energy Action Plan II, California Energy Commission and California Public Utilities Commission, September 21, 2005, p. 2 (available at: http://www.energy.ca.gov/energy_action_plan/2005-09-21_EAP2_FINAL.PDF) vii Map adapted from map published by the Database of State Incentives for Renewables & Efficiency (DSIRE), January 2008. viii Energy Action Plan II, California Energy Commission and California Public Utilities Commission, September 21, 2005, p. 6 (available at: http://www.energy.ca.gov/energy_action_plan/2005-09-21_EAP2_FINAL.PDF) ix 2008 Energy Action Plan Update, California Energy Commission and California Public Utilities Commission, February 2008, p. 12 (available at: http://www.energy.ca.gov/2008publications/CEC-100-2008-001/CEC-100-2008-001.PDF). x Black & Veatch assumed a 30% capacity factor for renewable energy in the Arizona Renewable Energy Assessment, Final Report, B&V Project Number 145888, September 2007. xi Western Climate Initiative, http://www.westernclimateinitiative.org/, visited February 2008. xii Press Release: Five Western Governors Announce Regional Greenhouse Gas Reduction Agreement, February 26, 2007 (available at: http://www.westernclimateinitiative.org/ewebeditpro/items/O104F12774.pdf). xiii Statement of Regional Goal, Western Climate Initiative, August 22, 2007, p. 4 (available at: http://www.westernclimateinitiative.org/ewebeditpro/items/O104F13012.pdf). xiv Statement of Regional Goal, Western Climate Initiative, August 22, 2007, p. 5-6 (available at: http://www.westernclimateinitiative.org/ewebeditpro/items/O104F13012.pdf). xv The WCI goal of 15% below 2005 levels reflects a rounding of the total “2020 Goal Relative to 2005”. This value may change as partner states and provinces continue to refine their GHG inventories. Utah and Manitoba are not included in the total. xvi Utah and Manitoba are not included in the total. xvii Climate Change Action Plan, Arizona Climate Change Advisory Group, August 2006, adapted from Table 3-1. xviii California Greenhouse Gas Inventory by Economic Sector, California Air Resources Board, November 19, 2007, adapted from 2004 Electricity Generation (In State) and Electricity Generation (Imports) (available at: http://www.arb.ca.gov/cc/inventory/data/data.htm). xix Greenhouse Gas Inventory and Forecasts for Nine Western States, Center for Climate Strategies, adapted from Figure 1a. xx Climate Change Draft Scoping Plan: A Framework for Change, California Air Resources Board, June 2008, Table 2, p. 11 (available at: http://www.arb.ca.gov/cc/scopingplan/document/draftscopingplan.pdf), xxi Western Climate Initiative Update, Western Climate Initiative, August 27, 2007(available at: http://www.climatechange.ca.gov/events/2007-08-30_wci/2007-08_WCU_UPDATE.PDF). xxii Statement of Regional Goal, Western Climate Initiative, August 22, 2007, p. 2 (available at: http://www.westernclimateinitiative.org/ewebeditpro/items/O104F13012.pdf). xxiii United States Climate Action Partnership (USCAP), “A Call to Action”, January 22, 2007, p. 6-7 (available at: http://www.us-cap.org/USCAPCallForAction.pdf). xxiv Climate Change Legislation Design, White Paper, Scope of a Cap-and-Trade Program, Senate Committee on Energy and Commerce, , prepared by the Committee on Energy and Commerce staff,

The West’s Renewable Energy Future A Contribution by National Grid July 2008
Page 45
October 2007, p. 7 (available at: http://energycommerce.house.gov/Climate_Change/White_Paper.100307.pdf). xxv Comparison of Legislative Climate Change Targets in the 110th Congress, World Resources Institute, December 7, 2007, p. 2 (available at: http://pdf.wri.org/usclimatetargets_071207.pdf). xxvi EPA Analysis of the Lieberman-Warner Climate Security Act of 2008, S. 2191 in 110th Congress, March 14, 2008 (available at: www.epa.gov/climatechange/economics/economicanalyses.html). xxvii EPA Analysis of the Low Carbon Economy Act of 2007, S. 1766 in 110th Congress, January 15, 2008 (available at: http://www.epa.gov/climatechange/economics/economicanalyses.html). xxviii EPA Analysis of The Climate Stewardship and Innovation Act of 2007, S. 280 in 110thCongress, July 16, 2007 (available at: http://www.epa.gov/climatechange/economics/economicanalyses.html). xxix 2007 Integrated Resource Plan, PacifiCorp, Table 6.2 p. 121 (available at: http://www.pacificorp.com/File/File74765.pdf). xxx Reading the Tea Leaves: How Utilities in the West Are Managing Carbon Regulatory Risk in their Resource Plans. Ernest Orlando Lawrence Berkeley National Laboratory. March 2008. p.xii (available at: http://eetd.lbl.gov/EA/emp/reports/lbnl-44e.pdf). xxxi Alvarodo, Al, Estimating the Generation Resource Mix of Electricity Imports to California – Energy Commission Staff Paper, California Energy Commission and Public Utilities Commission Workshop on Reporting and Tracking Greenhouse Gas Emissions for a Load-Based Cap, April 12 and 13, 2007, slide 29. xxxii Renewables Portfolio Standard Quarterly Report, California Public Utilities Commission, January 2008, p. 4 (available at: http://www.cpuc.ca.gov/NR/rdonlyres/2DBB287C-6DE9-4574-97D4-AA7F16996D3B/0/RPS_Rpt_to_Legislature_April_2008.DOC). xxxiii Database of Proposed Generation Within the Western Electricity Coordinating Council, California Energy Commission, June 4, 2008 (available at: http://www.energy.ca.gov/electricity/wscc_proposed_generation.html). xxxiv CAISO South Regional Transmission Plan for 2006 (CSRTP-2006), Part II: Findings and Recommendations on the Tehachapi Transmission Project, California Independent System Operator, December 29, 2006. xxxv 2007 Request for Proposal for Concentrating Solar Power Resources issued by The Joint Development Group; A Consortium of Southwestern Energy Service Providers, December 6, 2007. xxxvi “Plant to Brighten State’s Solar Future; $1 billion facility to be among the world’s largest, The Arizona Republic, February, 21, 2008 (available at: http://www.azcentral.com/business/articles/0221biz-solar0221.html), visited February 2008. xxxvii Update on US Geothermal Power Production and Development. Geothermal Energy Association. January 16, 2008 (available at: http://www.geo-energy.org/publications/reports/Geothermal_Production_and_Development_Update_January_16_2008.pdf). xxxviii Renewable Energy Transmission Initiative Phase 1A, Black & Veatch, May 2008 (available at: http://www.energy.ca.gov/reti/documents/index.html). xxxix 10 Million Solar Roofs Act of 2008 (S.3224), introduced in the US Senate, July 7, 2008. xl Renewable Energy Transmission Initiative Phase 1A, Black & Veatch, May 2008, p. 6-33 and 6-34 (available at: http://www.energy.ca.gov/reti/documents/index.html). xli Renewable Energy Transmission Initiative Phase 1A, Black & Veatch, May 2008, Figure 1-3, p. 1-7 (available at: http://www.energy.ca.gov/reti/documents/index.html). xlii Wind Atlas, National Renewable Energy Laboratory, Chapter 3, Regional Summaries, visited January 2008 (available at: http://rredc.nrel.gov/wind/pubs/atlas/chp3.html). xliii Western Wind and Solar Integration Study, Wind Data, Spreadsheet of Wind Site Locations for 2006, National Renewable Energy Laboratory, (available at: http://wind.nrel.gov/public/WWIS/3TierPts_Wk.csv) xliv Integration of Renewable Resources, California Independent System Operator, November 2007, p. 21. xlv Gateway South and TransWest Express Conceptual Technical Report, prepared by Black & Veatch, February 2008 (available at: https://transwest.azpsoasis.com/docs/GS_TWE_Conceptual_Technical_Report.pdf). xlvi Task 25 Design and Operation of Power Systems with Large Amounts of Wind Power, IEA Wind, 2007 (available at http://www.vtt.fi/inf/pdf/workingpapers/2007/W82.pdf). xlvii Integration of Renewable Resources, California Independent System Operator, November 2007.

The West’s Renewable Energy Future A Contribution by National Grid July 2008
Page 46
xlviii 20% Wind Energy by 2030, U.S. Department of Energy, Energy Efficiency and Renewable Energy, May 2008 (available at: http://www1.eere.energy.gov/windandhydro/). xlix TransWest Express Project Review, prepared by PA Consulting for National Grid, April 14, 2008. l Flowers, Larry, Wind Energy Update, National Renewable Energy Laboratory, November 2007, slide 42. li 2007 Environmental Performance Report of California’s Electrical Generation System, California Energy Commission, January 2008, Figure 13. lii 2007 Environmental Performance Report of California’s Electrical Generation System, California Energy Commission, January 2008, Table 9. and Solar Thermal Parabolic Trough Electric Power Plants for Electric Utilities in California, prepared by Solargenix Energy for the California Energy Commission, November 2005, P.48.