“the where” of development finance - oecd.org paper.pdf · access to development finance ......
TRANSCRIPT

“THE WHERE” OF DEVELOPMENT FINANCE Towards Better Targeting of Concessional Finance

DCD/DAC(2013)29
2
TABLE OF CONTENTS
PART ONE: WHO RECEIVES DEVELOPMENT FINANCE? MOTIVATIONS, CHALLENGES AND OPPORTUNITIES .......................................................................................................................................... 3
Background: motivation and challenges ..................................................................................................... 3 Emerging findings: diversity of country situations ..................................................................................... 5 Opportunities and recommendations ........................................................................................................... 9
PART TWO: A GRANULAR VIEW ON DEVELOPMENT FINANCE ................................................... 11
Basic characteristics of the country groupings .......................................................................................... 13 Access to development finance ................................................................................................................. 14
How important is ODA seen from recipients perspective? ................................................................... 15 Which ODA instruments are used and for whom? ................................................................................ 17
ANNEX A: UNPACKING DEVELOPMENT FINANCE FOR EACH COUNTRY GROUPING ............ 18
A.1. Fragile LDCs group ........................................................................................................................... 18 A.2. Non-fragile LDCs .............................................................................................................................. 21 A.3. Other fragile ...................................................................................................................................... 23 A.4. Mainly LMICS .................................................................................................................................. 25 A.5. Mainly UMICs .................................................................................................................................. 28
ANNEX B: ELIGIBILITY LISTS ................................................................................................................ 31
ANNEX C: DISTRIBUTION OF EXTERNAL DEVELOPMENT FINANCE AND INCOME ................ 34
ANNEX D: METHODOLOGY AND DATA .............................................................................................. 36
REFERENCES ............................................................................................................................................. 41
Tables
Table 1. Summary table of main indicators by group ......................................................................... 12 Table 2. ODA growth by group .......................................................................................................... 16
Figures
Figure 1. External finance (2000-2011) ................................................................................................. 4 Figure 2. Country groupings .................................................................................................................. 6 Figure 3. The five country groupings at a glance ................................................................................... 7 Figure 4. Basic characteristics of the groups ........................................................................................ 14 Figure 5. Importance of ODA as a source of development finance ..................................................... 15 Figure 6. ODA grants as a share of ODA, by group ............................................................................ 17
DCD/DAC(2013)29
3
PART ONE: WHO RECEIVES DEVELOPMENT FINANCE? MOTIVATIONS, CHALLENGES AND OPPORTUNITIES
1. As 2015 approaches, a new framework for development finance needs to be shaped, one that will help the world community fulfil the development goals for the post-2015 era. Such a framework will need to reflect the new reality of development finance. Despite the availability of new and old sources of finance to developing countries, these sources are not equally accessible to all. This paper provides elements for constructing a new development finance framework by taking a developing country perspective on current resource inflows and trends, discussing key questions such as who receives development finance, what kind of finance do they receive, and how important are these flows from the recipients’ perspective? Answering these questions will allow the Development Assistance Committee (DAC) to better assess whether there is a case for further enabling a distribution of development finance in accordance with countries’ need and ability to access external financing, including Official Development Assistance (ODA). This could also provide elements for reflection within the DAC on the definition and boundaries of ODA, including those imposed by DAC List of ODA Recipients.
2. This paper is organised in two parts. Part I analyses the motivation and challenges posed by the current development finance landscape, presents some emerging findings, and outlines opportunities and suggestions for better targeting concessional finance in a post-2015 framework. Part II provides a more in-depth analysis of trends and volumes of development finance for developing countries.
Background: motivation and challenges
3. Over the past decade, new actors, including emerging economies and large philanthropic foundations, has gained prominence. This shift can also be seen with new sources of funding which has become increasingly important. Overall, developing countries now have better access to global and regional financial markets. While ODA1 remains an important source of finance, non-concessional flows, both official and private, play an increasingly important role in developing countries.
4. Figure 1 below shows the change in the composition of external flows from DAC countries to developing countries over the past decade. New and growing sources of finance have emerged or become more prominent: from foreign, portfolio and institutional investors; migrant workers’ remittances; philanthropic institutions; to emerging and re-emerging donors. Therefore, while ODA steadily increased by 63% in real terms over the past decade, its relative importance as a source of finance has diminished. The analysis shows that ODA is still the main source of development finance for many countries and there are large variations in the ability of countries to attract external financial flows beyond ODA.
5. The way DAC members are providing ODA is also changing. While many members of the DAC still provide ODA exclusively in the form of grants (loans, on overall, represent only 30% of total gross ODA), some members’ ODA loans to developing countries have increased considerably. This is mainly due to the fact that, with the low interest rates in recent years, loans from market-raised funds by a few large DAC members have met the ODA grant element test, and been reported as ODA.
1 . ODA in this document covers concessional outflows from bilateral sources (i.e. bilateral gross ODA by DAC countries) as well as gross multilateral concessional outflows to developing countries. See Annex D for a list of donor coverage.

DCD/DAC(2013)29
4
Figure 1. External finance (2000-2011)1
1. Total external financial resources include bilateral ODA, OOF, private grants, and private flows at market terms and remittances from DAC countries and concessional and non-concessional outflows from multilateral agencies. From 2005 onwards, private grants are based on estimates from the Hudson Institute’s Centre for Global Prosperity, which use a more generous definition than DAC statistics, including for example the imputed value of volunteer time.
6. The recent increases in loans from market-raised funds have mainly gone to more creditworthy countries, which has changed geographic and income focus of some donors, with smaller shares now going to sub-Saharan Africa and least developed countries (LDCs). Preliminary data for 2012 suggest that bilateral ODA to sub-Saharan Africa recorded an 8% fall in real terms compared to 2011. While final 2012 figures may reduce this apparent fall, ODA increases had already started to slow down since 2008 (from average annual increases of 8% in 2000-07 to 6% in 2008-11, and finishing with a slight annual fall from 2010 to 2011). ODA to LDCs increased significantly over the past decade, but according to the preliminary figures indicatively dropped by 13% in 2012 in real terms compared to the previous year. In addition, the 2013 Development Co-operation Report points out that between 2007 and 2011 several bilateral donors decreased the share of their ODA allocated to LDCs (OECD 2013a, forthcoming).
7. The ODA concept is intrinsically linked to the eligibility of countries and territories as defined by the DAC List of ODA Recipients. Today, one hundred and forty eight countries are eligible to receive flows that qualify as ODA according to the DAC. A smaller number of developing countries can receive concessional lending from International Development Association (IDA), which is a good proxy for countries’ lack of access to the international financial markets. Other groups of countries are targeted by more or less explicit donor ODA commitments, such as: (i) the UN target for ODA to LDCs of 0.15%-0.20% of GNI and DAC 1978 Recommendation on the Terms and Conditions of Aid (under which members agreed to raise the overall grant element of their aid to 86%, with special provisions in the case of LDCs); and (ii) the explicit focus of some donors on fragile states, for which the OECD/DAC list of 51 Fragile and Conflict Affected States constitutes a good reference point2.
2 . The list of Fragile States used by the OECD for its analysis of financial flows in fragile states is neither an official DAC list nor an official definition. The list draws on other rankings in order to identify a group of countries that would categorise states of fragility. In practice it is a result from a compilation of two lists: the World Bank/African Development Bank/Asian Development Bank Harmonised List Fragile Situations, and countries in the “alert” and “warning” categories on the Failed States Index, developed by the Fund for Peace (See Annex B for more details).

DCD/DAC(2013)29
5
Emerging findings: diversity of country situations
8. The countries on the DAC List of ODA Recipients exhibit large differences that speak to the need for a more granular analysis. A few recent studies have mapped external finance to developing countries from different perspectives (geographic, income, or state of fragility), however such analyses do not capture sufficiently the heterogeneities of country situations. For example, the list of fragile states groups a wide array of countries, with per capita income ranging from USD 216 in the case of Democratic Republic of Congo to USD 5620 in the case of Libya. This paper takes the approach of looking at developing countries from the perspective of their potential access to concessional finance as defined by the internationally recognised classifications mentioned in the previous paragraph. The overlaps between these classifications produce five groups of countries3, for which the actual composition of external development finance, including ODA is examined. The five groups of countries (depicted in figure 2) are:
• Group one (Fragile LDCs) comprises 33 fragile, least developed countries (LDCs) that are eligible to receive concessional lending from IDA and which are primarily low-income and lower-middle income countries in sub-Saharan Africa and Asia.
• Group two (Non-fragile LDCs) covers the rest of the LDCs (15) that are not fragile and eligible to receive concessional lending from IDA. These countries are primarily concentrated in sub-Saharan Africa, and most of them are not considered rich in natural resources4.
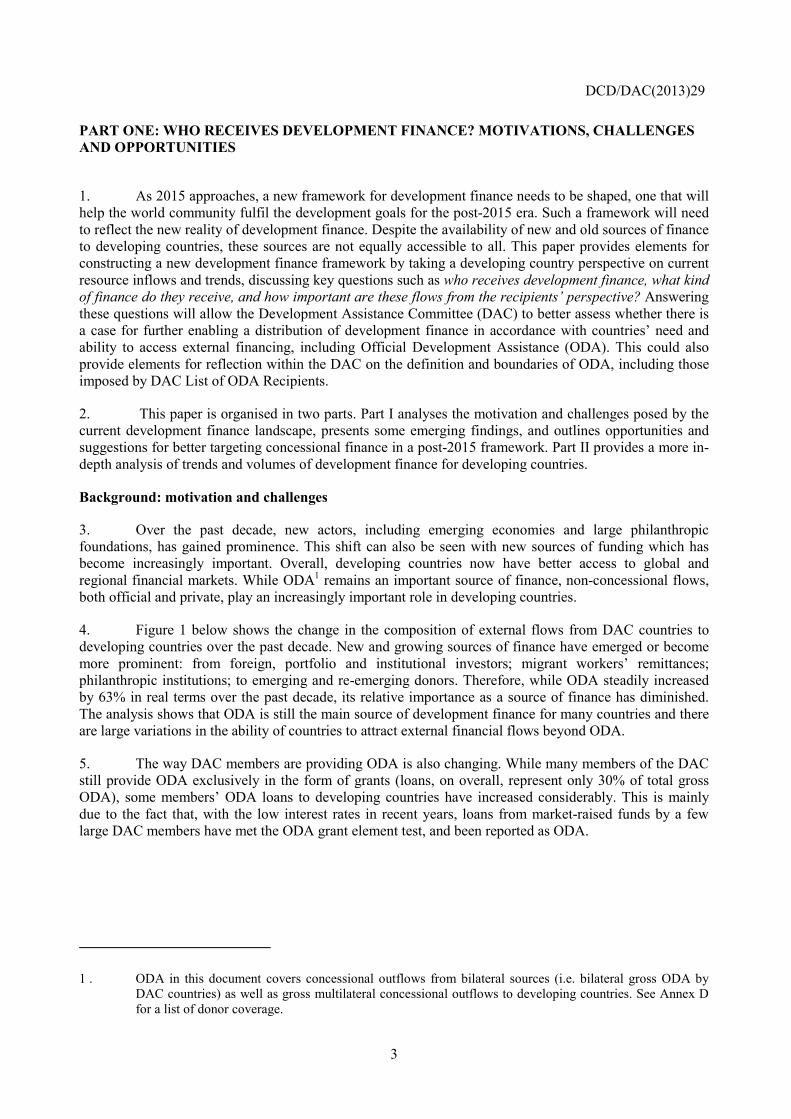
• Group three (Other fragile) covers 16 fragile primarily lower middle income countries that are eligible to receive concessional lending from IDA. The countries in this group are scattered across the world.
• Group four (Mainly LMICs) comprises 22 countries primarily LMICs and UMICs that are still on the IDA list and primarily in Asia or the Americas.
• Group five (Mainly UMICs) includes 60 countries that are on the DAC list of recipients primarily UMICs largely in America and Asia.
3 . The detailed methodology for grouping countries is explained in Annex D.
4 . The terminology for resource rich countries used in this paper is taken from IMF (2012), according to which 29 LICs or LMICs are defined as resource-rich countries as they have natural resource revenue or exports on average at least 20% of total fiscal revenue and exports. In addition, 12 LICs and LMICs have identified reserves where production has not begun or reached significant levels (e.g. Mozambique and Tanzania).

DCD/DAC(2013)29
6
Figure 2. Country groupings1
1. In theory, the overlaps across these lists would allow for eight different groups; however, no country belongs to the group consisting of fragile LDCs that are not IDA eligible; and in two other cases the groups are populated by very few countries which would not allow for a proper statistical analysis of their characteristics or external financial resources. From these two cases, the following countries have been reallocated: (i) Equatorial Guinea is included in Mostly UMICs despite the fact it is still an LDC and (ii) Egypt, Iraq, Libya and Syria are included in Other Fragile, despite the fact that they are not IDA eligible. In addition, the Democratic Republic of Korea and the West Bank and Gaza have been excluded from the analysis because of a lack of data. The geographical distribution of all the countries is presented in Annex D.
9. This way of grouping countries is not a determinant for the composition of external flows, but allows an analysis of developing countries traits in a more nuanced way by superposing various vulnerability criteria (income, poverty, fragility and lack of access to capital markets) and therefore providing a more granular analysis of their ability to attract external resources, as well as being helpful to the narrative on ODA reform and the post-2015 development finance framework.

DCD/DAC(2013)29
7
Figure 3. The five country groupings at a glance
10. Figure 3 above presents key country characteristics and access to development finance by group. Unpacking how much development finance the countries in each group receive in terms of trends and volumes of total external finance, the importance of ODA compared to other external flows, how big ODA flows are vis-à-vis domestic resources, the composition of ODA and ODA modalities provides a good understanding of the challenges and perspectives that these groups of developing countries face.
Uneven distribution of income and poverty challenges
11. Since 2000, 26 LICs have graduated to middle income country (MIC) status, including India (in 2007), and more recently Ghana and Zambia. However, only two countries, Cape Verde and Maldives have graduated from the LDC list. With respect to the IDA classification, five countries have graduated over the same period (these are Albania, Azerbaijan, Indonesia, Montenegro and Serbia). Over this period

DCD/DAC(2013)29
8
some countries have become fragile, succumbing to political instability on their journey to peace and prosperity (e.g. the Arab Spring). Overall, movements across the five groups analysed in this paper have been modest.
12. In 2011, the average GDP per capita of the groups ranged between USD 768 and USD 6348. In addition, reducing inequalities within-country remains a challenge for countries in all groups. The differences observed seem to have a geographical pattern, where countries in South America and sub-Saharan Africa exhibit the highest inequality levels.
13. The incidence of poverty remains highest in LDCs, irrespective of whether these are fragile or not, where on average half the population live on less than 1.25 dollars a day. On the other hand, the largest share of the world’s poor is found in Non-fragile LMICs, which include India, accounting for one third of the world’s poor.5
Heterogeneity of access to external development finance: the importance of ODA
14. ODA to all developing countries has increased at an average annual rate of 6% in 2000-11, but there are significant differences across countries. In a nutshell, the proposed grouping shows a clear distinction between LDCs and non-LDCs in terms of aid dependency. While other external flows (such as FDI, remittances, etc.) to developing countries have increased substantially over the past decade, the capacity of the LDCs to attract flows beyond ODA remains limited. For them, ODA flows remain the bulk of external financial resources, while FDI and other external financing are modest and usually more volatile. Also, ODA flows are important compared to the amount of resources that these countries are able to mobilise domestically, for example through taxes. ODA to LDCs represents on average half of domestic tax revenues in these countries. This speaks to the continued relevance of the LDCs classification and keeping these as a target group for concessional finance. Therefore, it is important to continue to monitor the UN target for LDCs. Considering that ODA-dependency is high for LDCs, the international community should, in a post-2015 framework, assess whether the level of ambition of the target is sufficiently high.
15. ODA increases to developing countries have not been distributed evenly. In this respect, there is a clear difference across countries. The largest increases have been observed for Fragile LDCs and Other Fragile states. In the case of the Non-fragile LDCs, ODA increases have been modest in comparison, however in per capita terms this group exhibits high levels of ODA, which can be partly attributed the observed bias in allocations towards small countries. In recent years, a shift in prioritisation is observed: ODA growth for LDCs and Other Fragile states is slowing down, while it is increasing for the group of Mainly LMICs and UMICs. Looking forward, projections from the Forward Spending Survey also point to a continuation of this pattern.
16. According to the Forward Spending Survey, the future increases are expected to go to the countries in the groups Mainly LMICs and Mainly UMICs. These groups of countries have experienced significant economic growth, and have substantially reduced their dependence on foreign aid. On average, ODA represents between 6% and 18% of external flows and between 0.8% and 5% of domestic tax revenues. At the same time, for these countries the elimination of poverty and a fairer distribution of wealth remain important challenges. ODA to these countries needs to be “smart” so that it can leverage other flows. In this respect a further look at the ODA modalities and their sectoral allocations may be useful.
17. The grant modality still represents the majority of ODA (nearly 70% of total ODA); however, this share varies across groups, ranging between 43% for the group of “mainly LMICs” and 88% for
5 . Nevertheless, our analysis shows that two-thirds of the extreme poor in MICs live in countries that have recently graduated into middle income status and have a GNI per capita of less than USD 1500.

DCD/DAC(2013)29
9
fragile LDCs. However, in the past three years the growth of ODA loans has surpassed the growth of ODA grants. In fact, given the current environment of low interest rates, a growing share of loans from DAC members is made from market-raised funds, which mainly targets the group of Mainly LMICs and Mainly UMICs. Three-quarters of the total value of concessional loans made from market-raised funds without a subsidy was committed to countries in the group of Mainly UMICs. The increased use of the loan modalities would partly also explain the projected future growth in ODA for these groups.
18. The debt relief operations carried out over the past decade combined with sound macro-economic policies have considerably reduced the external debt stock of countries. However, with the diversification of the external funding base of countries, it remains important to continue to monitor developing countries’ external debt stock, which despite being low compared to OECD member countries, could become a risk factor in case of external shocks.
Opportunities and recommendations
19. The post-2015 Development Goals can pave the way to set an ambitious agenda to reduce the growing inequalities between developing countries, so that no developing country is left behind. Improving countries’ access to external development finance is key to achieving sustainable development for all. The DAC has the opportunity to take the leadership in engaging other stakeholders in forging internationally accepted principles for development finance. It can also continue to deepen its understanding in this area.
20. Indeed leadership in this area could reverse a trend that sees a decline in ODA contributions to those countries for which ODA is the most important external financial resource. If the international community wants to eradicate poverty by 2030, more focus should be put to target the countries that are not able to attract significant volumes of external flows beyond ODA, and for which ODA is the largest and least volatile source of finance. While traditional donors show growing interest towards non-concessional lending and market-like financial instruments, the need to provide ODA to countries with little access to other sources of development finance remains strong. Overall, the analysis shows that as new sources of development finance emerge, there is scope for a better targeting of concessional funding.
21. Three recommendations emerge from the analysis in this paper:
• Elevate the prominence given to the monitoring and analysis of the target for ODA to LDCs of 0.15%- 0.20% of GNI. The international community could consider whether the target level is sufficiently ambitious, and subjected to review. This could also lead to a review of the criteria for eligibility for accessing official concessional resources, including monitoring use of grants and loans modalities.
• Further analyse the use of ODA in order to better ascertain its overall contribution to development in different country contexts, such as MICs/LICs and fragile states. At a minimum such analysis should include multiple dimensions - assessing the sectoral composition of ODA investments, the modalities (grants/loans), and the proportion that actually reaches developing countries.
• Continue to improve tracking of all development resources including beyond ODA. This speaks to the relevance of a new broader framework for development finance, which includes statistical measures of official support for development beyond ODA from recipients’ perspective.
22. Developing countries that rely less on concessional finance, like many MICs, will still need external finance to achieve their development goals in terms of poverty eradication. The LICs, being more dependent on concessional finance for their external funding, have fewer alternatives. However, greater consideration can be given to ensure that those already behind do not fall further. It is an opportunity to

DCD/DAC(2013)29
10
explore how official financing (whether concessional and non-concessional) could better leverage resources for development in different country contexts. It complements the priority on using ODA more innovatively and understanding how resources could be better leveraged and allocated.
23. DAC members’ comments and suggestions are invited to further deepen this analytical work.

DCD/DAC(2013)29
11
PART TWO: A GRANULAR VIEW ON DEVELOPMENT FINANCE
24. Taking as a starting point the country grouping introduced above, this section unpacks the comparative analysis of these groups. The analysis focuses on both what is referred to as the groups’ “basic characteristics” and the main features and trends of development finance. A comprehensive analysis for each group is presented in Annex A alongside with technical notes provided in Annex B to D.
25. To understand the groups’ basic characteristics, we consider four key indicators: (i) GDP per capita; (ii) poverty incidence (calculated with reference to both the USD 1.25 per day and a USD 2 per day thresholds); (iii) the Gini coefficient (to measure inequality in the income distribution within countries6); and (iv) the stock of debt as a share of GNI (useful to assess the ability of countries’ to access external development finance resources, in particular on private markets). To analyse the architecture of development finance from a country perspective, the importance of ODA as a source of other external flows [e.g. private flows at market terms, other official flows (OOF)7, remittances, etc.] and its size compared to domestic resources (e.g. government revenues, government tax revenues, and government expenditure) are examined. We also consider how much ODA each group receives compared to the others, both as a share of the total and in per capita terms. The share of grants in ODA is also taken into account.
26. The figures presented in this paper refer exclusively to outflows from DAC members and the multilateral organisations to which they primarily contribute. As DAC members still provide around 90% of all ODA-like flows (OECD, 2012), this approach leads to fairly complete figures of aid receipts. However, DAC member countries’ share of total remittances was only 55% in 2010-128, with, for example, large volumes of remittances to Asian countries such as India and Bangladesh from emigrants residing in Arab countries. Estimates on the share of DAC members’ private flows at market terms are more difficult to derive. Nevertheless, total FDI from OECD members are estimated at 77% of the global total in 2012 (OECD, 2013b). Therefore, while the ODA flow figures presented here are close to the true total of these receipts, they potentially overestimate the weight of ODA in external finance as seen from a partner country perspective. Nevertheless the approach appears to be the most sensible given the data constraints and consistency/comparability issues. More details on data sources and analysis are provided in Annex D.
6 . The Gini coefficient is a measure of statistical concentration, which is widely used to measure income inequality. Higher Gini coefficient values indicate higher inequality.
7 . OOF in this document includes other official flows from DAC members and non-concessional lending by multilateral agencies.
8 . Own calculations based on WB data.

DCD/DAC(2013)29
12
Table 1. Summary table of main indicators by group1
Fragile LDCs(33 countries)
Non-fragile LDCs(15 countries)
Other fragile2
(16 countries)Mainly LMICs(22 countries)
Mainly UMICs3
(60 countries)
LDCs, IDA eligible and fragile
LDCs, IDA eligible but not fragile
Not LDCs, but IDA eligible and fragile
Not LDC, but IDA eligible and not fragile
Not LDCs, not IDA eligible and not fragile
727 139 604 1,410 2,723 768 805 1,770 1,422 6,348
4% 4% 3% 6% 5%
47% 53% 27% 31% 10%
73% 76% 53% 65% 23%
Low 0.30 (Niger) 0.32 (Mozambique) 0.39 (Zimbabwe) 0.46 (Papua New Guinea)
0.54 (Swaziland)
Median 0.42 0.47 0.56 0.65 0.73
High 0.63 (Kiribati) 0.70 (Samoa) 0.73 (Bosnia-Herzegovina)
0.77 (Grenada) 0.82 (Chile)
Low 0.28 (Afghanistan) 0.36 (Cambodia) 0.30 (Pakistan) 0.31 (Tajikistan) 0.26 (Ukraine)
Median 0.39 0.40 0.39 0.39 0.45
High 0.64 (Comoros) 0.57 (Zambia) 0.61 (Micronesia, Fed. States)
0.57 (Honduras) 0.66 (Seychelles)
25% 36% 21% 22% 20%
38,535 11,003 18,248 17,821 28,217
Share of total ODA 4 34% 10% 16% 16% 25% 51 79 30 13 10
-10% -5% -3% 1% 10%7% 10% 2% 0.9% 0.2%5% 10% 2% 0.9% 0.2%
88% 81% 68% 43% 55%
16,418 3,571 50,239 82,638 449,891
3% 1% 8% 14% 75%
70% 75% 27% 18% 6%
23% 23% 26% 20% 26%
Tax revenue / GDP 20%(11% excl. Angola)
17% 12% 17% 19%
24% 27% 31% 28% 28%
28% 43% 7% 4% 0.6%ODA / Tax revenue 43% 59% 13% 5% 0.8%
28% 36% 6% 3% 0.6%1. All data refers to 2011 except for data on poverty and GINI index, which show the latest figures available.2. Note that Egypt, Iraq, Libya and Syria are included in this group even though they are not IDA eligible countries. 3. Note that Equatorial Guinea is included in this group even though it is still considered an LDC. 4. Due to rounding errors the shares sum up to 101%
ODA / total external financial resources
ODA per capitaChange 2010-2011ODA / GDP
Grant share of ODA
ODA / Government revenue
ODA / Government expenditure
Government revenue / GDP
Government expenditures / GDP
Share of ODA in domestic resources:
External debt stock (% of GNI)Development finance
ODA (USD million)
Other external resources (USD million)Share of total other external resources
ODA (excl. debt relief) / GDP
Average annual growth (2000-11)
Poverty: % of population living on less than USD 1.25 per day % of population living on less than USD 2 per day
HDI
Gini coefficient
Characteristics
Population (million)GDP per capita

DCD/DAC(2013)29
13
Basic characteristics of the country groupings
27. The GDP per capita gap between groups is large. As shown in Figure 4A, there is a clear difference across the groups in terms of income levels. Both Fragile and Non-Fragile LDCs have the lowest GDP per capita, below USD 805, and growth rate over the past decade (2000-11) has been below 4%. Higher growth rates are observed for a few countries in these groups, namely Angola9 among Fragile LDCs, and Cambodia, Bhutan, and Mozambique among Non-fragile LDCs. The GDP per capita of groups Other Fragile and Mainly LMICs is almost twice as much as that of Fragile LDCs and Non-Fragile LDCs, standing at USD 1,422 to USD 1,790, respectively. GDP per capita jumps even higher for Mainly UMICs, at USD 6,348. Economic growth has been sustained for Mainly LMICs and Mainly UMICs, with average annual growth rates between 5% and 6%, but, as expected, much slower for conflict-affected countries in Other Fragile (which groups fragile countries that are neither LDCs nor IDA eligible). In particular, of all the groups considered in this paper, Mainly LMICs has recorded the strongest GDP per capita growth, at an average annual rate of 6% in 2000-11, nearly doubling its GDP per capita over the past 11 years. Figure C.3 in Annex C also shows the overall dispersion of income per capita across developing countries, which has widened in absolute terms.
28. The incidence of poverty is highest in LDCs, but the largest share of the world’s poor lives in Mainly LMICs. Despite the positive economic performance of some groups in recent years, the elimination of extreme poverty and a fairer distribution of wealth remains a challenge for all. The LDCs (both fragile and non-fragile) have the highest incidence of extreme poverty, with around half of their population living on less than USD 1.25 a day. If the USD 2 dollars a day threshold is used, this figure becomes even more worrying, as over 70% of the population in Fragile LDCs and Non-Fragile LDCs is below this threshold (Figure 4C). However, in accordance with the findings in Sumner (2010), as well as this papers’ analysis, the largest share of the world’s poor - and the world’s extreme poor - lives in Mainly LMICs, where the presence of India is predominant with its 395 million extreme poor (93% of the total in the group). The second largest share of the world’s poor is found in Fragile LDCs (e.g. countries that are fragile, LDCs, and IDA eligible), and the third largest in Mainly UMICs.
29. Reducing inequality remains a challenge for countries in all groups. The median Gini coefficient is highest for Mainly UMICs (0.45); however, this is not significantly different from the other groups (median of 0.39-0.40). Mainly UMICs also has the largest range in Gini coefficient from a low of 0.26 in Ukraine to a high of 0.66 in the Seychelles (see Table 1). However, we observe a geographic pattern, where inequality is highest in Central and South America (11 of the 20 countries with the highest inequality levels are located here) and sub-Saharan Africa (8 out of the 20 countries with the highest inequality levels), while the lowest in South and Central Asia, and Europe.
30. External debt has reduced considerably over time. As Table 1 shows external debt currently constitutes between 20% to 36% of GNI for ODA recipients, having decreased considerably over the past decade, partially thanks to debt relief operations by the HIPC and MDRI initiatives. In 2011, the stock of external debt as a share of GNI was highest for the group of Non-fragile LDCs (36%) and ranged between 25% and 20% for all other groups. In 2005-6 large debt relief operations were implemented in several African countries and Iraq, while in 2011 some debt relief operations were targeted to Fragile LDCs (e.g. DRC and Malawi). A few countries in the Mainly LMICs group also received significant debt relief in 2006 (e.g. Ghana, Bolivia, Honduras, and Nicaragua).
9 . Much of Angola’s economic growth over the past decade can be directly attributed to the exploration of natural resources, with oil still accounting for about 80% of government revenue, 90% of exports and 47% of the country’s GDP (African Economic Outlook, 2013).

DCD/DAC(2013)29
14
Figure 4. Basic characteristics of the groups
1. Latest available estimates.
Access to development finance
31. To understand countries’ access to development finance it is important to examine the composition of ODA and its importance compared to other external flows for countries with different potential access to concessional funds.
502 (Fragile LDCs)
768 (Fragile LDCs)
527805
1,3191,770
7821,422
3,625
6,348
0500
1,0001,5002,0002,5003,0003,5004,0004,5005,0005,5006,0006,500
200020012002 200320042005 200620072008 200920102011
2011
USD
A. GDP per capita
Fragile LDCs Non-fragile LDCsOther fragile Mainly LMICsMainly UMICs
93%
25%
107%
36%
56%
21% 30% 22%
35%
20%
0%
20%
40%
60%
80%
100%
120%
2000 2001 2002 2003 2004 2005 2006 2007 2008 2009 2010 2011%
of G
NI
B. External debt stock as % of GNI
Fragile LDCs Non-fragile LDCsOther fragile Mainly LMICsMainly UMICs

DCD/DAC(2013)29
15
Figure 5. Importance of ODA as a source of development finance
How important is ODA seen from recipients perspective?
32. ODA is the largest external financial flow for LDCs. Nearly all LDCs, irrespective of whether they are fragile or not, remain strongly dependent on ODA flows. For these countries, ODA flows are the bulk of external financial resources, accounting for over 70% of all external flows, while FDI and other external financial flows remain modest. In the past five years, LDCs that are not fragile have recorded stagnating ODA levels and increasing inflows of remittances and private capital, which led to a decline in
5% 5%
13%10%
1.4%1.7%
1.3% 0.9%0.3% 0.2%0%
1%2%3%4%5%6%7%8%9%
10%11%12%13%14%
200020012002200320042005200620072008200920102011
% o
f GDP
B. ODA (excl. debt relief) as % of GDP
Fragile LDCs Non-fragile LDCsOther fragile Mainly LMICsMainly UMICs
3.0%3.1%3.2%
2.3%
4.5%
2.1%
4.1%3.2%
2.6%
0%
1%
2%
3%
4%
5%
6%
7%
2000 2001 2002 2003 2004 2005 2006 2007 2008 2009 2010 2011
% o
f GDP
C. Other external financing as % of GDP
Fragile LDCs Non-fragile LDCsOther fragile Mainly LMICsMainly UMICs

DCD/DAC(2013)29
16
the weight of ODA in total external resources (from 85% in 2000-06 to 73% in 2007-11). Despite this, this group has the highest share of ODA to all external resources. Countries in the Mainly UMICs group, and to a lesser extent countries in Other Fragile and Mainly LMICs groups, show less dependence on ODA flows. ODA still forms a good share of external financial flows (ranging between 27% and 6%), but these countries also have a greater capacity to attract other external financial flows, such as FDI and remittances. In the Mainly UMICs group, FDI and other private flows at market terms and remittances are by far the most important external flows, accounting for 57% and 27%, respectively, of total external financial resources. (See also Figure C.1 in Annex C for illustrations of the relative importance of ODA.)
33. For countries where ODA forms a large share of total external flows, drops in ODA have not, or only marginally, been counterbalanced by increases in other external financial flows. This is mainly because other external flows to these countries have been much more volatile (see Figure 5B and 6C) and their size too modest to compensate, in macroeconomic terms, for ODA falls.
34. ODA, excluding debt relief, represents as much as 10% of GDP for Non-Fragile LDCs, respectively, but 0.2% for the group of Mainly UMICs. As shown in Figure 5B, while the importance of ODA as a share of GDP has decreased for Non-Fragile LDCs it has remained stable on average for the other groups.
35. For LDCs ODA represents half of domestic government tax revenues. For LDCs, irrespective of whether they are fragile or not, ODA volumes are sizeable not only compared to total external flows, but also to resources mobilised domestically. In 2011, ODA as a share of government tax revenues was over 40% for Fragile LDCs and Non-Fragile LDCs, while ODA as a share of government revenues (excluding grants) was 43% for Non-Fragile LDCs and 28% for Fragile LDCs. The same shares were much smaller for the remaining groups. In particular, for Mainly UMICs they are below 1% (Table 2).
36. ODA growth is accelerating for Mainly LMICs and Mainly UMICs. ODA to all developing countries has increased at an average annual rate of 6% between 2000-11, but across groups ODA growth was strongest for Other Fragile (10%) and Fragile LDCs (8%), it stood at 4% for Non-Fragile LDCs and Mainly LMICs, while it was weakest for Mainly UMICs, at 1.4%. However, in the past three years there has been a shift. While ODA growth for LDCs and Other Fragile countries is slowing down, its pace is increasing for Mainly LMICs and Mainly UMICs, mainly as a result of increased concessional lending. A similar trend emerges from the ODA projections derived from the Forward Spending Survey (OECD 2013c, forthcoming), which point to decreases or no change in CPA allocations to Fragile and Non-Fragile LDCs and increases for the other groups, over the 2012-16 period (Table 2).
Table 2. ODA growth by group
2000-07 2008-11 2012-161
Fragile LDC 10% 6% 0%Non-fragile LDCs 4% 4% -1%Other fragile 10% 4% 2%Mostly LMICs 1% 8% 3%Mostly UMICs 1% 3% 1%1. CPA estimates based on the 2013 Survey on Donors' Forw ard Spending Plans

DCD/DAC(2013)29
17
Which ODA instruments are used and for whom?
Figure 6. ODA grants as a share of ODA, by group
37. Although the bulk of ODA is still provided in the form of grants, in the past three years the growth of ODA loans has surpassed the growth of ODA grants. Throughout the past decade, grants have increased faster than loans: at an average annual rate of 6%, against an average rate of 3% for loans. However, splitting the observation period in two, we find that the annual growth rate of grants has slowed down over the past three years, while loans have increased much faster (grants: from 7% in 2000-7 to 3% in 2008-11, loans: from -0.1% in 2000-07 to 9% in 2008-11). In addition, a growing share of loans from DAC members is made from market-raised funds, some of which without a subsidy. Provisional data for ODA loans indicate that, in 2011, 88% of concessional loans were made from market-raised funds, either in full (48.5%) or partially (39.8%), and market-raised loans without a subsidy represented 31% of all loans.
38. The grant share of ODA varies across groups, ranging between 88% of Fragile LDCs and 43% of Mainly LMICs. Remarkably, groups with a very different ability to attract external flows other than ODA (like Other Fragile and Mainly UMICs) receive very similar shares of ODA as grants (68% and 55%, respectively). However, three quarters of the total value of concessional loans made from market-raised funds without a subsidy was committed to countries in the Mainly UMICs group.10
39. Non-fragile LDCs receive the largest ODA per capita. Although ODA to Non-fragile LDCs grew only marginally in the past decade (at 4% annually, on average), this group, in terms of ODA per capita, receives the most, being de facto prioritised by donors. This group also has the smallest average population, therefore this finding is in line with the empirical evidence of the “small country bias”, or the fact that more populous countries tend to receive less ODA per capita. Annually this group receives USD 79, against USD 51 per capita to Fragile LDCs. The group that clusters Mainly UMICs receives the lowest ODA per capita: USD 10 per capita a year.
10 . Own calculations based on the Secretariat survey on ODA loans.

DCD/DAC(2013)29
18
ANNEX A: UNPACKING DEVELOPMENT FINANCE FOR EACH COUNTRY GROUPING
A.1. Fragile LDCs group
40. This group clusters 33 LDCs that are fragile and eligible to receive concessional lending from IDA, or in other words are in all lists. In this group consists of, for the most part (20 out of 33) Low income countries (LICs) in sub-Saharan Africa; it also includes four LICs in Asia and one in Central America, and eight MICs in Asia, Oceania and sub-Saharan Africa. One-third of the countries are also considered natural resources rich, either in oil or minerals.
A.1.1. Group characteristics
41. This group of countries was home to 727 million people in 2011 (or 13% of the population in developing countries), of which nearly half live in the three largest countries: Bangladesh, Democratic Republic of Congo and Ethiopia. Nearly all countries in this group have a low level of human development according to the HDI index11, with Niger and Democratic Republic of Congo showing the lowest scores. Nearly 70% of the countries in group 1 are located in Sub-Saharan Africa and most of the remaining countries in Asia or Oceania. One-third of the countries are also considered rich in natural resources, either in oil or minerals.12
42. Over the past decade, the countries in this group have experienced an average annual GDP per capita growth rate of 4%; however, most of the growth can be attributed to a small group of countries. While a few countries, such as Angola, Ethiopia and Rwanda, have grown rapidly over the past decade, several others are still struggling to grow their economies, especially Central African Republic, Eritrea and Madagascar, which have experienced negative development in terms of GDP per capita. In addition, despite the growth and the significant efforts made by several countries to reduce the number of poor people, nearly half of the population in these countries still live on less than USD 1.25 per day and almost three-quarters live on less than 2 USD per day. As an example, despite Angola managing to move from low-income status in the early 2000s to an upper-middle income country in 2011, 43% of its population still lives on less than USD 1.25 per day13, and the country does not yet fulfil all criteria to graduate from the UN list of LDCs.
43. Significant debt relief in 2006 and 2010-11 contributed to reduce the external debt stock of countries in group 1 from 93% of GNI in 2000 to 25% of GNI in 2011. In 2006, large debt relief operations were granted to several African countries (e.g. Ethiopia, Madagascar, Malawi, Niger, and Uganda), reducing their external debt stock by two-thirds. In 2010 and 2011, significant debt relief operations were mostly focused on conflict-affected states such as DRC and Liberia, cutting their external debt by 75%. Despite increasing over the past decade, tax revenue as a share of GDP remains low in comparison to countries in the other groups.
11 . This group also includes Somalia, South Sudan and Tuvalu that have no HDI ranking.
12 . As per the definition in IMF (2012), resource-rich countries are either a LIC or LMIC and have either natural resource revenue or exports on average at least 20% of total fiscal revenue and exports, respectively, over 2006-2010.
13 . This share may have changed since the latest poverty estimates for Angola are from 2009. From 2000 to 2009, the proportion of people living on less than USD 1.25 per day dropped from 54% to 43%, averaging 1.2% per year.

DCD/DAC(2013)29
19
A.1.2. Development Finance
44. Countries in this group rely heavily on ODA as a major source of external finance. In real terms, ODA has nearly tripled since 2000, from USD 14 billion to USD 39 billion in 2011. Other external financing doubled from USD 8 billion in 2000 to USD 16 billion in 2011; nearly this entire increase happened over the past five years. In addition, nearly half of the recent increase can be attributed to additional inflows to Angola and Bangladesh. In 2011, nearly half of all inflows of private resources at market terms were directed to Angola (44%; up from 34% in 2007), and more than one-third of remittances arrived in Bangladesh (37%; up from 33% in 2007).
45. Despite these increases in other external resources, ODA remains the main source of external finance. Excluding debt relief, ODA flows have been more stable than other external financial flows and have increased at times of falls in other external finance. The ODA volume is on average almost half the size of domestic tax revenues and less than one-third of all government revenues (excluding grants), but within-group variations are large.14
46. The share of ODA grants has increased since 2002. In 2011, grants accounted for 88% of total ODA. This signifies the increased efforts by donors to increase ODA and direct it towards the poorest and most fragile countries. More details are provided in the bullets below.
Importance of ODA as a source of development finance
ODA is the main source of external finance and its weight is not shrinking. ODA accounted for 72% of all external financial resources in 2000-11, compared to 45% for all ODA recipients over the same period. The weight of ODA on total external financial resources was lowest in 2003 (at 63%) and reached a peak of 83% in 2006, standing at 70% in 2011.
Declines in ODA volumes, when present, have not been mitigated by increases in other external financial flows. Over the 2000-11 period, gross ODA (excluding debt relief) increased at an average annual rate of 8%, nearly twice the rate for all ODA eligible countries. Gross ODA (excluding debt relief) increased every year up to 2010, but dropped by 6% in 2011. Other external financial flows have increased by 7% per year since 2000, and still rose in 2011. However, they have also been more volatile, recording steep falls in 2002 (38%) and 2004 (53%) and a smaller decrease in 2010 (9%). At times of steep decreases in other external financial flows, gross ODA increased, potentially contributing to fill the financial gap.
The ODA volume is less than half of government tax revenues and a little less than one-third of total government revenue and expenditures, with the ODA-to-tax-revenues at 43%, and the ODA-to-government-revenues and expenditures standing at 28% and 27% respectively. There are, however, within group variations, as ODA in 2011 was more than four times government revenues in Liberia (e.g. ODA-to-government-revenues is 444%), and larger than government revenues in Afghanistan, Burundi, Central African Republic, Democratic Republic of Congo, Guinea-Bissau, Haiti, Sierra Leone, Solomon Islands and Togo, while it is very small compared to domestic resources in Angola15 where the ODA-to-government-revenues ratio in
14 . Since data on domestic tax revenue is not available for all countries in group 1, the figures only represent the group of countries where information is available.
15 . With a GNI per capita (atlas method) of USD 4,580 in 2011, Angola is well above the effective operational cut-off for IDA eligibility established at USD 1,195 in 2011 (fiscal year 2013). However, IDA also supports some countries that, like Angola, are above the operational cut-off but lack the creditworthiness needed to borrow from the International Bank for Reconstruction and Development (IBRD). Angola accesses IDA financing only on blend credit terms.

DCD/DAC(2013)29
20
percentage is 0.55%. ODA represents half of total domestic revenue and is higher than total government tax revenue if Angola is excluded from the analysis.
Donor prioritisation
In per capita terms, ODA was USD 51 in 2011, more than twice as much as the average ODA per capita for developing countries (USD 20). As a share of GDP, ODA grew from 5% in 2000 to 7% in 2011 (8% if excluding Angola).
Composition of ODA
ODA is provided almost exclusively in the form of grants. In 2011, grants represented 88% of total ODA excluding debt relief to this group, compared to 68% to all ODA recipients. There are no large variations within group, with most countries receiving 90% or more of aid as grants. However, the exceptions are Bangladesh and Mauretania, which received 60% of aid as grants in 2011.
Figure A.1. Key facts about development finance for Fragile LDCs
33 countries (727 mn people):
Afghanistan
Angola
Bangladesh
Burkina Faso
Burundi
Central African Rep.
Chad
Comoros
Congo, Dem. Rep.
Eritrea
Ethiopia
Guinea
Guinea-Bissau
Haiti
Kiribati
Liberia
Madagascar
Malawi
Mali
Mauritania
Myanmar
Nepal
Niger
Sierra Leone
Solomon Islands
Somalia
South Sudan
Sudan
Timor-Leste
Togo
Tuvalu
Uganda
Yemen
Fragile LDCs (LDC, IDA eligible and fragile; 33 countries)
In 2000-11, ODA has been the main source of external finance. Compared to all DAC recipients, fragile LDCs have a very large share of ODA in total external finance.
The grant share of ODA has increased since 2002.In 2000-11, both ODA and other external resources have been on an upward trend, but other external financial flows have been more volatile
0%
10%
20%
30%
40%
50%
60%
70%
80%
90%
100%
2000 2001 2002 2003 2004 2005 2006 2007 2008 2009 2010 2011 Allcountries
(2011)ODA OOF Private flows Private grants Remittances
-
10
20
30
40
50
60
2000 2001 2002 2003 2004 2005 2006 2007 2008 2009 2010 2011
2011
USD
bill
ion
ODA ODA(excl. debt relief)
Other external resources
0%10%20%
30%40%50%
60%70%80%
90%100%
2000 2001 2002 2003 2004 2005 2006 2007 2008 2009 2010 2011
Shar
e of
tota
l ODA
ODA grants ODA loans

DCD/DAC(2013)29
21
A.2. Non-fragile LDCs
47. This group clusters 15 LDCs eligible to receive concessional lending from IDA, but who are not fragile. These countries are concentrated primarily in sub-Saharan Africa, both LICs and LMICs. This group also includes one LIC in Asia, and four LMICs, two of which are in Asia and two in Oceania. Only two countries in this group are considered rich in natural resources.
A.2.1. Group characteristics
48. Together, these countries are home to 139 million people. The two most populous countries, Tanzania (42 million) and Mozambique (22 million), account for nearly half of the population. According to the HDI index, five countries in this group have a medium level of human development, while all the others have low human development, with Mozambique showing the lowest score. Two-thirds of the countries are in Sub-Saharan Africa while the remaining countries are in Asia and Oceania. Only two countries are considered rich in natural resources, namely Laos and Zambia.
49. Over the 2000-11 period, GDP per capita growth increased by 4% per year. Some countries, however, have grown at a sustained pace, like Bhutan (6%) and Cambodia (7%) in Asia, and Mozambique (6%), Rwanda (6%) and Tanzania (5%) in Africa. Overall, however, extreme poverty remains widespread, and its incidence is the highest of all five groups, both in terms of the USD 1.25 per day and USD 2 per day poverty lines. Over one-third of the countries in this group still have more than 70% of their population living with less than USD 2 per day, including Mozambique, Rwanda and Tanzania where GDP per capita growth has been fairly sustained over the past decade. Tanzania is also the country with the highest incidence of poverty, as the latest figures show that 88% of its population lives on less than USD 2 per day.
50. Still today, of all groups, this group has the highest external debt stock compared to GNI (36%). However, this share is considerably lower than it was at the beginning of the period, when it stood at 107%. Significant debt relief over the past decade, especially in 2006, contributed to a substantial reduction in the external debt stock of these countries. The main beneficiaries of debt relief operations have been Mozambique, Tanzania and Zambia. In these countries, external debt as a share of GNI declined by 40-70% between 2000 and 2011.
A.2.2. Development finance
51. In group 2 countries, ODA is not only the main source of external finance; its weight in external finance is the largest compared to all five groups examined. However, this weight has declined over the past five years because of stagnating ODA levels and increasing inflows of remittances and private capital. In 2011, countries in group 2 received more ODA per capita than all other groups, and 55% more per person than the countries in group 1 (USD 79 per capita compared to USD 51 in group 1). More details are provided in the bullet points below (see also Figure A.2).
Importance of ODA as a source of development finance
ODA is still the main source of external finance, but its weight has declined since 2006. ODA accounted for 85% of all external financial resources between 2000 and 2006, but this share decreased to 75% in 2011. However, the weight of ODA for this group remains larger than for group 1, and significantly above the average for all ODA recipients (16%). Over the entire time period (2000-2011), 80% of all external financial resources have been ODA.
Declines in ODA volumes, when they happened, have at times been slightly compensated by increases in other external financial flows. Some of the countries in group 2 received large debt relief operations in 2006, which resulted in a 168% increase of ODA from the previous year. Excluding debt relief, however, ODA growth was sluggish, on average 4% each year, and negative in both 2010 and 2011. Other external flows have grown at an average annual rate of 6%

DCD/DAC(2013)29
22
a year since 2000. While ODA excluding debt relief dropped in four years (by 7% in 2003, by 4% in 2005, by 2% in 2010, and by 3% in 2011), other external flows increased during two of those drops (e.g. 13% in 2005, and 7% in 2011). However, as the volume of other external resources is small as compared to that of ODA flows, increases in the former have only partially compensated for ODA decreases.
ODA represents three-fifths of government tax revenues and slightly more than one-third of total government revenue and expenditures, with the ODA-to-tax–revenues at 59% and the ODA-to-government-revenues and expenditures standing at 43% and 36% respectively. As compared to government revenues, ODA represents more than government tax revenues and 82% of total government revenues in Rwanda, while it represents around one-third of total government revenues in Zambia.
Donor prioritisation:
In 2011, countries in this group received 10% of total ODA to developing countries. Accounting for the size of the population, however, this group seems to be strongly targeted by donors, scoring highest in terms of ODA per capita (USD 79 per capita).
Composition of ODA
ODA is mainly provided as grants. In 2010-11, grants represented 81% of total ODA to this group, above the 68% to all ODA recipients, but below the 88% to countries in group 1. The share of grants was smallest in Bhutan and Senegal (both at 66%) and largest in Gambia and Vanuatu (93% and 100%, respectively).
Figure A.2. Key facts about development finance for Non-Fragile LDCs
15 countries (139 mn people):
Benin
Bhutan
Cambodia
Djibouti
Gambia
Laos
Lesotho
Mozambique
Rwanda
Samoa
Sao Tome & Principe
Senegal
Tanzania
Vanuatu
Zambia The grant share of ODA remains high and stable.
In 2000-11, ODA has been the main source of external finance. However, as other external resources have grown in recent years, the ODA share in total external resources has slightly declined from about 85% in 2000-06 to around 70% in 2007-11.
Non-fragile LDCs (LDC, IDA eligible but not fragile; 15 countries)
In 2000-11, ODA has remained flat while other external resources have only slightly increased.
0%
10%
20%
30%
40%
50%
60%
70%
80%
90%
100%
2000 2001 2002 2003 2004 2005 2006 2007 2008 2009 2010 2011 Allcountries
(2011)ODA OOF Private flows Private grants Remittances
-
5
10
15
20
25
30
2000 2001 2002 2003 2004 2005 2006 2007 2008 2009 2010 2011
2011
USD
bill
ion
ODA ODA(excl. debt relief)
Other external resources
0%10%
20%
30%40%
50%60%
70%
80%90%
100%
2000 2001 2002 2003 2004 2005 2006 2007 2008 2009 2010 2011
Shar
e of
tota
l ODA
ODA grants ODA loans

DCD/DAC(2013)29
23
A.3. Other fragile
52. This group clusters 16 countries that are fragile and eligible to receive concessional lending from IDA but are not LDCs. This group mainly covers LMICs (12 out of 16). The countries in this group are scattered across the world with two countries in Europe, four in North Africa and the Middle East, four in Asia and Oceania and six countries in Sub-Saharan Africa. Six countries are rich in natural oil resources, of which four are in Africa.16
A.3.1 Group characteristics
53. Together, these countries are home to 597 million people. However, more than half of the population in this group can be found in Nigeria (160 million) and Pakistan (175 million). Countries in this group have different levels of human development according to the HDI, ranging from high (e.g. Bosnia, Herzegovina and Sri Lanka) to low (e.g. Zimbabwe and Cote d’Ivoire). The countries in this group are scattered across the world with two countries in Europe, four in North Africa and the Middle East, four in Asia and Oceania and six countries in Sub-Saharan Africa. Six countries are rich in natural oil resources, of which four are in Africa.
54. The average GDP per capita in this group is USD 1,770, well above the figure for groups 1 and 2 (USD 768 and 805, respectively), but with wide within-group variations (from USD 741 in Zimbabwe to USD 5,620 in Libya). Over the 2000-11 period, GDP per capita growth was modest (3%), but dropped by 4% in 2011 because of the turmoil following the Arab spring and the events following the 2010 presidential election in Cote d’Ivoire. The fastest growing countries are Nigeria and Sri Lanka, at an average annual rate of 6% and 4%, respectively. The weak GDP growth in this group leaves 27% of the population in extreme poverty; however, nearly all poor can be found in three countries: Kenya, Nigeria and Pakistan. In addition, over half of the population live in poverty based on the USD 2 per day poverty line. The incidence of poverty is lowest for Bosnia-Herzegovina and Egypt, and is highest in Nigeria and Republic of Congo, where 78% and 74%, respectively, of the population lives on less than USD 2 per day. The group is also heterogeneous in terms of income inequality, with values of the Gini coefficient ranging between 0.30 (Pakistan) and 0.61 (Micronesia).
55. The external debt stock of this group decreased from 56% of GNI in 2000 to 21% of GNI in 2011. As for groups 1 and 2, this fall is partially due to debt relief operations throughout the past decade, especially in 2006. The largest beneficiaries of debt relief were: Nigeria, Iraq, and Cameroon. Consequently, Nigeria saw a fall in its external debt stock from 78% of its GNI in 2000 to 6% of its GNI in 2011 (-92%), while in Cameroon the external debt stock decreased from 112% of GNI in 2000 to 12% of GNI in 2011 (-89%).
A.3.2. Development Finance
56. ODA is not the largest external financial flow to this group, and yet still a significant source of external finance, making up 27% of total external financial resources in 2011. Remittances are the largest external flow, representing 37% of the total, while private flows at market terms are the third largest external flow, representing 31% of the total. This is a recent configuration in the development finance to this group, as ODA was the largest external financial flow until 2006, when the large increases in remittances and private flows at market terms that began taking off in 2005, mainly benefitting Egypt and Nigeria, combined with slight decreases in ODA, made ODA the third largest external flow. Excluding debt relief, ODA volumes doubled from 2000 to 2011, mainly because of a surge in ODA to Iraq following the war. After the peak in 2005, ODA excluding debt relief decreased for three consecutive years in 2006-
16 . There are four countries in this group which are not IDA eligible; however because of their state of fragility, they are still included. These are Egypt, Libya, Iraq and Syria.

DCD/DAC(2013)29
24
08, and again in 2010, and in two of those years (2007 and 2008) other external flows increased, potentially compensating for ODA falls in macroeconomic terms. ODA is fairly small compared to government revenue; however, it still represents more than 30% in Cote d’Ivoire, Kenya and Kosovo. This group receives a small share of ODA to all ODA recipients (16%) and USD 30 per capita. More details are provided in the bullet points below (see also Figure A.3).
Importance of ODA as a source of development finance
Since 2006, ODA is no longer the largest external financial flow. Since 2006, ODA has become the third largest external financial flow, but still represents a significant source of external finance, making up 27% of total external financial resources in 2011. Remittances and private flows at market terms represent two-thirds of all external financing from DAC countries, of which 27% of FDIs and 59% of remittances are benefitting Nigeria. For over half of the countries in this group, however, ODA still represents more than 70% of total external financial flows.
Declines in ODA volumes, when they happened, have not been mitigated by increases in other external financial flows. Excluding debt relief, ODA increased rapidly from 2003 to 2005, mainly because of a surge in ODA volume to Iraq, but has since stabilised. On average ODA volume grew by 7% each year in 2000-11, while other external flows recorded a much stronger growth, on average by 12% yearly. ODA decreased for three consecutive years, in 2006-08, as well as in 2010. In two of those years other external financial flows also decreased. Including debt relief, ODA fluctuations are much stronger, as ODA skyrocketed in 2006 due to the USD 17 billion debt relief to Iraq. The following year the ODA levels remained high due to large debt relief to Nigeria and Cameroon; however, then fell sharply in 2007.
ODA represents 13% of government tax revenues and 7% and 6% of total government revenue and expenditures, respectively. Only for six of the 16 countries in this group, however, is ODA fairly small compared to government revenues (with a ODA-to-government-revenues ratio below 8%), namely: Bosnia-Herzegovina, Democratic Republic of Congo, Egypt, Iraq, Libya, and Nigeria; while for all other countries the same share ranges between 13%-35%. However, with the exception of Egypt, the countries with a small ODA to government revenues ratio have a large ODA-to-tax-revenues ratio (ranging between 15% to 193%), signalling that much of their government revenues derive from sources other than taxes, such as public enterprises’ revenues and grants other than those included in the ODA flows considered (e.g. from non DAC members).
Donor prioritisation:
The volume of ODA per capita is well below that of groups 1 and 2, standing at USD 30. Like the Mainly LMICs, this group receives 15% of total ODA to all groups. However, in per capita terms, it receives more than twice the ODA volume of the group of Mainly LMICs (USD 12).
Composition of ODA
Grants make up more than two-thirds of ODA to this group (68% in 2011). Three countries in this group receive ODA mainly as concessional loans (e.g. Bosnia-Herzegovina, Cote d’Ivoire, and Sri Lanka), while for all others more than half of ODA is grants.
DCD/DAC(2013)29
25
Figure A.3. Key facts about development finance for Other Fragile
A.4. Mainly LMICS
57. This group clusters 22 countries that are eligible to receive concessional lending from IDA, and are neither LDCs nor fragile. Only two countries in this group are LICs (Kyrgyz Republic and Tajikistan), and five are UMICs, while the bulk is made up of LMICs, almost half of which are in Asia. Overall, 80% of the countries in this group are in either Asia or in the Americas. Six countries are rich in natural resources.
A.4.1. Group characteristics
58. Under many aspects, this group is dominated by the presence of India, by far the largest economy and the most populous country in the group. Together, countries in group 4 are home to over 1.4 billion people, of which 1.1 billion live in India alone. Vietnam is the second most populous country, with a population of nearly 84 million (or 6% of total population in the group). Most of the countries in this group have a medium HDI, with the exception of India and Papua New Guinea, which have a low HDI, and St. Lucia, which has a high HDI. Around 80% of the countries in this group are in either Asia or in the Americas. Six countries are rich in natural resources, for Guyana, Papua New Guinea and Uzbekistan this is in the form of gold.
59. Of all the groups considered in this paper, group 4 has recorded the strongest GDP per capita growth, at an average annual rate of 6% in 2000-11, nearly doubling its GDP per capita over the past 11 years. GDP per capita growth was fastest in Armenia, which had an average annual growth rate of 7%, but a similar pace was recorded in Georgia, India, Mongolia, Tajikistan, Uzbekistan and Vietnam. Despite this good performance in terms of GDP per capita growth, the group is home to the largest share of the world’s poor with nearly one-third of the population, or 425 million people, still living in extreme poverty, of
16 countries (604 mn people):
Bosnia-Herzegovina
Cameroon
Congo, Rep.
Cote d'Ivoire
Egypt1
Iraq1
Kenya
Kosovo
Libya1
Marshall Islands
Micronesia, Fed. States
Nigeria
Pakistan
Sri Lanka
Syria1
Zimbabwe
In recent years the increase in other external resources have outperformed ODA.
1. Egypt, Iraq, Libya and Syria are included in this group because of their fragil ity. However, do they are not IDA eligible countries.
Other fragile (Not LDC, but IDA eligible and fragile; 16 countries)
In 2000-11, ODA has fluctuated around one-third of total external resources. In recent years, remittances have grown to represent the largest share of all external financing. The share of ODA and remittances are higher than the average for all countries, while the share of private flows is less than the average.
The grant share of ODA has fluctuated over time, remaining on a high level.
0%
10%
20%
30%
40%
50%
60%
70%
80%
90%
100%
2000 2001 2002 2003 2004 2005 2006 2007 2008 2009 2010 2011 Allcountries
(2011)ODA OOF Private flows Private grants Remittances
-
10
20
30
40
50
60
70
2000 2001 2002 2003 2004 2005 2006 2007 2008 2009 2010 2011
2011
USD
bill
ion
ODA ODA(excl. debt relief)
Other external resources
0%10%
20%30%40%50%60%70%
80%90%
100%
2000 2001 2002 2003 2004 2005 2006 2007 2008 2009 2010 2011
Shar
e of
tota
l ODA
ODA grants ODA loans

DCD/DAC(2013)29
26
which nearly all are in India (93%). An additional 475 million people, of which 405 million are in India, live on less than USD 2 per day17. However, the share of the population living in extreme poverty drops to 18% if India is excluded from the analysis. The median Gini coefficient for this group is the lowest across all groups. Similarly to the other groups, however, income inequality varies largely across countries, ranging between 0.31 (Tajikistan) and 0.57 (Honduras).
60. In 2000, the average external debt stock as a share of GNI of all countries in this group was considerably lower than that of groups 1 and 2, standing at 30%. After reaching a low of 19% in 2008, the external debt stock as a share of GNI has increased slightly, reaching 22% in 2011. Debt relief operations, especially in 2006, contributed to reducing the external debt stock by 30%-70% for some of the most indebted countries in 2000 (e.g. Bolivia, Ghana, Honduras, and Nicaragua). However, despite several debt relief operations for Nicaragua during the years 2004-07, Nicaragua’s external debt stock still remains higher than its GNI.
A.4.2. Development Finance
61. From 2000 to 2006, ODA accounted for more than one-third (38%) of total external finance; however, with a surge in private flows to India over recent years, its relative weight declined to 18% in 2011. The reduced weight of ODA in external financial flows is mainly due to the strong increases in private flows at market terms, which surged from USD 5 billion in 2000 to USD 33 billion in 2007, and stood at 37 billion in 2011. In addition, remittances grew from USD 10 billion in 2000, to USD 26 billion in 2007 and stood at USD 35 billion in 2011. While most of the increase can be attributed to India, foreign direct investments and remittances to other countries in group 4 increased as well (e.g. FDIs to Vietnam tripled and remittances doubled between 2006 and 2011), reducing the share of ODA of total external resources from 59% to 32% if India is excluded from the analysis. For all countries in group 4, ODA volumes were merely 5% compared to government tax revenue in 2011; however, this rises to 18% if India is excluded from the analysis, and in some countries, such as Cape Verde and Nicaragua, ODA still compares to more than 50% of total government tax revenue. Like group 3, countries in this group receive 16% of ODA. ODA per capita is also low compared to all other groups; however, this is heavily biased by India. ODA per capita is increased fourfold if India is excluded from the analysis. This group has the lowest grant share of ODA (43%), mainly due to increases in ODA concessional loans in the past three years (2008-11). Nearly all countries in this group are so-called blend countries, i.e. eligible for IDA but also creditworthy for some IBRD borrowing. More details are provided in the bullet points below (see also Figure A.4).
Importance of ODA as a source of development finance
The importance of ODA as a source of external finance is declining. ODA accounted for more than one-third of total external finance in 2000-06 (38%), with a peak of 46% in 2001. However, since 2007, other external flows gained prominence, exceeding the volume of ODA and shrinking the share of ODA to 18% of total external finance in 2011. Among other external flows, private flows at market terms recorded the largest increases, growing on average by 26% every year in 2000-11 and increasing sevenfold in this span of time, from USD 5 billion in 2000 to USD 37 billion in 2011. Over the same period, the volume of remittances tripled, standing at an estimated level of USD 35 billion in 2011, and representing the second largest external financial flows in 2011 (35% of total external flows), after private flows at market terms (37%).
Drops in ODA, when they happened, have often been mitigated by increases in other external financial flows. Between 2000 and 2011, ODA has grown at an average annual rate of
17 . After India, where 69% of the population live below the USD 2 per day poverty line, poverty incidence is highest in Nicaragua (64%), Papua New Guinea (57%), Ghana (52%), and Vietnam (43%).

DCD/DAC(2013)29
27
3%, against 14% of the other external financial flows, but these averages hide some fluctuations over time. Disregarding ODA fluctuations due to debt relief operations, ODA slightly declined five times (by 3% in 2002, by 5 in 2003, by 1% in 2005, by 6% in 2006, and by 1% in 2011) while in the same years other external flows increased considerably (by 23% in 2002 and 2003, by 26%% in 2005, by 44% in 2006, and by 33% in 2011).
ODA volumes are small compared to government tax revenues (5%) and total government revenue (4%) and expenditures (3%). India weighs much in this average and, together with Uzbekistan, is the only country with an ODA-to-government-revenues ratio smaller than 5%. Only three countries in this group have an ODA-to-government-revenues ratio higher than 30%, namely: Cape Verde, Nicaragua, and Tonga.
Donor prioritisation:
ODA per capita is low compared to all other groups but group 5 (USD 13); however, it exceeds both group 1 and group 3 if India is excluded (USD 57). Countries in this group receive 16% of ODA to all groups, the same share as the group of Other Fragile; however, more than half of ODA in 2011 went to India and Vietnam.
Composition of ODA
Grants make for less than half of ODA to this group. Grants represented on average 51% of ODA until 2007, but the increases in concessional loans over the past three years brought this share to 44%, as a 2008-11 average, and to 43% in 2011. Most of the countries in this group received between 50% and 85% of their aid as grants in 2011; however, the grant share for India and Vietnam was merely 25% because of large loans from Japan and the World Bank.

DCD/DAC(2013)29
28
Figure A.4. Key facts about development finance for Mainly LMICs
A.5. Mainly UMICs
62. This group clusters 60 countries that are not LDCs, not eligible to receive concessional lending from IDA, and not fragile, but are on the DAC list of recipients. These are mainly UMICs (63%), largely in America and Asia. There are a few countries rich in natural resources, among which Indonesia is the only LMIC. Several of the countries are also OECD members.
A.5.1. Group characteristics
63. In many ways, this group is dominated by the presence of China, by far the largest economy and the most populous country in the group. At the same time, it is the most heterogeneous group, clustering together countries as different as small islands like St. Kitts Nevis and Seychelles, as well as large economies like China, Brazil, and Mexico. Together, countries in this group are home to 2.7 billion people, of which almost half live in China (1.3 billion). They have a medium, high or very high HDI18. Over 60% of countries in this group are LICS, mainly in America or Asia. Among the LMICs, Indonesia is the only one identified as rich in natural resources (oil) (IMF, 2012).
64. This group has by far the highest GDP per capita, USD 6,265 in 2011. As in group 4, GDP per capita has grown at a sustained pace over the past decade, at an average annual rate of 5.2%. Although GDP per capita in China grew at an impressive average annual rate of 10%, this was still less than
18 . Nine countries in this group have no HDI ranking, but share all other characteristics: Anguilla, Cook Islands, F.Y.R. of Macedonia, Montserrat Nauru Niue St. Helena Tokelau Wallis & Futuna Korea have no HDI ranking.
22 countries (1410 mn people):
Armenia
Bolivia
Cape Verde
Dominica
Georgia
Ghana
Grenada
Guyana
Honduras
India
Kyrgyz Republic
Maldives
Moldova
Mongolia
Nicaragua
Papua New Guinea
St. Lucia
St.Vincent & Grenadines
Tajikistan
Tonga
Uzbekistan
Vietnam
Since 2008, countries in this group have receives a higher share of ODA loans than ODA grants.
In 2000-11, private flows and remittances have been the main source of external finance for this group. With the growth in private flows in the past 5 years, the ODA share in total external finance has been reduced to less than 20%.
Mainly LMICs (not LDC, IDA eligible but not fragile; 22 countries)
While ODA has remained stable since 2000, the countries in this group have experienced a large increase in other external resources.
0%
10%
20%
30%
40%
50%
60%
70%
80%
90%
100%
2000 2001 2002 2003 2004 2005 2006 2007 2008 2009 2010 2011 Allcountries
(2011)ODA OOF Private flows Private grants Remittances
-
10
20
30
40
50
60
70
80
90
2000 2001 2002 2003 2004 2005 2006 2007 2008 2009 2010 2011
2011
USD
bill
ion
ODA ODA(excl. debt relief)
Other external resources
0%10%20%
30%40%50%60%70%
80%90%
100%
2000 2001 2002 2003 2004 2005 2006 2007 2008 2009 2010 2011
Shar
e of
tota
l ODA
ODA grants ODA loans

DCD/DAC(2013)29
29
Azerbaijan, Equatorial Guinea and Turkmenistan which all grew by 12%19. The incidence of extreme poverty is much lower than in any other group, based on the latest estimates, 10% of the population (261 million) lived with less than USD 1.25 per day (8% excluding China). The share of the population living on less than USD 2 per day is 23%, or 627 million (19% excluding China). Nevertheless, because of the large population size, it is estimated that 22% of the world’s extreme poor live in countries in this group.
65. In 2000, at the beginning of the period considered, this group had a low external debt stock as a share of GNI (35%), which, after peaking at 38% in 2002, started to decrease and is now the lowest share among the groups considered (20%). At the aggregate level, debt relief increases over time to this group are negligible, as only a handful of countries were targeted for debt relief (e.g. Guatemala and Serbia). External debt still represents, however, a large share of GNI for a few countries, namely: Seychelles (184%), Jamaica (99%), Belize (96%), and Ukraine (83%).
A.5.2. Development Finance
66. For countries within this group, ODA accounts for a small share of total external financial flows (e.g. 7% in 2000-11, even when excluding China). ODA is less volatile than other external financial flows but too small to compensate significantly for any falls. Also compared to domestic resources, ODA is small, with the ODA-to-government-revenues, ODA-to-tax-revenues and ODA-to-government-expenditures ratios (in percentage) all at less than 1%. Nevertheless, these countries receive a good chunk of ODA to all DAC recipient countries: 25% in 2011, of which 55% of ODA is still in the form of grants. In per capita terms, this group receives much less ODA than the other groups, USD 10 per capita a year (USD 19 if China is excluded).
Importance of ODA as a source of development finance
ODA is small compared to other external financial flows. The ODA share in total external financial flows peaked in 2002 at 11%, mainly due to a fall of private flows at market terms. Otherwise, in terms of volume, ODA flows to this group were largest in 2011 (USD 28 million). In 2011 ODA accounted for 6% of all external flows, down from 8% in 2000. Turkey received the largest ODA volume in 2011, USD 3.7 billion, mainly consisting of loans from the European Investment Bank (EIB), or 12% of the ODA volume to the group for that year. The largest flows to this group are private flows at market terms, accounting for 57% of total external financial flows in 2011, followed by remittances (27%), and OOF (10%). However, there are significant within-group variations in terms of the importance of ODA as a source of external finance. In 2010-11, the weight of ODA on total external resources was smallest in Argentina, Brazil, and Venezuela (1%), followed by Chile, China, Mexico, and Uruguay (2%), while it was largest for small island countries, e.g. Nauru and Wallis and Futuna (99% and 96%, respectively).
ODA is less volatile than other external financial flows but too small to mitigate their falls. In 2000-11, ODA grew at an average annual rate of 2%, as compared to 4% of other external financial flows. However, fluctuations in ODA have been less dramatic than for the other external financial flows. These flows declined considerably in four years (by 13% in 2001 and 2002, by 19% in 2008, by 6% in 2009,) and slightly in 2011 (0.3%) and in three of those years ODA increased, but too little to compensate significantly for variations of the much larger other external flows (e.g. by 5% in 2001, by 4% in 2008, and by 11% in 2011).
19. Equatorial Guinea is technically still an LDC, but is included in this group since it was recommended for graduation from the LDC list in 2009 in accordance with the “income only” rule, as its GNI per capita level was several times above the income graduation threshold. However, the graduation of which was endorsed by the Council in 2009 but has not yet been taken note of by the General Assembly.

DCD/DAC(2013)29
30
ODA volumes are tiny compared to government tax revenues (0.8%) and total government revenue (0.6%) and expenditures (0.6%). However, for three countries ODA compares to more than 10% of total government revenue, namely: Albania (12%), Jordan (12%) and Swaziland (13%).
Donor prioritisation:
Countries in this group receive the lowest ODA per capita. In 2011, this group received 25% of all ODA flows to the five groups, second only to Fragile LDCs, which received 34% of all ODA. However, once we account for the size of the population, this group ranks at the bottom in terms of ODA received, with USD 10 per capita a year. Within this group, one-third of all ODA went to China (USD 2.7 billion), Indonesia (USD 2.7 billion) and Turkey (USD 3.7 billion).
Composition of ODA:
Grants make up over half of ODA. This average hides important within-group variations, as some countries received 100% of ODA as grants in 2010-11, while a smaller number of countries received less than 40% of ODA as grants (e.g. Malaysia, Serbia, Tunisia and Turkey).
Figure A.5. Key facts about development finance for Mainly UMICs
60 countries (2723 mn people):
Albania Montenegro
Algeria Montserrat
Anguilla Morocco
Antigua and Barbuda Namibia
Argentina Nauru
Azerbaijan Niue
Belarus Palau
Belize Panama
Botswana Paraguay
Brazil Peru
Chile Philippines
China Serbia
Colombia Seychelles
Cook Islands South Africa
Costa Rica St. Helena
Cuba St. Kitts-Nevis
Dominican Republic Suriname
Ecuador Swaziland
El Salvador Thailand
Equatorial Guinea Tokelau
Fiji Tunisia
F.Y.R. of Macedonia Turkey
Gabon Turkmenistan
Guatemala Ukraine
Indonesia Uruguay
Iran Venezuela
Jamaica Wallis & Futuna
Jordan
Kazakhstan
Lebanon
Malaysia
Mauritius
Mexico
While the grant share of ODA has remained stable around 60% since 2000, a slight reduction could be observed in 2011.
In 2000-11, ODA has represented a small share of total external finance to the countries in this group. Since 2003, the ODA share of total external finance is less than 10%, roughly half of the average share for all countries in 2011.
Mainly UMICs (not LDC, not IDA eligible and not fragile; 60 countries)
For countries in this group, ODA plays a marginal role in comparison with other external financial resources.
0%
10%
20%
30%
40%
50%
60%
70%
80%
90%
100%
2000 2001 2002 2003 2004 2005 2006 2007 2008 2009 2010 2011 Allcountries
(2011)ODA OOF Private flows Private grants Remittances
-
50
100
150
200
250
300
350
400
450
500
2000 2001 2002 2003 2004 2005 2006 2007 2008 2009 2010 2011
2011
USD
bill
ion
ODA ODA(excl. debt relief)
Other external resources
0%
10%
20%
30%40%
50%
60%
70%80%
90%
100%
2000 2001 2002 2003 2004 2005 2006 2007 2008 2009 2010 2011
Shar
e of
tota
l ODA
ODA grants ODA loans

DCD/DAC(2013)29
31
ANNEX B: ELIGIBILITY LISTS
The DAC/OECD List of ODA recipients
The DAC List of ODA Recipients includes all countries and territories eligible to receive official development assistance (ODA).
The list consists of all Least Developed Countries (LDCs) as defined by the United Nations (UN), along with all other low and middle income countries based on gross national income (GNI) per capita (atlas method) as published by the World Bank, with the exception of G8 members and European Union (EU) members (including countries with a firm date for entry into the EU).
The DAC List classifies countries and territories in four groups:
1. “Least Developed Countries” (LDCs), as defined by the United Nations;
2. “Other low-income countries” (Other LICs), all countries that are not defined as LDCs, but still low income countries as defined by the World Bank, i.e. in 2011, countries with an annual per capita GNI less or equal to USD 1025.
3. “Lower Middle Income Countries” (LMICs), all lower middle income countries as defined by the World Bank, i.e. in 2011, countries with annual per capita GNI between USD 1026 and USD 4035.
4. “Upper Middle Income Countries” (UMICs), all upper middle income countries as defined by the World Bank, i.e. in 2011, countries having an annual per capita GNI between USD 4036 and USD 12475.
The DAC list is updated every three years. For a country to graduate from the DAC list, it has to exceed the World Bank’s high-income threshold for three consecutive years. A country can therefore be classified as high income, yet still be eligible to receive ODA. The next review of the DAC list should take place in 2014.
The current DAC List of ODA recipients includes 148 countries.20
The United Nations list of Least Developed Countries (LDCs)
The category of LDCs was officially established in 1971 by the UN General Assembly. The Committee for Development Policy (CDP), a subsidiary body of the UN Economic and Social Council, is mandated to review the category of LDCs every three years and monitor their progress after graduation from the category.
The eligibility criteria for LDCs are:
1. Low-income criterion, based on a three-year average estimate of GNI per capita, based on the World Bank Atlas method (under $992 for inclusion, above $ 1,190 for graduation as applied in the 2012 triennial review).
20 . Read more about the DAC list of ODA recipients: http://www.oecd.org/dac/stats/daclistofodarecipients.htm

DCD/DAC(2013)29
32
2. Human Assets Index (HAI) based on indicators of health, nutrition, education and adult literacy rate.
3. Economic Vulnerability Index (EVI) based on indicators of population size and share of population living in low elevated coastal zones, merchandise export concentration, and other indicators of economical vulnerability.
Low-income countries whose populations are above 75 million are not eligible for inclusion in the list of LDCs. The population cut-off does not apply to countries that were on the list in 1991 when this rule was introduced.
To become eligible for graduation, a country must reach threshold levels of at least two of the three criteria, or its GNI per capita must exceed at least twice the threshold level, and the likelihood that the level of GNI per capita is sustainable must be deemed high. To be recommended for graduation, a country must be found eligible at two successive triennial reviews by the CDP. A country graduates three years after the GA takes note of the ECOSOC endorsement of the recommendation of the CDP. During this three-year period, the country remains on the list of LDCs and continues to benefit from the special support measures associated with LDC status.
Despite some countries already fulfilling some of the graduation criteria (e.g. Angola, Equatorial Guinea, Kiribati, Tuvalu and Vanuatu) the slow graduation process allows these countries to remain on the list of LDCs. The only three countries to have graduated out of the LDC category as of 2012 are Botswana, Cape Verde and Maldives.
The current list of LDCs includes 49 countries; 34 in Africa, 14 in Asia and the Pacific and one in Latin America21.
The International Development Association’s list of eligible countries
The International Development Association (IDA) is part of the World Bank and helps the world’s poorest countries. Established in 1960, IDA aims to reduce poverty by providing loans and grants for programmes that boost economic growth, reduce inequalities and improve people’s living conditions.
IDA complements the World Bank’s original lending arm, the International Bank for Reconstruction and Development (IBRD) by providing loans and advice to middle-income and credit-worthy countries. IDA lends money on concessional terms, that means credits having zero or very low interest charges and repayments stretched over 25 to 40 years, including 5 to 10-year grace periods. IDA also provides grants to countries at risk of debt distress. In addition, IDA can also provide debt relief through the Heavily Indebted Poor Countries (HIPC) Initiative and the Multilateral Debt Relief Initiative (MDRI).
Eligibility for IDA support depends on a country relative poverty, defined as gross national income (GNI) per capita below an established threshold updated annually. IDA also supports some countries, including several small island economies, which are above the operational cut-off, but lack the creditworthiness needed to borrow from IBRD.
The list of IDA borrowers includes 82 countries, of which 18 are so called “blend” countries that are also eligible to receive loans from IBRD. The list is updated every year.22
21 . Read more about the UN list of LDCs: http://www.unohrlls.org/en/ldc/25/
22 . Read more about IDA: http://www.worldbank.org/ida/what-is-ida.html or see the full list of IDA eligible countries: http://data.worldbank.org/about/country-classifications/country-and-lending-groups#IDA
DCD/DAC(2013)29
33
The OECD List of Fragile States
The list used by the OECD for its analysis of financial flows in fragile states is neither an official DAC list nor an official definition. Rather, it is put together every year for the purpose of monitoring and analysing certain indicators, financial flows and other data in these countries.
For the 2011 report and subsequent publications, the list of fragile states and economies assembled by the OECD results from a compilation of two lists. It comprises the countries on the World Bank-African Development Bank – Asian Development Bank Harmonised List Fragile Situations, and countries in the “alert” and “warning” categories on the Failed States Index, developed by the Fund for Peace (index above 90).
The list used for the 2008-10 reports was a compilation of three lists: the World Bank’s CPIA list; the Brookings Index of State Weakness in the Developing World; and the Carleton University Country Indicators for Foreign Policy (CIFP) index.23 The resulting list of countries was a change from the 2005, 2006 and 2007 reports, insofar as the use of two additional indices aimed to make the list more robust and consistent with the DAC’s policy focus. They reflected the DAC definition of fragility and conflict (which considers both the capacity and legitimacy of the state and includes a security dimension). The two additional indexes added 10 countries to the 38 that had been previously identified.
By contrast, the 2005, 2006 and 2007 reports were limited to the World Bank’s CPIA index linked list, in which the bottom two quintiles of the CPIA, plus unrated countries/territories and countries that had been moving in and out of the bottom two quintiles in previous years, defined the list of countries under consideration.
The current list of fragile states includes 51 countries; 31 in Africa, 17 in Asia and the Pacific, two in Europe and one in Latin America.24
23 . The full set of countries was taken from the Brookings and CI FP lists. From the World Bank list, states were taken if they had a CPIA rating of 3.2 or less (i.e. the bottom two quintiles of the list), plus unrated territories and countries that had been moving in and out of the 3.2 or less bracket. For more information, see Annex A of the Annual Report: Resource Flows to Fragile and Conflict-Affected States 2010.)
24 . Read more about the OECD list of fragile states: http://www.oecd.org/dac/incaf/resourceflowstofragilestates.htm

DCD/DAC(2013)29
34
ANNEX C: DISTRIBUTION OF EXTERNAL DEVELOPMENT FINANCE AND INCOME
Figure C.1. Distribution of countries per capita ODA and other external flows
Explanation: Figure C.1. presents ODA per capita (horizontal) and other external flows per capita (vertical) for all countries and group averages. A country or group appearing below the diagonal line receives relatively more ODA than other external flows. Note that for presentational purposes the right graph is merely a blown-up version of the left graph.

DCD/DAC(2013)29
35
Figure C.2. ODA as a share of total external resources in 2011, geographic distribution
Figure C.3. Overall Income distribution in 2000 and 2011
This box-and-whisker plot shows the distribution of per capita income for developing countries in 2000 and 2011.
The size of each box measures the distance between the lower 25th and the upper 75th percentiles, with the black lines extending to the minimum and maximum values of the distribution. The white straight horizontal line in the box shows the median. The dark blue area represent the values between the lower quartile (the 25th percentile) and the median, while the light blue area represent the values between the median and upper quartile (the 75th percentile).

DCD/DAC(2013)29
36
ANNEX D: METHODOLOGY AND DATA
Methodology of country groupings
The grouping of countries takes the one hundred and forty eight (148) countries that are on DAC List of ODA Recipients as a starting point, and considers three other international classifications, or eligibility lists: (i) the list of IDA borrowing countries, (ii) the UN list of LDCs, and (iii) the OECD/DAC list of fragile states. Although based on different eligibility criteria (presented in Annex B), these lists are all aimed at identifying those countries most in need of concessional funding. For example, the IDA borrowing list includes countries whose relative poverty is below a certain threshold (e.g. GNI per capita below USD 1,205 in fiscal year 2014) and that have limited access to the international capital market, not being creditworthy for IBRD borrowing. The LDC list includes countries below a certain threshold for GNI per capita, for a composite Human Assets Index (based on indicators of nutrition, health, education, and adult literacy) and for a composite Economic Vulnerability Index (details in Annex B). Since the LDC classification is based on a more nuanced assessment of a country’s status than GNI per capita, a number of MICs are in fact LDCs.
In theory, the overlap across these lists would allow for eight different groups; however, in practice there are no fragile LDCs that are not IDA eligible. In two other cases the groups would only be populated by a very small number of countries, which would not allow for a proper statistical analysis of the characteristics or external financial resources of these groups. For this purpose, the following countries have been reallocated into different groups:
• Equatorial Guinea is included in “Mostly UMICs” despite the fact it is still an LDC.25
• Egypt, Iraq, Libya and Syria are included in “Other Fragile”, despite the fact that they are not IDA eligible.
In addition, Democratic Republic of Korea and West Bank and Gaza have been excluded from the analysis because of lack of data. The overlaps among these lists give rise to five groups as illustrated in Figure 2, and allow us to sketch a granular picture of finance to developing countries based on potential access to finance.
25 . Equatorial Guinea is expected to graduate from the LDC list. The Committee for Development Policy Report on its fourteenth session wrote “the graduation of which was endorsed by the Council in 2009 but has not yet been taken note of by the General Assembly. In that regard, the Committee reiterated its concern that the continuing lack of action by the Assembly was prejudicial to the category.” [See Committee for Development Policy Report on the fourteenth session (12-16 March 2012), Economic and Social Council Official Records, 2012 Supplement No. 13, http://www.unohrlls.org/UserFiles/File/LDC%20Documents/CDP%20report%202012.pdf.]

DCD/DAC(2013)29
37
Figure D.1. Geographic distribution of groups
Data
This study focuses on external financing from DAC members and the main multilateral organisations (to which the DAC contributes) directed to all countries and territories on the DAC list of ODA recipients. The data is based on various sources; however, if available, data on financial flows from the OECD are prioritised over other sources. The data is measured on a gross disbursement basis for all official flows, and for private flows as far as the statistics allow. If the information is not available specifically for DAC members, the most recent estimates have been used to estimate the amount of resources stemming from DAC members. All figures are measured in constant 2011 USD.
Official development assistance ODA in this document covers concessional outflows from bilateral sources (i.e. bilateral gross ODA provided by DAC countries) as well as gross multilateral concessional outflows. See Table D.1 for a list of donor coverage. OOF in this document includes other official flows from DAC members and non-concessional lending by multilateral agencies.
Information on ODA is taken from DAC statistics (DAC Table 2a) and includes both grants and loans from DAC members and multilateral organisations to which the DAC contributes. The table below provides an overview of the providers covered in this analysis.

DCD/DAC(2013)29
38
Table D.1: Development finance providers
DAC members Multilateral organisations
Australia African Development Bank (AfDB) Austria Asian Development Bank ADB) Belgium Caribbean Development Bank (CDB) Canada European Bank for Reconstruction and Development (EBRD) Czech Republic GAVI alliance Denmark Global Environmental Facility (GEF) EU Institutions Global Fund to Fight AIDS, Tuberculosis and Malaria Finland International Atomic Energy Agency (IAEA) France International Bank of Reconstruction and Development (IBRD) Germany International Development Association (IDA) Greece Inter-American Development Bank (IDB) Iceland International Fund for Agricultural Development (IFAD) Ireland International Finance Corporation (IFC) Italy International Monetary Fund (IMF) Japan Montreal Protocol Korea Nordic Development Fund Luxembourg Organization for Security and Co-operation in Europe (OSCE) Netherlands UNAIDS New Zealand United Nations Development Programme (UNDP) Norway United Nations Population Fund (UNFPA) Portugal United Nations High Commissioner for Refugees (UNHCR) Slovak Republic1 United Nations Children's Fund (UNICEF) Spain United Nations Peacebuilding Fund (UNPBF) Sweden United Nations Relief and Works Agency (UNRWA) Switzerland UNTA United Kingdom World Food Programme (WFP) United States World Health Organisation (WHO) 1. Slovak Republic joined the DAC on 17 September 2013; however, since the cut-off date for the analysis was early September, it is not included in the analysis.
Information on other official flows (OOF) is taken from DAC statistics (DAC Table 2b) and includes other official grants, which do not qualify for ODA, official export credits, and acquisitions of all other types of OOF, including direct lending, rescheduling of private sector debt and rescheduled amounts of capitalised interest when OOF debt is reorganised, and purchases of bonds and equities.
Data on DAC members’ outward investments has been derived from the data collected by the Working Group on International Investment Statistics (WGIIS) of the OECD Investment Committee (IC). The decision to use data on FDI from the WGIIS system rather than from the DAC statistics (DAC Table 4) was made after analysis of the coverage in both systems. A recent review comparing WGIIS/ DAC statistics on FDI highlighted some coverage issues between the two systems [see DCD/DAC/STAT(2013)8]. Based on this analysis, the DAC Working Party on Development Finance Statistics (WP-STAT) and WGIIS agreed to test the feasibility of deriving DAC statistics on FDI from the WGIIS system over a two year trial period. However, it should be noted that the information used in this report only includes flows specifically from DAC members into countries on the DAC list of ODA recipients. No investment classified as global or regionally unallocated has been included since it cannot be verified that the investment is actually going to a country on the DAC list of ODA recipients.
Information on other securities and claims is taken from DAC statistics (DAC Table 4) and includes total bank and non-bank purchases of bonds and other securities (including equities) and disbursements of

DCD/DAC(2013)29
39
export credits, repayments and disposals. The data is reported to the DAC on a net basis; however, repayments of export credits have been added as an attempt to keep consistency and use of gross figures to the maximum extent possible.
Data on country-specific private grants is taken from DAC statistics (DAC Table 4). For Figure 1, information from the Hudson institute’s Index of Global Philanthropy and Remittances has been used to complement the overall information collected by the DAC26. However, since the information from the Hudson Institute is not available by developing country, only data from DAC statistics could be used for the remainder of the analysis.
Data on remittances from DAC countries for 2010-12 is taken from the World Bank bilateral remittance matrices and includes estimates of the sum of bilateral workers’ remittances, net compensation of employees and migrant transfers, using migrant stocks, host country incomes, and origin country incomes. Data on remittances from DAC countries for 2000-09 have been estimated using the total inflows of remittances into developing countries estimated by the World Bank and DAC countries’ average share of remittances to the same countries over the years 2010-12. While this approach serves as a useful estimation to keep consistency in the data coverage to assess the importance of ODA and other external flows in developing countries’ resource receipts over the past decade, it is important to keep in mind that these are merely estimates. In particular, the increasing growth in emerging markets over the past decade may have altered the pattern of migrant workers and remittances away from DAC countries towards emerging markets. Therefore, the DAC share of remittances prior to 2010 may be under-estimated.
Further information and sources for the country indicators are as follows:
• Information on the proportion of people in each country living on less than both USD 1.25 per day and USD 2 per day is taken from the PovcalNet database managed by the World Bank27. Only the latest available poverty statistics has been used for the analysis.
• External debt stock as % of GNI has been extracted from the World Bank’s World Development Indicators (WDI), and is defined as the sum of public, publicly guaranteed, and private nonguaranteed long-term debt, use of IMF credit, and short-term debt.
• Data on GDP and GNI are taken from the World Bank’s WDI and deflated into 2011 prices using GDP deflators and exchange rates from the IMF World Economic Outlook (WEO).
• Information on the Gini coefficient comes from the WDI. Only the latest available data on economic inequality, measured by the Gini coefficient, has been used for the analysis.
• The source for data on the Human Development Index (HDI) is the website for the Human Development Report (HDR), managed by the UNDP.
• Data on population are drawn from the IMF WEO, but complemented with information from WDI and UN statistics.
26 . The Hudson Institute’s reports on Global Philanthropy and Remittances can be found at http://gpr.hudson.org/.
27. PovcalNet is accessible at http://iresearch.worldbank.org/PovcalNet.

DCD/DAC(2013)29
40
• Information on the general government revenue, expenditures, and tax revenue as % of GDP are taken from the IMF WEO. Government revenue consists of taxes, social contributions, grants receivable, and other revenue. Total expenditure consists of total expense and the net acquisition of nonfinancial assets. Government tax revenue includes revenue from taxes on goods and services, revenue from taxes on income, profits, and capital gains, and other tax-generated revenue, for instance through taxes on international trade and transactions.
Information on sources for all external financial resource and country indicators used in this paper is summarised in the table D.2 below.
Table D.2: Sources for external financial resources and country indicators
Indicator Source Comments
Poverty statistics PovcalNet database -World BankExternal debt stocks (% of GNI) World Bank - World Development Indicators (WDI)GDP World Bank - World Development Indicators (WDI)Gini coefficient World Bank - World Development Indicators (WDI)GNI World Bank - World Development Indicators (WDI)Human Development Index (HDI) United Nations Development Programme (UNDP)
Population
International Monetary Fund - World Economic Outlook (WEO) complemented with data from the UN and the World Bank's World Development Indicators (WDI)
ODA OECD-DAC (table 2a) of which: Debt Relief OECD-DAC (table 2a)ODA excluding Debt Relief Computed based on OECD-DAC (table 2a)ODA grant share Computed based on OECD-DAC (table 2a)Export Credits OECD-DAC (table DAC2b)Other official flows OECD-DAC (table DAC2b)Foreign Direct Investments OECD DAF investment data
Bonds and other securities OECD-DAC (table 4)Since the data is reported on net basis, repayments of export credits has been added back to the overall figures.
Private grants OECD-DAC (table 4) complemented with data from Hudson Institute's Center for Global Prosperity
Information on total private grants from Hudson Institute's Center for Global Prosperity has been used for figure 1. Data from OECD-DAC (table 4) has been used for the group analysis.
Remittances World Bank Migration & Remittances Data
World Bank data series from 1970 to 2009 includes only total inflows. The DAC share of these inflows have been estimated using the average DAC share to the same countries in 2010-2012.
General government revenue (% of GDP) International Monetary Fund - World Economic Outlook (WEO)
General government total expenditure (% of GDP)
International Monetary Fund - World Economic Outlook (WEO)
Tax revenue (% of GDP)International Monetary Fund - World Economic Outlook (WEO)
Characteristics
Development finance

DCD/DAC(2013)29
41
REFERENCES
AFDB, OECD, UNDP, ECA (2013), “African Development Outlook”, Paris.
Agarwal, M. (2013), “Reshaping International Institutions to Achieve MDGs”, in S. Kindornay and H. Bseada (eds.), Multilateral Development Cooperation in a Changing Global Order. Palgrave McMillan, London.
Griffiths, J. (2013, forthcoming), “Development finance – where does it come from?”, Eurodad.
HLP (2013), “A New Global Partnership: eradicate Poverty and Transform Economies Through Sustainable Development”, The Report of the High-Level Panel of Eminent Persons on the Post-2015 Development Agenda, New York
IMF (2012), “Macroeconomic policy frameworks for resource-rich developing countries”, IMF, Washington
OECD (2012), “Development Co-operation Report 2012”, OECD, Paris
OECD (2013a, forthcoming), “2013 Development Co-operation Report”, OECD, Paris
OECD (2013b), “FDI in Figures”, OECD, Paris, http://www.oecd.org/daf/inv/FDI%20in%20figures.pdf
OECD (2013c, forthcoming), 2013 DAC Report on Aid Predictability, OECD, Paris
Piketty, T. and Saez, E. (2006), “The Evolution of Top Incomes: A Historical and International Perspective”, American Economic Review, American Economic Association, Vol. 96, No. 2, [place of publication], pp. 200-205.
Sumner, A. (2010), “Global Poverty and the New Bottom Billion: What if Three-Quarters of the World’s Poor Live in Middle-Income Countries?”, Institute of Development Studies, London
UNCTAD (2012), “The Least Developed Countries Report”, UNCTAD, New York and Geneva.
World Bank (2013), “Online Country Overviews”, http://www.worldbank.org/en/country