the world bank · the world bank for official use only report no: 82002-id international bank for...
TRANSCRIPT

Document of
The World Bank
FOR OFFICIAL USE ONLY
Report No: 82002-ID
INTERNATIONAL BANK FOR RECONSTRUCTION AND DEVELOPMENT
PROJECT PAPER
ON A
PROPOSED ADDITIONAL LOAN AND RESTRUCTURING
IN THE AMOUNT OF US$500 MILLION
TO THE
REPUBLIC OF INDONESIA
FOR A
LOCAL GOVERNMENT AND DECENTRALIZATION PROJECT ADDITIONAL FINANCING / LOCAL GOVERNMENT AND DECENTRALIZATION PROJECT PHASE II
September 2, 2014
Indonesia Sustainable Development Unit Sustainable Development Department East Asia and Pacific Region This document has a restricted distribution and may be used by recipients only in the performance of their official duties. Its contents may not otherwise be disclosed without World Bank authorization.
Pub
lic D
iscl
osur
e A
utho
rized
Pub
lic D
iscl
osur
e A
utho
rized
Pub
lic D
iscl
osur
e A
utho
rized
Pub
lic D
iscl
osur
e A
utho
rized
Pub
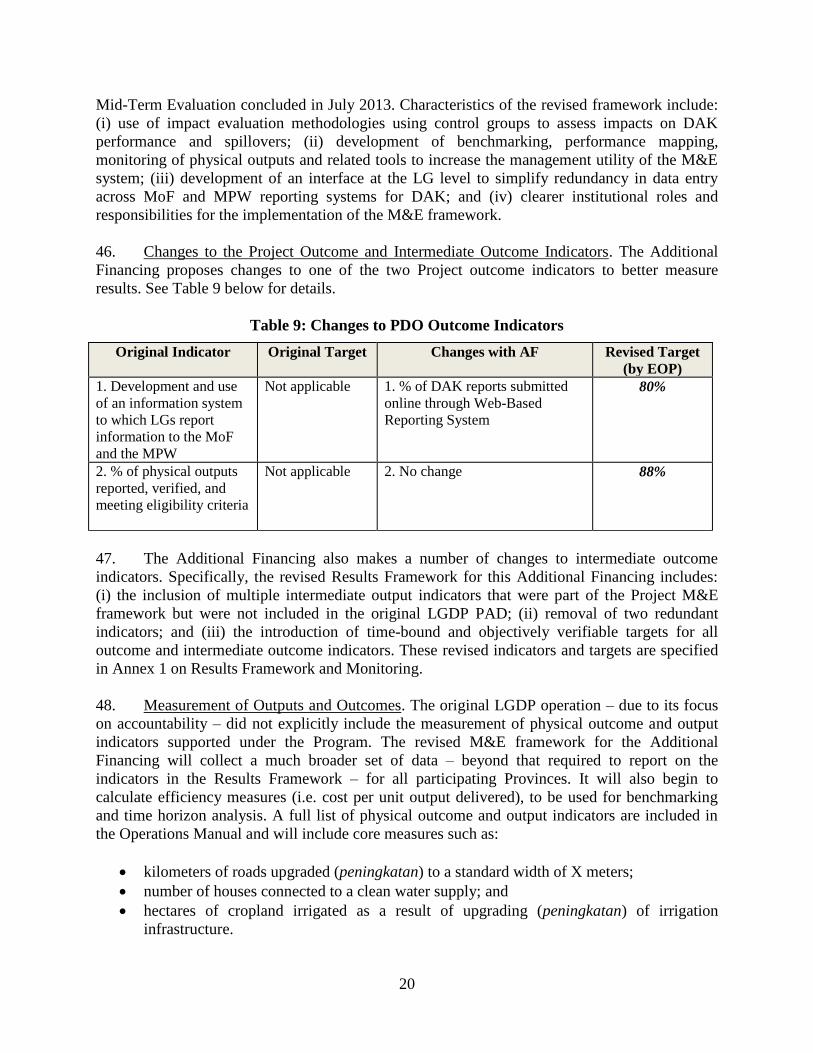
lic D
iscl
osur
e A
utho
rized
Pub
lic D
iscl
osur
e A
utho
rized
Pub
lic D
iscl
osur
e A
utho
rized
Pub
lic D
iscl
osur
e A
utho
rized

ii
CURRENCY EQUIVALENTS
(Exchange Rate Effective May 14, 2014)
Currency Unit = Indonesian Rupiah (IDR)
IDR 11,587.00 = US$1.00
FISCAL YEAR
January 1 – December 31
ABBREVIATIONS AND ACRONYMS
AP Advance Payment
APBD Local Budget
APBN National/State Budget
Bappenas National Planning Agency
Bappeda Local Planning Agency
BPK State Audit Board
BPKP Indonesian National Government
Internal Auditor
CPS Country Partnership Strategy
DAK Specific Purpose Grants
DAU General Purpose Grants
DBH Revenue Sharing
DG Directorate General
DGFB Directorate General of Fiscal
Balance
DP Adjustment Fund
EIRR Economic Internal Rate of Return
ES Environmental Social
FY Fiscal Year
GAC Government Anti-Corruption Plan
GDP Gross Domestic Product
GoI Government of Indonesia
IBRD International Bank for
Reconstruction and Development
IG Inspectorate General
ILGRP Initiative for Local Government
Reform Program
ISP Institutional Support Program
KOMANDAN Communication System and Data
Management (Komunikasi dan
Manajemen Data Nasional)
LG Local Government, comprising
Provinces, Kabupaten and Kota
M&E Monitoring and Evaluation
MoF Ministry of Finance
MoHA Ministry of Home Affairs
MPW Ministry of Public Works
NFI Net Fiscal Index
NPV Net Present Value
OBD Output Based Disbursement
OM Operation Manual
ORAF Operational Risk Assessment
Framework
OVR Output Verification Report
PDO Project Development Objective
Perpres Presidential Regulation
PforR Program for Results
PIU Project Implementing Unit
PP Government Regulation
QER Quality Enhancement Review
QP Qualifying Percentage
RD Definitive Plan
RKP Government Work Plan
RPJM Mid-Term Development Plan
(Rencana Pembangunan Jangka
Menengah)
SIKD Local Government Financial
Information System (Sistem
Informasi Keuangan Daerah)
SIL Specific Investment Loan
TA Technical Assistant
ULP Procurement Service Unit
UU Law
VFR Value of Final Reimbursement
VO Verification of Outputs
VPR Value of Potential Reimbursement
VQR Value of Qualifying
Reimbursement
VTR Value of Total Reimbursement
WBRS Web-Based Reporting System
ii
Vice President: Axel van Trotsenburg, EAPVP
Country Director: Rodrigo A. Chaves, EACIF
Sector Director: John Roome, GPSOS (through June 30, 2014)
Senior Global Practice Director: Ede Jorge Ijjasz-Vasquez, GURDR (from July 1, 2014)
Practice Director: Marisela Montoliu Munoz, GURDR (from July 1, 2014)
Sector Manager: Nathan M. Belete, GAGDR (through June 30, 2014)
Practice Manager: Abhas K. Jha, GURDR (from July 1, 2014)
Task Team Leader: Taimur Samad, GURDR
Co-Task Team Leader: Thalyta E. Yuwono, GURDR

INDONESIA
LOCAL GOVERNMENT AND DECENTRALIZATION PROJECT ADDITIONAL
FINANCING
PROJECT PAPER FOR ADDITIONAL FINANCING
CONTENTS
ADDITIONAL FINANCING DATA SHEET ............................................................................... ii
I. Introduction ................................................................................................................................ 2
II. Background and Rationale for Additional Financing ................................................................ 2
III. Proposed Changes ................................................................................................................... 11
IV. Appraisal Summary ................................................................................................................ 22
Annex 1: Results Framework and Monitoring............................................................................. 34
Annex 2: Operational Risk Assessment Framework (ORAF) ...................................................... 39
Annex 3: Summary of Bank Strategy on Intergovernmental Transfers ....................................... 42
Annex 4: Summary of Mid-Term Evaluation Results and Recommendations............................. 47
Annex 5: Provincial Selection Criteria and Results ...................................................................... 50
Annex 6: Summary of Poverty, Social and Gender Assessment .................................................. 55
Annex 7: Economic and Financial Analysis ................................................................................. 58
Annex 8: Current and Projected Disbursement ............................................................................ 65
ii
INDONESIA
LOCAL GOVERNMENT AND DECENTRALIZATION PROJECT ADDITIONAL
FINANCING
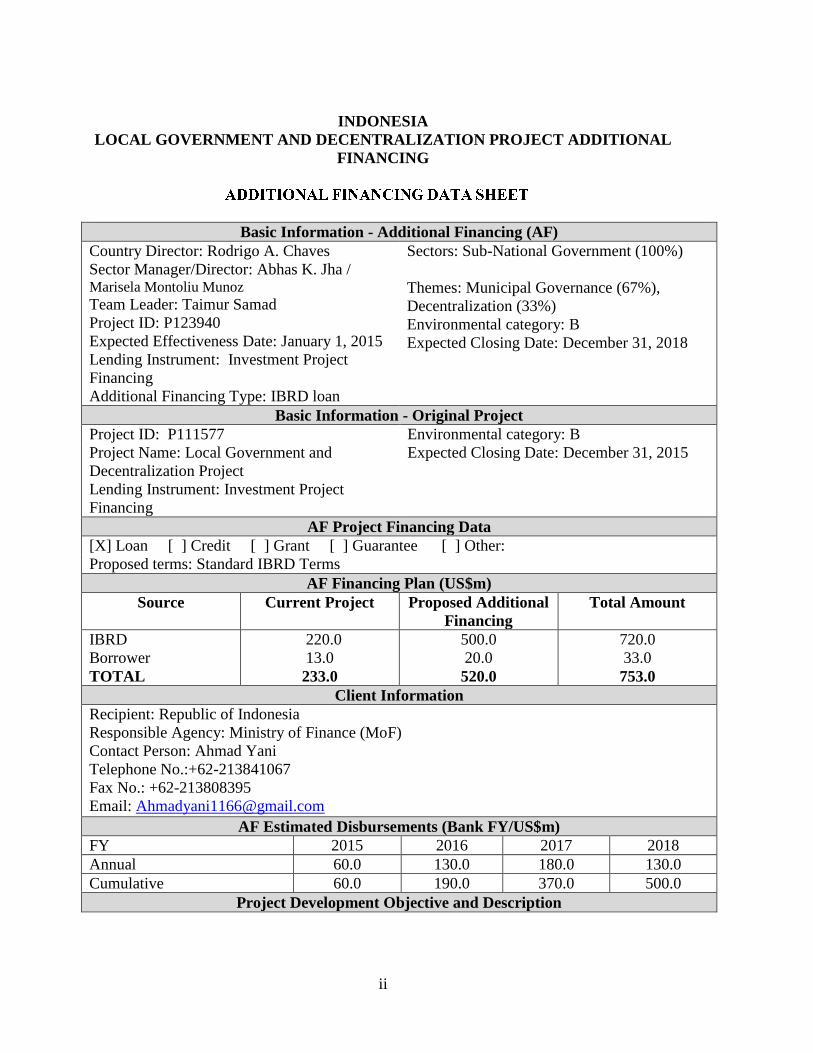
Basic Information - Additional Financing (AF)
Country Director: Rodrigo A. Chaves
Sector Manager/Director: Abhas K. Jha / Marisela Montoliu Munoz Team Leader: Taimur Samad
Project ID: P123940
Expected Effectiveness Date: January 1, 2015
Lending Instrument: Investment Project
Financing
Additional Financing Type: IBRD loan
Sectors: Sub-National Government (100%)
Themes: Municipal Governance (67%),
Decentralization (33%)
Environmental category: B
Expected Closing Date: December 31, 2018
Basic Information - Original Project
Project ID: P111577 Environmental category: B
Project Name: Local Government and
Decentralization Project
Expected Closing Date: December 31, 2015
Lending Instrument: Investment Project
Financing
AF Project Financing Data
[X] Loan [ ] Credit [ ] Grant [ ] Guarantee [ ] Other:
Proposed terms: Standard IBRD Terms
AF Financing Plan (US$m)
Source Current Project Proposed Additional
Financing
Total Amount
IBRD
Borrower
TOTAL
220.0
13.0
233.0
500.0
20.0
520.0
720.0
33.0
753.0
Client Information
Recipient: Republic of Indonesia
Responsible Agency: Ministry of Finance (MoF)
Contact Person: Ahmad Yani
Telephone No.:+62-213841067
Fax No.: +62-213808395
Email: [email protected]
AF Estimated Disbursements (Bank FY/US$m)
FY 2015 2016 2017 2018
Annual 60.0 130.0 180.0 130.0
Cumulative 60.0 190.0 370.0 500.0
Project Development Objective and Description
iii
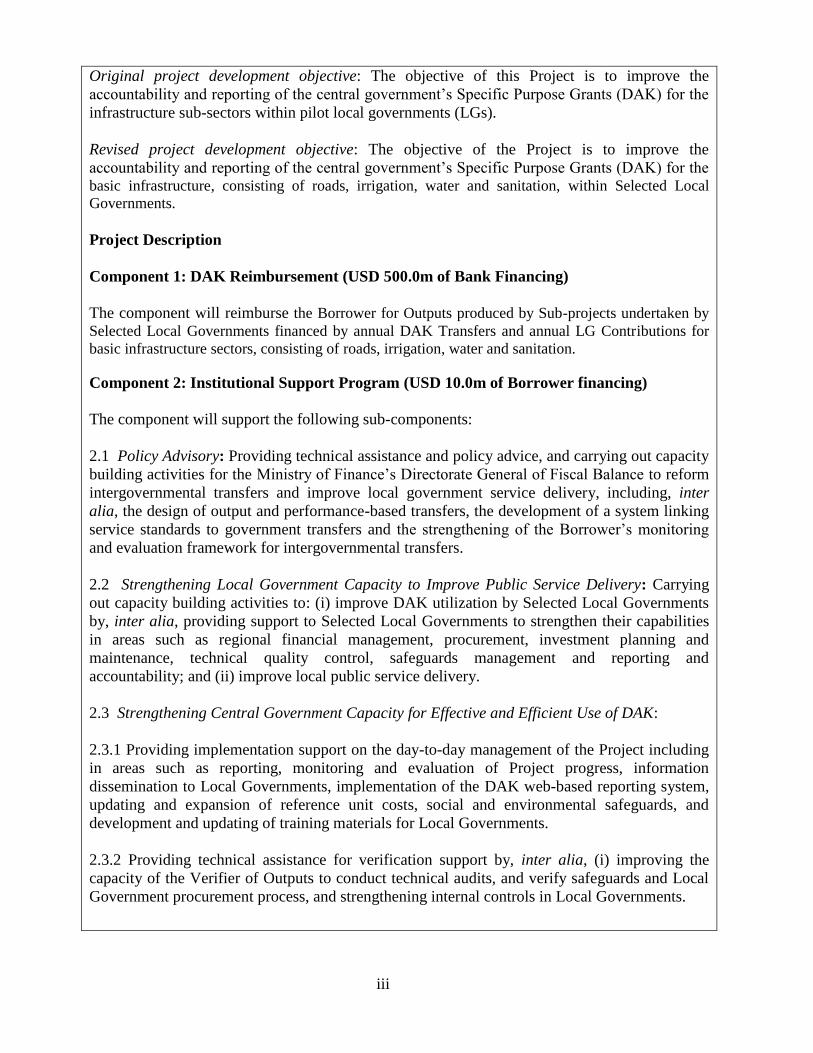
Original project development objective: The objective of this Project is to improve the
accountability and reporting of the central government’s Specific Purpose Grants (DAK) for the
infrastructure sub-sectors within pilot local governments (LGs).
Revised project development objective: The objective of the Project is to improve the
accountability and reporting of the central government’s Specific Purpose Grants (DAK) for the basic infrastructure, consisting of roads, irrigation, water and sanitation, within Selected Local
Governments.
Project Description
Component 1: DAK Reimbursement (USD 500.0m of Bank Financing)
The component will reimburse the Borrower for Outputs produced by Sub-projects undertaken by
Selected Local Governments financed by annual DAK Transfers and annual LG Contributions for
basic infrastructure sectors, consisting of roads, irrigation, water and sanitation.
Component 2: Institutional Support Program (USD 10.0m of Borrower financing)
The component will support the following sub-components:
2.1 Policy Advisory: Providing technical assistance and policy advice, and carrying out capacity
building activities for the Ministry of Finance’s Directorate General of Fiscal Balance to reform
intergovernmental transfers and improve local government service delivery, including, inter
alia, the design of output and performance-based transfers, the development of a system linking
service standards to government transfers and the strengthening of the Borrower’s monitoring
and evaluation framework for intergovernmental transfers.
2.2 Strengthening Local Government Capacity to Improve Public Service Delivery: Carrying
out capacity building activities to: (i) improve DAK utilization by Selected Local Governments
by, inter alia, providing support to Selected Local Governments to strengthen their capabilities
in areas such as regional financial management, procurement, investment planning and
maintenance, technical quality control, safeguards management and reporting and
accountability; and (ii) improve local public service delivery.
2.3 Strengthening Central Government Capacity for Effective and Efficient Use of DAK:
2.3.1 Providing implementation support on the day-to-day management of the Project including
in areas such as reporting, monitoring and evaluation of Project progress, information
dissemination to Local Governments, implementation of the DAK web-based reporting system,
updating and expansion of reference unit costs, social and environmental safeguards, and
development and updating of training materials for Local Governments.
2.3.2 Providing technical assistance for verification support by, inter alia, (i) improving the
capacity of the Verifier of Outputs to conduct technical audits, and verify safeguards and Local
Government procurement process, and strengthening internal controls in Local Governments.
iv
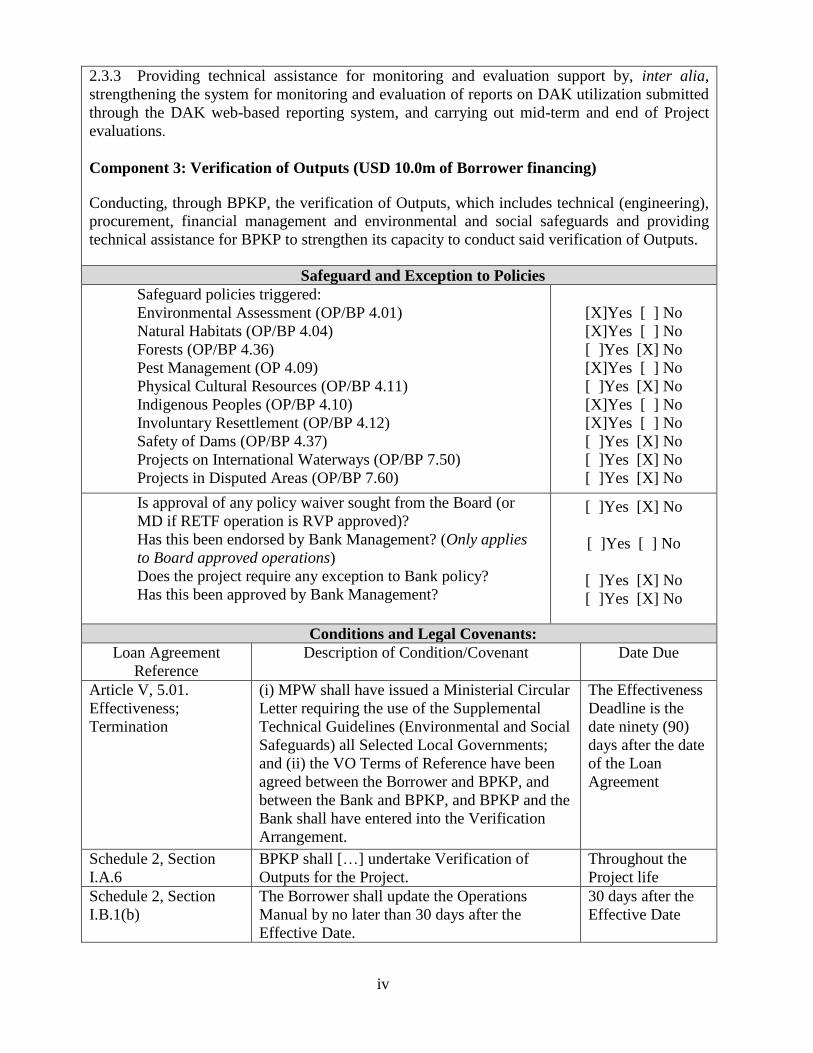
2.3.3 Providing technical assistance for monitoring and evaluation support by, inter alia,
strengthening the system for monitoring and evaluation of reports on DAK utilization submitted
through the DAK web-based reporting system, and carrying out mid-term and end of Project
evaluations.
Component 3: Verification of Outputs (USD 10.0m of Borrower financing)
Conducting, through BPKP, the verification of Outputs, which includes technical (engineering),
procurement, financial management and environmental and social safeguards and providing
technical assistance for BPKP to strengthen its capacity to conduct said verification of Outputs.
Safeguard and Exception to Policies
Safeguard policies triggered:
Environmental Assessment (OP/BP 4.01)
Natural Habitats (OP/BP 4.04)
Forests (OP/BP 4.36)
Pest Management (OP 4.09)
Physical Cultural Resources (OP/BP 4.11)
Indigenous Peoples (OP/BP 4.10)
Involuntary Resettlement (OP/BP 4.12)
Safety of Dams (OP/BP 4.37)
Projects on International Waterways (OP/BP 7.50)
Projects in Disputed Areas (OP/BP 7.60)
[X]Yes [ ] No
[X]Yes [ ] No
[ ]Yes [X] No
[X]Yes [ ] No
[ ]Yes [X] No
[X]Yes [ ] No
[X]Yes [ ] No
[ ]Yes [X] No
[ ]Yes [X] No
[ ]Yes [X] No
Is approval of any policy waiver sought from the Board (or
MD if RETF operation is RVP approved)?
Has this been endorsed by Bank Management? (Only applies
to Board approved operations)
Does the project require any exception to Bank policy?
Has this been approved by Bank Management?
[ ]Yes [X] No
[ ]Yes [ ] No
[ ]Yes [X] No
[ ]Yes [X] No
Conditions and Legal Covenants:
Loan Agreement
Reference
Description of Condition/Covenant Date Due
Article V, 5.01.
Effectiveness;
Termination
(i) MPW shall have issued a Ministerial Circular
Letter requiring the use of the Supplemental
Technical Guidelines (Environmental and Social
Safeguards) all Selected Local Governments;
and (ii) the VO Terms of Reference have been
agreed between the Borrower and BPKP, and
between the Bank and BPKP, and BPKP and the
Bank shall have entered into the Verification
Arrangement.
The Effectiveness
Deadline is the
date ninety (90)
days after the date
of the Loan
Agreement
Schedule 2, Section
I.A.6
BPKP shall […] undertake Verification of
Outputs for the Project.
Throughout the
Project life
Schedule 2, Section
I.B.1(b)
The Borrower shall update the Operations
Manual by no later than 30 days after the
Effective Date.
30 days after the
Effective Date

v
Schedule 2, Section
I.B,5(c) and Section
I.D.2
By October 31, 2015, the Borrower shall carry
out a review of the application of the
Supplemental Technical Guidelines
(Environmental and Social Safeguards to the
Project and amend the Supplemental Technical
Guidelines (Environmental and Social
Safeguards) if so requested by the Bank.
October 31, 2015
Schedule 2, Section
I.B.5(d)
The Borrower shall annually allocate a total
amount of DAK funds for Selected Local
Governments for each Fiscal Year of Project
implementation […], and shall notify the Bank
[…] no later than March 31 in such Fiscal Year.
Annually on
March 31
Schedule 2, Section
I.C.2(b)
BPKP shall submit to the Bank, by no later than
January 1 of each Fiscal Year […], a Work Plan
for verification activities, including technical
and environmental and social safeguards
capacity.
Annually on
January 1
2
I. Introduction
1. This Project Paper seeks the approval of the Executive Directors to provide an additional
loan in an amount of USD 500.0 million to the Republic of Indonesia for the Local Government
and Decentralization Project (LGDP) Additional Financing (P123940), currently supported by an
IBRD loan (P111577, 7914-ID for USD 220.0 million). The proposed additional financing will
bring total Project financing to USD 753.0 million, of which Bank financing constitutes USD
720.0 million and Government of Indonesia (GoI) counterpart funding makes up the remaining
USD 33.0 million. The proposed Additional Financing is being sought by GoI to scale up the
coverage of the LGDP program to a total of 30 participating provinces, from an initial five pilot
provinces in the first phase. The original loan will close on December 31, 2015 as scheduled.
2. The proposed Additional Financing is requested for four years (calendar years 2015 –
2018) covering reimbursements for the DAK Allocation in GoI budgets in the three fiscal years
from 2015 to 2017. The operation will continue to finance reimbursements and incentives linked
to the core DAK basic infrastructure sectors consisting of roads, irrigation, water and sanitation.
The proposed Additional Financing also involves a comprehensive institutional support program
(ISP) to support GoI effort to improve local government service delivery. The ISP includes
activities that would directly support Project implementation, by strengthening institutional
coordination across implementing entities, deepening targeted capacity building efforts for local
governments, and improving monitoring and evaluation. The cumulative intent of these
adjustments is to enhance overall DAK performance and transparency and to induce spillovers
into other areas of local government (LG) performance.
II. Background and Rationale for Additional Financing
3. Background. The World Bank has outlined twin organizing goals to end extreme
poverty within a generation and to promote shared prosperity. Ending poverty and promoting
shared prosperity are unequivocally about progress in non-monetary dimensions of welfare
including education, health, nutrition, and access to basic infrastructure. In an economy with
significant inter-regional variations in revenue capacity and investment needs, decentralized
provision of public services can enhance efficiency in the provision of these services and result
in welfare gain. Fiscal decentralization enters into poverty alleviation strategy in a number of
ways: (i) the proximity of policy makers to the target group reduces information and transaction
costs of identifying the poor and helps in designing potentially successful ‘capacity improving’
and ‘safety net’ policies; and (ii) enhance efficiency in the provision of basic infrastructure and
facilities (Rao, 1998)1.
4. Indonesia’s big bang decentralization, which began in 2001, constituted a tectonic shift in
service responsibilities and funding from the center to subnational governments. Subnational
governments took over primary responsibility for delivering nearly all public services. The
assignment of new functions to LGs was accompanied by massive reallocation of funding –
subnational expenditure grew from 2.7% of GDP in 2000 to 7.2% of GDP in 2011. Subnational
1 See Rao, M.G., (1998).”Poverty Alleviation under Fiscal Decentralization”, World Bank.

3
governments now manage about half of total core public spending (i.e. excluding central
government subsidies and interest payments). While the expectation was that decentralization
would allow subnational governments to better respond to service delivery needs, the
effectiveness of decentralized provision has not yet met expectations. A 2012 Subnational
Expenditure Review conducted by the World Bank concluded that subnational government
spending is excessively dominated by spending on administration over productive sectors and on
personnel over maintenance and capital spending. Moreover, the study finds that poor sector
outcomes are greatly influenced by inefficiency in spending.2
5. Further, general and specific purpose transfers are intended to enable poorer regions to
provide social and physical infrastructure at levels comparable to those in richer jurisdictions,
such transfer will enable the depressed regions to fully utilize their growth potential and will
hasten poverty reduction. Analysis results of the accuracy of DAK allocations for regions show
that correlation signs of DAK allocation by province on the condition of public service in
infrastructure sector are in line with DAK objective to reduce interregional service inequalities
(Usman et al, 2008)3. Infrastructure investments funded through DAK transfers have three
potential positive effects on reducing poverty. These include: (i) a public works effect; (ii) a
broad-based economic growth effect; and (3) a non-income effect. It is well known that the
construction of public infrastructure can provide needed wages to low-income workers and
therefore assist in the reduction of poverty.
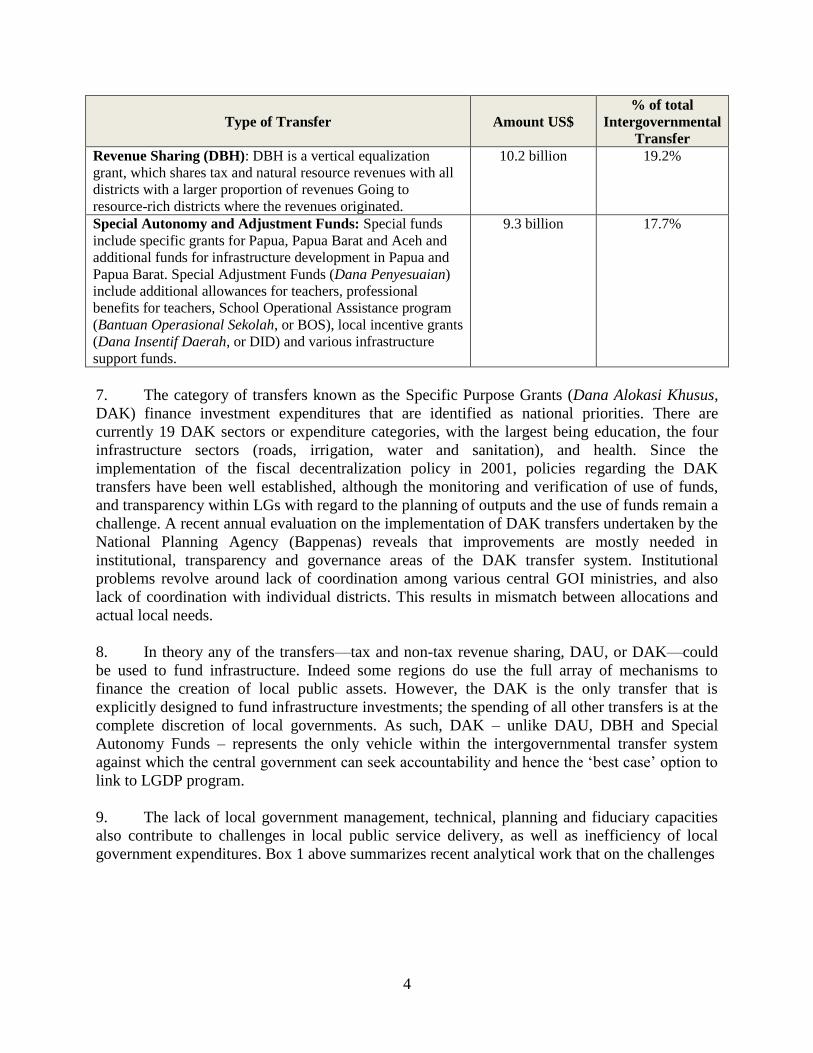
6. Local government spending remains dominated by intergovernmental transfers. In 2012,
over 32% of central government budget goes to transfers which account for over 90% of local
government budgets. Hence, addressing the effectiveness and efficiency of local government
spending across all sectors – including infrastructure – will in part require improved
transparency, accountability and incentives across key intergovernmental transfer mechanisms.
Table 1 below provides a summary of the main transfers in Indonesia.
Table 1: Major Categories of Intergovernmental Fiscal Transfers, 2014
Type of Transfer
Amount US$
% of total
Intergovernmental
Transfer
General Purpose Grants (DAU): Fund sourced (block grant)
from the Central Budget allocated to bring equality in the
fiscal capacity among the regions to finance needs associated
with the implementation of decentralization.
30.5 billion 57.6%
Specific Purpose Grants (DAK): Fund sourced from revenue
in APBN allocated to certain regions with the aim of funding
special activities of the region in accordance with national
priorities.
3.0 billion 5.6%
2 See World Bank, (2012). “Indonesia Subnational Public Expenditure Review: Optimizing Subnational
Performance for Better Services and Faster Growth”. Jakarta, Indonesia; for more detailed analysis on subnational
expenditure performance. 3 See Usman, S., Mawardi. S, Poesoro, A., Suryahadi, A., and Sampford, C., (2008).”The Specific Allocation Fund
(DAK): Mechanisms and Uses”, Research Report, The SMERU Research Institute.
4
Type of Transfer
Amount US$
% of total
Intergovernmental
Transfer
Revenue Sharing (DBH): DBH is a vertical equalization
grant, which shares tax and natural resource revenues with all
districts with a larger proportion of revenues Going to
resource-rich districts where the revenues originated.
10.2 billion 19.2%
Special Autonomy and Adjustment Funds: Special funds
include specific grants for Papua, Papua Barat and Aceh and
additional funds for infrastructure development in Papua and
Papua Barat. Special Adjustment Funds (Dana Penyesuaian)
include additional allowances for teachers, professional
benefits for teachers, School Operational Assistance program
(Bantuan Operasional Sekolah, or BOS), local incentive grants
(Dana Insentif Daerah, or DID) and various infrastructure
support funds.
9.3 billion 17.7%
7. The category of transfers known as the Specific Purpose Grants (Dana Alokasi Khusus,
DAK) finance investment expenditures that are identified as national priorities. There are
currently 19 DAK sectors or expenditure categories, with the largest being education, the four
infrastructure sectors (roads, irrigation, water and sanitation), and health. Since the
implementation of the fiscal decentralization policy in 2001, policies regarding the DAK
transfers have been well established, although the monitoring and verification of use of funds,
and transparency within LGs with regard to the planning of outputs and the use of funds remain a
challenge. A recent annual evaluation on the implementation of DAK transfers undertaken by the
National Planning Agency (Bappenas) reveals that improvements are mostly needed in
institutional, transparency and governance areas of the DAK transfer system. Institutional
problems revolve around lack of coordination among various central GOI ministries, and also
lack of coordination with individual districts. This results in mismatch between allocations and
actual local needs.
8. In theory any of the transfers—tax and non-tax revenue sharing, DAU, or DAK—could
be used to fund infrastructure. Indeed some regions do use the full array of mechanisms to
finance the creation of local public assets. However, the DAK is the only transfer that is
explicitly designed to fund infrastructure investments; the spending of all other transfers is at the
complete discretion of local governments. As such, DAK – unlike DAU, DBH and Special
Autonomy Funds – represents the only vehicle within the intergovernmental transfer system
against which the central government can seek accountability and hence the ‘best case’ option to
link to LGDP program.
9. The lack of local government management, technical, planning and fiduciary capacities
also contribute to challenges in local public service delivery, as well as inefficiency of local
government expenditures. Box 1 above summarizes recent analytical work that on the challenges

5
in improving local service delivery in the face of limited LG capacities and various constraints to
effective and efficient local government spending4.
4 See Lewis, B. and A. Oosterman, (2009),’The Impact of Decentralization on Subnational Government Fiscal Slack
in Indonesia’, Public Financial Publication, Inc; Sacks, A., Rahman., E., Turkewitz, J., Buehler, M., Saleh, I., and
Ali, A., (2013), ”The Dynamics of Centralized Procurement Reform in a Decentralized State: Evidence and Lessons
from Indonesia”, World Bank Jakarta and The Asia Foundation, Indonesia; AusAID, (2013), ”AusAID’s
Management of Infrastructure Aid to Indonesia”. Commonwealth of Australia; for more detailed analysis.
Box 1: Constraints on the Effectiveness and Efficiency of Subnational
A number of constraints on improving the effectiveness and efficiency of subnational spending have been
identified over the years. One study (Lewis and Oosterman, 2009) that examined various limitations of
local government capital spending suggested that inflexible budget rules, weak capacity in planning and
executing investment projects, and delays in forming tender committees because of worries over corruption
charges have played a significant role in limiting local expenditure. Another analysis (Sacks et al, 2013)
also focused on procurement problems, highlighting lack of leadership and the limited participation of
citizens’ groups in decision-making as particularly problematic in constraining reform. A recent review of
World Bank/AusAID district level public expenditure reviews (AusAID, 2013) examined a broad range of
potential public financial management difficulties and concluded that the most constraining factors were
that local governments did not generally have a full understanding of the total envelope of budgetary
resources available to them; district-level budget allocations rarely matched overall development priorities;
and bottom-up proposals did not play a significant role in funding decisions. The study also showed,
however, that public discussion and scrutiny of plans and budgets can significantly improve the quality of
planning and resource allocation.
A common conclusion derived from various examinations is that problems vary significantly across local
governments and that generalizations are difficult. With this in mind World Bank (2008) developed a tool
to diagnose specific public financial management issues at the local government level. The tool started by
identifying desirable public financial management related comes in the long-term. These included: prudent
financial management, effective governance structures and processes, accountability and transparency,
community participation in the budgeting process, and reduced corruption. Diagnostic methods were then
developed that focused on ascertaining constraints to attaining those objectives. Despite success of the
diagnostic tool in detecting public financial management difficulties, actual reform has proved elusive. The
World Bank also manages a subnational PFM capacity building program called PEACH (Public
Expenditure and Capacity Harmonization) that provides PFM capacity assessment followed with technical
assistance at provincial and district government levels in the areas of planning and budgeting.
Ministry of Finance (MoF) conducts annual local governments’ performance evaluation where regions are
obliged to submit regional reports. This program seeks to identify and rank LGs performance. In addition,
MoF, through Directorate General of Fiscal Balance, has been collaborating with several regional
universities across the country in organizing a Regional Finance Course (Kursus Keuangan Daerah-KKD)
and Course of Specific Regional Finance for Management/Accountancy (Kursus Keuangan Daerah
Khusus-KKDK) since 2007. KKD and KKDK were formulated to achieve the objective of increasing
knowledge and competency of local government apparatus to manage their regional finance including
planning, budgeting, and asset and revenue management. However, these courses only cover basic financial
management materials and less focus on case studies.

6
10. In parallel to the LGDP lending operation, the Bank has maintained a continuous
engagement with GoI on the possible structural reform agenda around DAK. Box 2 above
summarizes some of the Bank’s policy guidance with respect to the government’s plan to reform
the DAK towards a more performance-based transfer. More recently, in January 2014, the
Directorate General of Fiscal Balance (DGFB) of MoF issued a “Blue Print for Institutional
Transformation of DG Fiscal Balance”. With a renewed focus on transparency and
accountability in intergovernmental fiscal transfers and local government finances, this broader
transformation agenda for the areas under the purview of DGFB involves a series of initiatives
aimed at improvements in eight areas including Revenue Assignment, Expenditure Assignment,
Local Financing, Monitoring and Evaluation, Increasing Local Government Capacity,
Information and Technology, Organization Structure, and Human Resources. This
Box 2: Reforming the Specific Purpose Grants (DAK)
Increase funding. Central government policy intends to increase public capital spending at all levels of
government. The DAK is Government’s only mechanism for encouraging more capital spending at the
local level. DAK funding has not increased in real terms since 2007. Analysis conducted as part of the
Mid-Term Evaluation of the LGDP program suggest that an additional Rupiah of DAK leads to an
extra 2.6 Rupiah of capital spending for participating districts and an added 1.5 Rupiah of capital
spending for non-participating districts
Reduce sectoral coverage. The number of sectors covered by the DAK has expanded from three in
2001 to 19 in 2013. New sectors’ distributions have increased from just 5 to 25 percent of total
allocations; at the same time traditional infrastructure’s share has declined from 50 percent to 25
percent. Many of the new sectors are of questionable importance; they could be eliminated without
negative impact and funds could be reallocated to infrastructure subsectors of the DAK.
Reduce geographic coverage. The original intent of the DAK was to maximize impact of the grant by
focusing distributions on relatively few local governments. Indeed in the early years of DAK operation
allocations were made to only a small subset of local governments. Currently all local governments
receive at least some DAK. This feature of grant allocation reduces the size of DAK distributions to
individual local governments and weakens impact.
Allow for maintenance spending. Local governments spend too little on maintaining their assets.
Empirical evidence suggests that DAK allocations are negatively associated with maintenance
spending. Each additional rupiah of DAK leads to a decrease in maintenance and other non-personnel
current spending of more than 0.5 rupiah. Allowing DAK to be used to fund maintenance in a more
comprehensive fashion might help to reverse the trends.
Allow multi-year project implementation. When a local government is unable to complete its capital
improvement project during a fiscal year it must retender the project the following year. Retendering
the project creates significant time delays and economic inefficiencies. Allowing local governments to
plan and implement multi-year capital developments would support the implementation of larger
projects, widely recognized as needed, and eliminate inefficiencies.
Allow for some spending flexibilities. Policies that do not allow for any flexibility lead to the
ineffective use of funds, and as such require revision in order to provide room for local government on
specific variations based on the needs, while still retaining some level of national uniformity and the
objective to achieve minimum service standard.

7
transformation agenda has been developed and is being implemented in anticipation of
impending revisions to Law 32/2004 on district governance (pemerintahan daerah) and Law
33/2004 on fiscal balance. The draft revisions to these laws are still under discussion, and are
expected to include rationalization of the various categories of intergovernmental fiscal transfers,
with increased emphasis on effective local public service delivery.
11. Within the above context, the Local Government and Decentralization Project (LGDP)
Additional Financing is part of a broader Bank strategy on intergovernmental transfers and the
strengthening of subnational fiscal performance. As part of this strategy, the World Bank is also
engaging with Bappenas on the reform agenda for intergovernmental transfers as part of the Five
Year Plan, 2015-2019 (RPJM) currently under formulation. This dialogue builds on lessons from
LGDP implementation and from a broad program of policy analysis conducted in collaboration
with MoF and with support from the Bank and other multilateral and bilateral donors active in
Indonesia. The World Bank’s policy guidance to the RPJM process centers around four main
questions: (i) whether GoI should increase funding for intergovernmental transfers; (ii) how can
transfers be reformed in the short term; (ii) what actions or reforms are required in the medium-
term to reform transfers; and (ii) what additional reforms might the central government consider
to improve outcomes. The Bank’s policy guidance on these issues is outlined in Annex 3.
Figure 1: DAK Sector Allocations as a Percentage of Total DAK Funding (2003-2014)
12. In at least one instance, the policy dialogue with government regarding the DAK may be
producing results. As Box 2 shows, one of the reforms advocated by the Bank is to increase the
proportion of the total DAK allocated to infrastructure subsectors. In 2014, DAK infrastructure
distributions have increased to just over 30% of the total, from less than 25% the year before.
Figure 1 charts DAK allocations during the period of 2003 to 2014. The central government
allocates DAK recipient sectors in accordance with their priorities as set out in the government
work plan for the particular year. Over the span of 2003 to 2014, the biggest allocations across
00
10
20
30
40
50
60
70
2003 2004 2005 2006 2007 2008 2009 2010 2011 2012 2013 2014
Infrastructure Education and Health Other
8
all sectors are for education, health and infrastructure. However, the infrastructure sector has
experienced a constant upward trend since 2009.
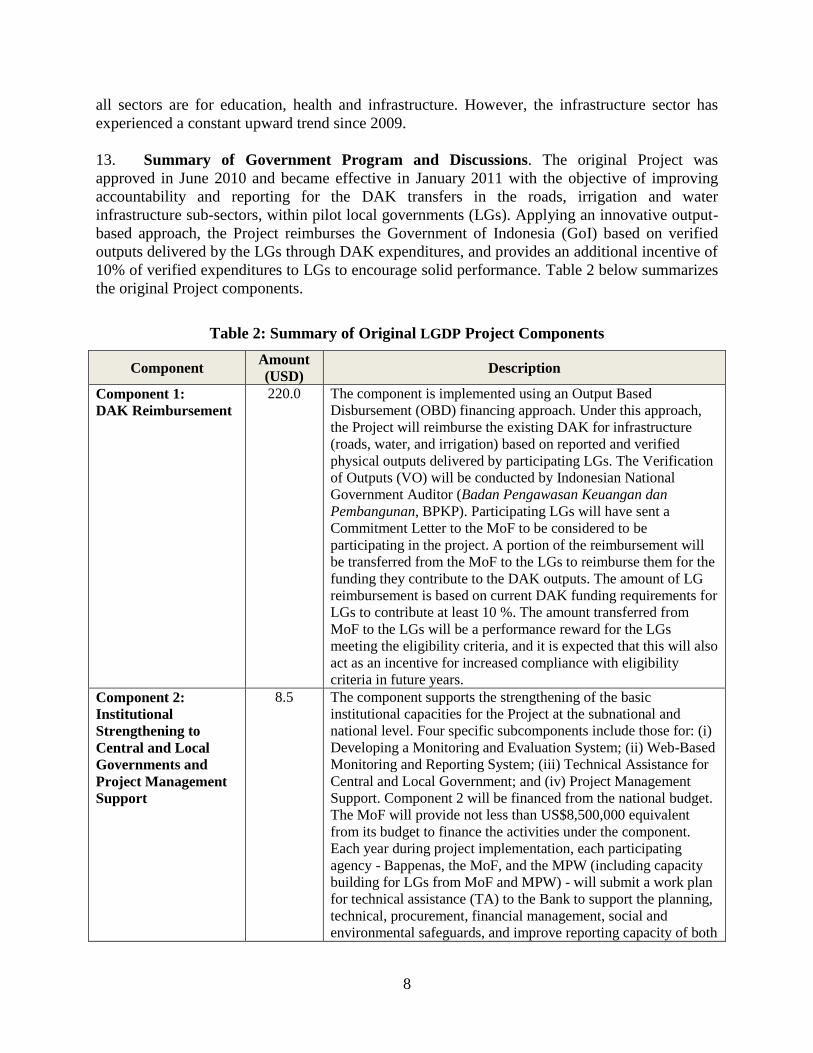
13. Summary of Government Program and Discussions. The original Project was
approved in June 2010 and became effective in January 2011 with the objective of improving
accountability and reporting for the DAK transfers in the roads, irrigation and water
infrastructure sub-sectors, within pilot local governments (LGs). Applying an innovative output-
based approach, the Project reimburses the Government of Indonesia (GoI) based on verified
outputs delivered by the LGs through DAK expenditures, and provides an additional incentive of
10% of verified expenditures to LGs to encourage solid performance. Table 2 below summarizes
the original Project components.
Table 2: Summary of Original LGDP Project Components
Component Amount
(USD) Description
Component 1:
DAK Reimbursement
220.0 The component is implemented using an Output Based
Disbursement (OBD) financing approach. Under this approach,
the Project will reimburse the existing DAK for infrastructure
(roads, water, and irrigation) based on reported and verified
physical outputs delivered by participating LGs. The Verification
of Outputs (VO) will be conducted by Indonesian National
Government Auditor (Badan Pengawasan Keuangan dan
Pembangunan, BPKP). Participating LGs will have sent a
Commitment Letter to the MoF to be considered to be
participating in the project. A portion of the reimbursement will
be transferred from the MoF to the LGs to reimburse them for the
funding they contribute to the DAK outputs. The amount of LG
reimbursement is based on current DAK funding requirements for
LGs to contribute at least 10 %. The amount transferred from
MoF to the LGs will be a performance reward for the LGs
meeting the eligibility criteria, and it is expected that this will also
act as an incentive for increased compliance with eligibility
criteria in future years.
Component 2:
Institutional
Strengthening to
Central and Local
Governments and
Project Management
Support
8.5 The component supports the strengthening of the basic
institutional capacities for the Project at the subnational and
national level. Four specific subcomponents include those for: (i)
Developing a Monitoring and Evaluation System; (ii) Web-Based
Monitoring and Reporting System; (iii) Technical Assistance for
Central and Local Government; and (iv) Project Management
Support. Component 2 will be financed from the national budget.
The MoF will provide not less than US$8,500,000 equivalent
from its budget to finance the activities under the component.
Each year during project implementation, each participating
agency - Bappenas, the MoF, and the MPW (including capacity
building for LGs from MoF and MPW) - will submit a work plan
for technical assistance (TA) to the Bank to support the planning,
technical, procurement, financial management, social and
environmental safeguards, and improve reporting capacity of both

9
Component Amount
(USD) Description
central agencies and LGs.
Component 3:
Verification of
Outputs
4.5 The component finances the verification of outputs (VO) through
BPKP. BPKP will finance the VO function including any
required hiring of new staff and capacity enhancement from their
own budget. BPKP will prepare an annual work plan to be
discussed with the Bank regarding its VO tasks for each
upcoming year.
14. The original Project operates in five pilot provinces and 77 constituent local
governments. Having completed three annual cycles of DAK investment expenditure and
verification, the loan has disbursed approximately USD 171.4 million against verified outputs.
With a no-cost extension of the closing date approved in March 2014, the original Project is now
scheduled to close on December 31, 2015 and projects to disburse a further USD 48.6 million
against DAK expenditures in GoI fiscal years 2014.
15. Discussions with GoI on a second phase of the LGDP operation began in January 2012.
In April 2012, a Concept Review was held for a proposed Second Local Government and
Decentralization Project to be structured under a Program for Results (PforR) approach. During
consultations with MoF and program stakeholders over the course of 2012 and into 2013, MoF
decided against proceeding with a PforR approach, electing conversely the Additional Financing
instrument. Two related factors were cited for the decision. First, GoI noted its preference and
intent to rapidly scale up the existing output-based model developed under LGDP which is
demonstrating results and has been effectively socialized in participating LGs. A change in the
LGDP model at this stage would result in considerable transaction costs associated with the
implementation and socialization of a new model. Second, given its experience with the existing
Program, GoI would be able to socialize and implement a geographical expansion of the existing
Program in a timely and efficient manner.
16. The Ministry of Finance, after review and evaluation of the first LGDP program between
February and August 2013, has requested the Bank to proceed with the preparation of a four year
(calendar years 2015 – 2018) Additional Financing operation covering GoI fiscal years 2015-
2017. Key characteristics of the proposed Additional Financing include: (i) a phased expansion
of the Program to involve 30 provinces (excluding DKI Jakarta and the three provinces with
special autonomy) by the third year; (ii) a strengthened and better targeted institutional support
program; (iii) an improved monitoring and evaluation program; (iv) improved institutional
arrangements; and (v) improved verification of outputs by BPKP.
17. Progress to Date. The original Project has made significant progress to date as evidenced
by the processing of a substantial reimbursement against DAK infrastructure expenditures in the
77 participating LGs across the five pilot provinces. To date, the Project had disbursed USD
171.4 million, or 78% of the total loan amount of USD 220.0 million. The remaining USD 48.6
million will be disbursed in 2015 for reimbursement of 2014 outputs.
18. Project performance is currently Satisfactory. The PDO-level results indicators focus on
output verification, and on reporting by LGs. In this regard, most of the verifiable outputs in
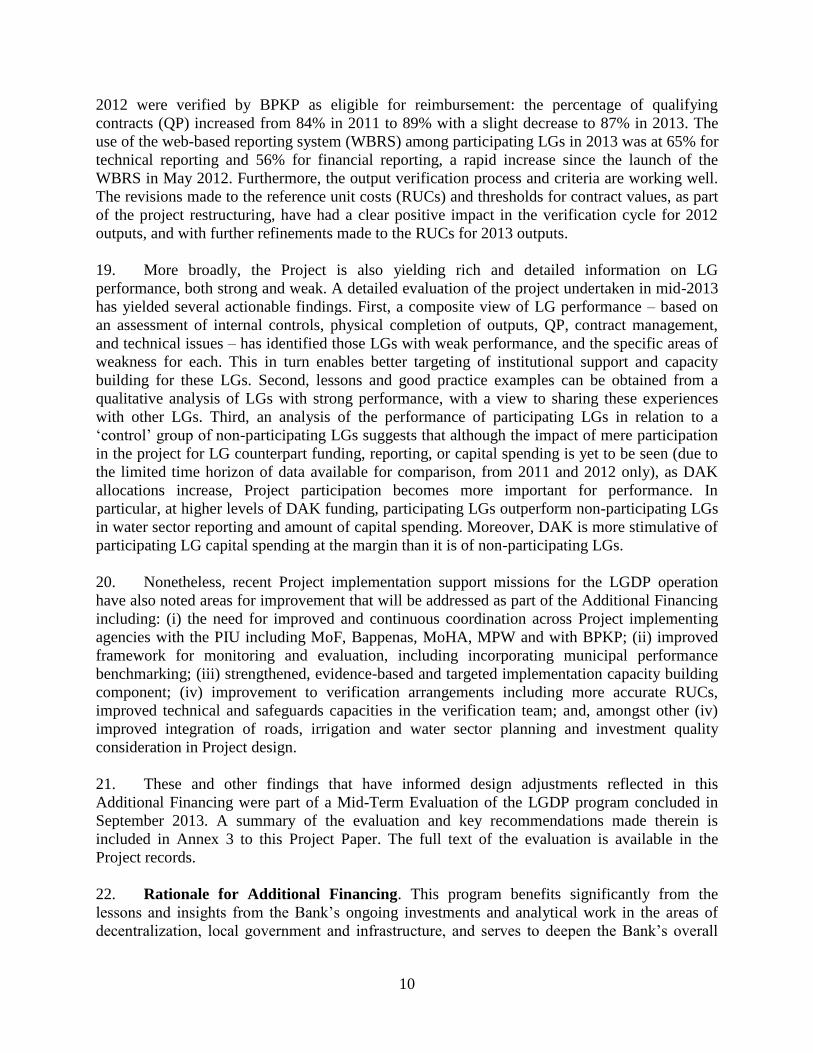
10
2012 were verified by BPKP as eligible for reimbursement: the percentage of qualifying
contracts (QP) increased from 84% in 2011 to 89% with a slight decrease to 87% in 2013. The
use of the web-based reporting system (WBRS) among participating LGs in 2013 was at 65% for
technical reporting and 56% for financial reporting, a rapid increase since the launch of the
WBRS in May 2012. Furthermore, the output verification process and criteria are working well.
The revisions made to the reference unit costs (RUCs) and thresholds for contract values, as part
of the project restructuring, have had a clear positive impact in the verification cycle for 2012
outputs, and with further refinements made to the RUCs for 2013 outputs.
19. More broadly, the Project is also yielding rich and detailed information on LG
performance, both strong and weak. A detailed evaluation of the project undertaken in mid-2013
has yielded several actionable findings. First, a composite view of LG performance – based on
an assessment of internal controls, physical completion of outputs, QP, contract management,
and technical issues – has identified those LGs with weak performance, and the specific areas of
weakness for each. This in turn enables better targeting of institutional support and capacity
building for these LGs. Second, lessons and good practice examples can be obtained from a
qualitative analysis of LGs with strong performance, with a view to sharing these experiences
with other LGs. Third, an analysis of the performance of participating LGs in relation to a
‘control’ group of non-participating LGs suggests that although the impact of mere participation
in the project for LG counterpart funding, reporting, or capital spending is yet to be seen (due to
the limited time horizon of data available for comparison, from 2011 and 2012 only), as DAK
allocations increase, Project participation becomes more important for performance. In
particular, at higher levels of DAK funding, participating LGs outperform non-participating LGs
in water sector reporting and amount of capital spending. Moreover, DAK is more stimulative of
participating LG capital spending at the margin than it is of non-participating LGs.
20. Nonetheless, recent Project implementation support missions for the LGDP operation
have also noted areas for improvement that will be addressed as part of the Additional Financing
including: (i) the need for improved and continuous coordination across Project implementing
agencies with the PIU including MoF, Bappenas, MoHA, MPW and with BPKP; (ii) improved
framework for monitoring and evaluation, including incorporating municipal performance
benchmarking; (iii) strengthened, evidence-based and targeted implementation capacity building
component; (iv) improvement to verification arrangements including more accurate RUCs,
improved technical and safeguards capacities in the verification team; and, amongst other (iv)
improved integration of roads, irrigation and water sector planning and investment quality
consideration in Project design.
21. These and other findings that have informed design adjustments reflected in this
Additional Financing were part of a Mid-Term Evaluation of the LGDP program concluded in
September 2013. A summary of the evaluation and key recommendations made therein is
included in Annex 3 to this Project Paper. The full text of the evaluation is available in the
Project records.
22. Rationale for Additional Financing. This program benefits significantly from the
lessons and insights from the Bank’s ongoing investments and analytical work in the areas of
decentralization, local government and infrastructure, and serves to deepen the Bank’s overall

11
engagement in local government reform. The proposed project is in line with the Bank’s current
Country Partnership Strategy (CPS) by supporting engagements for strengthening central and
local government institutions. In particular, the project would support an output-based approach
to financing local government infrastructure expenditures, while also promoting the use of
country systems in Indonesia.
23. This program directly supports the GoI’s decentralization transformation agenda, which
includes an increased emphasis on the effectiveness of local service delivery, as well as its
priorities for infrastructure development at the local level. The scope and size of DAK transfers
are expected to increase in the coming years, particularly as the financial resources under
existing transfer mechanisms, including the de-concentration and co-management funds, are
shifted to DAK. This shift is articulated in Law (UU) No. 33/2004 on Fiscal Balance between
central and local governments and Government Regulation (PP) No. 7/2008 regarding De-
concentration and Co-Management Funds, with further refinements expected through the
impending revisions to Law 32/2004 and Law 33/2004. Strengthening the intergovernmental
fiscal transfers to LGs, especially improving transparency in the use of funds, is thus essential for
the overall success of decentralization and improving local service delivery in Indonesia.
24. Additionally, the proposed Additional Financing would enable GoI to scale up and
replicate Project outcomes to LGs nationwide beyond the five existing pilot provinces. This
would contribute directly to the GoI reform agenda for DAK, and achieve broader, systemic
effects to improve the performance of more LGs in line with DGFB’s broader transformation
agenda. Project experience to date has demonstrated that the basic approach is sound, and can
deliver concrete results in terms of improving upward accountability and reporting of DAK
outputs by LGs. Scaling-up and extending the Project would also provide the opportunity to
enhance the scope and quality of the institutional strengthening and the monitoring and
evaluation (M&E) components of the Project.
25. Relationship to Country Partnership Strategy (CPS). The World Bank’s Indonesia
CPS for 2013-2015 clearly sets the stage for Bank involvement in local government
infrastructure investment, describing the strengthening of local government performance as one
of the key engagement areas under the pro-growth alignment of Bank support. It notes that weak
infrastructure development is not only undermining Indonesia’s economic growth, but that it also
negatively affects efforts to enhance equity and reduce poverty. While the Government is
committed to reducing its debt to GDP ratio, its priority for borrowing remains focused on
infrastructure and energy development.
III. Proposed Changes
26. The Project development objective will change slightly to more accurately reflect the
geographical scope of the operation, which will now be scaled-up across Indonesia. Thirty of the
country’s 34 provinces will be involved in this scale-up, with the four exceptions being the three
provinces with special autonomy status (Aceh, Papua and West Papua) and the Special Capital
District (DKI) of Jakarta. The unique circumstances of special autonomy, and DKI’s
metropolitan status and financial strength, render the DAK transfers of less relevance for these
four provinces. Table 3 below illustrates the said change:

12
Table 3: Proposed Changes to Project Development Objective
Original PDO Revised PDO
Original project development objective: The
objective of this Project is to improve the
accountability and reporting of the central
government’s Specific Purpose Grants (DAK)
for the infrastructure sub-sectors within pilot
local governments (LGs).
Revised project development objective: The
objective of the Project is to improve the
accountability and reporting of the central
government’s Specific Purpose Grants (DAK)
for basic infrastructure, consisting of roads,
irrigation, water and sanitation, within Selected
Local Governments.
27. Additionally, the proposed Additional Financing includes eight primary changes or
adjustments to the original Project including:
Extension of the Project Closing Date to December 31, 2018
Introduction of Criteria-Based Provincial Selection Methodology
Linking DAK Incentive to Compliance with Web-Based Reporting System
Changes to Component 2 – Restructured as part of an Institutional Support Program
(ISP)
Adjustment in Project Management Arrangements
Enhanced Monitoring and Evaluation Framework
Revised Procurement Arrangements
Enhanced Safeguards Approach by Triggering OP/BP 4.04 Natural Habitats and OP 4.09
Pest Management
28. Extension of the Project Closing Date. The project closing date is being extended from
December 31, 2015 to December 31, 2018 to accommodate the expanded scope outlined in this
Project Paper.
29. Introduction of a Criteria-Based Provincial Selection Methodology. The selection of
pilot participating provinces and constituent local governments for the original LGDP operation
was done based on considerations to maintain geographic balance and to include a broad range
of provinces and participating LGs with respect to performance in executing DAK transfers. For
the proposed LGDP Additional Financing, GoI aims to utilize a more objective and transparent
set of criteria. The LGDP Additional Financing includes a two-stage selection procedure
summarized in Table 4 below. This selection criteria allows the program to choose new
Provinces with the aim to progressively rollout to 30 Provinces by 2017.
Table 4: Summary of Two-Stage Provincial Selection Criteria
Stage Criteria
Stage One Stage 1 screens out non-eligible provinces and groups remaining provinces by
geographic coverage as follows:
- special autonomy provinces of Aceh, Papua and West Papua are excluded
as they are subject to special treatment in the intergovernmental system
- DKI Jakarta is excluded as it is a unique ‘outlier’ due to its size and

13
Stage Criteria
economic role
- the five LGDP pilot provinces are not included in the filtering as they are
already program participants
- the remaining 25 provinces are grouped into 4 regional groups to ensure
for geographic balance in the selection, i.e. Sumatra, Java-Bali,
Kalimantan-Sulawesi, and Eastern Indonesia (Nusa Tenggara-Maluku-
Papua).
Stage Two Stage 2 tabulates an order ranking of all provinces factoring in three variables:
- Proportion of DAK as a share of local budgets. Provinces receive a higher
rank order the greater the ratio of DAK as a percent of total local budgets
in each province. Analysis has shown that the LGDP program is
disproportionately successful in leveraging LG performance improvements
when DAK is a more important source of revenue for LGs.
- Human Development Index (HDI). Provinces with lower HDI receive
higher ranks under the criteria, demonstrating a pro-poor orientation in the
formula for provincial selection.
- Percentage of LGs reporting to Public Works on DAK. Provinces where a
greater number of LGs are reporting on DAK expenditures to the e-
monitoring system receive a higher rank. Here the criteria favor LGs and
provinces with a stronger track record of administrative compliance and
reinforce the transparency objectives of the program.
Stage Three Stage 3 involves the calculation of an aggregate order rank for all provinces
and includes the selection provinces from each island group as per MoF
guidelines (i.e. selection of 9 new provinces for GoI FY15 as follows, two
provinces from Sumatra, two from Java-Bali, three from Kalimantan-Sulawesi
and two from Eastern Indonesia).
30. The application of the abovementioned selection criteria resulted in the selection of the
following new provinces as part of a phased roll out to 30 provinces by 2017. Table 5 below
summarizes the cumulative characteristics of these additional provinces. Additionally, Annex 5
details the selection criteria and results.
Table 5: Summary of Provincial Selection Results
Parameter Original Project Additional Financing Total
Number of eligible
provinces 5
25 new
(with 5 original continuing) 30
Name of eligible
provinces
Jambi, East Java,
Central
Kalimantan,
West Sulawesi,
North Maluku
(i) Bengkulu, Lampung, West Java,
Central Java, West Kalimantan,
North Sulawesi, South Sulawesi,
NTB, NTT; (ii) West Sumatera,
South Sumatera, Bangka Belitung,
Bali, South Kalimantan, Central
Sulawesi, Gorontalo, Maluku; (iii)
North Sumatera, Riau, Kepulauan
Riau, DI Yogyakarta, Banten, East
Kalimantan, North Kalimantan,
South East Sulawesi

14
Number of eligible LGs
within the provinces 77
364
(in 25 new provinces, approx.)
446
(approx.)
2013 DAK allocation,
infrastructure (IDR
billions)
1,081 5,021
(in 25 new provinces, approx.)
6,102
(approx.)
31. Linking Local Government Incentive and Reimbursement to Reporting. The
Government of Indonesia has made a decision to strengthen under the Additional Financing the
emphasis of the program on transparency and accountability by linking the LG Incentive and
Reimbursement to the use of the Web-Based Reporting System (WBRS) for the reporting of
eligible DAK expenditures. Under the original Loan, the LG Incentive and Reimbursement was
calculated at 10% of the Value of Qualifying Reimbursement (VQR), as defined in the Legal
Agreement and Verification Agreement. The use of the WBRS system was encouraged
separately through technical assistance provided under component 2. The value of the LG
Incentive and Reimbursement was not linked to the use of WBRS for the reporting of eligible
DAK expenditures.
32. In the context of the national rollout of the LGDP program through the Additional
Financing, and the importance of further encouraging the accountability and transparency of LGs
with respect to their DAK expenditures, GoI has decided to provide a clear financial incentive
for compliance with WBRS reporting for DAK. For the Additional Financing the Value of LG
Inventive and Reimbursement will be calculated as follows:
(i) Value of Qualifying Reimbursement (VQR) times 10% summed for all Selected
LGs that utilized the web-based reporting system (WBRS) for the reporting of
eligible DAK expenditures; and
(ii) Value of Qualifying Reimbursement (VQR) times 7.5% summed for all Selected
LGs that have not utilized the web-based reporting system (WBRS) for the reporting
of eligible DAK expenditures.
33. As outlined in the Legal Agreement and the Verification Arrangement for this Additional
Financing, the percentages used for calculating the LG Incentive and Reimbursement for both
categories of LGs specified above may be revised by prior written agreement between the Borrower
and the Bank.
34. This change to the Project design will work to incent LGs to meet reporting requirements
under the LGDP program and thereby support enhanced transparency and accountability of the
DAK transfer system.
35. Change to Component 2 –Restructured as part of an Institutional Support Program
(ISP). The Additional Financing proposes a restructuring of Component 2 to better focus
institutional capacity building activities under the Program on leveraging transparency,
governance and performance improvements at the LG level. The component will focus on
leveraging improvements in the efficiency and effectiveness of local government performance in
areas directly related to DAK implementation as well as with respect to broader performance.
15
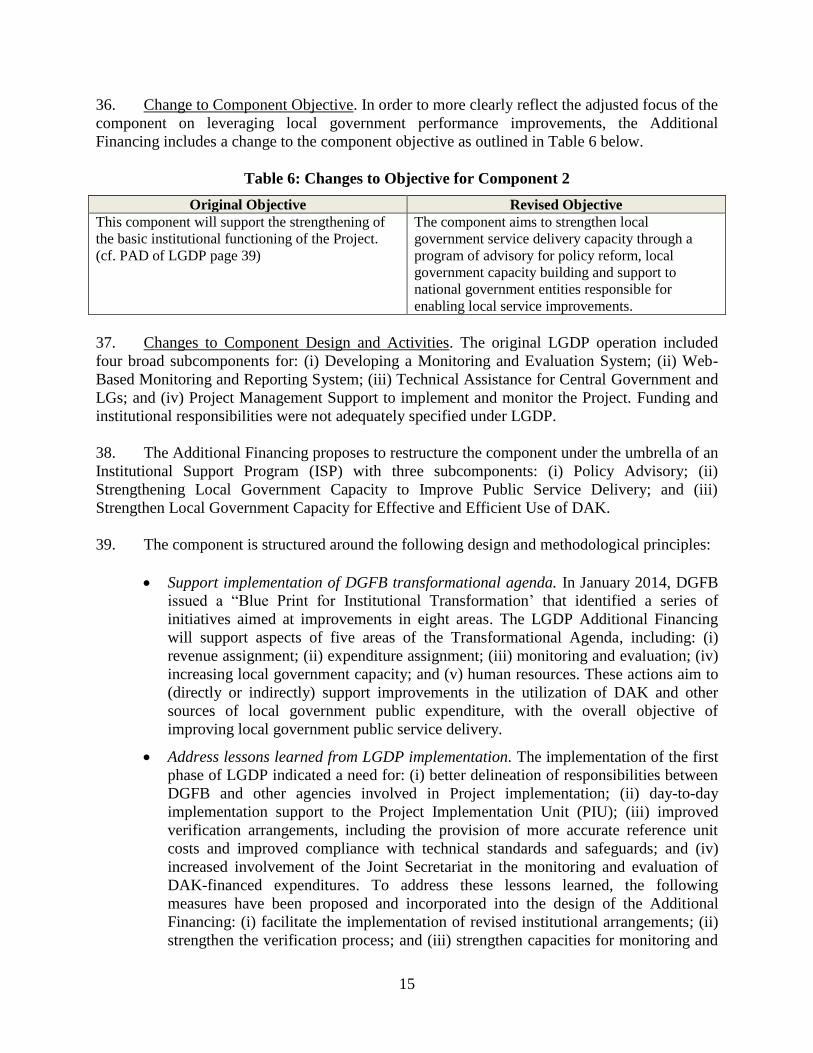
36. Change to Component Objective. In order to more clearly reflect the adjusted focus of the
component on leveraging local government performance improvements, the Additional
Financing includes a change to the component objective as outlined in Table 6 below.
Table 6: Changes to Objective for Component 2
Original Objective Revised Objective
This component will support the strengthening of
the basic institutional functioning of the Project.
(cf. PAD of LGDP page 39)
The component aims to strengthen local
government service delivery capacity through a
program of advisory for policy reform, local
government capacity building and support to
national government entities responsible for
enabling local service improvements.
37. Changes to Component Design and Activities. The original LGDP operation included
four broad subcomponents for: (i) Developing a Monitoring and Evaluation System; (ii) Web-
Based Monitoring and Reporting System; (iii) Technical Assistance for Central Government and
LGs; and (iv) Project Management Support to implement and monitor the Project. Funding and
institutional responsibilities were not adequately specified under LGDP.
38. The Additional Financing proposes to restructure the component under the umbrella of an
Institutional Support Program (ISP) with three subcomponents: (i) Policy Advisory; (ii)
Strengthening Local Government Capacity to Improve Public Service Delivery; and (iii)
Strengthen Local Government Capacity for Effective and Efficient Use of DAK.
39. The component is structured around the following design and methodological principles:
Support implementation of DGFB transformational agenda. In January 2014, DGFB
issued a “Blue Print for Institutional Transformation’ that identified a series of
initiatives aimed at improvements in eight areas. The LGDP Additional Financing
will support aspects of five areas of the Transformational Agenda, including: (i)
revenue assignment; (ii) expenditure assignment; (iii) monitoring and evaluation; (iv)
increasing local government capacity; and (v) human resources. These actions aim to
(directly or indirectly) support improvements in the utilization of DAK and other
sources of local government public expenditure, with the overall objective of
improving local government public service delivery.
Address lessons learned from LGDP implementation. The implementation of the first
phase of LGDP indicated a need for: (i) better delineation of responsibilities between
DGFB and other agencies involved in Project implementation; (ii) day-to-day
implementation support to the Project Implementation Unit (PIU); (iii) improved
verification arrangements, including the provision of more accurate reference unit
costs and improved compliance with technical standards and safeguards; and (iv)
increased involvement of the Joint Secretariat in the monitoring and evaluation of
DAK-financed expenditures. To address these lessons learned, the following
measures have been proposed and incorporated into the design of the Additional
Financing: (i) facilitate the implementation of revised institutional arrangements; (ii)
strengthen the verification process; and (iii) strengthen capacities for monitoring and

16
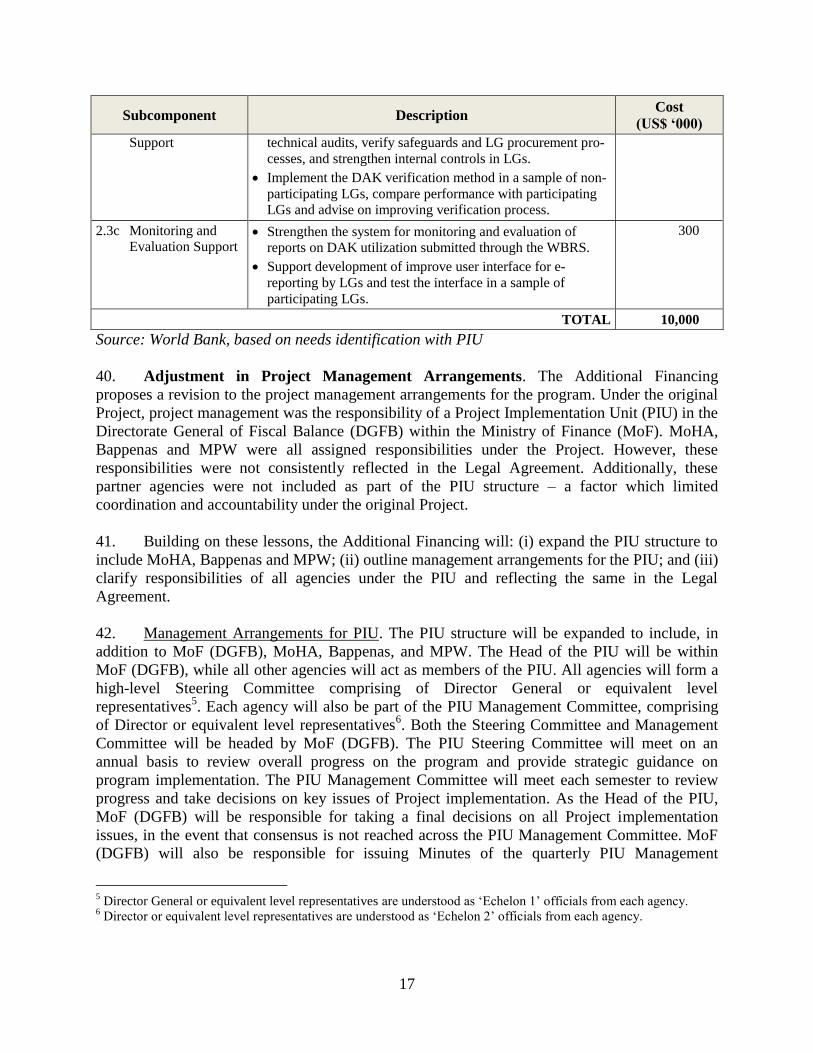
evaluation of DAK utilization. Key activities to be supported under the component
are specified in Table 7 below.
Table 7: Summary of Proposed Institutional Support Program (ISP)
Subcomponent Description Cost
(US$ ‘000)
2.1 Policy Advisory
2.1a Reform of
Intergovernmental
Transfers
Review service standards in selected DAK sectors
Design output-based and performance-driven DAK
Advise on development of multi-year DAK Design
Policy analysis and advisory on request of GoI
400
2.1b Improving LG
Service Delivery
Policy advisory on improving LG service delivery
Test prospective tools for improving municipal management
and citizen accountability in a sample LGs
Develop and use LG ranking to improve citizen ability to
hold LGs accountable for service delivery
Monitor and evaluate implementation of selected tool
Implement selected tools in selected LGs
600
2.1c Capacity Building
Support to DGFB
Review M&E of DAK spending and recommend on
improvements
Support training for PIU
250
2.2 Strengthen Local Government Capacity to Improve Public Service Delivery
2.2a LG Capacity
Building for
Improved DAK
Utilization
Provide participating LGs with hands-on support to
overcome weaknesses identified by BPKP and other
instruments, including:
- regional financial management,
- procurement
- investment planning and maintenance,
- technical quality control
- safeguards management, and
- reporting and accountability
3,500
2.2.b LG Capacity
Building for
Improved Public
Service Delivery
Implement tools to improve municipal management and
citizen accountability
4,000
2.3 Strengthening Central Government Capacity for Effective and Efficient Use of DAK
2.3a Implementation
Support Support day-to-day-management of the project, including:
- reporting,
- monitoring and evaluation of project progress,
- information dissemination to LGs,
- implementation of WBRS,
- updating and expansion of reference unit costs,
- social and environmental safeguards,
- development and updating of training materials for LGs,
500
2.3b Verification Improve the capacity of the verification agency to conduct 450
17
Subcomponent Description Cost
(US$ ‘000)
Support technical audits, verify safeguards and LG procurement pro-
cesses, and strengthen internal controls in LGs.
Implement the DAK verification method in a sample of non-
participating LGs, compare performance with participating
LGs and advise on improving verification process.
2.3c Monitoring and
Evaluation Support Strengthen the system for monitoring and evaluation of
reports on DAK utilization submitted through the WBRS.
Support development of improve user interface for e-
reporting by LGs and test the interface in a sample of
participating LGs.
300
TOTAL 10,000
Source: World Bank, based on needs identification with PIU
40. Adjustment in Project Management Arrangements. The Additional Financing
proposes a revision to the project management arrangements for the program. Under the original
Project, project management was the responsibility of a Project Implementation Unit (PIU) in the
Directorate General of Fiscal Balance (DGFB) within the Ministry of Finance (MoF). MoHA,
Bappenas and MPW were all assigned responsibilities under the Project. However, these
responsibilities were not consistently reflected in the Legal Agreement. Additionally, these
partner agencies were not included as part of the PIU structure – a factor which limited
coordination and accountability under the original Project.
41. Building on these lessons, the Additional Financing will: (i) expand the PIU structure to
include MoHA, Bappenas and MPW; (ii) outline management arrangements for the PIU; and (iii)
clarify responsibilities of all agencies under the PIU and reflecting the same in the Legal
Agreement.
42. Management Arrangements for PIU. The PIU structure will be expanded to include, in
addition to MoF (DGFB), MoHA, Bappenas, and MPW. The Head of the PIU will be within
MoF (DGFB), while all other agencies will act as members of the PIU. All agencies will form a
high-level Steering Committee comprising of Director General or equivalent level
representatives5. Each agency will also be part of the PIU Management Committee, comprising
of Director or equivalent level representatives6. Both the Steering Committee and Management
Committee will be headed by MoF (DGFB). The PIU Steering Committee will meet on an
annual basis to review overall progress on the program and provide strategic guidance on
program implementation. The PIU Management Committee will meet each semester to review
progress and take decisions on key issues of Project implementation. As the Head of the PIU,
MoF (DGFB) will be responsible for taking a final decisions on all Project implementation
issues, in the event that consensus is not reached across the PIU Management Committee. MoF
(DGFB) will also be responsible for issuing Minutes of the quarterly PIU Management
5 Director General or equivalent level representatives are understood as ‘Echelon 1’ officials from each agency.
6 Director or equivalent level representatives are understood as ‘Echelon 2’ officials from each agency.
18
Committee Meetings, and also for aggregating all Project reporting and monitoring reports to the
Bank.
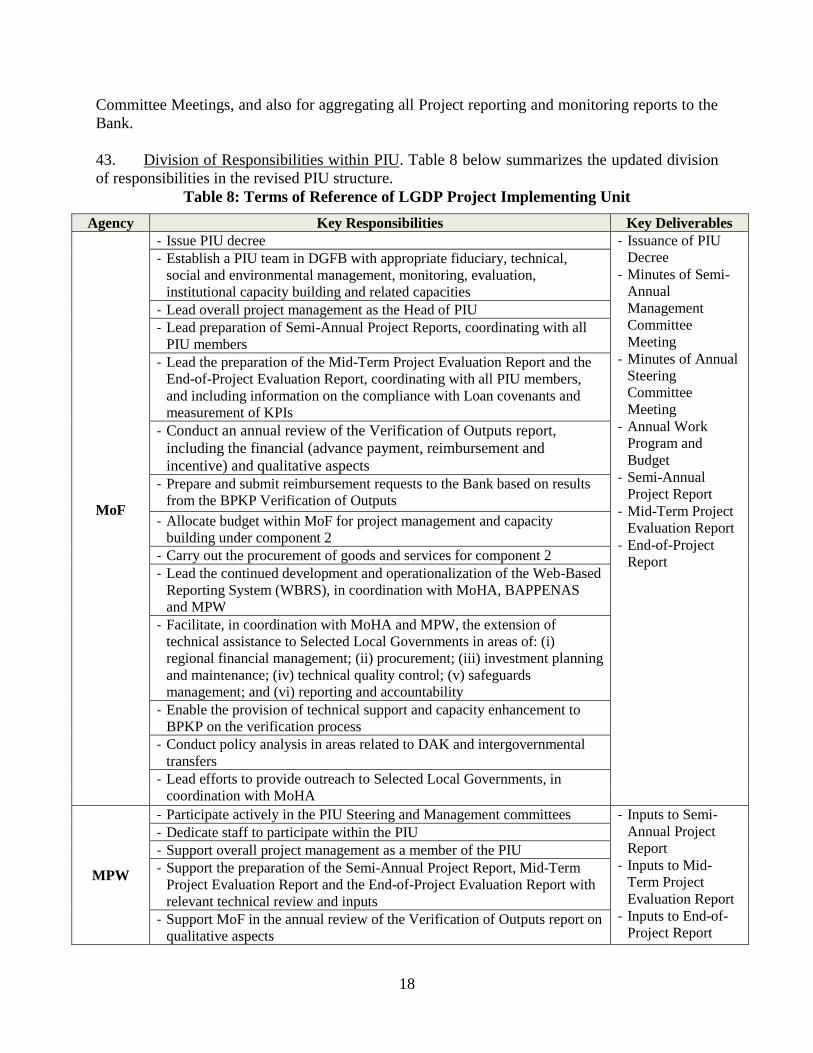
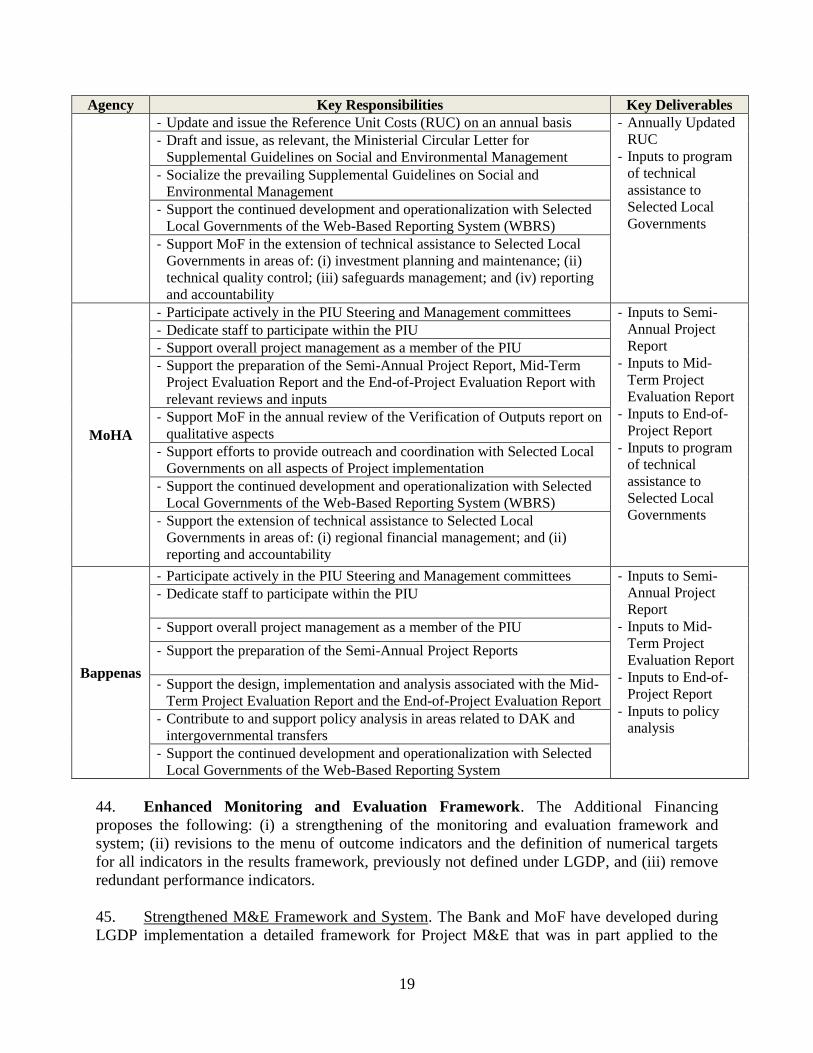
43. Division of Responsibilities within PIU. Table 8 below summarizes the updated division
of responsibilities in the revised PIU structure.
Table 8: Terms of Reference of LGDP Project Implementing Unit
Agency Key Responsibilities Key Deliverables
MoF
- Issue PIU decree - Issuance of PIU
Decree
- Minutes of Semi-
Annual
Management
Committee
Meeting
- Minutes of Annual
Steering
Committee
Meeting
- Annual Work
Program and
Budget
- Semi-Annual
Project Report
- Mid-Term Project
Evaluation Report
- End-of-Project
Report
- Establish a PIU team in DGFB with appropriate fiduciary, technical,
social and environmental management, monitoring, evaluation,
institutional capacity building and related capacities
- Lead overall project management as the Head of PIU
- Lead preparation of Semi-Annual Project Reports, coordinating with all
PIU members
- Lead the preparation of the Mid-Term Project Evaluation Report and the
End-of-Project Evaluation Report, coordinating with all PIU members,
and including information on the compliance with Loan covenants and
measurement of KPIs
- Conduct an annual review of the Verification of Outputs report,
including the financial (advance payment, reimbursement and
incentive) and qualitative aspects
- Prepare and submit reimbursement requests to the Bank based on results
from the BPKP Verification of Outputs
- Allocate budget within MoF for project management and capacity
building under component 2
- Carry out the procurement of goods and services for component 2
- Lead the continued development and operationalization of the Web-Based
Reporting System (WBRS), in coordination with MoHA, BAPPENAS
and MPW
- Facilitate, in coordination with MoHA and MPW, the extension of
technical assistance to Selected Local Governments in areas of: (i)
regional financial management; (ii) procurement; (iii) investment planning
and maintenance; (iv) technical quality control; (v) safeguards
management; and (vi) reporting and accountability
- Enable the provision of technical support and capacity enhancement to
BPKP on the verification process
- Conduct policy analysis in areas related to DAK and intergovernmental
transfers
- Lead efforts to provide outreach to Selected Local Governments, in
coordination with MoHA
MPW
- Participate actively in the PIU Steering and Management committees - Inputs to Semi-
Annual Project
Report
- Inputs to Mid-
Term Project
Evaluation Report
- Inputs to End-of-
Project Report
- Dedicate staff to participate within the PIU
- Support overall project management as a member of the PIU
- Support the preparation of the Semi-Annual Project Report, Mid-Term
Project Evaluation Report and the End-of-Project Evaluation Report with
relevant technical review and inputs
- Support MoF in the annual review of the Verification of Outputs report on
qualitative aspects
19
Agency Key Responsibilities Key Deliverables
- Update and issue the Reference Unit Costs (RUC) on an annual basis - Annually Updated
RUC
- Inputs to program
of technical
assistance to
Selected Local
Governments
- Draft and issue, as relevant, the Ministerial Circular Letter for
Supplemental Guidelines on Social and Environmental Management
- Socialize the prevailing Supplemental Guidelines on Social and
Environmental Management
- Support the continued development and operationalization with Selected
Local Governments of the Web-Based Reporting System (WBRS)
- Support MoF in the extension of technical assistance to Selected Local
Governments in areas of: (i) investment planning and maintenance; (ii)
technical quality control; (iii) safeguards management; and (iv) reporting
and accountability
MoHA
- Participate actively in the PIU Steering and Management committees - Inputs to Semi-
Annual Project
Report
- Inputs to Mid-
Term Project
Evaluation Report
- Inputs to End-of-
Project Report
- Inputs to program
of technical
assistance to
Selected Local
Governments
- Dedicate staff to participate within the PIU
- Support overall project management as a member of the PIU
- Support the preparation of the Semi-Annual Project Report, Mid-Term
Project Evaluation Report and the End-of-Project Evaluation Report with
relevant reviews and inputs
- Support MoF in the annual review of the Verification of Outputs report on
qualitative aspects
- Support efforts to provide outreach and coordination with Selected Local
Governments on all aspects of Project implementation
- Support the continued development and operationalization with Selected
Local Governments of the Web-Based Reporting System (WBRS)
- Support the extension of technical assistance to Selected Local
Governments in areas of: (i) regional financial management; and (ii)
reporting and accountability
Bappenas
- Participate actively in the PIU Steering and Management committees - Inputs to Semi-
Annual Project
Report
- Inputs to Mid-
Term Project
Evaluation Report
- Inputs to End-of-
Project Report
- Inputs to policy
analysis
- Dedicate staff to participate within the PIU
- Support overall project management as a member of the PIU
- Support the preparation of the Semi-Annual Project Reports
- Support the design, implementation and analysis associated with the Mid-
Term Project Evaluation Report and the End-of-Project Evaluation Report
- Contribute to and support policy analysis in areas related to DAK and
intergovernmental transfers
- Support the continued development and operationalization with Selected
Local Governments of the Web-Based Reporting System
44. Enhanced Monitoring and Evaluation Framework. The Additional Financing
proposes the following: (i) a strengthening of the monitoring and evaluation framework and
system; (ii) revisions to the menu of outcome indicators and the definition of numerical targets
for all indicators in the results framework, previously not defined under LGDP, and (iii) remove
redundant performance indicators.
45. Strengthened M&E Framework and System. The Bank and MoF have developed during
LGDP implementation a detailed framework for Project M&E that was in part applied to the
20
Mid-Term Evaluation concluded in July 2013. Characteristics of the revised framework include:
(i) use of impact evaluation methodologies using control groups to assess impacts on DAK
performance and spillovers; (ii) development of benchmarking, performance mapping,
monitoring of physical outputs and related tools to increase the management utility of the M&E
system; (iii) development of an interface at the LG level to simplify redundancy in data entry
across MoF and MPW reporting systems for DAK; and (iv) clearer institutional roles and
responsibilities for the implementation of the M&E framework.
46. Changes to the Project Outcome and Intermediate Outcome Indicators. The Additional
Financing proposes changes to one of the two Project outcome indicators to better measure
results. See Table 9 below for details.
Table 9: Changes to PDO Outcome Indicators
Original Indicator Original Target Changes with AF Revised Target
(by EOP) 1. Development and use
of an information system
to which LGs report
information to the MoF
and the MPW
Not applicable 1. % of DAK reports submitted
online through Web-Based
Reporting System
80%
2. % of physical outputs
reported, verified, and
meeting eligibility criteria
Not applicable 2. No change 88%
47. The Additional Financing also makes a number of changes to intermediate outcome
indicators. Specifically, the revised Results Framework for this Additional Financing includes:
(i) the inclusion of multiple intermediate output indicators that were part of the Project M&E
framework but were not included in the original LGDP PAD; (ii) removal of two redundant
indicators; and (iii) the introduction of time-bound and objectively verifiable targets for all
outcome and intermediate outcome indicators. These revised indicators and targets are specified
in Annex 1 on Results Framework and Monitoring.
48. Measurement of Outputs and Outcomes. The original LGDP operation – due to its focus
on accountability – did not explicitly include the measurement of physical outcome and output
indicators supported under the Program. The revised M&E framework for the Additional
Financing will collect a much broader set of data – beyond that required to report on the
indicators in the Results Framework – for all participating Provinces. It will also begin to
calculate efficiency measures (i.e. cost per unit output delivered), to be used for benchmarking
and time horizon analysis. A full list of physical outcome and output indicators are included in
the Operations Manual and will include core measures such as:
kilometers of roads upgraded (peningkatan) to a standard width of X meters;
number of houses connected to a clean water supply; and
hectares of cropland irrigated as a result of upgrading (peningkatan) of irrigation
infrastructure.

21
49. Revised Procurement Arrangements. The Additional Financing reflects minor
adjustments to the procurement arrangements for the Project. Specifically, the Additional
Financing will include an increase in the threshold amounts for eligible contracts and the
inclusion of community-based sanitation sector subprojects procured through simplified
competitive procedures.
50. Increasing Procurement Thresholds to Promote Improved Practices. As outlined in
further detail below, the original Project maintained a system of procurement thresholds of
$400,000, $500,000 and up to $1,000,000 based on compliance with basic procurement-related
actions. As part of this Additional Financing, in order to incentivize the use of e-procurement
practices, the Additional Financing will raise the threshold for eligible contract values to US$
2,000,000 based on LG compliance with specific criteria.
51. Enabling the Procurement of Sanitation Subprojects through Community Participation
with the use of Simplified Competitive Procedures. As part of the Additional Financing, the
menu of eligible procurement procedures will be expanded to include community participation in
procurement through simplified competitive procurement procedures for sanitation sector
investments.
52. These adjustments to the procurement arrangements for the Additional Financing are
discussed in greater detail below in the Appraisal Summary section of this Project Paper.
53. Enhanced Safeguards Approach by Triggering OP/BP 4.04 Natural Habitats and
OP 4.09 Pest Management. The LGDP Additional Financing, in expanding the geographical
coverage of the program from 5 pilot provinces (covering eligible 77 LGs) to 30 participating
provinces (covering approximately 446 eligible LGs), significantly increases the Project
‘footprint’; and, as such, alters the risk profile of the program. The Additional Financing will
also raise the threshold for eligible investments thereby increasing the possibility of greater
social and environmental impacts caused by individual subprojects. Therefore, the Additional
Financing triggers two additional Bank safeguard policies: Natural Habitats (OP/BP 4.04) and
Pest Management (OP 4.09).
54. The application of both policies will ensure that explicit and enhanced measures are in
place to mitigate and manage any and all adverse impacts related to the potential indirect
increase in pesticide use caused by increased crop production related to the irrigation
investments and potential adverse impacts on natural habitats related to all subproject typologies
in peri-urban and agricultural areas. The policies will also lead to improved safeguards
management at the LG level with respect to natural habitats and awareness and adoption of
integrated pest management methods. The policies were not triggered for the original Project due
to the pilot nature of the operation, the limited scale and scope of the investments and the
adequacy of the safeguard instrument and national legal and regulatory framework effective at
the time.
55. The Borrower and the Bank have agreed to a joint field-based review to take stock of the
experience and application of the current safeguard instrument within the first twelve months of
Project effectiveness, in light of the enhanced geographic scope and subproject size. The review

22
will recommend any necessary refinements to the safeguards approach. Additionally, the
Borrower and the Bank have agreed to incorporate technical assistance activities in component 2
of the AF (as further detailed in the Operations Manual) to strengthen LG awareness and
capacity with respect to managing natural habitat issues and promoting integrated pest
management practices as indicated and mandated in the instrument, accompanying project
manual, parent MPW guidelines and the overarching national legal and regulatory framework.
56. A more detailed discussion of environmental and social safeguards issued is included
below in the Appraisal Summary.
57. Project Costs. Table 10 below reflects the revised Project costs based on the proposed
Additional Financing and Restructuring.
Table 10: Costs by Component
Component Original Cost Changes with AF Revised Cost 1. DAK Reimbursement 220.0 500.0 720.0 2. Institutional Strengthening to Central
and Local Governments and Project
Management Support
8.5 10.0 18.5
3. Verification of Outputs 4.5 10.0 14.5
Total 233.0 520.0 753.0
IV. Appraisal Summary
58. Economic Analysis. The net present value (NPV) of Project investments was calculated
for the original LGDP operation as a whole, over a period of five years (2015-2019) using a
discount rate used of 12%. For illustrative purposes, the internal rate of return (based on net
economic benefits) was also calculated, to show the discount rate at which net present value
would be zero. It should be noted that the cost and benefit figures for each province do not take
into account the national-level investments for Components 2 and 3 of the Project; these are,
however, included in the analysis and results shown for the Project overall.
59. The results of the cost-benefit analysis are summarized in Table 11 below. The Project
NPV over five years, at a discount rate of 12%, is estimated at US$89,119,951, with an
economic internal rate of return (EIRR) of 30%.
Table 11: Benefits, costs and net present value for Project investments (USD)
Participating Provinces Total Benefit Total Cost North Sumatera 49,842,845 39,562,176
West Sumatera 40,657,736 28,236,419
Riau 20,221,365 16,205,140
Jambi 19,818,763 9,450,324
South Sumatera 28,396,226 19,706,236
Bengkulu 16,207,265 10,063,931
Lampung 18,287,005 15,655,499
Bangka Belitung 12,430,470 8,751,319
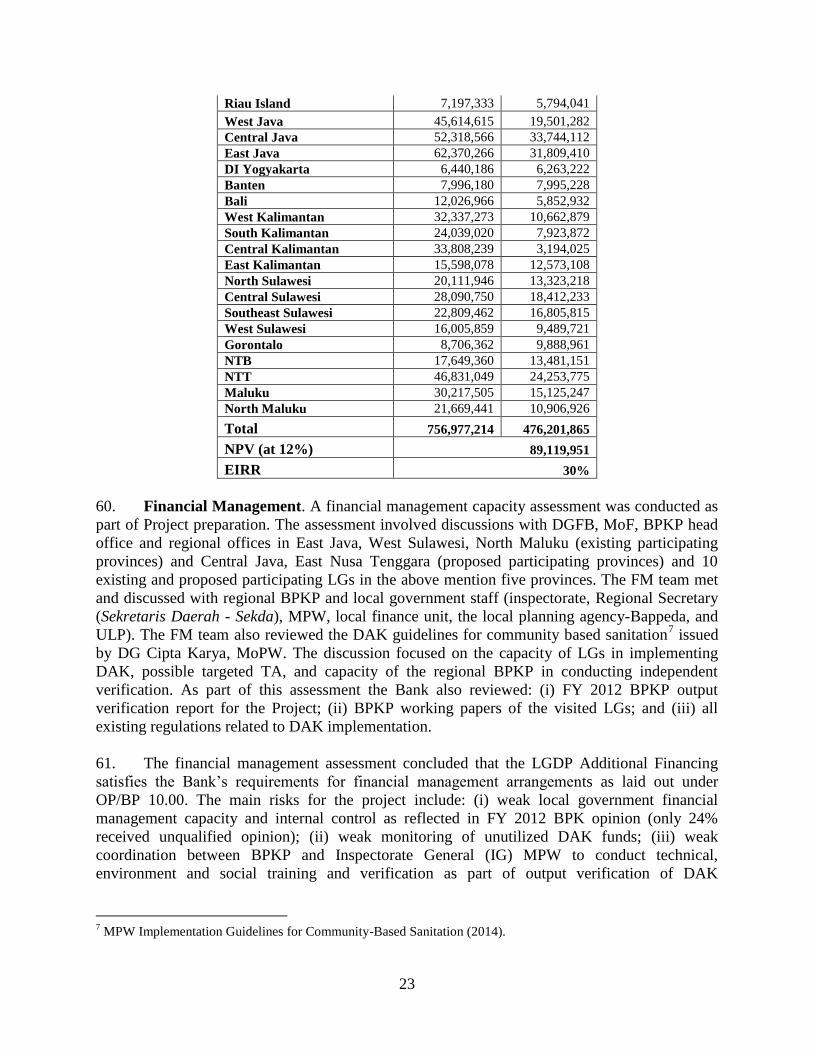
23
Riau Island 7,197,333 5,794,041
West Java 45,614,615 19,501,282
Central Java 52,318,566 33,744,112
East Java 62,370,266 31,809,410
DI Yogyakarta 6,440,186 6,263,222
Banten 7,996,180 7,995,228
Bali 12,026,966 5,852,932
West Kalimantan 32,337,273 10,662,879
South Kalimantan 24,039,020 7,923,872
Central Kalimantan 33,808,239 3,194,025
East Kalimantan 15,598,078 12,573,108
North Sulawesi 20,111,946 13,323,218
Central Sulawesi 28,090,750 18,412,233
Southeast Sulawesi 22,809,462 16,805,815
West Sulawesi 16,005,859 9,489,721
Gorontalo 8,706,362 9,888,961
NTB 17,649,360 13,481,151
NTT 46,831,049 24,253,775
Maluku 30,217,505 15,125,247
North Maluku 21,669,441 10,906,926
Total 756,977,214 476,201,865
NPV (at 12%) 89,119,951
EIRR 30%
60. Financial Management. A financial management capacity assessment was conducted as
part of Project preparation. The assessment involved discussions with DGFB, MoF, BPKP head
office and regional offices in East Java, West Sulawesi, North Maluku (existing participating
provinces) and Central Java, East Nusa Tenggara (proposed participating provinces) and 10
existing and proposed participating LGs in the above mention five provinces. The FM team met
and discussed with regional BPKP and local government staff (inspectorate, Regional Secretary
(Sekretaris Daerah - Sekda), MPW, local finance unit, the local planning agency-Bappeda, and
ULP). The FM team also reviewed the DAK guidelines for community based sanitation7 issued
by DG Cipta Karya, MoPW. The discussion focused on the capacity of LGs in implementing
DAK, possible targeted TA, and capacity of the regional BPKP in conducting independent
verification. As part of this assessment the Bank also reviewed: (i) FY 2012 BPKP output
verification report for the Project; (ii) BPKP working papers of the visited LGs; and (iii) all
existing regulations related to DAK implementation.
61. The financial management assessment concluded that the LGDP Additional Financing
satisfies the Bank’s requirements for financial management arrangements as laid out under
OP/BP 10.00. The main risks for the project include: (i) weak local government financial
management capacity and internal control as reflected in FY 2012 BPK opinion (only 24%
received unqualified opinion); (ii) weak monitoring of unutilized DAK funds; (iii) weak
coordination between BPKP and Inspectorate General (IG) MPW to conduct technical,
environment and social training and verification as part of output verification of DAK
7 MPW Implementation Guidelines for Community-Based Sanitation (2014).
24
implementation; (iv) insufficient budget for BPKP to conduct the task; and (v) improvements
required on DAK guidelines for community based sanitation.
62. The financial management risk for the Project is considered ‘Substantial’ before
mitigation and ‘Moderate’ after mitigation. As a means to mitigate these risks, the Project will:
(i) provide technical assistance to local government to improve local government internal
controls supported by BPKP; (ii) strengthen coordination between BPKP with MPW; and (iii)
revised DAK guidelines for community based sanitation. The Additional Financing also included
the updating of both the Verification Arrangement with BPKP, reflecting the updated Project
design and the expanded scope of the verification framework. Additionally, the ToRs for the
independent BPK audit have also been updated. There is no pending audit report for the project.
63. Under implementation, the Bank team will aim to work with MoF to ensure that BPKP
receive continuous and structured support from either the MPW Inspectorate General and/or
Balai Besar at the provincial level for technical aspects related to the output verification.
Additionally, both BPKP and MPW will need to secure adequate budget to support the enhanced
output verification requirements. Lastly, GoI is encouraged to identify alternatives for the
monitoring of unutilized DAK funds, including the possibility of inclusion of such tasks under
the scope of the BPKP ToRs for the output verification.
64. Disbursement Arrangements. The prevailing disbursement arrangement will be
maintained for the Additional Financing. Disbursements are on a reimbursement basis. The
reimbursement is made based on BPKP’s Output Verification Report(s). The Bank’s
reimbursement of DAK expenditures occurs once a year. The reimbursement includes the
advance reimbursement against expected DAK expenditures for the year (and will be recorded as
advance in the Bank's disbursement system) and reimbursement against outputs delivered at
year-end and verified in the first quarter of the following calendar year. The Bank finances not
more than 100% of the total cost of the Selected Government eligible investments as verified by
BPKP, up to Bank's full commitment amount under this additional financing. MOF is required to
transfer 10% of the amount disbursed by the Bank to MOF to the relevant Selected Local
Governments.
65. The Bank has disbursed three times, for outputs delivered at the end of GoI FYs 2011,
2012,and 2013. To date, the project has disbursed 78% of the allocated loan under the original
project (IBRD Loan No. 7914).. The remaining balance of USD 48.6million will be disbursed in
2015 against the 2014 verified outputs.
66. Procurement. Minor changes are expected in the procurement arrangements under the
Additional Financing. As under the original DAK operation, the Additional Financing is
expected to continue to finance, through the output-based reimbursement mechanism, the
reimbursement of eligible expenditures for subproject contracts of infrastructure civil works such
as maintenance, rehabilitation, improvement, development, and construction of new
infrastructure facilities. Procurement will continue to require the application of competitive
procurement procedures (Pelelangan Umum and Pemilihan Langsung) under Perpres 54/2010,
as amended by Perpres 70/2012, and sanitation subproject contracts, regardless of value, may be
procured through community participation through simplified competitive procedure

25
(Pengadaan Barang/Jasa dengan Pelelangan Sederhana) as per sub-paragraph 3.6.2 and sub-
paragraph 3.7 of the Annex for Implementation Guidance on Procurement of Goods and
Services of Community Based Sanitation as attached to the Implementing Guidance for DAK
Community Based Sanitation of 2014.
67. However, the restriction on subproject contract value under the Additional Financing is
being amended to increase the threshold from US$1,000,000 to US$2,000,000 and the
corresponding eligibility criteria for reimbursement of outputs for the increased threshold value
has been revised as follows to promote use of e-procurement for greater transparency:
(i) The Subproject was for a contract value of up to $500,000 equivalent; or
(ii) The Subproject was for a contract value of more than $500,000 equivalent and up to
$1,000,000 equivalent and (A) a decree for establishing the Procurement Service
Unit (ULP) has been issued by the relevant Local Government; and (B) each such
ULP has been properly staffed and budgeted in a manner satisfactory to the
Borrower and the Bank; or
(iii) The Subproject was for a contract value of more than $1,000,000 equivalent and up
to $2,000,000, and (A) a decree for establishing the ULP has been issued by the
relevant Local Government; (B) each such ULP has been properly staffed and
budgeted in a manner satisfactory to the Borrower and the Bank, and (C) the
Government’s e-procurement system has been used to invite and receive bids and
award the contract.
68. Furthermore, compliance of the procurement process of the specific subproject contracts
procured by the respective participating LGs, with the competitive procurement procedures, i.e.
Pelelangan Umum and Pemilihan Langsung (with post-qualification), set out in the Perpres
54/2010 as amended by Perpres 70/2012, shall also be verified for eligibility of reimbursement
of such contracts. Similarly, BPKP shall verify compliance of sanitation subproject contracts
with Pengadaan Barang/Jasa dengan Pelelangan Sederhana in sub-paragraph 3.6.2 and sub-
paragraph 3.7 of the Annex for Implementation Guidance on Procurement of Goods and Services
of Community Based Sanitation as attached to the Implementing Guidance for DAK Community
Based Sanitation of 2014. The review will include the following actions to be taken by BPKP:
verification of the availability and maintenance by the participating LGs/communities of
complete records of procurement, contract and purchase order documents;
review of the invitation for bids (tender notice) and request for quotations;
review of bidding and quotations documents;
review of bid and quotations evaluation reports;
review of signed contracts and purchase orders;
69. The BPKP verification process will be further strengthened under the Additional
Financing to enhance the level of detail in verification, on an ex-post basis, the procurement
processes for verifying substantial compliance with the required procurement procedures under
the applicable competitive methods of procurement under Perpres 54/70 and the Implementing
Guidance for DAK Community Based Sanitation of 2014. In carrying out the verification of
procurement to determine eligibility for reimbursement, BPKP shall use a check-list and
reporting format satisfactory to the World Bank.

26
70. The Additional Financing will also provide technical assistance, through a separate
Project component for institutional support, to support and build procurement implementation
capacity of the ULPs in the participating LGs, to pilot implementation of a program for
promoting use of e-procurement and monitoring of procurement performance, and to strengthen
the capacity of BPKP to effectively undertake verification of procurement processes.
71. Poverty, Social and Gender Impacts. A rapid poverty, social and gender assessment
has been conducted in the context of this Additional Financing. The assessment aims to identify
key poverty, gender and social impacts of the Program. More detailed findings of the assessment
are included in Annex 6.
72. Infrastructure investments funded through DAK transfers have three potential positive
effects on reducing poverty. These include: (i) a public works effect; (ii) a broad-based economic
growth effect; and (3) a non-income effect. It is well known that the construction of public
infrastructure can provide needed wages to low-income workers and therefore assist in the
reduction of poverty. DAK funded projects are implemented annually and can provide an
especially reliable source of necessary income for the poor and near poor in this regard. The
stock of infrastructure created by publically financed investments can also positively influence
broad-based economic growth, which in turn can help reduce poverty. Empirical evidence for
Indonesia suggests that increases in both the amount and quality of local roads infrastructure—a
major focus of the DAK—have a significant positive impact on district economic growth.
Finally, infrastructure can help reduce non-income poverty by providing the poor with enhanced
access to important public services. In this context, the DAK project helps to provide increased
access to water, for example, which helps to improve the quality of vulnerable groups’ lives
through enriched health outcomes.
73. New construction of small roads, irrigation channels and water supply facilities and
improved infrastructure supported under DAK will improve access and reliability of road and
water related services, in particular for vulnerable populations like women, youth, and elderly.
The rehabilitation of roads and bridges will be beneficial for women and youth, as it improves
road safety, reduces transportation costs and improves access social services. The new and
improved household water connections will help women in their role as provider of clean water
for their families.
74. Environmental and Social Safeguards. The proposed LGDP Additional Financing will
finance similar activities to those financed under the original Project, expanding coverage to a
total of 30 provinces and up to approximately 446 eligible local governments across Indonesia.
75. Investment Typology. The LGDP AF project will reimburse infrastructure investments
mainly for maintenance, rehabilitation and improvement of four types of investments; i.e. roads
(fixing pot holes, resurfacing of existing road, minor alignment), irrigation (fixing the retaining
walls, upgrading of existing canals, minor realignment), water supply (repairing existing lines,
and some upgrades) and sanitation (construction of basic bathing, washing, toilet facilities and
communal piped wastewater system). There may be new construction of small roads, irrigation
channels, water supply facilities and distribution pipes to improve existing service. New
construction of small roads, irrigation, water and sanitation subprojects is defined based on the
27
criteria specified in the Ministry of Environment Decree no 5/2012 on determining the
appropriate level of environmental assessment required (AMDAL, UKL/UPL or SOP). Based on
this, criteria for new construction to be funded by the Project includes: (i) coverage area up to
2000 ha for irrigation subsectors; (ii) the construction of the new road with the length of less than
5km in the roads subsector; and (iii) up to 100 l/s capacity of water treatment plant system with
transmission lines of up to 10 km and the distribution network for a water supply system serving
to up 500 ha area in the water subsector. It is expected that these trends will largely maintain for
the Additional Financing.
76. Despite the inclusion of new construction within the eligibility framework for both the
original Project and the Additional Financing, experience under the original LGDP operation
suggests that subproject supported under the Project are largely for rehabilitation and
maintenance of existing infrastructure assets. Data for FY 2011 investments shows that of 791
total irrigation sector subprojects, none were for new construction. Similarly, of 523 total road
sector subprojects, only 7 (or 1.34 percent) were for new construction. In the water sector, all
287 subprojects were for minor new construction in already built areas. New construction
supported in the roads and water sector remained small in size – average contract value for new
roads investment was approximately USD100,000 and USD 21,150 for water supply
investments. It is expected that these trends will largely maintain for the Additional Financing.
77. Summary of Key Environmental and Social Issues. Subprojects will be primarily located
in already converted urban, peri-urban or agricultural sites. The road and community water
supply subprojects will be located in peri-urban areas. Irrigation investments are all located on
established farm land area. The potential adverse environmental and social impacts of all types
of subproject investments financed by the LGDP AF are expected to be minor to moderate in
scale, site-specific, reversible and readily managed through application of standard mitigation
measures at the local level.
78. Specifically, the potential adverse environmental impacts for the three types of subproject
investment typologies might include temporary soil disturbance, vegetation removal,
construction phase increase in traffic and noise, increased generation of construction waste
requiring proper transport to a suitable final disposal site and, for irrigation projects, the minor to
moderate risk of an indirect increase in pesticide application.
79. The proposed interventions will not involve the purchase, distribution, use or disposal of
pesticides. And, it is unlikely that the improved irrigation schemes supported under the Project
will lead to significant increases use of pesticides given that, overall in Indonesia, pesticides are
primarily used for horticulture plots in the highlands and not irrigated crops or rice fields. In
addition, the price of the pesticides is high and farmers tend to use bio-pesticides made from
organic local sources, implementing Integrated Pest Management (IPM) approaches for the most
part. Additionally, Indonesia is at the forefront of applying IPM approaches supported by the
government regulations.
80. In terms of social impacts, land acquisition related to subproject investments is expected
to be minor due to the nature of the subproject investments which are primarily focused on
rehabilitation and maintenance of existing structures on converted sites. Indeed, for the few
subprojects financed under the original LGDP that required new small plots of land, they were

28
obtained through well documented voluntary land donation. Based on the supervision record
over the previous two years of project implementation, there was only one case of a road
widening investment where a LG obtained land through cash compensation.
81. Potential Indigenous Peoples (IPs) presence was screened in reference to the World Bank
Study on IPs Screening (2010). Under the original LGDP, Indigenous Peoples (IPs) communities
are potentially present in 34 districts out of 77 participating districts. Currently, based on the
supervision record and BPKP verification record, the original Project has not affected or
involved IPs communities as beneficiaries. In the additional 9 provinces covered under LGDP
AF there is a potential IPs presence in 59 districts of the 182 districts. As the LGDP AF will
likely cover a majority of LGs in 30 provinces by 2017, it is expected that some subproject
investments would take place in villages where Indigenous Peoples are present or where they
have activities.
82. Safeguards Management Approach for Additional Financing. Subprojects financed under
the Additional Financing will be largely of the same nature as those financed by the original
Project. As, as is the case with the original Project, potential adverse environmental and social
impacts will remain minor to moderate, low risk and hence does not warrant a change in the
Category B environmental classification for the Project. Nonetheless, the LGDP Additional
Financing, in expanding the geographical coverage of the program from 5 pilot provinces
(covering eligible 77 LGs) to 30 participating provinces (covering approximately 446 eligible
LGs), significantly increases the Project ‘footprint’ and, as such, alters the risk profile of the
program. The Additional Financing will also raise the threshold for eligible investments thereby
increasing the possibility of greater social and environmental impacts caused by individual
subprojects. Therefore, the Additional Financing triggers two additional Bank safeguard policies:
Natural Habitats (OP/BP 4.04) and Pest Management (OP 4.09).
83. The appraisal of safeguards issues conducted during preparation of the Additional
Financing found that:
the safeguards instrument for the original LGDP operation (STG for Environment and
Social) has successfully been applied to screen, identify and mitigate and manage all of
the social and environmental impacts associated with subproject investments;
the nature of the subproject investments to be supported under the Additional Financing
would likely be largely limited to rehabilitation and maintenance works and minor new
construction and not substantively different from those under the original operation given
that both the original and AF operations are subject to the same subproject eligibility
criteria as outlined in the MPW Technical Guidelines for DAK for basic infrastructure,
consisting of roads, irrigation, water and sanitation.
84. For the purposes of the Additional Financing, the Supplemental Technical Guidelines for
Environmental and Social Safeguards (STG) have been updated to reflect: (i) the increase in
Project scope from 5 to 30 provinces; (ii) triggering of two additional Bank safeguard policies on
Natural Habitats (OP/BP 4.04) and Pest Management (OP 4.09); and (iii) reflect changes in GoI
environmental and social management regulations. This updated STG was finalized by GoI and
received by the Bank on June 22, 2014. This updated STG, accompanied by the ‘parent’ MPW
Technical Guidelines and associated GoI regulations for integrated pest management, includes a

29
framework for screening, identifying and mitigating potential impacts associated with both the
Natural Habitats and Pest Management policies.
85. Disclosure. The STG for Environmental and Social Safeguards was disclosed on the
MPW website (see: www.djpk.depkeu.go.id/berita) on June 24, 2014 and in the Infoshop on June
23, 2014, prior to Appraisal. A final STG issued as a Circular Letter of the Minister of Public
Works to all provinces and local governments participating in the Additional Financing will be
disclosed after Board Approval and prior to Loan Effectiveness. The issuance of the Circular
Letter and STG is stipulated in the Legal Agreement as a Condition of Effectiveness.
86. Consultation. The LGDP AF will finance investments in a total of 30 provinces, with a
gradual rollout to 14 provinces in 2015, 8 more provinces in 2016 for a total 22 provinces in
2016, and once again 8 more provinces in 2017 a total of 30 provinces. Public consultation has
taken place and is ongoing and will continue during project implementation with the gradual roll
out of the project. A public consultation program has been developed and agreed upon with
counter-parts in order to ensure that consultation that has taken place, the ongoing consultation
and the future consultation during project implementation is meaningful, timely and taken into
consideration. The consultation program includes recurring annual consultations, a preliminary
consultation for the Additional Financing and a detailed consultation program on the final draft
STG that is ongoing and will take place prior to the eligibility of new provinces. The public
consultation program is structured as a continuing/ongoing process in order to address
Indonesian counter-parts regulations and procedures using a government decree such as the STG
as the main safeguards instrument while taking into account Bank requirements on public
consultations. It also takes into account the results of the previous ongoing project and the
successive roll out of the eligible provinces during project implementation.
87. Review of STG. The Supplemental Technical Guidelines (Environmental and Social
Safeguards) may be amended from time to time with the prior written agreement of the Bank and
the Borrower. It was agreed with GoI that, by October 31, 2015, the Borrower shall carry out a
review of the application of the Supplemental Technical Guidelines (Environmental and Social
Safeguards) to the Project. Based on the recommendations of such review, the Borrower shall
amend the Supplemental Technical Guidelines (Environmental and Social Safeguards) if so
requested by the Bank, in a manner acceptable to the Borrower and the Bank, and shall ensure
that the Project be carried out in accordance with said reviewed Supplemental Technical
Guidelines (Environmental and Social Safeguards) starting on January 1, 2016. The Bank will
support the Borrower in developing the methodological approach for the review.
88. Safeguards Performance and Capacity Issues. The implementation of Environmental and
Social Safeguards under the original LGDP project has been consistently rated as Moderately
Satisfactory under the original LGDP operation. Areas for improvement include: (i) ensuring
enhanced and adequate documentation for voluntary land donation (VLD); (ii) enhancing the
quality and detail of LG and BPKP reporting of the safeguards implementation; and (iii)
strengthening the overall capacity of BPKP to conduct social and environmental safeguards
verification, particularly at the regional level; and (iv) strengthening of the overall awareness and
skills of LG staff on social and environmental safeguards management. MPW along with MOF
are continuously improving the awareness and increasing the capacity of the Local Governments

30
to apply the STG for Safeguards through the socialization process. Central BPKP has
continuously socialized the verification checklist to the regional BPKPs annually. Additionally,
the Additional Financing includes enhanced technical assistance to BPKP and LG on social and
environmental safeguards verification and management.
89. Further details on the environmental and social safeguards issues and management
approach for the Additional Financing can be found in the publically disclosed Appraisal Stage
ISDS.
90. Assessment of the Institutional Support Component. As part of preparation for this
Additional Financing, the Bank conducted an assessment of the Institutional Support component
of the LGDP Program. The assessment found that, while performance has gradually improved
since the initiation of the program in 2011, overall outcomes for the component have been below
expectations. A range of factors are associated with this poor performance. First, MoF – as the
head of the PIU and the contracting agent – lacked the technical capacity to adequately structure,
bid and manage contracts for technical areas as wide ranging as social and environmental
safeguards, procurement, M&E and other areas. Second, the lack of a multi-year budgeting
framework has constrained the ability of MoF to adequately commit funds within a given FY.
Budget resources are only made available to executing units by March of a given FY and
activities have to be then procured and executed by December of the same year. Third, the Bank
also failed to provide more ‘hands-on’ assistance on the structuring and operationalizing TA
under the program.
91. The component has not been fully funded by MoF. To date, MoF has allocated USD
2.4m to the component against an overall commitment of USD 8.5m by the end of 2014. MoF
has allocated an additional USD 1.0m in financing for the component in the 2014 budget. This
funding gap is a function of multiple factors. First, MoF poor budget utilization on early years of
LGDP constrained the ability of the PIU to request larger allocations in subsequent years as
execution improved. For example, in 2011, the PIU received a full allocation of USD 1.7m but
was only able to execute under half of the same. In subsequent years, the PIU was unable to
justify larger allocations. Additionally, in 2013, overall MoF budget cuts impacted funding
levels.
92. Despite these factors the component has had areas of improved and strong performance.
The PIU has successfully mobilized technical assistance to LGs for the implementation of the
Web-Based Reporting System (WBRS). Since its launch in March 2012, PIU-support technical
assistance has enabled 60% of LGDP participating districts to submit technical and financial
reports through WBRS. The component has also successfully supported technical assistance on
procurement. The PIU worked together with the central government procurement agency (LKPP)
on delivering procurement training the LGs focusing on the establishment of Local Procurement
Units (ULPs) and on the use of e-procurement systems. Increasingly the identification of TA
activities supported under the program is being driven be evidence and LG performance
information emerging from the verification process.
93. Going forward, the Bank and MoF have been actively engaged in developing the
Institutional Support component for the LGDP AF with multiple enhancements. First, the
restructured component more clearly differentiates between major lines of activities, clarifying
31
responsibilities across agencies. Second, the program has been developed with detailed scope of
works for all major proposed activities. Third, there is a clearer focus on field-based delivery of
TA, i.e. being closer to the client. Fourth, the program is more directly linked to evidence on
performance so that TA activities can be better targeted where needed. Fifth, new regulations
allow for multi-year contracts for firms – a key hurdle in executing large TA programs over a
broad geographic footprint. Sixth, the Bank and MoF have designed an M&E framework for the
program that is ready-for-implementation.
94. Ensuring for full financing of the program remains a challenge. MoF has requested
support from the Australian Indonesia Partnership for Decentralization (AIPD) to finance
component two of the LGDP Additional Financing. The Bank team will closely monitor
compliance with financing commitments under the program.
95. Governance and Anti-Corruption. The proposed additional financing of LGDP will
continue to use the Web-Based Reporting System, which will be expanded in terms of use and
coverage to wider function and areas as the participating entities also increased. This will help to
improve the management of DAK through better reporting and enable the project to be
monitored in timely manner, more accurate, and accessible by the relevant parties/stakeholders.
96. Further improvement to the WBRS will be explored, based on the evaluation conducted
during the first phase of the program, which particularly will be focusing on the system operation
and application. Improved efficiency of the institutional arrangement to manage the system,
which to be made in-line with the overall DAK management and oversight arrangement in
Indonesia, and the formulation of a supporting national policy to strengthen the function of the
system are the two areas that intended to be achieved during the period of the proposed
additional financing of LGDP.
97. Summary and Assessment of the Verification System. BPKP, as the independent
verification agent, annually conducts field-based output verification. At the beginning of each
GoI fiscal year, the PIU with technical inputs from MPW is responsible for updating the
Reference Unit Costs (RUCs) to BPKP as a key input to the output verification process. Agreed
RUCs in the beginning of each fiscal year constitute a core feature of the Project as BPKP uses
the RUCs to determine the eligibility of subproject investments and subsequently to calculate the
value of potential reimbursement. Along with RUCs, BPKP applies as part of the verification
process a series of additional requirements that have to be met by the LGs in the first screening
stage for verifiable outputs, which include: (i) procurement thresholds as mentioned in the Loan
Agreement; (ii) contracts must utilize a competitive bidding process; (iii) outputs must be
produced by December 31 of the said fiscal year as evidenced by a certification of completion;
and (iv) the availability of matching funds of at least 10 % of total DAK contract values.
98. Following the first screening, BPKP will have a population of verifiable outputs and will
then take a minimum of 20% sample of contracts from each LG to be further verified. The
second stage of verification assesses compliance with a verification check list, agreed between
the World Bank and BPKP. The verification check list includes requirements on compliance with
government procurement regulations, financial management, safeguards policies in the MPW
Supplemental Technical Guidelines, and technical (quantitative and qualitative) requirements as
stipulated in the MPW Technical Guidelines. In conducting the technical verification in the field,
32
BPKP team is accompanied by technical experts from the Inspectorate General (IG) of MPW.
After the second screening, BPKP determine the value of qualifying reimbursement (VQR) for
each LG and the value of total reimbursement as a sum of the VQR across all LGs. As an
incentive for the LGs, 10 % of the VQR will be transferred from the MoF to LGs. As part of the
verification process, the BPKP is also responsible for providing feedback to LGs on their
implementation of DAK funds in the form of a management letter. Additionally, BPKP provides
a qualitative report to MoF to inform the design for the institutional capacity building
component. The verification results from BPKP serves as the sole basis for the World Bank
reimbursement to the MoF.
99. An assessment of the output verification system was conducted as a part of Project
preparation. The output verification system is managed by BPKP which, as per the terms of the
Verification Agreement, is responsible for verifying the timeliness and accuracy of the financial
and technical reports submitted, respectively, to MoF and MPW by LGs to ensure that outputs
have been achieved in compliance with the Technical Guidelines and the Supplemental
Technical Guidelines (Environmental and Social Safeguards).
100. At the initiation of the original LGDP operation, BPKP did not have prior experience as a
verification agent for a broad Government infrastructure program such as DAK. BPKP has
conducted output verification now for fiscal year 2011, 2012, and 2013 outputs.. The quality of
the verification process and system managed by BPKP has consistently improved over this
period. In the first fiscal year, while generally comfortable with fiduciary aspects of the
verification, BPKP struggled with the technical verification of outputs. The lack of adequate
coordination with MPW was also a constraint as it was intended for the Ministry to provide
support on technical verification. Nonetheless, in the ensuing year, BPKP both deepened its
collaboration and with MPW Inspectorate General Office and invested in the technical capacity
building of its field verification agents in the areas of internal control, civil work, environment
and social safeguards. The quality of the verification results and reports were much improved in
2012 and 2013. BPKP has successfully carried out the verification to the 75 participating LGs of
the original project, including the ones that located in the remote areas in eastern part of
Indonesia, within a relatively limited of time. BPKP has also taken on the role of providing
qualitative feedback to LGs in the form of a Management Letter that provides guidance to LGs
on how to improve performance.
101. There remains room for improvement. BPKP and the Bank have discussed the need going
forward to:
Ensure appropriate time and budget allocation for field verification agents to conduct a
full verification assessment;
Intensify the training in technical, FM, procurement, and safeguards to all BPKP staff
engaged in the program;
Improve coordination between BPKP and IG MPW to conduct technical, environment and
social training and verification as part of output verification of DAK implementation
Revise the verification checklist to better reflect the impact of the project outputs;
Improve record keeping of procurement documents and also enhance the level of detail in
checking by BPKP of the procurement process carried out by the LGs so as to be able to
effectively verify the level of compliance with the required procurement procedures under

33
the applicable competitive methods of procurement under the Perpres 54/2010 and its
revisions.
102. A revised Verification Arrangement incorporating these recommendations and other has
been prepared and will be signed in parallel to the processing of this Additional Financing.
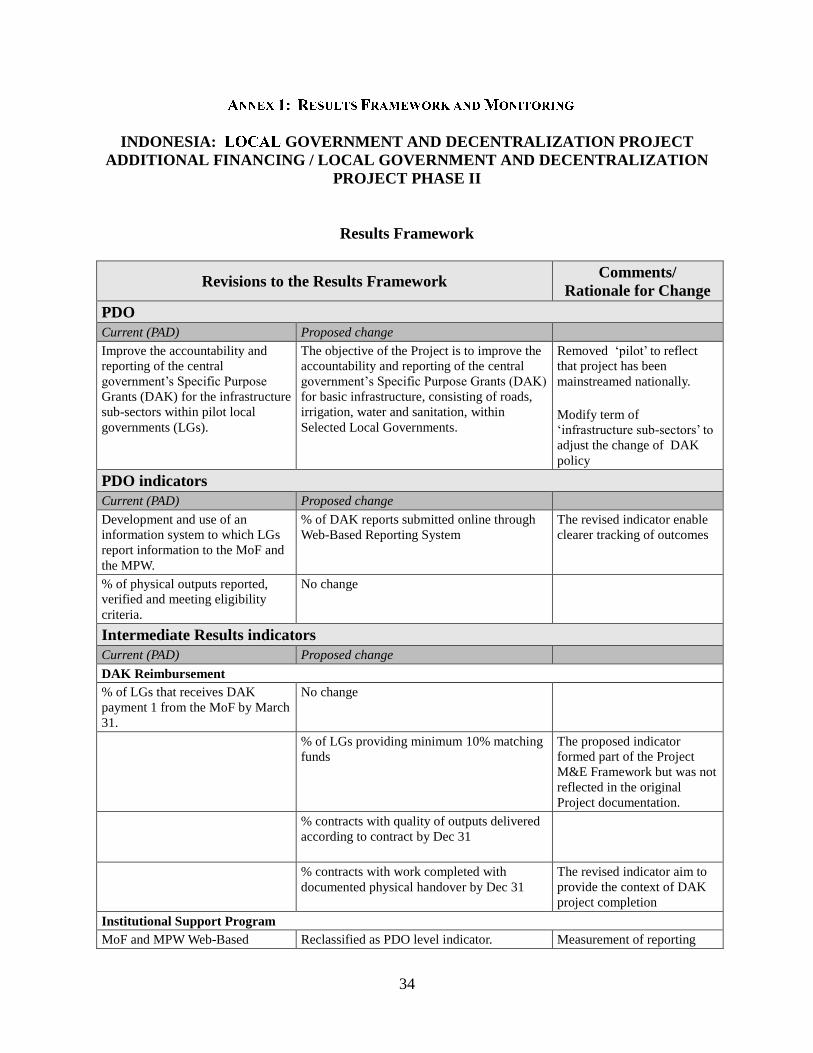
34
INDONESIA: GOVERNMENT AND DECENTRALIZATION PROJECT
ADDITIONAL FINANCING / LOCAL GOVERNMENT AND DECENTRALIZATION
PROJECT PHASE II
Results Framework
Revisions to the Results Framework Comments/
Rationale for Change
PDO
Current (PAD) Proposed change
Improve the accountability and
reporting of the central
government’s Specific Purpose
Grants (DAK) for the infrastructure
sub-sectors within pilot local
governments (LGs).
The objective of the Project is to improve the
accountability and reporting of the central
government’s Specific Purpose Grants (DAK)
for basic infrastructure, consisting of roads,
irrigation, water and sanitation, within
Selected Local Governments.
Removed ‘pilot’ to reflect
that project has been
mainstreamed nationally.
Modify term of
‘infrastructure sub-sectors’ to
adjust the change of DAK
policy
PDO indicators
Current (PAD) Proposed change
Development and use of an
information system to which LGs
report information to the MoF and
the MPW.
% of DAK reports submitted online through
Web-Based Reporting System
The revised indicator enable
clearer tracking of outcomes
% of physical outputs reported,
verified and meeting eligibility
criteria.
No change
Intermediate Results indicators
Current (PAD) Proposed change
DAK Reimbursement
% of LGs that receives DAK
payment 1 from the MoF by March
31.
No change
% of LGs providing minimum 10% matching
funds
The proposed indicator
formed part of the Project
M&E Framework but was not
reflected in the original
Project documentation.
% contracts with quality of outputs delivered
according to contract by Dec 31
% contracts with work completed with
documented physical handover by Dec 31
The revised indicator aim to
provide the context of DAK
project completion
Institutional Support Program
MoF and MPW Web-Based Reclassified as PDO level indicator. Measurement of reporting
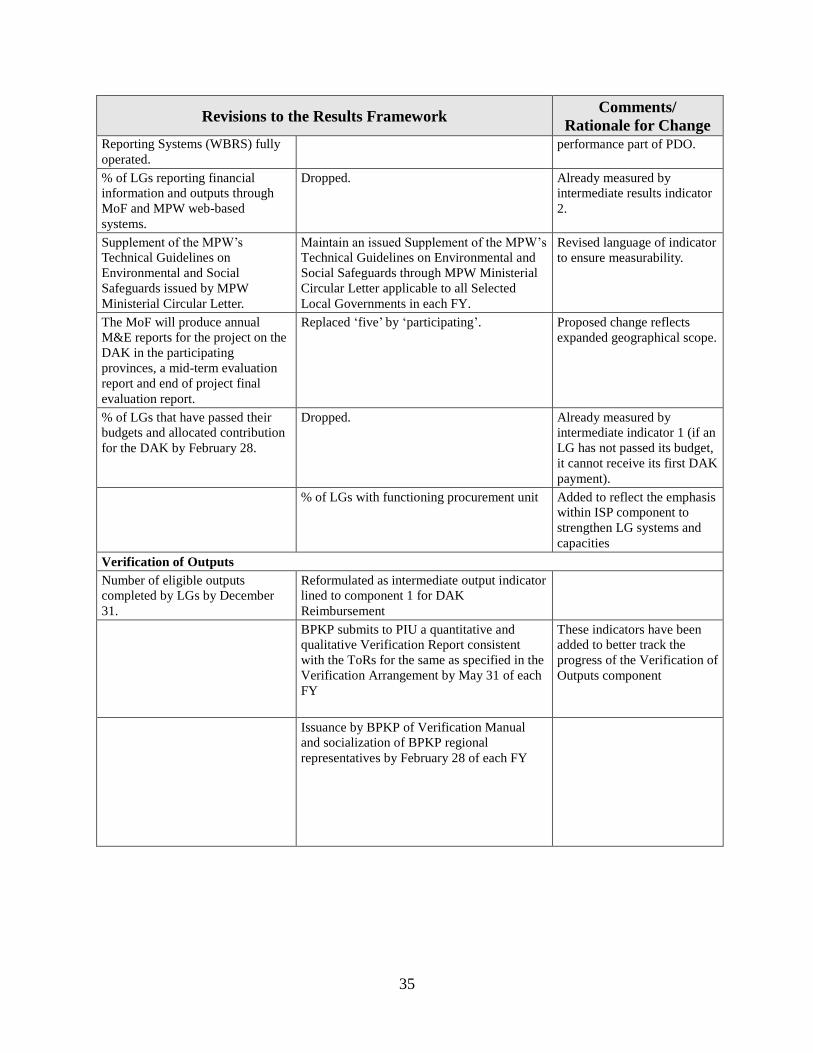
35
Revisions to the Results Framework Comments/
Rationale for Change Reporting Systems (WBRS) fully
operated.
performance part of PDO.
% of LGs reporting financial
information and outputs through
MoF and MPW web-based
systems.
Dropped. Already measured by
intermediate results indicator
2.
Supplement of the MPW’s
Technical Guidelines on
Environmental and Social
Safeguards issued by MPW
Ministerial Circular Letter.
Maintain an issued Supplement of the MPW’s
Technical Guidelines on Environmental and
Social Safeguards through MPW Ministerial
Circular Letter applicable to all Selected
Local Governments in each FY.
Revised language of indicator
to ensure measurability.
The MoF will produce annual
M&E reports for the project on the
DAK in the participating
provinces, a mid-term evaluation
report and end of project final
evaluation report.
Replaced ‘five’ by ‘participating’. Proposed change reflects
expanded geographical scope.
% of LGs that have passed their
budgets and allocated contribution
for the DAK by February 28.
Dropped. Already measured by
intermediate indicator 1 (if an
LG has not passed its budget,
it cannot receive its first DAK
payment).
% of LGs with functioning procurement unit Added to reflect the emphasis
within ISP component to
strengthen LG systems and
capacities
Verification of Outputs
Number of eligible outputs
completed by LGs by December
31.
Reformulated as intermediate output indicator
lined to component 1 for DAK
Reimbursement
BPKP submits to PIU a quantitative and
qualitative Verification Report consistent
with the ToRs for the same as specified in the
Verification Arrangement by May 31 of each
FY
These indicators have been
added to better track the
progress of the Verification of
Outputs component
Issuance by BPKP of Verification Manual
and socialization of BPKP regional
representatives by February 28 of each FY
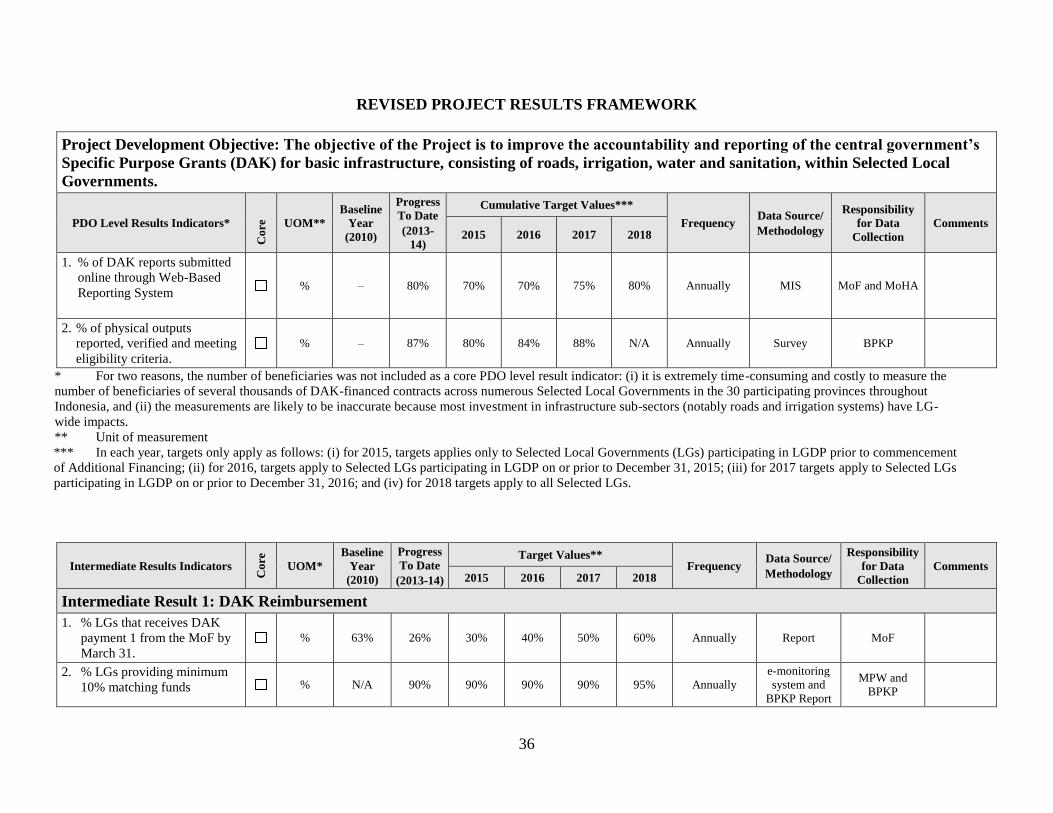
36
REVISED PROJECT RESULTS FRAMEWORK
Project Development Objective: The objective of the Project is to improve the accountability and reporting of the central government’s
Specific Purpose Grants (DAK) for basic infrastructure, consisting of roads, irrigation, water and sanitation, within Selected Local
Governments.
PDO Level Results Indicators*
Co
re
UOM**
Baseline
Year
(2010)
Progress
To Date
(2013-
14)
Cumulative Target Values***
Frequency Data Source/
Methodology
Responsibility
for Data
Collection
Comments 2015 2016 2017 2018
1. % of DAK reports submitted
online through Web-Based
Reporting System
% – 80% 70% 70% 75% 80% Annually MIS MoF and MoHA
2. % of physical outputs
reported, verified and meeting
eligibility criteria.
% – 87% 80% 84% 88% N/A Annually Survey BPKP
* For two reasons, the number of beneficiaries was not included as a core PDO level result indicator: (i) it is extremely time-consuming and costly to measure the
number of beneficiaries of several thousands of DAK-financed contracts across numerous Selected Local Governments in the 30 participating provinces throughout
Indonesia, and (ii) the measurements are likely to be inaccurate because most investment in infrastructure sub-sectors (notably roads and irrigation systems) have LG-
wide impacts.
** Unit of measurement
*** In each year, targets only apply as follows: (i) for 2015, targets applies only to Selected Local Governments (LGs) participating in LGDP prior to commencement
of Additional Financing; (ii) for 2016, targets apply to Selected LGs participating in LGDP on or prior to December 31, 2015; (iii) for 2017 targets apply to Selected LGs
participating in LGDP on or prior to December 31, 2016; and (iv) for 2018 targets apply to all Selected LGs.
Intermediate Results Indicators
Co
re
UOM*
Baseline
Year
(2010)
Progress
To Date
(2013-14)
Target Values** Frequency
Data Source/
Methodology
Responsibility
for Data
Collection
Comments 2015 2016 2017 2018
Intermediate Result 1: DAK Reimbursement
1. % LGs that receives DAK
payment 1 from the MoF by
March 31.
% 63% 26% 30% 40% 50% 60% Annually Report MoF
2. % LGs providing minimum
10% matching funds % N/A 90% 90% 90% 90% 95% Annually
e-monitoring
system and
BPKP Report
MPW and
BPKP
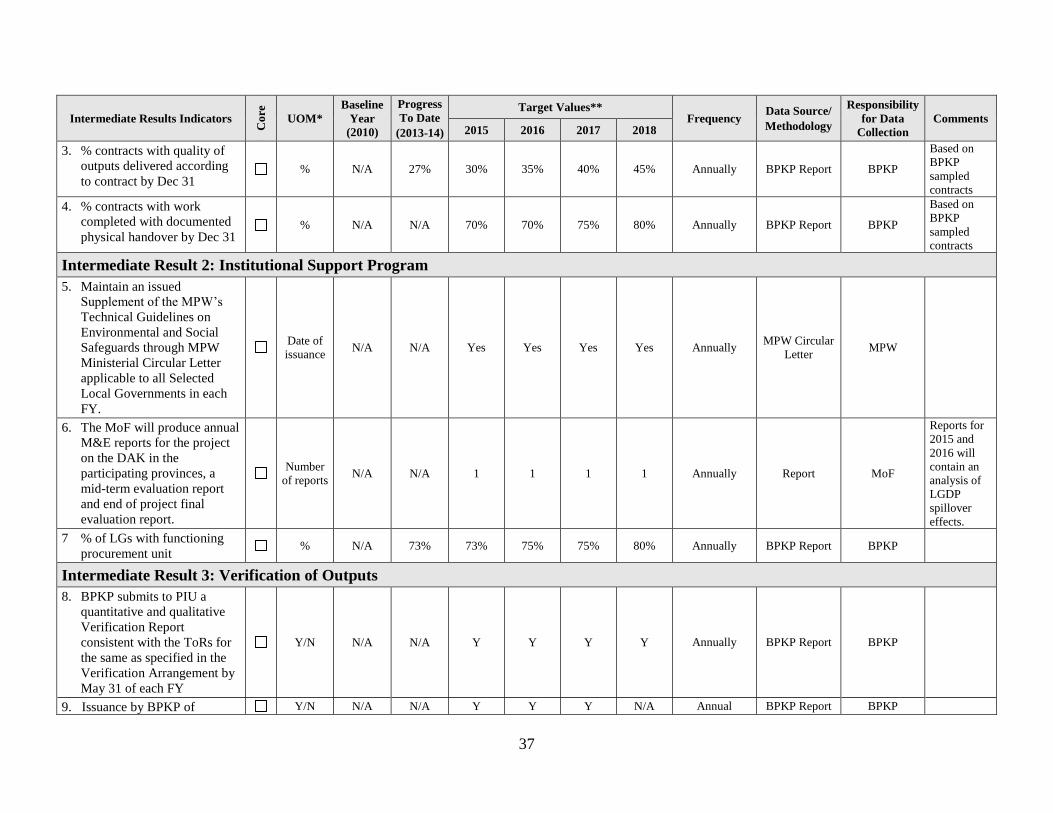
37
Intermediate Results Indicators
Co
re
UOM*
Baseline
Year
(2010)
Progress
To Date
(2013-14)
Target Values** Frequency
Data Source/
Methodology
Responsibility
for Data
Collection
Comments 2015 2016 2017 2018
3. % contracts with quality of
outputs delivered according
to contract by Dec 31 % N/A 27% 30% 35% 40% 45% Annually BPKP Report BPKP
Based on
BPKP
sampled
contracts
4. % contracts with work
completed with documented
physical handover by Dec 31 % N/A N/A 70% 70% 75% 80% Annually BPKP Report BPKP
Based on
BPKP
sampled
contracts
Intermediate Result 2: Institutional Support Program
5. Maintain an issued
Supplement of the MPW’s
Technical Guidelines on
Environmental and Social
Safeguards through MPW
Ministerial Circular Letter
applicable to all Selected
Local Governments in each
FY.
Date of
issuance N/A N/A Yes Yes Yes Yes Annually
MPW Circular
Letter MPW
6. The MoF will produce annual
M&E reports for the project
on the DAK in the
participating provinces, a
mid-term evaluation report
and end of project final
evaluation report.
Number
of reports N/A N/A 1 1 1 1 Annually Report MoF
Reports for
2015 and
2016 will
contain an
analysis of
LGDP
spillover
effects.
7 % of LGs with functioning
procurement unit % N/A 73% 73% 75% 75% 80% Annually BPKP Report BPKP
Intermediate Result 3: Verification of Outputs
8. BPKP submits to PIU a
quantitative and qualitative
Verification Report
consistent with the ToRs for
the same as specified in the
Verification Arrangement by
May 31 of each FY
Y/N N/A N/A Y Y Y Y Annually BPKP Report BPKP
9. Issuance by BPKP of Y/N N/A N/A Y Y Y N/A Annual BPKP Report BPKP

38
Intermediate Results Indicators
Co
re
UOM*
Baseline
Year
(2010)
Progress
To Date
(2013-14)
Target Values** Frequency
Data Source/
Methodology
Responsibility
for Data
Collection
Comments 2015 2016 2017 2018
Verification Manual and
socialization of BPKP
regional representatives by
February 28 of each FY
* Unit of measurement
** For intermediate indicators 1-4 and 7, in each year, targets only apply as follows: (i) for 2015, targets applies only to Selected Local Governments (LGs)
participating in LGDP prior to commencement of Additional Financing; (ii) for 2016, targets apply to Selected LGs participating in LGDP on or prior to December 31,
2015; (iii) for 2017 targets apply to Selected LGs participating in LGDP on or prior to December 31, 2016; and (iv) for 2018 targets apply to all Selected LGs.
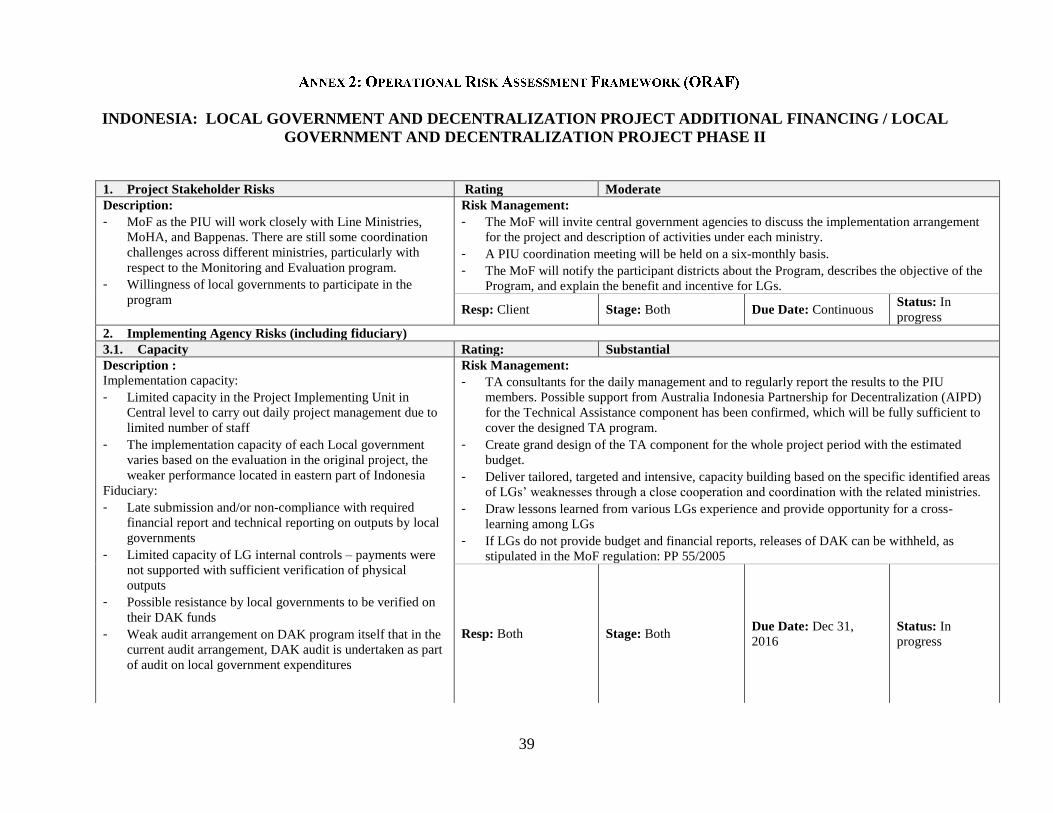
39
1. Project Stakeholder Risks Rating Moderate
Description:
- MoF as the PIU will work closely with Line Ministries,
MoHA, and Bappenas. There are still some coordination
challenges across different ministries, particularly with
respect to the Monitoring and Evaluation program.
- Willingness of local governments to participate in the
program
Risk Management:
- The MoF will invite central government agencies to discuss the implementation arrangement
for the project and description of activities under each ministry.
- A PIU coordination meeting will be held on a six-monthly basis.
- The MoF will notify the participant districts about the Program, describes the objective of the
Program, and explain the benefit and incentive for LGs.
Resp: Client Stage: Both Due Date: Continuous Status: In
progress
2. Implementing Agency Risks (including fiduciary)
3.1. Capacity Rating: Substantial
Description : Implementation capacity:
- Limited capacity in the Project Implementing Unit in
Central level to carry out daily project management due to
limited number of staff
- The implementation capacity of each Local government
varies based on the evaluation in the original project, the
weaker performance located in eastern part of Indonesia
Fiduciary:
- Late submission and/or non-compliance with required
financial report and technical reporting on outputs by local
governments
- Limited capacity of LG internal controls – payments were
not supported with sufficient verification of physical
outputs
- Possible resistance by local governments to be verified on
their DAK funds
- Weak audit arrangement on DAK program itself that in the
current audit arrangement, DAK audit is undertaken as part
of audit on local government expenditures
Risk Management:
- TA consultants for the daily management and to regularly report the results to the PIU
members. Possible support from Australia Indonesia Partnership for Decentralization (AIPD)
for the Technical Assistance component has been confirmed, which will be fully sufficient to
cover the designed TA program.
- Create grand design of the TA component for the whole project period with the estimated
budget.
- Deliver tailored, targeted and intensive, capacity building based on the specific identified areas
of LGs’ weaknesses through a close cooperation and coordination with the related ministries.
- Draw lessons learned from various LGs experience and provide opportunity for a cross-
learning among LGs
- If LGs do not provide budget and financial reports, releases of DAK can be withheld, as
stipulated in the MoF regulation: PP 55/2005
Resp: Both Stage: Both Due Date: Dec 31,
2016
Status: In
progress
INDONESIA: LOCAL GOVERNMENT AND DECENTRALIZATION PROJECT ADDITIONAL FINANCING / LOCAL
GOVERNMENT AND DECENTRALIZATION PROJECT PHASE II

40
3.2. Governance Rating: Moderate
Description: Coordination within the PIU that involve many
different stakeholders without the provision of unified
secretariat will create risk for the information sharing and
decision making.
Risk Management: A regular coordination meeting is to be held at least by quarterly basis.
Resp: Client Stage: Implementation Due Date: Continuous Status: In
progress
Risk Management: Support the improvement of the bidding process through close oversight and
capacity building in bid preparation to the implementing agency.
Resp: Both Stage: Implementation Due Date: Continuous Status: In
progress
4. Project Risks
4.1. Design Rating: Low
Description:
- Due to high variance of DAK outputs and its yearly
dynamic budget allocation, the RUC may not always
matches the actual output in the field, which usually
planned one year before the verification of outputs
- Use of WBRS in new LG participants will require intensive
capacity building and hands-on training from the PIU. The
PIU has developed an offline system to accommodate
Provinces with limited internet connection. This offline
system still requires socialization and dissemination to the
LGs.
- Increased number of participating area will affect the scope
of work for verification by BPKP. The BPKP may face
some challenges in resources to roll out the overall
verification.
- Possible DAK reform towards performance-based DAK,
multi-year DAK, and support the achievement of minimum
service standards, following the revision of Law 33/2004.
Through the reform, there will be a possibility of having
changes in DAK expenditure, which might affect the
project design.
Risk Management:
- Schedule yearly review to the RUC by involving related sectors in Ministry of Public Works
as early as possible
- The formulation of offline WBRS version during the first phase of the project will help to
overcome the challenges in the eastern part of Indonesia.
- Technical assistance to support the capacity strengthening of BPKP has been included in the
TA design. Initial discussion with the budget division in the Ministry of Finance has been
conducted to ensure sufficient budget allocation.
- Conduct assessments and analysis on the possibility of DAK reform and its impact for the project design, and
have discussions with the related stakeholders, including MoF, MoHA, and Bappenas.
Resp: Both Stage: Both Due Date: Continuous Status: In
progress
4.2. Social & Environmental Rating: Moderate
Description:
- Local governments may have limited knowledge and
understanding of the environmental and social safeguards
requirements specified in the supplement of MPW
Technical Guidelines; expansion of the project coverage
from 5 to 14 in 2015 and 30 provinces in will result in an
Risk Management: The PIU together with the line ministries will deliver targeted capacity
building efforts every year in each participating Province to raise awareness and understanding of
the LGDP design and the safeguard instrument for the project – the Supplemental Technical
Guidelines. Awareness and clear understanding of the requirements of the Technical Guidelines
will be continued every year in the Additional Financing and start prior to program
implementation.
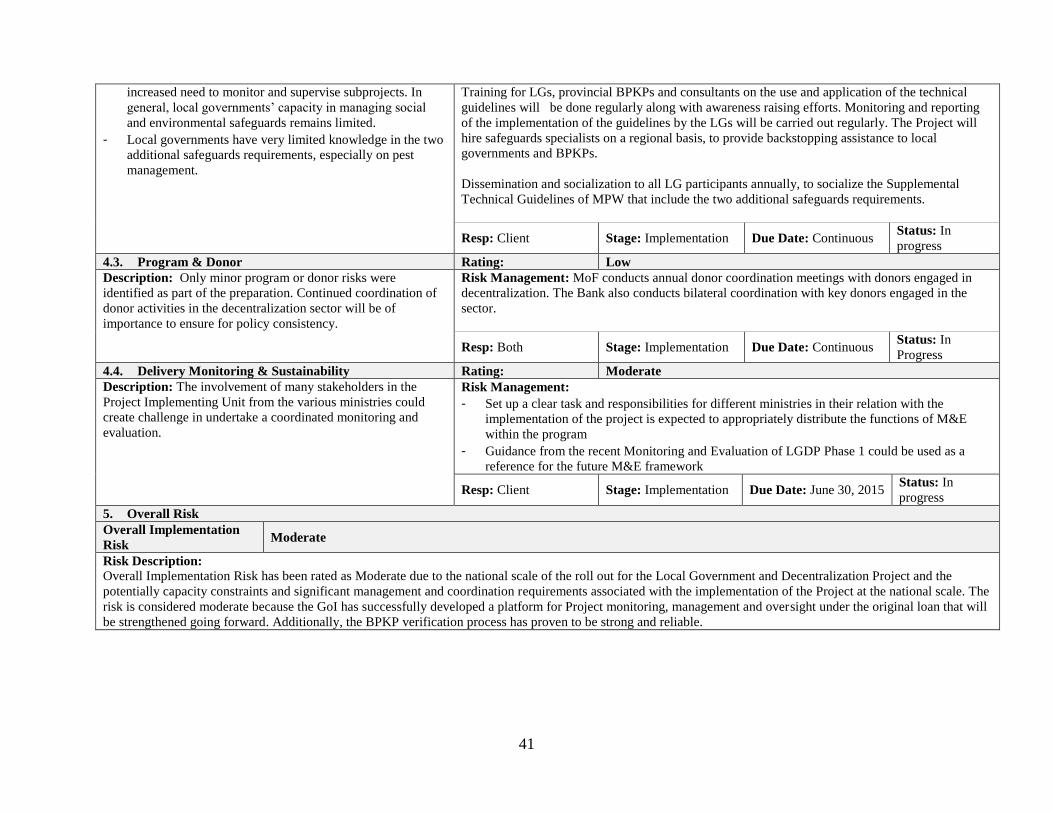
41
increased need to monitor and supervise subprojects. In
general, local governments’ capacity in managing social
and environmental safeguards remains limited.
- Local governments have very limited knowledge in the two
additional safeguards requirements, especially on pest
management.
Training for LGs, provincial BPKPs and consultants on the use and application of the technical
guidelines will be done regularly along with awareness raising efforts. Monitoring and reporting
of the implementation of the guidelines by the LGs will be carried out regularly. The Project will
hire safeguards specialists on a regional basis, to provide backstopping assistance to local
governments and BPKPs.
Dissemination and socialization to all LG participants annually, to socialize the Supplemental
Technical Guidelines of MPW that include the two additional safeguards requirements.
Resp: Client Stage: Implementation Due Date: Continuous Status: In
progress
4.3. Program & Donor Rating: Low
Description: Only minor program or donor risks were
identified as part of the preparation. Continued coordination of
donor activities in the decentralization sector will be of
importance to ensure for policy consistency.
Risk Management: MoF conducts annual donor coordination meetings with donors engaged in
decentralization. The Bank also conducts bilateral coordination with key donors engaged in the
sector.
Resp: Both Stage: Implementation Due Date: Continuous Status: In
Progress
4.4. Delivery Monitoring & Sustainability Rating: Moderate
Description: The involvement of many stakeholders in the
Project Implementing Unit from the various ministries could
create challenge in undertake a coordinated monitoring and
evaluation.
Risk Management:
- Set up a clear task and responsibilities for different ministries in their relation with the
implementation of the project is expected to appropriately distribute the functions of M&E
within the program
- Guidance from the recent Monitoring and Evaluation of LGDP Phase 1 could be used as a
reference for the future M&E framework
Resp: Client Stage: Implementation Due Date: June 30, 2015 Status: In
progress
5. Overall Risk
Overall Implementation
Risk Moderate
Risk Description:
Overall Implementation Risk has been rated as Moderate due to the national scale of the roll out for the Local Government and Decentralization Project and the
potentially capacity constraints and significant management and coordination requirements associated with the implementation of the Project at the national scale. The
risk is considered moderate because the GoI has successfully developed a platform for Project monitoring, management and oversight under the original loan that will
be strengthened going forward. Additionally, the BPKP verification process has proven to be strong and reliable.
42
1. The Local Government and Decentralization Project (LGDP) Additional Financing is part
of a broader Bank strategy on intergovernmental transfers and the strengthening of subnational
fiscal performance. As part of this strategy, the World Bank is currently engaging with Bappenas
on the reform agenda for intergovernmental transfers as part of the Five Year Plan, 2015-2019
(RPJM) currently under formulation. This dialogue builds on lessons from LGDP
implementation and from a broad program of policy analysis conducted in collaboration with
MoF with support from the Bank and other multilateral and bilateral donors active in Indonesia.
2. The World Bank’s policy guidance to the RPJM process centers around four main
questions: (i) whether GoI should increase funding for intergovernmental transfers; (ii) how can
transfers be reformed in the short term; (ii) what actions or reforms are required in the medium-
term to reform transfers; and (ii) what additional reforms might the central government consider
to improve outcomes. The Bank’s policy guidance on these issues is summarized below.
Should central government increase funding for intergovernmental transfers now?
3. The Bank team has emphasized three broad principles with respect to funding levels for
intergovernmental transfers.
Do not increase funding for DAU. Currently, increases in DAU at the margin are mostly
used to increase spending on local government staff salaries and allowances. An
additional rupiah of DAU increases personnel spending by 0.86 rupiah. Local
government personnel expenditure - 50 % of budgets on average - is already too high.
Additional increases in the DAU are unnecessary and would likely have a negative
impact on service delivery.
Increase funding for DAK. Increases in DAK funding are highly stimulative of local
government capital spending. An extra rupiah of DAK increases capital spending by
more than 1.5 rupiah. Additional capital spending by local governments results in larger
stocks of important local public capital assets in the health, education, and infrastructure
sectors. Increased stocks of public assets are, in turn, strongly associated with
improvements in service delivery.
Increase funding for Hibah (General Central-Subnational Grant Mechanism). Recent
experience with the Hibah suggests that it can be favorably adapted for use in improving
local government service delivery. The Water Hibah pilot project organized and funded
by AusAID, shows that increases in grant allocations result in increased local government
equity investments in PDAM which in turn help to expand the number of household
water connections, especially for vulnerable groups. Government might consider using its
own funds to roll out the Water Hibah initiative.
43
How should central government reform intergovernmental transfers in the short-term?
4. Presuming no changes in the structural laws governing decentralization and
intergovernmental transfers, the Bank has recommended:
DAU policy reform might focus on a number of issues in the allocation formula:
eliminating perverse incentives regarding personnel spending and own-source revenue
mobilization, more accurately estimating expenditure needs, and improving equalization
performance.
Eliminate basic allocation. The basic allocation in the DAU distribution formula provides
an incentive for local governments to increase spending on personnel. Local government
spending on staff salaries and allowances already comprises nearly 50 % of total local
spending and is arguably too large. Removing the basic allocation (or pushing its weight
in the formula close to zero) might help put downward pressure on personnel expenditure
at the local government level.
Remove own-source revenues. The inclusion of own-source revenues in the estimation of
fiscal capacity in the DAU allocation formula may provide at least somewhat of a
disincentive for local governments to mobilize revenues from own-sources. Removing
own-source revenues from the calculation (or pushing its weight close to zero) may
reverse that disincentive, something that would be especially useful as districts assume
full control over the local property tax next year.
Cluster local governments. The DAU formula treats all local governments similarly. This
one-size fits all approach causes difficulties in the proper estimation of fiscal needs.
Disaggregating local governments into smaller, more comparable groups (kota and
kabupaten, e.g.; or, more ambitiously: large cities, medium/small cities, suburban places,
natural resource rich districts, and remote regions, etc.) would provide a basis for a more
accurate estimation of fiscal needs.
Increase shared revenues coefficients. Occasionally only a portion of shared tax and/or
shared natural resource revenues has been used to estimate local government fiscal
capacity in the DAU formula. This aspect of the formula provides a significant benefit to
districts with high personal income and oil and gas producing regions, especially, but it
also constrains fiscal equalization across places. Using 100 % of all shared revenues in
the calculation would improve the equalization performance of the grant.
5. Additionally, DAK policy reform might focus on issues related to sectoral coverage,
geographic coverage, type of spending support, and multi-year implementation.
Reduce sectoral coverage. The number of sectors covered by the DAK has expanded
from 3 in 2001 to 19 in 2013. New sectors’ distributions have increased from just 5 to 25
% of total allocations; at the same time traditional infrastructure’s share has declined
from 50 % to 25 %. Many of the new sectors could be eliminated without negative
44
impact and funds could be reallocated to infrastructure, especially, and health and
education sectors.
Reduce geographic coverage. The original intent of the DAK was to maximize impact of
the grant by focusing distributions on relatively few local governments. Indeed initially
allocations were made to only a small subset of local governments. Now all local
governments receive at least some DAK. This feature of grant allocation reduces the size
of DAK distributions to individual districts and weakens impact. Government should
focus the DAK on priority regions.
Allow maintenance spending. Local governments spend too little on maintaining assets
under their control. DAK allocations are negatively associated with maintenance
spending. Each additional rupiah of DAK leads to a decrease in maintenance and other
non-personnel current spending of more than 0.5 rupiah8. Allowing DAK to be used to
fund routine maintenance of public capital assets in a more comprehensive fashion might
help to reverse the trends.
Allow multi-year project implementation. Although districts are permitted to roll over
unused DAK into the following fiscal year to be used for ‘similar purposes’ they must
still re-tender any associated contracts. Retendering projects creates significant time
delays and economic inefficiencies. Allowing local governments to roll over funds and
contracts from one fiscal year to the next would support the development of larger
investments and eliminate inefficiencies.
Allow some spending flexibility. Policies that do not allow for flexibility lead to the
ineffective use of funds, and as such require revision in order to provide room for local
government on specific variations based on needs, while still retaining some level of
national uniformity and the objective to achieve minimum service standard.
6. Other transfer policy reform would focus on expunging problems associated with
Dekon/Tugas Pembantuan (Direct Central Government Spending in Regions) and Dana
Penyesuaian (Adjustment Funds Granted to Regions). Both Dekon/Tugas Pembantuan funds
come from the APBN/National Budget, but they are not part of the intergovernmental transfer.
Dekon/Tugas Pembantuan funds are sourced from ministerial/institutional funds handed out to
governors as representatives of the central government in the regions.
Eliminate Dekon/Tugas Pembantuan. Dekon/Tugas Pembantuan and related direct
central government spending on decentralized functions confuses lines of service
responsibility, constrains horizontal accountability, and weakens the rule of law. Such
spending may also crowd out local capital spending. Evidence shows that an additional
rupiah of Dekon/Tugas Pembantuan results in a decline in local government capital
8 See Lewis, B., (2013).”DAK Reimbursement Project (P2D2) Impact Analysis: District Counterpart Funding,
Reporting, and Capital Spending”. World Bank, Jakarta; and, Lewis, B., (2013).”Notes on Propensity Score
Matching for DAK Impact Evaluation”. World Bank, Jakarta.
45
spending of 0.50 rupiah. Government could re-channel all central funds used for
decentralized activities into DAK and/or Hibah.
Eliminate Dana Penyesuaian for Infrastructure. Dana Penyesuaian, for infrastructure,
constitutes a parliament-driven pork barrel transfer. The international experience with
such pork barrel transfers is uniformly bad. Such transfers are usually allocated as a
means of vote buying and/or for personal gain and these distribution methods divert
attention away from primary transfer objectives. Internationally, such transfers are also
strongly associated with corruption. They should be permanently discontinued and the
funds transferred to DAK and/or Hibah.
How should central government reform intergovernmental transfers beyond the short-
term (past 3 years with possible change in law)?
7. Beyond the short-term, central government needs to re-think and clarify the objectives of
the transfer system and re-design the various mechanisms at its disposal to obtain stated
objectives.
Reconsider and clarify transfer objectives. Central government might reasonably focus
the intergovernmental transfer system on just three basic objectives: enhancing fiscal
equalization, improving service delivery performance, and supporting national spatial and
sector objectives. Mechanisms that could be employed to achieve those objectives are
already available: DAU, Hibah, and DAK, respectively.
Use DAU to equalize current spending and capital assets. In theory, the DAU is
supposed to equalize current and capital spending. The formula does not distinguish
between current and capital spending, however. (And in practice DAU is mostly used for
current spending). In any case, on the capital side, the appropriate equalization target is
assets and not spending. The DAU should be reformulated to equalize current spending
and the stock of capital assets.
Expand use of Hibah as performance grant. An argument for increasing the use of the
Hibah as a performance grant in the water sector has already been made above.
Performance of the Water Hibah should continue to be monitored in the short-term. If the
expanded use proves successful at further improving local water service delivery the
program could be rolled out to other sectors (using government funds), including other
types of infrastructure or in health and education sectors.
Improve DAK allocation methods. Short-term recommendations made above for DAK
will assist in supporting the grant’s most important goal—achieving national spatial and
sectoral objectives. Central government should avoid using the DAK to try to attain
supplementary objectives (as draft revisions to law now intend). Also, government should
re-think its current methods of grant allocation—based on general, specific, and technical
criteria—which are unfocussed on main objectives, too complicated, and lack
transparency.
46
What other reforms might central government consider to improve decentralization
outcomes?
8. Lastly, the Bank has recommended a broader agenda of key thematic areas that require
more attention including:
Improve central monitoring of transfers. Central monitoring and evaluation of
intergovernmental transfers is currently quite weak and data that are collected are closely
guarded. These weaknesses constrain vertical accountability and limit feedback into
improved transfer design and implementation. Central government should redouble its
efforts related to transfer monitoring and evaluation. An idea worth pursuing would be to
delegate some responsibility for these tasks to provinces. In any case, data collected
through improved monitoring and evaluation mechanisms should be made widely
available.
Strengthen horizontal or downward accountability. Arguably, the most binding constraint
on improving local service delivery is insufficient accountability between local
governments and citizens. Central government should initiate programs to support the
development of horizontal accountability. Of particular importance in this regard would
be local education programs aimed at advising citizens of comparable service quality
elsewhere in Indonesia and the region and strengthening demand for improvements here.
47
1. In 2010, the Government of Indonesia and the World Bank signed a loan agreement for the
Local Government and Decentralization Support Project (LGDP). The objective of the project is
to improve the accountability of local governments (LGs) in five pilot provinces on the use of the
Specific Purpose Grant (Dana Alokasi Khusus or DAK) for the infrastructure sub-sectors of
roads, irrigation and water supply. Since 2011, local governments participating in LGDP are
entitled to receive a financial incentive in the form of an additional Special Purpose Grant of up
to 10% of their original DAK allocation. The incentives are payable upon externally verified
achievement of eligible reimbursements. The Bank also finances technical assistance to help
participating local governments with improving the utilization (and reporting on the utilization)
of DAK. This annex summarizes the conclusions from an evaluation of the performance of LGs
participating in LGDP during 2010-2012, and provides recommendations for a monitoring and
evaluation (M&E) framework for Additional Financing to LGDP.
Evaluation of Local Government Performance
2. Almost 90% of the value of potential reimbursement qualified for reimbursement by
the Bank. To improve the accountability of participating local governments on the use of the
DAK, BPKP was appointed to verify a sample of DAK-financed contracts for compliance with
pre-agreed criteria. In 2012, 89% of the value of potential reimbursement was qualified for
reimbursement by the Bank (up from 84% in 2011) and just had a slight decrease to 87% in
2013. Poor internal controls are a likely explanation for non-compliance with eligibility criteria.
Internal controls are weakest in local governments in North Maluku and West Sulawesi.
3. Approximately 60% of participating local governments use the project’s web-based
reporting system (WBRS). The full use of the WBRS for technical reporting is much more
common than for financial reporting, possibly because LGs consider the system as redundant for
financial reporting purposes.
4. Participating local governments outperform non-participants in water sector reporting
and capital spending. There is no empirical evidence to suggest that mere participation in the
DAK reimbursement scheme has any impact on local government counterpart funding, reporting,
or capital spending, all other things remaining equal. However, as DAK allocations increase,
project participation becomes more important for performance. Participating local governments
that receive per capita DAK transfers in excess of about Rp. 50,000 (2012 terms) submit their
water sector reports in a timelier manner than non-participating districts; participating districts
that are allocated per capita DAK funds in amounts larger than approximately Rp. 125,000 (2012
terms) spend more on capital than non-participating districts.
5. DAK is more stimulative of participating district capital spending than it is of non-
participating districts. Estimation results suggest that an additional Rupiah of DAK leads to an
extra 2.6 Rupiah of capital spending for participating districts and an added 1.5 Rupiah of capital
spending for non-participating districts.
48
Assessment of Monitoring and Evaluation Framework
6. The existing M&E framework of LGDP consists of 13 quantitative indicators that––in
theory––enable the measurement of intermediate outcome indicators and thereby the
achievement of the project development objective. However, for six of the 13 indicators, no data
were available.
7. For none of the 13 quantitative indicators did the existing M&E framework contain time-
bound and objectively verifiable targets. As a result, there is no yardstick against which to judge
the performance of the participating LGs.
Recommendations
8. Recommendations emerging from the evaluation related to overall project design included:
Increase amount of financial incentives. At present, local governments participating in
LGDP quality for financial incentives that account for a maximum of 10% of the DAK
funds allocated to four infrastructure sectors. For many participants this is not a
significant amount, partly because there is already substantial variation year-on variation
in DAK transfers received by individual districts (so that increases in DAK will not
necessarily be attributed to the receipt of financial incentives).
Increase awareness of financial incentives. Supervision missions indicate that
participating local governments are often unaware of the amount (or mere existence) of
financial incentives. For such governments, a change in spending behavior is a priori
unlikely. It is especially important that technical departments responsible for the four
infrastructure sectors will be give the responsibility for monitoring and oversight of the
incentive.
Improve institutional coordination. At present, four central government agencies are
involved in the implementation of LGDP: the Ministry of Finance (the Executing
Agency), the Ministry of National Planning (Bappenas), the Ministry of Home Affairs
and the Ministry of Public Works (MPW). To secure broad-based support for an
expanded version of LGDP, there is a need to define the responsibilities of all parties and
agree upon a division of roles.
Provide targeted support to central government agencies. This will include, at the
minimum, technical assistance to MPW for the regular updating and expansion of the
reference unit cost list, and support to DGFB to analyze the benefits of LGDP,
communicate these benefits to other stakeholders (notably DPR, Bappenas, and other
Directorates-General in the Ministry of Finance) and provide regular feedback to WBRS
users.
Provide targeted support to participating local governments. There is substantial
variation in performance across LGDP participants. It is recommended to provide
intensive technical support to local governments least able to qualify for financial
49
incentives under the project (at present, these are concentrated in the provinces of North
Maluku and West Sulawesi).
9. Recommendations emerging from the evaluation related to strengthening the M&E
framework included:
Maintain the seven intermediate outcome indicators required to measure
performance in the existing M&E framework. Because the second phase of LGDP will
be financed from Additional Financing (as opposed to a separate loan), the M&E
framework in Annex 3 of the PAD for the original loan will continue to apply. For this
reason, it is recommended to maintain the quantitative indicators that contribute to
measuring the seven intermediate outcome indicators provided by this framework.
Remove redundant indicators. It is recommended to remove two of the quantitative
indicators because they do not appear to add value to the monitoring and evaluation of
LGDP. These are indicators are: “% of work packages contained in LG’s detailed work
plans” and “% of LGs with current general procurement plan”.
Introduce time-bound and objectively verifiable targets for all indicators. The present
M&E framework does not contain targets against which performance is measured. To
overcome this deficiency, it is recommended to start measuring the project-specific
indicators against time-bound targets. For the generic indicators (which can be measured
for all LGs, also those not participating in LGDP), the performance of participating LGs
would be measured against a control group of comparable but non-participating LGs.
Limit comparison with control group to original participants. Because the impacts of
the financial incentives and technical support provided by LGDP are not immediate, it is
recommended that the comparison with a control group will only be made for LGs that
participated in LGDP from the start.
Ensure data availability. To operationalize the above recommendations, it is necessary
to ensure that data will become available for the measurement of all indicators.
Reassess project impacts in 2015. Above a certain level of DAK allocations, participants
in the project already outperform non-participants in water sector reporting and capital
spending. It is recommended to reassess potential impacts of the project in 2015, to verify
if the impacts of the projects have been sustained and expanded to other areas.
10. Most of the abovementioned recommendations have been reflected in this Additional
Financing.

50
1. This Annex is structured into two sections. Section 1 describes the methodology that is
proposed to select additional participating provinces for the gradual rollout to 30 of Indonesia’s
34 provinces. The methodology utilizes a two-step filter as outlined below. Section 2 outlines the
steps used each year to select the eligible provinces and districts applying the methodology. In
the selection of the new participating regions consideration has been given to a combination of
factors such as socio-economic factors, DAK allocation, district revenue, and LGs compliance
on reporting.
Methodology and Selection Criteria for Expanding Participating Regions
2. The technique was implemented in three stages, which can be summarized as follows:
Stage 1: Geographical Coverage and Other Considerations
3. As part of Stage 1 the process first screens out special autonomy provinces, DKI Jakarta
and current provincial recipient of LGDP program. Special autonomy provinces are subject to
special fiscal treatment involving the transfer of considerable autonomy funds under the
Indonesian Constitution and as such fall outside the scope of this program. DKI Jakarta was also
excluded due its uniqueness as a major metropolitan area and Indonesia’s primary economic
agglomeration. As MoF has decided to continue LGDP implementation in the five participating
LGDP, they are screened out for the purposes of this provincial selection exercise.
4. The remaining provinces were then distributed into four distinct island groups: (i)
Sumatra; (ii) Java-Bali; (iii) Kalimantan-Sulawesi; and (iv) Eastern Indonesia (Nusa Tenggara-
Maluku-Papua). GoI has expressed a desire to ensure that all island groups or regions are well
represented in the final LGDP AF, indicated that there should be around two provinces each
selected from Sumatra, Java-Bali and Eastern Indonesia, and three from Kalimantan-Sulawesi
for each year. This will give the project geographic concentration and scalability in the number
of LGs covered, while also allowing some diversity across Indonesia’s regions.
Stage 2: Application of Three Indicators/Criteria and Order Ranking
5. After the abovementioned filters and clustering is applied, the selection methodology
involves the analysis of three indicators/criteria and the associated rank ordering as described
below.
Proportion of DAK to Overall Local Budget (APBD). The indicator is to be calculated
as a provincial average, i.e. the weighted sum of all DAK to APBD ratios for LGs in a
given province. The indicator favors LGs with a higher ratio of DAK to APBD.
Provinces receive higher rank ordering if they have higher percentage/ratio of DAK to
APBD. The current national average for this measure is 6.6%.
Rationale: The selection of this indicator is partly driven by results from the LGDP Mid-
Term Evaluation that found that the greater the LGs dependence on DAK the more likely
it is to respond to performance incentives under the program. Additionally, the choice of
51
indicator reflects DAK’s objective to reduce interregional service inequalities, i.e. the
worse the condition of service infrastructure in a region, the more DAK the region should
receive. Based on the formula, the determination of which districts receive DAK is based
on the net fiscal index or the difference between fiscal capacity and needs of a specific
region.
Human Development Index (HDI). The HDI measures a composite human
development index by combining indicators of life expectancy, educational attainment,
adult literacy, gross enrollment, and income. HDI more represents the pro-poor aspect in
the criteria. As part of the LGDP AF provincial selection process the HDI measure
calculated as the provincial weighted average of all HDI measures for all constituent LGs
in the said provinces. Provinces receive a higher rank order the lower the lower the HDI.
Rationale: The indicator was selected as a needs-based measure, prioritizing LGs and
provinces with lower income, access to basic services and human development levels.
DAK Reporting Performance to Ministry of Public Works. The indicator measures
the percentage of LGs reporting through the e-monitoring system to Ministry of Public
Works (MPW). The indicator will be calculated for each province as the percentage all
constituent LGs reporting through the e-monitoring system. Provinces will receive higher
rank ordering the better reporting performance of constituent LGs. In 2012, the average
percentage of participating LGDP LGs reporting to the MPW in the three subsectors (i.e.
road, irrigation and water) is around 84% or higher than the national average (79%).
Rationale: The indicator was selected to incent improved reporting and accountability
performance at the provincial and LG level.
Stage 3: Aggregate Order Ranking and Selection
6. After the abovementioned indicators are analyzed all provinces are ranked within each
island group against each indicator. These rankings are then summed across the three variables
giving each province an ‘aggregate order rank’. Provinces are then selected from each island
group based on the aggregate order ranking results.
7. This process is further outlined on Figure 1 below.

52
Figure 1: Provincial Selection Processes
Applying the Selection Methodology for the LGDP Additional Financing
8. Stage 1: As noted above, Stage 1 involved a preliminary screening of special autonomy
provinces, DKI Jakarta and participating provinces. The special autonomy provinces include
Aceh, Papua, and West Papua and participating provinces included Jambi, East Java, Central
Kalimantan, West Sulawesi, and North Maluku. The application of these filters trimmed the
eligible provinces from a total of 34 to 25. As noted above, the remaining 25 provinces were then
distributed into four distinct island groups: (i) Sumatra; (ii) Java-Bali; (iii) Kalimantan-Sulawesi;
and (iv) Eastern Indonesia (Nusa Tenggara-Maluku-Papua).
9. Stage 2: As noted above, Stage 2 involves the analysis of all provinces against the three
selection indicators/criteria and an order ranking of provinces by island group for each measure.
A summary of the result of this exercise are as follows:
Stage 1: Screening out and Grouping
- All 34 provinces in Indonesia
- Exclude Special Autonomy Provinces and DKI Jakarta (4 provinces)
- Rules out 5 current participating provinces
- Grouping into 4 distinct island groups
Stage 2: Application of 3 Criteria and Order Ranking
- Criteria 1: High Portion of DAK to Local Budget
- Criteria 2: Lower Human Development Index
- Criteria 3: Higher Percent of LGs Reporting to MPW
Stage 3: Aggregate Order Ranking and Grouping Selection
- 2015: Lampung, Bengkulu, West Java, Central Java, West Kalimantan, North
Sulawesi, South Sulawesi, NTB and NTT.
- 2016: West Sumatera, South Sumatera, Bangka Belitung, Bali, South
Kalimantan, Central Sulawesi, Gorontalo, and Maluku.
- 2017: North Sumatera, Riau, Riau Island, DI Yogyakarta, Banten, East
Kalimantan, North Kalimantan and South East Sulawesi.

53
Proportion of DAK to Overall Local Budget (APBD). From this criteria, the two
highest ranked provinces are as follow: Bengkulu and Lampung (Sumatera); West Java
and Central Java (Java-Bali); West Kalimantan and North Sulawesi (Kalimantan-
Sulawesi); East Nusa Tenggara and Maluku (Eastern Indonesia). The average DAK as %
of APBD in these provinces is around 7% (above national average).
Human Development Index. Provinces that have lower HDI get a higher ranking.
Provinces that have the highest ranking from this criteria are: Lampung and Bangka
Belitung (Sumatera); Banten and West Java (Java-Bali); West Kalimantan and Southeast
Sulawesi (Kalimantan-Sulawesi); and West and East Nusa Tenggara (Eastern Indonesia).
The average HDI for these provinces is 70 (below national average at 72.32).
DAK Reporting Performance to MPW. The results against this indicator found the
following provinces with the highest ranks: South Sumatera and Bangka Belitung
(Sumatera); Central Java and Bali (Java-Bali); West Kalimantan and South Sulawesi
(Kalimantan-Sulawesi), and West and East Nusa Tenggara (Eastern Indonesia). The
average percentage of DAK reporting to MPW in these provinces is around 79% (much
higher than the national average at 64%).
10. Stage 3: In this final stage an aggregate rank order across the three criteria is calculated
and provinces are selected. Participating provinces are picked based on their cumulative score of
rank ordering. In case of a tie in the ‘sum of rank ordering’, percentage of DAK to APBD is
utilized to break the tie. The summary and detailed results of this exercise are provided in tables
1 and 2 below. Approximately 8 to 9 provinces are selected each year against the three-selection
indicators/criteria. The idea is to select a group of provinces every year based on their cumulative
score of rank ordering,
Table 1: Summary of Provincial Selection Results
Parameter Original
Project
Additional Financing Total
Number of eligible provinces 5
25 new
(with 5 original continuing) 30
Name of eligible provinces
Jambi, East
Java, Central
Kalimantan,
West Sulawesi,
North Maluku
(i) Bengkulu, Lampung, West
Java, Central Java, West
Kalimantan, North Sulawesi,
South Sulawesi, NTB, NTT; (ii)
West Sumatera, South Sumatera,
Bangka Belitung, Bali, South
Kalimantan, Central Sulawesi,
Gorontalo, Maluku; and (iii)
North Sumatera, Riau,
Kepulauan Riau, DI Yogyakarta,
Banten, East Kalimantan, North
Kalimantan, South East Sulawesi
Number of eligible LGs
within the provinces 77
364
(in 25 new provinces, approx.)
446
(approx.)
2013 DAK allocation,
infrastructure (IDR billions) 1,081
5,021
(in 25 new provinces, approx.)
6,102
(approx.)
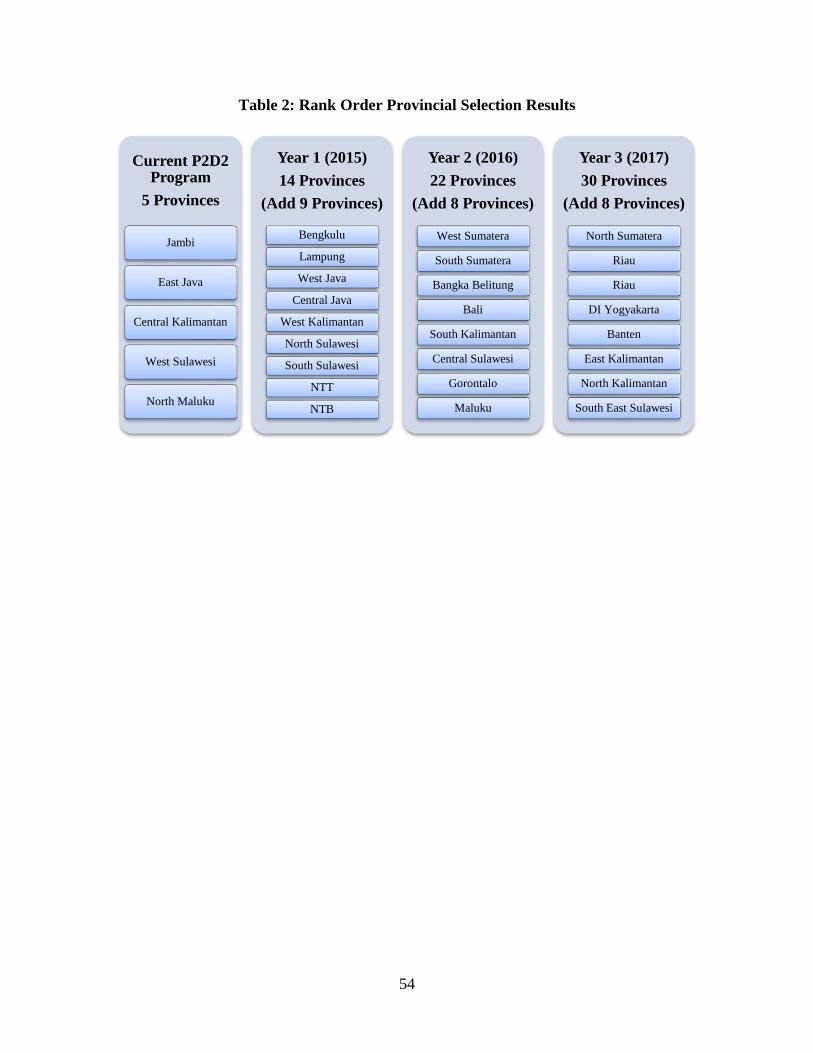
54
Table 2: Rank Order Provincial Selection Results
Current P2D2 Program
5 Provinces
Jambi
East Java
Central Kalimantan
West Sulawesi
North Maluku
Year 1 (2015)
14 Provinces
(Add 9 Provinces)
Bengkulu
Lampung
West Java
Central Java
West Kalimantan
North Sulawesi
South Sulawesi
NTT
NTB
Year 2 (2016)
22 Provinces
(Add 8 Provinces)
West Sumatera
South Sumatera
Bangka Belitung
Bali
South Kalimantan
Central Sulawesi
Gorontalo
Maluku
Year 3 (2017)
30 Provinces
(Add 8 Provinces)
North Sumatera
Riau
Riau
DI Yogyakarta
Banten
East Kalimantan
North Kalimantan
South East Sulawesi
55
1. The World Bank has outlined an ambitious organizing goal to end extreme poverty
within a generation and to promote shared prosperity. Ending poverty and promoting shared
prosperity are unequivocally about progress in non-monetary dimensions of welfare including
education, health, nutrition, and access to basic infrastructure.
2. In an economy with significant inter-regional variations in revenue capacity and
investment needs, decentralized provision of public services can enhance efficiency in the
provision of these services and result in welfare gain. Fiscal decentralization enters into poverty
alleviation strategy in a number of ways: (i) the proximity of policy makers to the target group
reduces information and transaction costs of identifying the poor and helps in designing
potentially successful ‘capacity improving’ and ‘safety net’ policies; and (ii) enhance efficiency
in the provision of basic infrastructure and facilities (Rao, 1998)9. Further, general and specific
purpose transfers are intended to enable poorer regions to provide social and physical
infrastructure at levels comparable to those in richer jurisdictions, such transfer will enable the
depressed regions to fully utilize their growth potential and will hasten poverty reduction.
Analysis results of the accuracy of DAK allocations for regions also show that correlation signs
of DAK allocation by province on the condition of public service in infrastructure sector are in
line with DAK objective to reduce interregional service inequalities (Usman et al, 2008)10
.
3. Infrastructure investments funded through DAK transfers have three potential positive
effects on reducing poverty. These include: (i) a public works effect; (ii) a broad-based economic
growth effect; and (3) a non-income effect. It is well known that the construction of public
infrastructure can provide needed wages to low-income workers and therefore assist in the
reduction of poverty. Public works programs can be designed explicitly to help mitigate the
negative impact of one-time economic shocks on impoverished groups, for example. More
importantly perhaps, public works projects that are implemented in a consistent fashion over
time can provide a reliable source of necessary income for the poor and near poor and thus
function as a more dependable means of poverty reduction (Del Nino, Subbarao, and Milazzo,
2009). DAK funded infrastructure projects are implemented routinely, year after year, and may
thus serve to help reduce poverty via the second channel.
4. The stock of infrastructure created by publically financed investments can also positively
influence broad-based economic growth, which in turn can help reduce poverty. In this context,
both direct and indirect effects may be important (Straub, 2008 and 2011)11
. Increases in the
stock of infrastructure can directly raise the productivity of other factors of production and
thereby support increases in economic output. Indirect effects relate to the possible efficiency-
9 See Rao, M.G., (1998).”Poverty Alleviation under Fiscal Decentralization”, World Bank.
10 See Usman, S., Mawardi. S, Poesoro, A., Suryahadi, A., and Sampford, C., (2008).”The Specific Allocation Fund
(DAK): Mechanisms and Uses”, Research Report, The SMERU Research Institute. 11
See Straub, S. and Terada-Hagiwara, A., (2011).”Infrastructure and Growth in Developing Asia”, Asian
Development Bank Review, Asian Development Bank, vol. 28(1), pages 119-156; and, Straub, S.
(2008).”Infrastructure and development: a critical appraisal of the macro level literature”. Policy Research Working
Paper Series 4590, the World Bank.

56
enhancing externalities of public infrastructure. More and better quality infrastructure may
reduce private capital adjustment costs, for example, by facilitating investment logistics or by
decreasing the need for own-provision of certain inputs such as roads, water, or electricity
(Agenor and Moreno-Dodson, 2006)12
. Alternatively, efficiencies may be gained through the
improvements to human capital and labor productivity that result from increasing some public
investments, such as those that help to reduce travel time to and from work, for instance (Galiani
et al., 2005)13
. Lewis and Niazi (forthcoming)14
provide empirical evidence to suggest that
increases in both the amount and quality of local roads infrastructure have a positive impact on
district economic growth in Indonesia.
5. Finally, infrastructure can help reduce non-income poverty by providing the poor with
enhanced access to important public services. Increased access to water, especially, for example,
is well known to improve the quality of vulnerable groups’ lives through enriched health
outcomes (ADB, 2012)15
. DAK funded infrastructure increases access of the poor to water and
thereby assists in easing some of the non-income dimensions of poverty.
6. Each of the above effects may be realized for DAK funded infrastructure projects, in
general. The case for greater LGDP impact, specifically, is a function of the empirical evidence
that suggests that the DAK is more stimulative of capital spending in participating districts than
it is of non-participating districts. More precisely, estimation results imply that an additional
rupiah of DAK leads to an added 1.5 rupiah of capital spending for non-participating districts but
an extra 2.6 rupiah of capital spending for participating districts. So DAK leads to relatively
more capital spending and relatively larger public capital stocks in LGDP local governments and
thus it is likely to result in increased poverty reduction in participating districts.
Gender
7. New and improved infrastructure supported under DAK will improve access and
reliability of road and water related services, in particular for vulnerable populations like women,
youth, and elderly. The LGDP project supports and encourages LG efforts in maintaining,
rehabilitating and improving the quality of their road, bridge, irrigation and water infrastructure.
8. The rehabilitation of roads and bridges will be beneficial for women and youth, as it
improves road safety, reduces transportation costs and improves access social services. Local
roads, especially in the rural areas, often bring social improvements to the community, as they
enable the community to travel to school, health clinic, local market, and government offices.
The rehabilitated roads and bridges often bring mobility and accessibility improvements to the
community, as they enable the community to transport their home-industries’ products to the city
with competitive advantage, since transport costs have also been reduced. This analysis is based
12
Agénor, P. and Moreno-Dodson, B., (2006).”Public Infrastructure and Growth: New Channels and Policy
Implications”. Public Research Working paper, the World Bank, Washington D.C. 13
Galiani, S., Gertler, P. and Schargrodsky, E. (2005). ”Water for Life: The Impact of the Privatization of Water
Services on Child Mortality”, Journal of Political Economy, the University of Chicago. 14
Lewis, B. and Niazi, T., (2013).”Fiscal Decentralization in Indonesia: Local Infrastructure Impact and Finance”.
Forthcoming. 15
ADB (2012).”ADB Annual Report 2011”. Asian Development Bank, Manila.
57
on the impact assessment of the IRFF (Infrastructure Rehabilitation Financing Facilities) at
Kabupaten Pidie and Pidie Jaya, Aceh Province, 2010; available on Booklet: Route to Recovery.
9. The new and improved household water connections will help women in their role as
provider of clean water for their families. Increased access to more reliable and safe water will
be beneficial for women and children who usually bear the responsibility of fetching water,
especially for women who are responsible for cooking and cleaning. Having water connections
closer to their houses will bring health benefits, resulting from reduced exposure to
environmental risks posed by contaminated water and associated waterborne diseases, as well as
economic benefits brought about through reductions in the cost of medical expenses as well as
time spent collecting water.
58
A. Project Objectives
1. The objective of the Project is to improve the accountability and reporting of the central
government’s Specific Purpose Grants (DAK) for the basic infrastructure, consisting of roads,
irrigation, water and sanitation within Selected Local Governments (LGs). As mentioned, the
program itself will be gradually expanded in 30 Provinces excluding three special autonomy
provinces, namely Aceh, Papua, West Papua, and one Special Capital District (DKI) of Jakarta in
the same infrastructure sector covering reimbursements for the DAK allocation in the three fiscal
years from 2015 to 2017. Fourteen provinces, five original and nine new LGs, will be included in
the first year of the program. During the rest of the program, eight additional provinces will be
chosen annually using criteria-based provincial selection methodology.
2. Based on independent verification of physical outputs, Component 1 of the Project will
reimburse up to the full DAK expenditure allocations for basic infrastructure sectors including
roads, irrigation, water and sanitation, including the 10% matching funds from district-level
resources.
3. Working with existing mechanisms for the transfer of DAK resources, Component 2 of
the Project will strengthen institutional capacities at both the national and sub-national levels, by
improving technical guidelines on DAK expenditures from line ministries, and enhancing
existing systems and mechanism for monitoring and verifying DAK implementation. This is
expected to have a positive impact beyond the basic infrastructure sectors supported under this
Project, since greater capacity at national and sub-national levels will improve the usage of DAK
resources and investments in other sectors.
B. Project Costs
4. Table 1 below summarizes the estimated Project costs, by Project component, sector, and
location (provincial or national levels). The cost estimates under Component 1 are based on the
average of the four most recent years (2011 through 2014) of actual DAK allocations by
province and sector. The overall budget envelope for Component 1 is such that the annual DAK
allocations to individual provinces and sectors are at a level similar to the actual DAK allocation
for 2014, assuming the Project’s investments are evenly distributed over three years.
5. In order to analyze the full economic costs and benefits, annual operating costs for the
infrastructure resulting from DAK investments under this Project were included in the analysis,
expressed as a percentage of the DAK investment outlays (Roads: 5%; Water: 2%; Irrigation:
5%). It was assumed that Project investments would have a service life of at least three years.
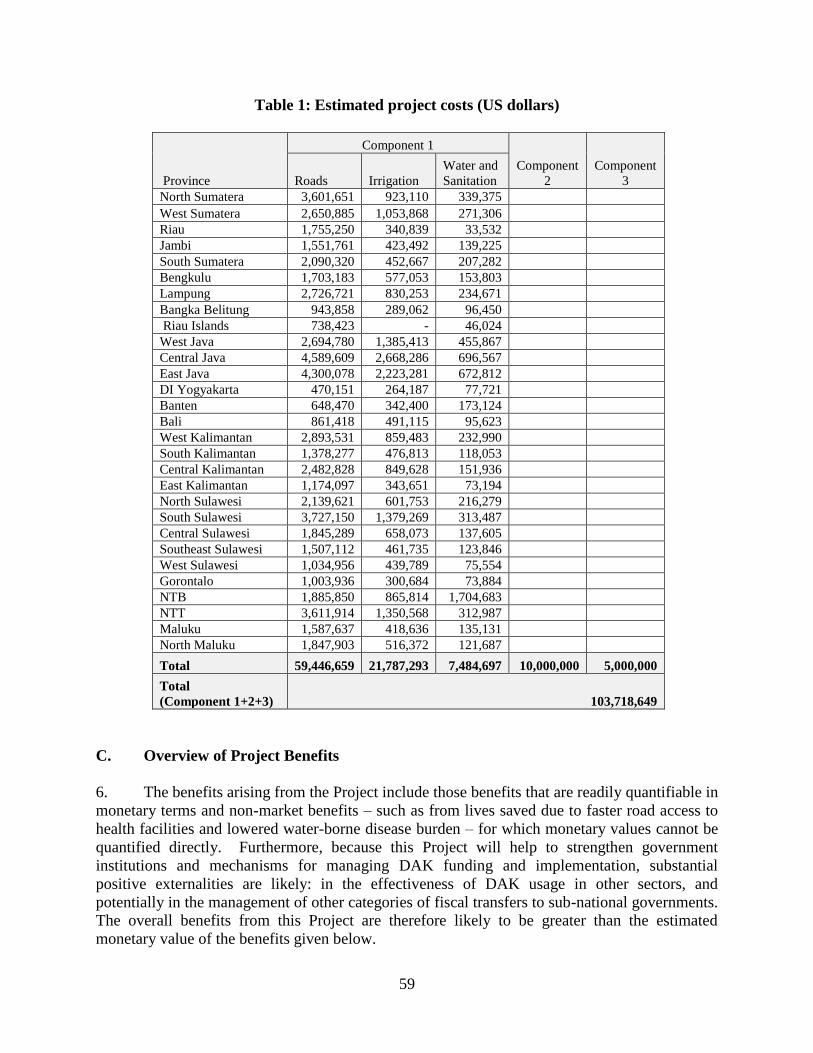
59
Table 1: Estimated project costs (US dollars)
Province
Component 1
Component
2
Component
3 Roads Irrigation
Water and
Sanitation
North Sumatera 3,601,651 923,110 339,375
West Sumatera 2,650,885 1,053,868 271,306
Riau 1,755,250 340,839 33,532
Jambi 1,551,761 423,492 139,225
South Sumatera 2,090,320 452,667 207,282
Bengkulu 1,703,183 577,053 153,803
Lampung 2,726,721 830,253 234,671
Bangka Belitung 943,858 289,062 96,450
Riau Islands 738,423 - 46,024
West Java 2,694,780 1,385,413 455,867
Central Java 4,589,609 2,668,286 696,567
East Java 4,300,078 2,223,281 672,812
DI Yogyakarta 470,151 264,187 77,721
Banten 648,470 342,400 173,124
Bali 861,418 491,115 95,623
West Kalimantan 2,893,531 859,483 232,990
South Kalimantan 1,378,277 476,813 118,053
Central Kalimantan 2,482,828 849,628 151,936
East Kalimantan 1,174,097 343,651 73,194
North Sulawesi 2,139,621 601,753 216,279
South Sulawesi 3,727,150 1,379,269 313,487
Central Sulawesi 1,845,289 658,073 137,605
Southeast Sulawesi 1,507,112 461,735 123,846
West Sulawesi 1,034,956 439,789 75,554
Gorontalo 1,003,936 300,684 73,884
NTB 1,885,850 865,814 1,704,683
NTT 3,611,914 1,350,568 312,987
Maluku 1,587,637 418,636 135,131
North Maluku 1,847,903 516,372 121,687
Total 59,446,659 21,787,293 7,484,697 10,000,000 5,000,000
Total
(Component 1+2+3) 103,718,649
C. Overview of Project Benefits
6. The benefits arising from the Project include those benefits that are readily quantifiable in
monetary terms and non-market benefits – such as from lives saved due to faster road access to
health facilities and lowered water-borne disease burden – for which monetary values cannot be
quantified directly. Furthermore, because this Project will help to strengthen government
institutions and mechanisms for managing DAK funding and implementation, substantial
positive externalities are likely: in the effectiveness of DAK usage in other sectors, and
potentially in the management of other categories of fiscal transfers to sub-national governments.
The overall benefits from this Project are therefore likely to be greater than the estimated
monetary value of the benefits given below.
60
7. The general types of direct benefits from the Project are described by project component
below. Specific benefits may vary from province to province and within a province, depending
on the unique circumstances of, and specific investments in, each location.
8. Component 1: DAK Reimbursement
Roads:
Transport cost savings from reduced fuel consumption and maintenance costs;
Time savings from smoother road travel;
Gains from better market access for goods;
Increased income of transport operators arising from greater demand for transport
services;
Enhanced capital values of property made more accessible by improved roads.
Water and Sanitation:
Time savings in obtaining clean water;
Cost savings for purchase of clean water;
Lower health expenditures from reduced incidence of water-borne disease.
Irrigation:
Increase in crop yields (per unit area);
Increase in area under cultivation;
Cultivation of higher value crops and higher yielding crop varieties;
Increase in farmer incomes (from increased productivity factors above);
Reduced risks of, and costs arising from, extreme events such as droughts or floods;
Enhanced capital values of agricultural land with improved irrigation.
9. Component 2: Institutional Support Program
Improved rate of completion and quality of outputs obtained from infrastructure
investments funded by DAK;
Reduced inefficiencies and irregularities in use of DAK funds;
Greater accountability and transparency in the use of DAK funds.
10. Component 3: Verification of Outputs
This component contributes to the achievement of results in Components 1 and 2 above.
D. Valuation of Project Benefits
11. The first step in estimating Project benefits was to estimate the quantity of outputs
expected from DAK investments under this Project in each sector and province. Given the
complexity of estimating future DAK investments in all 446 districts across thirty pilot
provinces, representative output types were chosen for each of the sectors, based on outputs most
commonly funded by DAK investments in these provinces:
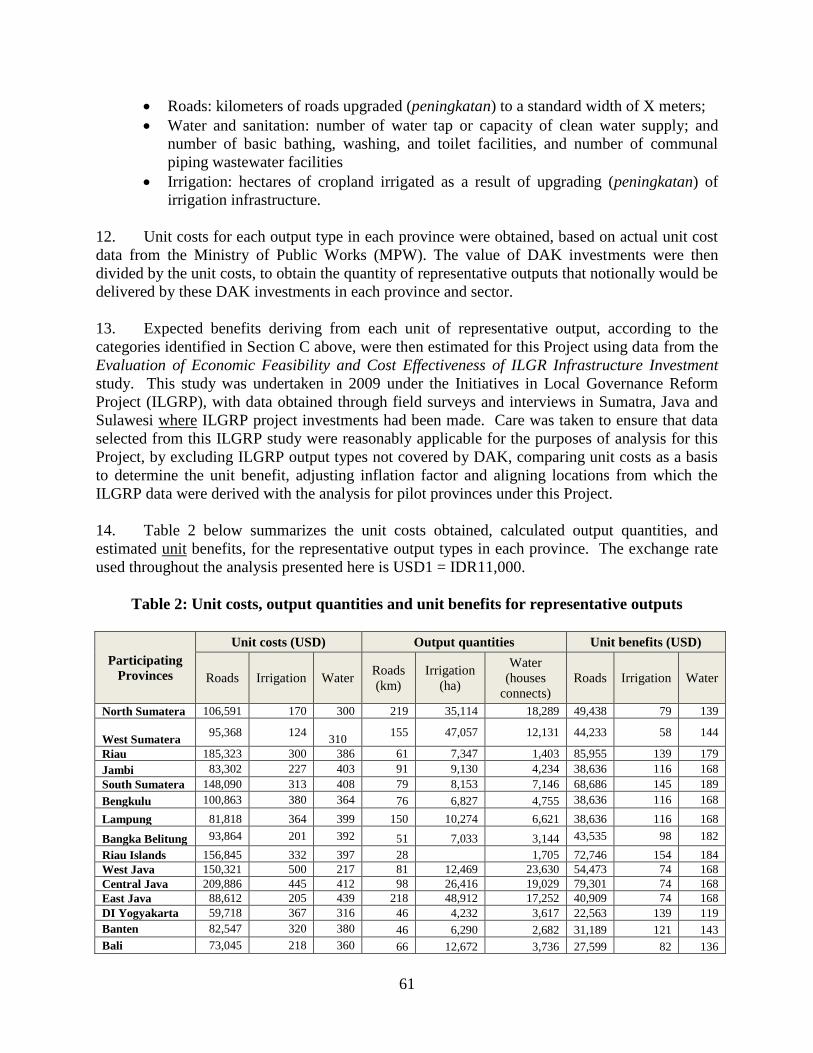
61
Roads: kilometers of roads upgraded (peningkatan) to a standard width of X meters;
Water and sanitation: number of water tap or capacity of clean water supply; and
number of basic bathing, washing, and toilet facilities, and number of communal
piping wastewater facilities
Irrigation: hectares of cropland irrigated as a result of upgrading (peningkatan) of
irrigation infrastructure.
12. Unit costs for each output type in each province were obtained, based on actual unit cost
data from the Ministry of Public Works (MPW). The value of DAK investments were then
divided by the unit costs, to obtain the quantity of representative outputs that notionally would be
delivered by these DAK investments in each province and sector.
13. Expected benefits deriving from each unit of representative output, according to the
categories identified in Section C above, were then estimated for this Project using data from the
Evaluation of Economic Feasibility and Cost Effectiveness of ILGR Infrastructure Investment
study. This study was undertaken in 2009 under the Initiatives in Local Governance Reform
Project (ILGRP), with data obtained through field surveys and interviews in Sumatra, Java and
Sulawesi where ILGRP project investments had been made. Care was taken to ensure that data
selected from this ILGRP study were reasonably applicable for the purposes of analysis for this
Project, by excluding ILGRP output types not covered by DAK, comparing unit costs as a basis
to determine the unit benefit, adjusting inflation factor and aligning locations from which the
ILGRP data were derived with the analysis for pilot provinces under this Project.
14. Table 2 below summarizes the unit costs obtained, calculated output quantities, and
estimated unit benefits, for the representative output types in each province. The exchange rate
used throughout the analysis presented here is USD1 = IDR11,000.
Table 2: Unit costs, output quantities and unit benefits for representative outputs
Participating
Provinces
Unit costs (USD) Output quantities Unit benefits (USD)
Roads Irrigation Water Roads
(km)
Irrigation
(ha)
Water
(houses
connects)
Roads Irrigation Water
North Sumatera 106,591 170 300 219 35,114 18,289 49,438 79 139
West Sumatera 95,368 124
310 155 47,057 12,131 44,233 58 144
Riau 185,323 300 386 61 7,347 1,403 85,955 139 179
Jambi 83,302 227 403 91 9,130 4,234 38,636 116 168
South Sumatera 148,090 313 408 79 8,153 7,146 68,686 145 189
Bengkulu 100,863 380 364 76 6,827 4,755 38,636 116 168
Lampung 81,818 364 399 150 10,274 6,621 38,636 116 168
Bangka Belitung 93,864 201 392 51 7,033 3,144 43,535 98 182
Riau Islands 156,845 332 397 28 1,705 72,746 154 184
West Java 150,321 500 217 81 12,469 23,630 54,473 74 168
Central Java 209,886 445 412 98 26,416 19,029 79,301 74 168
East Java 88,612 205 439 218 48,912 17,252 40,909 74 168
DI Yogyakarta 59,718 367 316 46 4,232 3,617 22,563 139 119
Banten 82,547 320 380 46 6,290 2,682 31,189 121 143
Bali 73,045 218 360 66 12,672 3,736 27,599 82 136
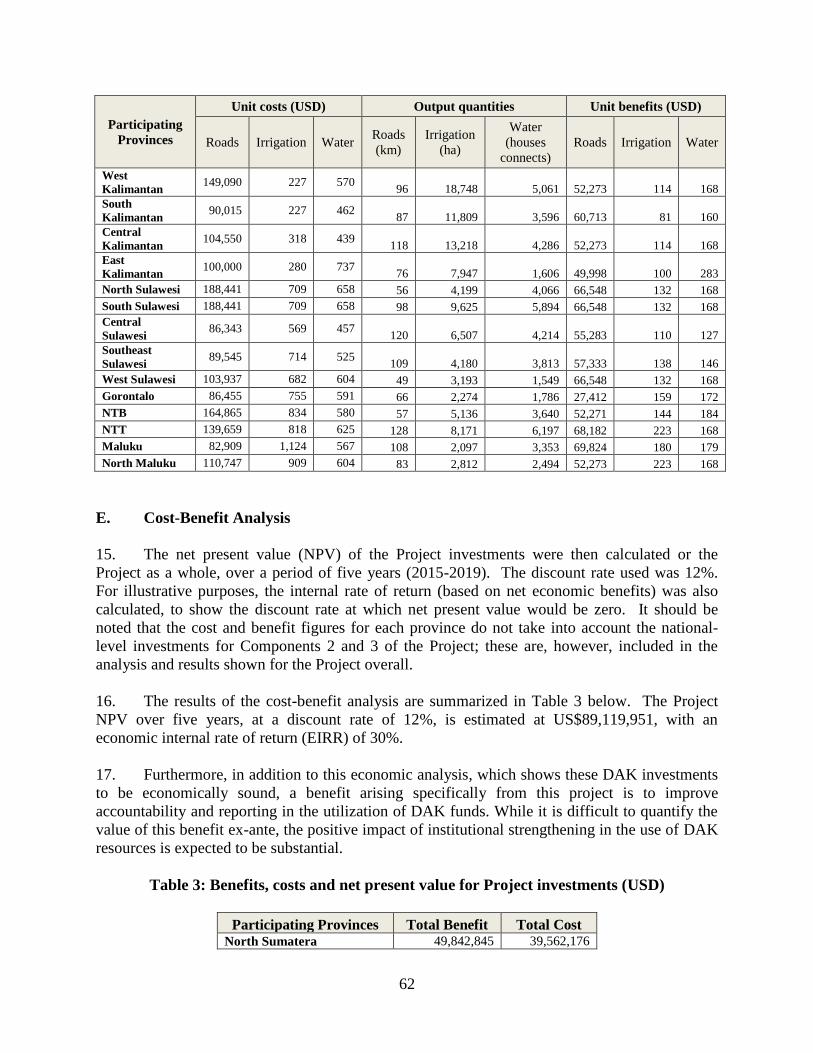
62
Participating
Provinces
Unit costs (USD) Output quantities Unit benefits (USD)
Roads Irrigation Water Roads
(km)
Irrigation
(ha)
Water
(houses
connects)
Roads Irrigation Water
West
Kalimantan 149,090 227 570
96 18,748 5,061 52,273 114 168
South
Kalimantan 90,015 227 462
87 11,809 3,596 60,713 81 160
Central
Kalimantan 104,550 318 439
118 13,218 4,286 52,273 114 168
East
Kalimantan 100,000 280 737
76 7,947 1,606 49,998 100 283
North Sulawesi 188,441 709 658 56 4,199 4,066 66,548 132 168
South Sulawesi 188,441 709 658 98 9,625 5,894 66,548 132 168
Central
Sulawesi 86,343 569 457
120 6,507 4,214 55,283 110 127
Southeast
Sulawesi 89,545 714 525
109 4,180 3,813 57,333 138 146
West Sulawesi 103,937 682 604 49 3,193 1,549 66,548 132 168
Gorontalo 86,455 755 591 66 2,274 1,786 27,412 159 172
NTB 164,865 834 580 57 5,136 3,640 52,271 144 184
NTT 139,659 818 625 128 8,171 6,197 68,182 223 168
Maluku 82,909 1,124 567 108 2,097 3,353 69,824 180 179
North Maluku 110,747 909 604 83 2,812 2,494 52,273 223 168
E. Cost-Benefit Analysis
15. The net present value (NPV) of the Project investments were then calculated or the
Project as a whole, over a period of five years (2015-2019). The discount rate used was 12%.
For illustrative purposes, the internal rate of return (based on net economic benefits) was also
calculated, to show the discount rate at which net present value would be zero. It should be
noted that the cost and benefit figures for each province do not take into account the national-
level investments for Components 2 and 3 of the Project; these are, however, included in the
analysis and results shown for the Project overall.
16. The results of the cost-benefit analysis are summarized in Table 3 below. The Project
NPV over five years, at a discount rate of 12%, is estimated at US$89,119,951, with an
economic internal rate of return (EIRR) of 30%.
17. Furthermore, in addition to this economic analysis, which shows these DAK investments
to be economically sound, a benefit arising specifically from this project is to improve
accountability and reporting in the utilization of DAK funds. While it is difficult to quantify the
value of this benefit ex-ante, the positive impact of institutional strengthening in the use of DAK
resources is expected to be substantial.
Table 3: Benefits, costs and net present value for Project investments (USD)
Participating Provinces Total Benefit Total Cost North Sumatera 49,842,845 39,562,176
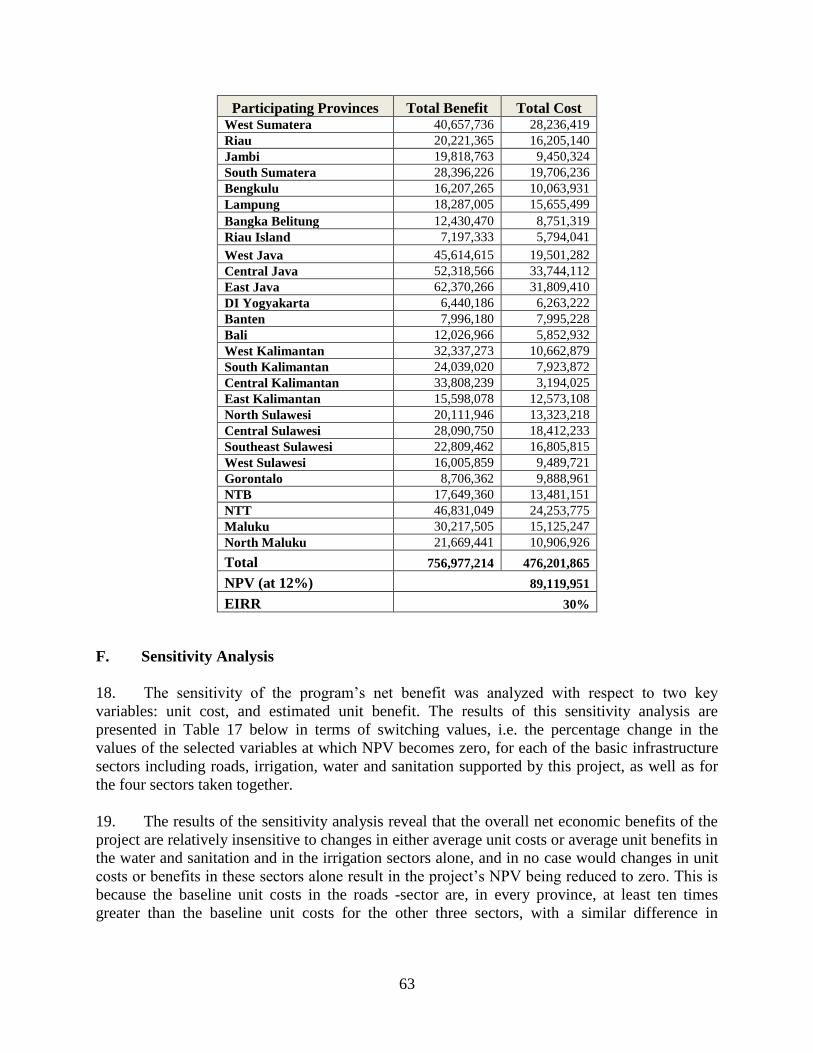
63
Participating Provinces Total Benefit Total Cost West Sumatera 40,657,736 28,236,419
Riau 20,221,365 16,205,140
Jambi 19,818,763 9,450,324
South Sumatera 28,396,226 19,706,236
Bengkulu 16,207,265 10,063,931
Lampung 18,287,005 15,655,499
Bangka Belitung 12,430,470 8,751,319
Riau Island 7,197,333 5,794,041
West Java 45,614,615 19,501,282
Central Java 52,318,566 33,744,112
East Java 62,370,266 31,809,410
DI Yogyakarta 6,440,186 6,263,222
Banten 7,996,180 7,995,228
Bali 12,026,966 5,852,932
West Kalimantan 32,337,273 10,662,879
South Kalimantan 24,039,020 7,923,872
Central Kalimantan 33,808,239 3,194,025
East Kalimantan 15,598,078 12,573,108
North Sulawesi 20,111,946 13,323,218
Central Sulawesi 28,090,750 18,412,233
Southeast Sulawesi 22,809,462 16,805,815
West Sulawesi 16,005,859 9,489,721
Gorontalo 8,706,362 9,888,961
NTB 17,649,360 13,481,151
NTT 46,831,049 24,253,775
Maluku 30,217,505 15,125,247
North Maluku 21,669,441 10,906,926
Total 756,977,214 476,201,865
NPV (at 12%) 89,119,951
EIRR 30%
F. Sensitivity Analysis
18. The sensitivity of the program’s net benefit was analyzed with respect to two key
variables: unit cost, and estimated unit benefit. The results of this sensitivity analysis are
presented in Table 17 below in terms of switching values, i.e. the percentage change in the
values of the selected variables at which NPV becomes zero, for each of the basic infrastructure
sectors including roads, irrigation, water and sanitation supported by this project, as well as for
the four sectors taken together.
19. The results of the sensitivity analysis reveal that the overall net economic benefits of the
project are relatively insensitive to changes in either average unit costs or average unit benefits in
the water and sanitation and in the irrigation sectors alone, and in no case would changes in unit
costs or benefits in these sectors alone result in the project’s NPV being reduced to zero. This is
because the baseline unit costs in the roads -sector are, in every province, at least ten times
greater than the baseline unit costs for the other three sectors, with a similar difference in
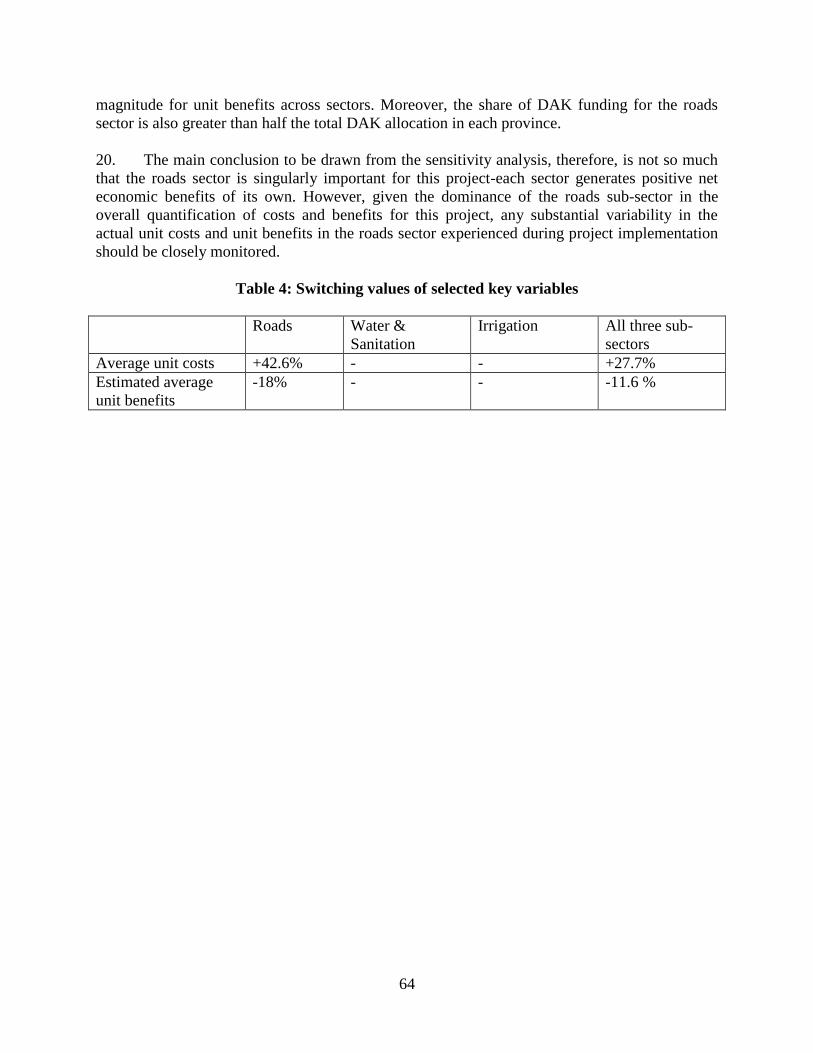
64
magnitude for unit benefits across sectors. Moreover, the share of DAK funding for the roads
sector is also greater than half the total DAK allocation in each province.
20. The main conclusion to be drawn from the sensitivity analysis, therefore, is not so much
that the roads sector is singularly important for this project-each sector generates positive net
economic benefits of its own. However, given the dominance of the roads sub-sector in the
overall quantification of costs and benefits for this project, any substantial variability in the
actual unit costs and unit benefits in the roads sector experienced during project implementation
should be closely monitored.
Table 4: Switching values of selected key variables
Roads Water &
Sanitation
Irrigation All three sub-
sectors
Average unit costs +42.6% - - +27.7%
Estimated average
unit benefits
-18% - - -11.6 %

65
A. Disbursement to Date
1. As of July 15, 2014, the project had disbursed USD 171.4 million, or 78% of the total
loan amount of USD 220.0 million. The disbursed Loan to-date consists of: (i) Advanced
Payments for the fiscal years 2011-2014; and (ii) Value of Final Reimbursement (VFR) for the
fiscal years 2011-2013, as shown at Table 1. This table provides value of to-date disbursement
payment.
Table 1: Value of Disbursement To-date (in USD)
B. Projected 2014 Output Reimbursement
2. The Remaining Loan Balance of USD 48.6 million is projected to be fully disbursed by
June 2015 against a projected eligible reimbursement for DAK 2014 outputs of USD 46.3
million and the associated incentive payment for LGs of approximately USD 5.3 million.
C. Reimbursement Progress and Comparison
3. The VQR (Value of Qualifying Reimbursement) is determined based on BPKP’s
verification of DAK Infrastructure implementation for 2011-2013. The VQR amount is
equivalent to the sum of VFR and AP. Figure 1 shown the comparison between DAK 2011,
2012, and 2013 reimbursement and the incentive.
2011 2012 2013 2014
Value of Qualifying Reimbursement
(VQR) 41,359,573 51,966,921 56,488,446
-
Advanced Payment (AP) 15,105,732 15,369,022 20,449,315 7,225,704
Value of Final Reimbursement (VFR) 26,253,841 36,597,899 36,039,131 -
Incentive Payment to LGs 3,927,853 5,077,938 5,361,445 -
Total per year 45,287,426 57,044,859 61,849,891 7,225,704
Total up to date
171,407,880
Loan Amount 220,000,000
Remaining Loan Balance 48,592,120
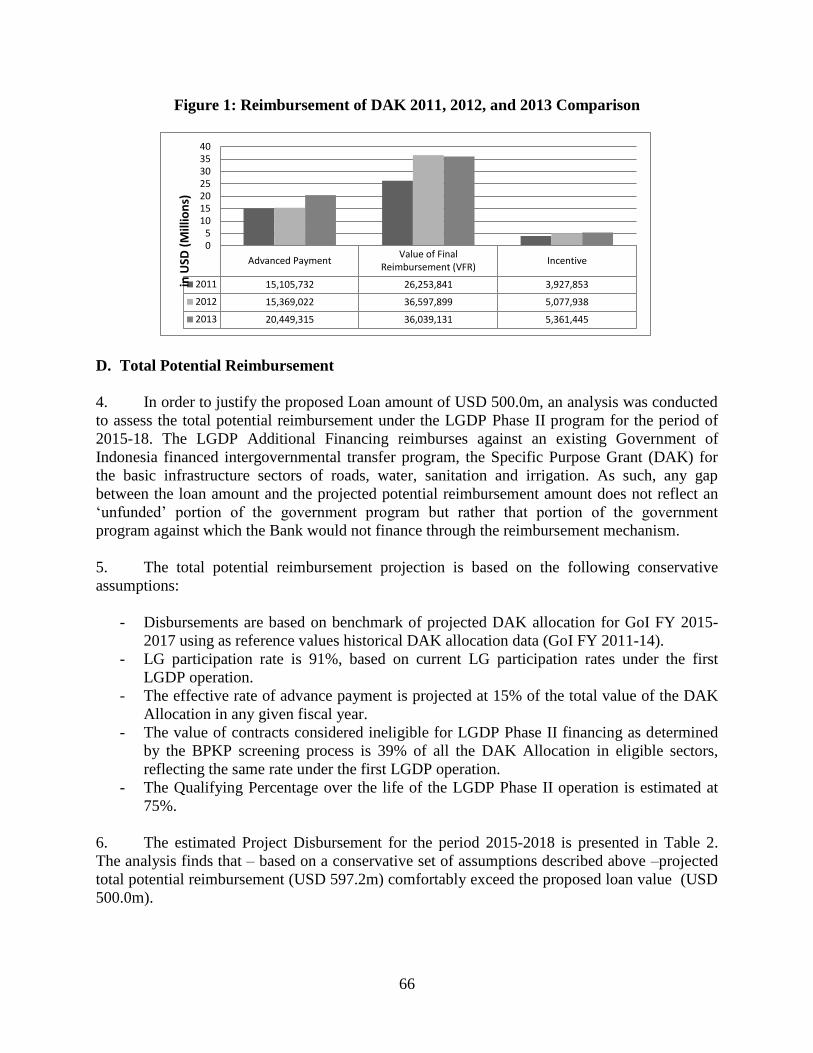
66
Figure 1: Reimbursement of DAK 2011, 2012, and 2013 Comparison
D. Total Potential Reimbursement
4. In order to justify the proposed Loan amount of USD 500.0m, an analysis was conducted
to assess the total potential reimbursement under the LGDP Phase II program for the period of
2015-18. The LGDP Additional Financing reimburses against an existing Government of
Indonesia financed intergovernmental transfer program, the Specific Purpose Grant (DAK) for
the basic infrastructure sectors of roads, water, sanitation and irrigation. As such, any gap
between the loan amount and the projected potential reimbursement amount does not reflect an
‘unfunded’ portion of the government program but rather that portion of the government
program against which the Bank would not finance through the reimbursement mechanism.
5. The total potential reimbursement projection is based on the following conservative
assumptions:
- Disbursements are based on benchmark of projected DAK allocation for GoI FY 2015-
2017 using as reference values historical DAK allocation data (GoI FY 2011-14).
- LG participation rate is 91%, based on current LG participation rates under the first
LGDP operation.
- The effective rate of advance payment is projected at 15% of the total value of the DAK
Allocation in any given fiscal year.
- The value of contracts considered ineligible for LGDP Phase II financing as determined
by the BPKP screening process is 39% of all the DAK Allocation in eligible sectors,
reflecting the same rate under the first LGDP operation.
- The Qualifying Percentage over the life of the LGDP Phase II operation is estimated at
75%.
6. The estimated Project Disbursement for the period 2015-2018 is presented in Table 2.
The analysis finds that – based on a conservative set of assumptions described above –projected
total potential reimbursement (USD 597.2m) comfortably exceed the proposed loan value (USD
500.0m).
Advanced PaymentValue of Final
Reimbursement (VFR)Incentive
2011 15,105,732 26,253,841 3,927,853
2012 15,369,022 36,597,899 5,077,938
2013 20,449,315 36,039,131 5,361,445
05
10152025303540
in U
SD (
Mill
ion
s)

67
Table 2: Projected Total Potential Reimbursement (in USD)
2015 2016 2017 2018
Advance payment
(for current year's DAK) 46,333,107 69,584,112 92,753,859 -
Output reimbursement
(for previous year's DAK) - 76,200,512 110,785,066 146,825,604
Basic incentive for LGs
(for previous year's DAK) - 12,358,664 18,198,741 24,178,789
Total 46,333,107 158,143,289 221,737,667 171,004,393
Total 2015 - 2018 597,218,455