the “zero-emission perspective”
TRANSCRIPT
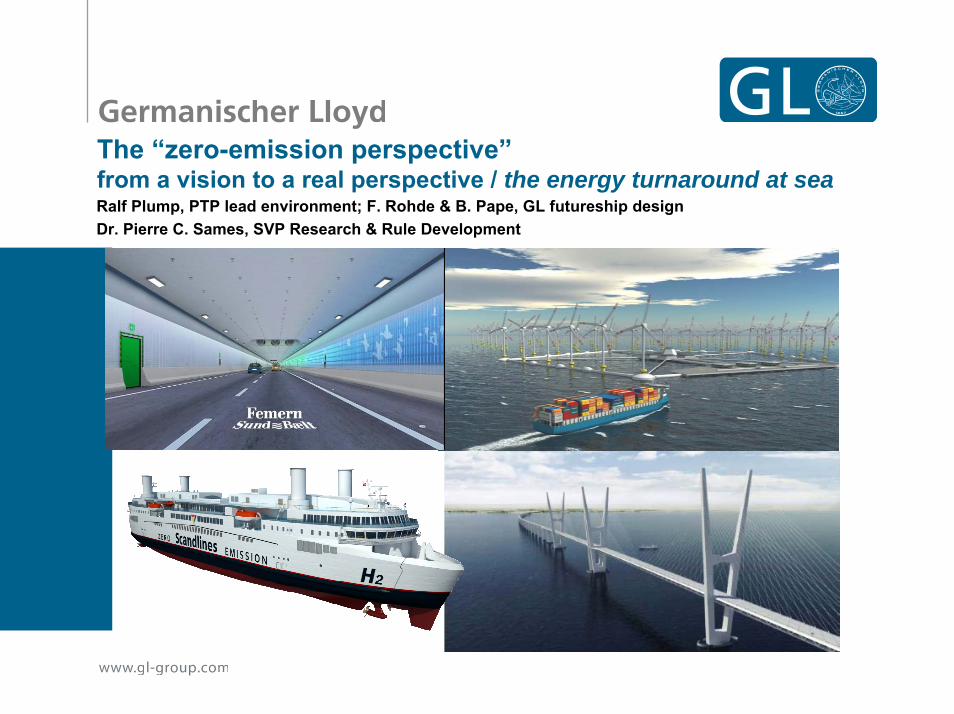
The “zero-emission perspective”from a vision to a real perspective / the energy turnaround at seaRalf Plump, PTP lead environment; F. Rohde & B. Pape, GL futureship designDr. Pierre C. Sames, SVP Research & Rule Development

Content• the starting point:
- „vision of a zero-emission container feeder vessel“- the concept design, the economy
• were does the sustainable energy come from: - offshore wind to hydrogen- onshore production of H2 / „windgas“
• the order: Scandlines ordered a feasiblity study:- Zero-emission ferry connection, Fehmarnbelt- concept design, possibilities & constraints
• what kind of H2: liqufied / compressed gas (LH2 / CH2)• will a LH2-fuelled ship be competitive?
The “zero-emission perspective”, from a vision to a real perspective / the energy turnaround at sea | 2013-10-11 | No. 2

The challenges and our motivationWith expected fleet growth to meet world transport demand for the next decades, CO2-emissions from shipping will increase.Even if known and available measures will be implemented, shipping will likely not meet the discussed emission targets.At the same time, fuel prices will continue to increase with future oil reserves being more remote and requiring more technology.
Therefore, it is time to consider novel solutions to enable future zero-emission shipping. GL Research and Rule Development looks at novel technologies beyond current applications.
Emission trajectory for international shipping
0
500
1000
1500
2000
2500
3000
1990 2000 2010 2020 2030 2040 2050
mill
ion
tonn
es C
O2
recorded scenario A1B "recent" data emission targets
- 20% from 2005
- 40% from 2005-40 %
sources: MEPC 59 /INF.1 0 and MEPC 60 /W P.5, graph b y PCS/GL
0200400600800
100012001400160018002000
2008201
020
1220
142016201
820
2020
222024202
620
2820
30203220342036
USD
/ to
n
IFO 380 M GO premium CO2 surcharge
A CO2 emission trading may start in 2013. Costs are based on IPCC upper estimates.
Price of HFO will continue to rise in the long run (2.5% pa)
In 2020, SOx-limits for fuel apply globally. MGO quality demands a premium (at least 50% of HFO price).
Source: GL research. The analysis excludes inflation effects.
The “zero-emission perspective”, from a vision to a real perspective / the energy turnaround at sea | 2013-10-11 | No. 3
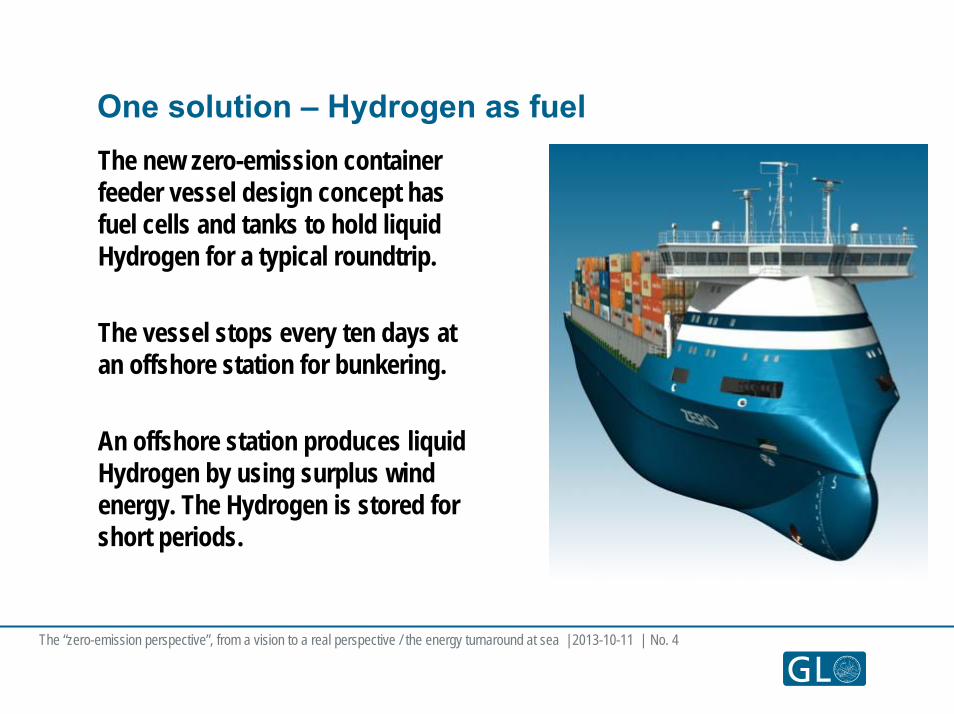
One solution – Hydrogen as fuelThe new zero-emission container feeder vessel design concept has fuel cells and tanks to hold liquid Hydrogen for a typical roundtrip.
The vessel stops every ten days at an offshore station for bunkering.
An offshore station produces liquid Hydrogen by using surplus wind energy. The Hydrogen is stored for short periods.
The “zero-emission perspective”, from a vision to a real perspective / the energy turnaround at sea | 2013-10-11 | No. 4
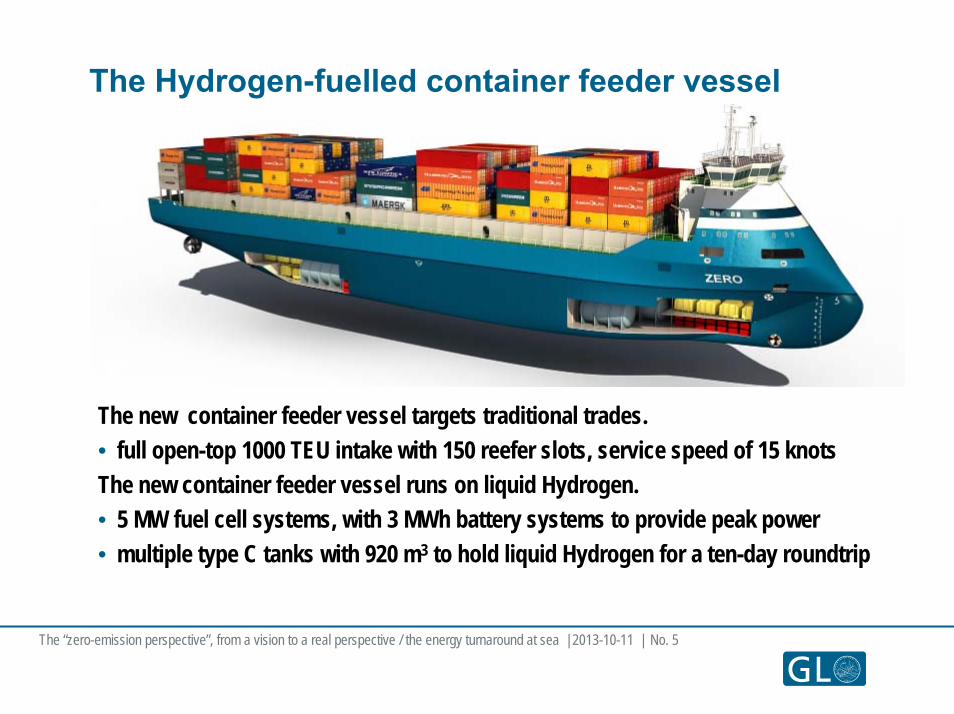
The Hydrogen-fuelled container feeder vessel
The new container feeder vessel targets traditional trades. • full open-top 1000 TEU intake with 150 reefer slots, service speed of 15 knotsThe new container feeder vessel runs on liquid Hydrogen. • 5 MW fuel cell systems, with 3 MWh battery systems to provide peak power• multiple type C tanks with 920 m3 to hold liquid Hydrogen for a ten-day roundtrip
The “zero-emission perspective”, from a vision to a real perspective / the energy turnaround at sea | 2013-10-11 | No. 5
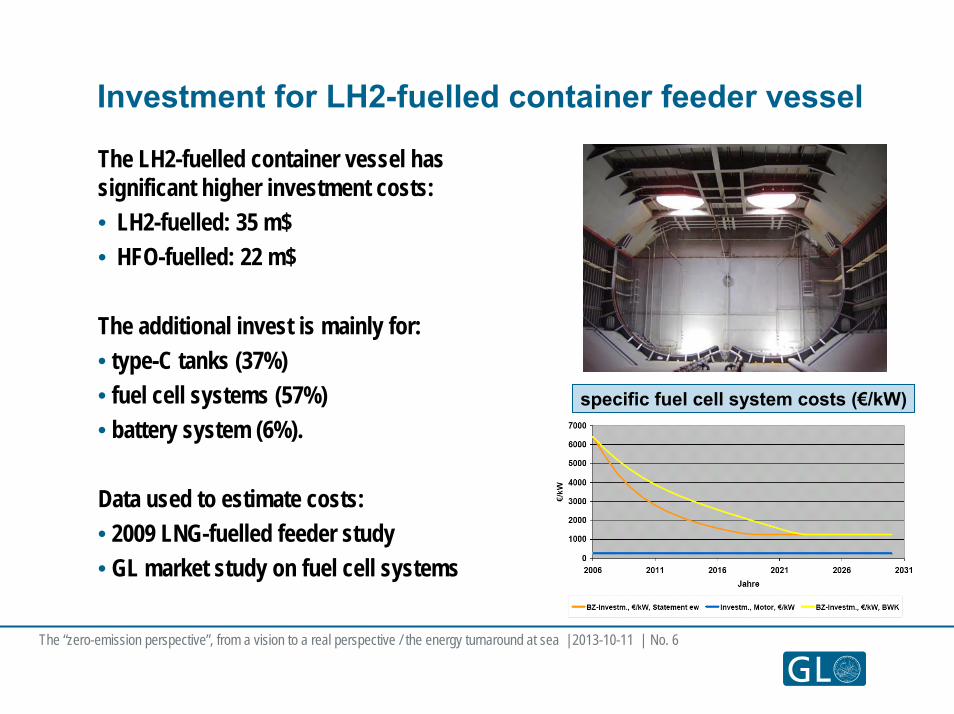
Investment for LH2-fuelled container feeder vessel
The LH2-fuelled container vessel has significant higher investment costs:• LH2-fuelled: 35 m$• HFO-fuelled: 22 m$
The additional invest is mainly for:• type-C tanks (37%)• fuel cell systems (57%) • battery system (6%).
Data used to estimate costs:• 2009 LNG-fuelled feeder study • GL market study on fuel cell systems
The “zero-emission perspective”, from a vision to a real perspective / the energy turnaround at sea | 2013-10-11 | No. 6
specific fuel cell system costs (€/kW)
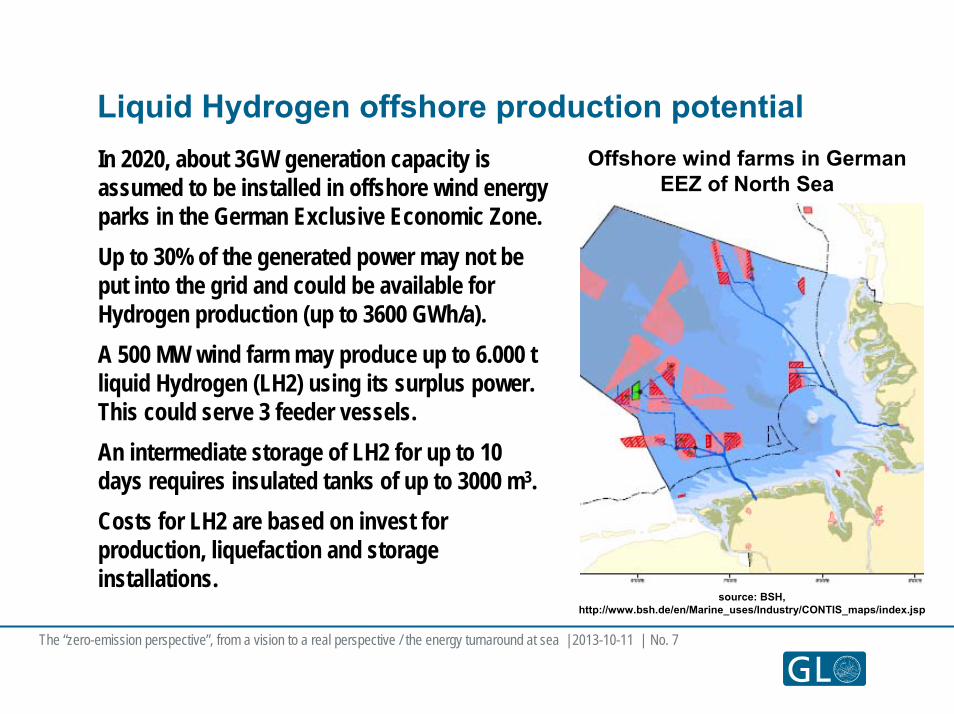
Liquid Hydrogen offshore production potentialIn 2020, about 3GW generation capacity is assumed to be installed in offshore wind energy parks in the German Exclusive Economic Zone.Up to 30% of the generated power may not be put into the grid and could be available for Hydrogen production (up to 3600 GWh/a).A 500 MW wind farm may produce up to 6.000 t liquid Hydrogen (LH2) using its surplus power. This could serve 3 feeder vessels.An intermediate storage of LH2 for up to 10 days requires insulated tanks of up to 3000 m3.Costs for LH2 are based on invest for production, liquefaction and storage installations.
Offshore wind farms in German EEZ of North Sea
source: BSH, http://www.bsh.de/en/Marine_uses/Industry/CONTIS_maps/index.jsp
The “zero-emission perspective”, from a vision to a real perspective / the energy turnaround at sea | 2013-10-11 | No. 7
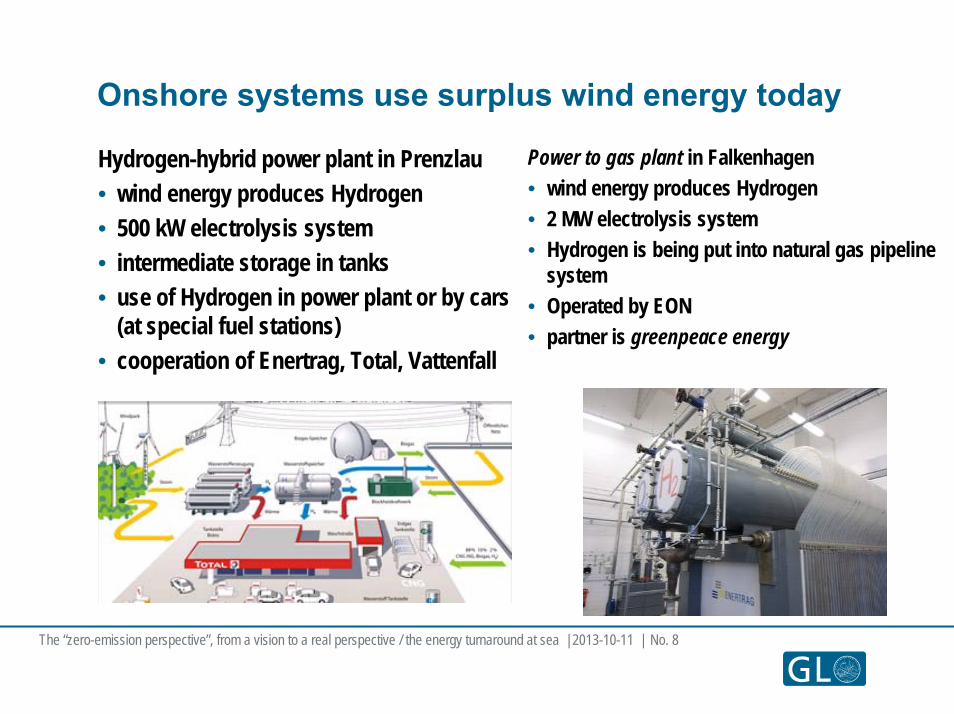
Onshore systems use surplus wind energy today
Hydrogen-hybrid power plant in Prenzlau• wind energy produces Hydrogen• 500 kW electrolysis system• intermediate storage in tanks• use of Hydrogen in power plant or by cars
(at special fuel stations)• cooperation of Enertrag, Total, Vattenfall
Power to gas plant in Falkenhagen• wind energy produces Hydrogen• 2 MW electrolysis system• Hydrogen is being put into natural gas pipeline
system • Operated by EON• partner is greenpeace energy
The “zero-emission perspective”, from a vision to a real perspective / the energy turnaround at sea | 2013-10-11 | No. 8
The “zero-emission perspective”, from a vision to a real perspective / the energy turnaround at sea | 2013-10-11 | No. 9
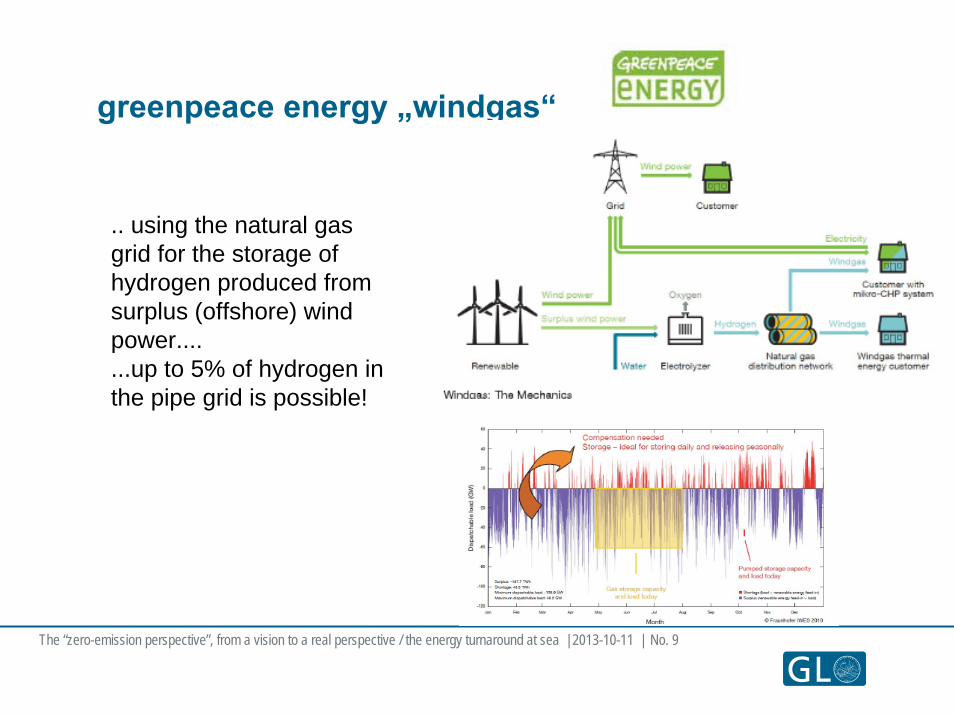
greenpeace energy „windgas“
.. using the natural gas grid for the storage of hydrogen produced fromsurplus (offshore) wind power.......up to 5% of hydrogen in the pipe grid is possible!
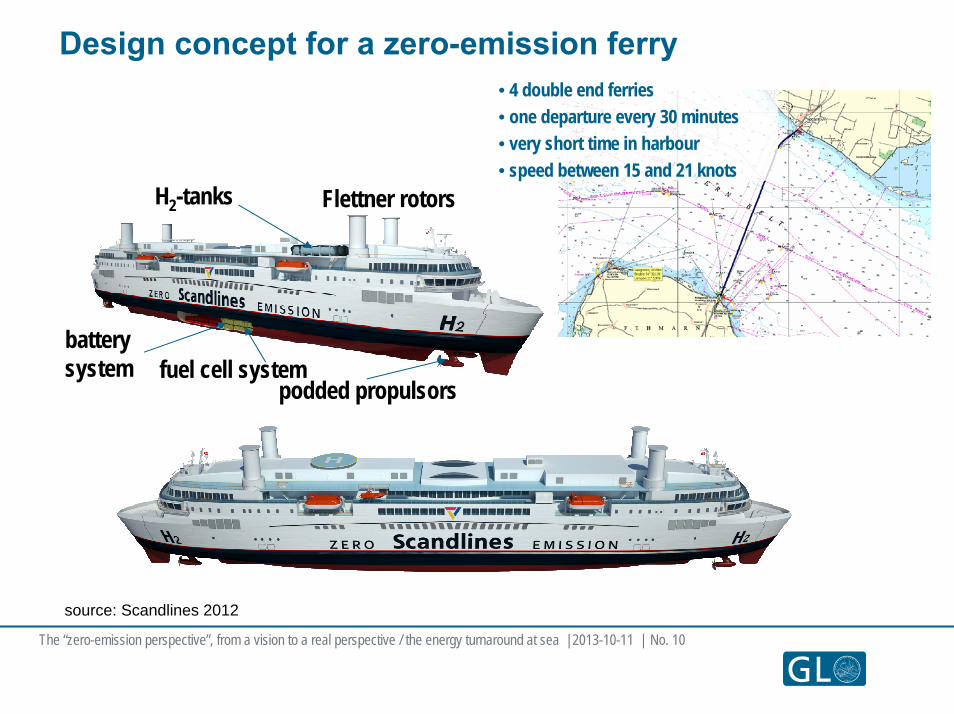
Design concept for a zero-emission ferry
batterysystem fuel cell system
H2-tanks Flettner rotors
podded propulsors
source: Scandlines 2012
• 4 double end ferries• one departure every 30 minutes• very short time in harbour• speed between 15 and 21 knots
The “zero-emission perspective”, from a vision to a real perspective / the energy turnaround at sea | 2013-10-11 | No. 10
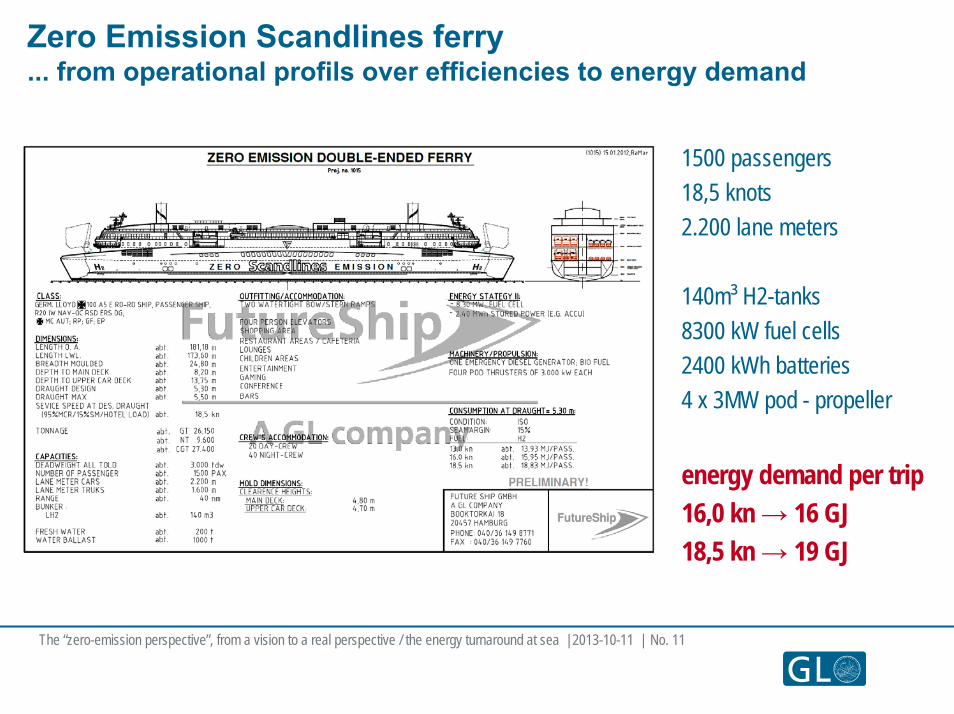
Zero Emission Scandlines ferry... from operational profils over efficiencies to energy demand
1500 passengers18,5 knots2.200 lane meters
140m³ H2-tanks8300 kW fuel cells2400 kWh batteries4 x 3MW pod - propeller
energy demand per trip16,0 kn → 16 GJ18,5 kn → 19 GJ
The “zero-emission perspective”, from a vision to a real perspective / the energy turnaround at sea | 2013-10-11 | No. 11
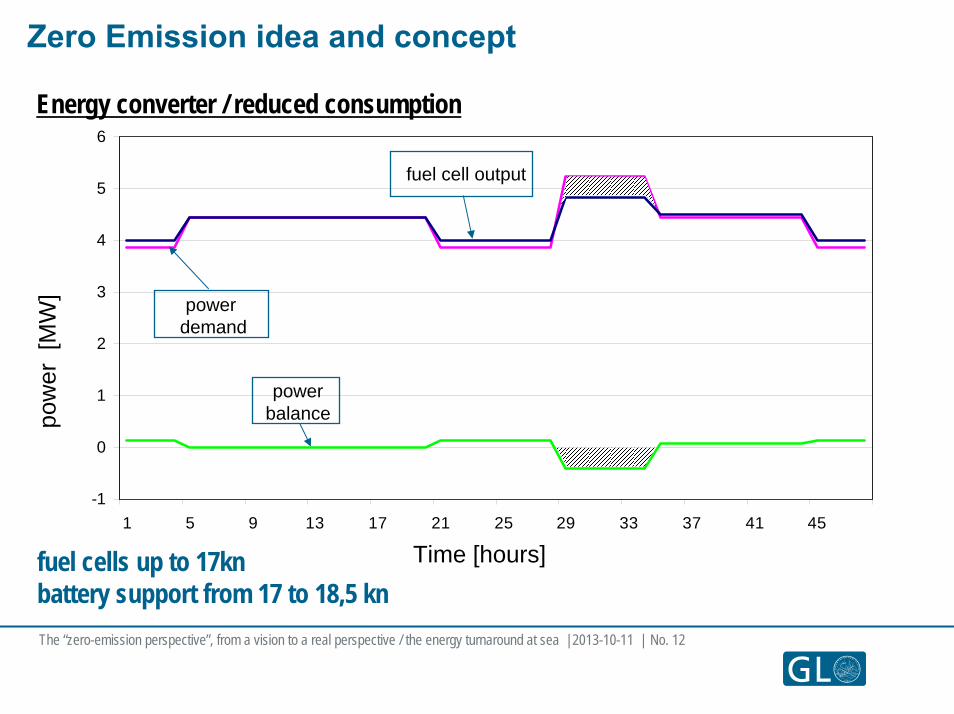
Zero Emission idea and concept
-1
0
1
2
3
4
5
6
1 5 9 13 17 21 25 29 33 37 41 45
Energy converter / reduced consumption
powerbalance
powerdemand
fuel cell output
fuel cells up to 17knbattery support from 17 to 18,5 kn
pow
er [
MW
]
Time [hours]
The “zero-emission perspective”, from a vision to a real perspective / the energy turnaround at sea | 2013-10-11 | No. 12
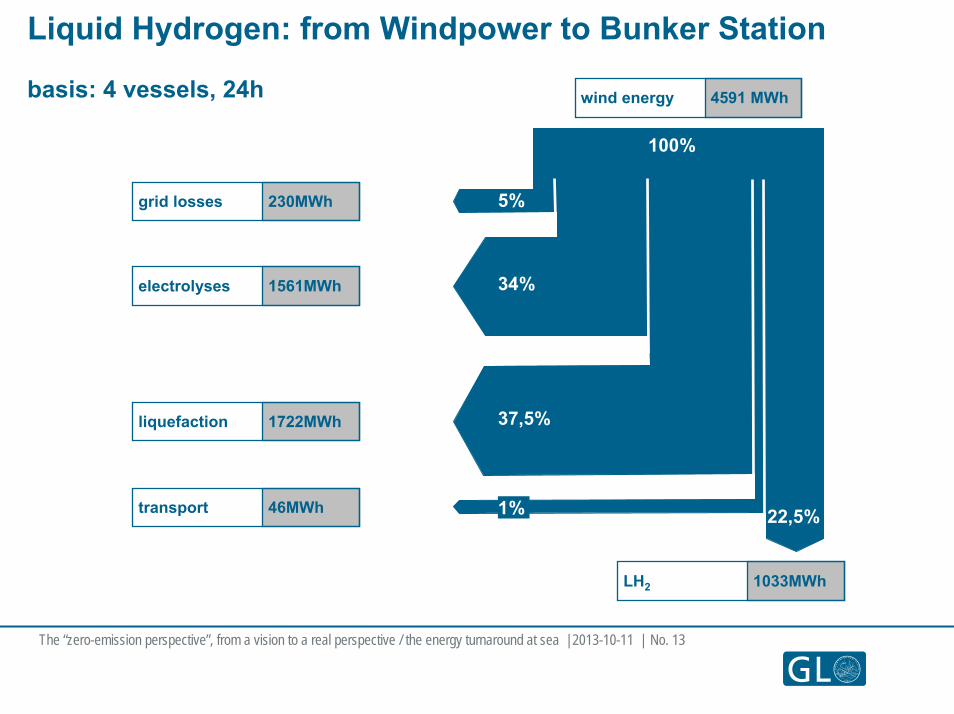
Liquid Hydrogen: from Windpower to Bunker Station
basis: 4 vessels, 24h 4591 MWhwind energy
100%
5%
34%
37,5%
1% 22,5%
230MWhgrid losses
1561MWhelectrolyses
1722MWhliquefaction
46MWhtransport
1033MWhLH2
The “zero-emission perspective”, from a vision to a real perspective / the energy turnaround at sea | 2013-10-11 | No. 13
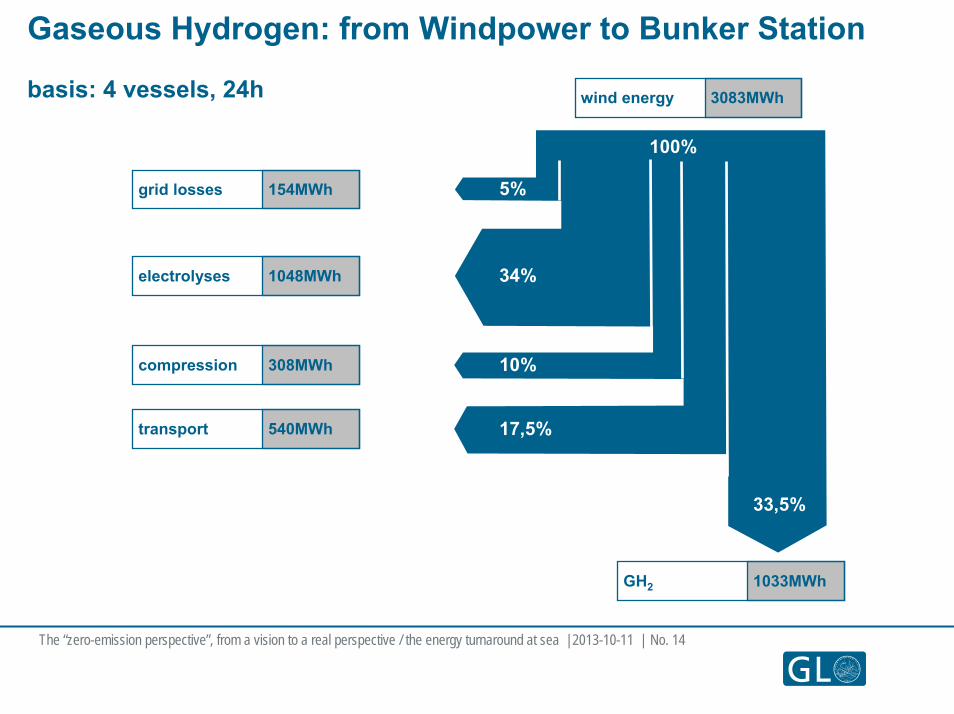
Gaseous Hydrogen: from Windpower to Bunker Station
basis: 4 vessels, 24h 3083MWhwind energy
34%
10%
17,5%
33,5%
100%
5%154MWhgrid losses
1048MWhelectrolyses
308MWhcompression
540MWhtransport
1033MWhGH2
The “zero-emission perspective”, from a vision to a real perspective / the energy turnaround at sea | 2013-10-11 | No. 14
Global Remarks
Hydrogen system energy efficiencies highly disputed in a number of sources.
The likely cause is a combination of aging results, varied assumptions, and the application of different
terminologies (e.g. electrolysis versus electrolyser system).
The following key parameter require thorough analysis BEFOREHAND as they have a significant
impact on the overall energy requirement:
1) feed water supply (treatment and logistics)
2) further use of excess heat from electrolysis
3) type of electrolysis system (incl. input pressure, arrangement (modular, central))
4) liquefaction cycle arrangement
5) pipeline dimension, pressure level and distance
The “zero-emission perspective”, from a vision to a real perspective / the energy turnaround at sea | 2013-10-11 | No. 15
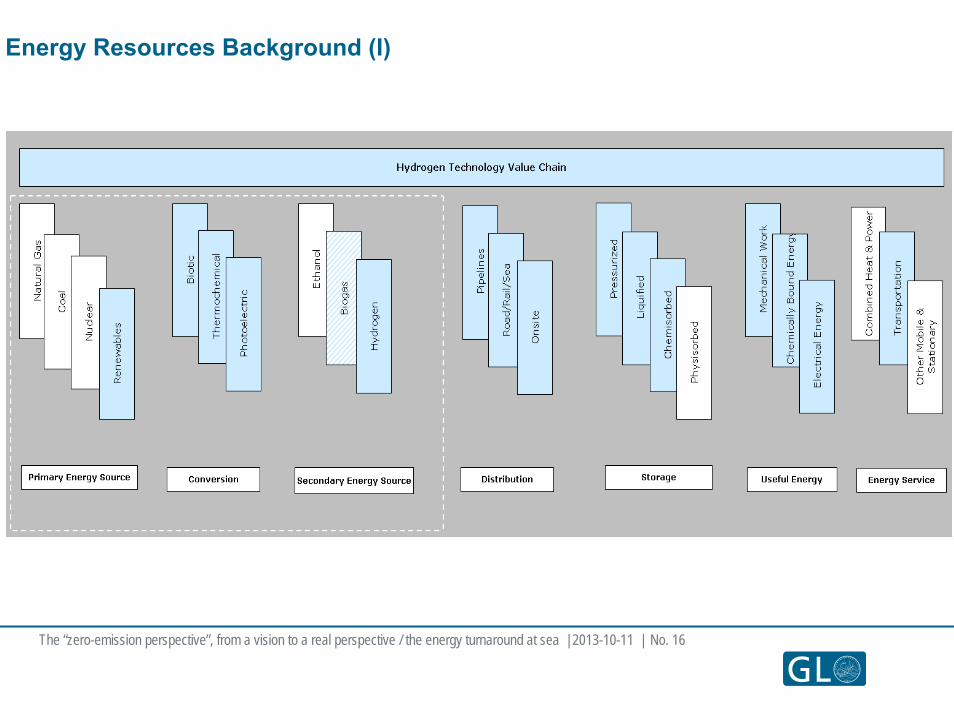
Energy Resources Background (I)
The “zero-emission perspective”, from a vision to a real perspective / the energy turnaround at sea | 2013-10-11 | No. 16

Will a LH2-fuelled ship be competitive?
Annual cost for container feeder vessel
02468
1012141618
250 500 750 1000 1250 1500 1750 2000 2250 2500
$/t MGO
m$
MGO-fuelled LH2-fuelled (lower estimate) LH2-fuelled (upper estimate)
MGO historic high: 1319 $/t, June 2008
Annual cost include capital costs, other operating costs and fuel costs.
MGO average for 2000: 252 $/t
MGO today: 950 $/t
The “zero-emission perspective”, from a vision to a real perspective / the energy turnaround at sea | 2013-10-11 | No. 17

conclusion & outlook
A vision for a zero-emission container feeder vessel was created. The vessel will run on liquid Hydrogen produced by offshore wind farms’ surplus energy.The LH2-fuelled container feeder vessel may become economically attractive when MGO prices increase beyond 2.000 $/t. A design concept for a zero-emission ferry was developed with Scandlines.
GL expects first dedicated zero-emission ships on short-sea routes.
The “zero-emission perspective”, from a vision to a real perspective / the energy turnaround at sea | 2013-10-11 | No. 18