theoretical assessment of the transmission dynamics...
TRANSCRIPT

Applied Mathematics, 2013, 4, 387-401 http://dx.doi.org/10.4236/am.2013.42059 Published Online February 2013 (http://www.scirp.org/journal/am)
Theoretical Assessment of the Transmission Dynamics of Leprosy
Edward T. Chiyaka, Tazvitya Muyendesi, Philimon Nyamugure, Farikayi K. Mutasa Modelling Biomedical Systems Research Group, Department of Applied Mathematics,
National University of Science and Technology, Bulawayo, Zimbabwe Email: [email protected], [email protected], [email protected], [email protected]
Received September 7, 2012; revised January 10, 2013; accepted January 17, 2013
ABSTRACT
Leprosy is a communicable disease which can cause hideous deformities to the afflicted and social stigmatization to them and their families. The continued high endemicity of leprosy in pockets of Sub-Saharan Africa is a source of baf-flement to researchers. In this paper, we investigate non-compliant behavior by patients on treatment and possible in-adequacy of the prescribed treatments as the reason for the persistence of the disease in the region. We construct theo-retical, deterministic mathematical models of the transmission dynamics of leprosy. These models are modified to en-capsulate non-compliance and inadequate treatment. The models are then analyzed to gain insight into the qualitative features of the equilibrium states, which enable us to determine the basic reproduction number. We also employ ana-lytical and numerical techniques to investigate the impact of non-compliance and inadequate treatment on the transmis-sion dynamics of the disease. Our results show that, as long as there is treatment, leprosy will eventually be eliminated from the region and that the disposition under investigation only serves to slow the rate at which the disease is eradi-cated. Keywords: Leprosy; Mycobacterium leprae; Mathematical Model; Multibacillary
1. Introduction
Leprosy, under guidelines set by the World Health Organization (WHO), has been successfully eliminated elsewhere. Most previously highly endemic countries have now reached elimination (defined as a registered prevalence rate of less than one case per 10,000 po- pulations). At the beginning of 2009, pockets of high endemicity still remained in Angola, Central African Re- public, Democratic Republic of Congo, India, Mada- gascar, Mozambique, Nepal, United Republic of Tanza- nia, and Brazil. These 9 countries account for 88% of all new cases. There were 213,036 new cases recorded from 121 countries at the beginning of 2009 [1]. Leprosy or Hansen’s disease is a chronic disease which has plagued mankind for at least 4000 years. It is caused by the pa- thogen, Mycobacterium leprae (M. leprae). Leprosy is principally a granulomatous disease of the peripheral nerves and mucosa of the upper respiratory tract. Skin lesions are the primary external sign. Unless properly treated, leprosy can be relentlessly progressive, causing permanent damage to the skin, nerves, limbs and eyes. The victims often die of some other disease and only a few live until they succumb to the wasting effects of leprosy itself. The age-old social stigma associated with
the advanced form of leprosy lingers in many areas, and remains a major obstacle to self-reporting and early treatment.
Leprosy is a communicable, slow progressing disease which is transmitted by contact between infected and healthy persons. Nasal secretions of untreated cases are the main exit route of the pathogen which is believed to gain entrance into the susceptible body through mem- branes lining the nose or through breaks in the skin. Living in close proximity with an infected individual seems necessary for one to contact the disease. Most in- dividuals exposed to M. leprae do not develop clinical features; the infection quietly dies out. If the infection progresses, the disease manifests in two extreme forms; tuberculoid and lepromatus leprosy. Effective chemo- therapy treatments are available for all manifestations of leprosy. When a patient begins treatment, he/she ceases to be infective in as little as 72 hours and can gradually resume normal life while continuing the chemotherapy treatment for periods of 6, 12 or 24 months depending on the type of manifestation. Reversal reactions, absen- teeism and non-compliance are some factors that com- plicate the curing process of any particular disease. If the disease is not treated properly, a relapse is imminent and the disease can be perilously progressive. A relapse is
Copyright © 2013 SciRes. AM

E. T. CHIYAKA ET AL. 388
defined as the recurrence of the disease after completion of the treatment [2].
2. Transmission and Pathogenesis
Nasal secretions of untreated lepromatus patients are teeming with bacilli and constitute the main source of infection, which occurs when the M. leprae invades the susceptible body via the nasal mucosa and spreads to the peripheral nerve Schwann cells and skin macrophages. M. leprae is also suspected to invade the body via broken skin. The skin of lepromatous patients is a possible exit route for the pathogen: lepromatous cases show large numbers of M. leprae deep down in the dermis. The pathogen is known to be a stable and hardy organism which can survive in the environment for up to 5 months [3,4]. Leprosy is not hereditary but in few cases, infec- tion actually takes place through the placenta. M. leprae can also be transmitted from mother to child via breast milk. For one to contract the disease, frequent and close contact with an infected person has been shown to be necessary. Since a contagious individual may infect close contacts rapidly, opportunities to transmit M. leprae may decrease with longer duration of the disease. Only small minorities of the exposed develop leprosy; the majority will have a sub-clinical infection and presumably de- velop protective immunity [3]. It is estimated that 95% of the exposed are able to clear the infection this way [4].
Transmission studies are difficult because of the uni- que biology of the M. leprae and long incubation period of the disease. In leprosy, both the reference points for measuring the incubation period and the times of infec- tion and onset of disease are difficult to define; the for- mer because of the lack of adequate immunological tools and the latter because of the disease’s slow onset. The incubation period is estimated to be between 2 - 5 years and 8 - 12 years for tuberculoid and lepromatus cases respectively [4]. The minimum incubation period report- ed is as short as a few weeks and this is based on the very occasional occurrence of leprosy among young infants. One of the greatest uncertainties in leprosy studies is that individuals incubating the disease may already harbor many bacilli, and it is possible that these individuals already transmit M. leprae to others long before the onset of the disease, given its long incubation period. Leprosy has an insidious onset and the source of infection in an infected individual is rarely identified. Studies detecting M. leprae deoxyribonucleic acid (DNA) by polymerase chain reaction (PCR) in nasal secretions have shown that it is carried by normal individuals and contacts in ende- mic countries (in Ethiopia, 6% of the population, in 1998) [3]. In leprosy, the clinical features are determined by the host’s immune response. In those infected who do de- velop the disease, a spectrum of immune responses is
seen. At one end of the spectrum, characterized by strong cell mediated immunity towards M. leprae, is Tuber- culoid leprosy. These patients have low bacillary loads. At the other pole is lepromatous leprosy, which is cha- racterized by the absence of a cell mediated immune response and high bacillary loads in its cases. If Tu- berculoid leprosy is left untreated it eventually resolves spontaneously, or if the patient has a less vigorous cel- lular immune response to the M. leprae bacteria, the disease may progress to a borderline leprosy. Lepromatus leprosy is the most severe; it is relentlessly progressive and unlike Tuberculoid leprosy which may or may not be infectious, its cases are definitely so. This form of le- prosy is responsible for the gross deformities associated with the disease.
Worldwide, 1 - 2 million persons are permanently disabled as a result of Hansen’s disease [5]. Between these two extremities, there are borderline patients with varying immunological responses and bacterial loads. Borderline patients are immunologically unstable and most progress towards lepromatus leprosy. They are also at risk of violent reversal reactions. These are delayed hypersensitivity reactions against M. leprae antigens and the result is elimination of mycobacteria which is achiev- ed at the expense of severe local tissue damage, in par- ticular to nerves. Nerve involvement is important in leprosy. Peripheral nerve damage occurs across the spec- trum and it can occur before, during or after treatment. In an Ethiopian study, 55% of patients had some degree of nerve function impairment at diagnosis [3]. Reversal reactions certainly complicate the nerve conditions and may lead to transient paralysis of the nerves. Delay in diagnosis may result in permanent nerve damage. In Nigeria 68% of patients had delays of more than a year before starting treatment. Of these, 37% had consulted folk healers who advised them not to seek medical help [3].
3. Model Formulation
We propose a deterministic SEIR model with respect to paucibacillary leprosy (PB) and an SEI model with re- spect to multibacillary leprosy (MB) when no treatment and control measures are put in place. The model divides the population concerned into the following five, time dependent subgroups or compartments:
S t —susceptible individuals who are yet to come into contact with the infection.
E t —individuals who have been infected by leprosy but not yet infectious nor showing any symptoms, P t — infectious class of individuals whose infection has progressed to paucibacillary leprosy, M t — infectious class of individuals whose infection has progressed to multibacillary leprosy, and R t —non-infectious group
Copyright © 2013 SciRes. AM
E. T. CHIYAKA ET AL.
Copyright © 2013 SciRes. AM
389
of people who have successfully recovered from the disease and are immune to re-infections.
Individuals move from one class to the other as their status with the disease evolves. Let be the total number of people in the population at any time , then:
N tt
M
N and
P
N
represent the probability that a randomly selected in- dividual has multibacillary and paucibacillary leprosy, respectively. Let the probability of infecting a susceptible during interaction be M and P for MB and PB cases, respectively. The probability of a susceptible being infected by an MB and a PB case is
M M
N
and PP
N
,
correspondingly. The force of infection for the disease can be expressed as
.M PM PS
N N
Infection is transmitted to the susceptible persons through successful contacts with either a paucibacillary or multibacillary patient. Class is increased by graduands from the susceptible class and decreases by natural death, progression of the infections to either PB or MB leprosy and by subsequent recoveries by some of its members. For patients who move to class
E t
M t , they either die naturally or due to leprosy related com- plications or eventually succumb to the wasting effects of the disease itself. Once an individual has progressed to compartment he/she eventually recovers and moves to class where he/she is immune to rein- fections and is non-infectious. Assumptions of the model are:
,P t R t
The population is homogenous and each individual is equally likely to interact with the other.
Transmission follows the mass action principle; if
I t is the number of infectious individuals and N t and S t have their usual meaning, then the
standard incidence per unit time is of the form i SI
N
,
for ,i M P . Transmission is only through interactions between the
susceptible person and either a PB or MB individual. Patients who recover from the disease become im-
mune to re-infections and are no longer infectious. No individual is naturally or artificially immune to
the disease, immunity is only acquired through recovery from infection.
Paucibacillary is not fatal, it is self limiting and all its cases eventually recover.
Multibacillary is relentlessly progressive and is fatal. MB patients are not isolated thus continue to be
infectious until they pass away. There is no migration, new recruits enter the
population through birth and the population decreases by natural or disease induced mortality.
Parameters: M —the probability of an MB case infecting a susceptible during interaction. p —the pro- bability of an PB case infecting a susceptible during interaction. M —the rate of progression from E t to multibacillary leprosy. p —the rate of progression from E t to paucibacillary leprosy. E —the recov- ery rate for the asymptomatic patients in E t . p — the recovery rate for the PB patients. —the natural death rate, —disease induced mortality rate for MB patients, and —birth rate.
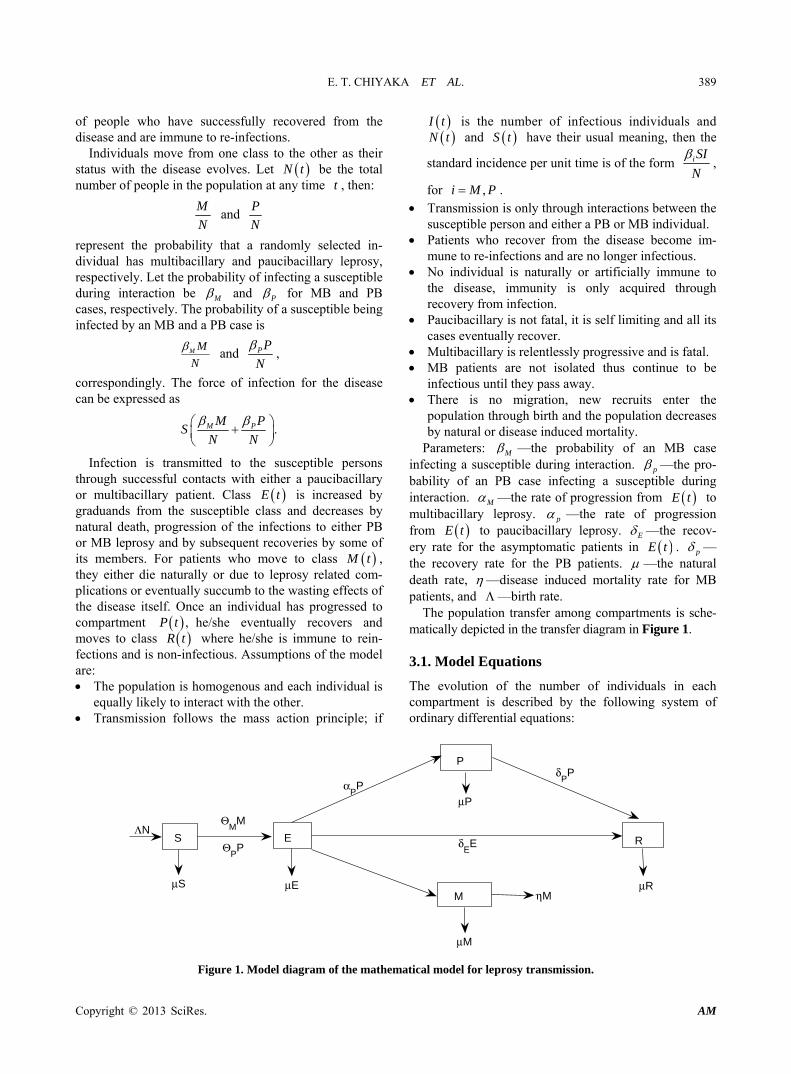
The population transfer among compartments is sche- matically depicted in the transfer diagram in Figure 1.
3.1. Model Equations
The evolution of the number of individuals in each compartment is described by the following system of ordinary differential equations:
ΛN
μS
ΘM
M
ΘPP
E
P
R
MμE
μM
ηMμR
δPP
μPα
PP
δEES
Figure 1. Model diagram of the mathematical model for leprosy transmission.

E. T. CHIYAKA ET AL. 390
d,
d
d,
dd
,d
d,
dd
.d
p M
p MM p E
M
p p
E p
SP SMSN S
t N NSP SME
Et N NM
E Mt
PE P
tR
E P Rt
(1)
Initial conditions of system (1) are
0 0 0 00 , 0 , 0 , 0 , 0S S E E M M P P R R 0
N
and , where 0 0 and are all greater or equal to zero and
00N 0 0 0, , , ,S E M P R 0N
.N t S t E t M t P t R t
3.2. Positivity of Solutions
The variables in (1) represent sub-populations of indi- viduals and therefore, should be positive or zero for all
. If this condition is not met, the model should be discarded as it violates a basic aspect of scientific reality. Let be an -dimensional space, for . If
0t
n n 1n is a subset of , it is said to be positive invariant with respect to a system of ordinary differential equations if a trajectory that starts in remains there forever. Posi- tive invariance of the non-negative orthant of 5
n
for
system (1) is assured if no trajectory can leave by crossing through one of its faces. The following theorem ensures that system (1) is well posed such that a solution with a non-negative initial point remains non-negative for . 0t
Theorem 1 The solutions of (1) are strictly positive for all and for all sets of initial conditions 0t
0 0 and with strictly positive compo- nents.
0 0, , ,S E M P 0R
Proof. We need to show that if a solution starts from a strictly positive point, the solution is strictly positive for
. To see this strict positivity, we proceed as follows: 0t From the first equation, since 0N , we have
,M PS S t
where
and .M PM P
M P
N N
After integrating, we obtain;
0
d
0e 0
t
M P t
S t S
.
,
.
Similar analysis for the second and third equation
yields;
0e 0M P E tE t E
and
0e 0tM t M
Analyzing the last two equations also shows that the variables P t and R t are also positive. Hence, we conclude that solutions , , ,S t E t M t P t and R t are always positive for all . □ 0t
3.3. Equilibrium States
The equilibrium states for the basic model are found by setting the right hand side of system (1) equal to zero. The model admits two equilibrium points, the disease free and the endemic equilibrium states.
3.3.1. Disease Free Equilibrium State At this steady state, there are no individuals exposed to M. leprae, no one is afflicted or has recovered from the disease, hence there is no infection in the population. Thus system (1) has a disease free equilibrium (DFE)
1 1 1 1 1 1, , , ,
,0,0,0,0 .
S E M P R
N
The stability of this steady state can be analyzed through the determination of the basic reproduction number, . 0R
3.3.2. Basic Reproduction Number The basic reproduction number, 0 , is defined as the average number of secondary infections produced by one primary infection in a wholly susceptible population during his/her entire life as infectious [6]. If 0
R
1R , then on average an infected individual produces less than one new infected individual over the course of its infectious period, and the infection cannot grow. Conversely, if
0 , then each infected individual produces, on average, more than one new infection, and the disease can invade the population [7]. In this study, 0 refers to the average number of secondary M. leprae infections produced by either a typical multibacillary or a pau- cibacillary patient in a totally susceptible population during his/her course of infectiousness. To calculate 0 , we follow the method outlined by Wartmough, 2008 [8]. We find our basic reproduction number to be
1R
R
R
0
1.p pM M
M p E p
R
We can express as the sum of two quantities, 0R
0 M pR R R , where
Copyright © 2013 SciRes. AM

E. T. CHIYAKA ET AL. 391
M M
M
M p E
R
and
.p p
p
M p E p
R
The two quantities represent the reproductive numbers for the multibacillary and for the paucibacillary, respec- tively. On average, in a totally susceptible population, a primary MB patient produces MR new M. leprae in- fections whilst a PB index case generates pR secondary M. leprae infections in their lifetimes as infectious. To keep leprosy under control, the numerical value of 0 should be below unity. From the analysis of 0 we can make a few general deductions and recommendations concerning transmission of leprosy.
RR
To assess the effect of the rates of progression from latent infection to either MB or PB, we dif- nferentiate
E t
MR with respect to M and pR with res- pect to p . This gives;
2
0
M p EM
M M p E
R
and
2
0.
p p M E
p M p E p
R
We note that rates of progression from latent infection to infectious leprosy significantly contributes to trans- mission of the disease. An effective control measure would be to treat the infection still in the latent stage; however, no suitable method for diagnosis of sub-clinical leprosy exists, as such this control measure is infeasible at present. We also note that the probability of a suc- cessful infection during an interaction between an infec- tious person ( M and p ) and a susceptible individual has a direct effect on 0 . Hence, education of the masses about leprosy transmission would greatly reduce this probability.
R
3.3.3. Endemic Equilibrium State When the conditions for the global asymptotic stability of the DFE are not met, system (1) admits a unique endemic equilibrium state which exists if and only if
. The endemic equilibrium is given by 0 1R
, , , ,e e e e e eS E M P R
where
,
,
,
,
,
e
p p M M
e
p p M M
eM
p p M M
ep
p p M M
p peE
p p M M
NmyzS
z y
N N yzE
m z y
yM N
zm z y
zP N
my z y
N yzR
m z y y
(2)
where
,p M E pm y and z .
This steady state is subject to the condition that
p p M M
myz
z y
or
S
N .
It can also be shown that this steady state is bio- logically sensible if .
3.3.4. Existence of the Endemic Equilibrium To show that the endemic equilibrium indeed exists for system (1) if 0 , we first express the equilibrium point in terms of
1R eM as follows:
,
,
,
.
ee e
M
ee e
M
epe e
M
p pe e eE
M
N mzMS M
zME M
zMP M
y
zR M M
y
(3)
After substituting the expressions for and in the second equation of (1), we get
, ,e e eS E PeR
0 1 0.e eM M A A (4)
where 00
MNA
pR
and 1 0 1A R
.
Solving equation (4), we get as one of the solutions 0eM which corresponds to the disease free equi-
librium. The other solution is 0 1eM A A . This solution
exists for 1 since it is clear that 0 . Since 0A 0A , then 1 0 1A R and so 1 if 0 . The
result of the existence of the endemic equilibrium for model system (1) can be summarized by the following lemma.
0A 1R
Copyright © 2013 SciRes. AM

E. T. CHIYAKA ET AL. 392
Lemma 1 The model system (1) always has a disease free equilibrium for and a unique endemic equi- librium exists if .
0 1R 10R
3.3.5. Local Stability of the Endemic Equilibrium The standard technique of determining the local stability of the endemic equilibrium is by linearization about the steady state and subsequent application of the Routh- Hurwitz analysis. Such an approach would be mathe- matically cumbersome for system (1). We therefore re- sort to the Center Manifold Theory as presented in Theorem 4.1 [Castillo-Chavez and Song, 2004][9], to establish the local asymptotic stability of the endemic equilibrium [10]. In order to apply the Center Manifold Theory, we make the following changes of variables:
Let
1 2
4 5
, ,
,
S t x E t x M t x
P t x R t x
3,
such that
5
1i
i
N t x
.
We now use the vector notation
T
1 2 3 4 5, , , ,X x x x x x
and model system (1) can now be expressed in the form 1 2 3 4 5, , , ,X F f f f f f such that:
51 41 3
1 1 5 51
1 1
1 41 32 2 5 5
1 1
2
3 3 2 3
4 4 2 4
5 5 2 4 5
,
,
,
,
.
pMi
ii i
i i
pM
i ii i
E M p
M
p p
E p
x xx x1x t f x x
x x
x xx xx t f
x x
x
x t f x x
x t f x x
x t f x x x
(5)
Using the Jacobian matrix of the above system at the disease free equilibrium, we obtain the model repro- duction number
0
1,p pM M
m p E p
R
which is similar to the one we got previously. We choose
M as our bifurcation parameter such that if M , then and if M0 1R then . We consi- der and solve for
0 1R 0 1R M to get:
.
M
m p E p p p
M p
We shall denote 1J by J when M .
The Jacobian matrix J has a simple zero eigen- value, hence the Center Manifold Theory can be used to analyze the dynamics of system (5) near M .
A right eigenvector associated with the zero eigen-
value exists and is given by where T
1 2 3 4 5, , , ,U u u u u u
1 2 2 22
4 2 5 2
, ,
1,and .
p pM M
p
p p pE
p p
u u u u u
u u u u
3 2 ,u
The left eigenvector associated with the zero eigen- value at M is given by
T
1 2 3 4 5, , , ,V v v v v v
where
1 2 2 3 2 4
5
0, , , ,
and 0.
p
p
v v v v v v v
v
2
We now use the following theorem whose proof is found in [9].
Theorem 2 Consider the following general system of ordinary differential equations with a parameter
2d, , : and
dn nx
f x f ft
, (6)
where is an equilibrium of the system, that is 0 0, 0f for all and assume
A1: 0,0 0,0ix
j
fA D f
x
is the linearization
of system (5) around the equilibrium 0 with eva- luated at 0 . Zero is a simple eigenvalue of A and other eigenvalues of A have negative real parts;
A2: Matrix A has a right eigenvector and a left eigenvector corresponding to the zero eigenvalue.
uv
Let kf be the component of thk f and
2
, , 1
2
, 1
0,0 ,
0,0 .
nk
k i jk i j i j
nk
k ik i i
fa v u u
x x
fb v u
x
(7)
The local dynamics of (5) around are totally go- 0
Copyright © 2013 SciRes. AM

E. T. CHIYAKA ET AL. 393
verned by and . a0,a b
b1) . When 0 0 with 1 , is
locally asymptotically stable, and there exists a positive unstable equilibrium; when
0
0 1 , is unstable and there exists a negative and locally asymptotically stable equilibrium;
0
2) . When 0,a b 0 0 with 1 , is un- stable; when
00 1 , is locally asymptotically
stable, and there exists a positive unstable equilibrium; 0
3) . When 0, 0a b 0 with 1 , is un- stable, and there exists a locally asymptotically stable negative equilibrium; when
0
0 1 , is stable and a positive unstable equilibrium appears;
0
4) . When 0,a b 0 changes from negative to positive, changes its stability from stable to unstable. Correspondingly a negative unstable equilibrium be- comes positive and locally asymptotically stable.
0
3.3.6. Computations of a and b For system (5), the associated non-zero partial deriva- tives of F at the disease free equilibrium are given by
2 22 2
2 3 3 5 1
2 22 2
2 4 4 5 1
2 22 2
23 4 4 1
2 22 2
24 33 1 1
,
,
,
22, .
p
p
p
f f
x x x x x
f f
x x x x x
f f
x x x x
f f
x xx x x
(8)
Since all non-zero partial derivatives of f are ne- gative and all iu for 0 2,3, 4i and 5, it follows from the above expressions that . 0a
For the sign of b, it is associated with the following non-zero partial derivatives of f ,
22
3
1.f
x
We thus have . 2 3 0u b v
Thus, and . Using Theorem 2, item (4), we have established the following result which only holds for but close to 1:
0
a
R
0b
0
Theorem 3 The unique endemic equilibrium guarante- ed by Theorem 2 is locally asymptotically stable for near 1.
1
0R
4. Model with Treatment
The first modern drug used in the chemotherapy of leprosy was Dapsone, in 1940, as monotherapy. Dapsone is only weakly bactericidal against M. leprae and it was
considered necessary for patients to take the drug in- definitely. Evolving drug resistance and treatment fail- ures when Dapsone was used led to the world’s only known anti-leprosy drug becoming virtually useless in the 1960s. Soon, it became clear that Dapsone resistance was on account of use of the drug as monotherapy. Worldwide increase in Dapsone resistance and the availability of equally effective drugs—Clofazimine and Rifampicin and from the experience in the therapy of tuberculosis (TB), led to the concept of multi-drug therapy (MDT) as a polychemotherapy for leprosy. Based on the theoretical considerations, recommenda- tions were made to treat leprosy with multi-drug re- gimens [4,11]. In 1981, multi-drug therapy (MDT) was first recommended by WHO. MDT is comprised of Dapsone, clofazimine and rifampicin, which are bacteri- cidal drugs [12]. Its characteristics are as follows:
1) The regimen includes drugs acting by different mechanisms, in order to prevent the emergence of drug resistance, and to be effective for strains of M. leprae resistant to any one of the three drugs.
2) The duration of MDT is limited in contrast to the lifelong duration of Dapsone monotherapy, to improve patient’s compliance. To make this possible, only bac- tericidal drugs are included as components.
3) Rifampicin is a key component because of its powerful bactericidal effect against M. leprae. It was to be administered only once per month under supervision, to ensure compliance and because of its high cost.
Two common regimens of MDT have been adopted, based on classification of leprosy into Multibacillary (or MB) and Paucibacillary (or PB). MB includes lepro- matus cases and borderline cases associated with high bacillary loads. PB includes tuberculoid patients and borderline cases which are characterized by small bac- terial loads. The first is a 24-month treatment for mul- tibacillary cases using rifampicin, clofazimine, and dapsone. The second is a six-month treatment for pau- cibacillary cases, using rifampicin and dapsone. The duration of MDT for MB patients was shortened to 12 months, in 1998 on the recommendation of WHO. MDT is safe, effective and easily administered [13]. There are virtually no relapses of the disease if treatment is com- pleted and no resistance of the bacillus to MDT has been detected. WHO estimates that early detection and treat- ment with MDT has prevented about four million people from being disabled. This suggests great cost-effec- tiveness of MDT as a health intervention, considering the economic and social loss averted [1]. Reversal reactions always complicate the curing process and WHO has stated that chemotherapy should not be stopped during a reaction. Relapses and persistent infections are not uncommon; they serve to complicate the curing process and extend the period over which an individual is
Copyright © 2013 SciRes. AM
E. T. CHIYAKA ET AL. 394
infectious. In this section, we investigate the situation in which
leprosy patients have access to MDT chemotherapy. MDT is very effective and patients are no longer infec- tious in as little as 72 hours after beginning treatment. In other words, transmission of leprosy is interrupted almost immediately. We aim to examine the ideal situation; one in which all patients are compliant and are put on MDT until completely cured. There are no relapses or recur- rences of the disease. Patients with a high initial bacterial index are treated until they test negative for M. leprae. Individuals who fail to recover from reversal reactions are put on lifelong MDT, thus they continue to be non-infectious even though the bacterium is persisting and can be considered removed.
4.1. The Model
This model divides the population into the following five time dependent compartments; , , ,S t E t M t P t and R t
—all of which are still defined as per the last section but now includes recoveries due to MDT treatment in addition to natural recoveries. Exposed class,
is increased by individuals from the susceptible compartment who contact the disease. The majority of these naturally recover while other infecteds subse- quently progress to either paucibacillary or multibacillary leprosy and the rest die of natural causes. MB patients, (in
R t
E t
M t ) either recover under treatment or pass away due to both natural and disease induced mortality.
4.1.1. Assumptions PB leprosy is not fatal and its cases recover naturally
or due to the treatment. MB patients recover under treatment; however they
are still subject to mortality due to disease related complications.
Patients who recover naturally or under treatment become non-infectious and are immune to re-infec- tions.
From the model (1), assumptions about the method of transmission and homogenous mixing of the population still hold. We also assume that no individual is naturally or artificially immune to the disease, immunity is only acquired through recovery from infection. Again, there is no migration; new recruits enter the population through birth and the population decreases by natural or disease induced mortality. Only two new parameters are included, which are M —the recovery rate for MB patients, which is entirely due to treatment, and p —the recovery rate for PB patients which includes both natural and recoveries under treatment. We retain the rest of the parameters from model (1), and maintain their defini- tions.
d,
d
d,
dd
,d
d,
dd
.d
p M
p MM p E
M M
p p
E M p
SP SMSN S
t N NSP SME
Et N NM
E Mt
PE P
tR
E M P Rt
(9)
Initial conditions for model system (9) are
0 0
0 0
0 , 0 , 0
0 , 0
S S E E M M
P P R R
0 ,
and 00N N ; where and are all greater than zero and
0 0 0 0 0, , , ,S E M P R 0N
.N t S t E t M t P t R t
4.1.2. Effective Reproductive Number To calculate 0T , we follow the method outlined by Wartmough [2008][8]. In our model, we can classify the
R
,E t M t and P t as the disease states. Thus,
0
1.p pM M
TM p E M p
R
0TRR R
can be expressed as the sum of two quantities:
0 0 0T M R P where
0
1 M MM
M p E M
R
and
0
1 p pP
M p E p
R
are the respective effective reproductive numbers for the multibacillary and for the paucibacillary forms of the disease when there is treatment.
4.1.3. Analysis of the Effective Reproductive Number From the analysis of 0T we can make a few general deductions and recommendations concerning transmis- sion of leprosy with MDT treatment.
R
To assess the effect of MDT treatment on the transmission of leprosy, we first differentiate 0MR with respect to the treatment induced recovery rate of MB patients M and also differentiate 0PR with respect to the recovery rate of PB patients P . This gives
0
20M M M
M M
R
m
Copyright © 2013 SciRes. AM

E. T. CHIYAKA ET AL. 395
and
0
20P P P
P P
R
m
.
We can draw the conclusion that MDT chemotherapy has a positive impact on the control of leprosy.
The rate of disease progression to the infectious classes ( M and P ) and probability of a successful interaction between a susceptible and an infectious individual, ( M and P ) have the same effect on
0TR for system (9) as in the analysis of 0R for model system (1). The deductions and recommen- dations we made for system (1) still hold for the model with MDT treatment.
If we remove MDT terms from the expression for
0TR , i.e. if we let M tend to zero and let P to be due to natural recoveries only, then 0TR for system (9) tends to the reproduction rate for model system (1).
5. Model with Inadequate Treatment and Non-Compliance
We consider the situation in which leprosy patients have access to MDT chemotherapy. In the previous section, ideally, patients were adherent, and the treatment re- ceived was assumed adequate. We aim to model the situation in which some of the patients are non-compliant to treatment procedures, some altogether default and for some, the treatment received is inadequate. Treatment received is deemed inadequate when after completion of MDT, there is still bacilli present in the patient’s body, predisposing him/her to a relapse or for some other reason the disease re-manifests after treatment has been completed. We recall that if a patient defaults from treatment, a relapse is almost always imminent; the same applies to non-compliant patients, to a certain extent [14]. Also, when one begins MDT treatment, he/she ceases to be infectious, thus transmission is interrupted almost im- mediately. When the disease relapses, the patient even- tually becomes infectious again. Our study in this section is based on the supposition that, at some point in the asymptomatic phase of the relapse, the patient must be able to communicate the infection.
5.1. Model Formulation
The model we propose introduces infectious carrier states for MB and PB patients in the asymptomatic phase of a relapse, i.e. before leprosy clinically re-manifests. The model classifies the population into seven time de- pendent classes: , and ; which are still defined as per the last section.
,S t E t R t
1M t —Infectious class of persons whose infection has progressed to multibacillary leprosy (MB), 2M t
—Infectious MB patients in the asymptomatic phase of a relapse, 1P t —Infectious class of persons whose infec- tion has progressed to paucibacillary leprosy (PB),
2P t —Infectious PB patients in the asymptomatic phase of a relapse.
Infection is transmitted to the susceptible persons through successful contacts with either a PB or MB pa- tient. These patients must be in the asymptomatic phase of a relapse or whose initial infection or relapse has progressed to either clinical PB or MB. The force of infection can be expressed as
1 = ,M p
where
1 2MM
S M M
N
and
1 2pp
S P P
N
.
M and p represent the probability of an MB or PB patient successfully infecting a susceptible during interaction, respectively.
, 1 are modification parameters which model the fact that individuals in the asymptomatic phase of a relapse are less infectious than those showing symptoms. MB patients, in 1M t either recover under treatment, pass away due to both natural and disease induced mor- tality or move into a carrier state, 2M t before the re- manifestation of MB leprosy. PB patients in the carrier state, 2P t progress to clinical PB.
5.1.1. Assumptions Patients in the asymptomatic phase of a relapse (or in
the carrier state) are able to transmit the disease to susceptible individuals.
Transmission is only through interactions between the susceptible person and either a PB or MB individual who is manifesting the disease or in the asymptomatic stage of a relapse.
Transmission follows the mass action principle. PB leprosy in not fatal and its cases can recover
naturally or due to the treatment. MB patients can recover under treatment; however
they are still subject to mortality due to disease re- lated complications.
A portion of PB and MB patients who have had ac- cess to treatment experience a relapse.
Patients who recover naturally or under treatment become non-infectious and are immune to re-infec- tions.
From model (9), the assumption about the homoge- nous mixing of the population still holds. We also as-
Copyright © 2013 SciRes. AM

E. T. CHIYAKA ET AL. 396
sume that no individual is naturally or artificially im- mune to the disease, immunity is only acquired through recovery from infection. Again, there is no migration; new recruits enter the population through birth and the population decreases by natural or disease induced mortality.
5.1.2. Parameters
M —rate at which MB patients who have accessed treatment move into the asymptomatic phase of a relapse.
p —rate at which PB patients who have accessed treatment move into the asymptomatic phase of a relapse.
M —rate at which patients in the asymptomatic phase of an MB relapse progress to clinical MB.
p —rate at which patients in the asymptomatic phase of a PB relapse progress to clinical PB.
For this model, we retain the rest of the parameters from the model (9) and maintain their definitions.
5.2. Model Equations
1 2 1 2
1 2 1 2
12
21 2
12 1
21 2
1 1
d,
d
d
d
,
d,
d
d,
d
d,
d
d,
d
d.
d
p M
p M
M p E
M M M M
M M
p p p p
p p
E M p
S P P S M MSN S
t N N
S P P S M ME
t N N
E
ME M M
t
MM M
t
PE P P
t
PP P
t
RE M P R
t
1
(10)
Initial conditions for system (10) are
0 0 1 1,0 2
1 1,0 2 2,0 0 0
0 , 0 , 0 , 0
0 , 0 , 0 , and 0
S S E E M M M M
P P P P R R N
2,0 ,
N
where 0 are all non- negative.
0 1,0 2,0 1,0 2,0 0 0, , , , , , , andS E M M P P R N
For model (10),
1
2 1 2 .
N t S t E t M t
M t P t P t R t
5.3. Effective Reproductive Number
The effective reproduction number is
0 1
1
M MM MC
M M
p pp p
p p
pR
mp wp
n
mn rn
We can express as the sum of two quantities, 0CR
0C MR R RP where
1 M MM M
MM M
pR
mp wp
and
1 .
p pp pp
p p
nR
mn rn
MR and pR are the respective reproductive numbers for the multibacillary and for the paucibacillary forms of the disease.
Analysis of C
From the analysis of 0C , we can make a few general deductions and recommendations concerning transmis- sion of leprosy with inadequate MDT treatment and non- compliance.
R0
R
1) To assess the effect of inadequate MDT treatment on transmission of leprosy, we first differentiate MR with respect to M the treatment induced progression rate of MB patients into the carrier state and then dif- ferentiate pR with respect to p . This gives
2
20
M M M M MM
M M M
p wR
mp wp
2
20.
p p p p pp
p p p
n rR
mn rn
We can draw the conclusion that inadequate MDT chemotherapy has a negative impact on the control of leprosy. One way of ensuring that patients receive ade- quate treatment is to follow the recommendations of Hussain [2007][15] and administer MDT until smear negativity. The parameters under test also encapsulate non-compliance and defaulting. Patient follow ups and accompanied treatment administration have proved to be most effective against defaulting and non-compliance from experiences in other diseases (TB, for instance).
2) To assess the effect of adequate MDT treatment on transmission of leprosy, we first differentiate MR with respect to the treatment induced recovery rate of MB patients M and also differentiate pR with respect to the recovery rate of PB patients p . This gives
Copyright © 2013 SciRes. AM

E. T. CHIYAKA ET AL. 397
2
21
M M M M MM
M M M
M MM M
M M
wR
mp wp
p
wpp m
0,
and
2
21
p p p p pp
p p p
p pp p
p p
rR
mn rn
n
rnn m
0.
We can draw the expected conclusion that adequate MDT chemotherapy has a positive impact on the control of leprosy. Treatment is deemed adequate when no re- lapse has been experienced. The recommendations made above can ensure this.
3) The rate of disease progression to the infectious classes, ( M and p ) and probability of a successful interaction between a susceptible and an infectious individual, ( M and p ), respectively, have the same effect on 0C for system (10) as in the analysis of 0 and 0T for the prior model systems. The deductions and recommendations we made for systems (1) and (9) still hold for the model with inadequate MDT treatment.
R RR
4) If we let M and p tend to zero, i.e. if there is no progression into a relapse, 0C tends to the repro- duction rate for the model with adequate treatment and compliant patients.
R
6. Numerical Simulations
In this Section, we present numerical simulations of the three models discussed in the previous sections. We use the fourth order Runge-Kutta numerical scheme coded in Visual Basic for Applications and we also utilized Microsoft Excel. In our simulations we used parameter values estimated from the results of various literature and surveys done in Sub-Saharan African countries. Where relevant data was unavailable, we made do with statistics from Indian researches, which happen to be the most extensive. The progression rates to clinical infections were estimated from the average incubation periods of 5 and 10 years for PB and MB, which happen to be estimates themselves since there is no test for detecting sub-clinical infections. Throughout this exercise, we considered a hypothetical population of just below 1.1 million people. We derived the initial conditions of the infectious classes from the (worst case) prevalence rate of 10 per 1000 population [16,17] in areas still endemic for the disease in Sub-Saharan Africa. A study in Ethiopia found that 6% of the normal population incu- bates the disease [3]. We derived initial value for the
latent infections from this observation. We first present simulations for the basic model to give us a portrait of the general behavior of Leprosy in a hypothetical popu- lation. We then go on to exhibit simulations for the model with adequate treatment and then finally for the one with inadequate treatment and non-compliance.
Numerical values of the parameters are as shown in the Table 1 below.
7. Discussion
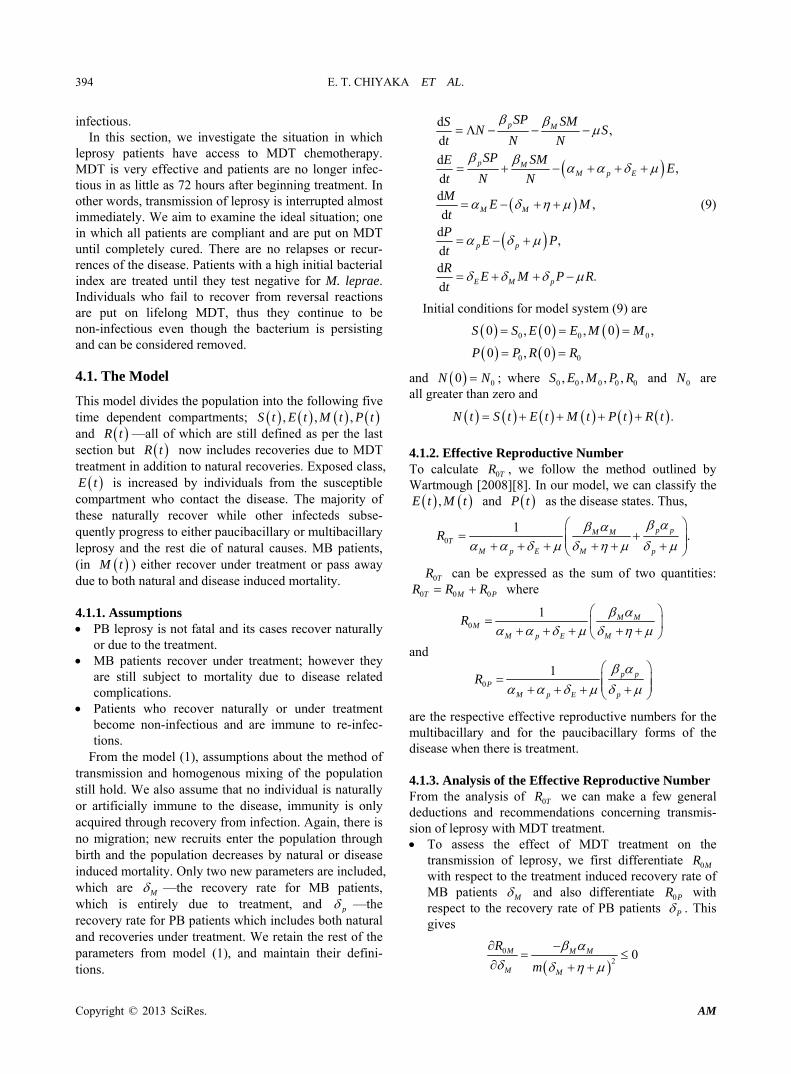
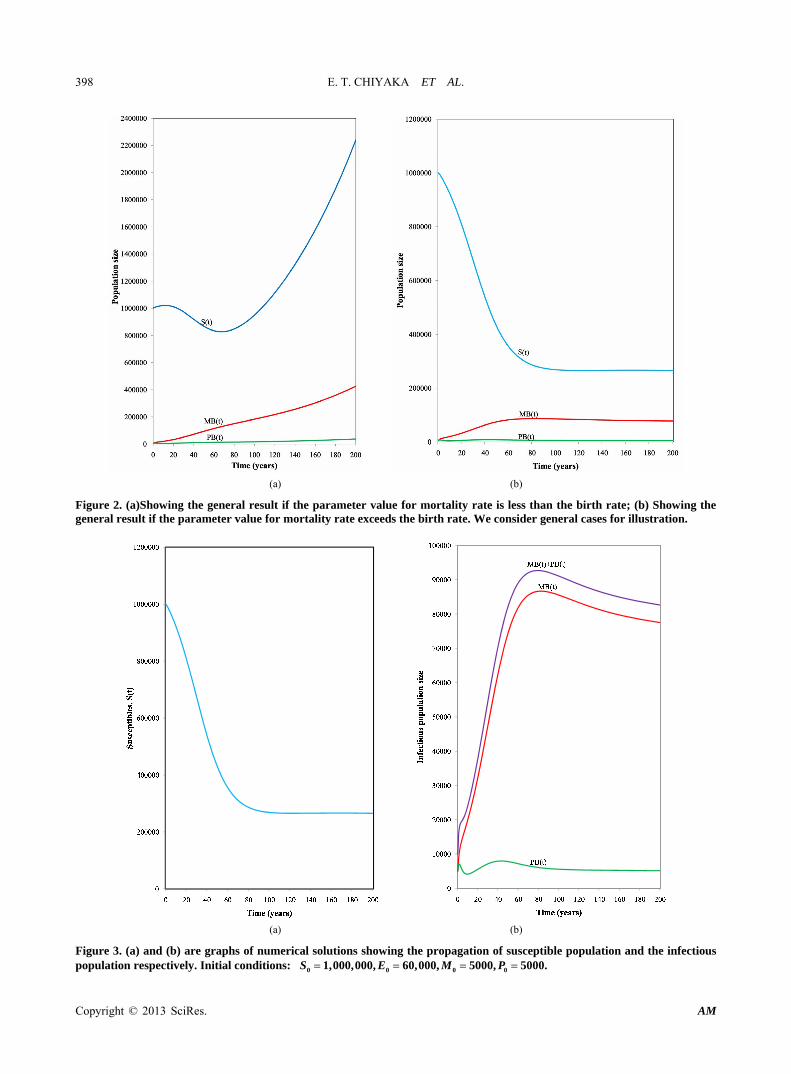
In model (1), we presented a basic deterministic com- partmental model for the transmission dynamics of leprosy in a community without access to treatment and with no other control measures in place (quarantines of lepromatus cases, as an example). Conditions for the sta- bility of the disease-free equilibrium were established. It was shown that the disease-free equilibrium is locally asymptotically stable whenever the basic reproduction number is less than unity. We also showed that the ende- mic equilibrium can exist if the reproduction rate exceeds unity. Numerical results in Figure 2 show that the rela- tive values of birth rate and mortality rate have a heavy bearing on the behavior of model system 1. It was shown through numerical simulation that without treatment, the disease eventually becomes highly endemic (Figure 3).
In model (9), we presented a deterministic compart- mental model of leprosy in a community with access to MDT treatment. We assumed that treatment completely cured the patients who were themselves assumed to be compliant. Similar conditions for the stability and exist- ence of the equilibrium states where established. Numeri- cal simulations showed that the disease fails to establish itself in the presence of MDT treatment (Figure 4). This is consistent with the findings in references [16,18-21]. However, according to the simulations, the higher the level of treatment, the swifter the disease is eliminated from the community (Figure 5).
In model (10), we presented a theoretical deterministic compartmental model of leprosy in a community with
Table 1. Model parameters and their interpretations.
Description Symbol Value Source
Natural birth rate 0.02 year Estimate
Natural mortality rate 0.02 year Zimstat
Rate of progression to MB M 0.1 year Estimate
Rate of progression to PB P 0.2 year Estimate
Recovery rate for asymptomatic infections E 0.56 year Estimate
Natural recovery rate for PB individuals P 0.30 year 15
Mortality rate for MB individuals H 0.05 year Estimate
Copyright © 2013 SciRes. AM
E. T. CHIYAKA ET AL.
Copyright © 2013 SciRes. AM
398
(a) (b)
Figure 2. (a)Showing the general result if the parameter value for mortality rate is less than the birth rate; (b) Showing the general result if the parameter value for mortality rate exceeds the birth rate. We consider general cases for illustration.
(a) (b)
Figure 3. (a) and (b) are graphs of numerical solutions showing the propagation of susceptible population and the infectious population respectively. Initial conditions: 0 0 0 01,000,000, 60,000, 5000, 5000.S E M P

E. T. CHIYAKA ET AL. 399
(a) (b)
Figure 4. (a) and (b) are graphs of numerical solutions showing the propagation of susceptible population and the infectious population respectively. Initial conditions: We consider general cases for illustration. , 0 01,000,000 70,000.S E
Figure 5. The graph shows the number of infectives plotted against time in years. The arrow shows the direction of increase of the level of treatment administered. The graphs where obtained for the following pairs of value for M and
P , respectively: (0.07, 0.875), (0.125, 0.175), (0.25, 0.35),
and (0.376, 0.525) Initial conditions:
We consider general cases for illustration.
0 1,000,000,S
70,000.0E
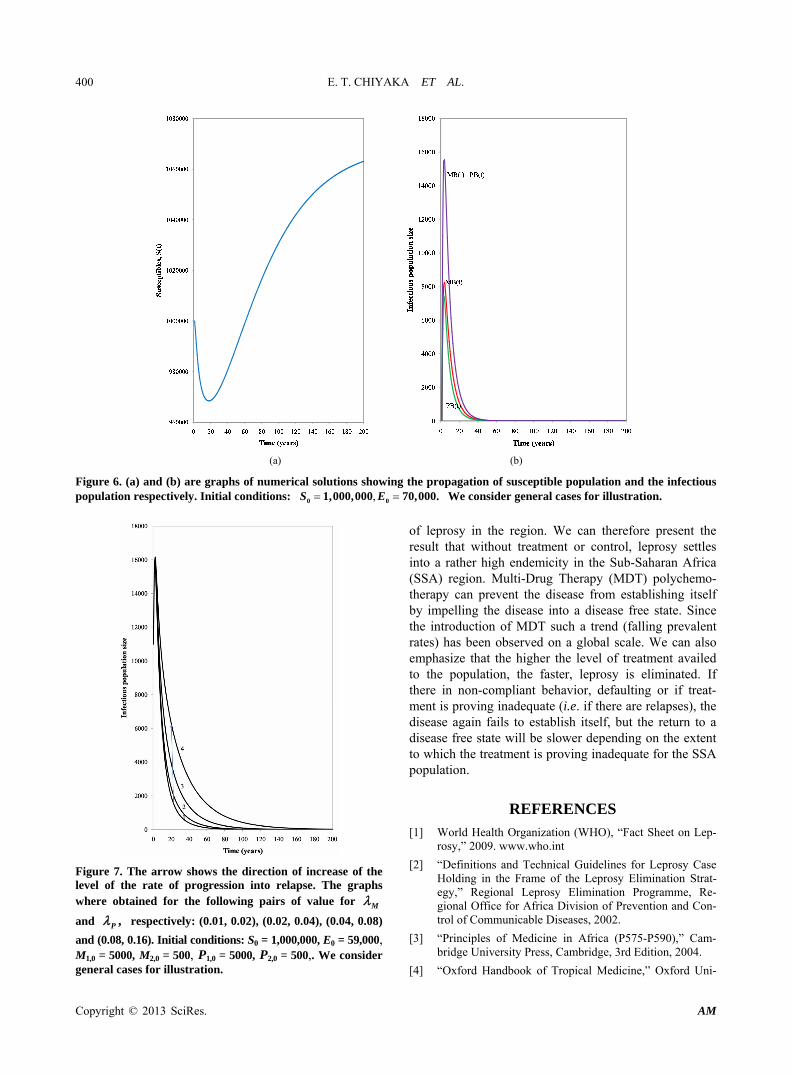
access to MDT treatment. We assumed that treatment fails to completely cure the patients, some of whom default or are not compliant with treatment procedures. Similar conditions for the stability and existence of the equilibrium states where established. Numerical simula- tions showed that the disease fails to establish itself in the presence of MDT treatment, despite the presence of cases of inadequate treatment and non-compliant be- havior (Figure 6). This is consistent with the findings in reference [13]. Our simulations, however, show that le- prosy is eliminated faster if patients are more adherent to treatment procedure and if the treatments completely cure the patient. Results in Figure 7 show that the infec- tious population gradually completely decays to zero but the decay rate of progression into a relapse is greater.
We calculated the basic reproduction rate for all three models. Analysis for the basic model showed that in- crease in probability of successful infection during an interaction directly increased transmission as does the increase in rates of progression to clinical infections. Under application of MDT, adequate treatment directly decreased transmission. If there in non-compliant be- havior or if treatment is proving inadequate, such a trend tends to increase the reproduction rate of the disease.
We tried to relate this study to the particular case of Sub-Saharan Africa in the model formulation and esti- mation of the parameter values and initial points for the imulations. As such, our models depict the transmission s
Copyright © 2013 SciRes. AM
E. T. CHIYAKA ET AL. 400
(a) (b)
Figure 6. (a) and (b) are graphs of numerical solutions showing the propagation of susceptible population and the infectious population respectively. Initial conditions: We consider general cases for illustration. , 0 01,000,000 70,000.S E
Figure 7. The arrow shows the direction of increase of the level of the rate of progression into relapse. The graphs where obtained for the following pairs of value for M
and ,P respectively: (0.01, 0.02), (0.02, 0.04), (0.04, 0.08)
and (0.08, 0.16). Initial conditions: S0 = 1,000,000, E0 = 59,000, M1,0 = 5000, M2,0 = 500, P1,0 = 5000, P2,0 = 500,. We consider general cases for illustration.
of leprosy in the region. We can therefore present the result that without treatment or control, leprosy settles into a rather high endemicity in the Sub-Saharan Africa (SSA) region. Multi-Drug Therapy (MDT) polychemo- therapy can prevent the disease from establishing itself by impelling the disease into a disease free state. Since the introduction of MDT such a trend (falling prevalent rates) has been observed on a global scale. We can also emphasize that the higher the level of treatment availed to the population, the faster, leprosy is eliminated. If there in non-compliant behavior, defaulting or if treat- ment is proving inadequate (i.e. if there are relapses), the disease again fails to establish itself, but the return to a disease free state will be slower depending on the extent to which the treatment is proving inadequate for the SSA population.
REFERENCES [1] World Health Organization (WHO), “Fact Sheet on Lep-
rosy,” 2009. www.who.int
[2] “Definitions and Technical Guidelines for Leprosy Case Holding in the Frame of the Leprosy Elimination Strat-egy,” Regional Leprosy Elimination Programme, Re-gional Office for Africa Division of Prevention and Con-trol of Communicable Diseases, 2002.
[3] “Principles of Medicine in Africa (P575-P590),” Cam-bridge University Press, Cambridge, 3rd Edition, 2004.
[4] “Oxford Handbook of Tropical Medicine,” Oxford Uni-
Copyright © 2013 SciRes. AM

E. T. CHIYAKA ET AL. 401
versity Press, Oxford, 3rd Edition, 2008.
[5] Centre for Disease Control (CDC), “Leprosy: Technical Information,” 2009. www.cdc.gov
[6] P. van den Driessche and J. Watmough, “Reproduction Numbers and Sub-Threshold Endemic Equilibrium for Compartmental Models of Disease Transmission,” Ma- thematical Biosciences, Vol. 180, No. 1-2, 2002, pp. 29- 48. doi:10.1016/S0025-5564(02)00108-6
[7] C. Castillo-Chavez, Z. Feng and W. Huang, “On the Computation of 0R and Its Role in Global Stability.
Mathematical Approaches for Emerging and Reemerging Infectious Diseases: An Introduction,” The IMA Volumes in Mathematics and Its Applications, Vol. 125, 2002, pp. 229-250.
[8] J. Watmough, “Computation of the Basic Reproduction Number,” MITACS-PIMS Summer School on Mathe-matical Modelling of Infectious Disease, University of Alberta, Edmonton, 2008.
[9] C. Castillo-Chavez and B. Song, “Dynamical Models of Tuberculosis and Their Applications,” Mathematical Bio-sciences and Engineering, Vol. 1, No. 2, 2004, pp. 361- 404. doi:10.3934/mbe.2004.1.361
[10] J. Carr, “Applications Centre Manifold Theory,” Springer- Velag, New York, 1981. doi:10.1007/978-1-4612-5929-9
[11] A. Meima, M. D. Gupte, G. J. van Oortmarssen and J. D. Habbema, “SIMLEP: A Simulation Model for Leprosy Transmission and Control,” International Journal of Lep-rosy and Other Mycobacterial Diseases, Vol. 67, No. 3, 1999, pp. 215-236.
[12] C. Bandit, “Recent Advances in Leprosy Chemotherapy,” Journal of Tropical Medicine & Parasitology, Vol. 29, No. 2, 2006, pp. 68-76.
[13] B. K. Girdhar and D. A. Girdhar, “Short Course Treat-ment of Leprosy,” Central JALMA Institute for Leprosy, Present Status, 2002.
[14] S. R. Pattyn, J. A. Husser, L. Janssens, S. Grillone and J.
Bourland, “Inadequate Treatment in Multibacillary Le- prody and Incubation Times for Relapses,” Acta Leprol- ogica, Vol. 4, No. 4, 1986, pp. 495-499.
[15] T. Hussain, “Leprosy Patients Attending the Out Patient’s Clinic at Agra: A Retrospective Analysis of the Charac-teristics and Frequency of Regularity VS Irregularity for Determining Absenteeism, Non-Adherence and Non- Compliance Division of Biostatistics,” National JALMA Institute for Leprosy and Other Mycobacterial Diseases, 2007.
[16] J. D. Habbema, “Trends in Leprosy Case Detection Worldwide since 1985,” University Medical Center Rot-terdam, Erasmus, 2004.
[17] B. R. Bloom and T. Godal, “Selective Primary Health Care: Strategies for Control of Disease in the Developing World,” V. Leprosy, Vol. 5, No. 4, 1983, pp. 765-780.
[18] J. H. Richardus and J. D. F. Habbema, “The Impact of Leprosy Control on the Transmission of M. leprae: Is Elimination Being Attained?” Leprosy Review, Vol. 78, No. 4, 2007, pp. 330-337.
[19] M. F. Lechat, C. B. Misson, M. Vanderveken, C. M. Vel-lut and E. E. Declercq, “A Computer Simulation of the Effect of MDT on the Incidence of Leprosy,” Annales de la Societe Belge de Medecine Tropicale, Vol. 67, 1987, pp. 59-65.
[20] A. Meima, L. M. Irgens, G. J. van Oortmarssen, J. H. Richardusa and J. D. Habbema, “Disappearance of Lep-rosy from Norway: An Exploration of Critical Factors Using Anepidemiological Modelling Approach,” Interna-tional Journal of Epidemiology, Vol. 31, No. 5, 2002, pp. 991-1000. doi:10.1093/ije/31.5.991
[21] A. Meima, W. Cairns, S. Smith, G. J. van Oortmarssen, J. H. Richardus and J. D. F. Habbema, “The Future Inci-dence of Leprosy: A Scenario Analysis,” Bulletin of the World Health Organization, Vol. 82, No. 5, 2004, pp. 373-385.
Copyright © 2013 SciRes. AM