theoretical ecology - rockefeller university
TRANSCRIPT

Theoretical Ecology PRINCIPLES AND APPLICATIONS
EDITED BY
ROBERT M. MAY Biology Department Princeton University
W.B.SAUNDERSCOMPANY PHILADELPHIA TORONTO

Western Hemisphere distribution rights assigned to
W.B. SAUNDERS COMPANY
West Washington Square, Philadelphia, Pa. 19105 833 Oxford Street, Toronto MSZ 5T9, Canada
Library of Congress Catalog Card Number: 76-9642
SBN o-7216-6205-6
© 1976 Blackwell Scientific Publications
Copyright under the International Copyright Union. All rights reserved. This book is protecterl by copyright. No part of it may be produced, stored in a retrieval system or transmitted in any form or by any means, electronic, mechanical, photocopying, or otherwise without written permission from the publisher.
Printed in Great Britain

Contents
List of authors
Acknowledgements
I Introduction
2 Models for Single Populations ROBERT M. MAY
'·
3 Bionomic Strategies and Population Parameters T. R. E. SOUTHWOOD
4 Models for Two Interacting Populations ROBERT M. MAY
5 Arthropod Predator-Prey Systems MICHAEL P. HASSELL
6 Plant-Herbivore Systems GRAEME CAUGHLEY
7 Competition and Niche Theory ERIC R. PIANKA
8 Patterns in Multi-Species Communities ROBERT M. MAY
vii
viii
I
4
49
7I
94
Il4
I42
9 Island Biogeography and the Design of Natural Reserves I63 JARED M. DIAMOND AND ROBERT M. MAY
v

vi CONTENTS
IO Succession I87
HENRYS. HORN
II The Central Problems of Sociobiology 205
EDWARD 0. WILSON
I2 Palaeontology Plus Ecology as Palaeobiology 2I8
STEPHEN JAY GOULD
I3 Schistosomiasis: a. Human Host-Parasite System 237 JOEL E. COHEN
I4 Man versus Pests 257 GORDON CONWAY
References 282
Organism index 308
Subject index 3II
-.

List of Authors
GRAEME CA UGHLEY Department of Biology, University of Sydney, Sydney, N.S.W., 2oo6, Australia
J 0 E L E. C 0 HEN Department of Biology, Rockefeller University, New York, N.Y., 10021, U.S.A.
GORDON CONWAY Environmental Management Unit, Imperial College Field Station, Silwood Park, Ascot, Berks, SL5 7 PY, England
JARED M. DIAMOND Physiology Department, U.C.L.A. Medical Center, Los Angeles, California, 90024, U.S.A.
STEPHEN JAY GOULD Department of Paleontology, Harvard University, Cambridge, Massachusetts, 02138, U.S.A.
MICHAEL P. HASSELL Imperial College Field Station, Silwood Park, Ascot, Berks, SL5 7PY, England
HENRY S. HORN Biology Department, Princeton University, Princeton, New Jersey, 08540, U.S.A.
ROBERT M. MAY Biology Department, Princeton University, Princeton, New Jersey, 08540, U.S.A.
ERIC R. PIANKA Department of Zoology, University of Texas, Austin, Texas, 78712, U.S.A.
T. R. E. SOUTHWOOD Department of Zoology and Applied Entomology, Imperial College, London, SW.7, England
EDWARD 0. WI L S 0 N Department of Biology, Harvard University, Cambridge, Massachusetts, 02138, U.S.A.
Vll

13 Schistosomiasi-s:
A Human Host-Parasite System JOEL E. COHEN*
13.1 Introduction
Hlliil&n schistosomiasis (pronounced SHIS~to-so-MY -uh-sis, or sometimes, synonymously, bilharzia) is a family of diseases caused primarily by three species of the genus SchiatoBoma of flatworms. The adult worms inhabit the blood vessels lining either the bladder or intestine, depending on the species of worm. Hence the worms are also known as blood flukes.
Jordan and Webbe (1¢9) provide a monographic review of human schistosomiasis. Malek's (1g61) shorter review emphasizes the eQological point of view. The insatiable reader is invited to consult the 10,286 references cited by Warren and Newill (1¢7), which do not include most of those on which this chapter is based.
Aside from its human impact, schistosomiasis is a marvellous source of puzzles for the biologist. How does this metazoan parasite escape annihi1ation by human immune responses 1 How do genetic factors in snails condition susceptibility to infection by the asexual stages? How do worms of opposite sex find each other in the dark1
How does the schistosome cope with successive environments of human ~aeces, water, snail tissue, water again, and human serum and other ti8sues1 Why is the fraction of snails observed to be infected in natUI'&l populations so remarkably low (Warren, 1973)? Are there immunological cross reactions between hul)lan schistosomes, as has been suggested for malaria (Cohen, 1973a)?
How do human behaviour and agricultural practices combine to propagate an insidious pest, and how can people balance conflicting demands of economics and health in controlling it?
The worldwide prevalence of schistosoma! infections has not been
• This work was supported in part by the U.S. National Science Foundation, under grant number BMS 74-13276.
237

CHAPTER 13
measured credibly. A figure conventionally cited is 200 million people, or approximately one out of every twenty people on the planet. The disease is virtually unknown in the rich countries of the world. Thus it is concentrated among those people least able financially to defend themselves against it.
According to a foundation which devotes a substantial fraction of its money to research on schistosomiasis, 'preliminary calculations indicate that global control would cost at least $2 billion per year at today's prices with the best current methods!' (Hoffman, 1975, p. 26). The exclamation point is intended, in context, to emphasize how expensive global control would be. But the resulting estimate of $10
per case for worldwide control of schistosomiasis should be compared with the $30 per case spent in the United States for research alone on muscular dystrophy, and with the alternate uses $2 billion have been put to recently.
'There is little doubt that all three schistosomes can cause considerable pathological change, sometimes in a comparatively large proportion of the population, but the evidence suggests that only a proportion of those so affected die of the disease' (Jordan and Webbe, 1969, p. 168). The absence of quantitative information from this assessment of the impact of the infection on health fairly reflects the information available.
After a schematic description of the life cycle and ecology of Schistosoma mansoni, this chapter will review several mathematical models of aspects of schistosomiasis. To date no mathematical model of the disease has come close to representing faithfully most of what is known about the natural history of the disease; none, in fact, has even tried. So the field is still open. The juxtaposition of these models will make clear the selective emphasis, and some of the omissions, of each.
13.2 A life cycle of schistosomiasis
The common features of all three schistosome species which are the major parasites of man are summarized in Fig. 13. I (from Jordan and Webbe, 1969, p. 7, from whom the following brief description is also drawn). The life cycle consists of an obligatory alternation of sexual and asexual generations. The sexual generation occurs in man (or sometimes other mammals). The asexual generation must pass through specific snails.

SCHISTOSOMIASIS: A HUMAN HOST-PARASITE SYSTEM 239
Paired mature Worms
Veins of bladder-S. hoemalobium
HOST
Hepatic~portal/. vessels
rtefres
Heart I
RETAINED IN TISSUES
~~ 6 12 k
Lungs - wee s \
Heart \
Veins Schistosomules ~
~.· -'-f-1-+"COMMON EXTERNAL ENVIRONMENT
rAff"~ WATER_~-
EGGS S.monsoni
S. hoemofobium S. joponicum
48 """" \...,,,., '00"""' B•QIInos 'P· "''' ""'")""; 7 oc """' ;, _,
Daughter t sporocysts . . ~ • •
Cercariae '--_ €} Free swrmmrng
produced within @~ Miracidium
Snail , (() 24 hours 4-7 weeks
Biompho/orio sp.
~ . '""trnt~ '''"'"';~, ~;1
Oncomelonto sp.
Fig, 13.I. The life cycle. (From Jordan and Webbe, 1969, p. 7.)
Eggs produced by the sexual stage leave people in urine (in the case of S. haematobium) or faeces (S. mansoni and S. japonicum). Eggs that reach water (a stream, an irrigation canal, a pond, puddle, or ritual

CHAPTER 13
ablution bath near a mosque) shed their shells and hatch a ciliated free-swimming stage called a miracidium.
The quantitative estimates in the following refer chiefly to S. mansoni. A miracidium that locates a snail within approximately one day
penetrates it. If the snail has the right genotype, the miracidium develops through two larval stages into thousands of cercariae. Each cercaria that escapes from the snail, starting 4 to 5 weeks after the initial infection, can swim up to two days. When cercariae penetrate the skin of host species in which they cannot develop, they die, producing a skin irritation. When one of the human schistosoma! cercariae enters human skin, it becomes a wormlike 'schistosomule'.
Here we follow the course, as far as it is known, of a schistosomule of S. mansoni. The schistosomule migrates to the lung, sometimes producing a cough, then appears in the portal system of the liver, where it reaches sexual maturity and mates. Worm pairs then migrate to the blood vessels lining the lower small intestine and the large intestine.
At this point the happy couple of worms resemble (roughly) a hot dog in a roll. The female, 7 to 17 mm long, lies in the gynecophoric canal of the male, who is 6 to 13 mm long and cylindrically shaped to correspond to the walls of their home, a blood vessel. The female is estimated to lay from roo to 300 eggs a day.
Some of these eggs work through the wall of the blood vessel, into the lumen of the intestine. Carried by faeces, these eggs again begin the life cycle. The interval from the entry of cercariae into human skin to the first detectable passage of eggs in the faeces varies from 5 to 6 weeks.
Most of the disease caused by the infection results from the eggs that do not escape with faeces. Some eggs get stuck in the tissue near where they are laid, causing fibrosis and granuloma as the host tries to protect itself. Other eggs get washed to the liver and spleen where they cause similar damage.
The medicines available to kill the schistosomes in people have so many dangerous side effects that they must be administered under medical supervision; and they are costly. So they may help rich tourists returned home; but by themselves they do nothing to protect a person in an endemic area against reinfection once he or she leaves the clinic. Even if enough medical personnel were available to treat all the infected population in a single month, the snail (and sometimes

SCHISTOSOMIASIS: A HUMAN HOST-PARASITE SYSTEM 241
other mammalian) reservoirs of infection would persist. The control or eradication of schistosomiasis is a truly ecological problem.
13.3 Proportion ever infected
If present conditions influencing infection with a parasite existed since well before the oldest people alive were born, then every age group should have the same proportion infected as did the community's oldest members when they were at each corresponding age. Assuming constant conditions, a snapshot of the distribution of infection according to age in a community today provides a picture of the life experience of a cohort (a group of people all born at the same time).
The mathematical models described in this section and the next take advantage of that possibility by using data about the prevalence of previous or present infection in a population at one point in time to make inferences about the dynamics of infection over time in a cohort.
Suppose a cohort is entirely susceptible to infection at some initial time, usually taken to be birth. Suppose that this cohort is exposed to a constant force of infection per unit time. 'This force is to be measured in effective contacts per unit time, no matter how complex may be the events leading up to these contacts' (Muench, I959, p. I6). Here the force of infection a summarizes everything that has to do with the contact between cercariae and people and with the subsequent establishment of a detectable infection. Suppose also that it is possible to classify each individual as ever having been infected or not.
Let N be the total number of individuals initially in the cohort. Let x(t) be the fraction of the cohort that has not been infected, and y(t) the fraction that has ever been infected, by time t. By definition x(t)+y(t) =I. Assume x(o) =I and y(o} = o. Then Nx(t) is the number of individuals never infected at time t. These individuals are constantly exposed to a force a of infection. So the change per unit time in the number Nx(t) of people never infected is
d[N x(t)]fdt = -aN x(t),
or, cancelling N, assumed constant,
dxfdt = -ax,
Similarly, for the number ever infected,
dyfdt = ax = a( I- y),
x(o) = I. (I3. I)
y(o) = o. (I3.2)

CHAPTER 13
The solution of eq. (13.2) is simply
y(t) = I-e-a1.
This model assumes no change in the size of the cohort due to death or emigration. Death or emigration will have no effect on the fraction y(t), so long as the death or emigration rates have identical values, p.(t), for both previously infected and never infected individuals (Cohen, 1972). To see this, we write the appropriate equations, where now the total population N(t) is no longer constant:
d[N(t) x(t)]fdt = - aN(t) x(t)- p.(t) N(t) x(t);
d[ N(t) y(t)]fdt = aN(t) x(t)- p.(t) N(t) y(t).
(13. 4)
(13. S)
By writing N(t) = N(o) ·exp [- f~ p.(s) ds] here, we recover precisely eqs. (13. r) and (13. 2) for the fractional population functions x(t) and y(t).
---------------------· .~ 0 ~ • .....-----o • e o • •
0 0
•
Years of age
Fi!i. 13. 2. The proportions observed positive in response to S. japonicu~ antigen skin tests as a function of age in the coastal division, Palo, Philippines. Open circles, 1954; solid circles, 1962. Solid line, prediction from eq. (13.3). (Adapted from Hairston, 1965b, p. 172.)
0
If conditions were constant over the past, and the means of detecting previous infection include individuals infected long ago, then (Hairston, 1965b) a survey of all age groups in a population at a given time should give a graph of the fraction of people ever infected as a function of age that looks like eq. (13. 3).
Figure 13. 2 takes t = o as 5 years of age. Infections before that age are neglected. The data are the fractions of people in each age group judged ever to have been infected with schistosomes on the basis

SCHISTOSOMIASIS: A HUMAN HOST-PARASITE SYSTEM 243
of skin tests in I954 and I¢2. Simple in theory, in practice these tests suffer from many difficulties (Kagan, I¢8).
Particularly for the younger age groups, the fit.of eq. (I3-3) to the data is reasonable. The systematic discrepancy between data and observation at the upper ages is plausibly explained by Hairston (I¢5b), on the basis of other calculations, as due to an insensitivity of the skin test to previous infection if the person has not recently been exposed to female cercariae or has no living female worms.
The numerical value of the parameter a = o · I2 used in Fig. I3. 2 was not obtained by fitting that curve to those data. The parameter was estimated by fitting another eq. (I3. 9) below to different data, from stool examinations, on the same population. This finding, which I consider one of the most remarkable in the epidemiology of schistosomiasis, suggests that an incredibly simple, and simple-minded, mathematical model can usefully interpret the age distribution of previous infection and yield information about the dynamics of infection which would otherwise be unava.ila.ble.
13-4 Proportion currently infected
Female 8. mansoni worms in human beings live an average 3 to 4 years; other species of human schistosomes are comparable (Hairston, I¢5a, p. 52; Jordan and Webbe, I¢9, p. I52).
A person in whom all female worms have died no longer excretes eggs. (A person may also no longer excrete eggs because tissue traps the eggs or because living females are unmated. We ignore these complications.) Hence some individuals previously infected may pass from currently excreting eggs to no longer excreting.
;
I3. 4. I A model allowing loss of infection
Let y(t) (not the same as in section I3-3) be the proportion of a cohort which is currently giving evidence of infection by excreting eggs and z(t) be the proportion which has been previously infected but is no longer passing eggs. As before, let x(t) be the proportion of the cohort at time t which has never been infected. Assume no death or emigration, so x(t)+y(t)+z(t) =I. .
H the cohort is subject to a constant force of infection a, and those individuals currently giving evidence of infection are now further

CHAPTER 13
subject to a constant risk of loss of infection b, then under constant conditions the proportions x, y and z behave (Muench, 1959) according to
dxfdt = -ax,
dyfdt = +ax-by,
dzfdt = +by,
x(o) = I,
y(o) = o,
z(o) = o.
(13.6)
(13. 7)
(13. 8)
All individuals are uninfected initially. The sum of the derivatives is zero, as it must be since the cohort does not change size. Then if a# b,
y(t) = a(e-b1-e-a1)f(a-b). (13.9)
Repeating the argument in section 13.3 shows that if death and emigration occur at equal rates in all three fractions of the cohort, the same equations (13.6) to (13.8) still hold.
In the limit as t gets large, y(t) approaches o, because eqs. (13. 6) to (13. 8) really assume that once having lost infection, an individual does not regain it. There is no re-entry from the category measured by z(t) to the category measured by y(t). Hence z(t) must be interpreted as the proportion having lost infection and not exposed to risk of further infection.
100
90
80
70 !i :~ 60 0 Q.
., 50 .,. " ' ~ 40 ~ ., n. 30
Years of oge
Fig, 13·3• Observed age prevalence (solid line) and theoretical age prevalence (dashed line) from eq. (13.9) of human infection with S. japonicum in the coastal division, Palo, Philippines, neglecting transmission before 5 years of age. (From Hairston, 1965b, p. 171.)

SCHISTOSOMIASIS: A HUMAN HOST-PARASITE SYSTEM 245
As Warren (1973) emphasizes, it is not more plausible to assume that such individuals are immune to further reinfection than it is to suppose that, for cultural and behavioural reasons, they simply have less contact with cercaria-l~tden water.
Figure 13.3 plots y(t) and the observed proportions with S. japonicum eggs in their faeces by age in the same Philippine population pictured in Fig. 13. z (Hairston, 1965b ). The annual rate b = o ·oz of becoming negative is not the annual death rate of individual female worms because (assuming the eggs are not blocked in the person's tissues) all the females in the person have to die, without replacement, for the person to stop excreting eggs.
Snails too pass through the stages of being never infected, infected and shedding (cercariae, instead of eggs), and (possibly) no longer infected (Fig. 13 .4). Sturrock and Web be (1971) plot proportions of snails shedding as a function of age, which they estimate by size.
20 .16 135
.14
'0 .12 .. u .!!! .!: .10 ~ c c: .08 "' '0 c: .06 :e 0 c. 0 .04 a:
.02
5 7 9 II 13 15 17 19 Estimated age of snails (weeks)
Fi~. 13•4• Observed age prevalence (histogram) of infection in Biomphalaria glabrata snails in St Lucia, starting from the first week when snails shed cercariae; and three predicted age prevalence curves: solid curve, eq. (13.9); long dashes, force of infection a adjusted for differential mortality of infected individuals; short dashes, loss of infection b adjusted for differential mortality. (From Cohen, 1973b, p. 2!0.)

246 CHAPTER 13
13. 4. 2 Differential mortality due to infection
Infection with schistosomes is unhealthy for both people and snails. For people, the increment in the probability of death at any age due to infecting schistosomes has never been measured credibly.
Laboratory experiments of Pan (1965) with the snails which transmitS. mansoni show unmistakably (Fig. 13. 5) an increase in the death rate of snails shedding cercariae compared with uninfected snails.
5.1
4.9
a. c:
:~ 4.7
" "' !!!. 4.5 ·a c: "' 0 4.3
"' .c ~ 4.1 .s c -' 3.7
3.7
Uninfected Slope=- 0.007
o-o-o-o-~-o-o-o-o-o x -o-o-o-
Exposed Slope=- 0.12
3.5--+-~~~~~~~~~~~--r-~-->r-
5 7 9 II 13 15 17 19
Weeks since exposure to infection
Fi~. 13 •S• Natural logarithms of the numbers of survivors in a group of snails exposed to S. mansoni (x) and in an unexposed group (open circles), based on data of C. T. Pan, and fitted straight lines; starting from first week when snails shed cercariae. The difference between the two slopes estimates "in eq. (13. 11). (From Cohen, 1973b, p. 208.)
A slight generalization (Cohen, 1973b) of the models above allows for differential mortality due to current infection. If p. is the constant mortality or emigration rate of individuals not currently shedding eggs (in the case of humans) or cercariae (snails), and p.+ € is the increased mortality or emigration rate of individuals currently shedding, then suppose
(1/N)d(Nx)jdt=-aX-p.X, x(o)=1, (13.10)
(1jN) d(Ny)jdt = +ax-by- (p.+ £) y, y(o) = o, (13. II)

SCHISTOSOMIASIS: A HUMAN HOST-PARASITE SYSTEM 247
(1/N) d(Nz)fdt = by-p.z, z(o) = o. (13.12)
The explicit solution for y(t) satisfying eqs. (13. 10) to (13. 12) appears in Cohen (1973b, p. zoo). When E = o, putting N(t) = N(o)e-P 1 leads back to the eqs. (13.6) to (13.8) and resulting eq. (13.9) of section
13-4-I. Ify(t) obtained from eqs. (13. 10) to (13. 12) is a better approximation
to reality than eq. (13. 9), but a curve of the form of eq. (13. 9) is fitted to data in ignorance of E, then the resulting estimates of the parameters a and b may be biased. The alternate two theoretical curves in Fig. 13.4 show the result of assuming that all the bias is absorbed either by a or by b. The differences among the predicted age prevalence curves are small, although the possible bias in the parameter estimates is not.
If the differential mortality due to infection is measured in the same population of snails whose age prevalence curve is being studied, even the possible bias in the parameter estimates is small (Sturrock et al., 1975). For estimating rates of gain and loss of infection and describing the age prevalence distribution in the snail populations studied by Sturrock, a little verisimilitude is gained by allowing for differential mortality due to infection, but not much.
This example illustrates a kind of sensitivity analysis which ought, I think, to accompany the study of very simple ecological models. The model is eqs. (13.10) to (13.12) is literally more realistic than the model in eqs. (13.6) to (13.8) because it includes a representation of a real phenomenon known to occur. It is a bit more complicated to study mathematically. It doesnot cause major alterations in how data studied with eqs. (13 .6) to (13 .8) are understood. Hence, for rough purposes, one can be more assured of the adequacy of eqs. (13.6) to (13.8); for finer purposes, one has a more refined tool, eqs. (13. 10) to (13. 12).
13-4·3 Immunity
Linhart (1968) analyzes three different stochastic models leading to age-prevalence curves, based on three different formalizations of how an infected (human) individual might develop immunity to infection. Bradley (1974) emphasizes the probable importance of human immunity in the epidemiology of human schistosomiasis, though Warren (1973) favours another view; but so far Linhart's are the only explicit mathematical models incorporating immunity. It is unfortunate that

CHAPTER 13
some of Linhart's predicted age-prevalence curves have never been tested against observations.
An important task in the modeling of schistosomiasis is to see what the burgeoning biological information about the immunology of schistosomiasis (Butterworth, in press) implies for the validity of these and new models, and to translate that information into mathematically explicit, empirically testable, and epidemiologically useful form.
13.5 Snail population dynamics
Biomphalaria glabrata is the snail principally responsible for the transmission of S. mansoni in the New World. Jobin and Michelson (1967) raised laboratory populations of these snails with varying amounts F of food (measured in g of watercress), numbers N of snails (each 15 mm in diameter), and volumes V of water (measured in litres), at 25°C. For each such population they measured the fecundity (E) by the numbers of eggs laid per snail per day. Their results (Fig. 13.6)
· are conveniently summarized by
E = kFf(NV). (13. 13)
It is plausible that, over a certain range at least, fecundity should
50
>. 40 0
~ ·c; c ., ~ 30 00 .. ~ 20 ~ :0 c ::0
" ~ 10
1.0 1.5 2.0 F I /'IV (g watercress/litre/snail)
Fig. 13.6. Fecundity of Biomphalaria glabrata snails as a function of food F, number N of snails, and water volume V. (From Jobin and Michelson, 1967, p. 659.)

l
SCHISTOSOMIASIS: A HUMAN HOST-PARASITE SYSTEM 249
increase with food and decrease with the number of snails competing for that food. What is counterintuitive about eq. (13. 13) is that a larger volume of water decreases fecundity. The reason is that the snails have a harder time finding the food.
Since eq. (13. 13) predicts that snails in a vanishingly small volume of water have an infinite fecundity, eq. (13. 13) obviously holds over only a limited range of V; in fact the experiments had jars only of 4 ·s litres and 7 ·6 litres.
In very large volumes of water, such as lakes, which are not crowded with snails, the addition of one more snail has no effect on the fecundity of the other snails present. So Jobin and Michelson (1967) assume that the inverse dependence on N in eq. (13. 13) disappears whenever the volume of water per snail exceeds a threshold called the 'crowding zone'.
These limitations on eq. (13. 13) for small V and for large V show that the direct and inverse proportionalities in eq. (13. 13) are deceptively simple. Eq. (13. 13) should be regarded as a linearization or tangent approximation to a nonlinear function. This approximation is useful over the range of variables used in one set of experiments.
In a simulation based on eq. (13. 13), Jobin and Michelson (1967)
I
I I
1-----Model prediction assuming no crowding
Model prediction assuming crowding begins at 100 litres /snail
102 ~~~~~~~~~~~~~~~~~~~~~~~~~~~~ D J F
Fi~. 13•7• Predictions (solid and dashed lines) of model for population of Bulinus globoBUS snails compared with field observations (open circles) from Foyle Pond. (From Jobin and Michelson, 1967, p. 661.)

CHAPTER 13
treat the proportionality constant k as a function of the species and age of the snails, the nutritional value of food, and water temperature. Mortality is assumed to depend on demographic and ecological factors. The fecundity and mortality submodels are combined into difference equations whose trajectory is computed. The parameters are estimated from observations by another investigator of Bulinus globosus, a Rhodesian snail carrying S. haematobium. The model's predictions of snail populations agree roughly with censuses (Fig. 13. 7). This study is an encouraging attempt to combine laboratory and field data (albeit from different snail species, since no one species has been studied comprehensively enough).
Sensitivity analysis of the sort discussed in section 13.4. 2, with respect to both parameter values and the form of entire components of the model, has not been reported in this case. There is room for much useful work here.
13.6 Sex among the schistosomes
The preceding models describe either the human or the snail half of the schistosome life cycle, never both. A minimally realistic model of the entire life cycle must explicitly recognize that the worms reproduce sexually in people. The effect on egg output, and hence on transmission of infection, of one additional female worm in a person depends on the numbers of males and females already there and upon the mating system and success of worms in people.
Unfortunately, the sexual stage of schistosomes has yet to receive its Masters and Johnson. Mathematical models of mating functions quantify possibilities within the range of present ignorance. Three recent studies which cite earlier work are due to Leyton (1968), Nasell and Hirsch (1973), and Dietz (1975).
13.7 Life cycle models
A few models attempt to comprehend the entire schistosome life cycle.
13.7. I A life table model
In Palo in the Philippines (Hairston, 1962, 1965a), the proportion of people infected with S. japonicum at each age changed very little from

SCHISTOSOMIASIS: A HUMAN HOST-PARASITE SYSTEM 251
I945 to I959- Hence one suspects that the per capita risk of infection also changed very little over that period. Barring large changes in the human population, it follows that the total worm population must have been stationary (constant in total numbers and age structure). It is therefore appropriate to use a life table, the demographic model of a stationary population, to describe the population of S. japonicum there.
In this model, the net rate of reproduction R 0 of the worm, previously defined in eq. (2. I4), may be written as the product of four factors reflecting four major stages in the worm's life cycle:
Worm's R0
= (Larval R0
in snail) x (Cercariae's probability of infecting a mammal) x (Adult worms' R
0 in mammal) x (Eggs' probability of
infecting a snail). (I3. I4)
Hairston (I962) further decomposes each of these factors. For example, he represents the probability of an egg's infecting a snail (I962, p. 39) as the product of the probability that an egg is able to hatch times the probability that the egg is deposited near snails times the probability of penetrating a snail times the probability of establishing an infection in the snail after penetration.
Even the very extensive field data gathered in Palo are insufficient to estimate all the factors in eq. (I3. I4) directly. Hairston supplements the data with guesses (of the contribution of swamp rats to transmission, for example), assumptions [of a Poisson distribution of worms per person, for example, though a negative binomial distribution is more likely (Hairston, I965a, p. 6o)], and ingenuity.
For S. japonicum, Hairston's (I965a, p. 6o) final estimate of the right side of eq. (I3. I4) is o · 6. Based on less reliable data from Egypt, his estimate for S. mansoni is I· 9 and for S. haematobium is 2 · 8. If Hairston's model and observations were correct, these estimates should be I. That the estimates do not differ from I by orders of magnitude is an indication of the coherence of the observations and the approximate correctness of the model, under the given conditions.
Still, some qualifications deserve note. First, although the age prevalence distribution remained nearly
constant from I945 to I959, and hence probably also the per capita exposure, if the total human population increased over that period, the worm population may have also. But the rate of increase of the human population is likely to have been low, on the order of a few percent per year. So the deviation of the R
0 of the worms from I was
probably much less than the uncertainty of the data.
CHAPTER 13
Second, the decomposition of the probability of transmission around the life cycle into the product of the probabilities of the elementary events which make up the life cycle implicitly assumes that the simple events may be treated as independent. Independence is so unlikely that Hairston (1962, 1965a) avoids making the assumption in practice by estimating from his data, not the elementary probabilities which appear in some of his formulas, but clusters of these factors representing compound events.
Third, since 'the parasite population is able to come into equilibrium at different rates of transmission' in different ecological settings, 'net reproduction in one or both of the hosts must be curtailed with increasing transmission and enhanced with decreasing transmission', and hence (Hairston, 1965a, pp. 46-47) 'there is a range of transmission rates over which compensatory mechanisms operate to keep the parasite population in equilibrium'. This means that if an intervention programme reduces one of the four factors on the right of eq. (13. 14), over at least some range, the other factors on the right will not remain constant but will increase to keep the product near r.
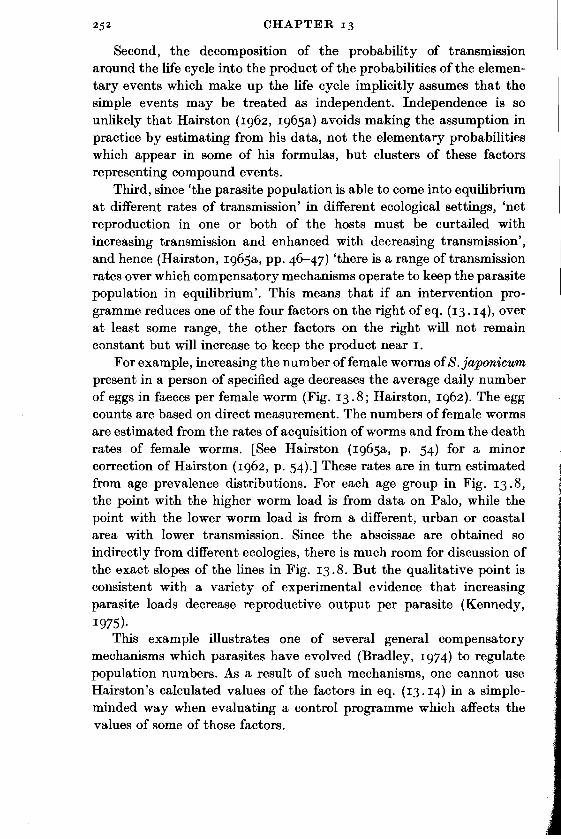
For example, increasing the number of female worms of S.japonicum present in a person of specified age decreases the average daily number of eggs in faeces per female worm (Fig. 13. 8; Hairston, 1962 ). The egg counts are based on direct measurement. The numbers of female worms are estimated from the rates of acquisition of worms and from the death rates of female worms. [See Hairston (1965a, p. 54) for a minor correction of Hairston (1962, p. 54).] These rates are in turn estimated from age prevalence distributions. For each age group in Fig. 13. 8, the point with the higher worm load is from data on Palo, while the point with the lower worm load is from a different, urban or coastal area with lower transmission. Since the abscissae are obtained so indirectly from different ecologies, there is much room for discussion of the exact slopes of the lines in Fig. 13. 8. But the qualitative point is consistent with a variety of experimental evidence that increasing parasite loads decrease reproductive output per parasite (Kennedy, 1975).
This example illustrates one of several general compensatory mechanisms which parasites have evolved (Bradley, 1974) to regulate population numbers. As a result of such mechanisms, one cannot use Hairston's calculated values of the factors in eq. (13. 14) in a simpleminded way when evaluating a control programme which affects the values of some of those factors.
SCHISTOSOMIASIS: A HUMAN HOST-PARASITE SYSTEM 253
~ 2000 Q.
.!!1 0
E .l!!
., Q.
"' ., u ., .E .!: "' "' "' .,
., .Q
E ::> c ., "' 0
~ >
<(
Average number of female worms present
Fi~. 13.8. Average daily egg output in faeces per female S.japonicum as a function of mean female worm load per person, in three age groups of people. Open circles estimated from data (see text); straight lines are simplest functions through two points. (From Hairston, 1962, p. 52.)
13. 7. 2 Dynamic models
Dynamic models, intended to describe what will happen when the life cycle is perturbed, attempt to represent these . regulatory mechanisms and are therefore necessarily nonlinear. One such model (Macdonald, 1965) emphasizes the nonlinearity introduced by supposed monogamous mating in the sexual stage of the worms, and borrows other nonlinear bits from existing models of malaria.
Dynamic models examine the transient and asymptotic behaviour of indicators such as the mean worm load m in people or the fraction of people infected as functions of various parameters, like the probability that an egg reaches and infects a snail, the snail population, and the probability that a cercaria reaches and infects a person. Numerical analysis of one simple model (Macdonald, 1965) suggests the existence of a threshold in m. Once m is below this threshold,
254 CHAPTER 13
transmission of infection disappears in a few years; once above it, infection remains endemic indefinitely.
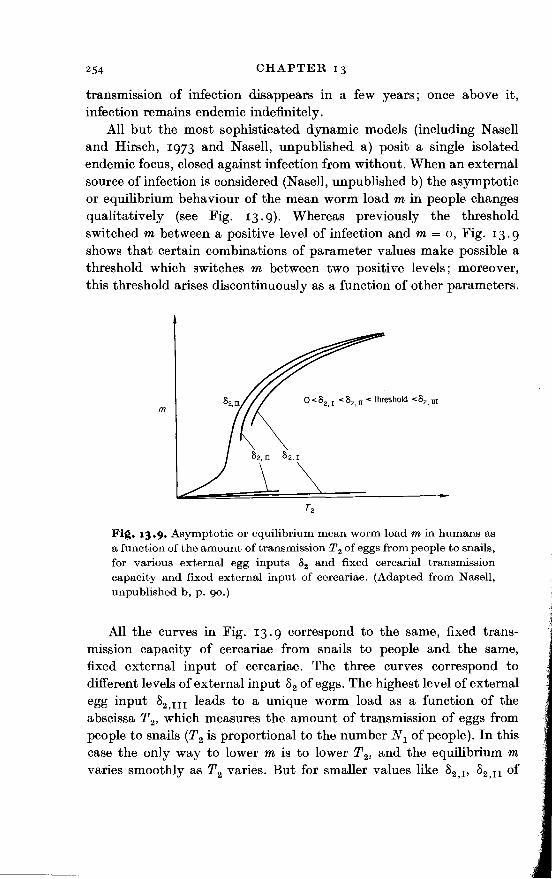
All but the most sophisticated dynamic models (including Nasell and Hirsch, 1973 and Nasell, unpublished a) posit a single isolated endemic focus, closed against infection from without. When an external source of infection is considered (NaselJ, unpublished b) the asymptotic or equilibrium behaviour of the mean worm load min people changes qualitatively (see Fig. 13. g). Whereas previously the threshold switched m between a positive level of infection and m = o, Fig. 13.9 shows that certain combinations of parameter values make possible a threshold which switches m between two positive levels; moreover, this threshold arises discontinuously as a function of other parameters.
m
Fi~. 13·9· Asymptotic or equilibrium mean worm load min humans as a function of the amount of transmission T 2 of eggs from people to snails, for various external egg inputs 82 and fixed cercaria! transmission capacity and fixed external input of cercariae. (Adapted from Nasell, unpublished b, p. go.)
All the curves in Fig. 13. 9 correspond to the same, fixed transmission capacity of cercariae from snails to people and the same, fixed external input of cercariae. The three curves correspond to different levels of external input 82 of eggs. The highest level of external egg input 82 ,111 leads to a unique worm load as a function of the abscissa T 2, which measures the amount of transmission of eggs from people to snails (T2 is proportional to the number N 1 of people). In this case the only way to lower m is to lower T 2, and the equilibrium m varies smoothly as T 2 varies. But for smaller values like 82 ,v 82 ,11 of

SCHISTOSOMIASIS: A HUMAN HOST-PARASITE SYSTEM 255
external egg input which are below a certain threshold, m may fall either on the lower or on the upper curve. If m falls on the upper curve, then one strategy of control, as before, is to reduce T 2 and obtain a corresponding smooth reduction in m. A more dramatic possibility is to shift the initial conditions by coordinated programmes of human case finding and treatment so that m shifts to the lower line. Then, if it is still desirable, T 2 can be reduced further. Unfortunately, this possibility leaves the community vulnerable to transfer back to a higher m if an uncontrolled influx of infection effectively reverses the change in initial conditions.
A more detailed review of all these mathematical models of schistosomiasis appears in Cohen (1976). See also Hairston (1973).
13.8 A broader view
"N. A. Croll: Are definitive hosts always idiots? J. C. Holmes: Definitive hosts are not idiots. Quite the contrary."
(Canning and Wright, 1972, pp. 148-49)
13. 8. I The ecology of human host-parasite systems
For concreteness, this chapter focuses on schistosomiasis. Other diseases, described by Crosby (1972), May (1958, 1961), Cockburn (1963), Van Oye (1964), Ford (1971), and, magnificently, Burnet and White (1972), deserve the same ecological approach. When descriptions revel mystically in the incomprehensible subtlety and unmanageable complexity of disease ecology, the success of simple models in schistosomiasis should not be forgotten.
Some attempts to generalize about human host-parasite systems immediately formalize an image of the transmission of infection, without (at least until recently) overmuch attention to biological mechanisms (Bailey, 1957, whose new edition has recently appeared: 1975; Dietz, 1967; Crofton, 1971a, 1971b). Other attempts to elucidate classes of biological mechanisms (Bradley, 1974) are ripe for, but have yet to receive, adequate mathematical formalization; hence many
· implications of such attempts remain to be worked out. In view of the generally primitive level of theoretical ecological
understanding of human host-parasite systems, policies for public health which follow from models should probably be presented, not as

CHAPTER 13
unconditional recommendations, but as proposals for experimental tests using the best field controls possible.
IJ. 8. 2 Broader aspects of disease
The models in this chapter describe the dynamics of infection. Infection is not tantamount to disease. Coping with disease requires, in addition to purely biomedical understanding, a grasp of its significant economic and social aspects.
For example, using quantitative models from economics and demography with extensive observations from St Lucia, a clribbean island, Weisbrod et al. (1973) ask: Does infection cause disease¥ They find it impossible to evaluate the impact ofS. mansoni on birth and death rates, the achievement of school children, and the labour productivity of adults without considering four intestinal nematodes of man which are also very widespread there. Throughout the poor countries of the world, most parasitized people are miniature ecosystems of multiple parasites which interact (see also Lehman et al., 1970). Moreover, ecological alterations such as the damming of rivers, the construction of irrigation canals, and the resettlement of human populations into new lands have greatly increased opportunities in some regions for schistosome bearing snails to propagate and to contact people. Other quantitative approaches to evaluating economic and demographic effects of schistosomiasis are presented and cited by Cohen (1974, I975) and Ansari and Junker (1¢9).
Because the real world seems painfully negligent of the boundaries between academic departments in universities, models which will be ·practically useful in coping with that world require an integration of ecology and of the biology of individuals with economics and sociology. The final chapter of this book explores such models.