therapeutic drug monitoring and population analysis as
TRANSCRIPT

Therapeutic Drug Monitoring and Population Analysis as Applied to Leflunomide and Cyclosporine Therapy in Dogs with Immune-mediated Diseases
by
Jameson Smoak Sofge
A thesis submitted to the Graduate Faculty of Auburn University
in partial fulfillment of the requirements for the Degree of
Master of Science
Auburn, Alabama December 13, 2014
leflunomide, cyclosporine, canine, monitoring
Copyright 2014 by Jameson Smoak Sofge
Approved by
Dawn Boothe, Chair, Professor of Veterinary Medicine Robert Judd, Boshell Associate Professor of Veterinary Medicine
James Wright, Professor of Veterinary Medicine

ii
Abstract
Two immunomodulator drugs, leflunomide (teriflunomide is its active metabolite) and
cyclosporine, are often monitored in veterinary patients in order to support the design of dosing
regimens when used to treat immune-mediated diseases. Such information can be complied to
offer population-based recommendations. However, while cyclosporine has been well studied in
normal animals, leflunomide has not been. This thesis describes the disposition of leflunomide in
normal dogs, and an assessment of factors that impact drug concentrations for either drug in
patients with clinical disease.
For leflunomide, apparently normal, healthy dogs (n=4) were orally dosed with 4 mg/kg
and it and teriflunomide were quantified in plasma using HPLC. No leflunomide was detected in
any of the samples. Mean pharmacokinetic values for teriflunomide were: Cmax=18.9±8.5
mcg/mL and half-life=25±10 hr. For clinical patients, samples were monitored between January
2012 and May 2014. In animals that responded to treatment, the recommended therapeutic
range of teriflunomide is 25-45 mcg/mL. Approximately 77% of dogs on leflunomide were
considered responders. The mean dose of leflunomide used to achieve control was 2.8 mg/kg
once daily. The correlation (r) between leflunomide dose and teriflunomide plasma
concentrations was 0.26.
For cyclosporine, clinical samples were monitored between October 2010 and May 2014.
Marked variability was seen amongst cyclosporine plasma concentrations. The correlation (r)
between cyclosporine dose and plasma concentration ranged from 0.0007-0.32 depending on

iii
dosing interval and sample collection time. Half-life also showed marked variability.
Approximately 60% of dogs on cyclosporine were considered responders. Covariate analysis
revealed the following potentially significant relationships with cyclosporine plasma drug
concentrations: breed, disease, ketoconazole, and generic preparations. Covariates with a
significant relationship with response were co-treatment of cyclosporine and prednisone or
prednisolone, or disease (arthritis, anemia, and inflammatory bowel disease).This study supports
the need for monitoring based on the lack of dose-response relationships for either drug. Several
cofactors appear to influence concentrations.

iv
Acknowledgments
This project would not have been possible without contributions from many people.
Special thanks to the Clinical Pharmacology Laboratory staff and graduate students. It has been
a pleasure working with each of you. Roy Harmon and Crisanta Cruz-Espindola were
instrumental in sample collection and analysis. Haden Bunn did great work on the leflunomide
method development. Thanks to Heather Gossett, Marike Visser, and Nick Rainosek (and their
dogs) for their contributions to the leflunomide pharmacokinetic study. Heather Gossett was also
extremely helpful in the writing stages of the project. My committee members, Dr. Judd and Dr.
Wright, were supportive, patient, and gave me great advice on many different occasions. Dr.
Boothe, my advisor and mentor, encouraged me and gave me the opportunity to pursue this
degree. I will be forever grateful for her guidance, instruction, and example. My wife, Danielle,
has been a rock on which to lean when times have gotten tough. Always patient, loving, and
supportive; I would be nothing and nowhere without her. Finally, and most importantly, I thank
God for the many opportunities and blessings He has bestowed upon me.

v
Table of Contents
Abstract ......................................................................................................................................... ii
Acknowledgments........................................................................................................................ iv
List of Tables .............................................................................................................................. vii
List of Figures ............................................................................................................................ viii
List of Abbreviations .................................................................................................................... x
Chapter 1: Background ................................................................................................................. 1
1.1: Drug Movement ........................................................................................................ 1
1.2: Pharmacokinetics/Pharmacodynamics ....................................................................... 2
1.3: Therapeutic Drug Monitoring .................................................................................... 5
1.4: Clinical Pharmacology Laboratory ............................................................................ 8
1.5: Study Design .............................................................................................................. 8
Chapter 2: Leflunomide .............................................................................................................. 11
2.1: Introduction ............................................................................................................. 11
2.2: Materials and Methods ............................................................................................. 11
2.3: Results ..................................................................................................................... 15
2.4: Discussion and Conclusions .................................................................................... 22
Chapter 3: Cyclosporine ............................................................................................................. 24
3.1: Introduction ............................................................................................................. 24
3.2: Materials and Methods ............................................................................................. 26
vi
3.3: Results ..................................................................................................................... 28
3.4: Discussion and Conclusions .................................................................................... 42
Chapter 4: Summary Discussion and Conclusions ..................................................................... 45
References ................................................................................................................................. 48
Appendix 1: Leflunomide SAS® code ..................................................................................... 51
Appendix 2: Cyclosporine SAS ® code ................................................................................... 60

vii
List of Tables
Table 2.1 .................................................................................................................................... 19
Table 3.1 .................................................................................................................................... 29
Table 3.2 .................................................................................................................................... 41
Table 3.3 .................................................................................................................................... 42

viii
List of Figures
Figure 2.1 ................................................................................................................................... 16
Figure 2.2 ................................................................................................................................... 16
Figure 2.3 ................................................................................................................................... 17
Figure 2.4 ................................................................................................................................... 17
Figure 2.5 ................................................................................................................................... 18
Figure 2.6 ................................................................................................................................... 19
Figure 2.7 ................................................................................................................................... 21
Figure 2.8 ................................................................................................................................... 21
Figure 3.1 ................................................................................................................................... 30
Figure 3.2 ................................................................................................................................... 30
Figure 3.3 ................................................................................................................................... 31
Figure 3.4 ................................................................................................................................... 32
Figure 3.5 ................................................................................................................................... 32
Figure 3.6 ................................................................................................................................... 33
Figure 3.7 ................................................................................................................................... 33
Figure 3.8 ................................................................................................................................... 34
Figure 3.9 ................................................................................................................................... 36
Figure 3.10 ................................................................................................................................. 37
Figure 3.11 ................................................................................................................................. 38

ix
Figure 3.12 ................................................................................................................................. 39
Figure 3.13 ................................................................................................................................. 40

x
List of Abbreviations
A77-1726 Teriflunomide
Atopy Atopic dermatitis
AUC Area under the curve
BID Every 12 hours (twice daily)
CI Confidence interval
Cl Clearance
Cmax Maximum plasma drug concentration
CPL Auburn University Clinical Pharmacology Laboratory
CsA Cyclosporine
ELISA Enzyme-linked immunosorbent assay
F Bioavailability
FL Fluorescence
GC Gas chromatography
GME Granulomatous meningoencephalitis/myelitis
HPLC High performance liquid chromatography
IBD Inflammatory bowel disease
IMHA Autoimmune hemolytic anemia
ITP Immune-mediated thrombocytopenia
LLOD Lower limit of detection

xi
LLOQ Lower limit of quantitation
LOD Limit of detection
LOQ Limit of quantitation
MS Mass spectrometry
MRT Mean residence time
PDC Plasma drug concentration
PRCA Pure red cell aplasia
QD Every 24 hours (once daily)
RIA Radioimmunoassay
TDM Therapeutic Drug Monitoring
Tmax Time to maximum plasma drug concentration
ULOD Upper limit of detection
ULOQ Upper limit of quantitation
UPLC Ultra-performance liquid chromatography
UV Ultraviolet
Vd Volume of distribution

1
Chapter 1: Background
1.1: Drug Movement
Drug movement may be described in three different phases: absorption (A) of the drug
from the site of administration into systemic circulation, distribution (D) of the drug from
circulation into tissues and back into peripheral circulation, metabolism (M) of the drug (most
commonly in the liver), and excretion (E) of the drug from the body either unchanged by
metabolism or as a metabolite. In humans and veterinary medicine, metabolism most commonly
occurs in the liver, and excretion occurs through the kidney or bile.
Each drug movement (ADME) is influenced by physiologic as well as pharmacologic
properties which may reflect the patient’s ability to respond to treatment with a drug. For oral
absorption, the major determinants of drug absorption into peripheral circulation are:
gastrointestinal pH (weak acids are readily absorbed, however, weak bases are trapped and are
unable to be absorbed), surface area (the small intestine), thickness of the mucosa (absorption
inhibited by inflammatory infiltrates), epithelial permeability (vascular compromise and
subsequent lack of epithelial barrier), and motility. Inherent properties of a drug may also alter
the rate of absorption through manipulation of the drug’s chemistry that alters the pH or
concurrent administration with food or other drugs which inactivate the product.
Distribution is influenced by the degree of drug binding to plasma proteins, organ blood
flow, capillary fenestration, and environmental pH. Metabolism, which occurs most frequently
in the liver, is responsible for activating a drug (pro-drug to active drug), inactivating a drug, or
forming active metabolites. This is accomplished by a two stage process involving a change of

2
the original lipid soluble drug to polar molecules (phase I) in preparation for conjugating the
molecule (phase II) with a large water soluble molecule such as glucuronide or glutathione.
Excretion of a drug most commonly occurs through the kidneys, and can be influenced
by blood flow, glomerular filtration, active tubular secretion, and passive reabsorption. A drug
excreted solely by filtration should be cleared at a rate similar to the patient’s glomerular
filtration rate; where as a drug that is actively secreted in the urine may exceed the filtration rate.
Excretion into the bile is most commonly seen with drugs that are very lipid soluble such as
drugs that are greater than 600 MW in size. Accounting for these factors that affect a drug’s
absorption, distribution, metabolism, and excretion can be used to predict changes in drug
concentration that will occur in the patient such that the dosing regimen can be appropriately
modified to facilitate safe and effective therapy (Boothe, 2012).
1.2: Pharmacokinetics/Pharmacodynamics
Simplistically, pharmacokinetics is the study of what the body does to the drug. More
specifically, it is the science of the time course of (generally plasma) drug concentrations and as
such, is a means of describing mathematically the absorption (if extravascular), distribution,
metabolism and excretion of a drug. Pharmacokinetic parameters are modeled based on
measurable criteria such as dose, body weight, and plasma drug concentration. In general, drugs
most commonly move by passive diffusion, with drug movement generally following first order
kinetics, meaning that a constant fraction of drug moves per unit time. The line that is derived
from drug movement over time is defined by a slope (rate constant = k) and Y intercept (Co). Cp
is the predicated concentration at any time (t) (Cp = Coe-kt). For each drug movement, or change

3
in the rate of elimination of drug from the body, a Y intercept and slope will contribute to the
equation (eg, two compartment model: Cp=Ae-αt + Be-βt, where A and B and α and β are the
respective Y intercepts and slopes for the first and second components respectively).
Pertinent pharmacokinetic parameters that describe drug behavior that can be determined
from plasma drug concentration versus time data. These include (example units) but are not
limited to:
1. Cmax (mg/ml) is the maximum plasma drug concentration achieved at the given dose,
after extravascular administration with Co being the extrapolated (from the Y axis) “maximum”
concentration after IV administration.
2. Time to Cmax (Tmax; min) is the time to maximum plasma drug concentration after
extravascular administration.
3. Area under the curve (AUC; mg/L/min) which describes the total time course of the
drug (usually calculated by Co/kel if one compartment, A/ + B/, if two, etc.).
4. Volume of distribution (Vd; L/kg), that is, the (theoretical or apparent) the volume that
the drug would have to be distributed to if present throughout the body at the same concentration
as that measured in plasma. Vd inversely influences PDC and is a direct determinant of dose
(larger Vd leads to lower PDC). Volume of distribution also influences half-life: a large Vd pulls
the drug into tissues, away from the organs of clearance, thus prolonging its elimination from the
body.
5. Elimination half-life. Defined as an inverse relationship with the slope such that half-
life = 0.693/k; for each component of the curve, a half-life can be determined. In the case of
multicomponent curves, the half-life which describes the elimination of drug from the body is
derived from the slope of the terminal component of the plasma drug concentration versus time

4
curve. Elimination half-life is important because it determines the amount of fluctuation between
Cmax and Cmin and is the basis for determining the dosing interval. A short elimination half-life –
such as occurs for cyclosporine – may be undesirable if response to therapy is dependent on the
presence of the drug throughout a dosing interval. The elimination half-life is the
pharmacokinetic variable used to determine duration of time necessary to remove the drug from
the patient’s body. At one half-life, 50% is eliminated; with the next half-life, 50% of the
remaining drug is eliminated (25%) for a total of 75%; at 3 half-lives, another 12.5% is
eliminated (half of 25%) for a total of 87.5%; by 4 half-lives, 93.75% is eliminated, and by 5
half-lives, 96.9% is eliminated. In general, 3 half-lives is enough time for drug movement to be
clinically complete.
Half-life also determines the time to reach steady-state equilibrium (steady-state), the
time point at which the amount of drug leaving the body is equal to the amount reaching
systemic circulation, thus maintaining consistent PDC. Steady-state is reached after 3 to 5 drug
half-lives have lapsed once a new dosing regimen has started, and only with drugs that
accumulate with multiple dosing will reach steady-state. A drug with a long half-life, such as
leflunomide, may present challenges in that the time to steady-state may be unacceptably long.
However, in such instances, once steady-state is achieved, the patient might be “protected” from
therapeutic failure that might otherwise occur with dramatic fluctuation in drug concentrations
that is typical of drugs with short half-lives. Knowing whether a drug has a short or long half-life
may be important for therapeutic success. Monitoring approaches also will vary for drugs with
short half-lives, for which both a peak and trough concentration might be important, versus drugs
with a long half-life, for which a sample collected any time during the dose interval may be
sufficient.

5
6. Clearance. As important as half-life is, it is also the parameter that is most subject to
change in response to physiologic, pharmacologic and pathologic factors. The rate of
elimination (min-1) or t1/2 (min) of a drug reflects the effect of two pharmacokinetic parameters.
Elimination is directly proportional to the volume of blood cleared per unit time, referred to as
clearance (CL: ml/kg/min) and indirectly (inversely) proportional to volume to which the drug is
distributed, referred to as volume of distribution (a drug that is distributed to tissues is not
available for clearance by the liver or kidney). For example, if volume of distribution of a drug
decreases (eg, in a dehydrated patient), more drug is in each volume cleared, and elimination
increases (half-life is shorter) even if clearance does not change. However, if clearance also were
to decrease (e.g., decreased GFR), less volume would be going through the kidney and thus
elimination would not change, despite profound differences in drug disposition. Like Vd,
however, CL only can be determined after IV administration of a drug since it reflects the
proportion of the Vd that is irreversibly cleared per unit time (CL = Vd*K) (Boothe, 2012).
1.3: Therapeutic Drug Monitoring
Therapeutic drug monitoring (TDM) is a tool that is used to guide dosing regimens for
drugs that are likely to be characterized by marked variability in disposition and thus are not
characterized by a strong relationship between dose and plasma drug concentration or response.
It can replace the trial and error approach to design of dosing regimens. As such, it is most
important for drugs that are potentially toxic, characterized by a poor dose-plasma drug
concentration–response relationship or for disease for which success or failure indicators are
insensitive or put the patient at risk (i.e., epilepsy, immune-mediated disease). TDM is based on

6
validated methods that quantitate the amount of drug (parent or active metabolite) in plasma,
serum, or whole blood. There are multiple methods by which drugs can be quantitated in body
tissues, including plasma. Among the more common methods are immunoassays, which use
compound-specific antibodies in conjuncture with a reporter molecule (such as enzyme-linked
immunosorbent assays (ELISA) or radioimmunoassay (RIA)). However, the disadvantage of
this method is that the antibodies directed toward the drug may not sufficiently discriminate
between parent and metabolite. The use of monoclonal – as opposed to polyclonal- antibodies
increases the accuracy of immunoassays in the presence of metabolites. Further, if the metabolite
is active, then the assay ideally will detect all active components. Immunoassays have been
developed for a number of drugs using automated instrumentation, thus facilitating the accurate,
yet rapid measurement of drug in the body, at a reasonable cost. Cyclosporine is among the drugs
for which an immunoassay for use in humans has been approved by the Food and Drug
Administration. However, although based on a monoclonal antibody, it nonetheless does detect
several metabolites.
Alternative methods for quantitating drug in the body include, but are not limited to, high
performance liquid chromatography (HPLC), ultra-performance liquid chromatography (UPLC),
or gas chromatography (GC) separation with ultraviolet (UV), fluorescence (FL), or mass
spectrometry (MS). The method must be rapid, cost effective, precise (repeatable), accurate, and
specific (able to distinguish the target drug from other drugs) (Boothe, 2012). An advantage of
these methods is that parent compounds can be discriminated from metabolites. However, these
methods often are tedious, requiring calibration with each “run”, and require costly, high
maintenance instrumentation. Further, method based on these methods can generally be
developed for most drugs without the need of producing antibodies.

7
TDM is a tool that can be helpful in designing and maintaining a dosing regimen.
Therapeutic ranges offer guidelines for target PDC based on the PDC at which most patients
might respond. However, a “therapeutic range” is a population statistic, indicating the range of
concentrations between which a sample population is expected to respond to the drug. As such, a
therapeutic range offers a population target. However, for the individual patient, each patient is
different and a patient-specific concentration should be the basis for TDM. When to draw the
sample(s), both amount of time after starting the treatment and time post dose is dictated by the
pharmacokinetics of the drug, which should be established in the target species. TDM can
provide useful information at several different time-periods in the cycle of treatment (Boothe,
2012).
Once a loading dose is complete (for drugs with a long elimination half-life), or once a
maintenance dose has reached steady state (typically 3 – 5 half-lives), a baseline value can
provide valuable information regarding the therapeutic target for the patient. Periodic rechecks
can ensure that effective concentrations are maintained and that toxic concentrations are avoided,
potentially preventing adverse events such as therapeutic failure or drug toxicity. If an adverse
event does occur, monitoring can help identify the cause of therapeutic failure or confirm
toxicity. Changes in patient factors (such as dose, dose interval, disease, diet, or other
treatments) may also provide grounds for checking levels to identify impact on treatment
exposure (Boothe, 2012).

8
1.4: Clinical Pharmacology Laboratory
The Auburn University Clinical Pharmacology Laboratory (CPL) performs veterinary
TDM on canine, feline, equine, and exotic species. Whole blood, serum or plasma samples to be
tested for specific drugs being used to control disease are submitted from laboratories and
veterinary clinics throughout the United States and internationally. These results in conjuncture
with recommendations by the clinical pharmacologist or residents are used to make medication
decisions.
The CPL results are kept in a Microsoft® Access (2007-2013) database. The current
database contains results from January, 2003 through the present. In this database are greater
than 60,000 submissions representing more than 70,000 results. Along with measured drug
concentrations, the database also contains other pieces of patient medical records. This includes,
but is not limited to: species, breed, gender, age, history, drugs, dosages, clinical response, and
drug side effects. The data collected in this database has served to provide clinically relevant
retrospective analysis for the areas of small animal seizure management, anti-microbial
recommendations for both small and large animals, as well as immunomodulator therapy in
small animal practice.
1.5: Study Design
Among the drugs for which TDM can provide effective guidance are those that target the
immune system. Both therapeutic failure and overzealous therapy can result in life-threatening
consequences to the veterinary patient. Among the most common immunomodulating drugs used

9
in veterinary medicine is cyclosporine. Cyclosporine is approved for use in dogs and as such, has
a long history of successful use. Surprisingly, however, little information is available regarding
relationships among dose, plasma drug concentrations and response in dogs. Recently, the use of
leflunomide, an immunomodulating drug with a differing mechanism of action, has emerged in
dogs that are not sufficiently responding to cyclosporine.
In this study we focused on improving the use of both of these drugs in animals through
TDM and two approaches were used. First, because essentially no information is available
regarding monitoring of leflunomide in animals, we set out to determine the conditions under
which TDM of leflunomide might take place, including determining a therapeutic range. This
necessitated development of an HPLC method for quantitation of leflunomide and its active
metabolite teriflunomide in canine serum and plasma. Because little information was available
regarding the pharmacokinetics of leflunomide in dogs, its disposition after oral administration
was evaluated by giving leflunomide to dogs and measuring the leflunomide and teriflunomide
concentrations in plasma. The conditions for monitoring leflunomide were also determined.
Signalment, history, presenting complaint and response to therapy of clinical samples submitted
for the leflunomide assay, were examined to identify trends and relationships among PDC,
controlled clinical response, and potential covariates.
Secondly, we attempted to answer questions regarding the proper methods for monitoring
cyclosporine in dogs. This approach was based on retrospective information collected from
samples submitted for TDM by small animal practices in patients receiving cyclosporine for
immunosuppressive therapy. This information was used to describe the population demographics
and statistics as well as to identify covariates for variability in PDC associated with cyclosporine

10
administration. In both arms of this study we explored the relationship between PDC and the
control of clinical signs.

11
Chapter 2: Leflunomide
2.1: Introduction
Leflunomide is a human approved immunomodulatory drug commonly used in dogs for a
variety of immune-mediated diseases. Leflunomide is a prodrug with its activity solely
dependent on rapid and complete conversion to the active metabolite, teriflunomide (A77-1726)
(Figure 1). Studies have demonstrated leflunomide to be useful for treatment of a variety of
immune mediated diseases in dogs and cats (Mehl, 2012; Gregory, 1998; Kyles, 2001).
However, studies describing the pharmacokinetics of leflunomide or its metabolite in dogs are
limited (Singer, 2011). Further, the therapeutic range has not been described for dogs. The
purpose of this study was to describe the disposition of teriflunomide in dogs after single oral
dosing of leflunomide (pharmacokinetics) and then to determine a therapeutic range for
teriflunomide in dogs with spontaneous immune-mediated disease (pharmacodynamics).
2.2: Materials and Methods
This study was implemented using two approaches: a pharmacokinetic study which
established the disposition of leflunomide in normal dogs. From this, the most appropriate time
for collection of samples and the impact of sample handling on drug concentrations was
determined; and a prospective TDM trial that established dose, concentration, and response

12
relationship in dogs with spontaneously occurring immune-mediated disease. All studies were
approved by the Institutional Animal Care and Use Committee (IACUC), and the Auburn
University College of Veterinary Medicine Clinical Research Review Committee (CRRC).
Samples were collected and analyzed by the Auburn University Clinical Pharmacology TDM
service.
In vitro study
Dog plasma was analyzed for Teriflunomide (A77-1726) concentrations by HPLC with
ultraviolet (UV) detection. The HPLC system consisted of a Waters 717 plus autosampler,
Waters 1525 Binary pump and a 2487 UV-Visible detector (Waters Corporation™, Milford,
MA, USA). Separation was achieved with a Luna C18, 5 µm, 150 x 4.6 mm column
(Phenomenex Inc. ™, Torrance, CA, USA). The mobile phase consisted of 40:60, 0.05 M
Potassium dihydrogen phosphate, KDP, (pH adjusted to 3.0 w/ phosphoric acid):Acetonitrile
(VWR®, Radnor, PA, USA) with the flow rate set to 1 mL/min. The standard curve was
generated ranging from 2.5 to 200 mcg/mL by fortifying canine plasma with known amounts of
Teriflunomide (VWR®, Radnor, PA, USA) reference standard and accepted if the coefficient of
determination (r2) was at least 0.999 and the predicted concentrations were within 10% of the
actual concentrations. Prior to analysis 500 µL of acetonitrile were added to tubes containing 250
µL of reference standard. The contents of each tube were mixed vigorously for 20 seconds
through vortexing, and then subjected to centrifugation for 10 minutes at 3000 x g. The volume
of clear supernatant injected into the column was 20 µL. The retention time for Teriflunomide
was 3.8-4.3 min and UV absorbance was monitored at 275 nm.

13
Pharmacokinetic study
Four, healthy, client owned dogs (two female, two male, all neutered; 2 Rottweilers, 1
Shetland sheepdog and 1 mixed breed) ranging in 3 to 6 years of age were studied. Healthy
participants were solicited from students, faculty, or staff. Each person was provided an informed
consent approved by Auburn University’s Clinical Research Review Committee.
Each dog was determined as healthy based on a complete blood cell count and serum
chemistries. The morning of each pharmacokinetic study, an indwelling catheter (14 G over the
wire Arrow catheters) was placed in the external jugular vein of each dog, using manual restraint
and topical anesthetic gel.
Dogs were fasted at least 4 hours prior to the study. Each dog received 4.0 mg/kg
leflunomide orally. Selection of this dose was based on previously published literature in both
dogs and cats indicating both a safe as well as clinically comparable dose (Mehl 2011, Singer
2011). Whole blood was collected from dogs at: 0, 5, 10, 15, 20, 30, 45, 60, 90 minutes, and 2,
6, 12, 24, and 48 hours after administration. For samples 0-60 minutes, the whole blood sample
(5 mLs) was treated with acetonitrile (0.5 mL) to inhibit conversion of parent compound to
active metabolite. For the remaining samples, whole blood was centrifuged at 3000 rpm for 10
minutes at 18 °C. The plasma was then harvested from the packed red blood cells and treated
with acetonitrile (0.5 ml). Once processed, samples were immediately analyzed via HPLC.
Parameters of interest included AUC (ng*hr/ml), Cmax (oral, mcg/mL) at time (Tmax; h); t1/2 (h)
and mean residence time (MRT; h). For in vitro samples, only AUC were determined. From
these time collection points (both in vivo and in vitro), the optimum time of sample collection,

14
storage conditions for shipment, and processing of samples were established for the purpose of
the prospective therapeutic monitoring portion of the study.
Therapeutic Drug Monitoring
Clinical samples were received from practitioners treating immune-mediated disorders in
dogs as part of the CPL TDM Service between January 2012 and May 2014. Inclusion criteria
included canine patients receiving once daily therapy of leflunomide for at least 5 days (steady
state). Submission forms must have provided leflunomide dose in mg/kg or ability to calculate
mg/kg based on dose and body weight. Also, the teriflunomide plasma drug concentration must
have been above the LLOQ. To maintain the independence of each observation, patients
(identified by clinic, animal name, and owner last name) with multiple accessions meeting
inclusion criteria were only included once. To account for potential dose changes to achieve
control, the accession with the highest dose (mg/kg) was selected from those patients that had
multiple accessions.
Data Management and Analysis
All statistics were performed using SAS® statistical software (version 9.3). All pairwise
comparisons were adjusted for using a Tukey-Kramer adjustment. Population demographics
were counted using Proc Freq. Group comparisons were performed by analysis of variance
(ANOVA) using Proc GLM. Descriptive statistics were generated by Proc Means. Correlations
were performed using Proc Corr. Regression plots were generated using Proc Sgplot. The

15
relationship between leflunomide dose (mg/kg) and teriflunomide plasma concentration (μg/ml)
was estimated by correlation. Samples for which clinical control was considered positive
(meaning disease had responded to leflunomide treatment) were used to calculate a therapeutic
range.
2.3: Results
Assay
The linear correlation coefficient for Teriflunomide was 0.9995. The limit of detection
(LOD) was 2.5 mcg/mL and the lower and upper limits of quantification (LOQ) for
Teriflunomide were 5.0 mcg/mL and 200 mcg/mL respectively. The RSD% for Teriflunomide,
5.0, 10, 50, 100, 150, 200 mcg/mL were 4.5%, 4.6%, 3.4%, 2.5%, 4.2%, and 4.5% respectively.
During the development of our assay, we found that the parent compound is
spontaneously converted to metabolite in plasma in-situ (Figure 2.1, 2.2, and 2.3). However,
lower temperatures (-20oC, -80oC) slowed the rate of conversion (Figure 2.4 and 2.5). As such,
standard curves only contained the active metabolite.

16
Figure 2.1: Peak area vs concentration plot for leflunomide at room temperature calibration
standards run on days 1-8.
Figure 2.2: Peak area vs concentration plot for A77-1726 at room temperature calibration
standards run on days 1-8.

17
Figure 2.3: Leflunomide and Teriflunomide (A77-1726) peak areas in the same standard (SK9-5,
50 μg/mL) over multiple days at room temperature, demonstrating gradual spontaneous
metabolism of the parent compound to the active metabolite. The red arrow represents the
direction of conversion
Figure 2.4: Peak area vs Concentration plot for A77-1726 at -20oC calibration standards run on days 1-8.

18
Figure 2.5: Peak area vs Concentration plot for Leflunomide at -80oC calibration standards run on days 1-8.
Pharmacokinetics (Experimental)
No leflunomide was detected in any of the pharmacokinetic study samples. For the active
metabolite, teriflunomide, Table 2.1 delineates selected pharmacokinetic parameters for the time
versus concentration curves demonstrated in Figure 2.6. Plasma drug concentrations remain in
the therapeutic range for at least 12 hours after administration of a single, oral 4 mg/kg dose.

19
Parameter Mean ± SD
Cmax (μg/ml) 18.9 ± 8.5
Tmax (hr) 1.38 ± 0.25
AUC (hr*μg/mL) 804 ± 285
Half-life (hrs) 25 ± 10
Vd/F (L/kg) 23 ± 32
Cl/F (L/hr/kg) 0.49 ± 0.6
MRT (hr) 175 ± 234
Table 2.1: Select pharmacokinetic parameters for teriflunomide after single dose oral
administration of 4 mg/kg leflunomide in 4 normal dogs.
Figure 2.6: Teriflunomide (A77-1726) concentration (μg/ml) over time (hr) after single
oral administration of 4mg/kg Leflunomide in 4 normal dogs.

20
Therapeutic Drug Monitoring (Clinical)
Out of 182 clinical samples, based on clinician assessment, 141 (77%) animals were
controlled, 23 (13%) animals were not controlled, and 18 (10%) animals were unspecified. The
most common indication was granulomatous meningoencephalitis (GME) at approximately 30%
(n = 55). No leflunomide was detected in any clinical sample. There was a significant difference
(F-value = 24.38, p <0.0001) between mean concentrations for samples indicating no control of
clinical signs versus those samples indicating control of clinical signs (See Figure 2.7). The
mean PDC of uncontrolled patients was 52.2 ± 38.6 μg/ml (CI95% of 43.9-60.4 μg/mL). The
mean PDC of controlled patients was 29.8 ± 15.3 μg/ml (CI95% of 26.5-33.2 μg/ml). The
double sided 95% distribution teriflunomide plasma concentrations in animals whose disease
was considered controlled was 5.0-59.3 μg/ml. Sample collection occurred any time during the
dosing interval. The mean dose of leflunomide used to achieve control was 2.8 mg/kg once daily
(CI95% of 2.6-3.0 mg/kg). The correlation (r) between leflunomide dose and teriflunomide
plasma concentrations was 0.26 (p = 0.0003) (Figure 2.8).

21
Figure 2.7: Box plot of trough teriflunomide (A77-1726) PDC (μg/ml) based on control
of clinical signs (n= 23 No, 141 Yes). F-value = 24.38, p-value <0.0001. Outliers = o.
Figure 2.8: Leflunomide dose (mg/kg) vs. trough teriflunomide (A77-1726) concentration
(μg/ml) based on clinical samples (n=182). Correlation (r) = 0.26 (p = 0.0003).

22
2.4: Discussion and Conclusions
Studies of leflunomide in canine clinical patients are limited. However, as early as 1998,
Gregory and coworkers (Gregory 1998) reported the use of the drug (1.5 mg/kg twice daily to 2
to 4 mg/kg once daily) in dogs (n = 29) afflicted with various immune-mediated disorders.
These include idiopathic thrombocytopenic purpura (n = 3; good to excellent response), IMHA
with idiopathic thrombocytopenic purpura (Evans syndrome), systemic histiocytosis (n = 3; one
failure and two total remissions), multifocal nonsuppurative encephalomyelitis (n = 5; good to
excellent response), and a variety of other immune-mediated disorders that had not responded to
glucocorticoids or azathioprine. Side effects included decreased appetite, mild anemia, and
bloody vomitus or stools (n = 3). This study led to experimental studies. Using a model of
canine renal transplantation, Kyles (2001, 2003) demonstrated a synergistic effect with
cyclosporine when combined with a leflunomide analogue. In similar studies, leflunomide has
been studied at doses ranging from 2 to 16 mg/kg/day as sole therapy or in combination with
cyclosporine in dogs undergoing experimental renal transplantation (Kyles 2001, 2003). Mean
trough leflunomide concentrations ranged from 10 μg/mL (2 mg/kg) to 55 μg/mL (16 mg/kg). By
using combination therapy, of cyclosporine and leflunomide at 4 mg/kg, survival time increased
from 28 to 68 days.
Since leflunomide was not detected in any of the pharmacokinetic study samples, it is
reasonable to conclude that leflunomide is rapidly and completely converted to teriflunomide in
dogs. Therefore, TDM of leflunomide can be solely based on teriflunomide plasma
concentrations. A correlation (r) between leflunomide dose and teriflunomide of 0.26 (p =
0.0003) indicates that prediction of plasma teriflunomide levels based on leflunomide dose will

23
be difficult. Therefore, TDM is recommended to ensure patients are reaching target levels of
teriflunomide. Based on a 25 hr half-life indicated by the pharmacokinetic study, a dose of 3.5
(3-4 mg/kg) once daily initially should achieve concentrations within the therapeutic range at
steady-state (3-5 days) and the target concentration at 24 hours post dose is 5.0-59.3 mcg/mL.
This concentration is inconsistent with ranges recommended in humans (>16 μg/ml) (van Roon,
2005). Therefore, when monitoring, a single trough sample (approximately 24 hours post dose) 1
week post dose change is recommended. Due to the lack of correlation between dose and A77-
1726 plasma concentrations recommends TDM to adjust doses for chronic therapy. Timing of
sample collection can be throughout a 24 hour dosing interval.

24
Chapter 3: Cyclosporine
3.1: Introduction
Cyclosporine (cyclosporine A, CsA), a very effective immune modulator, commonly is
used in dogs for a variety of immune-mediated diseases. Its use in the treatment of canine and
feline diseases has recently been reviewed (Archer, 2014). The CsA works by forming a
complex with cyclophilin that inhibits calcineurin. Inhibition of calcineurin prevents promotion
of cytokine genes, and subsequently T cell activation (Matsuda, 2000). As a drug, CsA is a large
molecule drug with a molecular weight of 1202.61 daltons (Da), and is extremely lipophilic,
which contributes to its poor oral absorption in the patient.
Metabolism of CsA occurs primarily in the liver, with a lesser extent in the intestinal
epithelial cells, through the cytochrome p450 enzyme CYP3A4. Metabolism leads to formation
of more than 20 metabolites, with some being active and others inactive. CsA is a known
substrate of P-glycoprotein, a prominent transport system in portals of entry (such as the
intestine), sanctuaries (such as the blood brain barrier), and drug excretion organs (such as the
kidney) (Boothe, 2012). In 2004, Steffan reported a mean half-life of 7.6 ± 1.1 hours in healthy
dogs. In 2006, Allenspach reported a mean half-life of 5.6 ± 1.2 in dogs with IBD.
In veterinary medicine, some of the most common uses for CsA include autoimmune
hemolytic anemia (IMHA), granulomatous meningoencephalitis/myelitis (GME), anemia,
inflammatory bowel disease (IBD), immune-mediated thrombocytopenia (ITP), atopic dermatitis
(atopy), arthritis, peri-anal fistulas, and pure red cell aplasia (PRCA). Because these diseases are
often life-threatening, it is not at all unusual for patients to be receiving multiple drugs.

25
The disposition of cyclosporine is markedly variable among animals. This reflects a
number of factors. Breed differences, although not documented, likely are to be significant, in
part because of the recognized deficiency in p-glycoprotein activity resulting from mutations in
the ABCB (MDR-1) (Mealey, 2010). Genetic differences in CYP3A4 metabolism are also likely
(Martinez, 2013). Because of the common role of p-glycoprotein and CYP3A4 in the disposition
of other drugs, drug interactions involving cyclosporine, which are well documented in humans,
are also likely in animals (Campana 1996). A likely major contributor to variability in
disposition is its oral formulation and variability in oral absorption. Cyclosporine is prepared as a
microemulsion in order to facilitate its oral absorption. Although a veterinary product is
approved for use in both dogs and cats (Atopica®; http://www.us.atopica.com/#), it is common
for veterinarians to prescribe alternatives in order to decrease cost. Among the alternatives are
human generics, of which currently more than 11 preparations are available (FDA Orange Book
(http://www.accessdata.fda.gov/scripts/cder/ob/docs/queryai.cfm). Although bioequivalence of
these products has been demonstrated in humans, this information cannot be extrapolated to
animals.
Further, and more disconcertingly, it is not at all unusual for veterinarians to prescribe
compounded cyclosporine. Variability among cyclosporine products compounded for animals
recently has been demonstrated (Umstead, 2012). Because of these and other factors, plasma
drug concentrations of cyclosporine are likely to be markedly variable among animals. Yet,
because it is used to treat life-threatening disorders, clinicians can monitor drug concentrations in
order to maintain cyclosporine concentrations within an assumed therapeutic range (Archer,
2014).

26
The CPL TDM monitors CsA for patients from animal hospitals across the United States.
The purpose of this study is to use the data in the TDM database to perform a retrospective study
with several goals: describe population demographics and pharmacokinetics, identify therapeutic
ranges, and identify potential covariates for changes in PDC or half-life.
3.2: Materials & Methods
Clinical submissions were selected from the TDM database between October 2010 and
May 2014. CsA was detected in canine EDTA whole blood using the Siemens (New York, NY)
Cyclosporine Immunoassay® (CSA) and the Siemens Cyclosporine Extended Range
Immunoassay® (CSAE) on a Siemens (New York, NY) Dimension Xpand Plus® general
chemistry analyzer. For CSA, the upper limit of quantitation was 500 ng/mL, and the lower limit
of quantitation was 25 ng/mL. CSA was calibrated using the Siemens CSA Calibrator® and
quality control was performed using More Diagnostics (Los Osos, CA) RAP/TAC/CSA
Controls®. For CSAE, the upper limit of quantitation was 2000 ng/mL, and the lower limit of
quantitation was 350 ng/mL, with ability to dilute up to 6000 ng/mL. CSAE was calibrated with
the Siemens CSAE Calibrator® and quality control was performed using More Diagnostics
Cyclosporine C2 Controls®.
To be included in this study submissions required the following information: canine
patients, dose in mg/kg, dose interval of twice daily (BID) or once daily (QD), dose of less than
or equal to 10 mg/kg on BID dosing, dose of less than or equal to 15 mg/kg on BID dosing. If a
patient had multiple accessions meeting the previous criteria, the earliest sample received that
specified clinical response regarding control was selected. Data collected from each patient

27
included: patient demographic information including species, breed, gender, and age. Additional
patient information included the disease being treated and drugs being co-administered. Drug
information included drug preparations (Atopica®, generic (human), or compounded; dose
(mg/kg), and interval; and monitoring-specific information, including peak versus trough sample
submission times. Response to therapy was recorded, when available, as “yes” or “no”, and was
based on assessment by the submitting veterinarian.
The results are stored in a Microsoft Access database. In addition to CsA plasma drug
concentration (PDC), patient demographic information, dosing information, and control of
clinical signs are kept when provided on the submission form. All statistics were run using
SAS® Statistical Software. All pairwise comparisons were adjusted for using a Tukey-Kramer
adjustment. Population demographics were counted using Proc Freq. Group comparisons were
performed by analysis of variance (ANOVA) using Proc GLM. Descriptive statistics were
generated by Proc Means. Correlations were performed using Proc Corr. Regression plots were
generated using Proc Sgplot. Testing for covariates was performed using Proc Reg or Proc
Logistic with backward selection. For many comparisons, due to the short half-life of CsA, the
samples were separated into dosing (BID vs QD) groups. These groups were further separated
into peak (less than 4 hours post dose) and trough (between 10 and 14 hours) for BID dosing;
and peak (less than 4 hours post dose), mid (between 10 and 14 hours), and trough (between 20
and 28 hours post dose) for QD dosing.
28
3.3: Results
Population Demographics
Samples from 916 dogs were analyzed. 320 (35%) cases did not specify clinical
response, while 185 (20%) indicated no control, and 411 (45%) indicated positive control of
clinical signs. There were 859 CsA PDC and 104 (83%) half-life values on BID dosing. There
were 189 CsA PDC and 22 (17%) half-life values on QD dosing. Age range was 0.5 to 17 years
with a mean value of 6.9 ± 3.2 years. Genders represented were unspecified female (n = 38),
intact female (n = 5), spayed female (n = 460), unspecified male (n = 55), intact male (n = 8),
and neutered male (n = 325). The top 5 most common breeds were mixed breed (n = 171),
German shepherd (n = 45), Dachshund (n = 43), Maltese (n = 42), and Chihuahua (n = 40).
As indicated by the patient history in the database, some of the concurrent medications
were pred (unspecified) (n = 94), prednisone (n = 342), prednisolone (n = 32), azathioprine (n =
63), omeprazole (n = 40), ketoconazole (n = 29), leflunomide (n = 15), and azithromycin (n = 5).
These drugs were checked for covariance throughout the analysis. The most commonly cited
diseases being treated were (IMHA) (n =116), GME (n = 84), anemia (n = 68), IBD (n = 51), ITP
(n = 39), atopy (n = 12), arthritis (n = 12), and PRCA (n = 6). These diseases were checked for
covariance throughout the analysis. See Table 3.1 for CsA dosing interval (how often dose is
given; BID = every 12 hours; QD = every 24 hours) breakdown by disease.

29
Disease BID Dosing QD Dosing Total
IMHA 100 16 116
GME 77 7 84
Anemia 64 4 68
IBD 37 14 51
ITP 36 3 39
Atopy 3 9 12
Arthritis 9 3 12
PRCA 6 0 6
Table 3.1: Dosing interval (how often dose is given; BID = every 12 hours; QD = every 24
hours) for cyclosporine in dogs for each disease being treated (see text for key to abbreviations).
.
Population Kinetics
The correlation (r) between log of PDC adjusted for dose over time was 0.24 (p <0.0001)
(See Figure 3.1). The correlation (r) between log of PDC adjusted for dose over time for BID
dosing was 0.24 (p <0.0001) (See Figure 3.2). The correlation (r) between log of PDC adjusted
for dose over time for BID dosing was 0.33 (p < 0.0001) (See Figure 3.3).

30
Figure 3.1: Log PDC adjusted for dose (ng/mL / mg/kg) over time (hours) (BID and QD dosing).
Correlation (r) = 0.24 (p <0.0001).
Figure 3.2: Log PDC adjusted for dose (ng/mL / mg/kg) over time (hours) (BID dosing).
Correlation (r) = 0.24 (p <0.0001).

31
Figure 3.3: Log PDC adjusted for dose (ng/mL / mg/kg) over time (hours) (QD dosing).
Correlation (r) = 0.33 (p < 0.0001).
The correlation (r) between dose (mg/kg) and PDC (ng/mL) was 0.04 (p = 0.42) for peak
samples (less than 4 hours post dose) on BID dosing (See Figure 3.4). The correlation (r)
between dose (mg/kg) and PDC (ng/mL) was 0.0007 (p = 0.99) for trough samples (between 10
and 14 hours post dose) on BID dosing (See Figure 3.5); 0.32 (p = 0.02) for peak samples (less
than 4 hours post dose) on QD dosing (See Figure 3.6); 0.20 (p = 0.23) for mid-interval samples
(between 10 and 14 hours post dose) on QD dosing (See Figure 3.7) and 0.15 (p = 0.29) for
trough samples (between 20 and 28 hours post dose) on QD dosing (See Figure 3.8).

32
Figure 3.4: CsA dose (mg/kg) vs. peak (less than 4 hours) CsA PDC (ng/mL) based on clinical
samples in dogs receiving CsA with BID dosing (n = 240). Correlation (r) = 0.04 (p = 0.42).
Figure 3.5: CsA dose (mg/kg) vs. trough (between 10 and 14 hours post dose) CsA PDC (ng/mL)
based on clinical samples on BID dosing (n = 219). Correlation (r) = 0.0007 (p = 0.99).

33
Figure 3.6: CsA dose (mg/kg) vs. peak (less than 4 hours post dose) CsA PDC (ng/mL) based on
clinical samples in dogs receiving CsA with QD dosing (n = 31). Correlation (r) = 0.32 (p =
0.02).
Figure 3.7: CsA dose (mg/kg) vs. mid-interval (between 10 and 14 hours post dose) CsA PDC
(ng/mL) based on clinical samples from dogs receiving CsA with QD dosing (n = 23).
Correlation (r) = 0.20 (p = 0.23).

34
Figure 3.8: CsA dose (mg/kg) vs. trough (between 20 and 28 hours post dose) CsA PDC (ng/mL)
based on clinical samples on QD dosing (n = 30). Correlation (r) = 0.15 (p = 0.29).
Due to the lack of correlation between dose and PDC, the marked variability was
examined for covariates in the next section. The mean half-life for all animals was 11.1 ± 12.9
hours. The median and mode were 4.8 hours and 3.7 hours respectively. The minimum half-life
was 2.2 hours, while the maximum half-life was 69.7 hours. The 95% confidence interval of the
mean was 8.7 – 13.6 hours. No concurrent medications (or combination of medications) or
diseases (see above) were significant covariates for half-life (p > 0.05). Age and gender were
also not significant covariates for half-life (p > 0.05).

35
“Responders” vs “Non-responders”
Analysis attempted to answer the question whether or not CsA concentrations varied
between patients in which clinical signs were controlled (“responders”) versus those in which
clinical signs were not controlled (“non-responders”). This question was asked for peak versus
trough concentrations in patients receiving CsA every 12 hrs (BID) or every 24 hrs (once daily
(QD). For the latter group, because samples also were collected mid interval, a 3rd category was
considered between responders and non-responders.
For BID dosed peak samples (less than 4 hours post dose) (n = 240), a significant
difference could not be detected between mean CsA PDC (F-value = 1.66, p =0.20) for
responders versus non-responders. Sixty-one non-responders had a mean PDC of 847.4 ng/mL
(95% CI = 696.3 – 998.4 ng/mL). One hundred seventy-nine responders had a mean PDC of
733.1 ng/mL (95% CI = 644.9 – 821.2 ng/mL) (See Figure 3.9).

36
Figure 3.9: Box plot of peak (less than 4 hours post dose) CsA PDC (ng/mL) based on control of
clinical signs (n= 61 No, 179 Yes) in dogs receiving CsA with BID dosing (F-value = 1.66, p
=0.20). Outliers = o.
For BID dosed trough samples (between 10 hours and 14 hours post dose) (n = 219), a
significant difference was detected between mean CsA PDC (F-value = 5.81, p = 0.017) for
responders versus non-responders. Ninety-two samples collected from non-responders had a
mean PDC of 268.7 ng/mL (95% CI = 202.4 – 335.0 ng/mL). One hundred twenty-seven
samples collected from positive responders had a mean PDC of 375.1 ng/mL (95% CI = 318.7 –
431.51 ng/mL) (See Figure 3.10).

37
Figure 3.10: Box plot of trough (10 hours to 14 hours post dose) CsA PDC (ng/mL) based on
control of clinical signs (n= 92 No, 127 Yes) in dogs receiving CsA with BID dosing (F-value =
5.81, p = 0.017). Outliers = o.
For QD dosed peak samples (less than 4 hours post dose) (n = 31), differences were not
significant at p < 0.05, but were significant at p < 0.10) between mean CsA PDC (F-value = 3.22,
p = 0.083) for responders versus non-responders. Fourteen samples collected from non-
responders, had a mean PDC of 558.3 ng/mL (95% CI = 86.9 – 1029.7 ng/mL). Seventeen
samples had from responders had a mean PDC of 1117.1 ng/mL (95% CI = 689.4 – 1544.9
ng/mL) (See Figure 3.11).

38
Figure 3.11: Box plot of peak (less than 4 hours post dose) CsA PDC (ng/mL) based on control
of clinical signs (n= 14 No, 17 Yes) from dogs receiving CsA with QD dosing (F-value = 3.22, p
= 0.083). Outliers = o.
For QD dosed mid-interval samples (between 10 hours and 14 hours post dose) (n = 23),
a significant difference could not be detected between mean CsA PDC (F-value = 0.97, p = 0.34)
for responders versus non-responders. Six samples were collected from non-responders, with a
mean PDC of 209.8 ng/mL (95% CI = 89.6 – 330.0 ng/mL). Seventeen samples were collected
from responders, with a mean PDC of 143.5 ng/mL (95% CI = 72.1 – 215.0 ng/mL) (See Figure
3.12).

39
Figure 3.12: Box plot of mid-interval (between 10 and 14 hours post dose) CsA PDC (ng/mL)
based on control of clinical signs (n= 6 No, 17 Yes) from dogs receiving CsA with QD dosing
(F-value = 0.97, p = 0.34). Outliers = o.
For QD dosed trough samples (between 20 hours and 28 hours post dose) (n = 30),
significant differences also could not be detected between mean CsA PDC (F-value = 1.5, p =
0.23) for responders versus non-responders. Twelve samples were collected from non-
responders, with a mean PDC of 82.3 ng/mL (95% CI = 2.2 – 162.5 ng/mL). Eighteen samples
were collected from responders, with a mean PDC of 144.1 ng/mL (95% CI = 78.7 – 209.6
ng/mL) (See Figure 3.13).

40
Figure 3.13: Box plot of trough (between 20 and 28 hours post dose) CsA PDC (ng/mL) based
on control of clinical signs (n= 12 No, 18 Yes) for QD dosing (F-value = 1.5, p = 0.23). Outliers
= o.
The mean BID dose given to patients with an indication of positive control was 5.1 ± 1.7
mg/kg (95% CI = 4.9 – 5.2 mg/kg). The median and mode were both 5.0 mg/kg. The minimum
dose was 0.5 mg/kg and the maximum dose was 10 mg/kg. The mean QD dose given to patients
with an indication of positive control was 4.9 ± 2.0 mg/kg (95% CI = 4.4 – 5.4 mg/kg). The
median and mode were both 5.0 mg/kg. The minimum dose was 1.0 mg/kg and the maximum
dose was 11 mg/kg.
The proportion of responders versus non-responders was not significantly different (p >
0.05) between patients on BID versus QD dosing (see Table 3.2).

41
Dose Interval Non-responder Responder Total
BID 151 351 502
QD 34 60 94
Total 185 411 596
Table 3.2: Proportion of responders versus non-responders on BID versus QD dosing.
Covariate Analysis
Age and gender were not significant covariates of PDC adjusted for dose. IMHA (F-
value = 8.35, p = 0.0041), ketoconazole (F-value = 31.6, p < 0.0001), and generic preparations
(F-value = 6.15, p = 0.014) were significant covariates of PDC adjusted for dose at BID dosing,
peak samples (less than 4 hours post dose). Ketoconazole (F-value = 132.6, p < 0.0001) were
significant covariates of PDC adjusted for dose at BID dosing, trough samples (between 10 and
14 hours post dose). Breed (F-value = 2.68, p = 0.015), and generic preparations (F-value =
19.58, p < 0.0001) were significant covariates of PCD adjusted for dose at QD dosing, trough
samples (20 to 28 hours post dose) (Table 3.3).

42
Covariate Dose Interval
Timing Mean PDC ± SD (95% CI) with
covariate (ng/mL)
Mean PDC ± SD (95% CI) w/o
covariate (ng/mL)
p-value
IMHA BID Peak 283.8 ± 143.3 (229.3 – 338)
167.6 ± 211.9 (143.9 – 191.3)
0.0041
Ketoconazole BID Peak 528.7 ± 466.6 (194.9 – 862.5)
166.9 ± 187.8 (146.5 – 187.3)
<0.0001
Generic preparation
BID Peak 216.1 ± 186.8 (161.3 – 271.0)
171.4 ± 212.4 (146.9 – 195.9)
0.014
Ketoconazole BID Trough 405.9 ± 333.4 (221.3 – 590.5)
71.1 ± 85.3 (61.6 – 80.6)
<0.0001
Generic preparation
QD Trough 15.1 ± 9.0 (9.7 – 20.6)
51.4 ± 73.6 (28.5 – 74.3)
<0.0001
Table 3.3: Summary of significant covariates for difference in mean CsA PDC (ng/mL).
Concurrent therapy with pred (unspecified) (Point estimate = 2.8, p = 0.0011) led to an
increased likelihood of being a non-responder. Treatment of arthritis (point estimate = 5.7, p =
0.047), inflammatory bowel disease (point estimate = 3.3, p = 0.0014), anemia (point estimate =
3.7, p <0.0001), and pure red cell aplasia (point estimate = 14.2, p = 0.016) also led to an
increased likelihood of being a non-responder. The other diseases analyzed, age, and breed were
not significant covariates (p > 0.05) for control of clinical signs.
3.4: Discussion and Conclusions
The mean CsA half-life of 11.1 hours is higher than reported mean half-lives
(Allenspach, 2006; Steffan, 2004). This elevated value, combined with the substantial variability
(standard deviation = 12.9), and a median and mode of 4.8 hours and 3.7 hours respectively,
suggests a few high leverage values are pulling the value up. No tested covariates (concurrent

43
medications, diseases, age, or gender) were significant with CsA half-life. However, the lack of
significant covariates may simply be due to lack of power of this study to detect the relationship.
Based on poor correlation (r) between CsA dose and PDC (0.0007 – 0.32; p = 0.99 –
0.03), prediction of PDC based on CsA dose is difficult. Therefore, monitoring of concentrations
is recommended. Correlation (r) between logged PDC adjusted for dose was between 0.24 and
0.33 demonstrates that prediction of PDC based on time is also difficult. Concurrent
ketoconazole therapy was the most consistent significant covariate for PDC adjusted for dose (p
< 0.05). Prednisone/prednisolone, IMHA, atopy, and breed showed limited covariance with
PDC adjusted for dose.
Patients receiving pred (unspecified) or azathioprine concurrently with CsA showed an
increased likelihood of being non-responders. Rather than suggesting these concurrent therapies
decreased efficacy, patients needing additional therapies probably are more likely to not respond.
Patients being treated for arthritis, IBD, anemia, or PRCA also showed an increased likelihood of
being non-responders.
The mean CsA dose given to patients where the clinical signs were considered controlled
was 5.1 ± 1.7 mg/kg BID and 4.9 ± 2.0 mg/kg QD. This is consistent with the doses reported in
the literature (Allenspach, 2006; Steffan, 2004).
Based on 95% CsA PDC distributions of patients with positive control of clinical signs,
the recommend therapeutic ranges for cyclosporine are 43.4 – 1841.5 ng/mL for BID peak
samples (less than 4 hours post dose), 52.0 – 1151.6 ng/mL for BID trough samples (10 – 14
hours post dose), 40.1 – 3050.6 ng/mL for QD peak samples (less than 4 hours post dose), 26.4 –
338.2 ng/mL for QD mid-interval samples (10 – 14 hours post dose), and 26.8 – 326.5 ng/mL for

44
QD trough samples (20 – 28 hours post dose). These ranges suggest that prolonged exposure
may play a larger role in controlling clinical signs rather than reaching a maximum PDC.

45
Chapter 4: Summary Discussion and Conclusions
This study is the first of its kind to examine the role that TDM has in the treatment of
immune-mediated disease in dogs. The investigation was based in part on a prospective approach
to establishing conditions for monitoring leflunomide, and an entirely retrospective approach for
cyclosporine.
The following conditions for leflunomide use and monitoring were determined:
Approximately 77% of patients receiving leflunomide were considered responders. Although
concentrations which discriminated responders from non-responders ranged from 5.0 mcg/mL to
59.3 mcg/mL, teriflunomide concentrations that exceed 25 mcg/mL at any time during the
dosing interval are considered the minimum end of the therapeutic range. Although a
concentration associated with toxicity could not be determined, concentrations higher than 45
mcg/mL do not appear to increase the likelihood of response. Thus, we propose an initial
therapeutic range of 25 to 45 mcg/mL of teriflunomide. An initial oral dose of 3 to 4 mg/kg one
daily is recommended in order to achieve teriflunomide concentrations considered therapeutic.
Monitoring can be based on either plasma or serum samples, and on the active
metabolite, teriflunomide. Further, samples can be collected at any time during a dosing interval,
although a trough sampling time will be recommended. Monitoring can be initiated in
approximately 5 days (we recommend a week) after therapy is initiated or changed.
Unfortunately, for leflunomide, the number of clinical samples was not sufficient to provide even
a limited covariate analysis suggesting that the number should be increased and then analyzed.

46
For cyclosporine, disposition among the population is markedly variable. This variability
could not be attributed to dose alone since the variability persisted when concentrations were
adjusted for dose. Further, dose was poorly correlated to concentrations regardless of sampling
time. The elimination half-life for all treated animals was longer than that reported and also is
characterized by marked variability. The range in elimination half-life, and thus time to steady-
state, is dramatically different. For some patients, therapeutic failure may be anticipated because
of a very short half-life; for others, care must be taken to avoid marked accumulation because of
a long half-life. Clinicians should consider collecting both a peak and trough in problematic
patients.
Covariate analysis indicated the following potentially significant (p < 0.05) relationships
with cyclosporine plasma drug concentrations: breed, disease, ketoconazole, and generic
preparations. Covariates with a significant relationship (p < 0.05) with response were co-
treatment of cyclosporine and prednisone or prednisolone, or disease (arthritis, anemia, and
inflammatory bowel disease).
Approximately 60% of patients receiving cyclosporine were considered responders.
Concentrations which discriminated between responders and non-responders could not be
identified. A difference also could not be detected with once versus twice daily administration,
although the proportion of animals receiving bid versus once daily dosing was not the same for
each disease. One of our goals was to explore whether or not evidence existed that generic vs
compounded cyclosporine concentrations were more or less predictable compared to Atopica®.
Further, we sought to determine whether peak or trough concentrations were better predictors of
PDC or response. Finally, we also hoped to identify patient conditions under which monitoring
was particularly important because of the impact on PDC (eg, co-drug administration). Further

47
study clearly is needed to identify reasons for variability in the disposition of cyclosporine
among patients. Variability reflects, in part, the limited information available through our TDM
records. However, this study does suggest that monitoring is recommended.
Further limitations of this study are those common with retrospective studies, such as
unknown patient information and difficulty confirming validity of medical history. As
covariates were added, the number of samples in each group dropped and decreased the power of
the statistical analysis. However, a framework has been laid for future retrospective or
prospective analysis based on TDM.

48
References
Allenspach, K., Rufenacht, S., Sauter, S., Grone, A., Steffan, J., Strehlau, G., and F. Gaschen.
Pharmacokinetics and Clinical Efficacy of Cyclosporine Treatment of Dogs with Steroid-Refractory Inflammatory Bowel Disease. J Vet Intern Med 2006;20:239-244
Archer TM, Boothe DM, Langston VC, Fellman CL, Lunsford KV, Mackin AJ. Oral
cyclosporine treatment in dogs: a review of the literature. J Vet Intern Med.2014 Jan-Feb;28(1):1-20.
Boothe, DM. Factors Affecting Drug Disposition. In: Small Animal Clinical Pharmacology &
Therapeutics. St. Louis, MO: Elsevier; 2012: 34-70 Boothe, DM. Principles of Drug Therapy. In: Small Animal Clinical Pharmacology &
Therapeutics. St. Louis, MO: Elsevier; 2012: 1-33 Boothe, DM. Therapeutic Drug Monitoring. In: Small Animal Clinical Pharmacology &
Therapeutics. St. Louis, MO: Elsevier; 2012: 112-127 Campana C, Regazzi MB, Buggia I, Molinaro M. Clinically significant drug interactions with
cyclosporin. An update. Clin Pharmacokinet. 1996 Feb;30(2):141-79. Chan V., Charles B.G., Tett S.E. Rapid determination of the active Teriflunomide metabolite
A77 1726 in human plasma by high-performance liquid chromatography. Journal of Chromatography B, 803 (2004) 331-335.
Chan V, Charles BG, Tett SE. Population pharmacokinetics and association between A77 1726
plasma concentrations and disease activity measures following administration of leflunomide to people with rheumatoid arthritis. Br J Clin Pharmacol. 2005 September; 60(3): 257–264.
Gregory CR, Stewart A, Sturges B, DeManvelle T, Cannon A, Ortega T, Harb M, Morris RE.
Leflunomide effectively treats naturally occurring immune-mediated and inflammatory diseases of dogs that are unresponsive to conventional therapy. Transplant Proc. 1998 Dec;30(8):4143-8.
Kyles AE, Gregory CR, Craigmill AL. Comparison of the in vitro antiproliferative effects of five
immunosuppressive drugs on lymphocytes in whole blood from cats. Am J Vet Res. 2000 Aug;61(8):906-9.
Kyles AE, Gregory CR, Griffey SM, Bernsteen L, Jackson J, Morris RE. Leflunomide analog,
MNA-715, plus cyclosporine reduces renal allograft rejection in mismatched dogs. Transplant Proc. 2001 Feb-Mar;33(1-2):368-9.
49
Kyles AE, Gregory CR, Griffey SM, Bernsteen L, Pierce J, Lilja HS, Morris RE. Immunosuppression with a combination of the leflunomide analog, FK778, and microemulsified cyclosporine for renal transplantation in mongrel dogs. Transplantation. 2003 Apr 27;75(8):1128-33.
Martinez MN, Antonovic L, Court M, Dacasto M, Fink-Gremmels J, Kukanich B, Locuson C,
Mealey K, Myers MJ, Trepanier L. Challenges in exploring the cytochrome P450 system as a source of variation in canine drug pharmacokinetics. Drug Metab Rev. 2013 May;45(2):218-30.
Matsuda, S., Koyasu, S. Mechanism of action of cyclosporine. Immunopharmacology
2000;47(2-3):119-125. McChesney L P , Xiao F , Sankary H N , et al: An evaluation of leflunomide in the canine renal
transplantation model , Transplantation 57 ( 12 ) : 1717 – 1722 , 1994 . Mealey KL, Waiting D, Raunig DL, Schmidt KR, Nelson FR. Oral bioavailability of P-
glycoprotein substrate drugs do not differ between ABCB1-1Δ and ABCB1 wild type dogs. J Vet Pharmacol Ther. 2010 Oct;33(5):453-60.
Mehl ML, Tell L, Kyles AE, Chen YJ, Craigmill A, Gregory CR. Pharmacokinetics and
pharmacodynamics of A77 1726 and leflunomide in domestic cats. J Vet Pharmacol Ther. 2012 Apr;35(2):139-46.
Smolen J S , Kalden J R , Scott D L , et al: Efficacy and safety of leflunomide compared with
placebo and sulphasalazine in active rheumatoid arthritis: a double-blind, randomised, multicenter trial, European Leflunomide Study , L ancet 353 : 259 – 266 , 1999.
Singer LM, Cohn LA, Reinero CR, PAPICH MG. Leflunomide pharmacokinetics after a single
oral administration to dogs. J Vet Pharmacol Therap. 2011 34: 609-611. Srinivas Rao V., Sunanda K. K., Narasimha Rao M., Allam Appa Rao, Maheswari IL and
Srinubabu G. Development and validation of LC method for the determination of Teriflunomide in pharmaceutical formulations using an experimental design. African Journal of Pure and Applied Chemistry Vol. 2 (2), pp. 010-017, February, 2008
Steffan J, Strehlau G, Maurer M, et al. Cyclosporin A pharmacokinetics and efficacy in the
treatment of atopic dermatitis in dogs. J Vet Pharmacol Ther 2004;27(4):231–238. Umstead ME, Boothe DM, Cruz-Espindola C, Macdonald JM, Kennis R, Angarano D. Accuracy
and precision of compounded ciclosporin capsules and solution. Vet Dermatol. 2012 Oct;23(5):431-e82.
van Roon EN, Yska JP, Raemaekers J, Jansen TL, van Wanrooy M, Brouwers JR. A rapid and
simple determination of A77 1726 in human serum by high-performance liquid

50
chromatography and its application for optimization of leflunomide therapy. J Pharm Biomed Anal. 2004 Sep 21;36(1):17-22.
van Roon EN, Jansen T, van de Laar MAFJ , Janssen M, Yska J, Keuper R, Houtman P, and
Brouwers J. Therapeutic drug monitoring of A77 1726, the active metabolite of leflunomide: serum concentrations predict response to treatment in patients with rheumatoid arthritis. Ann Rheum Dis. 2005 April; 64(4): 569–574. Colopy SA, Baker TA, Muir P. Efficacy of leflunomide for treatment of immune-mediated polyarthritis in dogs: 14 cases (2006-2008). J Am Vet Med Assoc. 2010 Feb 1;236(3):312-8
Williams CR, Sykes JE, Mehl M, MacLeod JS, Lindsay LL, Poland AM, Chen YJ, Kyles AE,
Waldman WJ, Gregory CR. In vitro effects of the active metabolite of leflunomide, A77 1726, on feline herpesvirus-1. Am J Vet Res. 2007 Sep;68(9):1010-5.

51
Appendix 1: Leflunomide SAS® Code
*Set output location of SAS Datasets 'Lef.'; LIBNAME Lef 'C:\Users\jss0012\Dropbox\Thesis\SAS datasets\Leflunomide\'; *Import excel file (must be xls not xlsx); PROC IMPORT OUT= Lef.Leflunomide DATAFILE= "C:\Users\jss0012\Dropbox\Thesis\Leflunomide 1-1-12 thru 5-31-14.xls" DBMS=xls REPLACE; SHEET="Leflunomide"; GETNAMES=YES; RUN;Quit; Data Lef.Leflunomide; Set Lef.Leflunomide; If Index(lowcase(Value), "<") NE 0 Then Value = '.'; If Index(lowcase(Value), ">") NE 0 Then Value = '.'; If Index(lowcase(Value), ".") = 0 Then Value = Catt(Value, '.'); Conc = Input (Value, 5.2); LogDose = Log (Dose); LogConc = Log (Conc); If Controlled = 'Yes' Then ControlledInt = 1; If Controlled = 'No' Then ControlledInt = 0; If Controlled = 'Unspecified' Then ControlledInt = .; Run;Quit; *Limit to K9s, Steady State (>=5d), Calculated Dose (mg/kg) and Removed those lacking a result; Data Lef.Leflunomide; Set Lef.Leflunomide; Where Species_Name = 'Canine' And SteadyState = 1 And DoseUnits = 'mg/kg' And DoseInterval="QD" And Conc GE 2.5; Run;Quit; *Number of accessions for each patient; Proc Freq Data=Lef.Leflunomide Noprint; Tables Clinic_ID*Animal_Name*Owner_Name / out=Lef.AccFreq; Run;Quit; *Sort the dataset prior to merge statement; Proc Sort Data=Lef.Leflunomide; By Clinic_ID Animal_Name Owner_Name; Run;Quit;

52
*Add number of accessions for each patient to drop scanned drugs; Data Lef.Leflunomide; Merge Lef.Leflunomide Lef.AccFreq; By Clinic_ID Animal_Name Owner_Name; Drop Percent; Rename COUNT=Patient_Accessions; Run;Quit; Data Lef.MultAcc; Set Lef.Leflunomide; Where Patient_Accessions > 1; Run;Quit; Proc Sort Data=Lef.Leflunomide; By Descending Dose; Run;Quit; *Drop duplicate patients; Proc Sort Data=Lef.Leflunomide Nodupkey; By Clinic_ID Animal_Name Owner_Name; Run;Quit; *MDR1 Breeds; Data Lef.Leflunomide; Set Lef.Leflunomide; If Breed_Name NE 'Australian Shepherd' And Breed_Name NE 'Collie' And Breed_Name NE 'Whippet' Then MDR1 = 0; If Breed_Name = 'Australian Shepherd' Or Breed_Name = 'Collie' Or Breed_Name = 'Whippet' Then MDR1 = 1; Run;Quit; *Scan patient history (Report_Comments) for drug keywords and assign boolean value to a new variable; Data Lef.Leflunomide; Set Lef.Leflunomide; If Index(Lowcase(Report_Comments), "pred") = 0 Then Pred = 0; If Index(Lowcase(Report_Comments), "pred") NE 0 Then Pred = 1; If Index(Lowcase(Report_Comments), "azith") = 0 Then Azithro = 0; If Index(Lowcase(Report_Comments), "azith") NE 0 Then Azithro = 1; If Index(Lowcase(Report_Comments), "cyclo") = 0 And Index(Lowcase(Report_Comments), "csa") = 0 Then Cyclo = 0; If Index(Lowcase(Report_Comments), "cyclo") NE 0 Or Index(Lowcase(Report_Comments), "csa") NE 0 Then Cyclo = 1; If Index(Lowcase(Report_Comments), "omep") = 0 Then Omeprazole = 0; If Index(Lowcase(Report_Comments), "omep") NE 0 Then Omeprazole = 1;

53
If Index(Lowcase(Report_Comments), "aza") = 0 Then Azathioprine = 0; If Index(Lowcase(Report_Comments), "aza") NE 0 Then Azathioprine = 1; Run;Quit; *Scan patient history (Report_Comments) for disease keywords and assign boolean value to a new variable; Data Lef.Leflunomide; Set Lef.Leflunomide; If Index(Lowcase(Report_Comments), "itp") = 0 Then ITP = 0; If Index(Lowcase(Report_Comments), "itp") NE 0 Then ITP = 1; If Index(Lowcase(Report_Comments), "histocytosis") = 0 Then Histocytosis = 0; If Index(Lowcase(Report_Comments), "histocytosis") NE 0 Then Histocytosis = 1; If Index(Lowcase(Report_Comments), "arthritis") = 0 Then Arthritis = 0; If Index(Lowcase(Report_Comments), "arthritis") NE 0 Then Arthritis = 1; If Index(Lowcase(Report_Comments), "gme") = 0 And Index(Lowcase(Report_Comments), "meningo") = 0 And Index(Lowcase(Report_Comments), "menengio") = 0 Then GME = 0; If Index(Lowcase(Report_Comments), "gme") NE 0 Or Index(Lowcase(Report_Comments), "meningo") NE 0 Or Index(Lowcase(Report_Comments), "menengio") NE 0 Then GME = 1; If Index(Lowcase(Report_Comments), "ibd") = 0 Then IBD = 0; If Index(Lowcase(Report_Comments), "ibd") NE 0 Then IBD = 1; If Index(Lowcase(Report_Comments), "anemia") = 0 Then Anemia = 0; If Index(Lowcase(Report_Comments), "anemia") NE 0 Then Anemia = 1; If Index(Lowcase(Report_Comments), "imha") = 0 Then IMHA = 0; If Index(Lowcase(Report_Comments), "imha") NE 0 Then IMHA = 1; Run;Quit; *Age Summary; TITLE 'Age Summary'; Proc means data=Lef.Leflunomide; Var Age; Run;Quit; *Count Frequency of each breed; TITLE 'Breed Frequencies'; Proc freq data=Lef.Leflunomide; Tables Breed_Name; Run;Quit; *Count Frequency of Controlled; TITLE 'Controlled Frequencies'; Proc freq data=Lef.Leflunomide; Tables Conc; Where Controlled = 'Yes'; Run;Quit; *Count Frequency of Controlled;

54
TITLE 'Controlled Frequencies'; Proc freq data=Lef.Leflunomide; Tables Controlled; Run;Quit; *Count Frequency of each gender; TITLE 'Gender Frequencies'; Proc freq data=Lef.Leflunomide; Tables Gender; Run;Quit; *Count Frequency of each disease being indicated; TITLE 'Disease Frequencies'; Proc freq data=Lef.Leflunomide; Tables ITP Histocytosis Arthritis GME IBD Anemia IMHA; Run;Quit; *Identify disease relationship to plasma drug concentration; TITLE 'Disease Covariance'; Proc reg data=Lef.Leflunomide; Model Conc = ITP Histocytosis Arthritis GME IBD Anemia IMHA / selection=adjrsq; Run;Quit; *Count Frequency of other drugs being indicated; TITLE 'Drug Frequencies'; Proc freq data=Lef.Leflunomide; Tables Pred Azithro cyclo Omeprazole Azathioprine; Run;Quit; *Identify other drug relationship to plasma drug concentration; TITLE 'Drug Covariance'; Proc reg data=Lef.Leflunomide; Model Conc = Pred Azithro cyclo Omeprazole Azathioprine / selection=adjrsq; Run;Quit; *Frequency controlled on pred vs not; TITLE 'Control with Pred'; Proc sort data=Lef.Leflunomide; By Pred; Run;Quit; *Odds ratio: pred more likely to achieve control; Proc freq data=Lef.Leflunomide; Tables Pred*Controlled / chisq relrisk; Where Controlled NE 'Unspecified';
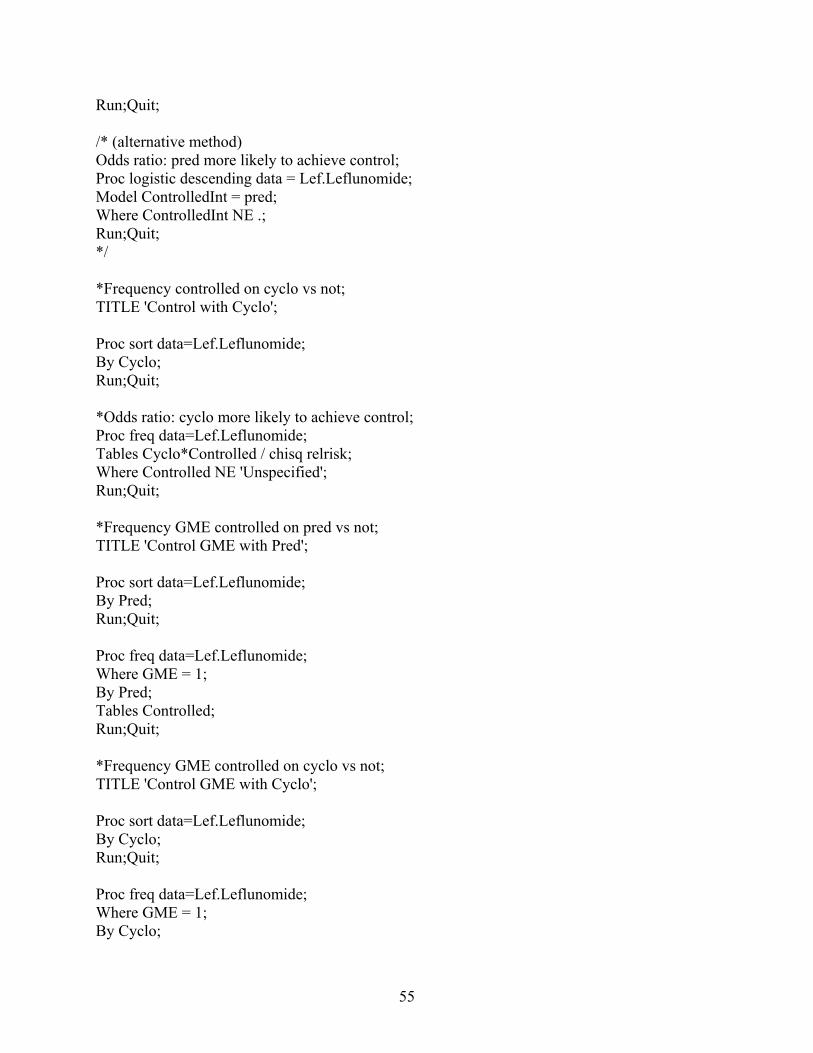
55
Run;Quit; /* (alternative method) Odds ratio: pred more likely to achieve control; Proc logistic descending data = Lef.Leflunomide; Model ControlledInt = pred; Where ControlledInt NE .; Run;Quit; */ *Frequency controlled on cyclo vs not; TITLE 'Control with Cyclo'; Proc sort data=Lef.Leflunomide; By Cyclo; Run;Quit; *Odds ratio: cyclo more likely to achieve control; Proc freq data=Lef.Leflunomide; Tables Cyclo*Controlled / chisq relrisk; Where Controlled NE 'Unspecified'; Run;Quit; *Frequency GME controlled on pred vs not; TITLE 'Control GME with Pred'; Proc sort data=Lef.Leflunomide; By Pred; Run;Quit; Proc freq data=Lef.Leflunomide; Where GME = 1; By Pred; Tables Controlled; Run;Quit; *Frequency GME controlled on cyclo vs not; TITLE 'Control GME with Cyclo'; Proc sort data=Lef.Leflunomide; By Cyclo; Run;Quit; Proc freq data=Lef.Leflunomide; Where GME = 1; By Cyclo;

56
Tables Controlled; Run;Quit; /*Timing breakdowns ruled irrelevant *ANOVA comparing Concentrations accross Controlled responses for 20-25hr samples; TITLE 'Conc 20-25hrs'; Proc glm data=Lef.Leflunomide; Class Controlled; Where Timing GE 20 and Timing LE 25; Model Conc = Controlled; Means Controlled / clm t tukey; Run;Quit; *ANOVA comparing Doses (mg/kg) accross Controlled responses for 20-25hr samples; TITLE 'Dose 20-25hrs'; Proc glm data=Lef.Leflunomide; Class Controlled; Where DoseUnits = 'mg/kg' and Timing GE 20 and Timing LE 25; Model Dose = Controlled; Means Controlled / clm t tukey; Run;Quit; *Correlation of Dose (mg/kg) vs Conc for 20-25hr samples, nothing logged; TITLE 'Correlation 20-25hrs (Regular)'; Proc corr data=Lef.Leflunomide plots=matrix; Var Dose Conc; Where DoseUnits = 'mg/kg' and Timing GE 20 and Timing LE 25; Run;Quit; *Correlation of Dose (mg/kg) vs Conc for 20-25hr samples, dose logged; TITLE 'Correlation 20-25hrs (LogDose)'; Proc corr data=Lef.Leflunomide plots=matrix; Var LogDose Conc; Where DoseUnits = 'mg/kg' and Timing GE 20 and Timing LE 25; Run;Quit; *Correlation of Dose (mg/kg) vs Conc for 20-25hr samples, conc logged; TITLE 'Correlation 20-25hrs (LogConc)'; Proc corr data=Lef.Leflunomide plots=matrix; Var Dose LogConc; Where DoseUnits = 'mg/kg' and Timing GE 20 and Timing LE 25; Run;Quit; *Correlation of Dose (mg/kg) vs Conc for 20-25hr samples, both logged; TITLE 'Correlation 20-25hrs (LogBoth)';
57
Proc corr data=Lef.Leflunomide plots=matrix; Var LogDose LogConc; Where DoseUnits = 'mg/kg' and Timing GE 20 and Timing LE 25; Run;Quit; *ANOVA comparing Concentrations accross Controlled responses for 12-25hr samples; TITLE 'Conc 12-25hrs'; Proc glm data=Lef.Leflunomide; Class Controlled; Where Timing GE 12 and Timing LE 25; Model Conc = Controlled; Means Controlled / clm t tukey; Run;Quit; *ANOVA comparing Doses (mg/kg) accross Controlled responses for 12-25hr samples; TITLE 'Dose 12-25hrs'; Proc glm data=Lef.Leflunomide; Class Controlled; Where DoseUnits = 'mg/kg' and Timing GE 12 and Timing LE 25; Model Dose = Controlled; Means Controlled / clm t tukey; Run;Quit; *Correlation of Dose (mg/kg) for 12-25hr samples, nothing logged; TITLE 'Correlation 12-25hrs (Regular)'; Proc corr data=Lef.Leflunomide plots=matrix; Var Dose Conc; Where DoseUnits = 'mg/kg' and Timing GE 12 and Timing LE 25; Run;Quit; *Correlation of Dose (mg/kg) for 12-25hr samples, dose logged; TITLE 'Correlation 12-25hrs (LogDose)'; Proc corr data=Lef.Leflunomide plots=matrix; Var LogDose Conc; Where DoseUnits = 'mg/kg' and Timing GE 12 and Timing LE 25; Run;Quit; *Correlation of Dose (mg/kg) for 12-25hr samples, conc logged; TITLE 'Correlation 12-25hrs (LogConc)'; Proc corr data=Lef.Leflunomide plots=matrix; Var Dose LogConc; Where DoseUnits = 'mg/kg' and Timing GE 12 and Timing LE 25; Run;Quit; *Correlation of Dose (mg/kg) for 12-25hr samples, both logged; TITLE 'Correlation 12-25hrs (LogBoth)';

58
Proc corr data=Lef.Leflunomide plots=matrix; Var LogDose LogConc; Where DoseUnits = 'mg/kg' and Timing GE 12 and Timing LE 25; Run;Quit; */ *ANOVA comparing Concentrations accross Controlled responses for all samples; TITLE 'Conc All'; Proc glm data=Lef.Leflunomide; Class Controlled; Model Conc = Controlled / cli p; Means Controlled / clm t tukey; Where Controlled NE 'Unspecified'; Run;Quit; Proc means data=Lef.Leflunomide n mean median mode std max min range clm; Where Controlled = "Yes"; Var Conc; run;Quit; Proc means data=Lef.Leflunomide n mean median mode std max min range clm; Where Controlled = "No"; Var Conc; run;Quit; TITLE 'Conc Pred'; Proc glm data=Lef.Leflunomide; Where Controlled = "Yes"; Class Pred; Model Conc = Pred / cli p; Means Pred / clm t tukey; Run;Quit; *ANOVA comparing Doses (mg/kg) accross Controlled responses for all samples; TITLE 'Dose All'; Proc glm data=Lef.Leflunomide; Class Controlled; Model Dose = Controlled / cli p; Means Controlled / clm t tukey; Run;Quit; TITLE 'Dose Pred'; Proc glm data=Lef.Leflunomide; Where Controlled = "Yes"; Class Pred;

59
Model Dose = Pred / cli p; Means Pred / clm t tukey; Run;Quit; Proc means data=Lef.Leflunomide n mean median mode max min range clm; Where Controlled = "Yes"; Var Dose; run;Quit; *Correlation of Dose (mg/kg) for all samples, nothing logged; TITLE 'Correlation All (Regular)'; Proc corr data=Lef.Leflunomide plots=matrix; Var Dose Conc; Run;Quit; /*Logging variables did not improve correlation *Correlation of Dose (mg/kg) for all samples, dose logged; TITLE 'Correlation All (LogDose)'; Proc corr data=Lef.Leflunomide plots=matrix; Var LogDose Conc; Where DoseUnits = 'mg/kg'; Run;Quit; *Correlation of Dose (mg/kg) for all samples, conc logged; TITLE 'Correlation All (LogConc)'; Proc corr data=Lef.Leflunomide plots=matrix; Var Dose LogConc; Where DoseUnits = 'mg/kg'; Run;Quit; *Correlation of Dose (mg/kg) for all samples, both logged; TITLE 'Correlation All (LogBoth)'; Proc corr data=Lef.Leflunomide plots=matrix; Var LogDose LogConc; Where DoseUnits = 'mg/kg'; Run;Quit; */ *Regression plot of A77-1726 vs Dose for all samples; TITLE 'A77-1726 in Canine Plasma'; proc sgplot data=Lef.leflunomide; reg y=dose x=conc / NOLEGFIT LINEATTRS= (THICKNESS= 2); run;quit;

60
Appendix 2: Cyclosporine SAS® Code
*Begin File Operations; *Set output location of SAS Datasets 'Cyclo.'; LIBNAME Cyclo 'C:\Users\jss0012\Dropbox\Thesis\SAS datasets\Cyclosporine\'; *Import excel file (must be xls not xlsx); PROC IMPORT OUT= Cyclo.Cyclosporine DATAFILE= "C:\Users\jss0012\Dropbox\Thesis\Cyclosporine 1-2-03 thru 5-31-14.xls" DBMS=xls REPLACE; SHEET="Cyclosporine"; GETNAMES=YES; RUN;Quit; *End File Operations; *Begin Dataset Operations; *Initial data clean-up; Data Cyclo.Cyclosporine; Set Cyclo.Cyclosporine; If Value = '0' Then Value = '.'; If Index(lowcase(Value), ".") = 0 Then Value = Catt(Value, '.'); If Index(lowcase(Value), ">") = 0 Then AboveRange = 0; If Index(lowcase(Value), ">") NE 0 Then AboveRange = 1; If Index(lowcase(Value), "<") = 0 Then NonDetectable = 0; If Index(lowcase(Value), "<") NE 0 Then NonDetectable = 1; If Test_Name = 'Cyclosporine Dilution' Then Test_Name = 'Cyclosporine'; Conc = Input (Value, 7.2); Half_Life = Input (Value, 7.2); AdjConc = Conc/Dose; If Controlled = 'Yes' Then ControlledInt = 1; If Controlled = 'No' Then ControlledInt = 0; If Controlled = 'Unspecified' Then ControlledInt = .; If Dose = . And OtherDose NE . And OtherDose NE 0 Then Dose = OtherDose And DoseUnits = 'mg/kg'; If DoseInterval = '' And OtherInterval NE '' Then DoseInterval = OtherInterval; Run;Quit;

61
*Gender categorization; Data Cyclo.Cyclosporine; Set Cyclo.Cyclosporine; If Gender = 'Female Spayed' Then Do; Neutered = 'Yes'; Sex='Female'; End; If Gender = 'Female Intact' Then Do; Neutered = 'No'; Sex='Female'; End; If Gender = 'Female' Then Do; Neutered = ''; Sex = 'Female'; End; If Gender = 'Male Neutered' Then Do; Neutered = 'Yes'; Sex='Male'; End; If Gender = 'Male Intact' Then Do; Neutered = 'No'; Sex='Male'; End; If Gender = 'Male' Then Do; Neutered = ''; Sex='Male'; End; Run;Quit; *Limit to K9s, Calculated Dose (mg/kg) and Removed those lacking a result or dose; Data Cyclo.Cyclosporine; Set Cyclo.Cyclosporine; Where Species_Name = 'Canine' And DoseUnits = 'mg/kg' And Timing NE . And Dose NE . And Controlled NE ''; Run;Quit; *Limit to BID or QD and log dose and conc; Data Cyclo.Cyclosporine; Set Cyclo.Cyclosporine; Where DoseInterval = 'BID' Or DoseInterval = 'QD'; LogDose = Log (Dose); LogConc = Log (Conc); LogAdjConc = Log (AdjConc); Run;Quit; /*This coded limited to just accessions with HL value. No longer necessary *Create list of accessions with half-life test value; Data Cyclo.Acc; Set Cyclo.Cyclosporine; Where Test_Name = 'Cyclosporine Half-Life'; HL = 1; Keep Accession_Number HL; Run;Quit; *Sort all datasets by accession number so can merge; Proc Sort Data=Cyclo.Cyclosporine; By Accession_Number; Run; Quit; Proc Sort Data=Cyclo.Acc; By Accession_Number; Run; Quit; *Merge datasets; Data Cyclo.Cyclosporine; Merge Cyclo.Cyclosporine Cyclo.Acc; By Accession_Number; Run;Quit;
62
*Only keep results where we had a half-life test value; Data Cyclo.Cyclosporine; Set Cyclo.Cyclosporine; Where HL = 1; Run;Quit; */ *Create fields to categorize Peak/Trough; Data Cyclo.Cyclosporine; Set Cyclo.Cyclosporine; If Timing LE 4 And DoseInterval = 'BID' Then PeakBID = 1; If Timing GE 10 And Timing LE 14 And DoseInterval = 'BID' Then TroughBID = 1; If Timing LE 4 And DoseInterval = 'QD' Then PeakQD = 1; If Timing GE 10 And Timing LE 14 And DoseInterval = 'QD' Then MidQD = 1; If Timing GE 20 And DoseInterval = 'QD' Then TroughQD = 1; Run;Quit; *Drop Entries with potential outlier doses (BID >10, QD >15); Data Cyclo.Cyclosporine; Set Cyclo.Cyclosporine; If DoseInterval = 'BID' And Dose >10 Then Delete; If DoseInterval = 'QD' And Dose >15 Then Delete; Run;Quit; *Sort prior to proc freq; Proc Sort Data=Cyclo.Cyclosporine; By Test_Name descending PeakBID descending TroughBID descending PeakQD descending MidQD descending TroughQD Controlled; Run;Quit; *Drop duplicate accessions; Proc Sort Data=Cyclo.Cyclosporine NoDupkey Out=Cyclo.PatientAcc; By Clinic_ID Animal_Name Owner_Name Accession_Number; Run;Quit; *Number of accessions for each patient; Proc Freq Data=Cyclo.PatientAcc Noprint; Tables Clinic_ID*Animal_Name*Owner_Name / out=Cyclo.PatientAccFreq; Run;Quit; *Sort the dataset prior to merge statement; Proc Sort Data=Cyclo.Cyclosporine; By Clinic_ID Animal_Name Owner_Name; Run;Quit;

63
*Add number of accessions for each patient to main dataset; Data Cyclo.Cyclosporine; Merge Cyclo.Cyclosporine Cyclo.PatientAccFreq; By Clinic_ID Animal_Name Owner_Name; Drop Percent; Rename COUNT=Patient_Accessions; Run;Quit; *Sort high-low patients by number of accessions; Proc Sort Data=Cyclo.Cyclosporine; By descending Patient_Accessions Clinic_ID Animal_Name Owner_Name Accession_Number; Run;Quit; *Create a new set of patients that have more than one accession; Data Cyclo.MultAcc; Set Cyclo.Cyclosporine; Where Patient_Accessions >1; Run;Quit; *Create a new set of patients that have only one accession; Data Cyclo.SingleAcc; Set Cyclo.Cyclosporine; Where Patient_Accessions = 1; Run;Quit; *Sort multiple accession set by Patient, descending control (1=yes, 0=no, . = unspecified), and ascending received date; Proc Sort Data=Cyclo.MultAcc; By Clinic_ID Animal_Name Owner_Name descending ControlledInt Received_Date; Run;Quit; *Ouput a list of accessions by dropping duplicates; Proc Sort Data=Cyclo.MultAcc Nodupkey Out=Cyclo.MultAccList; By Clinic_ID Animal_Name Owner_Name; Run;Quit; *Assign value to new field so we can use as criteria later. output only Accession number and new field; Data Cyclo.MultAccList; Set Cyclo.MultAccList; MultKeep = 1; Keep Accession_Number MultKeep; Run;Quit; *Sort prior to merge;

64
Proc Sort Data = Cyclo.MultAcc; By Accession_Number; Run;Quit; Proc Sort Data = Cyclo.MultAccList; By Accession_Number; Run;Quit; *Added field for keep critera to multiple accessions; Data Cyclo.MultAcc; Merge Cyclo.MultAcc Cyclo.MultAccList; By Accession_Number; Run;Quit; *Drop all but accession that was identfied; Data Cyclo.MultAcc; Set Cyclo.MultAcc; Where MultKeep = 1; Run;Quit; *Combine single accessions and kept accessions from multi; Proc Datasets Force Nolist; Append Base = Cyclo.SingleAcc Data= Cyclo.MultAcc; Run;Quit; *Rename combined set back as main set; Data Cyclo.Cyclosporine; Set Cyclo.SingleAcc; Run;Quit; *Resort by patients with descending accession numbers to check function of previous steps; Proc Sort Data=Cyclo.Cyclosporine; By descending Patient_Accessions Clinic_ID Animal_Name Owner_Name Accession_Number; Run;Quit; *MDR1 Breeds; Data Cyclo.Cyclosporine; Set Cyclo.Cyclosporine; If Breed_Name NE 'Australian Shepherd' And Breed_Name NE 'Collie' And Breed_Name NE 'Whippet' Then MDR1 = 0; If Breed_Name = 'Australian Shepherd' Or Breed_Name = 'Collie' Or Breed_Name = 'Whippet' Then MDR1 = 1; Run;Quit; *Scan patient history (Report_Comments) for drug keywords and assign boolean value to a new variable; Data Cyclo.Cyclosporine; Set Cyclo.Cyclosporine; If Index(Lowcase(Report_Comments), "pred") = 0 Then Pred = 0; If Index(Lowcase(Report_Comments), "pred") NE 0 And Index(Lowcase(Report_Comments), "prednisone") = 0

65
And Index(Lowcase(Report_Comments), "prednisolone") = 0 Then Pred = 1; If Index(Lowcase(Report_Comments), "prednisone") = 0 Then Prednisone = 0; If Index(Lowcase(Report_Comments), "prednisone") NE 0 Then Prednisone = 1; If Index(Lowcase(Report_Comments), "prednisolone") = 0 Then Prednisolone = 0; If Index(Lowcase(Report_Comments), "prednisolone") NE 0 Then Prednisolone = 1; If Index(Lowcase(Report_Comments), "azith") = 0 Then Azithro = 0; If Index(Lowcase(Report_Comments), "azith") NE 0 Then Azithro = 1; If Index(Lowcase(Report_Comments), "leflun") = 0 Then Leflunomide = 0; If Index(Lowcase(Report_Comments), "leflun") NE 0 Then Leflunomide = 1; If Index(Lowcase(Report_Comments), "omep") = 0 Then Omeprazole = 0; If Index(Lowcase(Report_Comments), "omep") NE 0 Then Omeprazole = 1; If Index(Lowcase(Report_Comments), "aza") = 0 Then Azathioprine = 0; If Index(Lowcase(Report_Comments), "aza") NE 0 Then Azathioprine = 1; If Index(Lowcase(Report_Comments), "ketacon") = 0 And Index(Lowcase(Report_Comments), "ketocon") = 0 Then Ketoconazole = 0; If Index(Lowcase(Report_Comments), "ketacon") NE 0 Or Index(Lowcase(Report_Comments), "ketocon") NE 0 Then Ketoconazole = 1; Run;Quit; *Scan patient history (Report_Comments) for disease keywords and assign boolean value to a new variable; Data Cyclo.Cyclosporine; Set Cyclo.Cyclosporine; If Index(Lowcase(Report_Comments), "itp") = 0 Then ITP = 0; If Index(Lowcase(Report_Comments), "itp") NE 0 Then ITP = 1; If Index(Lowcase(Report_Comments), "histocytosis") = 0 Then Histocytosis = 0; If Index(Lowcase(Report_Comments), "histocytosis") NE 0 Then Histocytosis = 1; If Index(Lowcase(Report_Comments), "arthritis") = 0 Then Arthritis = 0; If Index(Lowcase(Report_Comments), "arthritis") NE 0 Then Arthritis = 1; If Index(Lowcase(Report_Comments), "gme") = 0 And Index(Lowcase(Report_Comments), "meningo") = 0 And Index(Lowcase(Report_Comments), "menengio") = 0 Then GME = 0; If Index(Lowcase(Report_Comments), "gme") NE 0 Or Index(Lowcase(Report_Comments), "meningo") NE 0 Or Index(Lowcase(Report_Comments), "menengio") NE 0 Then GME = 1; If Index(Lowcase(Report_Comments), "ibd") = 0 Then IBD = 0; If Index(Lowcase(Report_Comments), "ibd") NE 0 Then IBD = 1; If Index(Lowcase(Report_Comments), "anemia") = 0 Then Anemia = 0; If Index(Lowcase(Report_Comments), "anemia") NE 0 Then Anemia = 1; If Index(Lowcase(Report_Comments), "aplasia") = 0 Then RPA = 0; If Index(Lowcase(Report_Comments), "aplasia") NE 0 Then RPA = 1; If Index(Lowcase(Report_Comments), "imha") = 0 Then IMHA = 0; If Index(Lowcase(Report_Comments), "imha") NE 0 Then IMHA = 1; If Index(Lowcase(Report_Comments), "atopy") = 0 Then Atopy = 0; If Index(Lowcase(Report_Comments), "atopy") NE 0 Then Atopy = 1; Run;Quit;
66
*Scan patient history (Report_Comments) for drug keywords and assign boolean value to a new variable; Data Cyclo.Cyclosporine; Set Cyclo.Cyclosporine; If Index(Lowcase(Report_Comments), "atopica") = 0 Then Atopica = 0; If Index(Lowcase(Report_Comments), "atopica") NE 0 Then Atopica = 1; If Index(Lowcase(Report_Comments), "neoral") = 0 Then Neoral = 0; If Index(Lowcase(Report_Comments), "neoral") NE 0 Then Neoral = 1; If Index(Lowcase(Report_Comments), "generic") = 0 Then Generic = 0; If Index(Lowcase(Report_Comments), "generic") NE 0 Then Generic = 1; If Index(Lowcase(Report_Comments), "compound") = 0 Then Compounded = 0; If Index(Lowcase(Report_Comments), "compound") NE 0 Then Compounded = 1; Run;Quit; *Split into datasets (one with full data, one with each patient only entered once); Data Cyclo.Full; Set Cyclo.Cyclosporine; Run;Quit; Proc Sort Data = Cyclo.Cyclosporine Nodupkey Out= Cyclo.Cases; By Clinic_ID Animal_Name Owner_Name; Run;Quit; **Population Descriptions; *Count N's; Title 'Group Ns-Full'; Proc Freq Data=Cyclo.Full; Tables Test_Name*Controlled PeakBID*Controlled TroughBID*Controlled PeakQD*Controlled MidQD*Controlled TroughQD*Controlled DoseInterval*Test_Name*Controlled; Run;Quit; *Count N's; Title 'Group Ns- Cases'; Proc Freq Data=Cyclo.Cases; Tables Test_Name*Controlled PeakBID*Controlled TroughBID*Controlled PeakQD*Controlled MidQD*Controlled TroughQD*Controlled DoseInterval*Test_Name*Controlled; Run;Quit; *Export to see date range; Proc sort Data=Cyclo.Full out=Cyclo.DateSort; By Received_Date; Run;Quit;

67
*Percent ND/Above range; Title 'ND/Above assay range by group'; Proc Freq Data = Cyclo.Full; Tables PeakBID*AboveRange*NonDetectable TroughBID*AboveRange*NonDetectable PeakQD*AboveRange*NonDetectable MidQD*AboveRange*NonDetectable TroughQD*AboveRange*NonDetectable; Run;Quit; *Age Summary; TITLE 'Age Summary'; Proc means data=Cyclo.Cases; Var Age; Where Age NE 0 and Age NE .; Run;Quit; *Count Frequency of each breed; TITLE 'Breed Frequencies'; Proc freq data=Cyclo.Cases; Tables Breed_Name / out=Cyclo.Breeds; Run;Quit; Proc Sort Data=Cyclo.Breeds; By descending COUNT; Run;Quit; *Count Frequency of each gender; TITLE 'Gender Frequencies'; Proc freq data=Cyclo.Cases; Tables Gender; Run;Quit; *Count Frequency of other drugs being indicated; TITLE 'Drug Frequencies'; Proc freq data=Cyclo.Cases; Tables Pred Prednisone Prednisolone Azithro Leflunomide Omeprazole Azathioprine Ketoconazole; Run;Quit; *Count Frequency of each disease being indicated; TITLE 'Disease Frequencies'; Proc freq data=Cyclo.Cases; Tables ITP Histocytosis Arthritis GME IBD Anemia IMHA RPA Atopy MDR1; Run;Quit; **Begin Analysis;

68
**Half-Life; *Half-life descriptive statistics; Title 'Half-Life Statistics'; Proc Means Data=Cyclo.Full n mean median mode std max min range clm; Var Half_Life; Where Test_Name = 'Cyclosporine Half-Life'; Run;Quit; *Drugs affect half-life?; TITLE 'GLM-Halflife-Drugs'; Proc reg data=Cyclo.Full; Where Test_Name = 'Cyclosporine Half-Life'; Model Half_Life = Pred Prednisone Prednisolone Azithro Leflunomide Omeprazole Azathioprine Ketoconazole / selection=adjrsq; Run;Quit; *Drugs affect half-life?; TITLE 'GLM-Halflife-Diseases'; Proc reg data=Cyclo.Full; Where Test_Name = 'Cyclosporine Half-Life'; Model Half_Life = ITP Histocytosis Arthritis GME IBD Anemia IMHA RPA Atopy MDR1 / selection=adjrsq; Run;Quit; *Age affect half-life?; TITLE 'Age Effect on Half-life'; Proc reg data=Cyclo.Full; Where Test_Name = 'Cyclosporine Half-Life'; Model Half_Life = Age; Run;Quit; *Gender affect half-life?; TITLE 'Gender Effect on Half-life'; Proc glm data=Cyclo.Full; Class Gender Sex Neutered; model Half_Life = Gender Sex Neutered; Means Gender Sex Neutered/ clm t tukey; Where Test_Name = 'Cyclosporine Half-Life'; Run;Quit; **BID PEAK; *ANOVA comparing Concentrations accross Controlled for BID Peaks; TITLE 'GLM-BID-Peak'; Proc glm data=Cyclo.Full;

69
Where Controlled NE 'Unspecified' And Test_Name = 'Cyclosporine' And PeakBID = 1; Class Controlled; Model Conc = Controlled / cli p clm; Means Controlled / clm t tukey; Run;Quit; *Correlation of Dose (mg/kg) vs PDC for BID Peaks; TITLE 'Correlation Dose vs Conc BID Peak'; Proc corr data=Cyclo.Full plots=matrix; Var Dose Conc; where Test_Name = 'Cyclosporine' And PeakBID = 1; Run;Quit; *Regression plot of Cyclosporine PDC vs Dose for BID Peaks; TITLE 'Cyclosporine Dose vs Conc BID Peak'; proc sgplot data=Cyclo.Full; reg y=Dose x=Conc / NOLEGFIT LINEATTRS= (THICKNESS= 2); Where Test_Name = 'Cyclosporine' And PeakBID = 1; run;quit; *Generate frequency and find double sided 95% to find "therapuetic range" for BID Peaks; TITLE 'Therapeutic Range BID Peak'; Proc Freq Data=Cyclo.Full; Tables Conc; Where Test_Name = 'Cyclosporine' And PeakBID = 1 And Controlled = 'Yes'; Run;Quit; **BID TROUGH; *ANOVA comparing Concentrations accross Controlled responses for BID Troughs; TITLE 'GLM-BID-Trough'; Proc glm data=Cyclo.Full; Where Controlled NE 'Unspecified' And Test_Name = 'Cyclosporine' And TroughBID = 1; Class Controlled; Model Conc = Controlled / cli p clm; Means Controlled / clm t tukey; Run;Quit; *Correlation of Dose (mg/kg) vs PDC for BID Troughs; TITLE 'Correlation Dose vs Conc BID Trough'; Proc corr data=Cyclo.Full plots=matrix; Var Dose Conc; where Test_Name = 'Cyclosporine' And TroughBID = 1; Run;Quit; *Regression plot of Cyclosporine PDC vs Dose for BID Troughs;

70
TITLE 'Cyclosporine Dose vs Conc BID Trough'; proc sgplot data=Cyclo.Full; reg y=Dose x=Conc / NOLEGFIT LINEATTRS= (THICKNESS= 2); Where Test_Name = 'Cyclosporine' And TroughBID = 1; run;quit; *Generate frequency and find double sided 95% to find "therapuetic range" for BID Troughs; TITLE 'Therapeutic Range BID Trough'; Proc Freq Data=Cyclo.Full; Tables Conc; Where Test_Name = 'Cyclosporine' And TroughBID = 1 And Controlled = 'Yes'; Run;Quit; **QD PEAK; *ANOVA comparing Concentrations accross Controlled responses for QD Peaks; TITLE 'GLM-QD-Peak'; Proc glm data=Cyclo.Full; Where Controlled NE 'Unspecified' And Test_Name = 'Cyclosporine' And PeakQD = 1; Class Controlled; Model Conc = Controlled / cli p clm; Means Controlled / clm t tukey; Run;Quit; *Correlation of Dose (mg/kg) vs PDC for QD Peaks; TITLE 'Correlation Dose vs Conc QD Peak'; Proc corr data=Cyclo.Full plots=matrix; Var Dose Conc; where Test_Name = 'Cyclosporine' And PeakQD = 1; Run;Quit; *Regression plot of Cyclosporine PDC vs Dose for QD Peaks; TITLE 'Cyclosporine Dose vs Conc QD Peak'; proc sgplot data=Cyclo.Full; reg y=Dose x=Conc / NOLEGFIT LINEATTRS= (THICKNESS= 2); Where Test_Name = 'Cyclosporine' And PeakQD = 1; run;quit; *Generate frequency and find double sided 95% to find "therapuetic range" for QD Peaks; TITLE 'Therapeutic Range QD Peak'; Proc Freq Data=Cyclo.Full; Tables Conc; Where Test_Name = 'Cyclosporine' And PeakQD = 1 And Controlled = 'Yes'; Run;Quit; **QD Mid;
71
*ANOVA comparing Concentrations accross Controlled responses for QD Mid; TITLE 'GLM-QD-Mid'; Proc glm data=Cyclo.Full; Where Controlled NE 'Unspecified' And Test_Name = 'Cyclosporine' And MidQD = 1; Class Controlled; Model Conc = Controlled / cli p clm; Means Controlled / clm t tukey; Run;Quit; *Correlation of Dose (mg/kg) vs PDC for QD Mid; TITLE 'Correlation Dose vs Conc QD Mid'; Proc corr data=Cyclo.Full plots=matrix; Var Dose Conc; where DoseInterval='QD' And Test_Name = 'Cyclosporine' And MidQD = 1; Run;Quit; *Regression plot of Cyclosporine PDC vs Dose for QD Mid; TITLE 'Cyclosporine Dose vs Conc QD Mid'; proc sgplot data=Cyclo.Full; reg y=Dose x=Conc / NOLEGFIT LINEATTRS= (THICKNESS= 2); Where DoseInterval = 'QD' And MidQD = 1; run;quit; *Generate frequency and find double sided 95% to find "therapuetic range" for QD Mid; TITLE 'Therapeutic Range QD Mid'; Proc Freq Data=Cyclo.Full; Tables Conc; Where Test_Name = 'Cyclosporine' And MidQD = 1 And Controlled = 'Yes'; Run;Quit; **QD TROUGH; *ANOVA comparing Concentrations accross Controlled responses for QD Troughs; TITLE 'GLM-QD-Trough'; Proc glm data=Cyclo.Full; Where Controlled NE 'Unspecified' And Test_Name = 'Cyclosporine' And TroughQD = 1; Class Controlled; Model Conc = Controlled / cli p clm; Means Controlled / clm t tukey; Run;Quit; *Correlation of Dose (mg/kg) vs PDC for QD Troughs; TITLE 'Correlation Dose vs Conc QD Trough'; Proc corr data=Cyclo.Full plots=matrix;

72
Var Dose Conc; where DoseInterval='QD' And Test_Name = 'Cyclosporine' And TroughQD = 1; Run;Quit; *Regression plot of Cyclosporine PDC vs Dose for QD Troughs; TITLE 'Cyclosporine Dose vs Conc QD Trough'; proc sgplot data=Cyclo.Full; reg y=Dose x=Conc / NOLEGFIT LINEATTRS= (THICKNESS= 2); Where DoseInterval = 'QD' And TroughQD = 1; run;quit; *Generate frequency and find double sided 95% to find "therapuetic range" for QD Trough; TITLE 'Therapeutic Range QD Trough'; Proc Freq Data=Cyclo.Full; Tables Conc; Where Test_Name = 'Cyclosporine' And TroughQD = 1 And Controlled = 'Yes'; Run;Quit; **Log Conc over Time; *Correlation of pdc adjusted for dose over time; TITLE 'Cyclosporine LogAdjConc vs Time'; Proc Corr Data = Cyclo.Full; Var Logadjconc Dose; Where Test_Name = 'Cyclosporine' And Timing LE 28; Run;Quit; *Regression plot of Cyclosporine Log(PDC) over time; TITLE 'Cyclosporine LogAdjConc vs Time'; proc sgplot data=Cyclo.Full; reg y=logadjconc x=Timing / NOLEGFIT LINEATTRS= (THICKNESS= 2); where Test_Name='Cyclosporine' And Timing LE 28; run;quit; *Correlation of pdc adjusted for dose over time BID; TITLE 'Cyclosporine LogAdjConc vs Time BID'; Proc Corr Data = Cyclo.Full; Var Logadjconc Dose; Where Test_Name = 'Cyclosporine' And DoseInterval = 'BID' And Timing LE 14; Run;Quit; *Regression plot of Cyclosporine Log(PDC) over time BID; TITLE 'Cyclosporine LogAdjConc vs Time BID'; proc sgplot data=Cyclo.Full; reg y=logadjconc x=Timing / NOLEGFIT LINEATTRS= (THICKNESS= 2); where Test_Name='Cyclosporine' And DoseInterval = 'BID' And Timing LE 14;

73
run;quit; *Correlation of pdc adjusted for dose over time BID; TITLE 'Cyclosporine LogAdjConc vs Time QD'; Proc Corr Data = Cyclo.Full; Var Logadjconc Dose; Where Test_Name = 'Cyclosporine' And DoseInterval = 'QD' And Timing LE 28; Run;Quit; *Regression plot of Cyclosporine Log(PDC) over time QD; TITLE 'Cyclosporine LogAdjConc vs Time QD'; proc sgplot data=Cyclo.Full; reg y=logadjconc x=Timing / NOLEGFIT LINEATTRS= (THICKNESS= 2); where Test_Name='Cyclosporine' And DoseInterval = 'QD' And Timing LE 28; run;quit; **Identify relationships; *Identify disease relationship to plasma drug concentration; TITLE 'Disease Covariance BID Peak'; Proc reg data=Cyclo.Full; Model AdjConc = ITP Histocytosis Arthritis GME IBD Anemia IMHA RPA Atopy MDR1 / selection=backward slstay=0.05 clb p; Where Test_Name = 'Cyclosporine' And PeakBID = 1; Run;Quit; TITLE 'Disease Covariance BID Trough'; Proc reg data=Cyclo.Full; Model AdjConc = ITP Histocytosis Arthritis GME IBD Anemia IMHA RPA Atopy MDR1 / selection=backward slstay=0.05 clb p; Where Test_Name = 'Cyclosporine' And TroughBID = 1; Run;Quit; TITLE 'Disease Covariance QD Peak'; Proc reg data=Cyclo.Full; Model AdjConc = ITP Histocytosis Arthritis GME IBD Anemia IMHA RPA Atopy MDR1 / selection=backward slstay=0.05 clb p; Where Test_Name = 'Cyclosporine' And PeakQD = 1; Run;Quit; TITLE 'Disease Covariance QD Mid'; Proc reg data=Cyclo.Full; Model AdjConc = ITP Histocytosis Arthritis GME IBD Anemia IMHA RPA Atopy MDR1 / selection=backward slstay=0.05 clb p; Where Test_Name = 'Cyclosporine' And MidQD = 1; Run;Quit;

74
TITLE 'Disease Covariance QD Trough'; Proc reg data=Cyclo.Full; Model AdjConc = ITP Histocytosis Arthritis GME IBD Anemia IMHA RPA Atopy MDR1 / selection=backward slstay=0.05 clb p; Where Test_Name = 'Cyclosporine' And TroughQD = 1; Run;Quit; *Identify other drug relationship to plasma drug concentration; TITLE 'Drug Covariance BID Peak'; Proc reg data=Cyclo.Full; Model AdjConc = Pred Azithro Leflunomide Omeprazole Azathioprine Ketoconazole / selection=backward slstay=0.05 clb p; Where Test_Name = 'Cyclosporine' And PeakBID = 1; Run;Quit; TITLE 'Drug Covariance BID Trough'; Proc reg data=Cyclo.Full; Model AdjConc = Pred Prednisone Prednisolone Azithro Leflunomide Omeprazole Azathioprine Ketoconazole / selection=backward slstay=0.05 clb p; Where Test_Name = 'Cyclosporine' And TroughBID = 1; Run;Quit; TITLE 'Drug Covariance QD Peak'; Proc reg data=Cyclo.Full; Model AdjConc = Pred Prednisone Prednisolone Azithro Leflunomide Omeprazole Azathioprine Ketoconazole / selection=backward slstay=0.05 clb p; Where Test_Name = 'Cyclosporine' And PeakQD = 1; Run;Quit; TITLE 'Drug Covariance QD Mid'; Proc reg data=Cyclo.Full; Model AdjConc = Pred Prednisone Prednisolone Azithro Leflunomide Omeprazole Azathioprine Ketoconazole / selection=backward slstay=0.05 clb p; Where Test_Name = 'Cyclosporine' And MidQD = 1; Run;Quit; TITLE 'Drug Covariance QD Trough'; Proc reg data=Cyclo.Full; Model AdjConc = Pred Prednisone Prednisolone Azithro Leflunomide Omeprazole Azathioprine Ketoconazole / selection=backward slstay=0.05 clb p; Where Test_Name = 'Cyclosporine' And TroughQD = 1; Run;Quit; *Identify age relationship to plasma drug concentration; TITLE 'Age Covariance BID Peak';

75
Proc reg data=Cyclo.Full; Model AdjConc = Age / clb p; Where Test_Name = 'Cyclosporine' And PeakBID = 1; Run;Quit; TITLE 'Age Covariance BID Trough'; Proc reg data=Cyclo.Full; Model AdjConc = Age / clb p; Where Test_Name = 'Cyclosporine' And TroughBID = 1; Run;Quit; TITLE 'Age Covariance QD Peak'; Proc reg data=Cyclo.Full; Model AdjConc = Age / clb p; Where Test_Name = 'Cyclosporine' And PeakQD = 1; Run;Quit; TITLE 'Age Covariance QD Mid'; Proc reg data=Cyclo.Full; Model AdjConc = Age / clb p; Where Test_Name = 'Cyclosporine' And MidQD = 1; Run;Quit; TITLE 'Age Covariance QD Trough'; Proc reg data=Cyclo.Full; Model AdjConc = Age /clb p; Where Test_Name = 'Cyclosporine' And TroughQD = 1; Run;Quit; *Identify Breed/Gender relationship to plasma drug concentration; TITLE 'Breed/Gender Covariance BID Peak'; Proc glm data=Cyclo.Full; Class Breed_Name Gender Sex Neutered; Model AdjConc = Breed_Name Gender Sex Neutered; Where Test_Name = 'Cyclosporine' And PeakBID = 1; Run;Quit; TITLE 'Breed/Gender Covariance BID Trough'; Proc glm data=Cyclo.Full; Class Breed_Name Gender Sex Neutered; Model AdjConc = Breed_Name Gender Sex Neutered; Where Test_Name = 'Cyclosporine' And TroughBID = 1; Run;Quit; TITLE 'Breed/Gender Covariance QD Peak'; Proc glm data=Cyclo.Full;

76
Class Breed_Name Gender Sex Neutered; Model AdjConc = Breed_Name Gender Sex Neutered; Where Test_Name = 'Cyclosporine' And PeakQD = 1; Run;Quit; TITLE 'Breed/Gender Covariance QD Mid'; Proc glm data=Cyclo.Full; Class Breed_Name Gender Sex Neutered; Model AdjConc = Breed_Name Gender Sex Neutered; Where Test_Name = 'Cyclosporine' And MidQD = 1; Run;Quit; TITLE 'Breed/Gender Covariance QD Trough'; Proc glm data=Cyclo.Full; Class Breed_Name Gender Sex Neutered; Model AdjConc = Breed_Name Gender Sex Neutered; Where Test_Name = 'Cyclosporine' And TroughQD = 1; Run;Quit; **Any drug show better control with than without?; /*Alternative Way to do Odds ratio, proc logistic more efficient for multiple variables TITLE 'Control with Pred'; Proc sort data=Cyclo.Cyclosporine; By Pred; Run;Quit; *Odds ratio: pred more likely to achieve control; Proc freq data=Cyclo.Cyclosporine; Tables Pred*Controlled / chisq relrisk; Where Controlled NE 'Unspecified'; Run;Quit; */ TITLE 'Drug more likely controlled?'; Proc logistic data=Cyclo.Cases; Class Pred Azithro Leflunomide Omeprazole Azathioprine Ketoconazole; model Controlled (event='Yes') = Pred Prednisone Prednisolone Azithro Leflunomide Omeprazole Azathioprine Ketoconazole / selection=backward; Where Controlled NE 'Unspecified'; Run;Quit; *Any disease more likely controlled?; TITLE 'Disease more likely controlled?';

77
Proc logistic data=Cyclo.Cases; Class ITP Histocytosis Arthritis GME IBD Anemia IMHA RPA Atopy; model Controlled (event='Yes') = ITP Histocytosis Arthritis GME IBD Anemia IMHA RPA Atopy / selection=backward; Where Controlled NE 'Unspecified'; Run;Quit; *Breed, Gender more likely controlled?; TITLE 'Breed/Gender more likely controlled?'; Proc logistic data=Cyclo.Cases; Class Breed_Name Gender Sex Neutered; model Controlled (event='Yes') = Breed_Name Gender Sex Neutered / selection=backward; Where Controlled NE 'Unspecified'; Run;Quit; *Preparation more likely controlled?; TITLE 'Preparation more likely controlled?'; Proc logistic data=Cyclo.Cases; Class Atopica Neoral Generic Compounded; model Controlled (event='Yes') = Atopica Neoral Generic Compounded / selection=backward; Where Controlled NE 'Unspecified'; Run;Quit; *Age affect controlled?; TITLE 'Age Effect on Controlled'; Proc glm data=Cyclo.Cases; Class Controlled; Model Age = Controlled; Where Controlled NE 'Unspecified'; Means Controlled / clm t tukey; Run;Quit; **Dose Comparisons; *ANOVA comparing Doses (mg/kg) accross Controlled responses for BID; TITLE 'GLM-Dose-BID'; Proc glm data=Cyclo.Cases; Class Controlled; Model Dose = Controlled; Means Controlled / clm t tukey; Where DoseInterval = 'BID' And Controlled NE 'Unspecified'; Run;Quit; Proc sort data=Cyclo.Cases; By Controlled; Run;Quit;

78
Proc means data=Cyclo.Cases n mean median mode std max min range clm; Var Dose; By Controlled; Where DoseInterval = 'BID' And Controlled NE 'Unspecified'; Run;Quit; *ANOVA comparing Doses (mg/kg) accross Controlled responses for QD; TITLE 'GLM-Dose-QD'; Proc glm data=Cyclo.Cases; Class Controlled; Model Dose = Controlled; Means Controlled / clm t tukey; Where DoseInterval = 'QD' And Controlled NE 'Unspecified'; Run;Quit; Proc sort data=Cyclo.Cases; By Controlled; Run;Quit; Proc means data=Cyclo.Cases n mean median mode std max min range clm; Var Dose; By Controlled; Where DoseInterval = 'QD' And Controlled NE 'Unspecified'; Run;Quit; *DoseInterval more likely controlled?; Proc freq data=Cyclo.Cases; Tables DoseInterval*Controlled; Where Controlled NE 'Unspecified'; Run;Quit; TITLE 'BID vs QD more likely controlled?'; Proc logistic data=Cyclo.Cases; Class DoseInterval; model Controlled (event='Yes') = DoseInterval; Where Controlled NE 'Unspecified'; Run;Quit; *Identify Preparation relationship to plasma drug concentration; TITLE 'Preparation Covariance BID Peak'; Proc glm data=Cyclo.Full; Class Atopica Neoral Generic Compounded; Model AdjConc = Atopica Neoral Generic Compounded; Where Test_Name = 'Cyclosporine' And PeakBID = 1; Run;Quit;

79
TITLE 'Preparation Covariance BID Trough'; Proc glm data=Cyclo.Full; Class Atopica Neoral Generic Compounded; Model AdjConc = Atopica Neoral Generic Compounded; Where Test_Name = 'Cyclosporine' And TroughBID = 1; Run;Quit; TITLE 'Preparation Covariance QD Peak'; Proc glm data=Cyclo.Full; Class Atopica Neoral Generic Compounded; Model AdjConc = Atopica Neoral Generic Compounded; Where Test_Name = 'Cyclosporine' And PeakQD = 1; Run;Quit; TITLE 'Preparation Covariance QD Mid'; Proc glm data=Cyclo.Full; Class Atopica Neoral Generic Compounded; Model AdjConc = Atopica Neoral Generic Compounded; Where Test_Name = 'Cyclosporine' And MidQD = 1; Run;Quit; TITLE 'Preparation Covariance QD Trough'; Proc glm data=Cyclo.Full; Class Atopica Neoral Generic Compounded; Model AdjConc = Atopica Neoral Generic Compounded; Where Test_Name = 'Cyclosporine' And TroughQD = 1; Run;Quit; *Disease treatment frequency; Proc freq data=Cyclo.Cases; Tables ITP*DoseInterval Histocytosis*DoseInterval Arthritis*DoseInterval GME*DoseInterval IBD*DoseInterval Anemia*DoseInterval IMHA*DoseInterval RPA*DoseInterval Atopy*DoseInterval; Run;Quit; Proc sort data = Cyclo.Full; By IMHA; Run;Quit; Proc means data = Cyclo.Full n mean median mode std clm; Var AdjConc; Where Test_Name = 'Cyclosporine' And PeakBID = 1; By IMHA; Run;Quit;

80
Proc sort data = Cyclo.Full; By Ketoconazole; Run;Quit; Proc means data = Cyclo.Full n mean median mode std clm; Var AdjConc; Where Test_Name = 'Cyclosporine' And PeakBID = 1; By Ketoconazole; Run;Quit; Proc sort data = Cyclo.Full; By Generic; Run;Quit; Proc means data = Cyclo.Full n mean median mode std clm; Var AdjConc; Where Test_Name = 'Cyclosporine' And PeakBID = 1; By Generic; Run;Quit; Proc sort data = Cyclo.Full; By Ketoconazole; Run;Quit; Proc means data = Cyclo.Full n mean median mode std clm; Var AdjConc; Where Test_Name = 'Cyclosporine' And TroughBID = 1; By Ketoconazole; Run;Quit; Proc sort data = Cyclo.Full; By Generic; Run;Quit; Proc means data = Cyclo.Full n mean median mode std clm; Var AdjConc; Where Test_Name = 'Cyclosporine' And TroughQD = 1; By Generic; Run;Quit; Proc sort data = Cyclo.Full; By Compounded; Run;Quit; Proc means data = Cyclo.Full n mean median mode std clm; Var AdjConc;

81
Where Test_Name = 'Cyclosporine' And TroughQD = 1; By Compounded; Run;Quit;