thermochemical properties of methylol phenol monomers and
TRANSCRIPT

Thermochemical Properties of Methylol Phenol
Monomers and Phenol Formaldehyde Resoles
A Thesis Submitted for the Degree of Doctor of Philosophy
By
Livia Tonge, B.Sc., B.Eng. (Hons.)
Faculty of Engineering and Industrial Sciences Swinburne University of Technology
September 2007

ii
Abstract
The principal aim of the present research is to investigate the thermochemical
characteristics of individual methylol phenol monomers, which are the first
addition products in the making of phenol formaldehyde (PF) resoles, in the
temperature range up to 250°C. The second aim of the research is to study the cure
properties of PF resoles as a whole with a particular focus on the dependence of the
reaction kinetics on the degree of the cure up to 250°C. Differential scanning
calorimetry (DSC) and the model-free kinetic analysis approach were used to
monitor the thermochemical properties of both the monomers and PF resoles as a
function of concentration of sodium hydroxide, a common basic catalyst used in
the making of the resoles.
A. The cure properties of methylol phenol monomers
A key mechanism that has been suggested to operate during the cure of the
monomers in the presence of NaOH is the formation of the sodium ring complex
that diminishes the capacity of the monomers to participate in condensation
reactions, particularly those involving ortho-methylol groups. At a particular
NaOH level, the monomer molecules may have a range of reactivity, depending on
whether they are associated with Na+. Such variation in the reactivity and the
different condensation possibilities of the monomers are critical factors governing
the cure behaviour.
Another important mechanism that has been suggested to operate during the cure is
the limitation on molecular diffusion that has the effect of slowing down the
condensation reactions of the monomers. The effect of the diffusion limitation
mechanism is more pronounced with increases in the amount of the methylol
groups in the monomers and in the levels of NaOH. The advancement in the extent
of cross-linking is another factor that exacerbates the significance of this
mechanism as the cure proceeds.

iii
Differences in the effects of these mechanisms between different samples are
manifested in differences in a number of parameters including the shape of the
DSC curves, the dependence of apparent activation energy Ea on the degree of
conversion and the heat of reactions ΔHT. These differences, together with the
established chemistry of condensation reactions, are used to elucidate possible
pathways that condensation reactions may proceed. In particular, the partial
contributions of reactions to form para-para and ortho-para linkages, as well as
ortho-ortho linkages in rare occasions, at different stages of the cure have been
proposed for each monomer at different NaOH levels.
B. The cure properties of PF resoles
The outcomes of both studies of the monomers and the resoles are complementary
to each other and provide a consistent overall picture of relevant mechanisms
operating during the cure process. In particular, the sodium ring complex
mechanism that has the retardation effect on the cure kinetics of the resoles is
demonstrated independently by both gel time measurements and DSC data. It is
suggested that the operation of this mechanism is not confined to 2-mono-methylol
phenol, but also applies to other methylol phenols present in the resoles.
On the basis of the data on the dependence of Ea on the extent of conversion, it is
suggested that the cure of the resoles proceed through two stages. The first stage is
characterized by an ascending trend of Ea up to conversion of 0.6 – 0.7, followed
by the second stage which exhibits a descending trend of Ea to the end of the cure
process. It is proposed that the partial contribution of reactions to form the para-
para linkages are dominant at low conversions and that contribution of the ortho-
para linkage reactions become more significant as the cure proceeds. The
descending trend of Ea is attributed to the increasing importance of the diffusion
limitation mechanism in the second stage of the cure. The effect of this mechanism
is more extensive for the resoles having higher NaOH / P ratio. This is attributed to
higher degree of methylol substitution and higher amount of NaOH present in these
resoles, both of which are shown in the study of monomers to have the effect of
exacerbating the severity of the diffusion limitation mechanism.

iv
The findings in the present study have practical implications in the development of
PF resole adhesive systems capable of curing faster at lower temperatures. Clearly,
for PF resole formulations with a particular F / P molar ratio, there is an optimal
level of NaOH / P molar ratio where the cross-linking reactions are encouraged and
the diffusion mechanism is minimised. The present results indicate that for a
system with a F / P molar ratio of 2, which is commonly used in the industry, a
NaOH / P ratio of 3 is sufficient to produce resoles with fully cross-linked
networks. Higher NaOH / P ratios would slow down the cure reactions due to
increasing importance of both the sodium ring complex and the diffusion limitation
mechanisms.
It is suggested that future work should involve the use of complementary
techniques such as NMR and FTIR to investigate the chemical structure of the
products at different stages of the cure of different monomers and PF resoles. This
is necessary to confirm the possible pathways for condensation reactions proposed
in the present study. As well, the issue of the effects of F / P molar ratio on the cure
properties of PF resoles should be revisited using the model-free DSC method,
given the effectiveness of this method in revealing possible complex sequences of
the cure reactions.
These additional data would add to the knowledge obtained in the present study
and aid in the development of PF resole systems capable of bonding under a wide
range of gluing conditions and curing faster at lower temperatures.
v
Acknowledgements
I wish to acknowledge and thank the Forest and Wood Products Research &
Development Corporation for their financial sponsorship of this PhD project.
I would like to thank my supervisors – Mr Aaron Blicblau, from Swinburne
University of Technology, Dr Jonathan Hodgkin from CSIRO Molecular Science,
and Dr Yoshi Yazaki, from CSIRO Forestry and Forest Products. I am particularly
indebted to Aaron for the enormous help and scientific guidance he extended to me
during the course of this project, especially his patience and willingness to assist
when problems arose.
I am grateful to CSIRO staff – Ms Mary Reilly, Mr Peter Collins, Mrs Touba
Nikpour, Dr Russell Varley for their assistance throughout this project. In
particular, I would like to highlight Mary for her dedication and very special
support.
I thank Dr Jim Gonis from Perkin Elmer for his considerable help and advice
regarding the commissioning and operation of the DSC.
My deep gratitude also goes to Gerry Scheltinga for your friendship, practical
assistance, encouragement, and steadfast interest in my progress.
To my family, Anyu, Johnnybacsi, and to Duy, I extend my eternal gratitude for
your enduring love, patience and encouragement over the years. Without Duy’s
unwavering caring guidance and support, this thesis would not have eventuated.
This thesis is in loving memory of my dad, Eric.

vi
Declarations
The work described in this thesis has never previously been submitted for a degree
or diploma in any University and to the best of my knowledge and belief contains
no material previously published or written by any other person except where due
reference is made in the thesis itself.
Parts of the work described here have previously been reported in the following
publications:
“Effects of Initial Phenol-Formaldehyde (PF) Reaction Products on the Curing Properties of PF Resin”
L. Y. Tonge, J. H. Hodgkin, A. S. Blicblau and P. J. Collins
in Journal of Thermal Analysis and Calorimetry, 64 (2), 721-730 (2001).
“Thermal Behaviour of Phenol-Formaldehyde (PF) Compounds”
L. Y. Tonge, Y. Yazaki and A. S. Blicblau
in Journal of Thermal Analysis and Calorimetry, 56 (3), 1347-1352 (1999).
“Cure Kinetics of Phenol-Formaldehyde (PF) Resins”
L. Y. Tonge, Y. Yazaki, A. S. Blicblau and J. H. Hodgkin
in Proceedings of the 8th Asian Chemical Congress, November 1999.

vii
Table of Contents
Title page i
Abstract ii
Acknowledgement v
Declaration vi
Table of Contents vii
List of Tables xii
List of Figures xiv
Chapter 1 Introduction 1
1.1 Background 1
1.1.1 General 1
1.1.2 The production of PF resoles 2
1.2 The Issues 3
1.3 The Objectives 4
1.4 Structure of the Thesis 5
1.5 References 6
Chapter 2 Literature Review of Thermochemical
Behaviour of PF Resole and Its Monomers 10
2.1 PF Resoles – Background 10
2.1.1 History 10
2.1.2 Application of PF resoles in the wood industry 11
2.2 PF Resole Chemistry 12
2.2.1 Formaldehyde addition to phenol to form monomers 12
2.2.1.1 General 12
2.2.1.2 Reactivity of methylol phenols with formaldehyde 12
2.2.2 Condensation reactions to form resole 14
2.2.2.1 Condensation reactions 14

viii
2.2.2.2 Effects of alkalinity on the condensation reactions 20
2.2.3 Cure reactions of resole 22
2.2.3.1 General 22
2.2.3.2 Reactions during the cure of resole 23
2.3 Effects of Formulation Parameters on Properties of PF Resoles 25
2.4 The Use of DSC to Study the Cure Behaviour of PF Resoles 26
2.5 Concluding Remarks 29
2.6 References 31
Chapter 3 Methodology and Experimental Details 38
3.1 Methodology 38
3.1.1 System parameters 38
3.1.1.1 Methyl phenol monomers 38
3.1.1.2 Reaction conditions 38
3.1.1.3 Additional experimental parameters 40
3.1.2 Thermal analysis by DSC 40
3.1.2.1 General 40
3.1.2.2 Principle of DSC 41
3.1.2.3 Analysis of DSC experimental data 43
3.1.2.4 “Effective” activation energy Eα obtained from the
model-free method 48
3.2 Experimental Details 51
3.2.1 Materials 51
3.2.1.1 Synthesis of 2,4-DMP 51
3.2.1.2 Synthesis of 2,6-DMP 54
3.2.1.3 Synthesis of TMP 56
3.2.2 Characterisation of 2,4-DMP, 2,6-DMP and TMP 57
3.2.3 DSC runs 63
3.3 References 64

ix
Chapter 4 Cure Properties of Mono-Methylol Phenols 67
4.1 Introduction 67
4.2 Effects of Scan Rate on DSC Thermograms 67
4.2.1 Peak temperature Tp 67
4.2.2 Fractional conversion αp at Tp 69
4.2.3 Heat of reactions ΔHT 70
4.3 Effects of NaOH on DSC Thermograms 71
4.3.1 Peak temperature Tp 71
4.3.2 Fractional conversion αp at Tp 73
4.3.3 Enthalpy of reactions ΔHT 74
4.4 Effects of NaOH on the Evolution of Activation Energy Ea 76
4.4.1 2-MMP 78
4.4.2 4-MMP 82
4.5 Summary 85
4.6 References 86
Chapter 5 Cure Properties of Di-Methylol Phenols 88
5.1 Introduction 88
5.2 Self-Condensation Reactions of DMP 88
5.3 DSC Thermograms 90
5.3.1 2,4-DMP and 2,6-DMP at molar ratios equal or less than 0.15 92
5.3.2 2,4-DMP at molar ratios higher than 0.15 93
5.3.3 2,6-DMP at molar ratios higher than 0.15 95
5.4 Enthalpy of Reaction ΔHT 96
5.5 Effects of NaOH on the Evolution of Activation Energy Ea 98
5.5.1 2,4-DMP 100
5.5.2 2,6-DMP 103
5.6 Summary 107
5.6 References 108

x
Chapter 6 Cure Properties of Tri-Methylol Phenols 110
6.1 Introduction 110
6.2 Self-Condensation Reactions of TMP 110
6.3 DSC Thermograms 112
6.4 Enthalpy of Reactions ΔHT 114
6.5 Effects of NaOH on the Evolution of Activation Energy Ea 116
6.6 Summary 124
6.7 References 125
Chapter 7 Comparison of Effects of NaOH on the Cure Properties of Mono-, Di- and Tri-Methylol Phenols 127
7.1 Introduction 127
7.2 MMP 128
7.2.1 2-MMP 128
7.2.2 4-MMP 129
7.3 DMP 130
7.3.1 2,4-DMP 130
7.3.2 2,6-DMP 133
7.4 TMP 135
7.5 Summary 137
7.6 References 138
Chapter 8 Cure Properties of PF Resoles 140
8.1 Introduction 140
8.2 Experimental 141
8.2.1 Resole synthesis 141
8.2.2 GPC 141
8.2.3 Gel time 142

xi
8.2.4 DSC experiments 142
8.3 Results and Discussion 143
8.3.1 GPC 143
8.3.2 Gel time 144
8.3.3 DSC curves 145
8.3.4 Enthalpy of reactions ΔHT 148
8.3.5 Effects of NaOH / P molar ratio on the evolution of activation energy Ea 150
8.4 Summary 157
8.5 References 158
Chapter 9 Conclusions and Future Work 162

xii
List of Tables
Table Page
Table 2.1: Reaction products from the self-condensation reactions of monomers as observed by Yeddanapalli and Francis 17
Table 2.2: Reaction products from the self-condensation reactions of monomers as observed by Grenier-Loustalot et al 19
Table 3.1: Reaction models used to describe thermal decomposition in solids 47
Table 3.2: 1H-NMR chemical shifts 58
Table 3.3: 13C-NMR chemical shifts 59
Table 4.1: Effects of scan rate on: the peak temperature of cure (Tp); total enthalpy of reactions (ΔHT); and the extent of the cure reactions at the peak of the exotherm (αp) for NaOH : 2-MMP molar ratios of 0.0 and 0.45 70
Table 4.2: Effects of scan rate on: the peak temperature of cure (Tp); total enthalpy of reactions (ΔHT); and the extent of the cure reactions at the peak of the exotherm (αp) for NaOH : 4-MMP molar ratios of 0.0 and 0.45 70
Table 4.3: The DSC Pyris computer software generated values of Tα at four scan rates (for NaOH : 2-MMP molar ratio 0.45) and the corresponding values for the dependent and independent variables for equation 3.7 77
Table 5.1: The DSC Pyris computer software generated values of Tα at four scan rates (for NaOH : 2,4-DMP molar ratio of 0.45) and the corresponding values for the dependent and independent variables for equation 3.7 99

xiii
Table 6.1: The DSC Pyris computer software generated values of Tα at four scan rates (for NaOH : 2,4,6-TMP molar ratio of 0.45) and the corresponding values for the dependent and independent variables for equation 3.7 117
Table 8.1: The DSC Pyris computer software generated values of Tα at four scan rates (for NaOH / P molar ratio of 0.30) and the corresponding values for the dependent and independent variables for equation 3.7 151

xiv
List of Figures
Figure Page
Figure 2.1: Reaction paths for the addition of formaldehyde to phenol 13
Figure 2.2: Formation of dimethylene ether and methylene bridges 15
Figure 2.3: Condensation reactions of TMP from pH 3 to pH 5 21
Figure 2.4: Condensation reactions of TMP from pH 5 to pH 10 21
Figure 2.5: Condensation reactions of TMP above pH 10 22
Figure 2.6: Three- dimensional cross-linked state 23
Figure 3.1: The five initial intermediate monomers 39
Figure 3.2: Power compensated DSC 42
Figure 3.3: DSC dynamic scan peak 43
Figure 3.4: A dynamic DSC thermogram in the scanning mode depicting an exothermic reaction 45
Figure 3.5: Reaction steps for the synthesis of 2,4-DMP 52
Figure 3.6: Schematic for the synthesis of compound II 52
Figure 3.7: Schematic for the synthesis of 2,4-DMP 53
Figure 3.8: Reaction steps for the synthesis of 2,6-DMP 55
Figure 3.9: 1H-NMR spectra of 2,4-DMP 60
Figure 3.10: 1H-NMR spectra of 2,6-DMP 60
Figure 3.11: 1H-NMR spectra of 2,4,6-TMP 61
Figure 3.12: 13C-NMR spectra of 2,4-DMP 61
Figure 3.13: 13C-NMR spectra of 2,6-DMP 62
Figure 3.14: 13C-NMR spectra of 2,4,6-TMP 62
xv
Figure 4.1: Dynamic traces for 2-MMP at varying scan rates in the absence of NaOH 68
Figure 4.2: Dynamic traces for 4-MMP at varying scan rates in the absence of NaOH 69
Figure 4.3: Dynamic traces of 2-MMP in the presence of varying NaOH : 2-MMP molar ratios at 10 °C min-1 scanning rate 72
Figure 4.4: Dynamic traces of 4-MMP in the presence of varying NaOH : 4-MMP molar ratios at 10 °C min-1 scanning rate 73
Figure 4.5: Fractional conversion αp as a function of NaOH : MMP molar ratio for 2-MMP and 4-MMP 74
Figure 4.6: ΔHT as a function of NaOH : MMP molar ratio for 2-MMP and 4-MMP 75
Figure 4.7: Graph of ln(Φ/Tα 2) vs. 1/Tα between α = 0.05 and α =
0.95 and the corresponding square of the correlation coefficient (r2) values for 2-MMP sample with NaOH : 2-MMP molar ratio of 0.45 78
Figure 4.8: Effects of NaOH on the evolution of apparent activation energy Ea for 2-MMP as a function of the degree of conversion 79
Figure 4.9: Condensation reactions of 2-MMP 80
Figure 4.10: The sodium ring complex 81
Figure 4.11: Effects of NaOH on the evolution of apparent activation energy Ea for 4-MMP as a function of the degree of conversion 82
Figure 4.12: Self-condensation of 4-MMP 83
Figure 4.13: Addition reaction of CH2O to 4-MMP 83
Figure 5.1: Condensation reactions of 2,4-DMP 88
Figure 5.2: Minor condensation reaction of 2,4-DMP 89
Figure 5.3: Condensation reaction of 2,6-DMP 89

xvi
Figure 5.4: Para and ortho quinoid structures of 2,6-DMP and 2,4-DMP 90
Figure 5.5: Dimethylene ether linkage formation 90
Figure 5.6: DSC thermograms for the self-condensation reactions of 2,4-DMP in the presence of varying NaOH : 2,4-DMP molar concentrations obtained at 10 °C min-1 scan rate 91
Figure 5.7: DSC thermograms for the self-condensation reactions of 2,6-DMP in the presence of varying NaOH : 2,6-DMP molar concentrations obtained at 10 °C min-1 scan rate 92
Figure 5.8: ΔHT as a function of NaOH : DMP molar ratio for 2,4-DMP and 2,6-DMP 97
Figure 5.9: Graph of ln(Φ/Tα 2) vs. 1/Tα between α = 0.05 and α = 0.95
and the corresponding square of the correlation coefficient (r2) values for 2-MMP sample with NaOH : 2,4-DMP molar ratio
of 0.45 100
Figure 5.10: Effects of NaOH on the evolution of apparent activation energy Ea for 2,4-DMP as a function of the degree of conversion 101
Figure 5.11: Effects of NaOH on the evolution of apparent activation energy Ea for 2,6-DMP as a function of the degree of conversion 104
Figure 6.1: Condensation reactions of TMP 111
Figure 6.2: Chemical structure of trimer following condensation reactions of TMP 111
Figure 6.3: DSC thermograms for the self-condensation reactions of TMP in the presence of varying NaOH : TMP molar concentrations obtained at 10 °C min-1 scan rate 113
Figure 6.4: ΔHT as a function of NaOH : TMP molar ratio for TMP 115
Figure 6.5: Graph of ln(Φ/Tα 2) vs. 1/Tα between α = 0.05 and α = 0.93
and the corresponding square of the correlation coefficient (r2) values for 2,4,6-TMP sample with NaOH : 2,4,6-TMP molar ratio of 0.45 118

xvii
Figure 6.6: Effects of NaOH on the evolution of apparent activation energy Ea for TMP as a function of the degree of conversion 119
Figure 6.7: Fractional conversion as a function of temperature for TMP samples with various NaOH molar ratios 122
Figure 8.1: The weight-average molecular weight (Mw) and the polydispersity (Mw/Mn) of PF resoles as functions of NaOH / P molar ratio 143
Figure 8.2: The gel time of PF resoles as a function of NaOH / P molar ratio 144
Figure 8.3: DSC thermograms of the PF resoles having different NaOH / P molar ratios obtained at 10 °C min-1 scan rate 146
Figure 8.4: Fractional conversion of the cure reactions of the resoles as a function of temperature 147
Figure 8.5: ΔHT as a function of NaOH / P molar ratio for PF resoles 149
Figure 8.6: Graphs of ln(Φ/Tα 2) vs. 1/Tα between α = 0.05 and α =
0.95 and the corresponding square of the correlation coefficient (r2) values for a resole sample having NaOH / P molar ratio 0.50 153
Figure 8.7: Effects of NaOH / P on the evolution of apparent activation energy Ea for the resoles as a function of the degree of conversion 155

1
Chapter 1
Introduction
1.1 Background
1.1.1 General
The production of reconstituted wood products has become increasingly important
as the demand for wood and wood-based products continues to increase and the
availability of high quality large diameter logs continue to lessen due to logging
restrictions and environmental concerns. Reconstituted wood products consist of
products where wood chippings, shavings or course saw dust are bonded together
by adhesives to form a larger piece of solid wood product such as wood flake
boards, particle boards, wood fibre boards and plywood.
The viability of the reconstituted wood product industries greatly depends on the
understanding of and the use of suitable wood adhesives. In fact, wood bonding is
one of the largest-volume uses of adhesives, particularly in the softwood plywood
industry. Some of the commonly used wood adhesives in Australia are, phenol
formaldehyde (PF), resorcinol formaldehyde (RF), melamine urea formaldehyde
(MUF), and urea formaldehyde (UF).
Of these products, PF resoles are preferred especially for external and structural
applications because they are structurally the most durable and can provide high
quality wood bonding suitable for all climatic conditions. They are also
environmentally more acceptable due to negligible formaldehyde emission. Apart
from timber applications, PF resoles have also been used extensively because of
their high temperature resistance, high char yield and moderate flame resistance in
many areas, especially in coating applications, carbonless copy paper, air and oil
filters and in other composites.

2
Despite these advantages, conventional PF resoles have relatively slow cure rates,
require high cure temperature and are less tolerant of variations in anatomical
features and wood substrate properties such as moisture content and density, which
limit their allowable gluing conditions. Extensive research and development over
the last few decades have gone into making better performance PF resoles. One of
the most important research fields is the investigation of the mechanism and
kinetics of the cure behaviour because PF has a very complicated cure process that
involves many reactions that occur simultaneously, each of which is profoundly
influenced by reaction conditions. Detailed information on the applications,
advantages and general issues regarding the limitations of PF resoles can be found
in a number of references [1-10].
1.1.2 The production of PF resoles
Detailed information on the production of PF resoles can be found in references [2-
6]. Generally, PF resoles are produced by base-catalysed reaction between phenol
and formaldehyde and step-growth polymerisation. The resoles produced consist of
low to medium molecular weight “reactive intermediates” which are stable at room
temperature, but are thermo-sensitive and can readily be transformed into three
dimensional, cross-linked, insoluble, and infusible polymers by the application of
heat during the curing process. The first isolable products of the reaction between
phenol and formaldehyde are methylol phenols. The position of the methylol
groups on the phenol ring and the ratio of various methylol derivatives formed
largely determine the rate of polymerisation, as well as the structure and properties
of the subsequent higher molecular weight products.
It is generally agreed that the first phase, methylolation, involves the addition of
methylol groups exclusively at the active ortho and para positions of the phenol
ring to form two mono-methylol phenols, which further react with formaldehyde to
form two di-methylol phenols, followed by one tri-methylol phenol. Molar ratio of
formaldehyde to phenol, type and concentration of catalyst, temperature and pH are
important factors that influence the nature and composition of the methylol phenols
formed during this phase [11-14]. As the process advances to the second phase
with the application of heat, condensation reactions of the methylol phenols occurr

3
to form methylene and/or ether bridges. The condensation reactions of individual
methylol phenols vary considerably, leading to a large number of reaction products
with varying reactivity and thermal properties. As the process proceeds further to
higher temperatures during the cure phase, more complex condensations and
rearrangements of the pre-polymer intermediates occur, leading to highly
condensed infusible network structures. The formation and nature of this network
structure determine the properties of the fully cured product.
1.2 The Issues
Various studies have been carried out to investigate the thermochemical
characteristics of the entire PF reaction cycle that involves the addition of
formaldehyde to phenol, the condensation reactions of methylol phenol monomers
and the subsequent curing reactions. However, the kinetics and mechanisms
governing the entire PF reaction cycle remain relatively unclear, not only due to the
complexity of the system, which involves many consecutive or integrated
processes, but also the profound effect of temperature, pH conditions and the molar
ratio between phenol and formaldehyde on the reaction system [see, for example,
15-20].
Extensive efforts have gone into elucidating the reaction pathways by simplifying
the system and starting with the first addition products. For the purpose of
simplification, the use of individual methylol phenol monomers, rather than the
complex PF resoles as a whole, has been advocated as a legitimate approach to the
mechanistic study and can be very useful in providing empirical parameters for
modelling and controlling the PF reaction cycle. However, these efforts generally
concerned themselves with the mechanisms and kinetics of the reactions occurring
during individual stages, rather than with the entire PF process. Hence, there is
very limited published information regarding the thermochemical properties of
methylol phenols for the entire PF cycle [see, for example, 21-31].
Apart from the approach of using individual methylol phenol monomers, many
research efforts have been dedicated to the investigation of PF resoles as a whole.
Whilst differential scanning calorimetry (DSC) is often used to study the cure

4
properties of the resoles, these studies were often limited to the interpretation of the
DSC curves, rather than focusing on kinetic analysis to obtain relevant kinetic
information [see, for example, 32]. Where kinetic analysis was carried out, it was
often mistakenly assumed that the activation energy of the thermal reaction was
constant and did not change with the extent of the cure. A number of studies have
addressed this issue and demonstrated the complex dependence of the reaction
kinetics on the degree of the cure. Despite these encouraging efforts, the use of
DSC to obtain insights into mechanisms of the cure of PF resoles is still limited
[see, for example, 17, 18, 33-38].
1.3 The Objectives
The principal aim of the present research is to investigate the thermochemical
characteristics of the individual monomers in the temperature range up to 250°C.
As opposed to the common approach of focusing on individual curing stages, this
temperature range captures the kinetics throughout the entire PF cure cycle which
is identified to be the least well understood. The experiments incorporate the initial
lower temperature cross-linking reactions of the monomers to form the pre-polymer
compounds, through to the fully cure reactions that lead to solid network structures
occurring at higher temperatures.
The second aim of the research is to study the cure properties of PF resoles as a
whole with a particular focus on the dependence of the reaction kinetics on the
degree of the cure up to 250°C. This focus aims to address the problems created by
the common mistaken assumption in the published literature, that the activation
energy of the cure reactions did not change with the extent of the cure. It also
recognises the importance of a changing reaction medium as the cure proceeds that
may induce significant variations in the reaction kinetics of the resoles.
The thermochemical properties of both methylol phenol monomers and PF resoles
are monitored as a function of concentration of sodium hydroxide, a common basic
catalyst used in the making of the resoles. DSC is employed as the major analytical
tool to obtain relevant kinetic information using isoconversional analysis. The use
of the isoconversional method allows the activation energy to be determined as a

5
function of the extent of the cure and/or temperature without making any
assumptions about the reaction model, thus eliminating the uncertainties involved
in the traditional model-fitting approach. These kinetic data, together with relevant
established chemical information, form the basis upon which the reaction pathways
throughout the entire cure cycle will be elucidated.
The outcomes of the research serve as a contribution to efforts aiming to improve
the understanding of the cure mechanism of PF resoles, and from here, to aid in the
development of PF resole adhesive systems capable of bonding under a wide range
of gluing conditions and curing faster at lower temperatures.
1.4 Structure of the Thesis
The body of the thesis is presented in 9 chapters. Following the current chapter
which introduces the background to the research, chapter 2 is a literature review of
the chemistry and thermochemical behaviour of PF resoles and their monomers.
The effects of formulation parameters on the properties of the resoles, as well as the
use of DSC to study their cure behaviour, will also be briefly reviewed in chapter 2.
Chapter 3 presents the methodology and experimental details for the study of the
monomers. The experimental results and discussion for mono-methylol phenols, di-
methylol phenols and tri-methylol phenol are presented separately in chapters 4, 5
and 6, respectively. Chapter 7 provides a summary of the findings and compares
the thermochemical properties of individual methylol phenols in an effort to
provide a consistent overall picture of relevant mechanisms operating during the
cure process. Chapter 8 focuses on the study of PF resoles as a whole and the
effects of sodium hydroxide concentration on the properties and cure behaviour of
the resoles. The outcomes of the monomers study are used in the interpretation of
the results. Chapter 9 concludes the thesis and proposes directions for future
research.

6
1.5 References
1. T. Sellers Jr., “Wood Adhesive Innovations and Applications in North
America”, Forest Prod. J. 51, 12-22 (2001).
2. A. Pizzi, Wood Adhesives, Marcel Dekker, New York, 1983.
3. A. Knop, and L.A. Pilato, Phenolic Resins – Chemistry, Applications and
Performance, Springer-Verlag, Berlin, 1985.
4. A. A. Whitehouse, E. G. K. Pritchett, G. Barnett, Phenolic Resins, Iliffe:
London, 1967.
5. A.A. Marra, Technology of Wood Bonding: Principles in Practice, Van
Nostrand Reinhold, 1992.
6. Y. Yazaki and P. J. Collins, “Adhesion Science and Technology”, in
Proceedings of the International Adhesion Symposium, Japan, 1994, p. 607.
7. N. J. L. Megson, “Unsolved Problems in Phenol Resin Chemistry”, Chem.-
Ztg. 96(1-2), 15-19 (1972).
8. A. Pizzi, in “Handbook of Adhesive Technology”, A. Pizzi, K.L. Mittal
(ed.), Marcel Dekker, New York, 2003.
9. A. Gardziella, L.A. Pilato, A. Knop, “Phenolic Resins: Chemistry,
Applications, Standardization, Safety, and Ecology”, 2nd ed., Springer-
Verlag, New York, 2000.
10. M.F. Grenier-Loustalot, G. Raffin, B. Salino and O. Païssé, “Phenolic
resins Part 6. Identifications of Volatile Organic Molecules During Thermal
Treatment of Neat Resols and Resol Filled with Glass Fibers”, Polymer
41(19), 7123-7132 (2000).
11. J. Bouajila, G. Raffin, H. Waton, C. Sanglar, J.O. Paisse, M-F. Grenier-
Loustalot, “Phenolic Resins - Characterizations and Kinetic Studies of
Different Resols Prepared with Different Catalysts and
Formaldehyde/Phenol Ratios”, Polymers & Polymer Composites 10, 341
(2002).

7
12. G. Astarloa-Aierbe, J. M. Echeverria, A. Vazquez, I. Mondragon,
“Influence of the Amount of Catalyst and Initial pH on the Phenolic Resol
Resin Formation”, Polymer 41, 3311 (2000).
13. L.B. Manfredi, C. C. Riccardi, O. de la Osa, A. Vazquez, “Modelling of
Resol Resin Polymerization with Various Formaldehyde/ Phenol Molar
Ratios”, Polymer International 50 (7), 796-802 (2001).
14. I. Poljangek, B. Likozar, M. Krajnc, “ Kinetics of Hydroxymethyl Phenols
Formation by In-Line FTIR Spectroscopy”, J. Appl. Polym. Sci. 106 (2),
878-888 (2007).
15. L. Gollob, “The Correlation Between Preparation and Properties in
Phenolic Resins”, in Wood Adhesives – Chemistry and Technology Vol. 2,
A. Pizzi (ed.), Dekker, New York, 1989, p. 121.
16. A. Pizzi and A. Stephanou, “Phenol - Formaldehyde Wood Adhesives
Under Very Alkaline Conditions - Part I: Behaviour and Proposed
Mechanism”, Holzforschung 48, 35-40 (1994).
17. Y-K Lee, D-J Kim, H-J Kim, T-S Hwang, M. Rafailovich and J. Sokolov,
“Activation Energy and Curing Behaviour of Resol- and Novolac-Type
Phenolic Resins by Differential Scanning Calorimetry and
Thermogravimetric Analysis”, J. Appl. Polym. Sci. 89, 2589-2596 (2003).
18. M.F. Grenier-Loustalot, S. Larroque and P. Grenier, “Phenolic Resins: 5.
Solid-State Physicochemical Study of Resoles With Variable F / P Ratio”,
Polymer 37(4), 639-650 (1996).
19. T. Halopainen, L. Alvila, P. Savolainen, T.T. Pakkanen, “Effect of F/P and
OH/P Molar Ratios and Condensation Viscosity on the Structure of Phenol-
Formaldehyde Resol Resins for Overlays - A statistical study”, J. Appl.
Polym. Sci. 91(5), 2942-2948 (2004).
20. R. Banerjee, K. Patil, K.C. Khilar, Canadian Journal of Chemical
Engineering 84, 328 (2006).
21. M.M. Sprung and M.T. Gladstone, “A Study of Some Condensations of o-
Methylolphenol”, J. Am. Chem. Soc. 71, 2907 (1949).

8
22. M.F. Grenier-Loustalot, S. Larroque and P. Grenier, “Phenolic Resins: 1.
Mechanisms and Kinetics of Phenol and of the First Polycondensates
Towards Formaldehyde in Solution”, Polymer 35(14), 3045-3054 (1994).
23. M. Higuchi, T. Urakawa and M. Morita, “Condensation Reactions of
Phenolic Resins. 1. Kinetics and Mechanisms of the Base-Catalyzed Self-
Condensation of 2-Hydroxymethylphenol”, Polymer 42, 4563 (2001).
24. J.H. Freeman and C.W. Lewis, “Alkaline-catalyzed Reaction of
Formaldehyde and the Methylols of Phenol; A Kinetic Study”, J. Am.
Chem. Soc. 76, 2080-2087 (1954).
25. L.M. Yeddanapalli and D.J. Francis, “Kinetics and Mechanism of the Alkali
Catalysed Condensation of o- and p-Methylol Phenols by Themselves and
with Phenol”, Die Makromolekulare Chemie 55, 74-86 (1962).
26. D.J. Francis and L.M. Yeddanapalli, “Kinetics and Mechanism of the Alkali
Catalysed Condensations of Di- and Tri-Methylol Phenols by Themselves
and with Phenol”, Die Makromolekulare Chemie 125, 119-125 (1969).
27. R.T. Jones, “The Condensation of Trimethylol Phenol”, J. Polym. Sci. 21,
1801 (1983).
28. Grenier-Loustalot, S. Larroque and P. Grenier, “Phenolic Resins: 4. Self-
Condensation of Methylolphenols in Formaldehyde-Free Media”, Polymer
37(6), 955-964 (1996).
29. N. Kamo, M. Higuchi, T. Yoshimatsu, T. Yoshimatsu, Y. Ohara, M.
Morita, “Condensation Reactions of Phenolic Resins III: Self-
Condensations of 2,4-Dihydroxymethylphenol and 2,4,6-
Trihydroxymethylphenol”, Journal of Wood Science 48(6), 491-496 (2002).
30. N. Kamo, M. Higuchi, T. Yoshimatsu, M. Morita, “Condensation reactions
of phenolic resins IV: self-condensation of 2,4-dihydroxymethylphenol and
2,4,6 trihydroxymethylphenol (2)”, Journal of Wood Science 50(1), 68-76
(2004).
31. N. Kamo, J. Tanaka, M. Higuchi, T. Kondo, M. Morita, “Condensation
reactions of phenolic resins VII: Catalytic Effect of Sodium Bicarbonate for

9
the Condensation of Hydroxymethylols”, )”, Journal of Wood Science
52(4), 68-76 (2006).
32. J. Monni, L. Alvila, J. Rainio, T.T. Pakkanen, “Novel Two-Stage Phenol-
Formaldehyde Resol Resin Synthesis”, J. Appl. Polym. Sci. 103 (1), 371-
379 (2007).
33. P.W. King, R.H. Mitchell, and A.R. Westwood, “Structural Analysis of
Phenolic Resole Resins”, J. Appl. Polym. Sci. 18, 1117-1130 (1974).
34. A.W. Christiansen and L. Gollob, “Differential Scanning Calorimetry of
Phenol-Formaldehyde Resols”, J. Appl. Polym. Sci. 30, 2279-2289 (1985).
35. G. Carotenuto and L. Nicolais, “Kinetic Study of Phenolic Resin Cure by
IR Spectroscopy”, J. Appl. Polym. Sci. 74, 2703-2715 (1999).
36. B.D. Park, B. Riedl, Y.S. Kim and W.T. So, “Effect of Synthesis
Parameters on Thermal Behaviour of Phenol-Formaldehyde Resol Resin”,
J. Appl. Polym. Sci. 83, 1415-1424 (2002).
37. G. He, B. Riedl and A. Ait-Kadi, “Model-Free Kinetics: Curing Behavior of
Phenol Formaldehyde Resins by Differential Scanning Calorimetry”, J.
Appl. Polym. Sci. 87, 433-440 (2003).
38. J. Monni, L. Alvila, T.T. Pakkanen, “Structural and Physical Changes in
Phenol-Formaldehyde Resol Resin, as a Function of the Degree of
Condensation of the Resol Solution”, Industrial & Engineering Chemistry
Research 46(21), 6916-6924 (2007).

10
Chapter 2
Literature Review of Thermochemical Behaviour of
PF Resole and Its Monomers
2.1 PF Resoles –Background
2.1.1 History
In 1910, synthetic resins formed by the condensation of phenols with formaldehyde
were the first resinous products to be commercially produced entirely from simple
compounds of low molecular weight. They remain one of the more important
products of the plastics industry as moulding and impregnated products and
insulation materials, particularly for electrical insulation. Early difficulties were the
tendency for the product to be brittle, crack, blister easily, and the violent nature of
the condensation reaction made it difficult to control. However, in 1907, Baekeland
provided the real solution of making quick-curing mouldings under controlled
conditions without the problems of cracking and blistering [1]. He showed that
acids and bases were chiefly catalytic in action and could be used in very small
proportions, whereas previously equi-molar or even larger amounts had been used.
With small proportions of an acid catalyst and a low molar ratio of formaldehyde to
phenol, permanently fusible resins soluble in common solvents, such as alcohol and
acetone, were obtained and called “novolaks”. This type of adhesive resin is not
important as a wood adhesive because the faster cure of the novolak compounds
can only result in linear molecules which result in a permanently fusible resin [2].
On the other hand, resinous compounds obtained with a basic catalyst and high
molar ratio of formaldehyde to phenol were different in character and were called
“resoles”. Once fully cured, they have the ability to form infusible, insoluble, three
dimensional cross-linked network structures which provide highly desirable
performance properties such as high modulus and tensile strength, good

11
dimensional stability and solvent resistance as well as being relatively low cost [3].
For these reasons, the ability to characterise the cure of the PF resole is of great
benefit from an application standpoint, since the degree of cure will significantly
influence the properties of the cured resin.
In the 1930s, resole adhesives became widely used in the wood products industry
for the manufacture of particleboard and plywood and then for the manufacture of
oriental strand board (OSB) since its introduction in the 1970s. Today, the PF
resoles continue to dominate composite wood adhesives and are a major cost factor
in the industry [4].
2.1.2 Application of PF resoles in the wood industry
Generally, PF resoles are produced and applied in the wood industry in three stages
[4]:
Stage A: Is obtained by reacting phenol and formaldehyde with basic catalyst. The
resin may be solid, liquid or semi-liquid, and is soluble in solvents. It can be stored
until applied to the wood components.
Stage B: The wood components and resin are then placed in a hot press, with
temperatures ranging between 130°C to 140°C and high pressures between (300 to
700) kPa. During this stage the PF resin becomes solid and insoluble, but may
swell in common solvents such as acetone or alcohol.
Stage C: On further heating, the resin in Stage B is converted to the final Stage C,
which is infusible and insoluble in organic solvents. This cure stage is normally
effected in 5 to 10 minutes. Volatiles, mainly water and insignificant amounts of
formaldehyde are eliminated during the cure process.
Major advances have been made in clarifying the mechanisms of each of the three
stages, particularly when methods were developed for simplifying the systems by
using pure phenol alcohols in place of the complex mixtures found in typical
resoles. There were some criticisms of early workers using the model phenol
alcohols because it was contended that the results might not be applicable to

12
commercial resins. However, this approach was later recognised to be sound as it
was accepted that functional groups generally undergo the same reactions in
monomeric and polymeric systems [see, for example, 4-6].
2.2 PF Resole Chemistry
Three reaction sequences must be considered in relation to PF resole production
and application: formaldehyde addition to phenol to form monomers, condensation
reactions to form resole, and finally the cross-linking reactions or cure of the
resole.
2.2.1 Formaldehyde addition to phenol to form monomers
2.2.1.1 General
The first step in the formation of resole is the addition of formaldehyde to phenol to
form monomers. This reaction is carried out at around 60°C using molar excess
formaldehyde and in the presence of alkaline metal hydroxides, commonly sodium
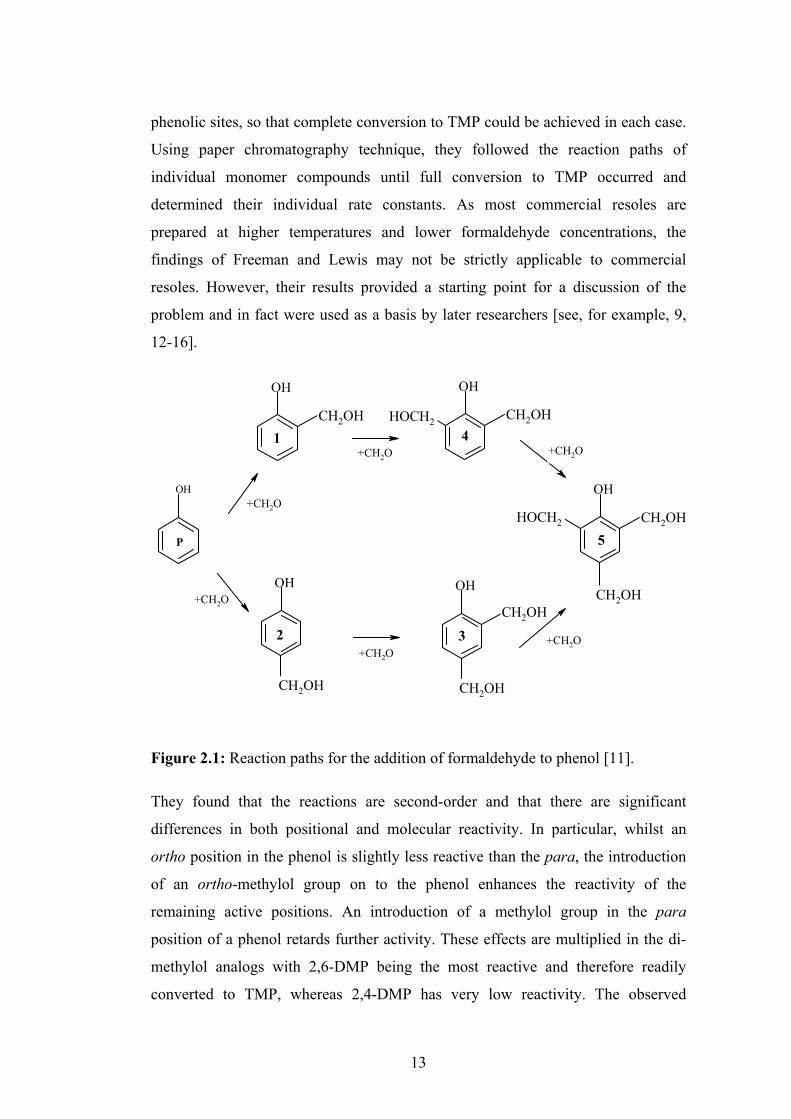
hydroxide, at pH 8 - 13. The reaction paths are shown in Figure 2.1. Essentially,
the formaldehyde attacks exclusively at the active ortho and para positions of the
phenol ring, adding methylol groups to these sites to form two mono-methylol
phenols (MMP), then two di-methylol phenols (DMP), followed by one tri-
methylol phenol (TMP) (compounds 1 to 5 respectively) [5, 7, 8]. Meta substitution
does not occur. The objective during this step is to react as much of the phenol with
the formaldehyde to obtain as many methylol groups attached as possible, which is
important for structural as well as environmental reasons. The methylol functional
groups on the monomers tend to react by condensation. However, at 60°C and
below, condensation reactions are negligible, thus giving the phenol an opportunity
to react relatively completely with the formaldehyde [9, 10].
2.2.1.2 Reactivity of methylol phenols with formaldehyde
Freeman and Lewis [11] first performed the most complete study to determine the
reactivity of individual methylol phenols with formaldehyde by reacting them at
30°C with an amount of formaldehyde equivalent to the total number of reactive
13
phenolic sites, so that complete conversion to TMP could be achieved in each case.
Using paper chromatography technique, they followed the reaction paths of
individual monomer compounds until full conversion to TMP occurred and
determined their individual rate constants. As most commercial resoles are
prepared at higher temperatures and lower formaldehyde concentrations, the
findings of Freeman and Lewis may not be strictly applicable to commercial
resoles. However, their results provided a starting point for a discussion of the
problem and in fact were used as a basis by later researchers [see, for example, 9,
12-16].
OH
OH
CH2OH
OH
CH2OH
OH
CH2OH
CH2OH
OH
CH2OHHOCH2
OH
CH2OH
CH2OHHOCH2
P
+CH2O
1
2 3
4
5
+CH2O +CH2O
+CH2O+CH2O
+CH2O
Figure 2.1: Reaction paths for the addition of formaldehyde to phenol [11].
They found that the reactions are second-order and that there are significant
differences in both positional and molecular reactivity. In particular, whilst an
ortho position in the phenol is slightly less reactive than the para, the introduction
of an ortho-methylol group on to the phenol enhances the reactivity of the
remaining active positions. An introduction of a methylol group in the para
position of a phenol retards further activity. These effects are multiplied in the di-
methylol analogs with 2,6-DMP being the most reactive and therefore readily
converted to TMP, whereas 2,4-DMP has very low reactivity. The observed

14
differences in reactivity between the para and ortho methylol compounds are
attributed to the effect of hydrogen bonds in the ortho methylol compounds. With
these results, Freeman and Lewis predicted that in a reaction between phenol and
formaldehyde, 4-MMP and 2,4-DMP are the major components, 2-MMP is a minor
component, 2,6-DMP will be below the limits of detection and the relative amounts
of TMP and residual phenol are determined by the amount of formaldehyde
available.
More recently, Grenier-Loustalot et al. [17] conducted a series of studies to
determine the reactivity of individual methylol phenols with formaldehyde in
conditions of resole synthesis (60°C, catalysed by NaOH at pH 8). Using a range
of techniques including HPLC, 13C NMR, FTIR and chemical assays, they
monitored the kinetic and mechanistic changes in each monomer as a function of
time and obtained rate constants by simulating kinetic curves during the first hours
using a second-order equation of the type dx/dt = kC0(1-x)2. Their results supported
the reaction path of each monomer as found by Freeman and Lewis. They also
confirmed that 2,6-DMP is the most reactive compound and 2,4-DMP the least and
will likely to accumulate in the mixture. However, the results for the reactivity of
2-MMP and 4-MMP seemed to contradict those of Freeman and Lewis. In the
experimental conditions chosen, they classified the reactivity of each monomer as:
k 2,4-DMP < k 2-MMP < k 4-MMP < k 2,6-DMP. Besides the addition of formaldehyde to the
phenol, some condensation reactions occurring between the monomers to form
dimers and trimers were also observed.
2.2.2 Condensation reactions to form resole
2.2.2.1 Condensation reactions
As heating is continued in the range from above 60°C to 100°C, the reaction
advances to the second stage of the process, which involves the condensation
reactions of the methylol phenols [6]. This may occur via three possible reaction
mechanisms to form ether and / or methylene linked chains as shown in Figure 2.2
[17]. In the case of the ether bridge, the mechanism involves the reaction between
two methylol groups and the release of one molecule of water with the creation of a

15
dimethylene ether bridge (Scheme IV, Figure 2.2). Ether formation is favoured
under neutral or acidic conditions. The formation of the methylene bridge involves
the reaction of a methylol group either with another methylol group with the
simultaneous release of one molecule of water and one molecule of formaldehyde,
or with a proton on the aromatic ring (ortho or para) with the release of one
molecule of water (Schemes V and VI, respectively, Figure 2.2). The resultant
resole has low degrees of polymerisation and consists of a complex mixture of
species such as unreacted phenol, formaldehyde, water and various monomers and
dimers with a substantial proportion of reactive methylol groups reacted.
OH OH
+ HO CH2 + H2OOH
CH2OH CH2OH
CH2O IV
OH OH
+ HO CH2 + H2OOH
CH2OH CH2OH
V+ CH2O
OH OH
+ HO CH2 + H2OOH
CH2OH
VICH2OH
CH2OH
Figure 2.2: Formation of dimethylene ether and methylene bridges.
The kinetic and mechanistic aspects of the condensation reactions of the individual
methylol phenols have been investigated in a number of studies [14, 18-23]. Whilst
the reaction conditions and the method of analysis between these studies are
different, there are differing results, but also some similarities. One of the early
experiments to shed an insight into the mechanism was conducted by Reese in a
series of experiments by individually heating the five monomers in alkaline

16
solutions at 70°C [21]. The monomers were heated alone for a predetermined
period following which the products of the reaction were separated by two-
dimensional chromatography. Reese found that for both 2-MMP and 2,6-DMP, the
condensation involved the reaction of a methylol group with a free para hydrogen
on the ring of the coupling monomer to form an (o,p) methylene link. No loss of
formaldehyde was observed and hence the reaction proceeded via Scheme VI
(Figure 2.2). On the other hand, 4-MMP and 2,4-DMP and 2,4,6-TMP, coupled
preferentially at the para position and formed (p,p) methylene links with the loss of
formaldehyde as in Scheme V (Figure 2.2). He also observed small quantities of
2,4-DMP formed when 4-MMP was condensed, which may be attributed to the
addition of the released formaldehyde to a free nuclear position.
Yeddanapalli and Francis [20, 22] carried out a series of studies to determine the
kinetics and mechanisms of the self-condensation reactions of the five monomers
in alkaline solution. They heated the reaction mixture in a reaction vessel
isothermally at (70, 80, 90) °C and samples of the mixture were removed at regular
intervals and the course of the reaction was followed by quantitative paper
chromatography to analyse and identify the reactants and products (Table 2.1). It
was noted that other reactions also appeared in minor amounts, but could not be
identified. In regard to the relative reactivity, their results indicated that the para-
position of 2-MMP appeared to be twice as reactive as the ortho-position of 4-
MMP. This is in agreement with the generally recognised fact that the ortho
position is less reactive than the para in electrophilic substitution reactions. They
also obtained values for the activation energy from the plot of the first-order log
rate constants against reciprocal of temperature (Table 2.1). The self-condensation
reaction of the 2-MMP in the absence of a catalyst was observed to be second-order
with an activation energy of 83.7 kJ mol-1. Similar to Reese, small quantities of
2,4-DMP formed when 4-MMP was condensed.

17
Table 2.1: Reaction products from the self-condensation reactions of monomers as observed by Yeddanapalli and Francis [20, 22].
Monomer Reaction Product Linkage / Mechanism
Rate constant*
(k) s-1
Ea kJ mol-1
OH
CH2OH
OH
OHCH2
CH2OH
+ H2O
ortho - para
VI 1.6x10⁻⁵
77.5
OH
CH2OH
OH
OH + H2OCH2
CH2OH
OH+CH2O
+ H2OCH2HO
+ 2,4-MMP
ortho-para
VI
para-para
V
1.67x10⁻⁵
72.4
OH
CH2OH
CH2OH
OH
+ H2OCH2HO
CH2OHHOCH2
CH2OH
OH OH
+ H2OCH2
CH2OH
CH2OH
CH2OH
ortho-para
VI
ortho-ortho
VI
6.23x10⁻⁵ __
OH
CH2OHHOCH2
OH
+ H2OCH2HO
CH2OHHOCH2
HOCH2
ortho-para
VI 8.56x10⁻⁵ 81.6
OH
CH2OH
CH2OHHOCH2
OH + H2OCH2HO
CH2OH
CH2OH+CH2O
HOCH2
HOCH2
para-para
V __ __
*Rate constant for the disappearance of the monomer.

18
A more recent study carried out by Grenier-Loustalot et al. [17] simulated the
condensation reactions for each of the five substituted phenol monomers as alkaline
solutions without formaldehyde and in similar conditions of resole synthesis
(60°C, catalysed by NaOH at pH = 8) in order to determine the reaction
mechanisms and the reactivity during condensation of each of the monomers.
Using 13C-NMR and HPLC, they followed the changes during the self-
condensation reaction of these monomers in the absence of formaldehyde. Their
results, similar to those in the work of Reese and Yeddanapalli, showed only the
formation of methylene bridges under these particular experimental conditions
(Schemes V or VI, Figure 2.2) and that two parameters affecting the reactivity of
the monomers were the position and the number of methylol groups on the
aromatic ring. Table 2.2 summarises their observations in terms of the mechanism
and type of linkage formed during the self-condensation of the monomers.
The study by Grenier-Loustalot et al. showed that no ortho – ortho linkage was
formed and that a methylol group in the para position preferentially reacted with
another para methylol, rather than with an ortho methylol, to form para–para
methylene bridges. This may be due to intra-molecular interactions between
methylol groups in ortho position and the hydroxyl group of the aromatic ring, or
to steric hindrance preventing the sites from reacting [17, 22]. The reactivity of the
monomers towards themselves was also shown to increase with increasing
methylol substitution. Furthermore, the reactivity of 2-MMP toward itself was
about five times less than that of 4-MMP. These results mostly corroborate with
those of Yeddanapalli and Francis.

19
Table 2.2: Reaction products from the self-condensation reactions of monomers as observed by Grenier-Loustalot et al. [17].
Monomer Reaction Product Linkage Mechanism
OH
CH2OH
OH
OHCH2
CH2OH
+ H2O
ortho - para VI
OH
CH2OH
OH
OH + H2OCH2
CH2OH
OHHO+CH2O
+ H2OCH2
ortho-para
para-para
VI
V
OH
CH2OH
CH2OH
OH+ CH2O
+ H2OCH2HO
CH2OHHOCH2
OH
OH
+ H2OCH2
CH2OH
CH2OH
para-para (major component) ortho-para
V
VI
OH
CH2OHHOCH2
OH
+ H2OCH2HO
CH2OHHOCH2
HOCH2
ortho-para
VI
OH
CH2OH
CH2OHHOCH2
OH + H2OCH2HO
CH2OH
CH2OH+CH2O
HOCH2
HOCH2
OH
+CH2O
+ H2OCH2
CH2OH
CH2OH
HOCH2
HOCH2
HO
para-para ortho-para
V
V

20
2.2.2.2 Effects of alkalinity on the condensation reactions
It is well established that ether linkages resulting from the self condensation
reactions of the monomers only occur in slightly acidic or neutral reaction
conditions and that ether formation is essentially, if not completely, eliminated
under alkaline conditions [19, 21, 24-26]. Various studies have also been published
on the kinetics and mechanisms of the condensation reactions of the monomers,
mostly over narrow ranges of temperature and alkalinity [see, for example, 12, 27,
28]. This limitation has also been identified by Poljangek et. al. [9]. Sprung and
Gladstone [25] studied the condensation reactions of 2-MMP with itself in the
presence and absence of a basic catalyst (triethanolamine). They reported that the
self-condensation of 2-MMP is second-order without the catalyst, but is first-order
in the presence of the catalyst, and that the rate constant was independent of the
basic strength. Yeddanapalli and Francis also observed that the base-catalysed self-
condensation reactions of the mono-, di- and tri-methylol monomers in an aqueous
system were first-order, but that the reactivity of the ortho-methylol group
decreased considerably at higher concentrations of alkali [20, 22].
More recently, Kamo et. al. [14, 30, 31] studied the order of reaction of self-
condensation of each of the mono-, di-, and tri-methylol phenol monomers as
solutions under varying NaOH / monomer molar ratio. They noted that the above
mentioned earlier authors derived their kinetic results by graphing the reactant
concentration against reaction time and they ignored the possible effect of the
evolved condensation reaction products on the reaction. Kamo at. al. by using
HPLC, LC-MS and NMR analysis techniques, found that the reaction mechanism
of the condensation reactions of the methylol phenol monomers changes in a
complex manner with the evolution and further reactions of reaction products
during the condensation reaction.
Jones [19] carried out the self-condensation reaction of TMP in an aqueous
solution at 40°C over a range of pH 3-11 and monitored the disappearance of the
TMP by HPLC. Contrary to previous investigators, he proposed that the self-
condensation reactions of TMP are best explained by mechanisms that involve the

21
formation of quinone methide intermediate. In particular, from pH 3 to pH 5, the
following reactions between unionized molecules are predominant:
RR
CH2OH
O
CH2
RROH
+ H2O
quinone methide intermediate
RR
CH2OH
OH O
CH2
RR
+ CH2
R
R
R
R
OHHO + CH2O
Figure 2.3: Condensation reactions of TMP from pH 3 to pH 5.
From pH 5 to pH 10, the major reactions are between ionized and unionized
molecules:
RR
CH2OH
O
CH2
RROH
+ H2O
quinone methide intermediate
RR
CH2OH
O- O
CH2
RR
+ CH2
R
R
R
R
O-HO + CH2O
Figure 2.4: Condensation reactions of TMP from pH 5 to pH 10.
Above pH 10, the reactions between ionized molecules predominate:

22
RR
CH2OH
O- O
CH2
RR
+ OH-
quinone methide intermediate
RR
CH2OH
O- O
CH2
R
+ CH2
R
R
R
O-HO + CH2OR
R
Figure 2.5: Condensation reactions of TMP above pH 10.
In a more recent study, Higuchi [18] supported the quinone methide hypothesis and
found that the self-condensation of 2-MMP is first-order. Furthermore, he
ascertained that the reaction rate of the self-condensation of 2-MMP increases with
increase in NaOH : 2-MMP molar ratio until it reaches the maximum at around the
molar ratio of 0.10. Thereafter, it decreases as the molar ratio increases. The
activation energy was found to be 103 kJ mol-1 obtained at (80, 90 and 100) °C
with NaOH : 2-MMP molar ratios of 0.05, 0.10, 0.50 and 0.75. This value is
greater than those reported by Sprung and Gladstone (77.5 kJ mol-1) [25] and
Yeddanapalli and Francis (66.7 kJ mol-1) [20].
2.2.3 Cure reactions of resole
2.2.3.1 General
Cure is a thermally activated process, by which one or more reactants are
transformed from low-molecular weight materials to a highly cross-linked network.
During the cure, heat is applied and the cross-linking is established through the
reactive methylol groups with the occurrence of gelation at some intermediate stage
in the polymerisation process. At the gel point, the system loses fluidity since the
gel is insoluble in all solvents even at elevated temperatures due to molecular
entanglement by branching and some cross-linking. The non-gel portion of the
polymer remains soluble.

23
As the polymerisation proceeds beyond the gel point, the amount of gel increases at
the expense of the soluble portion [6]. The reaction is continued until the final
infusible, insoluble, three-dimensional cross-linked state is reached as shown in
Figure 2.6 (Scheme VII):
CH2
OH
HO
CH2 CH2
OH VII
CH2OH
CH2OH
CH2OH
CH2OH
OH
HOH2C
HOH2C
Figure 2.6: Three-dimensional cross-linked state.
Whilst it is preferable to fully methylolate the phenolic molecule to provide site for
three-dimensional cross-linking, not all reactive sites are accessible to
formaldehyde as the oligomer increases in size, due to steric reasons or molecular
shielding. These processes have been described theoretically and empirically by
the works of Flory [32] and Gan et al. [33].
2.2.3.2 Reactions during the cure of resole
The cure of a PF resin is extremely complex, involving a number of competing
reactions each of which may be profoundly influenced by reaction conditions [9,
13, 29]. A further complicating factor is introduced by the possibility of reaction at
either or both the ortho and para positions of the phenol. This not only leads to
large number of isomeric products, but also to products of varying reactivity,
depending on the location of the functional group. Knowledge of the chemistry of
cure depends greatly on studies of model systems and studies of the products of
degradation.
Previous studies have revealed amongst other things that the nature of cure
reactions is dependent on temperature. Below about 170°C, reactions characterised
by molecular extension predominate. The primary reactions in this temperature

24
range are those which form methylene and ether linkages. Methylene linkages are
the most stable as well as the most important linkages established during the cure.
It may be formed either directly or indirectly according to Schemes IV – VI
(Figure 2.2). Although the para position is favoured for condensation over the
ortho position on a per site basis, the proportion of ortho-para linkages is higher
than para-para linkages since there are twice as many ortho as para sites [5, 21-
24].
The formation of ether linkages as per Scheme IV (Figure 2.2) is another important
reaction under acidic or neutral conditions at temperatures below about 170°C.
Ether formation is essentially, if not completely, eliminated under alkaline
conditions. It appears that phenols with ortho-methylol groups are generally more
susceptible to ether formation than those with para- methylol groups [38, 39]. The
ratio of methylene to ether linkages formed also depends on the number of
methylol groups as compared to the number of free ring positions in the resole.
With a resole of high methylol content, or conversely with a resole with a few free
ortho and para ring positions, ether formation becomes increasingly important [5,
40]. The ether linkages are unstable at higher temperatures and may undergo
further reactions [41]. On the other hand, the methylene linkages are very stable
normally until the point of complete decomposition of the cured resole.
As the cure proceeds beyond about 170°C, many complex changes may occur.
Ether linkages may undergo further reactions, for instance, to form methylene
linkages with further loss of formaldehyde [3, 5, 40]. Further reactions may also
arise from monomers that have not already reacted at lower temperatures. At higher
temperatures, above about 200°C, thermal and oxidative decomposition of the
resin, together with simultaneous reactions involving the formation of quinone
methides and their polymerisation may occur, leading to extremely complex
products [3, 5, 6, 40, 63, 64].

25
2.3 Effects of Formulation Parameters on Properties of PF
Resoles
Generally, PF resoles in the cured state are insoluble infusible materials which, by
their very nature, are difficult to examine by many analytical techniques. Yet,
owing to the advances in thermal and spectroscopic methods of investigation in
polymer chemistry, progress has been made to improve the understanding of these
intricate processes. The main objectives of the majority of the studies were to
correlate the effects of the formulation parameters on: (i) the chemical structural
features of the pre-polymer compounds comprising the resole; and (ii) relate these
to cure characteristics and cured resin performance for optimisation purposes [9,
10, 13, 23, 41-44].
A key parameter that has been extensively studied is the formaldehyde / phenol
molar ratio (F / P) [12, 15, 23, 44]. Generally, increasing the F / P ratio has the
effect of increasing the molecular weight of the resole [37, 42, 45, 46]. In a study
using solid-state 13C-NMR, FTIR, spectroscopy with cross-polarization and magic
angle spinning (CP/MAS) Grenier-Loustalot et al. [47] reported that the extent of
methylol substitution in the phenolic ring increases with increasing F / P ratio.
Similarly, Holopainen et al. [45] suggested that increasing F / P value enhances the
concentration of methylol groups in methylol phenols, resulting in increasing
amounts of methylene and ether linkages and in rigid structure. Park et al. [46]
observed that as the F / P molar ratio increased, the viscosity of the resole also
increased. This was attributed to the higher degree of methylolation and more
cross-linking at higher F / P ratios. The study also showed that the gel time of the
resole decreased with increasing F / P molar ratio, suggesting that a higher F / P
molar ratio makes the resole cure faster than a lower F / P molar ratio does. This
increased reactivity of the resole was attributed to the higher amounts of reactive
mythylol groups formed in the resole with higher F / P ratios.
Another parameter that greatly influences the cure properties of the resole is the
NaOH / phenol molar ratio (NaOH / P) [48]. Park et al. [46] reported that the
molecular weight of the resole increases with increase in NaOH / P molar ratio.

26
This is in agreement with the results reported in a previous study by Gollob [42].
Pizzi and Stephanou [49] studied the cure behaviour of PF resoles under neutral
and alkaline conditions using IR, UV, 13C-NMR, paper chromatography techniques
and gel times. They found that gel times increased at around pH 9 – 10, indicating
that the rate of cure of the PF resole slows down markedly at high pH, instead of
accelerating as commonly thought. They postulated that a ring complex holding
Na+ is formed between the phenolic ring and the ortho-methylol group and
explained the progressive retardation of the cure with increase in pH on the basis of
this ring complex mechanism. Park et al. [46] also found that gel times of PF resole
increased as NaOH / P ratio was increased from 0.20 to 0.50 and attributed the
retarding effect of NaOH on the reaction kinetics to the formation of the sodium
ring complex. Likewise, Haupt and Waago [50] investigated the effect of varying
NaOH / P ratio (0.05 to 0.95) on the relative rate constants of condensation
reactions of PF resoles using gel permeation chromatography (GPC) and
viscometry. They found amongst other things that the condensation rate increased
as NaOH / P was increased from 0.05 to 0.30. However, further increases in NaOH
/ P ratio to 0.95 had the effect of decreasing the condensation rate. A similar effect
of NaOH in retarding the condensation kinetics of PF resoles was also reported by
Christiansen and Gollob [51] as they varied NaOH / P ratio from 0.45 to 0.75 and
by He and Yan [52].
2.4 The Use of DSC to Study the Cure Behaviour of PF
Resoles
DSC has been used in many studies to investigate the cure behaviour of PF resoles
[see, for example, 40, 41, 45-47, 51-56]. The nature of the DSC peaks has been a
subject of extensive investigation [10, 41, 52, 55-57]. Christiansen and Gollob [51]
used DSC to follow the cure behaviour of resoles having varying F / P ratio and
pH. The DSC analysis showed two major exothermic peaks. The first peak between
98°C and 129°C was quite sharp and attributed to the addition of formaldehyde to
phenolic rings, whereas the second peak between 139°C to 151°C was always
broader and attributed to the condensation reactions involving methylol groups.

27
This hypothesis was supported by the fact that the first exothermic peak was found
to be more intense with the increase in the free formaldehyde content.
King et al. [40] used DSC to study the effects of F / P ratio and type of catalyst
(NaOH and triethylamine) on the cure characteristics of resoles. They found that
the DSC curves had two peaks at 155°C and 185°C and that the relative
significance of the peaks depended largely on the type of catalyst used and not very
much on F / P ratio. They attributed the lower peak to the formation of methylene
linkages and the higher to the formation of ether linkages. Holopainen et al [45]
also reported two exotherms at temperatures higher than about 150°C for PF
resoles with varying F / P molar ratios. These exotherms overlapped at lower F / P
ratios (1.90 - 2.00), but became well-separated at higher F / P ratios (2.15 - 2.30).
As the F / P ratio increased, the peak temperature of the first exotherm changed
only slightly, whereas the peak temperature of the second exotherm increased
significantly. The first exotherm was attributed to the formation of ether and
methylene linkages, and the second to further reactions of the resin, for example,
the condensation of ether linkages to methylene linkages eliminating formaldehyde.
It was also suggested in this study that the increase of F/P ratio resulted in increases
of methylol concentration and in amounts of methylene and ether linkages in the
rigid resin, which made the condensation of ether linkages more difficult as
evidenced by the shift of the second exotherm to higher temperatures.
A single DSC exothermic peak for certain resoles was also observed in other
studies [46, 47, 53]. He et al. [53] observed a single DSC peak at about 150°C
during the curing of both low and high viscosity resoles. This peak was attributed
to the condensation reactions to form ether and methylene linkages, since
comparative experiments in the same study suggested that the addition reactions
were almost complete prior to the curing process. The authors also noted that
addition reactions due to formaldehyde released during the cure could occur
simultaneously with condensation reactions. Park et al. [46] also observed a single
exothermic DSC peak for all samples with varying F / P and NaOH / P molar
ratios, but attributed this to the lower molecular weight of the resoles used in their
study.

28
In addition to the focus on the nature of the DSC peaks, a number of studies have
also analysed the DSC curves to obtain kinetic information [see, examples, 52, 55-
57]. The analyses commonly involved fitting the DSC data to a hypothetical
reaction model of f(α). Following this model-fitting, the Arrhenius parameters such
as reaction order (n), activation energy (Ea), pre-exponential factor (Z), reaction
rate (k) were determined by the form of f(α) assumed [41, 55-57]. However, there
are discrepant results and interpretations. For instance, Lee et al. [54] investigated
the change in Ea of thermal reactions and cure behaviour of the resole as a function
of the F / P molar ratio ranging from 1.3 to 2.5. They observed a single exothermic
DSC peak for all samples and assumed that the reactions had nth-order kinetics and
used the Kissinger method [58] to calculate Ea from the plotting of –ln(βTp2) versus
1/Tp, where β is the heating rate and Tp is the peak exotherm temperature. They
found that Ea was 17.6 kJ mol-1 for F / P molar ratio of 1.3 and decreased to 15.2 kJ
mol-1 for molar ratio of 2.5.
In the study by Park et al. which also observed a single exothermic peak as
discussed above, the authors also assumed nth-order kinetics, but used the
Borchardt-Daniels method [59] which is based on a single heating rate run for the
calculation of Ea. In this case, Ea was found to increase from 92.4 kJ mol-1 for F / P
ratio of 1.9 to 118.7 for F / P ratio of 2.5. This is in disagreement with the
decreasing trend for Ea with increasing F / P ratio as found in Lee et al. As well, the
values for Ea in Park et al. were much higher than those in Lee et al. Park et al. also
calculated Es for varying NaOH / P ratio. They found that Ea had a value of 102.0
kJ mol-1 for NaOH / P of 0.2 and decreased to 90.5 kJ mol-1 as NaOH / P was
increased to 0.50. However, as the authors pointed out, such a decreasing trend of
Ea with increasing NaOH / P ratio is not consistent with other findings that the
reactivity of PF resoles decreases under high alkaline conditions.
These studies assumed that Ea does not change with temperature. A major problem
with this approach is that it ignores the complexity of the reactions and the
complex dependence of Ea on the degree of the cure, as has been shown in a
number of studies [see, for example, 14, 30, 55]. In particular, Kiran and Iyer [60]
studied the cure behaviour of a paper – PF resole composite using DSC in the

29
dynamic heating mode up to 250°C. They observed that Ea beyond 30 %
conversion was about one-half of its value observed at the lower conversion range.
The decrease in the “apparent” Ea was attributed to diffusion limitation that became
significant beyond 30 % conversion. The authors suggested that the kinetics of the
cure could be described by the homogeneous first-order model below 30 %
conversion and by the Jander 3-dimensional diffusion model beyond 30 %
conversion. Vazquez et al. [61] used the model-free isoconversional method [62] to
analyse the cure behaviour of a commercial PF resole up to about 200°C. They
found that the apparent Ea did not remain constant, but decreased with the extent of
the cure. Such decrease in Ea was attributed to the complications caused by
diffusion limitation mechanism. Similarly, He et al. [53] analysed the DSC data
obtained from the cure of PF resoles up to 250°C using isoconversional analysis
method. They found a decrease in Ea as the cure proceeded and concluded that the
cure of PF resoles changed from a kinetic to a diffusion regime because of gelation,
vitrification and cross-linking in the system.
2.5 Concluding Remarks
It has been established by the use of various chemical, chromatographic and
spectroscopic techniques, that when phenol reacts with formaldehyde in basic
medium the reactions occur through different stages:
(a) Addition reactions to form five monomer compounds: 2-MMP and 4-MMP are
formed which may further react with formaldehyde to form 2,4-DMP and 2,6-
DMP. The reactions may proceed further to form 2,4,6-TMP;
(b) Resole formation: some condensation of the methylol phenols to form
methylene and ether linkages. Products of this type, soluble and fusible and
containing alcohols, are the pre-polymer compounds (resoles), which are used
commercially;
(c) Cure reactions: if the process proceeds further at higher temperatures, as in
practical applications, more complex condensations and rearrangements of the pre-

30
polymer intermediates occur, leading to highly condensed infusible network
structures.
Despite the overall support in the published literature for the above reaction
sequence in a general sense, the mechanisms governing the cross-linking process
encompassing the entire PF reaction cycle remain relatively unclear. This is largely
due to the heterogeneous nature of the phenomena involved and by the lack of
simple or distinctive analytical tools. Extensive efforts have gone into elucidating
the reaction pathways during the PF reaction cycle by simplifying the system and
starting with the first addition products. However, these efforts generally concerned
themselves with studies of the mechanisms and kinetics of the reactions occurring
during individual stages of the PF reaction cycle. With the advent of thermal
analytical techniques, various efforts have been made to study the thermochemical
characteristics of the entire PF reaction cycle that involve the addition of
formaldehyde to phenol, the condensation reactions of the monomers to form the
resole and the subsequent cure reactions. However, the complexity of the system,
which involves many consecutive or integrated processes, has precluded a
complete understanding of the reactions that occur during the entire process. With
the exception of a few studies, there is very limited published information on the
use of monomer compounds to elucidate the kinetics and mechanisms of the
reactions during the entire PF cycle.
The present study aims to fill this gap and to investigate the thermochemical
characteristics of the individual monomers as a function of catalyst concentration
using DSC in the temperature range up to 250°C. Within a single experiment, this
temperature range incorporates the initial lower temperature cross-linking reactions
of the monomers to form the pre-polymer compounds, through to the cure reactions
that lead to fully solid network structures occurring at higher temperatures. This
regime captures the kinetics throughout the entire cure region and was identified to
be the least well understood, and which might provide complementary information
for further understanding the cure mechanism of PF resoles. The study focuses on
the use of isoconversional analysis of the DSC data to evaluate the dependence of
activation energy on the degree of reaction conversion.

31
Another issue is that despite the extensive past efforts of using DSC to study the
cure properties of PF resoles, they were often limited to the investigation of the
nature of the DSC curves. Where kinetic analysis was carried out to obtain relevant
kinetic information, it was often mistakenly assumed that the activation energy of
the thermal reactions was constant and did not change with the extent of the cure. A
few studies have addressed this issue and demonstrated the complex dependence of
the reaction kinetics on the degree of the cure, mainly due to gelation, vitrification
and cross-linking in the system. Despite these encouraging efforts, the use of DSC
to obtain insights into mechanisms of the cure of PF resoles is still limited.
Therefore, in addition to the work on the monomers, the present study also aims to
use DSC isoconversional analysis to investigate the effects of catalyst
concentration on the cure properties of PF resoles as a whole.
2.6 References
1. L.H. Bakeland, U.S. Pat. 942699, 1907.
2. R. Houwink and G. Salomon (eds.), Adhesion and Adhesives Vol. 1,
Elsevier Publishing Company, 1965.
3. A. Knop and W. Scheib, Chemistry and Application of Phenolic Resins,
Springer-Verlag, New York, 1979.
4. A.A. Marra, Technology of Wood Bonding: Principles in Practice, Van
Nostrand Reinhold, 1992.
5. R.W. Martin, The Chemistry of Phenolic Resins, J. Wiley, New York, 1956.
6. A. Knop and L.A. Pilato, Phenolic Resins – Chemistry, Applications and
Performance, Springer-Verlag, Berlin, 1985.
7. J.M. Garro-Galvez, and B. Riedl, “Pyrogallol-Formaldehyde Thermosetting
Adhesives”, J. Appl. Polym. Sci. 65(2), 399-408 (1997).
8. M.F. Grenier-Loustalot, S. Larroque and P. Grenier, “Phenolic Resins: 1.
Mechanisms and Kinetics of Phenol and of the First Polycondensates
Towards Formaldehyde in Solution”, Polymer 35(14), 3045-3054 (1994).

32
9. I. Poljangek, B. Likozar, M. Krajnc, “ Kinetics of Hydroxymethyl Phenols
Formation by In-Line FTIR Spectroscopy”, J. Polym. Sci. 106(2), 878-888
(2007).
10. G.B. He, N. Yan, “Influence of the Synthesis Conditions on the Curing
Behavior of Phenol–Urea–Formaldehyde Resol Resins”, J. Polym. Sci.
95(6), 1368-1375 (2005).
11. J.H. Freeman and C.W. Lewis, “Alkaline-catalyzed Reaction of
Formaldehyde and the Methylols of Phenol; A Kinetic Study”, J. Am.
Chem. Soc. 76, 2080-2087 (1954).
12. L.B. Manfredi, C. C. Riccardi, O. de la Osa, A. Vazquez, “Modelling of
Resol Resin Polymerization with Various Formaldehyde/ Phenol Molar
Ratios”, Polymer International 50 (7), 796-802 (2001).
13. J. Monni, L. Alvila, J. Rainio, T.T. Pakkanen, “Novel Two-Stage Phenol-
Formaldehyde Resol Resin Synthesis”, J. Polym. Sci. 103 (1), 371-379
(2007).
14. N. Kamo, M. Higuchi, T. Yoshimatsu, T. Yoshimatsu, Y. Ohara, M. Morita,
“Condensation Reactions of Phenolic Resins III: Self-Condensations of 2,4-
Dihydroxymethylphenol and 2,4,6-Trihydroxymethylphenol (1)”, Journal
of Wood Science 48(6), 491-496 (2002).
15. C.C. Riccardi, G.A. Aierbe, J.M. Echeverria, I. Mondragon, “Modelling of
Phenolic Resin Polymerisation”, Polymer 43(5) 1631-1639 (2002).
16. K. Lenghaus, G.G. Qiao, D.H. Solomon, “The Effect of Formaldehyde to
Phenol Ratio on the Curing and Characterisation Behaviour of Resole
Resins”, Polymer 42(8), 3355-3362 (2001).
17. M.F. Grenier-Loustalot, S. Larroque and P. Grenier, “Phenolic Resins: 4.
Self-Condensation of Methylolphenols in Formaldehyde-Free Media”,
Polymer 37(6), 955-964 (1996).
18. M. Higuchi, T. Urakawa and M. Morita, “Condensation Reactions of
Phenolic Resins. 1. Kinetics and Mechanisms of the Base-Catalyzed Self-
Condensation of 2-Hydroxymethylphenol”, Polymer 42, 4563 (2001).

33
19. R.T. Jones, “The Condensation of Trimethylol Phenol”, J. Polym. Sci. 21,
1801 (1983).
20. L.M. Yeddanapalli and D.J. Francis, “Kinetics and Mechanism of the Alkali
Catalysed Condensation of o- and p-Methylol Phenols by Themselves and
with Phenol”, Die Makromolekulare Chemie 55, 74-86 (1962).
21. J. Reese, Kunststoffe 45(4), 137-145 (1955).
22. D.J. Francis and L.M. Yeddanapalli, “Kinetics and Mechanism of the Alkali
Catalysed Condensations of Di- and Tri-Methylol Phenols by Themselves
and with Phenol”, Die Makromolekulare Chemie 125, 119-125 (1969).
23. T. Halopainen, L. Alvila, P. Savolainen, T.T. Pakkanen, “Effect of F/P and
OH/P Molar Ratios and Condensation Viscosity on the Structure of Phenol-
Formaldehyde Resol Resins for Overlays - A statistical study”, J. Polym.
Sci. 91(5), 2942-2948 (2004).
24. H.S. Lilley, J. Soc. Chem. Ind. 67, 196-199 (1948).
25. M.M. Sprung and M.T. Gladstone, “A Study of Some Condensations of o-
Methylolphenol”, J. Am. Chem. Soc. 71, 2907 (1949).
26. Z. Katovic, “Curing of Resol-Type Phenol-Formaldehyde Resins”, J. Appl.
Polym. Sci. 11, 85-93 (1967).
27. A. Gardziella, L.A. Pilato, A. Knop, “Phenolic Resins : Chemistry,
Applications, Standardization, Safety, and Ecology”, 2nd ed., Springer-
Verlag, New York, 2000.
28. M.F. Grenier-Loustalot, G. Raffin, B. Salino and O. Païssé, “Phenolic resins
Part 6. Identifications of Volatile Organic Molecules During Thermal
Treatment of Neat Resols and Resol Filled with Glass Fibers”, Polymer
41(19), 7123-7132 (2000).
29. R. Banerjee, K. Patil, K.C. Khilar, Canadian Journal of Chemical
Engineering 84, 328 (2006).
30. N. Kamo, M. Higuchi, T. Yoshimatsu, M. Morita, “Condensation reactions
of phenolic resins IV: self-condensation of 2,4-dihydroxymethylphenol and

34
2,4,6 trihydroxymethylphenol (2)”, Journal of Wood Science 50(1), 68-76
(2004).
31. N. Kamo, J. Tanaka, M. Higuchi, T. Kondo, M. Morita, “Condensation
reactions of phenolic resins VII: Catalytic Effect of Sodium Bicarbonate for
the Condensation of Hydroxymethylols”, )”, Journal of Wood Science
52(4), 68-76 (2006).
32. P.J. Flory, Principles of Polymer Chemistry, Cornell University Press, New
York, 1953.
33. S. Gan, J.K. Gillham and R.B. Prime, “A Methodology for Characterizing
Reactive Coatings: Time-Temperature-Transformation (TTT) Analysis of
the Competition Between Cure, Evaporation, and Thermal Degradation for
an Epoxy-Phenolic System,” J. Appl. Polym. Sci. 37, 803 (1989).
34. K. Hultzsch, Angew. Chem. 61, 93-96 (1949).
35. K. Hultzsch, Chemie der Phenolharze, Springer-Verlag, Berlin, 1950.
36. D.D. Werstler, “Quantitative 13C NMR Characterization of Aqueous
Formaldehyde Resins: 1. Phenol-Formaldehyde Resins Polymer 27, 750-
756 (1986).
37. S. So and A. Rudin, “Analysis of the Formation and Curing Reactions of
Resole Phenolics”, J. Appl. Polym. Sci. 41, 205-232 (1990).
38. E. Imoto and T. Kimura, J. Chem. Soc. Japan 53, 9-11 (1950).
39. A. Pizzi, in “Handbook of Adhesive Technology”, A. Pizzi, K.L. Mittal
(Ed.), Marcel Dekker, New York, 2003.
40. P.W. King, R.H. Mitchell, and A.R. Westwood, “Structural Analysis of
Phenolic Resole Resins”, J. Appl. Polym. Sci. 18, 1117-1130 (1974).
41. G. Vazquez, J.Gonzalez-Alvarez, F. Lopez-Suevos, S. Freire, G.
Antorrena, “Curing Kinetics of Tannin-Phenol-Formaldehyde Adhesives as
Determined by DSC”, Journal of Thermal Analysis and Calorimetry 70(1),
143-149 (2005).

35
42. L. Gollob, “The Correlation Between Preparation and Properties in Phenolic
Resins”, in Wood Adhesives – Chemistry and Technology Vol. 2, A. Pizzi
(ed.), Dekker, New York, 1989, p. 121.
43. J. Monni, L. Alvila, T.T. Pakkanen, “Structural and Physical Changes in
Phenol-Formaldehyde Resol Resin, as a Function of the Degree of
Condensation of the Resol Solution”, Industrial & Engineering Chemistry
Research 46(21), 6916-6924 (2007).
44. J. Bouajila, G. Raffin, H. Waton, C. Sanglar, J.O. Paisse, M-F. Grenier-
Loustalot, “Phenolic Resins - Characterizations and Kinetic Studies of
Different Resols Prepared with Different Catalysts and
Formaldehyde/Phenol Ratios”, Polymers & Polymer Composites 10, 341
(2002).
45. T. Holopainen, L. Alvila, J. Rainio and T.T. Pakkanen, “Phenol-
Formaldehyde Resol Resins Studied by 13C-NMR Spectroscopy, Gel
Permeation Chromatography, and Differential Calorimetry”, J. Appl.
Polym. Sci. 66, 1183-1193 (1997).
46. B.D. Park, B. Riedl, Y.S. Kim and W.T. So, “Effect of Synthesis
Parameters on Thermal Behaviour of Phenol-Formaldehyde Resol Resin”,
J. Appl. Polym. Sci 83, 1415-1424 (2002).
47. M.F. Grenier-Loustalot, S. Larroque and P. Grenier, “Phenolic Resins: 5.
Solid-State Physicochemical Study of Resoles with Variable F / P Ratios”,
Polymer 37(4), 639-650 (1996).
48. G. Astarloa-Aierbe, J. M. Echeverria, A. Vazquez, I. Mondragon,
“Influence of the Amount of Catalyst and Initial pH on the Phenolic Resol
Resin Formation”, Polymer 41, 3311 (2000).
49. A. Pizzi and A. Stephanou, “Phenol - Formaldehyde Wood Adhesives
Under Very Alkaline Conditions - Part I: Behaviour and Proposed
Mechanism”, Holzforschung 48, 35-40 (1994).
50. R.A. Haupt and S. Waago, “The Ionic Nature of the Phenol-Formaldehyde
Condensation Reaction and Its Effect on Polymer Propreties”, in A.W.

36
Christiansen, and A.H. Conner (eds.), Proc. of Wood Adhesives 1995, pp.
220–226 June 29–30, 1995, Portland, Oregon. Forest Prod. Soc., Madison,
Wisconsin.
51. A.W. Christiansen and L. Gollob, “Differential Scanning Calorimetry of
Phenol-Formaldehyde Resols”, J. Appl. Polym. Sci. 30, 2279-2289 (1985).
52. G. He, N. Yan, “Effect of Wood on the Curing Behavior of Commercial
Phenolic Resin Systems”, J. Polym. Sci. 95(2), 185-192 (2004).
53. G. He, B. Riedl and A. Ait-Kadi, “Model-Free Kinetics: Curing Behavior of
Phenol Formaldehyde Resins by Differential Scanning Calorimetry”, J.
Appl. Polym. Sci. 87, 433-440 (2003).
54. Y-K Lee, D-J Kim, H-J Kim, T-S Hwang, M. Rafailovich and J. Sokolov,
“Activation Energy and Curing Behaviour of Resol- and Novolac-Type
Phenolic Resins by Differential Scanning Calorimetry and
Thermogravimetric Analysis”, J. Appl. Polym. Sci. 89, 2589-2596 (2003).
55. Byung-Dae Park, Xiang-Ming Wang, “Thermokinetic Behaviour of
Powdered Phenol-Formaldehyde (PPF) Resin”, Thermochimica Acta 433
(1-2), 88-92 (2005).
56. M.V. Alonso, M. Oliet, J.M. Pérez, F. Rodríguez, J. Echeverría,
“Determination of Curing Kinetic Parameters of Lignin–Phenol–
Formaldehyde Resol Resins by Several Dynamic Differential Scanning
Calorimetry Methods”, Thermochimica Acta 419(1-2), 161-167 (2004).
57. M.V. Alonso, M. Oliet, J. Garcia F. Rodríguez, J. Echeverría,
“Transformation of Dynamic DSC Results into Isothermal Data for the
Curing Kinetics Study of the Resol Resin”, Journal of Thermal Analysis
and Calorimetry 86(3), 797-802 (2006).
58. H.E. Kissinger, “Reaction Kinetics in Differential Thermal Analysis”,
Analytical Chemistry 29, 1702 (1957).
59. H.J. Borchardt and F. Daniels, “The Application of Differential Thermal
Analysis to the Study of Reaction Kinetics”, J. Am. Chem. Soc. 79, 41
(1957).

37
60. E. Kiran and R. Iyer, “Cure Behaviour of Paper-Phenolic Composite
System: Kinetic Modeling”, J. Appl. Polym. Sci. 51, 353-364 (1994).
61. G. Vazquez, J. Gonzalez-Alvarez, F. Lopez-Suevos, S. Freire and G.
Antorrena, “Curing Kinetics of Tannin-Phenol-Formaldehyde Adhesives as
Determined by DSC”, J. Therm. Anal. Cal. 70, 19-28 (2002).
62. S. Vyazovskin and C. Wight, “Model-free and Model-fitting Approaches to
Kinetic Analysis of Isothermal and Nonisothermal Data”, Thermochimica
Acta 340-341, 53-68 (1999).
63. J. E. Shafizadeh, S. Guionnet, M. S. Tillman, J. C. Seferis “Synthesis and
Characterization of Phenolic Resole Resins for Composite Applications”, J.
Appl. Polym. Sci. 73(4), 505-514 (1999).
64. C. N. Zarate, M. I. Aranguren, M. M. Reboredo, “Thermal Degradation of a
Phenolic Resin, Vegetable Fibers, and Derived Composites”, J. Appl.
Polym. Sci. 107(5), 2977-2985 (2008).

38
Chapter 3
Methodology and Experimental Details
3.1 Methodology
As reviewed in Chapter 2, whilst there is agreement among researchers on the
general features of the PF reaction cycle, the reaction pathways governing the
entire cycle remain relatively unclear, primarily because of the complexity caused
by the large number of reactions occurring simultaneously. The use of methylol
phenol monomers to simplify the system has been advocated as a legitimate
approach to study relevant mechanistic aspects and can be very useful in providing
empirical parameters for modelling and controlling the PF reaction cycle. However,
most studies utilising this approach have been commonly concerned with the
mechanisms and kinetics of the reactions occurring during individual stages, rather
than the entire PF reaction cycle. The above considerations provided the impetus
for adopting a particular methodology, the essential features of which are described
in the following sections.
3.1.1 System parameters
3.1.1.1 Methyl phenol monomers
Given the complexity of the system, the strategy adopted in the present study
involves simplifying this system by starting with the first formed addition products
in the phenol-formaldehyde reaction and evaluating the reactions of each
independently. The five initial monomers are shown in Figure 3.1.
3.1.1.2 Reaction conditions
It is commonly accepted that the reaction pathway is dependent on the initial
formulation parameters, namely, the ratio of reactants (P / F), type and amount of
catalyst and the temperature. As this study is concerned with the condensation and

39
cure reactions, the P / F ratio is not an issue, but instead the effects of the catalyst
and temperature are the focus. The pressure of the reaction chamber is also an
important consideration.
OH
CH2OH
OH
CH2OH
OH
CH2OHHOCH2
OH
CH2OH
CH2OH
OH
CH2OH
CH2OHHOCH2
2-MMP 4-MMP 2,6-DMP2,4-DMP 2,4,6-TMP
Figure 3.1: The five initial intermediate monomers.
Catalyst: NaOH is selected as the catalyst, because it is most commonly used in the
wood adhesives industry. As discussed in chapter 2, the presence of NaOH has a
significant influence kinetically and mechanistically, both during the initial
addition reactions to form the five monomer compounds and during the subsequent
stages to form the resole and consequently the fully cured resin. Whilst there have
been studies that examined the effects of NaOH by monitoring the kinetics of the
reactions of the monomer compounds in aqueous solutions towards itself, towards
phenol and towards formaldehyde, these studies were commonly carried out under
constant conditions of pH and temperature with a varying F / P ratio. The present
study aims to investigate the condensation and curing reactions of individual
monomers in different NaOH regimes by systematically changing the molar ratio
of NaOH / monomer between zero and one. Molar ratio, instead of pH, is chosen as
the variable, since the experiments are carried out in a melt rather than in aqueous
solution. This range of NaOH is consistent with the common practice in the
production of commercial PF resole used in the wood adhesives industry.
Temperature: The condensation and curing reactions in the PF resole system are
effected by the application of heat within the temperature range of about (60 –
80)°C (333 – 353K) to 250°C (523K). At about 80°C (353K) to 100°C (373K), the
condensation reactions of the monomers occur to form the pre-polymer
compounds. The resin reaches the fully cured state with further heating to 250°C
(523K). In the manufacture of wood composites, the curing temperature varies

40
between 120°C (393K) to 250°C (523K), depending on the type of wood product.
In the present study, the monomers were heated up to 250°C (523K).
Pressure: In commercial operations, resoles are cured under heat and pressure.
Another consideration is that condensation reactions occurring under ambient
atmospheric conditions may lead to emission of volatile reaction products, usually
water and formaldehyde, within the temperature range studied. The emission of the
volatiles may obscure the results arising from the cross-linking reactions.
Therefore, experiments were conducted under a sealed cell operation to simulate
the commercial curing conditions and had the additional advantage of being able to
retain reactive volatiles. This was achieved by using hermetically sealed stainless
steel capsules that withstand the internal pressures (maximum up to 24
atmospheres).
3.1.1.3 Additional experimental parameters
Experiments were carried out in a melt, rather than in aqueous solution to further
simplify the system by excluding water and focusing purely on the effects of NaOH
on the cross-linking reactions. For optimum instrument resolution, the contact
surface between sample holder and sample should be maximized during heating the
sample. This was achieved by the use of compact fine granules in good contact
with the capsule bottom.
3.1.2 Thermal analysis by DSC
3.1.2.1 General
The most common and conventional analytical techniques employed for the
investigation of curing reactions include chemical analysis, quantitative paper
chromatography (PC), high-performance liquid chromatography (HPLC), gel
permeation chromatography (GPC), ultra violet (UV) spectroscopy, infra-red (IR)
spectroscopy and nuclear magnetic resonance (NMR). These methods are based on
monitoring the changes in concentration of reactive groups consumed or produced
in the course of reaction, and are powerful tools to characterize the chemical
composition of resoles. However, as the cross-linking advances particularly past

41
the gel point, the resin becomes completely insoluble in solvent, and as a
consequence, the whole PF reaction cycle is difficult to study by chemical and
spectroscopic means.
Although techniques such as the solid-state 13C-NMR spectroscopy with cross-
polarization and magic angle spinning (CP/MAS) can be used to study the solid-
state polymers, only a few methods can be employed to follow the whole PF
reaction cycle from beginning to end. In recent years, intensive use of thermal
techniques has been found to offer valuable insights into the intricate processes of
the formation, the curing characteristics and the thermal degradation of
thermosetting resins. Thermal analysis covers a group of techniques such as
thermomechanical analysis (TMA), thermogravimetry (TG), differential thermal
analysis (DTA), dinamomechanical analysis (DMA) and DSC. Of these, the
method mostly used to study the kinetics of cure reactions is the thermal analysis
by DSC. The following sections present a brief overview of the principle of the
DSC technique and key aspects of DSC data analysis. Detailed information
regarding these issues can be found in a number of references [1-3].
3.1.2.2 Principle of DSC
Whenever a material undergoes a change in physical state, such as melting or
transition from one crystalline form to another, or whenever it reacts chemically,
heat is either absorbed or liberated. Many such processes can be initiated simply by
raising the temperature of the material. DSC measures this heat flow into a material
(endothermic) or out of a material (exothermic). A commonality of all
thermosetting systems is the evolution of energy accompanying the cure, expressed
as heat per mol of reacting groups (kJ mol-1).
DSC is designed to determine the enthalpies of these reactions by measuring the
differential heat flow required to maintain a sample of the material and an inert
reference at the same temperature. There are two types of DSC instruments
currently used: “heat flux” and “power compensated” instruments. Although they
are fundamentally different in design, the data produced are comparable. For the

42
remainder of this work, the technique referred to as DSC is specifically that of the
power compensated method.
The power-compensated DSC consists of two separate microfurnaces for the
sample and reference and each contain one temperature sensor and a heater (Figure
3.2). Both furnaces are positioned in an aluminium block of constant temperature.
The same heating power is supplied to both furnaces according to a preset
temperature-time program. In the case of ideal thermal symmetry, the temperatures
of both furnaces are the same. When a sample reaction occurs (exothermic or
endothermic), the symmetry is disturbed due to a temperature difference between
the furnaces. This temperature difference of the measuring system can be
electronically compensated either by increasing or decreasing an additional heating
power. The compensating heating power is proportional to the measured
temperature difference between the furnaces. Thus the temperature of the sample
holder is always kept the same as that of the reference holder by continuous and
automatic adjustment of the heater power. A signal proportional to the difference
between the heat input to the sample and that to the reference is recorded as
reaction heat flow rate dH/dt as a result of calibration determined by measuring the
enthalpy of fusion of pure indium metal (99.9 % purity). The resulting enthalpy
change is then plotted against the temperature ramp as shown in Figure 3.3.
Figure 3.2: Power compensated DSC.
A peak in the measured curve occurs when the steady state is disturbed by
thermally activated heat production or consumption in the sample. A peak begins at
Ti (first deviation from the baseline), rises / falls to the peak maximum / minimum
Pt sensors
S R
Individualheaters
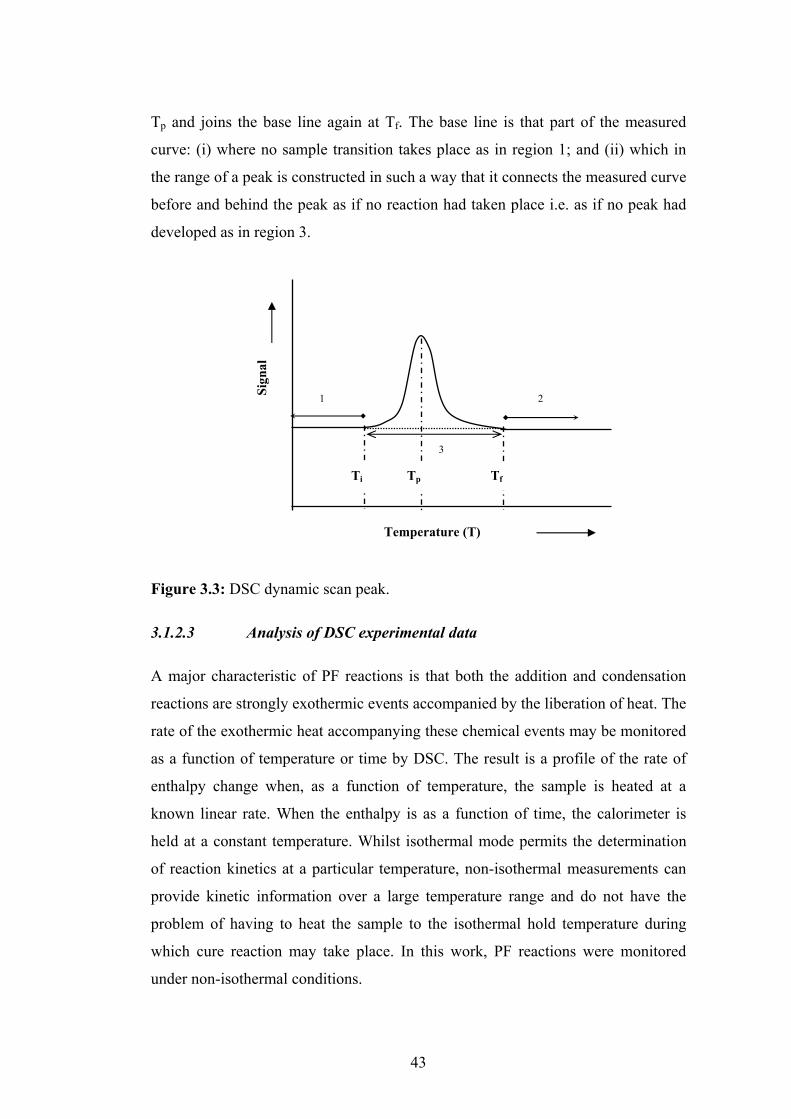
43
Tp and joins the base line again at Tf. The base line is that part of the measured
curve: (i) where no sample transition takes place as in region 1; and (ii) which in
the range of a peak is constructed in such a way that it connects the measured curve
before and behind the peak as if no reaction had taken place i.e. as if no peak had
developed as in region 3.
Figure 3.3: DSC dynamic scan peak.
3.1.2.3 Analysis of DSC experimental data
A major characteristic of PF reactions is that both the addition and condensation
reactions are strongly exothermic events accompanied by the liberation of heat. The
rate of the exothermic heat accompanying these chemical events may be monitored
as a function of temperature or time by DSC. The result is a profile of the rate of
enthalpy change when, as a function of temperature, the sample is heated at a
known linear rate. When the enthalpy is as a function of time, the calorimeter is
held at a constant temperature. Whilst isothermal mode permits the determination
of reaction kinetics at a particular temperature, non-isothermal measurements can
provide kinetic information over a large temperature range and do not have the
problem of having to heat the sample to the isothermal hold temperature during
which cure reaction may take place. In this work, PF reactions were monitored
under non-isothermal conditions.
Sign
al
1 2
3
Temperature (T)
Ti Tp Tf

44
Various methods may be used in the analysis of the DSC curves to evaluate the
reaction progress. All kinetic studies start with the basic rate equation:
dα/dt = k f(α) 3.1
where k is the rate constant, α is the degree of conversion and f(α) is the function of
the degree of conversion. In general, k is dependent on temperature through an
Arrhenious-type equation. Thus, the rate equation can be written as:
dα/dt = f(α)A exp(-Eα/RT) 3.2
where A is the pre-exponential factor (s-1) and relates to the amount of collisions
that need to occur in a unit time to carry out the reaction, Eα (Jmol-1) is the
activation energy at a given degree of conversion, R is the universal gas constant
(8.314 J mol-1.K), and T is the absolute temperature (K).
The DSC exotherm is used to measure the two basic parameters of the reaction,
namely, the fraction reacted α and the reaction rate dα/dt. Figure 3.4 depicts a
sample dynamic DSC thermogram. At a sufficiently high enough temperature, the
cross-linking reaction begins to proceed and the onset of curing is observed as an
exothermic event. The onset temperature (Ti) is the temperature at which the
reaction begins to progress. The peak maximum (Tp) represents the maximum rate
of cure at the given scanning rate. The completion of the cure occurs when the DSC
response returns to linear behavior at the upper temperature range (Tf).
The basic assumptions in applying the DSC to curing reaction kinetics are:
(i) The liberation of heat accompanying the curing reaction can be measured
directly with the DSC and the rate of enthalpy change (dH/dt) with respect
to temperature is recorded directly.
(ii) Enthalpy change, ΔH, up to any temperature T is proportional to the number
of moles of reactants consumed.

45
(iii) The total area under the exotherm corresponds to the total enthalpy of
curing reaction, ΔHTotal, and the partial area up to a certain temperature T,
corresponds to the enthalpy, ΔH, up to that temperature.
(iv) The rate of enthalpy change, (dH/dt), relative to the instrumental baseline is
directly proportional to the reaction rate.
Figure 3.4: A dynamic DSC thermogram in the scanning mode depicting an exothermic reaction.
From the above assumptions, the reaction rate dα/dt at any point along the reaction
exotherm temperature axis is obtained by dividing the peak height dH/dt at
temperature T by the total peak area ΔHTotal (equation 3.5), while the fraction
reacted α is obtained by measuring the ratio of the partial area ΔH at temperature T
to the total peak area ΔHTotal (equation 3.3).
⎟⎟⎠
⎞⎜⎜⎝
⎛Δ
Δ=
TotalHH
α 3.3
and
Total
Total
HHH
ΔΔ−Δ
=− )1( α 3.4
ΔHTotal - ΔH ΔH
Ti Tf T
exo
endo
dtdH
Tp
α = ΔH ΔHTotal dα/dt = dH/dt ΔHTotal
Hea
t flo
w
dtdH
T

46
where α is the conversion or extent of reaction, ΔH is the enthalpy change up to a
certain temperature and ΔHTotal is the total enthalpy change with the basic
assumption that complete conversion of the reactants is achieved, and:
⎥⎥⎥⎥
⎦
⎤
⎢⎢⎢⎢
⎣
⎡⎟⎠⎞
⎜⎝⎛
=
⎥⎥⎥⎥
⎦
⎤
⎢⎢⎢⎢
⎣
⎡
Δ
⎟⎠⎞
⎜⎝⎛
=⎟⎠⎞
⎜⎝⎛=
Adt
dH
Hdt
dH
dtdr
Total
α 3.5
where r (s-1), is the rate of reaction, dH / dt (mJ g-1 s-1) is the ordinate of a DSC
trace, and A (mJ), is the total area under the curve and corresponds to the total
enthalpy of reaction ΔHTotal (mJ g-1).
The values for ΔHTotal, ΔH and α at selected temperatures along the temperature
axis were computed by the Perkin-Elmer Pyris computer software used in
conjunction with the DSC instrument. The ordinates of a DSC trace, dH/dt, for the
corresponding α, is the height of the curve below the baseline at temperature T and
was manually calculated by taking the difference between the value of the heat
flow at the baseline and the value of the heat flow corresponding to the particular
position of the curve (Figure 3.4).
Traditionally, kinetic analysis of DSC curves involves the fitting of data to
hypothetical reaction model of f(α). Some examples of reaction models commonly
used are listed in Table 3.1. Following this model-fitting, the Arrhenius parameters
are determined by the form of f(α) assumed. Vyazovskin and Wight [4] pointed out
the major drawbacks of the model-fitting approach in non-isothermal experiments,
which are relevant in this study. In particular, since both T and α vary
simultaneously in non-isothermal experiments, the model-fitting approach
generally fails to achieve a clean separation between the temperature dependence
k(T) and the reaction model f(α). As a result, the form of f(α) may be chosen to fit
the data, but often at the cost of drastic variations in the Arrhenius parameters,
which compensate for the difference between the assumed and the true but
unknown f(α). Also, the model-fitting method usually aims at extracting a single
value for the activation energy for an overall process. For reactions with activation
energy varying with both temperature and the extent of conversion, such a single

47
value does not reflect changes in the reaction mechanism and kinetics during the
course of the reactions.
Table 3.1: Reaction models used to describe thermal decomposition in solids [4].
Reaction models f(α)
Power law 4α3/4
Power law 3α2/3
Power law 2α1/2
Power law 2/3α-1/2
One-dimensional diffusion 1/2α-1
Mampel (first-order) 1- α
Avrami-Erofeev 4(1- α)[-ln(1- α)]3/4
Avrami-Erofeev 3(1- α)[-ln(1- α)]2/3
Avrami-Erofeev 2(1- α)[-ln(1- α)]1/2
Three-dimensional diffusion 2(1- α)2/3[1 - (1- α)1/3]-1
Contracting sphere 3(1- α)2/3
Contracting cylinder 2(1- α)1/2
Second-order (1- α)2
These drawbacks can be avoided by the use of the model-free method, described in
a series of studies by Vyazovskin et al. [4-7], which is based on the realization that
although f(α) and Eα depend on the degree of conversion α, they are always the
same at a particular degree of conversion, independent of the heating rate used. The
use of this method allows the activation energy to be determined as a function of
the extent of conversion and/or temperature without making any assumptions about
the reaction model, thus eliminating the uncertainties involved in the model-fitting
approach.
The present study involves monitoring the chemical and physical changes of the
system from the initial stage consisting of the monomer compounds to the
completely cured state as a function of temperature. The evolution of the system

48
would thus involve a range of different chemical reactions with different kinetics.
To avoid the aforementioned drawbacks of the model-fitting approach, the model-
free method is chosen in the present study for the analysis of DSC data. Assuming
that f(α) and Eα are constant at a particular degree of conversion, we can obtain a
differential equation from equation 3.2:
d ln(dα/dt)α / dT-1 = -Eα / R 3.6
Compared to the ASTM E698 method [8], which follows only one point of
conversion and applies the derived activation energy at the DSC transition
maximum to the overall reaction process, the model-free method follows every
point of conversion, obtaining the activation energy at each point. Thus, it can
reveal the dependence of Eα on α and the complexity of the cure process. In
particular, Eα and the pre-exponential factor A can be evaluated from the following
expression [9]:
ln Φ / Ti 2 = - Eα
/ RTi + ln RA / Eα 3.7
where Φ is the heating rate and Ti is the temperature to reach a given degree of
conversion. A graph of ln Φ / Ti 2 versus 1/Ti should yield a straight line. The value
for Eα and the pre-exponential factor A can be obtained from the slope and
intercept, respectively.
3.1.2.4 “Effective” activation energy Eα obtained from the model-free
method
Activation energy Ea is often used to denote the minimum energy required for a
specific chemical reaction to occur. The rate equation 3.2 gives the quantitative
basis of the relationship between Ea and the rate at which a reaction proceeds. It
can be seen that either increasing temperature or decreasing the Ea (for example
through the use of catalysts) will result in an increase in the rate of reaction.
Because the relationship of reaction rate to Ea and temperature is exponential, a
small change in temperature or Ea generally causes a large change in reaction rate.
Nevertheless, the extent of change in reaction rate as the temperature changes is
less significant for reaction with a low Ea compared to reaction with a high Ea.

49
As mentioned above, a key difference between the model-fitting and the model-free
methods is that the former aims at extracting a single averaged value of Ea for the
overall process, whereas the latter reveals the dependence of Eα on the degree of
conversion, α. Thus, for a system where different reactions occur over different
temperature regimes, as in the present study, the model-fitting method is not
suitable because it ignores the changing nature of the reactions and variation of Ea
as the cure proceeds. Instead, the model-free method, adopted in this study, avoids
the assumption of homogeneous reaction kinetics and allows the monitoring of
different chemical reactions with different kinetics from the initial to the final cure
stages.
The model-free method has been applied successfully to a range of processes
including those involving competing, independent, consecutive and reversible
reactions [see, for example, 4-7, 10-15]. Although the shape of the dependence of
Eα on α obtained from this approach does not necessarily unequivocally identify the
reaction mechanisms, it in all instances reveals critical kinetic information and
sheds light on possible sequences of reactions that may occur in a particular
process.
An issue that may occur in the calculation of Ea using DSC is when the cure is
incomplete. This is a common problem in isothermal experiments where the DSC
scans are carried out at a fixed temperature below the glass transition temperature
Tg [16]. It has been shown that for incomplete cure, the model-free method yields
correct values of Ea provided the relative extents of cure are used instead of the
absolute values [17, 18]. The relative extent of cure, α, is determined using the total
enthalpy change for the incomplete cure reaction according to:
α = ΔHα / ΔHTotal 3.8
where ΔH is the enthalpy change up to fractional conversion α and ΔHTotal is the
total enthalpy change for the incomplete cure reaction.

50
In contrast, the absolute extent of cure, α’, is determined using the total enthalpy
change for complete cure reaction according to:
α’ = ΔHα / ΔHTotal, complete cure 3.9
where ΔHα is the enthalpy change up to fractional conversion, α, and ΔHTotal, complete
cure is the total enthalpy change for the complete cure reaction with complete
conversion of the reactants.
In practice, the relative extent of cure, α, is determined directly from DSC data
obtained for the incomplete cure system, whereas the absolute extent of cure, α’, is
obtained by carrying out an additional experiment to bring the system to a fully
cured state and determine ΔHTotal, complete cure. The relative extent of cure, α, has been
used extensively in literature to obtain correct values of Ea [see, for example, 10-
15]
In the present study, all samples were subjected to dynamic DSC scans in the range
25°C to 250°C. Further increases of the temperature up to 350°C did not give rise
to any additional exothermic peak. Re-scanning the cured samples to establish the
baselines only gave a flat line and did not result in any peak either. Therefore, the
samples must have achieved their maximum possible cross-linking reactions at the
end of the initial dynamic scans. It is noted that, as will be described in later
chapters, one of the effects of NaOH is to reduce the number of cross-links in
methylol phenol monomers with corresponding decreases in ΔHTotal following the
cure of these samples. Given that maximum cross-linking reactions have been
achieved for these samples, the reduction in the number of cross-links represents
the changes in their chemical and physical nature caused by the presence of NaOH,
rather than “incomplete” cure reactions.
The extent of cure, α, for all samples in the present study was determined by
measuring the ΔHα and the ΔHTotal obtained from the dynamic DSC scans. As such,
even if the cure of samples containing NaOH is regarded as “incomplete”, the α
values determined in this way are effectively the relative values. This would yield
correct values of Ea and enable comparisons between different samples.
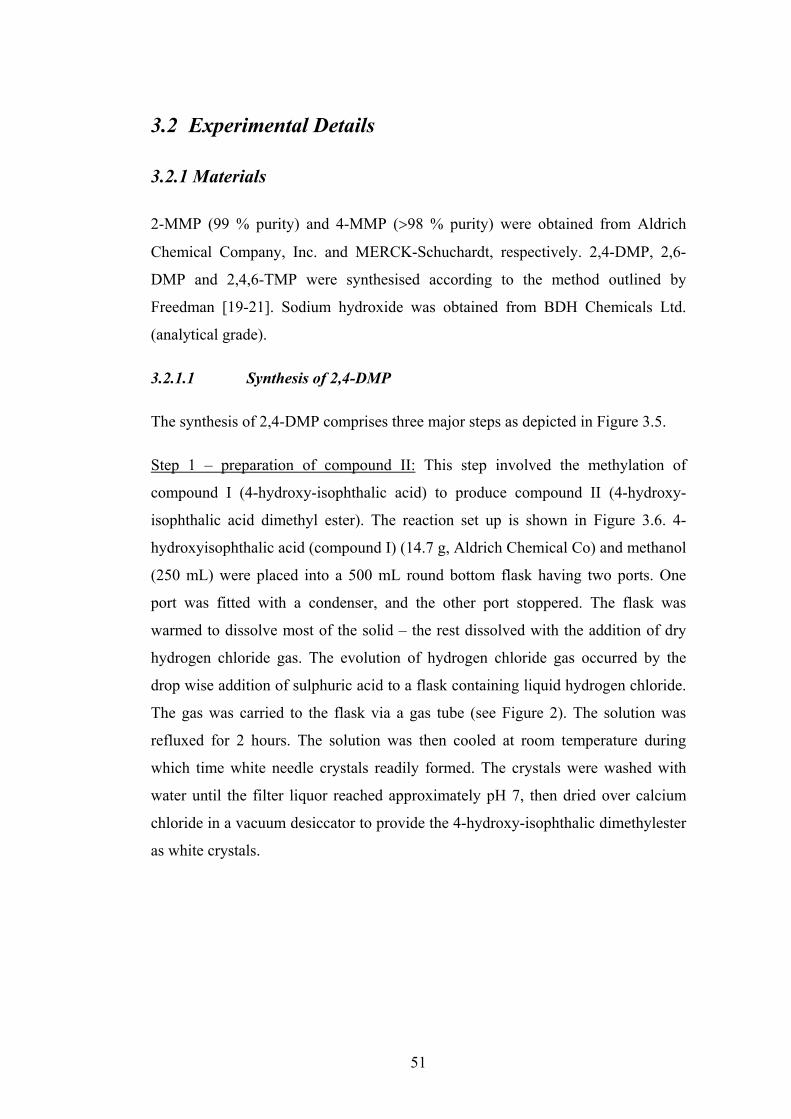
51
3.2 Experimental Details
3.2.1 Materials
2-MMP (99 % purity) and 4-MMP (>98 % purity) were obtained from Aldrich
Chemical Company, Inc. and MERCK-Schuchardt, respectively. 2,4-DMP, 2,6-
DMP and 2,4,6-TMP were synthesised according to the method outlined by
Freedman [19-21]. Sodium hydroxide was obtained from BDH Chemicals Ltd.
(analytical grade).
3.2.1.1 Synthesis of 2,4-DMP
The synthesis of 2,4-DMP comprises three major steps as depicted in Figure 3.5.
Step 1 – preparation of compound II: This step involved the methylation of
compound I (4-hydroxy-isophthalic acid) to produce compound II (4-hydroxy-
isophthalic acid dimethyl ester). The reaction set up is shown in Figure 3.6. 4-
hydroxyisophthalic acid (compound I) (14.7 g, Aldrich Chemical Co) and methanol
(250 mL) were placed into a 500 mL round bottom flask having two ports. One
port was fitted with a condenser, and the other port stoppered. The flask was
warmed to dissolve most of the solid – the rest dissolved with the addition of dry
hydrogen chloride gas. The evolution of hydrogen chloride gas occurred by the
drop wise addition of sulphuric acid to a flask containing liquid hydrogen chloride.
The gas was carried to the flask via a gas tube (see Figure 2). The solution was
refluxed for 2 hours. The solution was then cooled at room temperature during
which time white needle crystals readily formed. The crystals were washed with
water until the filter liquor reached approximately pH 7, then dried over calcium
chloride in a vacuum desiccator to provide the 4-hydroxy-isophthalic dimethylester
as white crystals.

52
OHO OHO
OH O
O
CH3
OO
CH3
O
O
CH3
O
O
CH3
OH
OH OH
I II III IV
(ii) (iii)(i)
Figure 3.5: Reaction steps for the synthesis of 2,4-DMP.
4-HiPA + MeOH
empty H2SO4
HCl
H2SO4
H2O
H2O
glass gas tubes
silicon hose
heating mantel
Figure 3.6: Schematic for the synthesis of compound II.
Step 2 - preparation of compound III from compound II: This involved the
acetylation of compound II to produce 4-acetoxy-isophthalic acid dimethylester
(compound III). To a stirred solution of compound II (14.78 g) and pyridine (35
mL, AR grade) was added excess acetic anhydride (35 mL) over an ice bath. The
solution was allowed to stand at room temperature for 16 or more hours. The
mixture was poured into 500 mL ice water and stirred for an hour. The solution
was then acidified with the gradual addition of dilute 5N hydrochloric acid
monitored using pH indicator paper to pH 3-4. The white crystalline product was
separated by filtration, washed with saturated sodium carbonate solution (100 mL)

53
to remove unacetylated material, then with water and finally dried in a vacuum
desiccator to provide the crystalline 4-acetoxy-isophthalic acid dimethyl ester.
Step 3 – preparation of 2,4-DMP: This involved the reduction of compound III to
produce the target compound 2,4-Dimethylol phenol (2,4-DMP). The reaction set
up is shown in Figure 3.7.
1
2
3
45 6
7
8
9
1 102
3
45 6
7
8
911
H2O
H2O
CaCl2 drying tube
LiAlH4 + THF
4-AiPAdiMe + THF
pressure equalizing dropping funnel
heating mantel
Figure 3.7: Schematic for the synthesis of 2,4-DMP.
Lithium aluminium hydride (5 g) was weighed into a two necked round bottom
flask in a sealed box flushed with nitrogen gas. One of the necks was stoppered,
and tetrahydrofuran (100 mL) was slowly and carefully added, then fitted with a
condenser attached with a calcium chloride drying tube and the flask flushed again
with nitrogen gas. The lithium aluminium hydride was dissolved in the
tetrahydrofuran by refluxing for 16 hours or longer with stirring.
4-acetoxy-isophthalic acid dimethyl ester dissolved in tetrahydrofuran (100 mL)
was poured into a pressure equalising funnel and fitted to the spare port on the
reaction flask. The solution was added dropwise to the dissolved lithium
aluminium hydride over a period of 45 minutes at about 60°C (slightly below
reflux). The dropping funnel was exchanged for a thermometer and the refluxing

54
maintained for a further 15 minutes. The temperature was then reduced to 38 -
40°C and refluxing continued for 3 hours.
To decompose excess lithium aluminium hydride, tetrahydrofuran (10 mL)
containing ethyl acetate (3 mL) was cautiously added to the reaction flask and the
mixture refluxed for a further 15 minutes at about 38°C. Tetrahydrofuran (25 mL)
containing water (2 mL) was cautiously added through the condenser to the cold
reaction flask and the mixture allowed to stand 1-2 hours or overnight. A slight
stiochiometric excess of sodium potassium tartrate (~34 % w/v) was cautiously and
slowly added over an ice bath to complex the aluminium hydroxide. The water
volume was kept small due to solubility of the 2,4-DMP. The solution was stirred
for approximately one hour. The pH was lowered to pH 6 by titrating the lithium
hydroxide by-product with a 60 % w/v tartaric acid solution. Tetrahydrofuran was
removed by rotary evaporation, followed by exhaustive mechanical extraction of
the remaining aqueous layer with ethyl acetate (4 x 150 mL). The ethyl acetate
fraction liquor was concentrated on the rotary evaporator and the residue stored at –
14°C. Aggregates of crystals formed after a few hours and were collected by
filtration.
3.2.1.2 Synthesis of 2,6-DMP
The synthesis of 2,6-DMP comprised four reaction steps as shown in Figure 3.8.
Step 1 – preparation of compound II (2-hydroxy-isophthalic acid): Compound I (2-
methoxy-isophthalic acid) was obtained from Aldrich Chemical Co. Excess
hydriodic acid (25 mL) was added to compound I (4.0 g) placed in a conical flask.
The solution, which was heated to boiling and stirred for fifteen minutes, produced
the 2-hydroxy-isophthalic acid (compound II). The solution was then cooled at
room temperature and filtered (filter glass porosity 3) while washing with a small
volume of water to remove the pale yellow of the hydriodic acid. The collected
crystals were recrystallized from boiling water, by dissolving and heating in
enough water to dissolve the crystals to a clear solution. The liquor was slowly
cooled to room temperature during which time white needles of crystals formed

55
readily. These were dried in a vacuum desiccator to provide the 2-hydroxy-
isophthalic acid (compound II) as white crystals.
OHO
OCH3
O
OH
OHO
OH
O
OH
OO
CH3
O
OH
OCH3
OH
OH
OH
OO
CH3
OCH3
O
O
O
CH3
I IVII III V
Figure 3.8: Reaction steps for the synthesis of 2,6-DMP.
Step 2 – preparation of compound III (2-hydroxy-isophthalic acid dimethyl ester):
Compound II (2.94 g) weighed into a round bottom flask and dissolved in methanol
(150 mL) was refluxed for two hours with a steady gas flow from the HCl gas
admitted just prior to reflux. Reducing the volume of solvent by vacuum
evaporation facilitated the formation of crystals. The crystals were directly
recrystallized by warming the flask and allowing the liquor to cool under
refrigeration overnight, during which time large white needles of crystals of 2-
hydroxy-isophthalic acid dimethyl ester (compound III) formed readily. These were
collected by filtration and dried under vacuum.
Step 3 – preparation of compound IV (2-acetoxy-isophthalic acid dimethyl ester):
Compound III (2.284 g) and pyridine (17.5 mL) were mixed to which an excess of
acetic anhydride (12mL) was added over an ice bath, and was then allowed to stand
at room temperature over night. The solution, after being poured into ice water
(~500 mL), formed a white precipitate and was then stirred for 90 minutes. The
solution was acidified to pH 3 with hydrochloric acid (5N) and filtered over a glass
filter (filter glass porosity 4). The crystal cake was washed with saturated solution
of sodium carbonate (~250 mL) to remove unacetylated material, then with water
(2 x 300mL) and dried in a vacuum desiccator.

56
Step 4 – preparation of compound V (2,6-DMP): Compound IV (1.876 g) was
dissolved in dry tetrahydrofuran (75 mL) and added to a pressure equalising funnel.
Lithium aluminium hydride (5.67 g) was refluxed in tetrahydrofuran (75 mL) for
two hours with constant stirring. The solution was allowed to cool slightly (below
reflux), and then the tetrahydrofuran solution containing compound IV was
admitted over approximately forty minutes and the reflux was continued for three
hours. To decompose excess lithium aluminium hydride, tetrahydrofuran (10 mL)
containing ethyl acetate (3 mL) was added, then continued to reflux for a further
fifteen minutes following which the mixture was cooled to room temperature.
Tetrahydrofuran (20 mL) containing water (0.5mL) was added through the
condenser, then potassium sodium tartrate (42.2 g dissolved in 85 mL water) was
added to complex the aluminium ions, being careful to keep water volume small.
Tetrahydrofuran was removed by vacuum evaporation. The solution was titrated to
pH6 with sulphuric acid (24.5 mL) added to water (50 mL) to neutralise the alkali
present. Ethyl acetate (150 mL) was added to the aqueous mixture in a separating
funnel, the ethyl acetate layer removed and its volume reduced by vacuum
evaporation until a final volume of 20 mL was attained. Similarly, the aqueous
portion was extracted a further three times with fresh ethyl acetate (150 mL x 3).
The four flasks containing the final volume of approximately 20 mL were stored at
4oC overnight to form crystals. The crystals of 2,6-dimethylol phenol were
collected by filtration and dried in a vacuum desiccator.
3.2.1.3 Synthesis of TMP
The synthesis of TMP was carried out in a two-step process: (i) the synthesis of
lithium-trimethylol phenol; (ii) the synthesis of trimethylol phenol. The synthesis
step was only carried out to the end of the first stage until the compound was ready
to be used due to the instability of the neutral TMP.
Step 1 – preparation of lithium-trimethylol phenol: Phenol (94 g) and lithium
hydroxide monohydrate (42 g) were mixed in water (100 mL). Formaldehyde (39g
as a 36 % solution) was added. The exotherm which resulted raised the temperature
of the solution assisting it to dissolve the reagents. However, care had to be taken
not to allow the temperature to rise above 50°C. After the exotherm ceased, the

57
mixture was allowed to stand at room temperature overnight. The mixture was
poured into isopropanol (800 mL), stirred for thirty minutes during which time fine
white granular precipitate formed. This precipitate was collected on a scintered
glass filter (filter glass porosity No. 2), washed with acetone (400 mL) and dried in
a vacuum desiccator.
Step 2 – preparation of trimethylol phenol:
Preparation of the ion-exchange column: A glass column (2.5 cm ID, length 22
cm, filter porosity No.2 at the base of the column) was filled with Amberlite resin
IR-120 (H) (AR, Merck, 50 g) to attain approximately a depth of fifteen cm. The
resin was washed with water. This was followed by rinsing the column with
sodium hydroxide (1 N, 120 mL) to exhaust the resin. The column was regenerated
with hydrochloric acid (0.5 N, 120 mL) and then washed with water until neutral.
Preparation of 2,4,6-TMP: Li-TMP (5 g) was dissolved in water (200 mL) and
carefully and slowly applied to the prepared ion-exchange column making sure the
column did not run dry. The major portion of the sample was collected in the first
100 mL of eluent. After the 200 mL solution passed through, the column continued
to be washed with water until ferric chloride (60 % w/w solution) monitoring of
the eluent for the presence of phenolic OH, only showed a faint blue colour. The
collected eluents were freeze-dried.
3.2.2 Characterisation of 2,4-DMP, 2,6-DMP and TMP
1H- and 13C-NMR spectra were recorded with a Bruker AM-100 spectrometer
equipped with an Aspect 3000 computer operating at frequencies of 300 MHz and
100 MHz respectively. The monomer compounds, 2,4-DMP, 2,6-DMP and 2,4,6-
TMP, were dissolved in deuterated methanol-d4 (MEOD). All chemical shift data
are reported as δ values, in parts per million (ppm), downfield from
tetramethylsilane (TMS) as internal standard (δ 0.0).
Figures 3.9-3.11 depicts the 1H-NMR spectra and Figures 3.12-3.14 the 13C-NMR
spectra for the monomers. Table 3.2 summarises the 1H-NMR results and reports
the chemical shifts (ppm), coupling pattern (s: singlet, d: doublet, t: triplet), and

58
coupling constants (J-values given in Hz). Table 3.3 provides the 13C-NMR
chemical shifts. NMR spectral data of these monomers were in agreement with data
reported in literature [22, 23].
OH
HH
H
H
H5
4
1
2
3
CH2OH
Table 3.2: 1H-NMR chemical shifts.
Compound
2,4-DMP
ppm (multiplicity,
J-values)
2,6-DMP
ppm (multiplicity,
J-values)
TMP
ppm (multiplicity,
J-values)
p- CH2 - OH 4.64 (s) - 4.49 (d, 5.58)
o- CH2 - OH 4.48 (s) 4.71 (s) 4.63 (d, 4.90)
Ar - H1 - - -
Ar - H2 7.25 (s) 7.13 (d, 7.50) 7.03 (s)
Ar - H3 - 6.80 (d, 7.50) -
Ar - H4 7.09 (d, 2.11) 7.13 (d, 7.50) 7.03 (s)
Ar - H5 6.74 (d, 8.03) - -

59
OH
54
12
3CH2OH
6
Table 3.3: 13C-NMR chemical shifts.
Compound 2,4-DMP
ppm
2,6-DMP
ppm
TMP
ppm
o- CH2 - OH 61.05 62.09 64.17
o- CH2 - OH - 62.09 64.07
p- CH2 - OH 65.09 - 66.46
C1 155.50 155.03 161.03
C2 127.98 127.43 129.80
C3 128.65 128.08 128.64
C4 133.20 120.32 132.48
C5 128.65 128.08 128.64
C6 115.79 127.43 129.80

60
Figure 3.9: 1H-NMR spectra of 2,4-DMP
Figure 3.10: 1H-NMR spectra of 2,6-DMP

61
7.03
49
4.67
06
4.43
84
(ppm)4.04.24.44.64.85.05.25.45.65.86.06.26.46.66.87.07.27.4
Figure 3.11: 1H-NMR spectra of 2,4,6-TMP
Figure 3.12: 13C-NMR spectra of 2,4-DMP

62
Figure 3.13: 13C-NMR spectra of 2,6-DMP
161.
0300
130.
6802
130.
0398
129.
5595
128.
6447
66.4
586
64.1
715
(ppm)60708090100110120130140150160
Figure 3.14: 13C-NMR spectra of 2,4,6-TMP

63
3.2.3 DSC runs
Aqueous solutions (0.040M) of 2,MMP, 4-MMP, 2,4-DMP, 2,6-DMP and TMP,
together with solutions of (0.006, 0.012, 0.018, 0.024, 0.030, 0.040) M aqueous
sodium hydroxide were prepared and mixed at room temperature to form molar
ratios of NaOH : monomer ranging from 0.15 to 1.0. These mixtures were freeze-
dried and stored at – 5°C (268K) prior to DSC runs. The DSC runs were carried out
using a Perkin Elmer DSC (Pyris-1) under a constant purge of nitrogen gas (20
cc.min-1). Temperature calibration was performed by determining the enthalpy
change of pure indium metal (99.9 % purity). The samples were weighed directly
into the stainless steel pans specifically designed for DSC use and sealed (the mass
of the samples ranged from 4 to 9 mg). These sealed pans can withstand pressures
up to 24 atm and hence, reactive volatiles were able to be contained.
The sealed samples were heated in the DSC using an empty sample pan as
reference. Thermograms were recorded at scan speeds of (5, 7, 10, 15, 20) °C min-1
in the range 25°C (298K) to 250°C (523K). The scan was started at a relatively low
temperature compared with the curing reaction temperature so that the pans
containing the samples as well as the reference one are in equilibrium well before
the start of the reaction. Thus the total enthalpy of reaction is more accurately
acquired. Baselines were established by re-scanning the cured sample and
subtracting from the sample scan using relevant Pyris computer software. DSC
runs were made in triplicate and the maximum error in the data was ± 0.5 %.
It is noted that the purpose of the freeze-drying of the samples was to remove the
solvents, particularly water. Since the monomers are polar, there could have been
some residual water in the freeze-dried samples. Nevertheless, with the use of the
sealed pans, the results are free from potential interference due to residual water, if
any, as evidenced in the absence of the water peak in all DSC thermograms.
For optimum peak sharpness and resolution, the contact surface between pan and
sample should be maximized. This was achieved by the use of compact fine
granules in good contact with the capsule bottom.

64
3.3 References
1. G.W. Ehrenstein, G. Riedel and P. Trawiel, Thermal Analysis of Plastics:
Theory and Practice, Hanser, Munich, 2004.
2. G.W.H. Hohne, W.F. Hemminger, H.-J. Flammersheim, Differential
Scanning Calorimetry, Springer, Berlin, 2003.
3. E.L. Charsley and S.B. Warrington (eds), Thermal Analysis: Techniques
and Applications, Royal Society of Chemistry, Cambridge, 1992.
4. S. Vyazovskin and C. Wight, “Model-free and Model-fitting Approaches to
Kinetic Analysis of Isothermal and Nonisothermal Data”, Thermochimica
Acta 340-341, 53-68 (1999).
5. S. Vyazovkin, “Thermal Analysis”, Anal. Chem. 76, 3299-3312 (2004).
6. S. Vyazovkin, “On the Phenomenon of Variable Activation Energy for
Condensed Phase reactions”, New J. Chem. 24, 913-917 (2000).
7. S. Vyazovkin, “Kinetic Concepts of Thermally Stimulated Reactions on
Solids: A View From a Historical Perspective”, Int. Rev. Phys. Chem. 19,
45-60 (2000).
8. Standard Test Method for Arrhenius Kinetic Constants for Thermally
Unstable Materials, ANSI/ASTM E698 – 79, ASTM, Philadelphia, 1979.
9. H.E. Kissinger, “Reaction Kinetics in Differential Thermal Analysis”,
Analytical Chemistry 29, 1702 (1957).
10. G. Vazquez, J. Gonzalez-Alvarez, F. Lopez-Suevos, S. Freire and G.
Antorrena, “Curing Kinetics of Tannin-Phenol-Formaldehyde Adhesives as
Determined by DSC”, J. Therm. Anal. Cal. 70, 19-28 (2002).
11. G. He, B. Riedl and A. Ait-Kadi, “Model-Free Kinetics: Curing Behavior of
Phenol Formaldehyde Resins by Differential Scanning Calorimetry”, J.
Appl. Polym. Sci. 87, 433-440 (2003).
12. N. Sbirrazzuoli, S. Vyazovkin, A. Mititelu, C.l Sladic and L. Vincent, “A
Study of Epoxy-Amine Cure Kinetics by Combining Isoconversional

65
Analysis with Temperature Modulated DSC and Dynamic Rheometry”,
Macromol. Chem. Phys. 204, 1815–1821 (2003).
13. S. Vyazovkin and N. Sbirrazzuoli, “Isoconversional Kinetic Analysis of
Thermally Stimulated Processes in Polymers”, Macromol. Rapid Commun.
27, 1515-1532 (2006).
14. A. L. Daniel-da-Silva, J. C. M. Bordado and J. M. Martin-Martinez, “Use of
Isoconversional Methods to Analyze the Cure Kinetics of Isocyanate-Ended
Quasi-Prepolymers with Water”, J. Appl. Polym. Sci. 104, 1049–1057
(2007).
15. F. X. Perrin, T. M. H. Nguyen and J. L. Vernet, “Kinetic Analysis of
Isothermal and Nonisothermal Epoxy-Amine Cures by Model-Free
Isoconversional Methods”, Macromol. Chem. Phys. 208, 718–729 (2007).
16. J. M. Salla and X. Ramis, “Comparative Analysis of the Cure Kinetics of an
Unsaturated Polymer Resin Using Different Procedures”, Polym. Eng. Sci.
36, 835-851 (1996).
17. S. Vyazovkin and N. Sbirrazzuoli, “Kinetic Analysis of Isothermal Cures
Performed Below the Limiting Glass Transition Temperature”, Macromol.
Rapid Commun. 21, 85–90 (2000).
18. N. Sbirrazzuoli and S. Vyazovkin, “Learning About Epoxy Cure
Mechanisms From isoconversional Analysis of DSC Data”, Thermochimica
Acta 388, 289-298 (2002)
19. J. H. Freeman, “Synthesis of the Polymethylols of Phenols”, Journal of the
American Chemical Society 74 (24), 6257 (1952).
20. G. R. Sprengling and J. H. Freeman, “The Reaction of Phenol with
Formaldehyde”, Journal of the American Chemical Society 72 (5), 1984
(1950).
21. J. H. Freeman, “Kinetics of the Formation of Hydroxydiphenylmethanes
From Tri-methylolphenol In Alkali”, American Chemical Society, Division
of Organic Coatings and Plastics Chemistry, 27(1), 84 (1967).

66
22. M. F. Grenier-Loustalot, S. Larroque and P. Grenier, “Phenolic Resins:1.
Mechanism and Kinetics of Phenol and of The First Polycondensates
Towards Formaldehyde in Solution”, Polymer 35 (14), 3046 (1994).
23. Y. Yazaki, P. J. Collins, M. J. Reilly, S. D. Terrill and T. Nikpour, “Fast-
Curing Phenol-Formaldehyde (PF) Resins: Part1. Molecular Weight
Distribution of PF Resins”, Holzforschung 48, 41 (1994).

67
Chapter 4
Cure Properties of Mono-Methylol Phenols
4.1 Introduction
This chapter discusses the effects of NaOH on the cure properties of 2-MMP and 4-
MMP. Since the DSC runs were carried out at different scan rates, a general
discussion on the effects of scan rate on DSC thermograms will be given with
particular emphasis on the peak exotherm temperature Tp, the fractional conversion
αp at Tp and the total enthalpy of reaction ΔHT.
The main body of the chapter begins with a discussion on the effects of various
levels of NaOH on the DSC curves of the monomers and other parameters
including Tp, αp and ΔHT. The discussion then focuses on the effects of NaOH
content on the evolution of apparent activation energy Ea during the cure. The
discussion relies in part on the established knowledge of self-condensation
reactions of 2-MMP and 4-MMP, and forms the basis for the proposals of possible
mechanisms which operate during the cure.
4.2 Effects of Scan Rate on DSC Thermograms
DSC thermograms at varying scan rates for 2-MMP and 4-MMP, with or without
the presence of NaOH, display certain common features. An example is shown in
Figures 4.1 and 4.2 that show the DSC thermograms at scan rates of (5, 10, 15 and
20) °C min-1 for 2-MMP and 4-MMP, respectively, in the absence of NaOH.
4.2.1 Peak temperature Tp
It can be seen in Figure 4.1 that the peak exotherm temperature Tp shifted to higher
values along the temperature axis with increasing heating rate. Although not
presented here, similar shifts to higher temperature as the heating rate was
increased were also observed for 2-MMP and 4-MMP compounds for the entire

68
range of NaOH : MMP molar ratios used in this study. Such effect of scan rate on
Tp is a well established phenomenon, essentially due to the fact that individual
reactions have not had time to reach completion before the rapidly rising
temperature reaches the initiation temperature of adjacent higher temperature
reactions [1,2].
By way of examples, Tables 4.1 and 4.2 list the changes in Tp values with changes
in scan rate for 2-MMP and 4-MMP, respectively, with NaOH : MMP molar ratios
of 0 and 0.45. For the sake of brevity, Tp values for other molar ratios are not
presented. In the case of NaOH : 2-MMP molar ratio of 0, Tp was 148°C at scan
rate of 5 °C min-1 and shifted significantly to higher temperatures with increasing
scan rate and reached a value of 167°C at 20 °C min-1 scan rate. Similarly, for
NaOH : 4-MMP ratio of 0, Tp was 130°C when the scan rate was held at 5 °C min-1
and steadily increased to 147°C at 20 °C min-1 heating rate. Similar changes of Tp
with the increase in scan rate can also be seen in Tables 4.1 and 4.2 for 2-MMP and
4 MMP in the presence of NaOH.
2-MMP
Temperature (οC)
100 120 140 160 180 200 220 240 260 280 300
Hea
t Flo
w E
ndo
Up
(mW
)
0
5
10
15
20
25
30
35
40
45
5 oCmin-1
10 oCmin-1
15 oCmin-1
20 oCmin-1
Figure 4.1: Dynamic traces for 2-MMP at varying scan rates in the absence of NaOH.
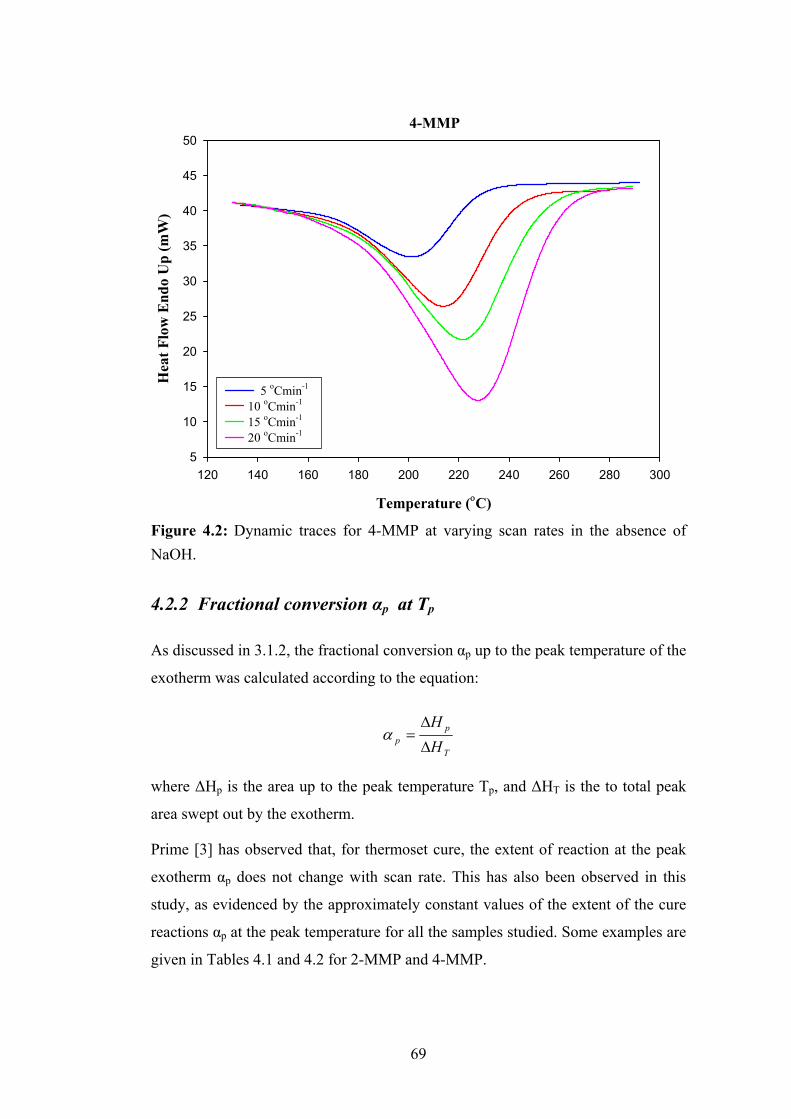
69
4-MMP
Temperature (οC)
120 140 160 180 200 220 240 260 280 300
Hea
t Flo
w E
ndo
Up
(mW
)
5
10
15
20
25
30
35
40
45
50
5 oCmin-1
10 oCmin-1
15 oCmin-1
20 oCmin-1
Figure 4.2: Dynamic traces for 4-MMP at varying scan rates in the absence of NaOH.
4.2.2 Fractional conversion αp at Tp
As discussed in 3.1.2, the fractional conversion αp up to the peak temperature of the
exotherm was calculated according to the equation:
T
pp H
HΔ
Δ=α
where ΔHp is the area up to the peak temperature Tp, and ΔHT is the to total peak
area swept out by the exotherm.
Prime [3] has observed that, for thermoset cure, the extent of reaction at the peak
exotherm αp does not change with scan rate. This has also been observed in this
study, as evidenced by the approximately constant values of the extent of the cure
reactions αp at the peak temperature for all the samples studied. Some examples are
given in Tables 4.1 and 4.2 for 2-MMP and 4-MMP.

70
Table 4.1: Effects of scan rate on: the peak temperature of cure (Tp); total enthalpy of reactions (ΔHT); and the extent of the cure reactions at the peak of the exotherm (αp) for NaOH : 2-MMP molar ratios of 0.0 and 0.45. Maximum error from the triplicate DSC runs was 0.5 %.
NaOH : 2-MMP ratio = 0.00 NaOH : 2-MMP = 0.45 Heating rate
(°C min-1) Tp (°C) ΔHT (J g-1) αp Tp (°C) ΔHT (J g-1) αp
5
7
10
15
20
148.30
153.10
157.57
163.21
167.30
547.78
542.50
535.97
530.47
533.58
0.678
0.690
0.679
0.665
0.664
150.89
153.69
156.82
161.85
165.78
468.60
469.18
465.06
469.98
463.04
0.521
0.507
0.515
0.500
0.488
Table 4.2: Effects of scan rate on: the peak temperature of cure (Tp); total enthalpy of reactions (ΔHT); and the extent of the cure reactions at the peak of the exotherm (αp) for NaOH : 4-MMP molar ratios of 0.0 and 0.45. Maximum error from the triplicate DSC runs was 0.5 %.
NaOH : 4-MMP = 0.00 NaOH : 4-MMP = 0.45 Heating rate
(°C min-1) Tp °C ΔHT (J g-1) αp Tp (°C) ΔHT (J g-1) αp
5
7
10
15
20
198.36
204.51
212.80
220.65
227.88
389.55
386.86
387.31
385.66
395.76
0.618
0.616
0.594
0.582
0.610
129.51
133.83
137.89
143.89
147.51
438.14
443.18
436.03
446.73
436.37
0.512
0.488
0.491
0.497
0.496
4.2.3 Enthalpy of reactions ΔHT
The total enthalpy change ΔHT during the cure reactions is directly proportional to
the total area swept out by the exotherm. It can be seen from Figure 4.1 that the
peak height, hence the peak area, of the exotherm increases with increasing heating
rate. Therefore, comparison between the peak areas will be possible only when all
the exotherms are converted to the same scanning rate or to a time domain.
Consequently, the total enthalpy of reactions, ΔHT, was computed by integration of

71
the enthalpy change, dH / dt, with respect to time. This calculation was performed
using the DSC Pyris software.
In this study, no significant change in ΔHT for all 2-MMP and 4-MMP samples was
observed as the scan rate was varied. Examples are given in Tables 4.1 and 4.2
where values of ΔHT are similar for two different NaOH : MMP molar ratios listed
in Tables 4.1 and 4.2 at the five scan rates.
4.3 Effects of NaOH on DSC Thermograms
There were significant differences in DSC thermograms of the compounds as
NaOH concentration was varied. Thermograms obtained at 10°C min-1 scan rate for
2-MMP and 4-MMP in the presence of varying amounts of NaOH are shown in
Figures 4.3 and 4.4, respectively.
4.3.1 Peak temperature Tp
Generally, there was a significant effect of NaOH on 2-MMP and 4-MMP in terms
of the peak cure temperature Tp as can be seen in Figure 4.3. In the uncatalyzed
condition, both compounds had one characteristic peak exotherm at approximately
211°C. As the NaOH : MMP molar ratio was increased to 0.15, the position of the
peaks shifted significantly to lower temperatures, approximately to 162°C for 2-
MMP and to 142°C for the 4-MMP and became steady at these values for the entire
higher range of NaOH concentrations.
The decrease of the peak temperature in the presence of NaOH may be a
consequence of the diffusivity of the peak, and does not necessarily imply that the
cure of 2-MMP and 4-MMP is faster. This interpretation is supported by higher
activation energies for both 2-MMP and 4-MMP in the presence of NaOH as will
be shown in 4.4. It is relevant to note that in a study of the effect of lignin on the
cure properties of phenolic resins using DSC, Barry et al. [3] reported that whilst
the DSC peak temperature decreased in the presence of lignin, the activation
energies of lignin-containing resins were higher than those of pure resins.

72
2-MMP
Temperature (οC)
60 80 100 120 140 160 180 200 220 240 260 280
Hea
t Flo
w E
ndo
Up
(mW
)
0
10
20
30
40
50
60
70
80
90
100
110
120
No NaOH0.15 NaOH0.30 NaOH0.45 NaOH0.60 NaOH1.00 NaOH
Figure 4.3: Dynamic traces of 2-MMP in the presence of varying NaOH : 2-MMP molar ratios at 10 °C min-1 scanning rate.
73
4-MMP
Temperature (οC)
20 40 60 80 100 120 140 160 180 200 220 240 260 280 300
Hea
t Flo
w E
ndo
Up
(mW
)
5
10
15
20
25
30
35
40
45
50
55
60
No NaOH0.15 NaOH0.30 NaOH0.45 NaOH0.60 NaOH1.00 NaOH
Figure 4.4: Dynamic traces of 4-MMP in the presence of varying NaOH : 4-MMP molar ratios at 10 °C min-1 scanning rate.
4.3.2 Fractional conversion αp at Tp
Figure 4.5 shows the fractional conversion αp as a function of NaOH : MMP molar
ratio. It can be seen that αp decreased from 0.68 in the uncatalyzed state to 0.60 at
molar ratio of 0.15 and remained steady around 0.57 with further increase of
NaOH. In the case of 4-MMP, αp steadily decreased from 0.62 in the uncatalyzed

74
state to a value of approximately 0.50 at molar ratio of 0.30. Further increase of
NaOH concentration did not seem to have any additional effect.
NaOH : MMP molar ratio
0.0 0.1 0.2 0.3 0.4 0.5 0.6 0.7 0.8 0.9 1.0
Frac
tiona
l con
vers
ion
( αp)
0.40
0.45
0.50
0.55
0.60
0.65
0.70
0.75
0.802-MMP4-MMP
2-MMP and 4-MMP
Figure 4.5: Fractional conversion αp as a function of NaOH : MMP molar ratio for 2-MMP and 4-MMP. Maximum error from the triplicate DSC runs was 0.5 %. Error bars are not included in the graph since they were close to the font size of the data points.
4.3.3 Enthalpy of reactions ΔHT
Figure 4.6 shows ΔHT as a function of NaOH : MMP molar ratio. It can be seen
that in the uncatalyzed condition, ΔHT for 2-MMP was 538 J g-1 and remained
steady at this value until the molar ratio reached 0.30. Thereafter, ΔHT steadily
decreased to about 425 J g-1 at molar ratios of 0.60 or higher. For 4-MMP, ΔHT
steadily increased from 390 J g-1 in the uncatalyzed state to approximately 450 J g-1
at molar ratio of 0.30. Subsequently, it steadily returned to the uncatalysed value of
390 J g-1 at molar ratio of 1.

75
It is clear that the extent of variation of ΔHT as a function of NaOH content for 4-
MMP was not as significant as for 2-MMP. A decrease in ΔHT, as in the case of 2-
MMP, may be an indication of a decrease in the extent of cross-linking. Indeed, as
will be discussed in 4.4.1, the activation energies of cross-linking reactions for 2-
MMP increased in the presence of NaOH. Therefore, it appears that the decrease in
ΔHT at molar ratios higher than 0.30 was due to lower amounts of crosslinks
formed. This explanation is consistent with the observation that although the
“cured” 2-MMP samples with high NaOH content had a solid and glassy
appearance, they disintegrated into a gel-like substance when immersed in acetone
and/or methanol. The disintegration of these samples suggests that stable
methylene linkages, which is characteristic of a cured state, were not fully formed.
NaOH : MMP molar ratio
0.0 0.1 0.2 0.3 0.4 0.5 0.6 0.7 0.8 0.9 1.0
Ent
halp
y of
rea
ctio
n ( Δ
HT, J
g-1
)
350
400
450
500
550
6002-MMP4-MMP
2-MMP and 4-MMP
Figure 4.6: ΔHT as a function of NaOH : MMP molar ratio for 2-MMP and 4-MMP. Maximum error from the triplicate DSC runs was 0.5 %. Error bars are not included in the graph since they were close to the font size of the data points.

76
4.4 Effects of NaOH on the Evolution of Activation Energy Ea
As described in Chapter 3, activation energy Ea for increasing extent of conversion
α was calculated according to the equation:
ln (Φ/Tα 2) = - Eα
/ RTα + ln (RA / Eα) 3.7
where Φ is the heating rate (°C min-1); Tα is the temperature to reach a given degree
of conversion, α; R is the universal gas constant (J mol-1 K-1); and A is the
frequency factor (s-1).
A graph of ln(Φ/Tα 2) versus 1/Tα should yield a straight line. The value for Eα can
be obtained from the slope of the linear graph.
For each NaOH : MMP molar ratio, thermograms were recorded at scanning rates
(5, 10, 15 and 20) oC min-1 in the range 25oC up to 250oC. Figures 4.1 and 4.2
depict that the values of the temperature at which the peak of the exotherm occurs
(Tp) increases with increasing scan rate. Similarly, the temperature (Tα) at which a
particular conversion (α) is reached shifts to higher temperature as the heating rate
is increased. The DSC Pyris version 3.52 software was used to obtain the values of
Tα for increasing values of α for each scan rate. Taking NaOH : 2-MMP molar ratio
0.45 as an example, Table 4.3 depicts the values of Tα at the four scan rates. From
these values the linear regression analysis function of SigmaPlot version 7.1 (from
SPSS Inc.) was used to generate linear graphs of ln(Φ/Tα 2) vs. 1/Tα at a set
confidence level of 95 %. Figure 4.7 shows the linear regression graphs between α
= 0.05 and α = 0.95 and the corresponding square of the correlation coefficient (r2)
values. The equations of the linear graphs were then generated by the SigmaPlot
software, from which the values of Eα at different α could be manually calculated.
Maximum error in Ea values obtained from the triplicate DSC runs was 0.5 %.

77
Table 4.3: The DSC Pyris computer software generated values of Tα at four scan rates (for NaOH : 2-MMP molar ratio 0.45) and the corresponding values for the dependent and independent variables for equation 3.7.
Conversion α
Scan rate Φ (°C min-1)
Tα (°C) Tα (K) (1/Tα) x 10-3 (K) Ln(Φ/ Tα2)
0.05 5 118.669 391.869 2.551873203 13.55129311
10 126.56 399.76 2.501500901 14.28431383 15 133.038 406.238 2.461611174 14.72192859 20 137.173 410.373 2.43680749 15.02986528
0.10 5 125.511 398.711 2.508082295 13.5859116 10 133.639 406.839 2.457974776 14.31942015 15 139.855 413.055 2.420985099 14.75521171 20 144.149 417.349 2.396076186 15.06357788
0.20 5 133.837 407.037 2.456779113 13.62724609 10 142.161 415.361 2.407544281 14.36088114 15 148.37 421.57 2.3720853 14.79602188 20 152.824 426.024 2.347285599 15.10472364
0.30 5 139.64 412.84 2.422245906 13.65555813 10 148.081 421.281 2.373712558 14.38918523 15 154.103 427.303 2.340259722 14.82303693 20 158.344 431.544 2.317260812 15.13047122
0.40 5 144.348 417.548 2.394934235 13.67823693 10 152.588 425.788 2.348586621 14.41046823 15 158.328 431.528 2.317346731 14.842715 20 162.385 435.585 2.295763169 15.14911218
0.45 5 146.977 420.177 0.002379949 13.69079001 10 154.428 427.628 0.002338481 14.41909241 15 161.12 434.32 0.00230245 14.85561338 20 164.186 437.386 0.00228631 15.15736447
0.50 5 148.278 421.478 2.372603078 13.69697308 10 156.21 429.41 2.328776694 14.42740944 15 161.871 435.071 2.298475421 14.85906867 20 165.6 438.8 2.278942571 15.16381973
0.60 5 151.628 424.828 2.353893811 13.71280667 10 159.641 432.841 2.310317183 14.443326 15 165.464 438.664 2.279649116 14.87551769 20 169.663 442.863 2.258034652 15.18225321
0.70 5 155.19 428.39 2.334321529 13.7295059 10 163.411 436.611 2.290368314 14.46067037 15 169.303 442.503 2.259871684 14.89294469 20 173.611 446.811 2.238082769 15.20000365
0.80 5 159.415 432.615 2.311524103 13.74913429 10 167.891 441.091 2.267105881 14.4810875

78
15 173.855 447.055 2.236861236 14.91341346 20 178.266 451.466 2.215006224 15.2207324
0.90 5 165.233 438.433 2.28085021 13.77585193 10 174.012 447.212 2.236075955 14.5086506 15 179.992 453.192 2.206570284 14.94068195 20 184.584 457.784 2.184436328 15.24852719
0.95 5 169.753 442.953 2.25757586 13.79636525 10 178.739 451.939 2.212687996 14.52967952 15 184.699 457.899 2.183887713 14.96134747 20 189.46 462.66 2.16141443 15.26971716
2-MMP
1/Tα x 10-3 (K)
2.10 2.15 2.20 2.25 2.30 2.35 2.40 2.45 2.50 2.55 2.60 2.65 2.70 2.75
ln( φ
/ T
α2 )
13.4
13.6
13.8
14.0
14.2
14.4
14.6
14.8
15.0
15.2
15.4α = 0.05; r2 = 0.996α = 0.10; r2 = 0.997α = 0.20; r2 = 0.997α = 0.30; r2 = 0.998α = 0.40; r2 = 0.999α = 0.50; r2 = 0.998α = 0.60; r2 = 0.998α = 0.70; r2 = 0.999α = 0.80; r2 = 0.998α = 0.90; r2 = 0.999α = 0.95; r2 = 0.999
Figure 4.7: Graph of ln(Φ/Tα
2) vs. 1/Tα between α = 0.05 and α = 0.95 and the corresponding square of the correlation coefficient (r2) values for 2-MMP sample with NaOH : 2-MMP molar ratio of 0.45.
4.4.1 2-MMP
Figure 4.8 shows the effects of NaOH content on the evolution of apparent
activation energy Ea for 2-MMP as a function of the degree of conversion. It can be
seen that for most samples, there was a decrease in Ea in the initial cure stages,

79
especially when fractional conversion was about 0.10 or less. Such behaviour of Ea
may be explained by the diffusion effect on the cure kinetics at low conversions,
leading to a decrease in Ea, as proposed by Vyazovkin and Sbirrazzuoli [5]. This
phenomenon will not be investigated in the present work. Instead, the following
discussion focuses on the evolution of Ea when conversion was higher than 0.10.
2-MMP
Conversion (α)
0.0 0.1 0.2 0.3 0.4 0.5 0.6 0.7 0.8 0.9 1.0
Act
ivat
ion
Ene
rgy
(Ea,
kJ
mol
-1)
80
90
100
110
120
130
140
No NaOH0.15 NaOH0.30 NaOH0.45 NaOH0.60 NaOH1.00 NaOH
Figure 4.8: Effects of NaOH on the evolution of apparent activation energy Ea for 2-MMP as a function of the degree of conversion. Error bars are not included in the graph because the maximum error in Ea and α values from the triplicate DSC runs was only 0.5 %.
As can be seen in Figure 4.8, for the uncatalyzed sample, there was a relatively
rapid rise of Ea from 89 kJ mol-1 to about 102 kJ mol-1 as conversion reached 0.25.
As the cure proceeded, Ea increased less rapidly and reached a value of about 108
kJ mol-1 at the end of the cure. Figure 4.8 also shows that whilst the values of Ea for
samples with NaOH were higher than the uncatalyzed sample, there were certain
differences amongst these samples. In particular, for the sample with molar ratio of
0.15, Ea increased steadily from (110 to 119) kJ mol-1 during the course of the cure
process. Further increase of NaOH content also resulted in an ascending

80
dependence of Ea on conversion until the later phase of the cure process where Ea
seemed to remain steady at about 130 kJ mol-1. There was no clear trend with
respect to the fractional conversion at which the steady Ea was reached amongst
these high NaOH content samples.
It has been shown that the shape of the dependence of Ea on conversion degree is
determined by the ratio of the partial contribution of individual reactions to the
overall reaction process [6]. Previous studies [7-8] have shown that the self-
condensation reaction of 2-MMP essentially involves the reaction of a methylol
group with a free para hydrogen on the ring of the coupling 2-MMP to form an
(o,p) methylene linkage. Yeddanapalli and Francis [9] have shown that a lesser
amount of (o,o) methyene linkage is also formed with a higher Ea (89.6 kJ mol-1)
than the (o,p) linkage (78.3 kJ mol-1). Whilst there are discrepancies in the absolute
Ea values compared to other studies [see, for instance, 10-11], the higher Ea for the
(o,o) linkage reaction is consistent with the low reactivity of ortho position of 2-
MMP. A schematic representation of the relevant condensation reactions is
presented in Figure 4.9.
OH
CH2OH
OH
CH2OH
+
OH
CH2
CH2OHOH
+ H2O
OH
CH2
CH2OH
+ H2OOH
(o,p methylene linkage)
(o,o methylene linkage)
Figure 4.9: Condensation reactions of 2-MMP.
In the present case, the rise in Ea as a function of conversion may indicate a kinetic
process involving contributions of both (o,o) and (o,p) linkage reactions. It may be
that at low conversions, the partial contribution of the (o,o) linkage reaction with
higher Ea was low compared to that of the (o,p) linkage reaction. As the cure

81
proceeded, the contribution of the (o,o) linkage reaction increased and that of the
(o,p) linkage reaction decreased. This would result in an increasing dependence of
Ea on conversion, which has been shown to be characteristic of processes consisting
of parallel competing reactions [6,12].
It has been proposed that 2-MMP would be transformed to a sodium ring complex
following the addition of NaOH according to the following scheme [13]:
Na+
O OO
HNa
+
CH2OH CH2
:
Figure 4.10: The sodium ring complex.
Following the formation of the sodium ring complex, the methylol group is blocked
and its capacity to form methylene linkage is diminished. As well, the inclusion of
Na+ in the complex reduces the carbanion negative charge, which is the main
driving force for the condensation reactions. Thus, as the NaOH : 2-MMP molar
ratio increases, a higher proportion of methylol group are blocked and a higher
proportion of carbanion ions have less negative charge. As a consequence, higher
activation energy is required for the condensation reactions. This is reflected in the
results obtained for all samples with different levels of NaOH as shown in Figure
4.8. For the sample with molar ratio of 0.15, the increasing dependence of Ea on
fractional conversion is similar to that of the uncatalyzed sample. However, for
samples with higher NaOH content, Ea became steady at around 130 kJ mol-1 at
higher conversions, suggesting that the (o,p) linkage reaction was essentially
complete and that the (o,o) linkage reaction with higher activation energy was the
main reaction during this later phase. The lower ΔHT for these samples compared
to those with low NaOH content, as discussed in 4.3.3, is possibly due to the
sodium ring complex mechanism, which has the effect of making it more difficult
to form methylene linkage, especially at high NaOH content.

82
4.4.2 4-MMP
Figure 4.11 shows the effects of NaOH content on the evolution of apparent
activation energy Ea for 4-MMP as a function of fractional conversion. Similar to
the case of 2-MMP, there was a decrease in Ea in the initial cure stages for most 4-
MMP samples, especially when fractional conversion was about 0.10 or less, due to
the diffusion effect. The following discussion focuses on the evolution of Ea when
conversion was higher than 0.10.
4-MMP
Conversion (α)0.0 0.1 0.2 0.3 0.4 0.5 0.6 0.7 0.8 0.9 1.0
Act
ivat
ion
Ene
rgy
(Ea,
kJ
mol
-1)
90
100
110
120
130
140
150No NaOH0.15 NaOH0.30 NaOH0.45 NaOH0.60 NaOH1.00 NaOH
Figure 4.11: Effects of NaOH on the evolution of apparent activation energy Ea for 4-MMP as a function of the degree of conversion. Error bars are not included in the graph because the maximum error in Ea and α values from the triplicate DSC runs was only 0.5 %.
As seen in Figure 4.11, for the uncatalyzed sample, there was a gradual decrease of
Ea from about 110 kJ mol-1 in the early stage to about 98 kJ mol-1 as conversion
reached 0.95. For the sample with molar ratio of 0.15, the conversion dependence
of Ea was similar to that for the uncatalyzed sample, although the rate of decrease
seemed to be greater. Further increase of NaOH content had the effect of increasing

83
Ea values for all samples, but these values remained relatively steady throughout
the cure process, rather than showing a decreasing trend. Samples with molar ratios
between 0.30 and 0.60 had Ea ranging from about (115 to 120) kJ mol-1, whereas
the sample with molar ratio of 1.00 had higher Ea in the vicinity of 128 kJ mol-1.
Similar to the case of 2-MMP, the identification of individual reactions and their
partial contributions to the overall reaction process is important in understanding
the dependence of the apparent activation energy on the extent of conversion.
Previous studies [8-9] have shown that the self-condensation of 4-MMP essentially
involves the formation of methylene linkage according to the following schemes:
CH2OH
CH2
OH
OH
OH
CH2OH
+ H2O
CH2 OH + H2O + CH2OHO
(o,p methylene linkage)
(p,p methlyne linkage)CH2OH
OH
+
Figure 4.12: Self-condensation of 4-MMP.
Both (p,p) and (o,p) linkage reactions occur at similar rates. Yeddanapalli and
Francis [9] obtained an activation energy of 72 kJ mol-1 for these reactions. The
CH2O released from the (p,p) linkage reaction also reacts with 4-MMP to form 2,4-
DMP according to the scheme shown in Figure 4.12. Eapen and Yeddanapalli [15]
reported a value of 60 kJ mol-1 for the addition reaction of CH2O to 4-MMP.
CH2OH
OH
CH2OH
+
OH
CH2OH
CH2O
Figure 4.13: Addition reaction of CH2O to 4-MMP.

84
The above discussion suggests that the cure process of 4-MMP consisted of
consecutive reactions. The process started with the self-condensation reactions with
higher activation energy, followed by the addition reaction of the product CH2O to
4-MMP with lower activation energy. The descending shape of the dependence of
Ea on conversion extent for the uncatalyzed 4-MMP suggests that the self-
condensation gradually decreased its partial contribution to the overall process as
the cure proceeded, whereas the addition reaction made a growing contribution and
became the main reaction towards the end of process. The activation energies of
the self-condensation and addition reactions can be estimated as the maximum and
minimum values of the effective activation energy (110 and 98) kJ mol-1,
respectively.
The results also suggest that the effect of NaOH on the cure property of 4-MMP
varied, depending on the amount present. At low level, NaOH did not seem to have
significant effect on Ea as well as its conversion dependence, as shown by the
results for the sample with molar ratio of 0.15. However, as the level of NaOH
increased, higher energy was required for the reactions to proceed. As discussed in
4.4.1 for the case of 2-MMP, the association between Na+ and the phenate oxygen
decreases the electron density on the phenolic aromatic ring, and therefore reduces
the carbanion negative charge, which is the main force driving the self-
condensation. A similar mechanism also operates in the case of 4-MMP. As a
consequence, as NaOH content was increased, higher proportion of carbanion ions
had less negative charge and higher activation energy was required for the self-
condensation reactions to occur. Despite this, the adverse effects of NaOH on the
self-condensation of 4-MMP should be less compared to 2-MMP, since the sodium
ring complex which blocked the ortho methylol group was not formed in the case
of 4-MMP. The comparison of the effects of NaOH on 2-MMP and 4-MMP will be
further explored in chapter 7.
It is interesting that all samples with molar ratio of 0.30 or above had “flat”
conversion dependences of Ea, suggesting that the self-condensation and addition
reactions had similar activation energies when NaOH content was high. It seems
that in these cases, the reduction of the negative charge on carbanion ions due to
the association with Na+ raised not only the energy required for the self-

85
condensation, but also the energy required for the addition reaction between CH2O
and 4-MMP.
4.5 Summary
In this chapter, the effects of scan rate on the peak exotherm temperature, Tp, the
fractional conversion, αp, at Tp and the total enthalpy of reaction, ΔHT, of 2-MMP
and 4-MMP were investigated. It has been shown that Tp shifted to higher values
with increasing heating rate, whereas αp and ΔHT did not change significantly with
scan rate. These properties are consistent with general behaviour of thermoset
materials.
The main focus of the chapter discussed the effect of various levels of NaOH on
the DSC curves of the monomers and on the evolution of apparent activation
energy, Ea, during the cure, as well as on ΔHT. Based on the shape of the
dependence of Ea on conversion degree, α, for 2-MMP, it was proposed that at low
conversions, the partial contribution of the (o,o) linkage reaction with higher Ea was
low compared to that of the (o,p) linkage reaction. As the cure proceeded, the
contribution of the (o,o) linkage reaction increased and that of the (o,p) linkage
reaction decreased. It was also suggested that the addition of NaOH resulted in the
formation of the sodium ring complex, which blocked the methylol group and
diminished its capacity to form methylene linkage. This is reflected in the
observation of higher Ea and lower ΔHT with increase in NaOH content.
The shape of the curve, Ea vs. α for 4-MMP, suggested that the cure process started
with the self-condensation reactions with higher activation energy to form (o,p) and
(p,p) methylene linkages. This was followed by the addition reaction of the product
CH2O to 4-MMP with lower activation energy. The descending shape of the
dependence of Ea on conversion extent for the uncatalyzed 4-MMP suggested that
the self-condensation gradually decreased its partial contribution as the cure
proceeded, whereas the addition reaction made a growing contribution to the
overall process and became the main reaction towards the end of the process.

86
A sodium ring complex mechanism was also suggested to operate in the case of 4-
MMP as NaOH was added with the resulting higher Ea for the condensation
reactions. Despite this, the adverse effects of NaOH on the cure of 4-MMP was less
compared to 2-MMP, since the sodium ring complex which blocked the ortho
methylol group was not formed in the former. Further comparison of the effects of
NaOH on the cure properties of 2-MMP and 4-MMP, as well as of DMP and TMP,
will be presented in chapter 7.
4.6 References
1. S.S.J. Warne and P. Bayliss, “The Differential Thermal Analysis of
Cerussite”, Amer. Mineral. 47, 1011 (1962).
2. R.C. MacKenzie and B.D. Mitchell, Differential Thermal Analysis, R.C.
Mackenzie (ed.), Acad. Press, London, 1970, Vol. 1, Chapter 4, p. 101.
3. A.O. Barry, W. Peng and B. Riedl, “The Effect of Lignin Content on the
Cure Properties of Phenol-Formaldehyde Resin as Determined by
Differential Scanning Calorimetry”, Holzforschung 47, 247-252 (1993).
4. J.S.M. Kazayawoko, B. Riedl, J. Poliquin, A.O. Barry and L.M. Matuana,
“A Lignin-Phenol-Formaldehyde Binder for Particle Board Part 1. Thermal
Characteristics, Holzforschung 46, 257-262 (1992).
5. S. Vyazovkin and N. Sbirrazzuoli, “Effect of Viscosity on The Kinetics of
Initial Cure Stages”, Macromol. Chem. Phys. 201, 199–203 (2000).
6. S.V. Vyazovkin, V.I. Goryachko and A.I. Lesnikovich, “An Approach to
the Solution of the Inverse Kinetic Problem in the Case of Complex
Processes. Part III. Parallel Independent Reactions”, Thermochimica Acta
197, 41-51 (1992).
7. J. Reese, Kunststoffe 45(4), 137-145 (1955).
8. M.F. Grenier-Loustalot, S. Larroque and P. Grenier, “Phenolic Resins: 4.
Self-Condensation of Methylolphenols in Formaldehyde-Free Media”,
Polymer 37(6), 955-964 (1996).

87
9. L.M. Yeddanapalli and D.J. Francis, “Kinetics and Mechanism of the Alkali
Catalysed Condensation of o- and p-Methylol Phenols by Themselves and
with Phenol”, Makromol. Chem. 55, 74-86 (1962).
10. M.M. Sprung and M.T. Gladstone, “A Study of Some Condensations of o-
Methylolphenol”, J. Am. Chem. Soc. 71, 2907 (1949).
11. M. Higuchi, T. Urakawa and M. Morita, “Condensation Reactions of
Phenolic Resins. 1. Kinetics and Mechanisms of the Base-Catalyzed Self-
Condensation of 2-Hydroxymethylphenol”, Polymer 42, 4563 (2001).
12. S. Vyazovskin and A. Lesnicovich, “An Approach to the Solution of the
Inverse Kinetic Problem in the Case of Complex Processes. Part 1. Methods
Employing a Series of Thermoanalytical Curves”, Thermochimica Acta
165, 273-280 (1990).
13. A. Pizzi and A. Stephanou, “Phenol - Formaldehyde Wood Adhesives under
Very Alkaline Conditions - Part I: Behaviour and Proposed Mechanism,”
Holzforschung 48, 35-40 (1994).
14. D.J. Francis and L.M. Yeddanapalli, “Kinetics and Mechanism of the Alkali
Catalysed Condensations of Di- and Tri-Methylol Phenols by Themselves
and with Phenol”, Die Makromolekulare Chemie 125, 119-125 (1969).
15. K.C. Eapen and L.M. Yeddanapalli, “Kinetics and Mechanism of the
Alkali-Catalysed Addition of Formaldehyde to Phenol and Substituted
Phenols”, Die Makromolekulare Chemie 119, 4-16 (1968).

88
Chapter 5
Cure Properties of Di-Methylol Phenols
5.1 Introduction
This chapter discusses the effects of NaOH on the cure properties for 2,4-DMP and
2,6-DMP. The effects of scan rate on the peak exotherm temperature Tp, the
fractional conversion αp at Tp and the total enthalpy of reaction ΔHT for DMP are
similar to those for MMP. Therefore, for brevity, these aspects will not be
discussed here.
The chapter begins with a brief review of self-condensation reactions of DMP,
followed by a discussion on the effects of NaOH on the shape of DSC curves and
the enthalpy of reactions ΔHT. The chapter then focuses on the effects of NaOH
content on the evolution of apparent activation energy Ea during the cure. Possible
mechanisms that operate during the cure are proposed.
5.2 Self-Condensation Reactions of DMP
Previous studies [1,2] have shown that self-condensation reactions of 2,4-DMP
may occur according to the following schemes:
CH2OH
OH
CH2OH
CH2OH
OH
CH2OH
+ CH2
CH2
OH
OHCH2 CH2OH
OH + H2O + CH2O
(p, p methylene linkage)
OH
CH2OH
CH2OH
OH H2O + CH2O+
(o, p methylene linkage)
Figure 5.1: Condensation reactions of 2,4-DMP.

89
These studies have suggested that whilst the CH2O produced by the above
condensation reactions may react with the compounds present to form minor
compounds, the trisubstituted 2,4,6-TMP was not observed. The para methylol
group may also react with the ortho aromatic proton to yield a minor compound
according to:
CH2OH
OH
CH2OH
CH2OH
OH
CH2OH
+ CH2
OH
CH2OH
CH2OH
OH H2O+
(o, p methylene linkage)
OHCH2
Figure 5.2: Minor condensation reaction of 2,4-DMP.
In contrast to the high number of condensation possibilities in the case of 2,4-DMP,
these studies have shown that the condensation of 2,6-DMP proceeds mainly via
the following reaction:
OH
CH2OH
+ CH2 + H2O
OH
CH2OH
CH2OH
OH
(o, p methylene linkage)
OHCH2
OH
CH2OHOHCH2
OHCH2
Figure 5.3: Condensation reaction of 2,6-DMP.
A small quantity of higher-order oligomer with three aromatic rings has also been
observed. This has been attributed to the reaction between 2,6-DMP and the
aromatic carbon in non-substituted para position of the dimer.
The reactivity of 2,6-DMP is also higher than that of 2,4-DMP. This is because the
para position is more reactive than the ortho position due to the facts that the para
quinoid resonating structure is more stable than the ortho structure and that the
para position is not hindered like the ortho position which is close to the phenate
oxygen [3-5]:

90
OCH2OH
O
CH2OH
CH2OH
Para quinoid structure
HOCH2
Ortho quinoid structure
Figure 5.4: Para and ortho quinoid structures of 2,6-DMP and 2,4-DMP.
In acidic or neutral conditions, both 2,4-DMP and 2,6-DMP form dimethylene
ether linkages [6]. The mechanism involves the reaction between two methylol
groups and the release of one molecule of water according to the following scheme:
CH2OH
+ CH2 + H2OOHOHCH2
O CH2
Figure 5.5: Dimethylene ether linkage formation.
It is generally accepted that methylene and ether linkages are formed
simultaneously and that ether formation becomes increasingly important as the
methylol content in the phenolic ring increases [7]. Under strong alkaline
conditions, ether formation is essentially, if not completely, eliminated [8].
5.3 DSC Thermograms
Figures 5.6 and 5.7 show the DSC thermograms for 2,4-DMP and 2,6-DMP,
respectively, obtained at 10 °C min-1 scan rate in the presence of varying amounts
of NaOH. Generally, the DSC curves for 2,4-DMP and 2,6-DMP consisted of
either a single, two or three observable exothermic peaks, depending on the level of
NaOH in the sample. This is in contrast to the cases of 2-MMP and 4-MMP that
exhibited single DSC peak for all levels of NaOH.

91
2,4-DMP
Temperature (οC)
40 60 80 100 120 140 160 180 200 220 240 260 280
Hea
t Flo
w E
ndo
Up
(mW
)
0
5
10
15
20
25
30
35
40
45
50
55
60
65
70
75
80
No NaOH0.15 NaOH0.30 NaOH0.45 NaOH0.60 NaOH0.75 NaOH1.00 NaOH
Figure 5.6: DSC thermograms for the self-condensation reactions of 2,4-DMP in the presence of varying NaOH : 2,4-DMP molar concentrations obtained at 10 °C min-1 scan rate.

92
2,6-DMP
Temperature (οC)
60 80 100 120 140 160 180 200 220 240 260 280
Hea
t Flo
w E
ndo
Up
(mW
)
0
5
10
15
20
25
30
35
40
45
50
55
60
65
70
75
80
No NaOH0.15 NaOH0.30 NaOH0.45 NaOH0.60 NaOH0.75 NaOH1.00 NaOH
Figure 5.7: DSC thermograms for the self-condensation reactions of 2,6-DMP in the presence of varying NaOH : 2,6-DMP molar concentrations obtained at 10 °C min-1 scan rate.
5.3.1 2,4-DMP and 2,6-DMP at molar ratios equal or less than 0.15
In the uncatalyzed condition, the compounds had a single exothermic peak at
211°C and 218°C for 2,4-DMP and 2,6-DMP, respectively. The broadness of the
peaks suggests a complex process and an overlapping of different reactions during

93
the cure. At the NaOH : DMP molar ratio of 0.15, the position of the peaks shifted
significantly to lower temperatures, approximately to 135°C for 2,4-DMP and to
145°C for the 2,6-DMP. Similar to the case of MMP, the shifting to lower
temperatures following the addition of NaOH may be a consequence of the
diffusivity of the peak, and does not necessarily imply that the cure of the
compounds was faster. There was also the appearance of a second peak at around
160°C for both compounds, which disappeared at higher NaOH levels. The first
peak is due to the condensation of the compounds to form methylene and ether
linkages [9,10]. This peak was broader for 2,4-DMP compared to 2,6-DMP,
probably due in part to the higher number of condensation possibilities for 2,4-
DMP. The second peak represents further reaction of the ether linkages, for
instance, to form methylene linkages and eliminate formaldehyde [9,10]. This
interpretation is supported by the disappearance of the second peak at higher NaOH
levels, reflecting the fact that the formation of ether linkages is very unlikely under
strong alkaline conditions. For the uncatalyzed samples, it is likely that similar
reactions involving the formation of ether linkages and their degradation also
occurred, but were not manifested in distinct signals due to the broadness of the
peak that encompassed a wide range of temperatures.
At molar ratios higher than 0.15, the DSC curves for both compounds changed
significantly, suggesting considerable changes in the effects of NaOH on various
condensation reactions of the compounds. Despite the similarities, there are certain
differences between the curves for 2,4-DMP and 2,6-DMP.
5.3.2 2,4-DMP at molar ratios higher than 0.15
For 2,4-DMP, the peak seemed to be broadened at molar ratios between 0.30 and
0.75 and a broad shoulder at about 153°C became evident at molar ratio of 0.75. At
the ratio of 1.00, there were two sharp peaks at about 143°C and 163°C. Similar to
the case of MMP, a sodium ring complex may form between the phenolic ring and
the ortho methylol group of 2,4-DMP. This would result in a decrease in the
capacity of the ortho methylol group to form methylene linkages, as well as a
reduction in the carbanion negative charge, which is the main driving force for the
condensation reactions [11]. For the condensation of 2,4-DMP, the effect of the

94
ring complex mechanism on the formation of (o,p) methylene linkages is likely to
be more severe than that of (p,p) methylene linkages. Further, at a particular level
of NaOH, only a proportion of ortho methylol groups are affected by the formation
of the ring complex. This would result in different reactivities of 2,4-DMP
molecules, depending on whether they are associated with Na+. Such variation in
the reactivity of 2,4-DMP, coupled with the different condensation possibilities,
may lead to the observed broadening of the DSC curves.
As the NaOH content increases, a higher proportion of ortho methylol groups are
blocked and a higher proportion of carbanion ions have less negative charge.
Where the NaOH content is sufficiently high, it would be more difficult for the
condensation reactions to occur. However, since most 2,4-DMP molecules are
affected to more or less the same extent in the presence of high levels of Na+, there
would be less variation in their reactivity and the corresponding DSC curve is
expected to be narrow. This is probably a reason for the sharp and distinct DSC
peaks as the molar ratio is 1.00. It is noted that the shoulder at about 153°C for the
sample with molar ratio of 0.75 seems to be the precursor for the second peak for
the sample with molar ratio of 1.00.
It may be that at molar ratio of 1.00, the cure process is affected not only by
chemical reactions, but also by the excessive amounts of Na+ and OH¯ ions that
may impose transport limitation on the reaction rates. This is probably a reason for
the relatively high onset temperature of the DSC curve for this sample. After the
initial formation of methylene linkages that gave rise to the first DSC peak, the
limitation on molecular mobility would become more severe, further delaying the
condensation reactions. Higher temperatures may help reduce the viscosity of the
medium and improve the mobility of reacting molecules [12]. Thus, the second
DSC peak observed for this sample may represent the regime where the
temperatures were sufficiently high for parts of unreacted 2,4-DMP molecules to
overcome the diffusion barrier and accelerate the reactions. The hypothesis of a
diffusion control mechanism and its effect on the extent of methylene linkage
formation is supported by the results for the apparent activation energy Ea and for
the enthalpy of reactions ΔHT, which will be discussed in 5.5 and 5.4, respectively.
95
There may be other explanations for the emergence of the second peak. One such
explanation is that the peak is due to the degradation of ether linkages. However,
this is very unlikely since the formation of ether linkages is insignificant, if not
eliminated, at high NaOH levels. There is also a possibility that the CH2O produced
by the condensation reactions may react at a later phase with the compounds
present, contributing to the second peak. It may be argued that the reactions of the
compounds with CH2O are favoured at strong alkaline conditions, hence the
emergence of the second peak only at high molar ratio of 1.00. However, the 2,6-
DMP sample with the same molar ratio also exhibited a similar second peak, but
there was no CH2O produced by its self-condensation reactions. Another possibility
is that the methylene linkages may undergo degradation reactions at higher
temperatures. However, this possibility seems to be inconsistent with the absence
of a corresponding degradation peak in other samples.
5.3.3 2,6-DMP at molar ratios higher than 0.15
In contrast to the case of 2,4-DMP, the DSC peak for 2,6-DMP was quite narrow at
molar ratios of 0.30 and 0.45. As discussed in 5.2, the condensation of 2,4-DMP
would proceed via both (p,p) and (o,p) positions, whereas those for 2,6-DMP
primarily via only (o,p) positions. As well, the reactivity of 2,6-DMP is known to
be higher than that of 2,4-DMP since the para position is more reactive than the
ortho position. The limited condensation possibilities and the higher reactivity of
2,6-DMP would give rise to narrower DSC curves compared to those for 2,4-DMP.
This is likely to be a reason for the narrowness of the curves at lower molar ratios
of 0.30 and 0.45, where the effect of NaOH was not significant.
At higher molar ratios, the peak became broadened and a broad shoulder at about
160°C emerged for the sample with molar ratio of 0.75. Similar to the case of 2,4-
DMP, the reactivity of 2,6-DMP molecules would be affected by the association
with Na+ that diminishes the capacity of the ortho methylol group to form
methylene linkages, as well as reducing the carbanion negative charge. Therefore,
the broadening of the DSC curves at higher molar ratios of 0.60 and 0.75 may be
explained in part by the variation in the reactivity of different 2,6-DMP molecules,
depending on whether they were associated with Na+. As well, although the

96
condensation reaction of 2,6-DMP to form dimers is limited to (o,p) methylene
linkages, these dimers can further react with 2,6-DMP at higher NaOH molar ratios
to form higher-order oligomers with three aromatic rings. The reaction rate to form
trimers for 2,6-DMP at higher molar ratios is much higher than that for 2,4-DMP
[3]. Such condensation possibilities for 2,6-DMP may also contribute to the
broadening of the peak at higher molar ratios.
The DSC curve for the sample with molar ratio of 1.00 was similar to that observed
for the corresponding 2,4-DMP sample, although the two peaks in this case were
sharper and more distinct at about 160°C and 180°C. The curve also had a
relatively higher onset temperature compared to others with lower NaOH content.
Similar to the case of 2,4-DMP, the condensation process in this case may be
complicated by diffusion limitation. As discussed previously, the limitation on
molecular diffusion could have the effect of delaying the condensation process of
2,6-DMP, and this effect would became more critical with an increasing extent of
cross-linking. Thus, after the initial condensation reactions that started at a
relatively high temperature as shown by the first DSC peak, there was a change in
mechanism from kinetic to diffusion control, which slowed down further reactions.
The second DSC peak may represent the regime where the temperatures were
sufficiently high for some of the unreacted molecules to overcome the diffusion
barrier and speed up the reactions. This hypothesis is supported by the results for
the apparent activation energy Ea and for the enthalpy of reactions ΔHT, which will
be discussed in 5.5 and 5.4, respectively.
5.4 Enthalpy of Reactions ΔHT
The effect of NaOH on ΔHT for both 2,4-DMP and 2,6-DMP are shown in Figure
5.8. It can be seen that in the uncatalyzed condition, ΔHT for 2,4-DMP was
approximately 500 J g-1. ΔHT steadily decreased with increase of NaOH level and
reduced to a value of 340 J g-1 at molar ratio of 1.00. For 2,6-DMP, the value of
ΔHT was about 530 J g-1 in the uncatalyzed condition and gradually decreased to

97
363 J g-1 at molar ratio of 0.45. ΔHT remained steady at this value until the molar
ratio reached 0.75, after which it decreased to 310 J g-1 at molar ratio of 1.00.
NaOH : DMP molar ratio
0.0 0.1 0.2 0.3 0.4 0.5 0.6 0.7 0.8 0.9 1.0
Ent
halp
y of
rea
ctio
n ( Δ
HT, J
g-1
)
250
300
350
400
450
500
5502,4-DMP2,6-DMP
2,4-DMP and 2,6-DMP
Figure 5.8: ΔHT as a function of NaOH : DMP molar ratio for 2,4-DMP and 2,6-DMP. Maximum error from the triplicate DSC runs was 0.5 %. Error bars are not included in the graph since they were close to the font size of the data points.
As discussed in the case of MMP, a decrease in ΔHT may be an indication of a
decrease in the extent of cross-linking. Indeed, as will be discussed in 5.5, the
activation energies of crosslinking reactions for both 2,4-DMP and 2,6-DMP
increased in the presence of NaOH. Therefore, it appears that the decrease in ΔHT
for both compounds as NaOH content was increased was due to lower amounts of
crosslinks being formed. This explanation is consistent with the hypothesis that at
high NaOH levels, the condensation process for both compounds was complicated
by diffusion control which had the effect of limiting molecular transport and
adversely affecting the extent of cross-linking. Samples with molar ratio of 1.00
appear to be most affected by the diffusion limitation with the lowest ΔHT.

98
Although higher temperatures facilitated the second phase of condensation
reactions, as suggested by the second DSC peak, it seems that this is not sufficient
to significantly improve the degree of cross-linking for these samples.
5.5 Effects of NaOH on the Evolution of Activation Energy
Ea
As described in Chapter 3, activation energy Ea for increasing extent of conversion
α was calculated according to the equation:
ln (Φ/Tα 2) = - Eα
/ RTα + ln (RA / Eα) 3.7
where Φ is the heating rate (°C min-1); Tα is the temperature to reach a given degree
of conversion, α; R is the universal gas constant (J mol-1 K-1); and A is the
frequency factor (s-1).
A graph of ln(Φ/Tα 2) versus 1/Tα should yield a straight line. The value for Eα can
be obtained from the slope of the linear graph.
For each NaOH : MMP molar ratio, thermograms were recorded at scanning rates
(5, 10, 15 and 20) oC min-1 in the range 25oC up to 250oC. The temperature (Tα) at
which a particular conversion (α) is reached shifts to higher temperatures as the
heating rate is increased. For each scan rate, the DSC Pyris version 3.52 software
was used to obtain the values of Tα for increasing values of α. Taking the sample
with NaOH : 2,4-DMP molar ratio of 0.45 as an example, Table 5.1 depicts the
values of Tα at the four scan rates. From these values the linear regression analysis
function of SigmaPlot version 7.1 (from SPSS Inc.) was used to generate linear
graphs of ln(Φ/Tα 2) vs. 1/Tα at a set confidence level of 95 %. Figure 5.9 shows the
linear regression graphs between α = 0.05 and α = 0.95 and the corresponding
square of the correlation coefficient (r2) values. The equations of the linear graphs
were then generated by the SigmaPlot software, from which the values of Eα at
different α could be manually calculated. Maximum error in Ea values obtained
from the triplicate DSC runs was 0.5 %.

99
Table 5.1: The DSC Pyris computer software generated values of Tα at four scan rates (for NaOH : 2,4-DMP molar ratio of 0.45) and the corresponding values for the dependent and independent variables for equation 3.7.
Conversion α
Scan rate Φ (°C min-1)
Tα (°C)
Tα (K)
(1/Tα) x 10-3 (K)
Ln ((Φ/ Tα)2)
0.05 5 98.459 371.659 2.690638462 13.44539145
10 107.72 380.92 2.625223144 14.18776385 15 113.12 386.32 2.588527645 14.62138228 20 116.549 389.749 2.565753857 14.92673816
0.10 5 104.608 377.808 2.646847076 13.47821017 10 114.148 387.348 2.581657837 14.22123212 15 118.98 392.18 2.549849559 14.65149204 20 121.82 395.02 2.531517392 14.95360507
0.20 5 111.9555 385.1555 2.59635394 13.51673221 10 121.66 394.86 2.53254318 14.25964764 15 126 399.2 2.50501002 14.68697529 20 129.176 402.376 2.485237688 14.99050622
0.30 5 117.388 390.588 2.560242506 13.5447445 10 126.638 399.838 2.50101291 14.28470402 15 131.508 404.708 2.470917303 14.71438184 20 134.515 407.715 2.452693671 15.01686908
0.40 5 121.743 394.943 2.532010948 13.56692081 10 130.748 403.948 2.475566162 14.30515741 15 135.729 408.929 2.445412284 14.73513329 20 138.842 412.042 2.42693706 15.03798285
0.50 5 125.055 398.255 2.510954037 13.58362292 10 134.302 407.502 2.453975686 14.32267677 15 139.327 412.527 2.424083757 14.75265352 20 141.862 415.062 2.409278614 15.05258809
0.60 5 128.384 401.584 2.490139049 13.60027137 10 137.695 410.895 2.433711776 14.33926051 15 142.731 415.931 2.404244935 14.76908896 20 145.27 418.47 2.389657562 15.06894268
0.70 5 131.622 404.822 2.47022148 13.61633284 10 141.019 414.219 2.41418187 14.35537473 15 146.115 419.315 2.384841945 14.78529506 20 148.871 422.071 2.369269625 15.08607937
0.80 5 135.602 408.802 2.446171985 13.63589977 10 145.138 418.338 2.390411581 14.37516453

100
15 150.485 423.685 2.360244049 14.80603071 20 153.279 426.479 2.344781337 15.10685853
0.90 5 139.722 412.922 2.421764885 13.65595534 10 150.018 423.218 2.362848461 14.39835992 15 155.006 428.206 2.335324587 14.82725898 20 157.975 431.175 2.319243926 15.12876035
0.95 5 143.609 416.809 2.39918044 13.67469408 10 154.219 427.419 2.339624584 14.41811469 15 159.094 432.294 2.313240526 14.84626203 20 162.299 435.499 2.296216524 15.14871727
2,4-DMP
1/Tα x 10-3 (K)
2.25 2.30 2.35 2.40 2.45 2.50 2.55 2.60 2.65 2.70 2.75 2.80 2.85
ln ( φ
/ T
α2 )
13.2
13.4
13.6
13.8
14.0
14.2
14.4
14.6
14.8
15.0
15.2
15.4α = 0.05; r2 = 0.999α = 0.10; r2 = 0.995α = 0.20; r2 = 0.994α = 0.30; r2 = 9.997α = 0.40; r2 = 0.998α = 0.50; r2 = 0.994α = 0.60; r2 = 0.994α = 0.70; r2 = 0.996α = 0.80; r2 = 0.996α = 0.90; r2 = 0.994α = 0.95; r2 = 0.993
Figure 5.9: Graph of ln(Φ/Tα 2) vs. 1/Tα between α = 0.05 and α = 0.95 and the
corresponding square of the correlation coefficient (r2) values for 2-MMP sample with NaOH : 2,4-DMP molar ratio of 0.45.
5.5.1 2,4-DMP
Figure 5.10 shows the effects of NaOH content on the evolution of apparent
activation energy Ea for 2,4-DMP as a function of the degree of conversion. Similar

101
to the case of MMP, there was a decrease in Ea in the initial cure stages for many
2,4-DMP samples, especially when fractional conversion was about 0.1 or less, due
to the diffusion effect. The following discussion focuses on the evolution of Ea
when conversion was higher than 0.10.
As can be seen in Figure 5.10, for the uncatalyzed sample, there was a steady rise
of Ea from about 90 kJ mol-1 as conversion was 0.15 to about 110 kJ mol-1 at the
end of the cure. The introduction of NaOH had the effect of increasing the Ea for all
samples, although there were clear differences amongst these samples. In
particular, for the sample with molar ratio of 0.15, Ea appeared to be steady at
about 103 kJ mol-1 up to conversion of 0.4. Thereafter, it gradually increased, and
when conversion was 0.8, it showed a rapid rise to about 140 kJ mol-1 and
remained there until the end of the cure process. For the sample with molar ratio of
0.30, the cure started off with a higher Ea of about 110 kJ mol-1, which appeared to
decrease somewhat to a value of about 102 kJ mol-1 at the end of the cure.
2,4-DMP
Conversion (α)
0.0 0.1 0.2 0.3 0.4 0.5 0.6 0.7 0.8 0.9 1.0
Act
ivat
ion
ener
gy (E
a, k
J m
ol-1
)
80
90
100
110
120
130
140
150
160
No NaOH0.15 NaOH0.30 NaOH0.45 NaOH0.60 NaOH0.75 NaOH1.00 NaOH
Figure 5.10: Effects of NaOH on the evolution of apparent activation energy Ea for 2,4-DMP as a function of the degree of conversion. Maximum error from the triplicate DSC runs was 0.5 %. Error bars are not included in the graph since they were close to the font size of the data points.

102
The pattern of Ea evolution changed significantly with a further increase in NaOH
content. For molar ratios between 0.45 and 0.75, Ea values increased with NaOH
content and with the degree of conversion. They started off at values between about
100 kJ mol-1 and kJ mol-1 and reached values between about 120 kJ mol-1 and 128
kJ mol-1 at the end of the cure. It is noted that, for molar ratio of 0.60, Ea had a
decreasing trend at conversions lower than 0.4 before starting to rise. This is in
contrast to the cases of molar ratios of 0.45 and 0.75 which had an increasing trend
for Ea from the beginning of the cure process. Reason for this anomalous behaviour
is not clear.
For molar ratio of 1.00, Ea rapidly rose to about 150 kJ mol-1 when conversion was
0.25. Thereafter, it gradually decreased with the increase in conversion to about
140 kJ mol-1 when the conversion reached about 0.8, at which point there was a
slight rise before rapidly decreasing again.
As discussed in the case of MMP, an increasing dependence of the activation
energy on conversion degree is characteristic of processes consisting of parallel
competing reactions. For the uncatalyzed sample, the rise in Ea with the increase in
fractional conversion may indicate a kinetic process involving contributions of
reactions to form (p,p) and (o,p) methylene linkages, as well as the dimethylene
ether linkages. It may be that at low conversions, the partial contributions of
reactions with lower Ea including the formation of ether and (p,p) methylene
linkages were predominant. As the cure proceeded, the contributions of the (o,p)
linkage reaction with higher Ea increased and that of the (p,p) linkage reaction
decreased. As discussed previously, given the wide range of temperatures
encompassed by the DSC curve, it is likely that the condensation reaction of the
ether linkages to form methylene linkages also contributed to the apparent Ea,
particularly towards the later phase of the cure.
It is expected that the activation energy of condensation reactions of 2,4-DMP
would increase with the addition of NaOH due to the formation of a sodium ring
complex between the phenolic ring and the ortho methylol group. This is generally
consistent with the observation that the higher the NaOH content, the higher the Ea
required. As discussed previously, the effect of the ring complex mechanism on the

103
formation of (o,p) methylene linkages is likely to be more severe than that of (p,p)
methylene linkages. Further, there would be a variation in the reactivity of 2,4-
DMP molecules at a particular NaOH level, depending on whether they are
associated with Na+. In this case, the increasing dependence of Ea on fractional
conversion for molar ratios of 0.45, 0.60 and 0.75 suggests: (i) decreasing
contributions of reactions with lower Ea, for instance, reactions between molecules
not affected by the ring complex to form (p,p) linkages; and (ii) increasing
contributions of reactions with higher Ea, for instance, reactions between molecules
affected by the ring complex to form (o,p) linkages. It is interesting that Ea for
samples with molar ratios of 0.15 and 0.30 did not follow this ascending trend, but
appeared relatively “flat”, suggesting that the partial contributions of individual
reactions in these cases were relatively constant throughout the whole cure process.
It is noted that the rapid rise of Ea towards the end of the cure in the case of molar
ratio of 0.15 represents the energy required for further reactions of the ether
linkages to form methylene linkages.
As suggested earlier, the condensation of 2,4-DMP is likely to be influenced by
diffusion limitation at molar ratio of 1.00. The diffusion limitation does not change
the identity of the reactions, but affects the reactions by involving a transport step
and imposing limitation on the rates of the reactions. It has been shown that
diffusion limitation causes a decrease of the apparent activation energy with
increasing extent of polymerisation [12]. Such a descending trend of Ea is evident
in this case after Ea reached the maximum value of about 150 kJ mol-1 at
conversion of 0.25. The slight rise in Ea at conversion of about 0.8 before resuming
the descending trend is consistent with the earlier suggestion that the temperature at
this point was sufficiently high to allow part of the unreacted 2,4-DMP molecules
to overcome the diffusion barrier and speed up the reactions.
5.5.2 2,6-DMP
Figure 5.11 shows the effects of NaOH content on the evolution of apparent
activation energy Ea for 2,6-DMP as a function of the degree of conversion. Similar
to previous cases, there was a decrease in Ea in the initial cure stages for most 2,6-
DMP samples, especially when fractional conversion was about 0.10 or less, due to

104
the diffusion effect. The following discussion focuses on the evolution of Ea when
conversion was higher than 0.10.
As can be seen in Figure 5.11, Ea for the uncatalyzed sample was relatively
constant at about 96 kJ mol-1 throughout the entire process, although there appeared
to be a slight decrease from fractional conversion of 0.8 onwards to a value of
about 91 kJ mol-1 at the end of the cure process. For the sample with molar ratio of
0.15, there was a steady increase of Ea from about 90 kJ mol-1 at conversion of 0.10
to about 104 kJ mol-1 as conversion reached 0.7. This is followed by a slight
decrease to about 100 kJ mol-1 at conversion of about 0.9, where there was a rapid
rise to about 122 kJ mol-1 at the end of the cure.
2,6-DMP
Conversion (α)
0.0 0.1 0.2 0.3 0.4 0.5 0.6 0.7 0.8 0.9 1.0
Act
ivat
ion
ener
gy (E
a, k
J m
ol-1
)
70
80
90
100
110
120
130
140
150
160
170
180
190No NaOH0.15 NaOH0.30 NaOH0.45 NaOH0.60 NaOH0.75 NaOH1.00 NaOH
Figure 5.11: Effects of NaOH on the evolution of apparent activation energy Ea for 2,6-DMP as a function of the degree of conversion. Maximum error from the triplicate DSC runs was 0.5 %. Error bars are not included in the graph since they were close to the font size of the data points.

105
Further increases of NaOH content generally had the effect of raising Ea in all
cases. For molar ratio of 0.30, Ea started off at about 110 kJ mol-1 at the beginning
of the cure and, but instead of having an ascending trend as in the case of molar
ratio of 0.15, it gradually decreased to reach a value of about 100 kJ mol-1 at the
end of the process. Ea for molar ratio of 0.45 also started at about 110 kJ mol-1, but
remained relatively steady at this value until conversion reached 0.7, after which it
gradually decreased to about 105 kJ mol-1 at the end of the cure.
Ea for the samples with molar ratios of 0.60 and 0.75 were about 122 kJ mol-1 at
conversion of 0.10. It appeared to have a descending trend with increase in
conversion, although such a descending trend of Ea was convoluted by the rises and
falls that corresponded to the emergence of small exotherms observed in the DSC
curves of these samples. For the sample with molar ratio of 1.00, Ea had an
ascending trend and reached a value of 180 kJ mol-1 at conversion of about 0.3
before starting a deep descending trend down to 80 kJ mol-1 when conversion
reached about 0.8. Thereafter, Ea rose rapidly to about 140 kJ mol-1 at conversion
of 0.95.
In the uncatalyzed state, the condensation of 2,6-DMP is likely to proceed mainly
via the formation of ether bridges and (o,p) methylene linkages. The “flat”
conversion dependence of Ea for the uncatalyzed sample suggests that the
condensation of 2,6-DMP was governed by constant contributions of these
reactions throughout the cure. This is consistent with the commonly accepted view
that methylene and ether linkages are formed simultaneously [7]. The slight and
gradual decrease in Ea from fractional conversion of 0.8 onwards may be due to
diffusion limitation, which could have some effect as the extent of cross-linking
increased. It is noted that a similar decrease in Ea towards the end of the cure was
also observed for samples added with NaOH.
The reactivity of 2,6-DMP molecules would be affected by the association with
Na+ that diminishes their capacity to proceed with condensation reactions.
However, as discussed previously, not all 2,6-DMP molecules would be affected
by the sodium ring complex, especially at lower levels of NaOH. The ascending
trend of Ea at molar ratio of 0.15 suggests that reactions between molecules not

106
affected by Na+ (i.e., with lower Ea) decreased their contributions and reactions
between molecules affected by Na+ (i.e., with higher Ea) and became more
dominant as fractional conversion increased. Similar to 2,4-DMP, the rapid rise of
Ea at conversion of 0.9 represents the energy required for further reactions of the
ether linkages to form methylene linkages.
At higher molar ratios, the extent of association between 2,6-DMP molecules and
Na+ is expected to increase. When most 2,6-DMP molecules are associated with
Na+, their reactivity would be more uniform. Given that at high molar ratios, the
major condensation reaction of 2,6-DMP is the formation of (o,p) methylene
linkages, such uniformity in 2,6-DMP reactivity would result in constant Ea
throughout the cure. This is perhaps the reason for the “flat” conversion
dependence of Ea at higher molar ratios of 0.30 and 0.45. Some effect of diffusion
limitation for both of these samples is also apparent as suggested by the descending
trend of Ea towards the end of cure. Note the more extensive effect for molar ratio
of 0.30, the reason for which is not clear.
Whilst not apparent from the DSC curves, diffusion limitation appears to prevail
from the early phase of the cure for molar ratios of 0.60 and 0.75, as suggested by
the descending conversion dependence of Ea. It seems that the excessive amounts
of Na+ and OH¯ ions were effective in imposing transport limitation on reacting
molecules, which became increasingly important as the condensation reactions
progressed. The rises and falls that convoluted the descending trend of Ea towards
the later phase of the cure of both molar ratios is probably due to the possibility
that parts of unreacted 2,6-DMP molecules gained sufficient energy at higher
temperatures to overcome the diffusion barrier and speed up the reactions.
A further increase of NaOH to 1.00 molar ratio exacerbated the effect of diffusion
limitation, as suggested by the higher onset temperature for the DSC curve. It is
possible that the diffusion of 2,6-DMP molecules to bring about chemical reactions
in the early phase of the cure was facilitated by high temperature, leading to the
observed ascending conversion dependence of Ea during this phase. As the
fractional conversion reached 0.3 where the cross-linking was more extensive,
diffusion control became more dominant, leading to the descending trend for Ea

107
with increase in the extent of conversion. Again, the rapid rise of Ea as conversion
reached 0.8 is presumably due to those unreacted 2,6-DMP molecules that could
overcome the diffusion barrier and accelerate the reactions.
5.6 Summary
A major focus of this chapter was to investigate the effects of NaOH content on the
evolution of apparent activation energy, Ea, during the cure of 2,4-DMP and 2,6-
DMP, as well as on total enthalpy of reaction, ΔHT. For 2,4-DMP, it was proposed
that at low conversions, partial contributions of reactions with lower Ea including
the formation of ether and (p,p) methylene linkages were predominant. As the cure
proceeded, the contributions of the (o,p) linkage reaction with higher Ea increased.
It was suggested that the addition of NaOH resulted in the formation of the sodium
ring complex, which diminished the capacity of the monomer to form methylene
linkages, particularly the (o,p) linkage. This was reflected in the rise of the Ea with
increase in NaOH content. At the high NaOH molar ratio of 1.00, it was proposed
that the condensation of 2,4-DMP was influenced by diffusion limitation
mechanism in the later stage of the cure, which became increasingly important as
the condensation reactions progressed and resulted in a descending trend of Ea. The
diminished capacity of 2,4-DMP to form methylene linkages was also reflected in
lower ΔHT values with increase in NaOH content.
For 2,6-DMP, the condensation was suggested to proceed mainly via the reactions
to form ether bridges and (o,p) methylene linkages with constant contributions of
these reactions throughout the cure. The sodium ring complex mechanism was also
suggested to operate in the case of 2,6-DMP which became more dominant with
increase in NaOH content. At higher NaOH content, ether bridges did not form and
the major condensation reaction of 2,6-DMP was the formation of (o,p) methylene
linkages, as reflected in constant Ea throughout the cure. In contrast to 2,4-DMP,
the diffusion limitation mechanism appeared to operate at lower NaOH content for
2,6-DMP, as suggested by the descending conversion dependence of Ea from the
early phase of the cure for molar ratios of 0.60 or above.

108
Further comparison of the effects of NaOH on the cure properties of 2,4-DMP and
2,6-DMP, as well as of MMP and TMP, will be presented in chapter 7.
5.7 References
1. M.F. Grenier-Loustalot, S. Larroque and P. Grenier, “Phenolic Resins: 4.
Self-Condensation of Methylolphenols in Formaldehyde-Free Media”,
Polymer 37(6), 955-964 (1996).
2. D.J. Francis and L.M. Yeddanapalli, “Kinetics and Mechanism of the Alkali
Catalysed Condensations of Di- and Tri-Methylol Phenols by Themselves
and with Phenol”, Die Makromolekulare Chemie 125, 119-125 (1969).
3. K.C. Eapen and L.M. Yeddanapalli, “Kinetics and Mechanism of the
Alkali-Catalysed Addition of Formaldehyde to Phenol and Substituted
Phenols”, Die Makromolekulare Chemie 119, 4-16 (1968).
4. M.F. Grenier-Loustalot, S. Larroque, D Grande and P. Grenier, “Phenolic
Resins: 2. Influence of Catalyst Type on Reaction Mechanisms and
Kinetics”, Polymer 37(8), 1363-1369 (1996).
5. M.F. Grenier-Loustalot, S. Larroque and P. Grenier, “Phenolic Resins: 1.
Mechanisms and Kinetics of Phenol and of the First Polycondensates
Towards Formaldehyde in Solution”, Polymer 35(14), 3045-3054 (1994).
6. E. Imoto and T. Kimura, J. Chem. Soc. Japan 53, 9-11 (1950).
7. R.W. Martin, The Chemistry of Phenolic Resins, J. Wiley, New York, 1956,
p. 134.
8. A. Knop and W. Scheib, Chemistry and Application of Phenolic Resins,
Springer-Verlag, New York, 1979, p. 44.
9. T. Holopainen, L. Alvila, J. Rainio and T.T. Pakkanen, “Phenol-
Formaldehyde Resol Resins Studied by 13C-NMR Spectroscopy, Gel
Permeation Chromatography, and Differential Calorimetry”, J. Appl.
Polym. Sci. 66, 1183-1193 (1997).

109
10. P. Luukko, L. Alvila, T. Holopainen, J. Rainio and T.T. Pakkanen, “Effect
of Alkalinity on the Structure of Phenol-Formaldehyde Resol Resins”, J.
Appl. Polym. Sci. 82, 258-262 (2001).
11. B.D. Park, B. Riedl, Y.S. Kim and W.T. So, “Effect of Synthesis
Parameters on Thermal Behaviour of Phenol-Formaldehyde Resol Resin”,
J. Appl. Polym. Sci 83, 1415-1424 (2002).
12. S.V. Vyazovkin, “On the Phenomenon of Variable Activation Energy for
Condensed Phase Reactions”, New J. Chem. 24, 913-917 (2000).
13. A.O. Barry, W. Peng and B. Riedl, “The Effect of Lignin Content on the
Cure Properties of Phenol-Formaldehyde Resin as Determined by
Differential Scanning Calorimetry”, Holzforschung 47, 247-252 (1993).
14. J.S.M. Kazayawoko, B. Riedl, J. Poliquin, A.O. Barry and L.M. Matuana,
“A Lignin-Phenol-Formaldehyde Binder for Particle Board Part 1. Thermal
Characteristics”, Holzforschung 46, 257-262 (1992).
15. R.T. Jones, “The Condensation of Trimethylol Phenol”, J. Polym. Sci. 21,
1801 (1983).
16. P.W. King, R.H. Mitchell, and A.R. Westwood, “Structural Analysis of
Phenolic Resole Resins”, J. Appl. Polym. Sci. 18, 1117-1130 (1974).
17. T.H. Goswami and M.M. Naiti, “The Characterization of Trimethylol
Phenol by Thermal Analysis”, Thermochimica Acta 197, 453-462 (1992).

110
Chapter 6
Cure Properties of Tri-Methylol Phenols
6.1 Introduction
This chapter discusses the effects of NaOH on the cure properties for TMP. The
effects of scan rate on the peak exotherm temperature Tp, the fractional conversion
αp at Tp and the total enthalpy of reactions ΔHT for TMP are similar to those for
MMP. Therefore, for brevity, these aspects will not be discussed here.
The structure of this chapter is similar to that of chapter 5. It begins with a brief
review of self-condensation reactions of TMP, followed by a discussion on the
effects of NaOH on the DSC curves and the enthalpy of reactions ΔHT. The
discussion then focuses on the effects of NaOH content on the evolution of
apparent activation energy Ea during the cure. Possible mechanisms that operate
during the cure are proposed.
6.2 Self-condensation reactions of TMP
Previous studies [1,2] have shown that self-condensation reactions of 2,4-DMP
may occur according to the following schemes:

111
OH
CH2OH
CH2 + H2O
CH2OH
CH2OH
OH
(p, p methylene linkage)
OHCH2
OHCH2
CH2OH
2 x
OHCH2
HO + CH2O
CH2 + H2O
CH2OH
CH2OHHO
(o, p methylene linkage)
OHCH2
OHCH2
HO + CH2O
Figure 6.1: Condensation reactions of TMP.
Despite the larger number of methylol groups in the ortho position, the formation
of (p,p) methylene linkage involving condensation between two methylol groups in
the para position is favoured, compared to (o,p) methylene linkage. Higher-order
oligomer with three aromatic rings may also be formed from the methylol group in
the para position of compound with (o,p) methylene linkage:
CH2
CH2
CH2OHHOOHCH2
OHCH2
HO
OH
CH2OH
OHCH2
Figure 6.2: Chemical structure of trimer following condensation reactions of TMP.
The methylol groups on TMP are more reactive towards themselves compared to
those on MMP and DMP. Jones [3] has shown that the condensation rate of TMP
reaches a maximum near pH 8.5 and decreases with increasing pH.

112
Ether linkages are formed under slightly acidic and neutral conditions. Because of
the high methylol content, ether formation is likely to be more important for TMP,
compared to MMP and DMP [4]. Quinone methides are also formed in the
presence of acid or alkaline catalyst [5]. As with MMP and DMP, the stability of
ether linkages is limited up to about 160°C, beyond which they decompose to
methylene linkages [4, 6, 7].
6.3 DSC Thermograms
Figure 6.3 shows the DSC thermograms for TMP obtained at 10 °C min-1 scan rate
in the presence of varying amounts of NaOH. It can be seen that the DSC curve for
the uncatalyzed sample was quite broad, encompassing the temperature range
between about 90°C and 160°C. A similar DSC curve was also observed for the
sample with molar ratio of 0.15. The broadness of the curves suggests a complex
process and an overlapping of different reactions during the cure. As discussed
above, the formation of ether bridges, (p,p) and (o,p) methylene linkages are major
condensation reactions of TMP. Further increases of NaOH content had significant
effect on the shape of the DSC curves. At molar ratio of 0.45, the curve became
narrower with a sharp peak at about 147°C and a smaller peak at about 137°C. As
the molar ratio was increased to 0.60, the smaller peak disappeared and the curve
had a single peak at about 137°C that was even sharper compared to that of 0.45
molar ratio. At molar ratio of 0.75, this peak was still present at about 130°C, but
there was an additional small exotherm with peak at 146°C. Although further
increase of NaOH to 1.00 molar ratio appeared to enhance the significance of the
exotherm at 146°C, the sharp peak at about 130°C did not seem to change.
The similarity between the DSC curves of the uncatalyzed sample and the sample
with molar ratio of 0.15 suggests that this level of NaOH did not have significant
influence on the cure properties of TMP. As will be seen in the analysis of the
apparent activation energy Ea in 6.5, diffusion limitation appears to be an important
mechanism in the condensation of TMP for both samples. This is in contrast to the
case of DMP, where the effect of diffusion limitation was only apparent at much
higher NaOH content. The importance of diffusion limitation for TMP samples,

113
even in the uncatalyzed condition, may be due to the higher concentration of
methylol groups in TMP that would give rise to a higher degree of molecular
branching, and higher amounts of ether and methylene linkages, hence a bulkier
and more rigid structure.
TMP
Temperature (οC)
50 60 70 80 90 100 110 120 130 140 150 160 170 180 190 200
Hea
t Flo
w E
ndo
Up
(mW
)
0
10
20
30
40
50
60
70
80
90
100
110
120
130
No NaOH0.15 NaOH0.45 NaOH0.60 NaOH0.75 NaOH1.00 NaOH
Figure 6.3: DSC thermograms for the self-condensation reactions of TMP in the presence of varying NaOH : TMP molar concentrations obtained at 10 °C min-1 scan rate.

114
The narrowing of the curve with the emergence of two peaks at 0.45 molar ratio
suggests that the condensation reactions were shifted to higher temperatures at this
NaOH level. This is probably due to the association between Na+ and TMP which
could slow down the condensation reactions of TMP, particularly those involving
the ortho methylol groups. The two peaks in the curve may represent the different
reactivities of TMP molecules, depending on whether they are associated with Na+,
and the different condensation possibilities. The early peak at 137°C is probably
due to (p,p) methylene linkage formation, which is expected to be least affected by
Na+. Some (o,p) methylene linkages could also be formed from TMP molecules not
affected by Na+ at this stage. The sharp peak at about 147°C may be due mainly to
reactions between TMP molecules affected by Na+ to form (o,p) methylene
linkages. As will be seen in 6.4 and 6.5, the effect of diffusion limitation was also
prominent at 0.45 molar ratio.
At higher molar ratio of 0.60, the delaying effect of Na+ is expected to be more
severe. This may be a reason for the disappearance of the lower temperature peak.
The sharp single DSC peak at 137°C for the entire cure process suggests that the
condensation was most effective within a narrow range of temperatures. At this
NaOH level, it is possible that most TMP molecules would be affected by Na+ and
the differences in their reactivity become less significant. Although the sharp peak
still persisted at higher molar ratios, the exotherm with peak at 146°C seemed to
increase its significance with increase in NaOH from (0.75 to 1.00) molar ratio. It
may be that at these high NaOH levels, the condensation reactions that gave rise to
the sharp peak were ineffective and that the exotherm at 146°C is due to reactions
of residual TMP molecules which could overcome the diffusion barrier at higher
temperatures. These issues will be further explored in 6.4 and 6.5.
6.4 Enthalpy of Reactions ΔHT
The effect of NaOH on ΔHT for TMP is shown in Figure 6.4. It can be seen that
ΔHT for TMP was approximately 365 J g-1 in the uncatalyzed condition and slightly
increased to about 372 J g-1 at molar ratio of 0.15. Increasing the NaOH molar ratio

115
to 0.45 had the effect of increasing ΔHT to a value of 420 J g-1. Thereafter, ΔHT
increased more slowly and reached a value of 435 J g-1 at molar ratio of 1.00.
TMP
NaOH : 2,4,6-TMP
0.0 0.1 0.2 0.3 0.4 0.5 0.6 0.7 0.8 0.9 1.0
Ent
halp
y of
rea
ctio
n ( Δ
ΗΤ,
J g
-1)
350
360
370
380
390
400
410
420
430
440
4502,4,6-TMP
Figure 6.4: ΔHT as a function of NaOH : TMP molar ratio for TMP Maximum error from the triplicate DSC runs was 0.5 %. Error bars are not included in the graph since they were close to the font size of the data points.
As discussed previously, an increase in ΔHT may indicate that the extent of cross-
linking is higher. All the cured samples appeared glassy, rigid and were not
affected when immersed in acetone and/or methanol, suggesting that the samples
reached a fully cured state at the end of the cure process. Therefore, it is unlikely
that the difference in the extent of cross-linking between the samples, if any, would
contribute significantly to the increase in ΔHT as NaOH content was increased.
Rather, as will be discussed in 6.5, such change in ΔHT with NaOH content is
likely due to the increase in the activation energies of cross-linking reactions for
TMP as NaOH content was increased.
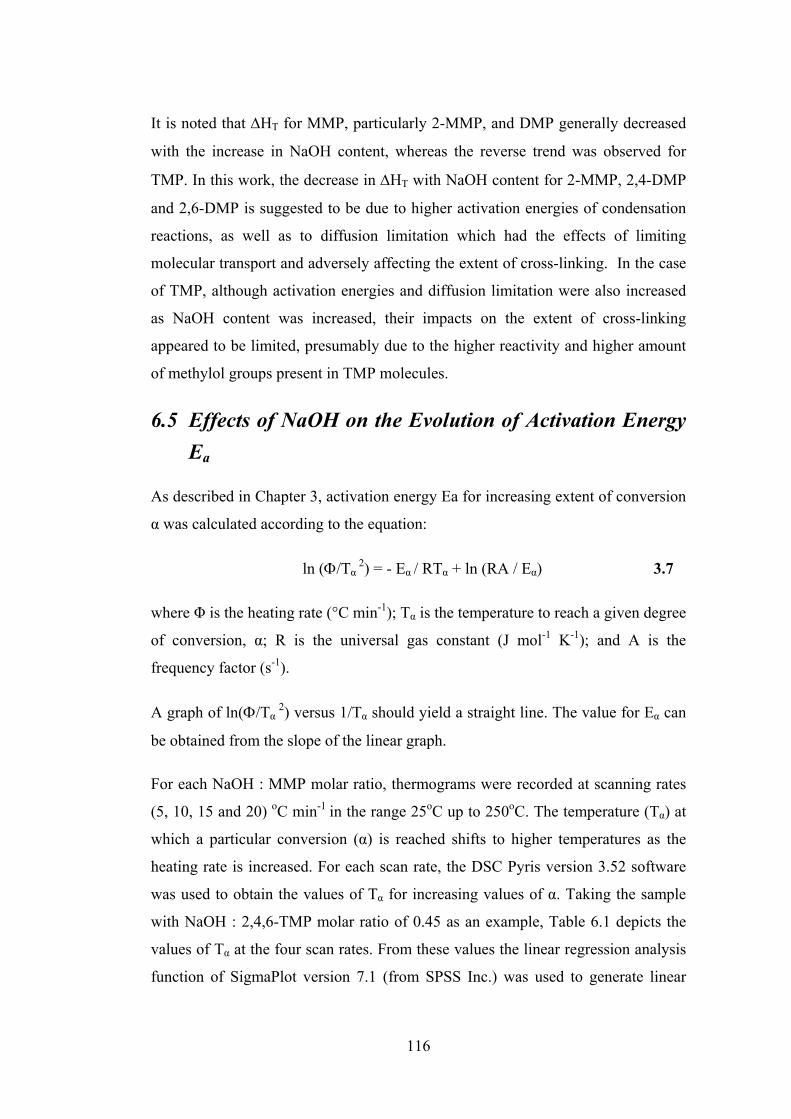
116
It is noted that ΔHT for MMP, particularly 2-MMP, and DMP generally decreased
with the increase in NaOH content, whereas the reverse trend was observed for
TMP. In this work, the decrease in ΔHT with NaOH content for 2-MMP, 2,4-DMP
and 2,6-DMP is suggested to be due to higher activation energies of condensation
reactions, as well as to diffusion limitation which had the effects of limiting
molecular transport and adversely affecting the extent of cross-linking. In the case
of TMP, although activation energies and diffusion limitation were also increased
as NaOH content was increased, their impacts on the extent of cross-linking
appeared to be limited, presumably due to the higher reactivity and higher amount
of methylol groups present in TMP molecules.
6.5 Effects of NaOH on the Evolution of Activation Energy Ea
As described in Chapter 3, activation energy Ea for increasing extent of conversion
α was calculated according to the equation:
ln (Φ/Tα 2) = - Eα
/ RTα + ln (RA / Eα) 3.7
where Φ is the heating rate (°C min-1); Tα is the temperature to reach a given degree
of conversion, α; R is the universal gas constant (J mol-1 K-1); and A is the
frequency factor (s-1).
A graph of ln(Φ/Tα 2) versus 1/Tα should yield a straight line. The value for Eα can
be obtained from the slope of the linear graph.
For each NaOH : MMP molar ratio, thermograms were recorded at scanning rates
(5, 10, 15 and 20) oC min-1 in the range 25oC up to 250oC. The temperature (Tα) at
which a particular conversion (α) is reached shifts to higher temperatures as the
heating rate is increased. For each scan rate, the DSC Pyris version 3.52 software
was used to obtain the values of Tα for increasing values of α. Taking the sample
with NaOH : 2,4,6-TMP molar ratio of 0.45 as an example, Table 6.1 depicts the
values of Tα at the four scan rates. From these values the linear regression analysis
function of SigmaPlot version 7.1 (from SPSS Inc.) was used to generate linear

117
graphs of ln(Φ/Tα 2) vs. 1/Tα at a set confidence level of 95 %. Figure 5.9 shows the
linear regression graphs between α = 0.05 and α = 0.95 and the corresponding
square of the correlation coefficient (r2) values. The equations of the linear graphs
were then generated by the SigmaPlot software, from which the values of Eα at
different α could be manually calculated. Maximum error in Ea values obtained
from the triplicate DSC runs was 0.5 %.
Table 6.1: The DSC Pyris computer software generated values of Tα at four scan rates (for NaOH : 2,4,6-TMP molar ratio of 0.45) and the corresponding values for the dependent and independent variables for equation 3.7.
Conversion
α Scan rate Φ (°C min-1)
Tα (°C)
Tα (K)
(1/Tα) x 10-3 (K)
Ln (Φ/ Tα2)
0.05 5 94.8 368 2.7174 13.425604
10 102.083 375.283 2.6647 14.157946 15 106.842 380.042 2.6313 14.588614 20 110.369 383.569 2.6071 14.894771
0.10 5 103.797 376.997 2.6525 13.473912 10 110.764 383.964 2.6044 14.203683 15 114.925 388.125 2.5765 14.630705 20 118.25 391.45 2.5546 14.935448
0.20 5 115.69 388.89 2.5714 13.536031 10 122.454 395.654 2.5275 14.263665 15 126.035 399.235 2.5048 14.687151 20 128.322 401.522 2.4905 14.986257
0.30 5 124.135 397.335 2.5168 13.578997 10 130.851 404.051 2.4749 14.305667 15 134.692 407.892 2.4516 14.730055 20 137.156 410.356 2.4369 15.029782
0.4 5 128.818 402.018 2.4875 13.602432 10 136.006 409.206 2.4438 14.331022 15 139.828 413.028 2.4211 14.755081 20 142.51 415.71 2.4055 15.055708
0.50 5 132.032 405.232 2.4677 13.618357 10 140.032 413.232 2.4199 14.350603 15 144.108 417.308 2.3963 14.775699 20 147.005 420.205 2.3798 15.077218
0.60 5 135.882 409.082 2.4445 13.637269 10 143.836 417.036 2.3979 14.36893 15 148.43 421.63 2.3717 14.796307 20 151.672 424.872 2.3537 15.099308

118
0.70 5 139.193 412.393 2.4249 13.653391
10 146.639 419.839 2.3819 14.382328 15 151.504 424.704 2.3546 14.810835 20 154.573 427.773 2.3377 15.112918
0.80 5 142.008 415.208 2.4084 13.666997 10 149.142 422.342 2.3677 14.394216 15 154.295 427.495 2.3392 14.823935 20 157.507 430.707 2.3218 15.126588
0.90 5 145.348 418.548 2.3892 13.683021 10 154.144 427.344 2.34 14.417764 15 159.755 432.955 2.3097 14.849318 20 163.275 436.475 2.2911 15.153194
0.93 5 147.713 420.913 2.3758 13.69429 10 154.858 428.058 2.3361 14.421102 15 162.9 436.1 2.2931 14.863793 20 166.836 440.036 2.2725 15.169445
TMP
1/Tα x 10-3 (K)
2.25 2.30 2.35 2.40 2.45 2.50 2.55 2.60 2.65 2.70 2.75 2.80 2.85 2.90
ln( φ
/ T
α2 )
13.2
13.4
13.6
13.8
14.0
14.2
14.4
14.6
14.8
15.0
15.2
15.4α = 0.05; r2 = 0.999α = 0.10; r2 = 0.999α = 0.20; r2 = 0.997α = 0.30; r2 = 0.999α = 0.40; r2 = 0.998α = 0.50; r2 = 0.998α = 0.60; r2 = 0.999α = 0.70; r2 = 0.997α = 0.80; r2 = 0.998α = 0.90; r2 = 0.997α = 0.93; r2 = 0.986
Figure 6.5: Graph of ln(Φ/Tα
2) vs. 1/Tα between α = 0.05 and α = 0.93 and the corresponding square of the correlation coefficient (r2) values for 2,4,6-TMP sample with NaOH : 2,4,6-TMP molar ratio of 0.45.
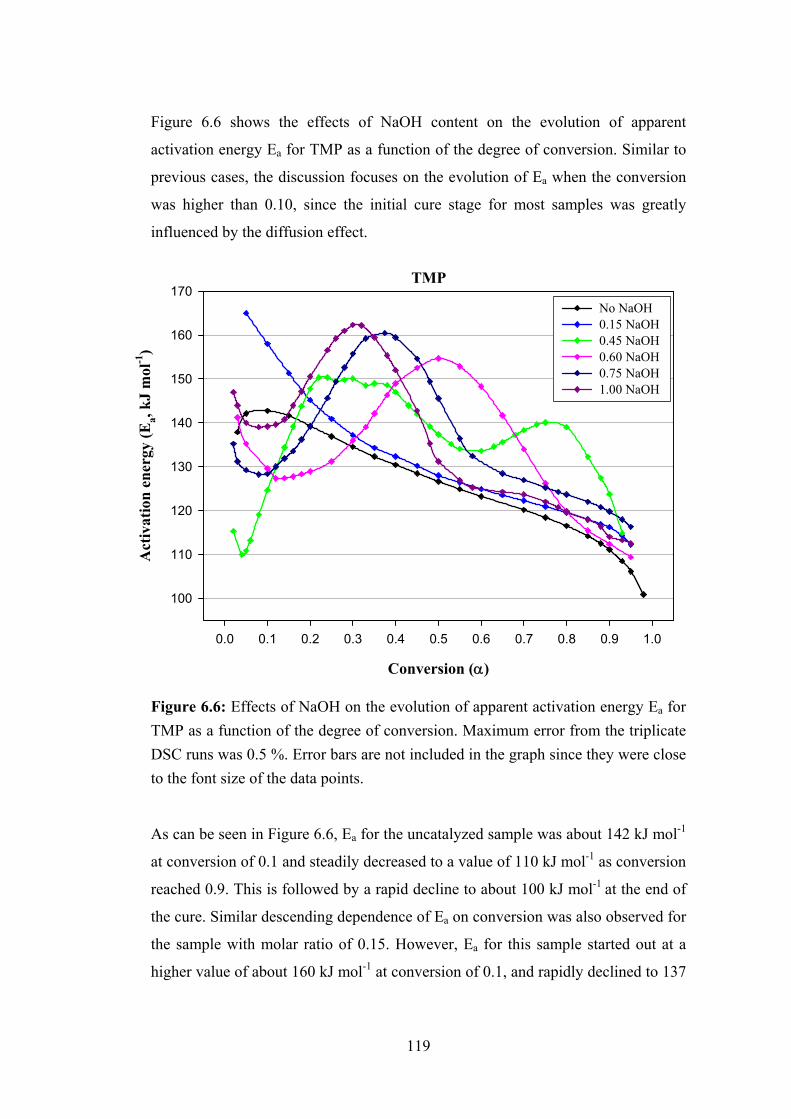
119
Figure 6.6 shows the effects of NaOH content on the evolution of apparent
activation energy Ea for TMP as a function of the degree of conversion. Similar to
previous cases, the discussion focuses on the evolution of Ea when the conversion
was higher than 0.10, since the initial cure stage for most samples was greatly
influenced by the diffusion effect.
TMP
Conversion (α)
0.0 0.1 0.2 0.3 0.4 0.5 0.6 0.7 0.8 0.9 1.0
Act
ivat
ion
ener
gy (E
a, kJ
mol
-1)
100
110
120
130
140
150
160
170No NaOH0.15 NaOH0.45 NaOH0.60 NaOH0.75 NaOH1.00 NaOH
Figure 6.6: Effects of NaOH on the evolution of apparent activation energy Ea for TMP as a function of the degree of conversion. Maximum error from the triplicate DSC runs was 0.5 %. Error bars are not included in the graph since they were close to the font size of the data points.
As can be seen in Figure 6.6, Ea for the uncatalyzed sample was about 142 kJ mol-1
at conversion of 0.1 and steadily decreased to a value of 110 kJ mol-1 as conversion
reached 0.9. This is followed by a rapid decline to about 100 kJ mol-1 at the end of
the cure. Similar descending dependence of Ea on conversion was also observed for
the sample with molar ratio of 0.15. However, Ea for this sample started out at a
higher value of about 160 kJ mol-1 at conversion of 0.1, and rapidly declined to 137

120
kJ mol-1 at conversion of 0.3. Thereafter, the rate of decline was similar to that of
the uncatalyzed sample, although Ea values were slightly higher.
The dependence of Ea on conversion degree changed dramatically with further
increases of NaOH content. For molar ratio of 0.45, Ea had a value of about 125 kJ
mol-1 at 0.1 conversion and rapidly rose to the maximum value of 150 kJ mol-1 at
0.2 conversion. It appeared to remain steady at this value until conversion reached
0.4. At this point, Ea started to decline to about 133 kJ mol-1 at 0.6 conversion, and
then rose to 140 kJ mol-1 at 0.8 conversion before declining rapidly to 114 kJ mol-1
at the end of the cure.
For the sample with molar ratio of 0.60, Ea was about 127 kJ mol-1 at 0.1
conversion and steadily rose to the maximum value of 155 kJ mol-1 at 0.5
conversion. After reaching the maximum value, Ea gradually declined to about 110
kJ mol-1 at the end of the cure. It is noted that the maximum Ea for this sample was
higher and was reached at a later phase in the cure, compared to the maximum Ea
for molar ratio of 0.45.
The shape of the conversion dependence of Ea for molar ratios of 0.75 and 1.00 was
similar to that for molar ratio of 0.60. However, for these samples, the rise of Ea
seemed to be more rapid with higher maximum value and the descending
dependence also occurred at earlier stages in the cure. In particular, for molar ratio
of 0.75, Ea started to rise from the beginning of the cure and reached a value of
about 161 kJ mol-1 at conversion close to 0.4 before starting to decline. For higher
molar ratio of 1.00, the maximum Ea was 162 kJ mol-1 and this value was reached
at lower conversion of 0.3. The decline of Ea for these samples proceeded in two
stages. The first stage was relatively rapid, whereas the second stage which started
at conversions of about 0.5 – 0.6 was much slower. It is noted that the decline for
molar ratio of 1.00 was convoluted by a slight rise in Ea at conversions of about 0.7
– 0.8 which corresponds to the exotherm with peak at 146°C in the respective DSC
curve.
In the uncatalyzed state, the condensation of TMP is likely to proceed via a range
of reactions including the formation of ether bridges, (p,p) and (o,p) methylene

121
linkages. However, instead of having an ascending dependence on conversion as
in the cases of 2-MMP and 2,4-DMP (see 4.4.1 and 5.5.1, respectively), or a “flat”
dependence as in the cases of uncatalyzed 2,6-DMP (see 5.5.2), Ea for this sample
exhibited a descending trend with conversion. A descending dependence of Ea on
conversion was also observed for uncatalyzed 4-MMP, which is suggested to be
due to consecutive reactions, starting with the self-condensation reaction with
higher activation energy, followed by the addition reaction of the product CH2O to
4-MMP with lower activation energy (see 4.4.2). In the case of uncatalyzed TMP,
diffusion limitation is likely to have a major role in bringing about the observed
descending trend of Ea. Indeed, the higher concentration of methylol groups in
TMP, compared to those in MMP and DMP, is expected to give rise to higher
degree of molecular branching, as well as higher amounts of ether and methylene
linkages. Therefore, as the condensation progressed, the polymeric structure would
become bulkier and more rigid, thus limiting molecular transport and providing
steric hindrances which would shield internal methylol groups from further
reactions [8-10]. It is noted that although the condensation reactions of TMP
produce CH2O, addition reaction of CH2O to TMP is not possible.
The similarity between Ea evolution of the uncatalyzed sample and that of the
sample with molar ratio of 0.15 suggests that the addition of NaOH to this level did
not have a significant effect. However, as discussed above, there were considerable
changes in Ea evolution at molar ratios of 0.45 or higher. It is important that these
changes be considered in conjunction with the changes in the respective DSC
curves. In particular, the shape of the DSC curves at molar ratio of 0.45 or higher
suggests that the condensation reactions were shifted to higher temperatures at
these NaOH levels. This can be seen in Figure 6.7 which shows the fractional
conversion as a function of temperature for TMP samples with various NaOH
molar ratios.
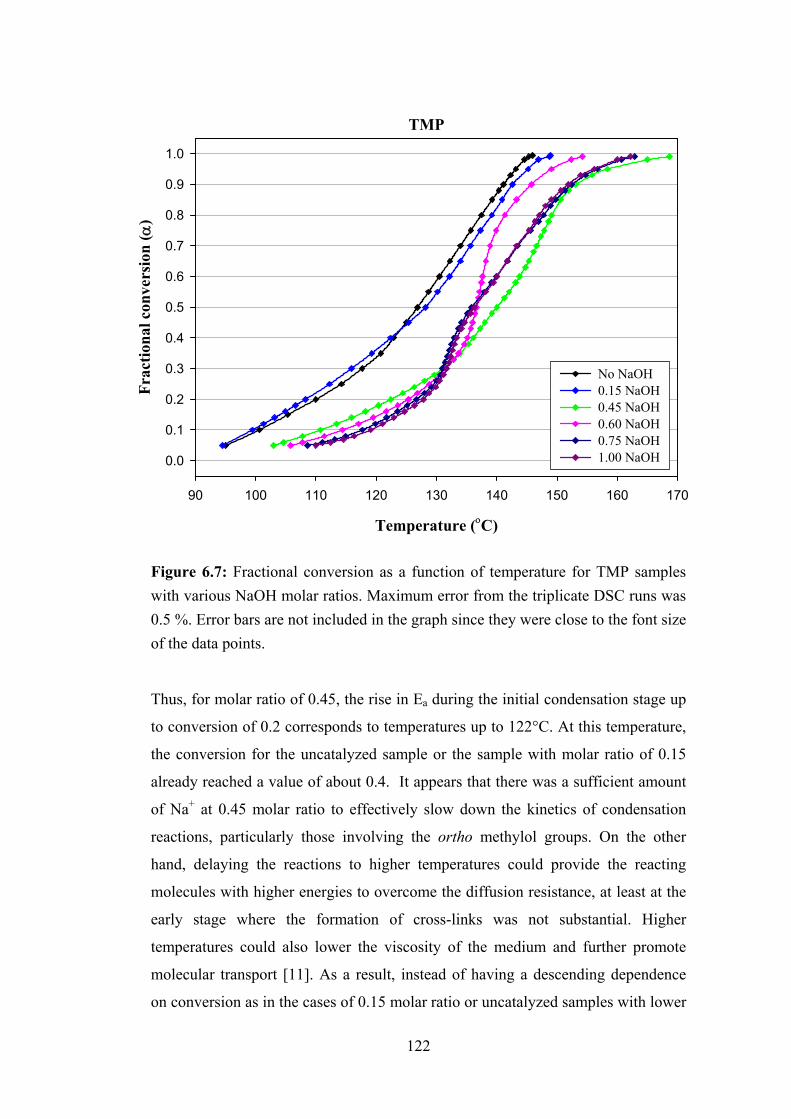
122
TMP
Temperature (οC)
90 100 110 120 130 140 150 160 170
Frac
tiona
l con
vers
ion
( α)
0.0
0.1
0.2
0.3
0.4
0.5
0.6
0.7
0.8
0.9
1.0
No NaOH0.15 NaOH0.45 NaOH0.60 NaOH0.75 NaOH1.00 NaOH
Figure 6.7: Fractional conversion as a function of temperature for TMP samples with various NaOH molar ratios. Maximum error from the triplicate DSC runs was 0.5 %. Error bars are not included in the graph since they were close to the font size of the data points.
Thus, for molar ratio of 0.45, the rise in Ea during the initial condensation stage up
to conversion of 0.2 corresponds to temperatures up to 122°C. At this temperature,
the conversion for the uncatalyzed sample or the sample with molar ratio of 0.15
already reached a value of about 0.4. It appears that there was a sufficient amount
of Na+ at 0.45 molar ratio to effectively slow down the kinetics of condensation
reactions, particularly those involving the ortho methylol groups. On the other
hand, delaying the reactions to higher temperatures could provide the reacting
molecules with higher energies to overcome the diffusion resistance, at least at the
early stage where the formation of cross-links was not substantial. Higher
temperatures could also lower the viscosity of the medium and further promote
molecular transport [11]. As a result, instead of having a descending dependence
on conversion as in the cases of 0.15 molar ratio or uncatalyzed samples with lower

123
onset temperatures, Ea for 0.45 molar ratio sample exhibited an ascending trend up
to conversion of 0.2 and appeared to remain steady until the conversion reached
0.4. This stage corresponds to the early peak at about 137°C in the DSC curve of
the sample. It is likely that during this stage, the more reactive TMP molecules
were those not associated with or affected by Na+ and the predominant reaction was
the formation of (p,p) methylene linkages.
As the extent of crosslink formation increases, the effect of diffusion limitation is
expected to be more severe, thus imposing considerable limitation on molecular
transport. This is probably the reason for the descending trend of Ea from
conversions of 0.4 to 0.6. The second rise in Ea from conversions of 0.6 to 0.8 may
represent the regime where the temperatures were sufficiently high for unreacted
TMP molecules to overcome the diffusion barrier. The predominant reactions
during this stage may be the formation of (o,p) methylene linkages by TMP
molecules which were affected by Na+.
Figure 6.7 also shows that the condensation reactions for 0.60 molar ratio were not
as effective as those for 0.45 molar ratio in the initial stage up to about 133°C. The
slowing down of the condensation during this stage is probably due to the enhanced
association between TMP molecules and Na+ at higher molar ratio. However, from
about 133°C onwards, the reactions became much more rapid and the conversion
reached 0.8 at about 141°C. It can be seen in Figure 6.7 that this narrow
temperature range corresponds to the rise and fall of Ea between conversions of 0.3
and 0.8. The rise is likely due to condensation reactions with increasing
contributions from those with higher activation energies and the fall due to the
increasing effect of diffusion limitation as condensation reactions progressed. As
discussed in 6.3, the fact that the reactions were most effective within a relatively
narrow range of temperatures suggests that at this NaOH level, most TMP
molecules were affected by Na+ and the differences in their reactivity were not as
significant as in the case of 0.45 molar ratio.
Further increases of NaOH to molar ratios of 0.75 and 1.00 seemed to enhance the
delaying effect of Na+, as can be seen in Figure 6.7 where conversions up to about
130°C for these samples were lower than those for 0.60 molar ratio. However,

124
condensation reactions were much more rapid from 130°C to 135°C with
conversion rising from 0.30 to 0.50 within this temperature range. It is possible that
some TMP molecules that had been shielded from reactions in the earlier phase
gained sufficient energies to react at this stage. The higher energies required for
reactions are reflected in the higher Ea for these molar ratios shown in Figure 6.6.
The rise in Ea up to conversion of 0.3 - 0.4 is attributed to the increasing
importance of reactions with higher activation energies, whereas the subsequent
descending trend up to conversion of about 0.5, to increasing effect of diffusion
limitation.
The condensation up to conversion of about 0.5 corresponds to the sharp peak in
the DSC curves of these samples, shown in Figure 6.3. It can also be seen in Figure
6.3 that in addition to the sharp peak, the DSC curves of these samples showed an
exotherm with peak at 146°C, which was not present in the case of 0.60 molar
ratio. As suggested in 6.3, it may be that the effect of NaOH was much more severe
at molar ratios of 0.75 and 1.00 such that the reactions that gave rise to the sharp
peak did not condense all TMP molecules and that the emergence of the subsequent
exotherm is due to condensation reactions of residual TMP molecules which could
overcome the diffusion barrier at higher temperatures. These reactions proceeded at
a slower rate than the preceding condensation stage, as suggested by the change in
the slope of the respective curves shown in Figure 6.7, and were affected by
increasing contribution from diffusion limitation, as suggested by the descending
trend of Ea from conversion of about 0.5 to the end of the cure shown in Figure 6.6.
6.6 Summary
This chapter focused on the effects of NaOH content on the evolution of apparent
activation energy, Ea, during the cure of TMP, as well as on total enthalpy of
reaction, ΔHT. It was proposed that in the uncatalysed state, the condensation of
TMP proceeded via a range of reactions including the formation of ether bridges,
(p,p) and (o,p) methylene linkages. These reactions appeared to be influenced
significantly by the diffusion limitation mechanism, as suggested by the observed
descending trend of Ea. It was suggested that the higher concentration of methylol

125
groups in TMP, compared to those in MMP and DMP, would give rise to higher
degree of molecular branching, as well as higher amounts of ether and methylene
linkages, thus limiting molecular transport as the cure progressed.
The sodium complex mechanism was also suggested to be operative in the case of
TMP and became quite severe for samples having NaOH molar ratios of 0.45 or
higher. This was evidenced in the shifting of the onset temperatures for
condensation reactions of these samples to higher values, consistent with the
slowing down of reaction kinetics due to the diminished capacity of TMP
molecules to form methylene linkages, particularly those involving the ortho
methylol groups. The increased severity of the sodium complex mechanism was
also reflected in higher Ea values for these samples and in their descending
dependence on conversion, particularly during later phases of the cure.
The addition of NaOH also had the effect of increasing ΔHT. Because all TMP
samples, irrespective of NaOH content, reached a fully cured state at the end of the
cure process, it was suggested that such increase in ΔHT was due to the increase in
the activation energy of cross-linking reactions for TMP as NaOH content was
increased.
Further comparison of the effects of NaOH on the cure properties of TMP with
those of MMP and DMP will be presented in chapter 7.
6.7 References
1. M.F. Grenier-Loustalot, S. Larroque and P. Grenier, “Phenolic Resins: 4.
Self-Condensation of Methylolphenols in Formaldehyde-Free Media”,
Polymer 37(6), 955-964 (1996).
2. D.J. Francis and L.M. Yeddanapalli, “Kinetics and Mechanism of the
Alkali Catalysed Condensations of Di- and Tri-Methylol Phenols by
Themselves and with Phenol”, Die Makromolekulare Chemie 125, 119-
125 (1969).

126
3. R.T. Jones, “The Condensation of Trimethylol Phenol”, J. Polym. Sci. 21,
1801 (1983).
4. P.W. King, R.H. Mitchell, and A.R. Westwood, “Structural Analysis of
Phenolic Resole Resins”, J. Appl. Polym. Sci. 18, 1117-1130 (1974).
5. T.H. Goswami and M.M. Naiti, “The Characterization of Trimethylol
Phenol by Thermal Analysis”, Thermochimica Acta 197, 453-462 (1992).
6. R.W. Martin, The Chemistry of Phenolic Resins, J. Wiley, New York,
1956, p. 128.
7. T. Holopainen, L. Alvila, J. Rainio and T.T. Pakkanen, “Phenol-
Formaldehyde Resol Resins Studied by 13C-NMR Spectroscopy, Gel
Permeation Chromatography, and Differential Calorimetry”, J. Appl.
Polym. Sci. 66, 1183-1193 (1997).
8. A. Kumar, U. K. Phukan, A. K. Kulshreshtha and S. K. Gupta, “Molecular
Weight Distribution in Novolac Type Phenol Formaldehyde
Polymerization”, Polymer 23, 215-221 (1982).
9. A. Kumar, A. K. Kulshreshtha and S. K. Gupta, “Modelling of Phenol-
Formaldehyde Polymerization Reaction”, Polymer 21, 317-324 (1980).
10. L. Collob, “The Correlation Between Preparation and Properties in
Phenolic Resins” in Wood Adhesives. Vol. 2, A. Pizzi (ed.), Dekker, New
York, 1989, p. 121.
11. S.V. Vyazovkin, “On the Phenomenon of Variable Activation Energy for
Condensed Phase Reactions”, New J. Chem. 24, 913-917 (2000).

127
Chapter 7
Comparison of Effects of NaOH on the Cure
Properties of Mono-, Di- and Tri-Methylol Phenols
7.1 Introduction
In previous chapters, the DSC thermograms, the conversion dependence of
apparrent activation energy Ea and the enthalpy of reactions ΔHT of individual
methylol phenols at different NaOH levels have been analysed in an effort to obtain
further insights into the cure properties of MMP, DMP and TMP. A key
mechanism that has been discussed is the strong inclusion of Na+ in the methylol
phenols that diminish the capacity of these compounds to participate in
condensation reactions. Another important mechanism that has been suggested to
affect the reactions is the limitation on molecular diffusion, especially when the
cure is carried out in the presence of excessive amounts of Na+ and OH¯ ions.
These effects have been shown not only to depend on the level of NaOH, but also
on the amount and position of methylol groups in the methylol phenols.
Differences in the DSC thermograms, in the evolution of Ea with extent of
conversion and in ΔHT between different samples have been used to assess the
extent of these effects and to gain insights into various mechanistic aspects of the
condensation process. On this basis, proposals for possible mechanisms that
operate during the cure process of individual methylol phenols at different NaOH
levels have been put forward.
This chapter aims to provide a summary of the findings and compare the cure
properties of individual methylol phenols. In previous chapters, where appropriate,
some differences in the cure properties of these compounds have been identified
and explanations have been proposed. In this chapter, the comparison will be

128
carried out in a more systematic manner in an effort to provide a consistent overall
picture of relevant mechanisms operating during the cure process.
7.2 MMP
7.2.1 2-MMP
During the cure of 2-MMP in the uncatalyzed state, the apparent activation energy
Ea rose relatively rapidly from 89 kJ mole-1 to about 102 kJ mole-1 as conversion
reached 0.25. As the cure proceeded, Ea increased less rapidly and reached a value
of about 108 kJ mole-1 at the end of the cure. It has been suggested that the rise in
Ea as a function of conversion is due to a kinetic process involving variable
contributions of both (o,o) and (o,p) linkage reactions. At low conversions, the
partial contribution of the (o,o) linkage reaction with higher Ea was low compared
to that of the (o,p) linkage reaction. As the cure proceeded, the contribution of the
(o,o) linkage reaction increased and that of the (o,p) linkage reaction decreased.
The addition of NaOH generally had the effect of raising Ea. This has been
suggested to be due to the formation of the sodium ring complex, which
presumably has the effects of blocking the ortho-methylol group and reducing the
carbanion negative charge. In particular, at 0.15 molar ratio, Ea increased steadily
during the course of the cure from 110 kJ mole-1 at the beginning and reached 119
kJ mole-1 at the end of the process. Similar to the uncatalyzed sample, the
ascending dependence of Ea on conversion suggests an increasing contribution of
the (o,o) linkage reaction, and a diminishing importance of the (o,p) linkage
reaction, as the cure progressed.
Further increases of NaOH up to 1.00 molar ratio also resulted in an ascending
dependence of Ea on extent of conversion. However, instead of persisting
throughout the entire cure process, the ascending dependence of Ea for these
samples was maintained only in the initial stage, after which Ea had a “flat”
dependence with value at about 130 kJ mole-1. It has been suggested that during
this later phase, the (o,p) linkage reaction was essentially complete and the (o,o)
linkage reaction with higher activation energy became the dominant reaction.

129
The addition of NaOH to 2-MMP also had the effect of decreasing the enthalpy of
reactions ΔHT, especially at higher NaOH content. In particular, ΔHT was 538 J g-1
in the uncatalyzed condition and remained steady around this value until the molar
ratio reached 0.30. Thereafter, ΔHT steadily decreased to about 425 J g-1 at molar
ratios of 0.60 or higher. Such decrease in ΔHT has been suggested to be due to
lower amounts of cross-links formed at higher molar ratios, as higher activation
energies were required for the cross-linking reactions.
7.2.2 4-MMP
In contrast to 2-MMP where there was an ascending dependence of Ea on
conversion, Ea of the uncatalyzed 4-MMP gradually decreased from about 110 kJ
mole-1 in the early stage to about 98 kJ mole-1 at the end of the cure. It has been
suggested that the cure process of 4-MMP consisted of consecutive reactions,
starting with the self-condensation reactions with higher activation energies to form
(p,p) and (o,p) linkages, followed by the addition reaction of the product CH2O to
4-MMP with lower activation energy. The descending dependence of Ea on
conversion is attributed to decreasing contributions of the self-condensation
reactions as the cure proceeded, and to the growing contribution of the addition
reaction towards the end of the process. It is noted that (p,p) and (o,p) linkage
reactions of 4-MMP have been found to occur at similar rates with an activation
energy of 72 kJ mole-1 [1], whereas the addition reaction of CH2O to 4-MMP had a
lower activation energy of 60 kJ mole-1 [2].
Whilst NaOH molar ratio of 0.15 did not have significant effect on Ea as well as its
conversion dependence, higher levels of NaOH content had the effect of increasing
Ea, which had values ranging from about 115 kJ mole-1 to 120 kJ mole-1 for molar
ratios between 0.30 and 0.60, and about 128 kJ mole-1 for molar ratio of 1.00. The
increase in Ea is attributed to the association between Na+ and the phenate oxygen,
which reduces the carbanion negative charge and diminishes the capacity of 4-
MMP to participate in self-condensation reactions. It has also been suggested that
the adverse effects of NaOH on 4-MMP should be less compared to 2-MMP, since
the sodium ring complex is not formed in the former case. Indeed, whilst a low
NaOH molar ratio of 0.15 did not change the cure properties of 4-MMP to any
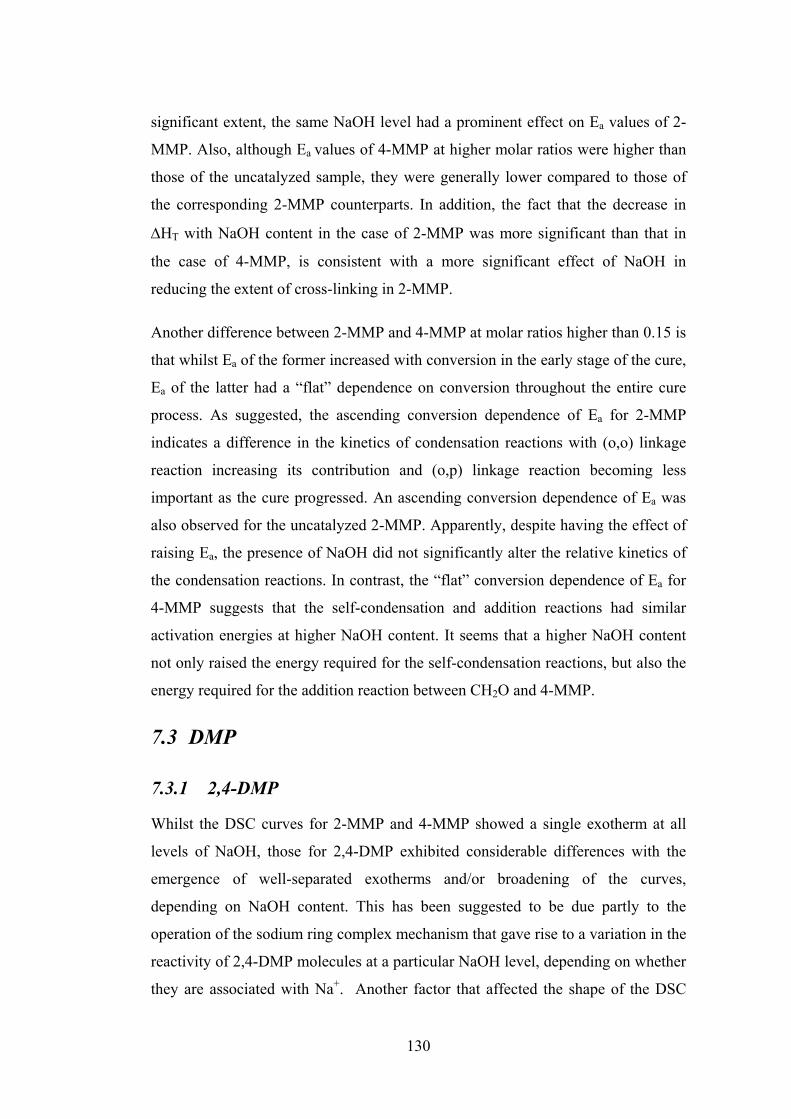
130
significant extent, the same NaOH level had a prominent effect on Ea values of 2-
MMP. Also, although Ea values of 4-MMP at higher molar ratios were higher than
those of the uncatalyzed sample, they were generally lower compared to those of
the corresponding 2-MMP counterparts. In addition, the fact that the decrease in
ΔHT with NaOH content in the case of 2-MMP was more significant than that in
the case of 4-MMP, is consistent with a more significant effect of NaOH in
reducing the extent of cross-linking in 2-MMP.
Another difference between 2-MMP and 4-MMP at molar ratios higher than 0.15 is
that whilst Ea of the former increased with conversion in the early stage of the cure,
Ea of the latter had a “flat” dependence on conversion throughout the entire cure
process. As suggested, the ascending conversion dependence of Ea for 2-MMP
indicates a difference in the kinetics of condensation reactions with (o,o) linkage
reaction increasing its contribution and (o,p) linkage reaction becoming less
important as the cure progressed. An ascending conversion dependence of Ea was
also observed for the uncatalyzed 2-MMP. Apparently, despite having the effect of
raising Ea, the presence of NaOH did not significantly alter the relative kinetics of
the condensation reactions. In contrast, the “flat” conversion dependence of Ea for
4-MMP suggests that the self-condensation and addition reactions had similar
activation energies at higher NaOH content. It seems that a higher NaOH content
not only raised the energy required for the self-condensation reactions, but also the
energy required for the addition reaction between CH2O and 4-MMP.
7.3 DMP
7.3.1 2,4-DMP
Whilst the DSC curves for 2-MMP and 4-MMP showed a single exotherm at all
levels of NaOH, those for 2,4-DMP exhibited considerable differences with the
emergence of well-separated exotherms and/or broadening of the curves,
depending on NaOH content. This has been suggested to be due partly to the
operation of the sodium ring complex mechanism that gave rise to a variation in the
reactivity of 2,4-DMP molecules at a particular NaOH level, depending on whether
they are associated with Na+. Another factor that affected the shape of the DSC

131
curves is thought to be the range of condensation possibilities which essentially
consisted of reactions to form (p,p) and (o,p) methylene linkages, as well as ether
linkages at low NaOH levels.
A particular feature of the DSC curve for 2,4-DMP at molar ratio of 0.15 is the
emergence of two peaks at around 135°C and 160°C. It has been suggested that the
first peak (135°C) is due to the condensation reactions to form methylene and ether
linkages, whereas the second peak (160°C) represents further reaction of the ether
linkages, for instance, to form methylene linkages and eliminate formaldehyde. In
contrast, the DSC curves of 2-MMP and 4-MMP at similar molar ratio did not
show a similar distinct peak for the degradation of ether linkages. Holopainen et al.
[3] have reported that the condensation and ether degradation peaks of methylol
phenols overlap when the degree of methylol substitution is low and become
progressively separated with increasing substitution. This is likely to be the reason
for the absence of the ether degradation peak for the MMP samples and the
emergence of such a peak for the 2,4-DMP sample.
Another distinguishing feature of the DSC curves for 2,4-DMP is that at molar
ratio of 1.00, there were two distinct peaks at about 143°C and 163°C. The
narrowness of the peaks have been suggested to be due in part to less variation in
the reactivity of 2,4-DMP molecules since most would be affected to more or less
the same extent in the presence of high level of Na+. Another factor that is thought
to be operative at this molar ratio is the excessive amounts of Na+ and OH¯ ions that
may impose limitation on molecular diffusion. It has been suggested that after the
initial formation of methylene linkages at the relatively high onset temperature that
gave rise to the first DSC peak (143°C), the limitation on molecular mobility could
become more severe, making it more difficult for further condensation to proceed.
The second DSC peak (163°C) is thought to be due to the unreacted 2,4-DMP
molecules that could overcome the diffusion barrier and accelerate the reactions at
higher temperatures.
In terms of the apparent activation energy Ea, for the uncatalyzed sample, there was
a steady rise of Ea from about 90 kJ mole-1 in the early stage to about 110 kJ mole-1
at the end of the cure. Such ascending dependence of Ea on conversion has been

132
suggested to be due to a predominance of reactions to form ether and (p,p)
methylene linkages with lower activation energies at lower conversions, and an
increasing contribution of the (o,p) linkage reaction with higher activation energy
as the cure proceeded. As expected, the addition of NaOH had the effect of raising
the activation energies of condensation reactions due to the formation of the
sodium ring complex. In particular, Ea appeared to increase with increases in
NaOH content and reached a value as high as 140 kJ mole-1 at 0.75 molar ratio.
Generally, the ascending conversion dependence of Ea was still observed for
different NaOH molar ratios. This has been attributed to: (i) decreasing
contributions of reactions with lower Ea, for instance, reactions between molecules
not affected by the sodium ring complex to form (p,p) linkages; and (ii) increasing
contributions of reactions with higher Ea, for instance, reactions between molecules
affected by the ring complex to form (o,p) linkages.
The conversion dependence of Ea at molar ratio of 1.00 was distinctly different
from that at lower molar ratios in that there was an initial rise of Ea to about 150 kJ
mole-1 at 0.25 conversion, followed by a steady decrease to about 140 kJ mole-1
when the conversion reached about 0.80. Afterwards, there was a slight rise before
rapidly decreasing again. Consistent with the interpretation of the respective DSC
curve, the descending trend between 0.25 and 0.80 conversions has been attributed
to the diffusion limitation that caused a decrease of the apparent activation energy
with increasing extent of polymerisation. As well, the slight rise after 0.80
conversion has been suggested to be due to unreacted 2,4-DMP molecules which
could overcome the diffusion barrier and speed up the reactions at higher
temperatures.
Whilst the results suggest that diffusion limitation was important for 2,4-DMP at
1.00 molar ratio, there was no evidence that a similar mechanism operated in the
cases of 2-MMP and 4-MMP. This may be due in part to the bulkier nature of 2,4-
DMP molecules that could exacerbate the limitation on molecular mobility caused
by excessive amounts of Na+ and OH¯ ions, thus raising the onset temperatures for
condensation reactions as observed. Also, as the condensation reactions proceeded,
the higher concentration of methylol groups in 2,4-DMP would give rise to higher

133
degree of molecular branching and higher amounts of ether and methylene
linkages, thus rendering a more rigid polymer structure with less effective
molecular diffusion, compared to those formed by 2-MMP and 4-MMP molecules.
The change in enthalpy ΔHT with NaOH content is another parameter that provides
further insights into the cure properties of 2,4-DMP. In particular, ΔHT for 2,4-
DMP decreased steadily with increase in NaOH content from about 500 J g-1 in the
uncatalyzed state to about 340 J g-1 when NaOH molar ratio reached 1.00. This has
been attributed to the lower amounts of cross-links formed at higher molar ratios. It
is noted that within a similar range of NaOH content, the decrease in ΔHT in the
case of 2,4-DMP was more significant than those in the cases of 2-MMP and 4-
MMP. This is consistent with the diffusion limitation mechanism which had the
effect of diminishing the extent of cross-linking in 2,4-DMP.
7.3.2 2,6-DMP
A main difference between 2,4-DMP and 2,6-DMP was that the shape of the DSC
curves for the latter was narrower and did not appear to change significantly at
molar ratios of 0.45 or less, apart from the appearance of the distinct second peak at
0.15 molar ratio. This second peak, as in the case of 2,4-DMP, has been attributed
to further reactions of the ether linkages to form methylene. The narrowness of the
curves has been attributed in part to the limited condensation possibilities of 2,6-
DMP where reactions proceeded primarily via only (o,p) positions, compared to
those for 2,4-DMP where reactions occurred via both (p,p) and (o,p) positions. As
well, the higher reactivity of 2,6-DMP, compared to that of 2,4-DMP, is another
factor that has been suggested to contribute to the narrow shape of the curves. The
apparent stability of the DSC curves of 2,6-DMP at these molar ratios has been
attributed to a less severe effect of NaOH on the reactivity of 2,6-DMP, given that
one ortho methylol group is still available for reactions, whilst the other is
restrained by the association with Na+.
At higher molar ratios, the effects of NaOH were more significant and the shape of
the DSC curves became broadened at molar ratios of 0.60 and 0.75, before
emerging as two distinct sharp peaks at molar ratio of 1.00. Similar to the case of

134
2,4-DMP, the broadening of the curves has been explained in part by the variation
in the reactivity of different 2,6-DMP molecules, depending on whether they were
associated with Na+. Likewise, a molecular diffusion control mechanism which
slows down the condensation reactions until higher temperatures has also been
used to explain the emergence of the two sharp peaks at 1.00 molar ratio. It is noted
that the first and second peaks for 2,6-DMP at 1.00 molar ratio were more distinct
and well-separated, compared to those for 2,4-DMP. This is likely to be due to the
greater effect of diffusion limitation for 2,6-DMP at higher molar ratios, as
apparent from the following comparison of the conversion dependence of Ea of the
two compounds.
In the uncatalyzed state, the conversion dependence of Ea was “flat” at about 96 kJ
mole-1. This has been suggested to be due to constant contributions of reactions to
form ether bridges and (o,p) methylene linkages throughout the cure. At molar
ratios between 0.15 and 0.45, Ea of 2,6-DMP generally had either an ascending or a
“flat” dependence on conversion. Given that the major condensation reaction of
2,6-DMP is the formation of (o,p) linkages, such behaviour of Ea has been
attributed to the variation in reactivity of 2,6-DMP molecules due to the extent of
their association with Na+ at a particular NaOH level. Some effects of diffusion
limitation were also apparent for 2,6-DMP at 0.30 and 0.45 molar ratios,
particularly towards the end of cure.
As mentioned above, data on the conversion dependence of Ea suggest that
diffusion limitation mechanism had greater effects on 2,6-DMP than on 2,4-DMP,
especially at higher molar ratios. In particular, diffusion limitation appeared to
prevail from the early phase of the cure for 2,6-DMP at molar ratios of 0.60 and
0.75, as suggested by the descending conversion dependence of Ea for these
samples. This is in contrast to the predominance of chemical reactions for 2,4-DMP
at similar molar ratios, as suggested by the ascending trend of Ea for these samples.
The greater effects of diffusion limitation mechanism for 2,6-DMP can also be seen
in the case of 1.00 molar ratio where Ea for this sample initially rose to a high value
of 180 kJ mole-1 at 0.3 conversion, then sharply decreased down to about 80 kJ
mole-1 at 0.8 conversion before rapidly increasing to about 140 kJ mole-1 towards

135
the end of the cure. Note that Ea for 2,4-DMP at 1.00 molar ratio also had a similar
pattern of evolution with conversion, but to a much lesser extent. Reasons for the
difference in the effects of diffusion limitation on the two compounds are not clear.
The decrease in the enthalpy of reactions ΔHT with NaOH content for 2,6-DMP
appeared to be more significant than that for 2,4-DMP. In particular, ΔHT
decreased from about 530 J g-1 in the uncatalyzed condition to a value of 310 J g-1
at molar ratio of 1.00. The greater change in ΔHT for 2,6-DMP is consistent with
the greater effects of diffusion limitation mechanism which further diminished the
extent of cross-linking in the structure of this compound.
7.4 TMP
As discussed previously, diffusion limitation was absent in the cure of 2-MMP and
4-MMP, but was important in the condensation of 2,4-DMP and 2,6-DMP at higher
levels of NaOH. For TMP, this mechanism played a major role even in the
uncatalyzed condition, as suggested by the steady descending dependence of Ea on
conversion for the uncatalyzed TMP from about 142 kJ mole-1 at the beginning to
about 100 kJ mole-1 at the end of the cure. This has been attributed to the higher
concentration of methylol groups in TMP, compared to those in MMP and DMP,
that would give rise to higher degree of molecular branching, and higher amounts
of ether and methylene linkages. The formation of ether bridges, (p,p) and (o,p)
methylene linkages are thought to be major condensation reactions of TMP.
The effects of diffusion limitation did not appear to change at molar ratio of 0.15,
but became increasingly severe at molar ratios of 0.45 or higher, as evidenced in
the considerable changes in the DSC curves and in the conversion dependence of
Ea of these samples. In particular, at 0.45 molar ratio, the onset temperatures for
condensation reactions increased significantly and the DSC curve became narrower
with the emergence of a smaller peak at about 137°C and a sharp peak at about
147°C. The smaller peak represents the first condensation stage during which Ea
increased to about 150 kJ mole-1 at 0.2 conversion and remained steady at this
value until the conversion reached 0.4. The sharp peak represents the second
condensation stage where there was a descending trend of Ea to about 133 kJ mole-1

136
at 0.6 conversion, followed by a rapid rise to kJ mole-1 at 0.8 conversion before
declining rapidly to 114 kJ mole-1 at the end of the cure.
The shape of the DSC curve and the complex evolution of Ea at 0.45 molar ratio
have been attributed to the association between Na+ and TMP which further
exacerbated the diffusion limitation imposed by TMP itself. In particular, it has
been suggested that during the first condensation stage, TMP molecules not
associated with Na+ were more reactive and would preferentially react to form (p,p)
methylene linkages. As the condensation proceeded, the effect of diffusion
limitation became more severe, leading to the descending trend of Ea from 0.4 to
0.6 conversions. The evolution of Ea from 0.6 conversion towards the end of the
cure has been explained on the basis that further increases in temperature would
allow some unreacted TMP molecules to overcome the diffusion barrier and
accelerate the condensation, before being restrained again by the diffusion control
mechanism. The predominant reactions during this stage are thought to be the
formation of (o,p) methylene linkages by TMP molecules which were affected by
Na+.
Further increases of NaOH content resulted in further changes in the DSC curves
and in the conversion dependence of Ea, which are consistent with increasingly
enhanced association between Na+ and TMP, and a more severe effect of diffusion
limitation mechanism. In particular, the condensation reactions at 0.60 molar ratio
were further shifted to higher temperatures compared to those at 0.45 molar ratio
and the DSC curve exhibited a sharp single peak at 137°C, instead of two peaks as
in the case of 0.45 molar ratio. Correspondingly, Ea showed an initial rise to the
maximum value of 155 kJ mole-1 at 0.5 conversion and a subsequent descending
trend to about 110 kJ mole-1 towards the end of the cure. It has been suggested that
the shifting of the condensation reactions to higher temperatures is due to enhanced
association between Na+ and TMP, and that the emergence of a single sharp peak is
due partly to a more uniform reactivity of TMP molecules and an increased effect
of diffusion limitation at this molar ratio.
Increases of NaOH to molar ratios of 0.75 and 1.00 further shifted the condensation
to higher temperatures, which is consistent with a more severe effect of TMP – Na+

137
complex in delaying the reactions. The sharp peak still persisted, but an exotherm
with peak at 146°C started to emerge with increased significance at 1.00 molar
ratio. The shape of the conversion dependence of Ea for these samples was similar
to that for 0.60 molar ratio. However, the rise of Ea seemed to be more rapid with
higher maximum value and the descending dependence also occurred at earlier
stages in the cure. It has been suggested that at these high molar ratios, the effect of
NaOH was much more severe so that the initial condensation that gave rise to the
sharp peak was not efficient, and that the emergence of the subsequent exotherm is
due to reactions of residual TMP molecules which could overcome the diffusion
barrier at higher temperatures.
As discussed previously, the enthalpy of reactions ΔHT for MMP and DMP
decreased with increases in NaOH content. This has been attributed to the lowering
of the extent of cross-linking in these compounds due to higher activation energies
required and the diffusion limitation mechanism at higher molar ratios. However,
for TMP, an increasing dependence of ΔHT on NaOH content was observed, which
started at about 365 J g-1 for the uncatalyzed sample and reached 435 J g-1 as NaOH
was increased to 1.00 molar ratio. This is the case despite the increase in activation
energies of condensation reactions and the enhanced effect of diffusion limitation
at higher molar ratios for TMP. The higher reactivity and higher amount of
methylol groups present in TMP molecules have been suggested to be contributing
to the more efficient cross-linking reactions in TMP samples.
7.5 Summary
This chapter summarised and compared the effects of NaOH on the cure properties
of individual methylol phenols. A key mechanism that was suggested to operate
during the cure of the monomers in the presence of NaOH is the formation of the
sodium ring complex that diminishes the capacity of the monomers to participate in
condensation reactions, particularly those involving ortho-methylol groups. At a
particular NaOH level, the monomer molecules may have a range of reactivity,
depending on whether they are associated with Na+. Such variation in the reactivity
and the different condensation possibilities of the monomers are critical factors
governing the cure behaviour of the monomers. An effect of the sodium ring

138
complex that was commonly observed for all monomers, was the raising of the
apparent activation energy, Ea. For TMP, an additional effect was the shifting of
the onset temperatures for condensation reactions to higher values as NaOH
content is increased.
Another important mechanism that was suggested to operate during the cure was
the limitation on molecular diffusion that had the effect of slowing down the
condensation reactions of the monomers. The effect of the diffusion limitation
mechanism was more pronounced with increases in the amount of the methylol
groups in the monomers, which would give rise to higher degree of molecular
branching and higher amounts of methylene linkages, thus limiting molecular
transport as the cure progressed. Increasing NaOH content in the monomers also
had the effect of exacerbating the effect of this mechanism. As shown by the shape
of the dependence of Ea on the degree of conversion, the diffusion limitation
mechanism is absent in the cases of 2-MMP and 4-MMP, and most pronounced in
the case of TMP. For 2,4-DMP and 2,6-DMP, the presence of this mechanism was
only apparent in samples with higher NaOH content.
Differences in the effects of these mechanisms between monomer samples with
different NaOH content, together with the established chemistry of condensation
reactions, were used as a basis to explain the shape of the DSC curves, the
dependence of Ea on the degree of conversion and the heat of reactions ΔHT. The
partial contributions of condensation reactions to form para-para and ortho-para
linkages, as well as ortho-ortho linkages on rare occasions, at different stages of
the cure, were also proposed for individual monomers at different NaOH levels.
7.6 References
1. L.M. Yeddanapalli and D.J. Francis, “Kinetics and Mechanism of the Alkali
Catalysed Condensation of o- and p-Methylol Phenols by Themselves and
with Phenol”, Makromol. Chem. 55, 74-86 (1962).
2. K.C. Eapen and L.M. Yeddanapalli, “Kinetics and Mechanism of the
Alkali-Catalysed Addition of Formaldehyde to Phenol and Substituted
Phenols”, Die Makromolekulare Chemie 119, 4-16 (1968).

139
3. T. Holopainen, L. Alvila, J. Rainio and T.T. Pakkanen, “Phenol-
Formaldehyde Resol Resins Studied by 13C-NMR Spectroscopy, Gel
Permeation Chromatography, and Differential Calorimetry”, J. Appl.
Polym. Sci. 66, 1183-1193 (1997).

140
Chapter 8
Cure Properties of PF Resoles
8.1 Introduction
As discussed in chapters 1 and 2, many DSC studies of PF resoles often mistakenly
assumed that the activation energy of the thermal reaction is constant and did not
change with the extent of the cure. This approach ignores the complexity of the
reactions and the complex dependence of Ea on the degree of the cure. As reviewed
in Chapter 2, the limited number of studies which investigated the variation of Ea
during the cure, suggested a decrease in Ea as the cure proceeded and concluded
that the cure of PF resoles changed from a kinetic to a diffusion regime due to
cross-linking in the system. Nevertheless, these studies did not investigate the
effects of NaOH on the cure kinetics of the resoles.
This chapter uses the model-free kinetic analysis of DSC data to investigate the
variation of activation energy, Ea, during the cure of resoles having different NaOH
/ P molar ratios, and from here, to obtain further insights into the cure mechanisms.
Gel permeation chromatography (GPC) and gel time techniques are also used to
provide complementary information. An issue that will be addressed in this chapter
is whether the retardation effect on the cure kinetics of the resoles caused by the
sodium complex ring mechanism, is confined to 2-MMP or also applies to other
methylol phenols present in the resoles. This chapter will also investigate the
effects of NaOH content and methylol substitution on the diffusion limitation
mechanism that operates in the later stage of the cure.
The chapter contains an experimental section that describes the synthesis of the
resoles and the experimental techniques employed including GPC and gel time
techniques. The DSC methods are similar to those used for the monomers and are
not presented here. It will be shown that the outcomes of both studies of the
monomers and the resoles are complementary to each other and provide a

141
consistent overall picture of relevant mechanisms operating during the cure
process.
8.2 Experimental
8.2.1 Resole synthesis
Three PF resole formulations were synthesised with F / P molar ratio of 2.0, while
the NaOH / P molar ratios were 0.30, 0.50 and 0.70. The materials used were 100%
phenol, 46 % NaOH, 54 % formaldehyde and water. The reactions were conducted
in a laboratory glass reactor equipped with a thermometer, stirrer and a reflux
condenser. The temperature was controlled with an electric heating mantle and an
ice water cooling bath.
The initial charge consisted of all the phenol and half of the NaOH content. After
heating the components to 60°C, half of the formaldehyde was slowly added over
thirty minutes and the reaction continued at this temperature for a further thirty
minutes. The reaction was then allowed to heat to 80°C and held at that
temperature for thirty minutes. The remaining sodium hydroxide and water were
charged, then cooled to 60°C. The reaction was maintained at this temperature for
30 minutes, during which time the remaining formaldehyde was slowly added. The
reaction temperature was then increased to 75°C and maintained at this temperature
until the final viscosity reached approximately 300 mPa.s. The reaction was
stopped by cooling rapidly to room temperature. In order to monitor the reactions,
samples were periodically taken from the reaction mixture and their viscosity
determined at 25°C using a Mettler Rheomat RM 180 rotational viscometer.
The solids content of the resoles were 42 % to 46 % and the final free
formaldehyde contents were less than 0.1 %.
8.2.2 GPC
The GPC procedure to determine the molecular weight distribution of the PF
resoles was outlined in Yazaki et al. [1]. Essentially, the GPC of the resoles was
performed using a Waters Associates instrument comprising Waters 710B injection

142
system, Waters 590 programmable HPLC pump and Waters Lambda-max 481 UV
detector fitted with a series of Shodex columns having dimensions 300mm length
by 8mm ID and packed with styrene-divinylbenzene copolymers. The column
series consisted of KF 800P (guard column, 10 mm by 4.6 mm ID), KF 803, KF
802.5 and KF 802. HPLC grade tetrahydrofuran (THF) was used as the mobile
phase. A sample (5mg) of PF resin was dissolved in THF (5 mL) and toluene (1
µL) was added as an internal standard. An aliquot (50 µL) of the sample solution
was injected, eluted with the THF at a flow rate of 1 mL/min and UV absorption
was detected at 280 nm. Polystyrene standards (nominal molecular weights
100000, 9000, 2000 and 580) were used for calibration. The resulting
chromatograms were analysed for weight-average molecular weight (Mw) and
number-average molecular weight (Mn). All GPC data collection and manipulation
was performed on a 4100 computing integrator (Spectra-Physics, San Jose, CA)
and Millenium Software (Waters Corporation, Milford, MA) respectively.
8.2.3 Gel time
Gelation is defined as the point at which a resole ceases to be a viscous liquid and
becomes a soft, elastic, rubbery solid. The procedure to determine the gel time for
the resoles essentially consisted of filling a test tube of 1.25 cm diameter with a
sample of the resoles to approximately half of its capacity. The test tube was then
placed into a constant-temperature bath at 100°C with an inserted stirring glass rod
of 4mm, which was used as a probe. The glass rod was removed frequently for
observation. The gel time was the time taken for the sample to reach a specified gel
strength, taken as a point at which truly viscous flow was no longer observed.
Duplicate determinations were carried out [2].
8.2.4 DSC experiments
DSC runs and kinetic analysis of DSC data were carried out in accordance with the
methods and procedures described in chapter 3.

143
8.3 Results and Discussion
8.3.1 GPC
The molecular weight measurements and the calculated polydispersity (Mw / Mn) of
the PF resoles as functions of NaOH / P molar ratio are shown in Figure 8.1. It can
be seen that Mw increased steadily with increase of NaOH from about 1700 at
molar ratio of 0.30 to about 5500 at molar ratio of 0.70. Likewise, the
polydispersity of the resoles increased progressively from about 2.0 at 0.30 molar
ratio to about 5.0 at 0.70 molar ratio.
PF resoles
NaOH / P molar ratio
0.3 0.4 0.5 0.6 0.7
Wei
ght-
aver
age
mol
ecul
ar w
eigh
t (M
w)
1000
2000
3000
4000
5000
6000
Poly
disp
ersi
ty (M
w /
Mn)
1
2
3
4
5
6
Molecular weightPolydispersity
Figure 8.1: The weight-average molecular weight (Mw) and the polydispersity (Mw/Mn) of PF resoles as functions of NaOH / P molar ratio.
The increasing trend of Mw with increase of NaOH / P molar ratio is in agreement
with the results reported in previous studies [3-5]. Gollob [3] explained that since
the addition of NaOH has the effect of thinning the resoles, the methylol phenols in
the resole with higher NaOH content must react to a greater extent to reach a

144
constant viscosity end point. Polydispersity gives a measure of the range of
molecular size in the resole. The higher polydispersity for resoles with higher
NaOH content may reflect the larger range of reaction products with different
molecular weights arising from the greater extent of condensation as NaOH content
was increased.
8.3.2 Gel time
Figure 8.2 shows that the gel time of the PF resoles increased as NaOH / P ratio
was increased, indicating that the resole reactivity decreased at higher NaOH
content. This is in agreement with previous gel time studies, which found a similar
decreasing trend of the reactivity of PF resoles as NaOH / P molar ratio was
increased within the range similar to that used in the present study [4-7]. It is noted
that Haupt and Waago [5] found that for PF resoles having NaOH / P molar ratio
less than about 0.30, the reactivity of the resoles increased with increases in the
ratio.
PF Resoles
NaOH / P molar ratio
0.3 0.4 0.5 0.6 0.7
Gel
tim
e (s
)
400
600
800
1000
1200
1400
1600
1800
Figure 8.2: The gel time of PF resoles as a function of NaOH / P molar ratio.

145
Since gel time is measured by the cessation of viscous flow, a major critique of the
use of gel time to study reactivity is that the interpretation of the results is
complicated by factors that influence the viscosity of the resoles [8]. In the present
study, the use of resoles having similar viscosity would eliminate these
complications. The consistency between the gel time results and the DSC data, as
well as further discussion on the effects of NaOH on resole reactivity, will be
presented in the following sections.
8.3.3 DSC curves
Figure 8.3 shows the DSC thermograms of the PF resoles having different NaOH /
P molar ratios obtained at 10 °C min-1 scan rate. It can be seen that for the resole
with a NaOH / P molar ratio of 0.30, the DSC curve was quite sharp and had a peak
at about 139°C. Further increases of the NaOH / P ratio to 0.50 and 0.70 had the
effect of broadening the curve and shifted the peak temperatures to higher values of
about 147°C and 152°C, respectively.
It is noted that all DSC thermograms of the resoles obtained in this study showed a
single exothermic peak. The presence of a single peak is consistent with a number
of studies [see, for example, 4, 9, 10], but not in agreement with some others that
showed two exothermic peaks [see, for example, 6, 11-13]. Park et al. [4] attributed
the single peak in their study to the lower molecular weight of the resoles used,
which ranged from 486 to 701. However, this does not explain the presence of a
single peak for the resoles in this study, which had much higher molecular weight
(1700 – 5500). It is likely that the single peak in the present study is due to
condensation reactions involving the methylol groups to form mostly methylene
linkages [6]. The absence of a sharp “addition” peak between 98°C and 130°C [6,
13] is likely due to the insignificant level of residual formaldehyde in the resoles to
give rise to addition reactions with phenolic rings. Likewise, the absence of a peak
representing the degradation of ether linkages at a temperature higher than that of
the condensation peak [12, 13] is probably because the formation of ether linkages
was insignificant under the alkaline conditions used.

146
PF Resoles
Temperature (οC)
40 60 80 100 120 140 160 180 200 220
Hea
t Flo
w E
ndo
Up
(mW
)
0
10
20
30
40
50
60
NaOH / P = 0.70NaOH / P = 0.50NaOH / P = 0.30
Figure 8.3: DSC thermograms of the PF resoles having different NaOH / P molar ratios obtained at 10 °C min-1 scan rate.
Figure 8.4 shows the fractional conversion of the cure reactions of the resoles as a
function of temperature. It can be seen that for the resole with NaOH / P = 0.30, the
cure kinetics was relatively slow at temperatures below 132°C where the
conversion degrees were less than about 0.3. Thereafter, the reactions accelerated
significantly and reached a conversion of 0.9 at about 145°C, before slowing down

147
towards the end of the cure process. The fast reaction kinetics within a relatively
narrow temperature range reflects the sharp exotherm in the DSC curve of the
resole.
Increasing the NaOH / P molar ratio had the effect of delaying the cure reactions to
higher temperatures, most notably when the conversions were above 0.3. Indeed, it
can be seen in Figure 8.4 that higher temperatures were required for the resoles
with 0.50 and 0.70 NaOH / P molar ratios to reach the same degree of conversion
as that of the resole with 0.30 molar ratio. For instance, whilst the 0.30 molar ratio
resole reached 0.9 conversion at 145°C, the 0.50 and 0.70 molar ratio resoles
reached the same conversion degree at 161°C and 165°C, respectively. The slow
reaction kinetics for these resoles over a broad range of temperatures reflects the
broad exotherm in the DSC curves of the respective resoles.
PF Resoles
Temperature (οC)
100 110 120 130 140 150 160 170 180
Con
vers
ion
( α)
0.0
0.1
0.2
0.3
0.4
0.5
0.6
0.7
0.8
0.9
1.0
NaOH / P = 0.70NaOH / P = 0.50NaOH / P = 0.30
Figure 8.4: Fractional conversion of the cure reactions of the resoles as a function of temperature.

148
The progressive retardation of the reaction kinetics with increases in the NaOH / P
ratio observed in the DSC data is in agreement with the gel time results presented
in 8.3.2. As discussed previously, the retardation effect of NaOH has been reported
in a number of studies, but most of these studies were based on the gel time
technique. Although DSC technique has been employed in a number of PF resole
studies, its use to study the effect of NaOH on the cure kinetics is limited. The DSC
data in the present study provide an independent confirmation of the retardation
effect of NaOH on the cure kinetics of PF resoles.
It has been suggested that a key mechanism for the progressive retardation of the
cure kinetics of PF resoles at increasingly higher NaOH content is the formation of
the sodium ring complex that blocks the ortho-methylol group and reduces the
carbanion negative charge, which is the main force driving the PF condensation
reactions under alkaline conditions [7]. However, there is uncertainty as to whether
only 2-MMP moieties in PF resoles are involved in the retardation effect. The
results of individual monomers in the present study strongly suggest that the
retardation effect of NaOH was not confined to 2-MMP, but also applied to other
methylol phenols present in the resoles. In addition, resoles with higher NaOH / P
molar ratios would have higher proportions of DMP and TMP, and should be more
reactive towards condensation reactions, given that the degree of substitution
increases with increasing NaOH content and that the reactivity of methylol phenols
increases with increasing substitution [5, 14, 16, 17]. The opposite trend observed
for the reactivity of the resoles as NaOH / P molar ratio was increased provides
additional confirmation that methylol phenols other than 2-MMP were also
affected by NaOH.
8.3.4 Enthalpy of reactions ΔHT
Figure 8.5 shows ΔHT for the cure reactions of the resoles as a function of NaOH /
P molar ratio. It can be seen that ΔHT had a value of 254 J g-1 at molar ratio of 0.30
and steadily decreased to about 200 J g-1 at molar ratio of 0.70. A decrease in ΔHT
may be an indication of a decrease in the extent of cross-linking. Alternatively, it
may suggest that less energy is required for the cross-linking. As will be discussed

149
in 8.3.5, the activation energies of condensation reactions for the resoles increased
with increasing NaOH / P ratio. Therefore, it appears that the decrease in ΔHT was
due to lower amounts of cross-links formed during the cure process.
PF Resoles
NaOH / P molar ratio
0.3 0.4 0.5 0.6 0.7
Ent
hapl
y of
rea
ctio
n ( Δ
HT, J
g-1
)
190
200
210
220
230
240
250
260
Figure 8.5: ΔHT as a function of NaOH / P molar ratio for PF resoles. Maximum error from the triplicate DSC runs was 0.5 %. Error bars are not included in the graph since they were close to the font size of the data points.
It is noted that all the cured resoles having different NaOH content had a solid and
glassy appearance and were not affected when immersed in acetone and/or
methanol, suggesting that the resoles reached a fully cured state at the end of the
cure process. As discussed in 8.3.1, prior to the cure process, the condensation
reactions of methylol phenols in resole having higher NaOH content would have
proceeded to a greater extent to reach a constant viscosity end point. It may be that
the prior condensation during the making of the resole would reduce the amounts
of methylol groups available for further condensation during the cure process,
leading to lower ΔHT as shown by the DSC data.
150
It is also interesting that the values of ΔHT for the resoles ranged from about 200 J
g-1 to 250 J g-1, whereas higher values between about 300 J g-1 to 550 J g-1 were
obtained for the monomers, depending on the type of monomers and the level of
NaOH content. It is likely that the prior condensation of the methylol groups during
the making of the resoles could be a factor contributing to the lower ΔHT values for
the resoles.
8.3.5 Effects of NaOH/ P molar ratio on the evolution of activation energy Ea
As described in Chapter 3, activation energy (Ea) for increasing extent of
conversion α was calculated according to the equation:
ln (Φ/Ti 2) = - Eα
/ RTi + ln (RA / Eα) 3.7
where Φ is the heating rate (°C min-1); Tα is the temperature to reach a given degree
of conversion, α; R is the universal gas constant (J mol-1 K-1); and A is the
frequency factor (s-1).
A graph of ln(Φ/Tα 2) versus 1/Tα should yield a straight line. The value for Eα can
be obtained from the slope of the linear graph.
For each NaOH : P molar ratios, thermograms were recorded at scanning rates (2.5,
5, 10 and 20) oC min-1 in the range 25oC up to 250oC. The temperature (Tα) at
which a particular conversion (α) is reached shifts to higher temperatures as the
heating rate is increased. For each scan rate, the DSC Pyris version 3.52 software
was used to obtain the values of Tα for increasing values of α. Taking the sample
with NaOH / P molar ratio 0.30 as an example, Table 8.1 depicts the values of Tα at
the four scan rates. From these values the linear regression analysis function of
SigmaPlot version 7.1 (from SPSS Inc.) was used to generate linear graphs of
ln(Φ/Tα 2) vs. 1/Tα at a set confidence level of 95 %. Figure 8.6 shows the linear
regression graphs between α = 0.05 and α = 0.95 and the corresponding square of
the correlation coefficient (r2) values. The equations of the linear graphs were then
generated by the SigmaPlot software, from which the values of Eα at different α

151
could be manually calculated. Maximum error in Ea values obtained from the
triplicate DSC runs was 0.5 %.
Table 8.1: The DSC Pyris computer software generated values of Tα at four scan rates (for NaOH / P molar ratio of 0.30) and the corresponding values for the dependent and independent variables for equation 3.7.
Conversion α
Scan rate Φ
(°C min-1)
Tα (°C)
Tα (K)
(1/Tα) x 10-3 (K)
Ln (Φ/ Tα2)
0.02 2.5 82.878 356.078 2.8083734 12.66659 5 96.412 369.612 2.7055399 13.434346 10 102.706 375.906 2.6602395 14.161263 20 116.069 389.269 2.5689176 14.924274
0.05 2.5 89.911 363.111 2.7539788 12.705708 5 102.216 375.416 2.6637117 13.465507 10 111.447 384.647 2.5997863 14.207237 20 124.483 397.683 2.5145656 14.967043
0.1 2.5 97.12 370.32 2.7003672 12.745026 5 110.137 383.337 2.6086707 13.507267 10 119.778 392.978 2.5446717 14.250092 20 132.793 405.993 2.4630967 15.008404
0.15 2.5 102.661 375.861 2.660558 12.77473 5 115.562 388.762 2.5722679 13.535373 10 125.364 398.564 2.5090073 14.278321 20 139.257 412.457 2.4244952 15.039996
0.2 2.5 106.824 380.024 2.6314128 12.79676 5 119.414 392.614 2.5470309 13.555092 10 130.085 403.285 2.479636 14.301872 20 143.113 416.313 2.4020389 15.058607
0.25 2.5 110.585 383.785 2.6056255 12.816456 5 123.287 396.487 2.5221508 13.574724 10 133.286 406.486 2.4601093 14.317684 20 146.886 420.086 2.380465 15.076651
0.3 2.5 114.187 387.387 2.5813979 12.835139 5 126.306 399.506 2.5030913 13.589895 10 136.419 409.619 2.441293 14.33304 20 149.806 423.006 2.3640327 15.090505
0.35 2.5 117.899 391.099 2.5568974 12.854212 5 129.037 402.237 2.4860965 13.603521 10 139.265 412.465 2.4244481 14.346888 20 152.431 425.631 2.3494529 15.102878

152
0.4 2.5 121.249 394.449 2.535182 12.87127
5 131.518 404.718 2.4708563 13.615819 10 141.956 415.156 2.4087331 14.359894 20 154.335 427.535 2.3389898 15.111805
0.45 2.5 124.206 397.406 2.5163183 12.886208 5 133.864 407.064 2.4566162 13.627379 10 143.698 416.898 2.3986683 14.368268 20 156.005 429.205 2.329889 15.119602
0.5 2.5 126.559 399.759 2.5015072 12.898014 5 136.605 409.805 2.440185 13.640801 10 145.453 418.653 2.388613 14.37667 20 157.401 430.601 2.3223355 15.126096
0.55 2.5 129.173 402.373 2.4852562 12.91105 5 138.973 412.173 2.4261657 13.652324 10 148.103 421.303 2.3735886 14.38929 20 159.256 432.456 2.312374 15.134693
0.6 2.5 131.826 405.026 2.4689773 12.924193 5 141.415 414.615 2.4118761 13.664139 10 150.088 423.288 2.3624577 14.398691 20 161.637 434.837 2.2997123 15.145675
0.65 2.5 133.761 406.961 2.4572379 12.933725 5 143.632 416.832 2.3990481 13.674804 10 152.054 425.254 2.3515358 14.407958 20 163.592 436.792 2.2894192 15.154646
0.7 2.5 135.704 408.904 2.4455618 12.943252 5 145.227 418.427 2.3899031 13.682443 10 154.138 427.338 2.340068 14.417736 20 165.587 438.787 2.2790101 15.16376
0.75 2.5 137.995 411.195 2.4319362 12.954426 5 147.929 421.129 2.3745693 13.695316 10 156.392 429.592 2.3277901 14.428257 20 168.503 441.703 2.2639647 15.177008
0.8 2.5 139.856 413.056 2.4209792 12.963457 5 150.408 423.608 2.3606731 13.707055 10 159.915 433.115 2.3088556 14.444592 20 170.795 443.995 2.2522776 15.187359
0.85 2.5 141.581 414.781 2.4109108 12.971792 5 151.994 425.194 2.3518676 13.714529 10 161.676 434.876 2.2995061 14.452707 20 173.348 446.548 2.2394009 15.198826
0.88 2.5 143.053 416.253 2.4023851 12.978877 5 153.924 427.124 2.3412405 13.723587 10 163.087 436.287 2.2920692 14.459186 20 175.791 448.991 2.2272161 15.209738

153
0.9 2.5 145.653 418.853 2.3874725 12.991331 5 155.751 428.951 2.3312686 13.732123 10 165.585 438.785 2.2790205 14.470604 20 179.055 452.255 2.2111419 15.224225
0.95 2.5 148.954 422.154 2.3688038 13.007031 5 159.221 432.421 2.3125611 13.748237 10 169.545 442.745 2.2586365 14.488573 20 184.111 457.311 2.1866957 15.24646
0.98 2.5 152.233 425.433 2.3505464 13.022506 5 164.492 437.692 2.2847116 13.772469 10 175.022 448.222 2.2310373 14.513162 20 188.981 462.181 2.1636545 15.267645
Resole
1/Tα x 10-3 (K)
2.15 2.20 2.25 2.30 2.35 2.40 2.45 2.50 2.55 2.60 2.65 2.70 2.75 2.80 2.85 2.90 2.95
ln( φ
/ T
α2 )
12.5
13.0
13.5
14.0
14.5
15.0
15.5α = 0.05; r2 = 0.984α = 0.10; r2 = 0.996α = 0.20; r2 = 0.998α = 0.30; r2 = 0.998α = 0.40; r2 = 0.995α = 0.50; r2 = 0.998α = 0.60; r2 = 0.998α = 0.70; r2 = 0.999α = 0.80; r2 = 0.999α = 0.90; r2 = 0.997α = 0.95; r2 = 0.996
Figure 8.6: Graphs of ln(Φ/Tα 2) vs. 1/Tα between α = 0.05 and α = 0.95 and the
corresponding square of the correlation coefficient (r2) values for a resole sample having NaOH / P molar ratio 0.50.

154
The cure of a PF resole is greatly influenced by the types of monomers present and
the reaction pathways to form methylene linkages (as well as ether linkages under
acidic or neutral conditions). As discussed in chapter 2, the formation of the
methylene linkages in the resole usually involves the reaction of a methylol group
either with another methylol group, or with a proton on the aromatic ring (Schemes
V and VI, respectively, Figure 2.2). Due to the high reactivity of para-methylol
groups in the condensation reactions, methylene linkages formed are mainly in the
form of (o,p) and (p,p) linkages with the (o,o) linkages rarely forming [18-20].
Various studies using DSC have also indicated that the cure of PF resoles is
complicated by the diffusion limitation mechanism, particularly towards the later
phase of the cure, as shown by a corresponding decrease in the apparent activation
energy Ea [21-23].
This section presents the results on the dependence of apparent activation energy Ea
on the degree of conversion for the resoles having different NaOH / P molar ratios.
This information provides insights into the relative contributions of (o,p) and (p,p)
methylene linkage formation throughout the cure process, as well as the role of the
diffusion limitation mechanism, as a function of NaOH / P molar ratio.
Figure 8.7 shows the evolution of apparent activation energy Ea for the resoles with
different NaOH / P molar ratios as a function of the degree of conversion. Similar
to the cases of monomers, the initial cure stage of the resoles could be affected by
the diffusion effect and will not be investigated in the present work. Instead, the
following discussion focuses on the evolution of Ea when conversion was higher
than 0.1.

155
PF Resoles
Conversion (α)
0.0 0.1 0.2 0.3 0.4 0.5 0.6 0.7 0.8 0.9 1.0
Act
ivat
ion
ener
gy (E
a, kJ
mol
-1)
50
60
70
80
90
100
110
120
NaOH / P = 0.70NaOH / P = 0.50NaOH / P = 0.30
Figure 8.7: Effects of NaOH / P on the evolution of apparent activation energy Ea for the resoles as a function of the degree of conversion. Maximum error from the triplicate DSC runs was 0.5 %. Error bars are not included in the graph since they were close to the font size of the data points.
As can be seen in Figure 8.7, for the resole with NaOH / P = 0.30, there was a
steady rise of Ea from about 60 kJ mole-1 at conversion of 0.1 to 109 kJ mole-1 as
the conversion reached about 0.6. Thereafter, Ea gradually decreased as the cure
progressed and had a value of about 105 kJ mole-1 at the end of the cure. Although
a similar pattern of dependence of Ea on conversion was also observed for the
resoles with higher molar ratios, there were also clear differences. In particular, for
the resole with NaOH / P = 0.50, Ea started off at a higher value of about 80 kJ
mole-1 and progressively increased to the maximum value of 111 kJ mole-1 at
conversion of 0.7, before declining steadily towards the end of the cure. The
decline of Ea was more significant compared to the 0.30 molar ratio resole and a
value of 101 kJ mole-1 was reached at the end of the cure. Increasing the NaOH / P
molar ratio to 0.70 had the effect of further increasing Ea to about 90 kJ mole-1 at

156
the beginning of the cure. A similar increasing dependence of Ea was also observed
up to about 0.7 conversion, where Ea reached the maximum value of about 115 kJ
mole-1. The subsequent decline of Ea for this resole was even more extensive with a
lower Ea of 93 kJ mole-1 obtained at the end of the cure.
As discussed in previous chapters, the shape of the dependence of Ea on conversion
degree is determined by the ratio of the partial contributions of individual reactions
to the overall reaction process. Given that the most important condensation
reactions during the cure of the resoles involve the formation of (p,p) and (o,p)
methylene linkages and that the para-position is more reactive than the ortho-
position, it is suggested that the partial contributions of the (p,p) linkage reactions
were dominant at low conversions and that the (o,p) linkage reactions became more
dominant as the cure proceeded. This would result in an increasing dependence of
Ea on conversion observed in the earlier stage of the cure of the resoles. It is noted
that the higher values of Ea for resoles having higher NaOH / P ratio in this stage
are consistent with the retardation effect of NaOH caused by the sodium ring
complex mechanism.
The descending dependence of Ea for all resoles when conversions were higher
than 0.6 – 0.7 is likely due to the effect of the diffusion limitation mechanism
which became increasingly important as the cure proceeded. The differences in the
extent to which Ea declined between different resoles provide insights into factors
that may exacerbate the effect of this mechanism. The DSC data showed that the
decline of Ea was more extensive for resoles with higher NaOH / P ratios,
suggesting a more important role of the diffusion limitation mechanism for these
resoles. A possible reason for this behavior is related to the types of addition
products formed. As shown in the study of the monomers, the effect of the
diffusion limitation mechanism is most extensive in the case of TMP and becomes
less important for DMP, whereas there is no evidence that this mechanism operates
in the case of MMP. Given that the degree of methylol substitution increases with
increasing NaOH content, it is possible that the resoles with higher NaOH / P ratios
would have higher proportions of DMP and TMP, and therefore would be more
affected by the diffusion limitation mechanism. An excessive amount of NaOH is

157
another factor that may limit molecular diffusion, as shown in the study of the
monomers. Therefore, the higher amount of NaOH in resoles with higher NaOH / P
ratios could also exacerbate the severity of the diffusion limitation mechanism.
8.4 Summary
In this chapter, the thermochemical properties of PF resoles having different NaOH
/ P molar ratios were investigated. This is the first time the model-free kinetic
analysis of DSC data has been applied to investigate the variation of activation
energy, Ea, during the cure of PF resoles having different NaOH / P molar ratios.
GPC and gel time techniques have also been used to provide complementary
information. The results obtained from both resole and monomer studies provided
insights into the operation of the sodium complex ring mechanism, as well as the
effects of NaOH content and methylol substitution on the diffusion limitation
mechanism.
It was found that the weight-average molecular weight Mw and the polydispersity
of the resoles increased with increasing NaOH / P ratio. This was suggested to be
due to different extents of condensation in the resoles to reach a constant viscosity
end point. The gel time measurements and DSC data showed that the cure kinetics
of the resoles decreased as NaOH content was increased, which is consistent with
the retardation effect caused by the sodium ring complex mechanism. On the basis
of the study of the monomers and GPC data, it was argued that the operation of this
mechanism was not confined to 2-MMP, but also applied to other methylol phenols
present in the resoles.
The DSC data also showed that the activation energies of the cure reactions
increased with increasing NaOH / P ratio. From the data on the dependence of Ea
on the extent of conversion, it was suggested that the cure of the resoles proceeded
through two stages. The first stage is characterised by an ascending trend of Ea up
to conversion of 0.6 – 0.7. It was proposed that during this stage, the partial
contributions of reactions to form the (p,p) linkages were dominant at low
conversions and that the (o,p) linkage reactions became more significant as the cure
proceeded. The second stage is characterised by a descending trend of Ea to the end

158
of the cure, which suggested an increasing contribution of the diffusion limitation
mechanism. The effect of this mechanism was more extensive for the resoles
having higher NaOH / P ratio. This was attributed to a higher degree of methylol
substitution and a higher amount of NaOH present in these resoles, both of which
were shown in the study of monomers to have the effect of exacerbating the
severity of the diffusion limitation mechanism.
The above findings have practical implications in the development of PF resole
adhesive systems capable of curing faster at lower temperatures. As described in
Chapter 2, it is commonly thought that a higher degree of methylolation would lead
to more rigid structures with more three dimensional cross-linking and that the
addition of NaOH as a catalyst would speed up the cure process. The findings of
the current research show that increasing the degree of methylolation and the
amount of NaOH would increase the contributions of the diffusion limitation
mechanism and the retardation effect, which in turn would slow down the
condensation reactions. Clearly, for PF resole formulations with a particular F / P
molar ratio, there is an optimal level of NaOH / P molar ratio where the cross-
linking reactions are encouraged and the diffusion mechanism is minimised. The
present results indicate that for a system with a F / P molar ratio of 2, which is
commonly used in the industry, a NaOH / P ratio of 3 is sufficient to produce
resoles with a fully cross-linked network. Higher NaOH / P ratios would slow
down the cure reactions due to increasing importance of both the sodium ring
complex and the diffusion limitation mechanisms.
8.5 References
1. Y. Yazaki, P. J. Collins, M. J. Reilly, S. D. Terrill, T. Nikpour, “Fast-
Curing Phenol-Formaldehyde (PF) Resins: Part 1. Molecular Weight
Distribution of PF Resins”, Holzforschung 48, 42-48 (1994).
2. A. Pizzi and A. Stephanou, “Phenol - Formaldehyde Wood Adhesives
Under Very Alkaline Conditions - Part I: Behaviour and Proposed
Mechanism”, Holzforschung 48, 35-40 (1994).

159
3. L. Gollob, “The Correlation Between Preparation and Properties in
Phenolic Resins”, in Wood Adhesives – Chemistry and Technology Vol. 2,
A. Pizzi (ed.), Dekker, New York, 1989, p. 121.
4. B.D. Park, B. Riedl, Y.S. Kim and W.T. So, “Effect of Synthesis
Parameters on Thermal Behaviour of Phenol-Formaldehyde Resol Resin”,
J. Appl. Polym. Sci 83, 1415-1424 (2002).
5. R.A. Haupt and S. Waago, “The Ionic Nature of the Phenol-Formaldehyde
Condensation Reaction and Its Effect on Polymer Propreties”, Wood
Adhesives, 220-226 (1995).
6. A.W. Christiansen and L. Gollob, “Differential Scanning Calorimetry of
Phenol-Formaldehyde Resols”, J. Appl. Polym. Sci. 30, 2279-2289 (1985).
7. A. Pizzi and A. Stephanou, “Phenol - Formaldehyde Wood Adhesives
Under Very Alkaline Conditions - Part I: Behaviour and Proposed
Mechanism”, Holzforschung 48, 35-40 (1994).
8. R.A. Haupt and T. Sellers, Jr., “Characterizations of Phenol-Formaldehyde
Resol Resin”, Ind. Eng. Chem. Res. 33, 693-697 (1994).
9. M.F. Grenier-Loustalot, S. Larroque and P. Grenier, “Phenolic Resins: 5.
Solid-State Physicochemical Study of Resoles with Variable F / P Ratios”,
Polymer 37(4), 639-650 (1996).
10. G. He, B. Riedl and A. Ait-Kadi, “Model-Free Kinetics: Curing Behavior of
Phenol Formaldehyde Resins by Differential Scanning Calorimetry”, J.
Appl. Polym. Sci. 87, 433-440 (2003).
11. P.W. King, R.H. Mitchell, and A.R. Westwood, “Structural Analysis of
Phenolic Resole Resins”, J. Appl. Polym. Sci. 18, 1117-1130 (1974).
12. T. Holopainen, L. Alvila, J. Rainio and T.T. Pakkanen, “Phenol-
Formaldehyde Resol Resins Studied by 13C-NMR Spectroscopy, Gel
Permeation Chromatography, and Differential Calorimetry”, J. Appl.
Polym. Sci. 66, 1183-1193 (1997).

160
13. P. Luukko, L. Alvila, T. Holopainen, J. Rainio and T.T. Pakkanen, “Effect
of Alkalinity on the Structure of Phenol-Formaldehyde Resol Resins”, J.
Appl. Polym. Sci. 82, 258-262 (2001).
14. A. Knop and W. Scheib, Chemistry and Application of Phenolic Resins,
Springer-Verlag, New York, 1979, p. 41-43.
15. L. Gollob, “The Correlation Between Preparation and Properties in
Phenolic Resins”, in Wood Adhesives – Chemistry and Technology Vol. 2,
A. Pizzi (ed.), Dekker, New York, 1989, p. 142.
16. M.F. Grenier-Loustalot, S. Larroque and P. Grenier, “Phenolic Resins: 4.
Self-Condensation of Methylolphenols in Formaldehyde-Free Media”,
Polymer 37(6), 955-964 (1996).
17. M.F. Grenier-Loustalot, S. Larroque and P. Grenier, “Phenolic Resins: 1.
Mechanisms and Kinetics of Phenol and of the First Polycondensates
Towards Formaldehyde in Solution”, Polymer 35(14), 3045-3054 (1994).
18. D. D. Werstler, “Quantitative 13C NMR Characterization of Aqueous
Formaldehyde Resins: 1. Phenol-Formaldehyde Resins Polymer 27, 750-
756 (1986).
19. S. So and A. Rudin, “Analysis of the Formation and Curing Reactions of
Resole Phenolics”, J. Appl. Polym. Sci. 41, 205-232 (1990).
20. M.G. Kim, Y. Wu and L.W. Amos, “Polymer Structure of Cured Alkaline
Phenol-Formaldehyde Resol Resins with Respect to Resin Synthesis Mole
Ratio and Oxidative Side Reactions”, J. Polym. Sci. Part A: Polym. Chem.
35, 3275-3285 (1997).
21. E. Kiran and R. Iyer, “Cure Behaviour of Paper-Phenolic Composite
System: Kinetic Modeling”, J. Appl. Polym. Sci. 51, 353-364 (1994).
22. G. Vazquez, J. Gonzalez-Alvarez, F. Lopez-Suevos, S. Freire and G.
Antorrena, “Curing Kinetics of Tannin-Phenol-Formaldehyde Adhesives as
Determined by DSC”, J. Therm. Anal. Cal. 70, 19-28 (2002).

161
23. G. He, B. Riedl and A. Ait-Kadi, “Model-Free Kinetics: Curing Behavior of
Phenol Formaldehyde Resins by Differential Scanning Calorimetry”, J.
Appl. Polym. Sci. 87, 433-440 (2003).

162
Chapter 9
Conclusions and Future Work
In the present study, the thermochemical properties of individual PF monomers as a
function of NaOH in the temperature range up to 250°C were investigated using
DSC. DSC experiments were conducted in the dynamic mode and the kinetic
analysis of the DSC data was carried out using the model-free method. A particular
focus of the study was on the changes in the shape of the DSC curves, the
dependence of apparent activation energy Ea on the degree of conversion and the
enthalpy of reactions ΔHT as the NaOH content in the monomers was varied. These
changes, together with the established chemistry of condensation reactions, were
used to elucidate relevant reaction mechanisms during the cure.
A key mechanism that was suggested to operate in the presence of NaOH is the
formation of the sodium ring complex that diminishes the capacity of the
monomers to participate in condensation reactions, particularly those involving
ortho-methylol groups. At a particular NaOH level, the monomer molecules may
have a range of reactivity, depending on whether they are associated with Na+.
Such variation in the reactivity and the different condensation possibilities of the
monomers are critical factors governing the cure behaviour.
Another important mechanism that was suggested to operate during the cure is the
limitation on molecular diffusion that had the effect of slowing down the
condensation reactions of the monomers. The effect of the diffusion limitation
mechanism was more pronounced with increases in the amount of the methylol
groups in the monomers and in the levels of NaOH. The increase in the extent of
cross-linking is another factor that exacerbates the significance of this mechanism
as the cure proceeds.
Whilst the effects of these mechanisms are consistently manifested in various DSC
parameters, the results regarding the dependence of Ea on the degree of conversion
for the monomers at different NaOH levels are particularly useful in providing

163
insights into possible pathways that condensation reactions may proceed. In
particular, the partial contributions of reactions to form (p,p) and (o,p) linkages, as
well as (o,o) linkages in rare occasions, at different stages of the cure were
proposed for each monomer at different NaOH levels.
Apart from the focus on PF monomers, this study also investigated the effects of
NaOH / P ratio on the cure properties of PF resoles as a whole. A particular
emphasis of the study was on the use the model-free kinetic analysis of DSC data
to investigate the variation of activation energy Ea during the cure of the resoles,
and from here, to obtain further insights into the cure mechanisms. The outcomes
of both the studies of the monomers and the resoles are complementary to each
other and provide a consistent overall picture of relevant mechanisms operating
during the cure process. In particular, the sodium ring complex mechanism that had
the retardation effect on the cure kinetics of the resoles was demonstrated
independently by both gel time measurements and DSC data. It was suggested that
the operation of this mechanism is not confined to 2-MMP, but also applies to other
methylol phenols present in the resoles.
On the basis of the data on the dependence of Ea on the extent of conversion, it was
suggested that the cure of the resoles proceeded through two stages. The first stage
is characterised by an ascending trend of Ea up to conversion of 0.6 – 0.7, followed
by the second stage which exhibited a descending trend of Ea to the end of the cure
process. It was proposed that the partial contribution of reactions to form the (p,p)
linkages are dominant at low conversions and that the contribution of the (o,p)
linkage reactions become more significant as the cure proceeds. The descending
trend of Ea was attributed to the increasing importance of the diffusion limitation
mechanism in the second stage of the cure. The effect of this mechanism was more
extensive for the resoles having higher NaOH / P ratio. This was attributed to a
higher degree of methylol substitution and a higher amount of NaOH present in
these resoles, both of which were shown in the study of monomers to have the
effect of exacerbating the severity of the diffusion limitation mechanism.
The findings in the present study have practical implications in the development of
PF resole adhesive systems capable of curing faster at lower temperatures. Indeed,

164
it is commonly thought that higher degree of methylolation would lead to more
rigid structures with more three dimensional cross-linking and that the addition of
NaOH as a catalyst would speed up the cure process. The present research shows
that increasing the degree of methylolation and the amount of NaOH would
increase the contributions of the diffusion limitation mechanism and the retardation
effect, which in turn would slow down the condensation reactions. Clearly, for PF
resole formulations with a particular F / P molar ratio, there is an optimal level of
NaOH / P molar ratio where the cross-linking reactions are encouraged and the
diffusion mechanism is minimized. The present results indicate that for a system
with a F / P molar ratio of 2, which is commonly used in the industry, a NaOH / P
ratio of 3 is sufficient to produce resoles with fully cross-linked network. Higher
NaOH / P ratio would slow down the cure reactions due to increasing importance
of both the sodium ring complex and the diffusion limitation mechanisms.
The present study proposes possible pathways that condensation reactions may
proceed, as well as possible contributions of reactions to form (p,p) and (o,p)
linkages, during the cure of different monomers and PF resoles. Further work is
required to confirm these possibilities. The work would involve analysing the
chemical structures of the products at different stages of the cure using
complementary techniques such as NMR and FTIR. The confirmation or otherwise
of these proposed mechanisms using these techniques is necessary to improve the
understanding of the cure mechanism of PF resoles.
Another area that requires further research is the effects of F / P molar ratio on the
cure properties of PF resoles. As reviewed in Chapter 2, the effects of F / P molar
ratio have been investigated in various studies. However, these studies commonly
ignore the complexity of the reactions and assume that Ea does not change with
temperature. As has been shown throughout the present study, the model-free DSC
method avoids the assumption of homogeneous reaction kinetics and allows the
monitoring of different chemical reactions with different kinetics via the
dependence of Ea on the degree of the cure. Therefore, the issue of the effects of F /
P molar ratio should be revisited using the model-free method to analyse the DSC

165
data, together with NMR and FTIR to provide complementary structural
information at different stages of the cure, as suggested above.
These additional data will add to the knowledge obtained in the present study and
aid in the development of PF resole systems capable of bonding under a wide range
of gluing conditions with the ability to cure faster at lower temperatures.