thermodynamic and kinetic modification for libh4 and its
TRANSCRIPT
Doctoral Thesis
Thermodynamic and kinetic modification for LiBH4
and its composite with MgH2
(LiBH4および MgH2との複合化材料の熱力学的
および動力学的改良)
Mechanical Science and Engineering
Graduate School of Engineering
Hiroshima University
September 2020
Pratibha Pal


This thesis is dedicated to my father for his
unconditional love, support and patient.


i
Acknowledgment
Firstly, I would like to thank Almighty God, for giving me strength and power in my doctoral
course life.
I am blessed to work and would like to express my sincere gratitude to my supervisor Prof.
Dr. Takayuki Ichikawa for his guidance, timely support, suggestions and encouragements
throughout the doctoral life. I am blessed to do work under his supervision. He is not only an
outstanding supervisor, a great team leader but also a kind human being.
I would also like to express my special thanks to Assoc. Prof. Dr. Ankur Jain for his
continuous support beyond the limits and guidance throughout my doctoral course. I am
pleased to have him as a mentor who knows how to mold raw clay and morph into
meaningful thing from it. He always demonstrated a positive attitude and acts as a catalyst for
me not only in professional career but in personal as well.
I want to express my sincere thanks to Prof. Dr. Yoshitsugu Kojima for his valuable
suggestions during my work and a lot of interesting talks at diverse topics. I am also thankful
to Assoc. Prof. Dr. Hiroki Miyaoka for his valuable time for discussion, suggestions,
constructive criticism, and support throughout the work.
I am also thankful to Dr. Tengfei Zhang, Dr. Jean Pierre Bonnet for their valuable and critical
discussions time to time which worked for me a source of encouragement.
I wish to express my sincere gratitude to Assist. Prof. Rini Singh and Assist. Prof. Kana
Machi for their kind support in my doctoral course life.
I express my heartiest thanks to my seniors and colleagues - Mr. Tomoyuki Ichikawa, Dr.
Rajesh Jangir, Dr. Suganthamalar Selvaraj, Dr. Keita Nakajima, Mr. Hironori Kawai, Ms.
Guo Fangqin, Mr. Keita Shinzato, Mr. Fernando Cano Banda, Mr. Hiroyuki Gi, who made
this journey really interesting and helped me in all ways.
I would like to express my special thanks to Ms. Misao Mukouda, Ms. Saori Inagaki and Ms.
Hikaru Yamamoto for their kind support in my doctoral course life.
It is my privilege to acknowledge all the faculty members and staff of Faculty of engineering,

ii
Hiroshima University for their continuous support and kind availability at all the time.
I am also thankful to my colleagues and friends Dr. Pooja Kumari (Research Fellow,
University of Birmingham), Dr. Bulbul Jha, Ms. Khushboo Sharma (MNIT, Jaipur), for their
co-operation and making this journey memorable. A special thanks to Dr. Amol Singh
(NSRRC Hsinchu, Taiwan), Mr. Jignesh Patel for always being with me in all situations and
to give me a lot of moral support during this journey.
I am very thankful to Assist. Prof. Dr. Shiv Kumar (Hiroshima synchrotron center, Hiroshima
University), without whom I couldn’t be able to find such a wonderful PhD group and guide.
My deepest sense of gratitude goes to my parents and my family who always stood by me
during hard times, who taught me basic lessons of gratitude and bringing me up by moral
lessons, with which I become a scholar and decent human being. I take this opportunity to
thank all those whose name may not be mentioned here but who supported me at different
point of times through their wishes, blessings and kindness.
Last but not the least, I would like to thanks to my boyfriend Dr. Dayanand Kumar (Research
scholar, NTU Singapore) for his constant encouragement and patient. He has always been a
great source of motivation and his support in many ways cannot be expressed in words.
iii
Abstract
The present study was focused on to lower the decomposition temperature of LiBH4 and its
composite system 2LiBH4-MgH2 by tuning their thermodynamics and kinetics. According to
the issues associated with LiBH4 (hard thermodynamics) and 2LiBH4-MgH2 (sluggish
kinetics), the thesis was structured with two objectives.
First objective was to focus on the 2LiBH4-MgH2 composite, where the thermodynamics of
LiBH4 was modified by the addition of MgH2 but this composite system possess serious
kinetic issues. In this work, KH was added as catalyst to the 2LiBH4-MgH2 system in order to
enhance the kinetics. A reduction in the temperature was observed for the first hydrogen
desorption reaction, but no effect could be seen in the second dehydrogenation. However, an
interesting phenomenon of eutectic melting was observed during the thermal heating of this
system. By addition of 5 mol% KH, the melting point was shifted to lower temperature,
which was continuously decreased with increase in the amount of KH from 0 to 55 mol%.
For 55 mol% KH i.e. at eutectic composition 0.45(2LiBH4-MgH2)-0.55KH the lowest
melting temperature was observed as 79oC. Eutectic melting is an interesting phenomenon
and happens if two or more components sustain their liquid state below the melting points of
their pure components. In this work, kinetic enhancement was achieved due to the occurrence
of eutectic melting on adding KH as additive. The enhanced ionic mobility must be the
driving force to desorb hydrogen at lower temperature in comparison of 2LiBH4-MgH2
composite, thus caused a kinetic enhancement on addition of KH. Reduced melting point for
some complex hydrogen storage systems behaves as eutectic melts and can be utilized for
refueling of vehicles. A pseudo-binary phase diagram between the 2LiBH4-MgH2 composite
iv
and KH was discussed and was explained in terms of degree of freedom.
The second objective of the thesis was to modify the thermodynamics of pure LiBH4 by the
addition of Bi2X3 chalcogenides and study their decomposition properties. This work was
initiated with a curiosity during an electrochemical experiment on Bi2X3 chalcogenides as
anode materials for all-solid-state Li-ion battery in a recent work by our group. LiBH4 was
used as solid electrolyte in the cell with Bi2Te3 nanostructures as anode material. An
interesting issue of cell opening during the charging – discharging motivated us to investigate
the effect of Bi2X3 (X = S, Se and Te) addition on the decomposition properties of LiBH4. An
efficient destabilization of LiBH4 could be achieved by addition of chalcogenides (Bi2S3,
Bi2Se3 and Bi2Te3), which could tune the thermodynamic properties of LiBH4 decomposition
by alloying with Li. The hydrogen desorption temperature of LiBH4 was reduced to below
150 ℃ by the addition of bulk Bi2X3. The detailed mechanism was established for the
reaction of LiBH4 with the Bi2Te3 (similar reaction steps were found for other two
composites as well, i.e. LiBH4-50wt%Bi2Se3 and LiBH4-50wt%Bi2S3) using several
techniques and was proposed as follows:
A further reduction in the decomposition temperature was achieved using nanostructured
Bi2X3, which must be due to kinetic enhancement due to better solid-solid contact between
LiBH4 and Bi2X3 that promotes a faster reaction between the components.
All the work was compiled in Chapter 1 to 6. Chapter 1, describes the introduction of the

v
field, need of research and associated challenges. Based on the background discussed in
chapter 1, the objectives are described in chapter 2, which comprises the aim of the thesis and
motivation behind the research work. All the methods and materials adopted for the
preparation as well as characterization of composite materials used in this work are covered
in chapter 3. Chapter 4 is the explanation of our first objective i.e. improving the kinetics of
2LiBH4-MgH2 system by the addition of potassium hydride (KH) as a catalyst. The results on
the destabilization of LiBH4 by the infusion of Bi2X3 (X = S, Se, Te) are presented in chapter
5. At last, chapter 6 summarize the results and suggest overall conclusion of the thesis and
propose the future direction of research.

vi
Table of Contents
Chapter-1: Introduction .................................................................................. 1
1-1 Hydrogen as Energy Carrier .................................................................... 1
1-2 Properties of Hydrogen ............................................................................. 3
1-2-1 Hydrogen Isotopes ................................................................................ 3
1-2-2 Hydrogen Molecule .............................................................................. 3
1-2-3 Equation of State .................................................................................. 4
1-3 Hydrogen Storage ...................................................................................... 5
1-3-1 Storing hydrogen as a gas .................................................................... 6
1-3-2 Liquid hydrogen ................................................................................... 7
1-3-3 Hydrogen Storage in Solid-State Materials ........................................ 7
1-4 Interaction of Hydrogen with Solids ........................................................ 8
1-4-1 Thermodynamics of Hydrogen Absorption/Desorption .................... 10
1-4-2 Kinetics of hydrogen absorption and desorption .............................. 12
1-5 How to tune thermodynamics and kinetics of hydrogen absorption
/desorption ...................................................................................................... 15
1-5-1 Thermodynamic Alteration ................................................................ 15
1-5-2 Kinetic Alteration ................................................................................ 16
KH as excellent catalyst for metal hydrogen system .................................. 16
1-6 Solid state hydrogen storage materials .................................................. 18
1-6-1 Metal hydrides .................................................................................... 20
1-6-2 Complex hydride ................................................................................. 20
vii
1-7 LiBH4 as promising material for hydrogen storage ............................. 22
1-8 2LiBH4 - MgH2 System ............................................................................ 23
1-9 LiBH4 as solid electrolyte and its use for Bi2X3 anode materials in
all-solid-state Li-ion battery .......................................................................... 26
Chapter-2: Purpose of thesis ......................................................................... 39
Chapter-3: Materials and Methods .............................................................. 42
3-1 Sample preparation ................................................................................. 42
3-1-1 Materials ............................................................................................. 42
3-1-2 Mechanical ball milling method ........................................................ 42
3-1-3 Synthesis of nanostructures ............................................................... 44
3-2 Characterization techniques ................................................................... 46
3-2-1 X-ray Diffraction Spectroscopy (XRD) .............................................. 46
3-2-2 Thermal analysis for gas desorption ................................................. 48
3-2-2-1 Thermogravimetry – Differential thermal analysis (TG-DTA) ..... 48
3-2-2-2 Thermal Desorption Mass Spectroscopy (TDMS) ......................... 49
3-2-2-3 Differential scanning calorimetry (DSC) ..................................... 50
3-2-4 Transmission Electron Microscopy (TEM) ....................................... 51
3-2-5 Scanning Electron Microscopy (SEM) ............................................. 52
Chapter-4: Improveming the kinetics of 2LiBH4-MgH2 system by the
addition of potassium hydride (KH) as a catalyst ....................................... 70
4-1 Introduction .............................................................................................. 70
4-2 Effect of 5 mol% KH addition on the 2LiBH4-MgH2 system .............. 71

viii
4-3 Effect of varying KH content on the 2LiBH4-MgH2 system ................ 73
4-4 Phase diagram of x(2LiBH4-MgH2) - (1-x)KH system ......................... 74
4-5 Structural observations after milling and heating ............................... 75
4-6 Summary .................................................................................................. 76
Chapter-5: Destabilization of LiBH4 by the infusion of Bi2X3 (X = S, Se,
Te): Structural and Morphological Investigation ....................................... 84
5-1 Introduction .............................................................................................. 84
5-2 Dehydrogenation of LiBH4 – bulk Bi2X3 composites ............................ 84
5-3 Nanostructures characterizations: SEM and TEM analysis ............... 86
5-4 Effect of nanostructured Bi2X3 on decomposition properties of LiBH4
.......................................................................................................................... 87
5-5 XRD analysis of LiBH4 – 50wt% Bi2X3 composites at different
decomposition steps ....................................................................................... 88
5-6 In-situ TEM observation of LiBH4-nano Bi2X3 composites ................. 91
5-7 Discussion and reaction mechanism establishment .............................. 93
5-8 Summary .................................................................................................. 96
Chapter-6: Conclusions and Future work .................................................. 117
References ...................................................................................................... 119
ix
List of Figures
Figure 1-1: Energy consumption in between 2018-2050 28
Figure 1-2: Schematic representation of hydrogen or protium (H), deuterium (D) and tritium
29
Figure 1-3: Ortho and para hydrogen 30
Figure 1-4: (T)Phase diagram of hydrogen; liquid hydrogen only exists between the solidus
line and the line from the triple point at 21.2 K and the critical point at 32 K 31
Figure 1-5: Potential energy diagram for interaction of hydrogen with metal surfaces 32
Figure 1-6: Pressure–Composition–Temperature diagram (PCT isotherms). Inset: van't Hoff
plot 33
Figure 1-7: Energy barrier for hydrogen adsorption and desorption 34
Figure 1-8: Diffusion coefficients of hydrogen isotopes in some bcc metals 35
Figure 1-9: Temperature dependences of H2 and NH3 release from the potassium-modified
(—) and the pristine samples (‐ ‐ ‐ ‐) 36
Figure 1-10: Free energy per mol of H2 as a function of temperature and the standard
enthalpy of a reaction of the hydride system 2LiBH4 + MgH2 37
Figure 1-11: Schematic of destabilization process of a hydride MH using third element A 38
Figure 3-1: Rotating (planetary) ball mill 54
Figure 3-2: Schematic for the synthesis of Bi2S3 nanoflowers 55
Figure 3-3: Schematic for the synthesis of Bi2Se3 nanoflowers 56
Figure 3-4: Schematic for the synthesis of Bi2Te3 nanoflowers 57
Figure 3-5: Diffraction of X-ray from lattice planes in crystal 58
x
Figure 3-6: Picture of Rigaku-RINT 2500 XRD equipment 59
Figure 3-7: Sample for XRD measurement 59
Figure 3-8: Schematic of TG-DTA apparatus 60
Figure 3-9: (a) Rigaku, TG8120 connected to a mass spectrometer (MS, Anelva, M-QA200TS) glove
box, (b) TG-DTA instrument inside the glove box 61
Figure 3-10: Schematic of heat flux type DSC apparatus 62
Figure 3-11: Image of Q10 PDSC, TA instruments DSC apparatus 63
Figure 3-12: Generated signals when a high-energy beam of electrons interacts with a thin
specimen 64
Figure 3-13: (a) Left: bright-field (BF) mode. (b) Right: “dirty” dark-field (d-DF) mode 65
Figure 3-14: Interactions between electrons and a sample 66
Figure 3-15: Emission of secondary electron, backscattered electron and characteristic X-ray 67
Figure 3-16: Schematic diagram of a scanning electron microscope 68
Figure 3-17: Images of the SEM instrument JEOL JSM 6380 (left); other two images belongs to
transfer stick and sample stage 69
Figure 4-1: DTA (upper panel) and TG analysis (lower panel) of 2LiBH4-MgH2 (dashed lines) and
2LiBH4-MgH2 - 5%KH (solid lines) 77
Figure 4-2: DSC profile of pure LiBH4-MgH2 (green color) and on the addition of 5 mol% KH in
LiBH4-MgH2 78
Figure 4-3: DSC curves for pure 2LiBH4-MgH2 (first from upwards) and remaining with the
increasing percentage of potassium hydride 79
Figure 4-4: DSC profiles of selected samples 80
xi
Figure 4-5: Phase diagram of x(2LiBH4-MgH2)-(1-x)KH system 81
Figure 4-6: XRD patterns of selected samples after milling 82
Figure 4-7: XRD patterns of selected samples after heating 83
Figure 5-1: TG-DTA and MS profile of milled (a) LiBH4 – 50wt% bulk Bi2S3 97
Figure 5-2: TG-DTA and MS profile of milled (b) LiBH4 – 50wt% bulk Bi2Se3 98
Figure 5-3: TG-DTA and MS profile of milled (c) LiBH4 – 50wt% bulk Bi2Te3 99
Figure 5-4: FE-SEM & TEM images of Bi2S3 nanoflowers (a & b), SAED & HRTEM images of
nanoflowers (c & d) 100
Figure 5-5: TEM & FE-SEM images of Bi2Se3 nanosheets (a & b), SAED & HRTEM images of
Bi2Se3 nanosheets (c & d) 101
Figure 5-6: FE-SEM & TEM images of Bi2Te3 nanosheets (a & b), SAED & HRTEM images of
Bi2Te3 nanosheets (c & d) 102
Figure 5-7: (a) TG and (b) MS profiles of milled samples; (i) LiBH4 – 50 wt% Bi2S3 nanoflowers (ii)
LiBH4 – 50 wt% Bi2Se3 nanosheets (iii) LiBH4– 50 wt% Bi2Te3 nanosheets 103
Figure 5-7: (c) and (d) are MS profile for the comparison of nanostructures and bulk Bi2X3 samples
mixed LiBH4 for dehydrogenation properties 104
Figure 5-7: (e) is MS profile for the comparison of nanostructures and bulk Bi2X3 samples mixed
LiBH4 for dehydrogenation properties 105
Figure 5-8: XRD profile of samples after heated to various temperatures with the same heating rate (a)
LiBH4 – 50 wt% bulk Bi2S3 106
Figure 5-9: XRD profile of samples after heated to various temperatures with the same heating rate
(b) LiBH4 – 50 wt% bulk Bi2Se3 107
xii
Figure 5-10: XRD profile of samples after heated to various temperatures with the same heating rate
(c) LiBH4-50 wt% bulk Bi2Te3 108
Figure 5-11: DTA profile of LiBH4-50wt% Bi2S3 composite with heating (downwards; endo) and
cooling (upwards; exo) profiles 109
Figure 5-12: TG-DTA and MS profile of 12LiBH4- Bi2S3 sample 110
Figure 5-13: TEM images (associated SADP) of LiBH4 - 50% Bi2S3 nanostructures (a) after milling
at room temperature (b) after heating at 50℃ (c) after heating at 100℃ (d) after heating at 150℃ (e)
after heating at 200℃(Image a to image e, measurements are on spot 1) 111
Figure 5-14: TEM Micrograph of LiBH4-50% Bi2S3 composite after milling and heating at different
temperatures. EDS profile was obtained from the position shown by the start point of arrow 112
Figure 5-15: TEM images (associated SADP) of (a) LiBH4 - 50% Bi2Se3 nanostructures at room
temperature on spot 1 (b) LiBH4 - 50% Bi2Se3 nanostructures at room temperature after heating on
spot 2 113
Figure 5-16: TEM Micrograph of LiBH4-50% Bi2Se3 composite after milling and heating at 450oC.
EDS profile was obtained from the position shown by the start point of arrow 114
Figure 5-17: TEM images (associated SADP) of (a) LiBH4 - 50% Bi2Te3 nanostructures at room
temperature on spot 1 (b) LiBH4 - 50% Bi2Te3 nanostructures at room temperature after heating on
spot 2 115
Figure 5-18: TEM Micrograph of LiBH4-50% Bi2Te3 composite after milling and heating at different
temperatures. EDS profile was obtained from the position shown by the start point of arrow 116
1
Chapter-1
Introduction
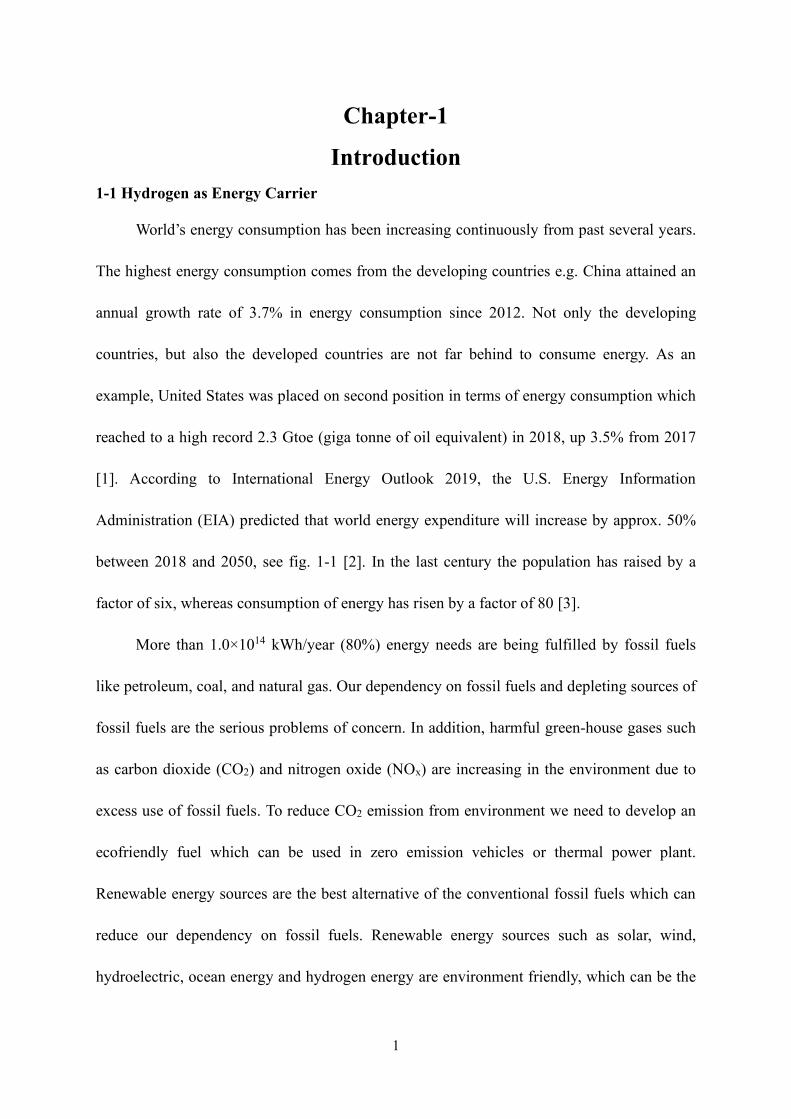
1-1 Hydrogen as Energy Carrier
World’s energy consumption has been increasing continuously from past several years.
The highest energy consumption comes from the developing countries e.g. China attained an
annual growth rate of 3.7% in energy consumption since 2012. Not only the developing
countries, but also the developed countries are not far behind to consume energy. As an
example, United States was placed on second position in terms of energy consumption which
reached to a high record 2.3 Gtoe (giga tonne of oil equivalent) in 2018, up 3.5% from 2017
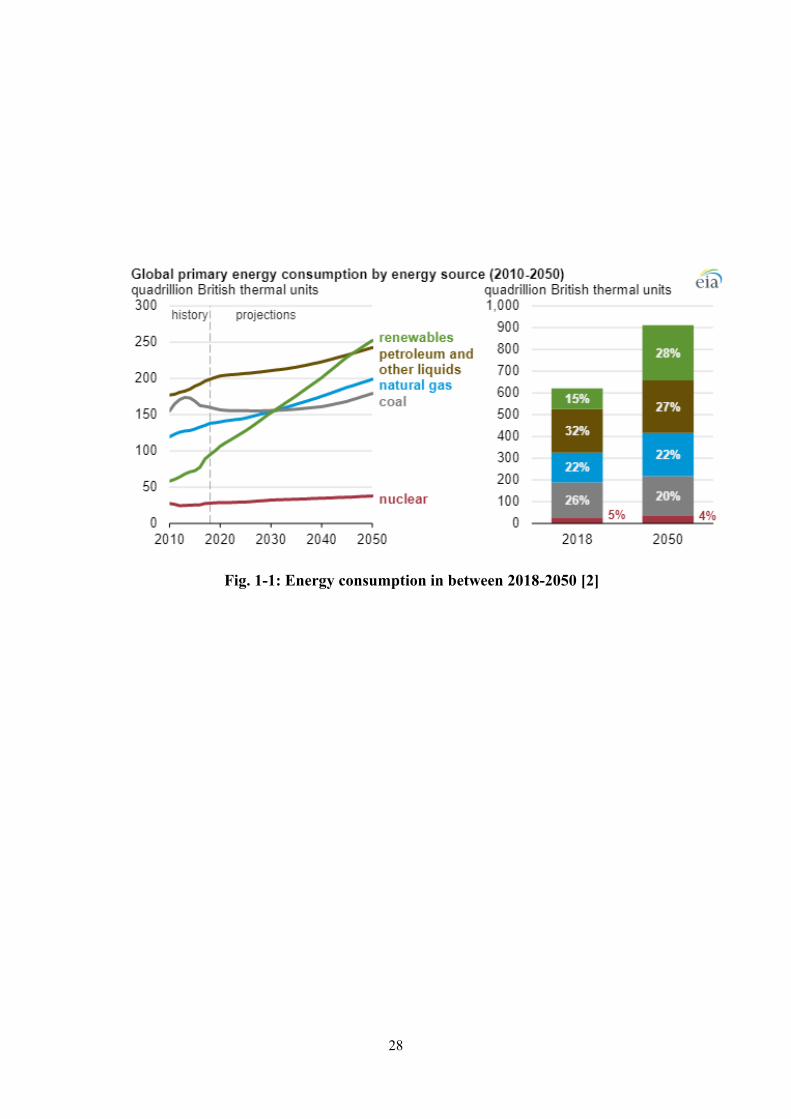
[1]. According to International Energy Outlook 2019, the U.S. Energy Information
Administration (EIA) predicted that world energy expenditure will increase by approx. 50%
between 2018 and 2050, see fig. 1-1 [2]. In the last century the population has raised by a
factor of six, whereas consumption of energy has risen by a factor of 80 [3].
More than 1.0×10¹⁴ kWh/year (80%) energy needs are being fulfilled by fossil fuels
like petroleum, coal, and natural gas. Our dependency on fossil fuels and depleting sources of
fossil fuels are the serious problems of concern. In addition, harmful green-house gases such
as carbon dioxide (CO2) and nitrogen oxide (NOx) are increasing in the environment due to
excess use of fossil fuels. To reduce CO2 emission from environment we need to develop an
ecofriendly fuel which can be used in zero emission vehicles or thermal power plant.
Renewable energy sources are the best alternative of the conventional fossil fuels which can
reduce our dependency on fossil fuels. Renewable energy sources such as solar, wind,
hydroelectric, ocean energy and hydrogen energy are environment friendly, which can be the
2
possible solutions of above-mentioned issues. However, the renewable energy sources
fluctuate and depend on the places. Hydrogen is necessary to make a balance between supply
and demand which is well-known as energy carrier in today’s world due to the following
features:
1. Hydrogen is one of the most abundant elements on the planet; but unfortunately, only less
than 1% is available in molecular form, the immense part is chemically bound in form of
water (H2O) and some of it is bound as volatile hydrocarbons.
2. The hydrogen atom is enticing because it consists of a proton and an electron, i.e. unlike
other elements of periodic table, hydrogen has the maximum ratio of number of valence
electrons to the protons (and neutrons). In case of hydrogen, the energy gain per electron
is 13.6 eV that is too high. The chemical energy per mass of hydrogen (39.4 kWh·kg−1) is
three times greater than that of other chemical fuels, e.g. liquid hydrocarbons (13.1
kWh·kg−1). This means - the energy content of 0.33 kg of hydrogen can be compared with
the energy content of 1 kg of oil [4].
3. The production of hydrogen is simple by using primary energy sources like solar power,
hydroelectric, wind power and ocean energy without emitting any pollutants like CO2 at
the time of fossil fuel combustion or usage.
4. Hydrogen is the energy carrier not the primary source of energy, it can be converted as
electric energy by using fuel cell. No pollutants are emitted from hydrogen while using in
fuel cell, water is the only product from fuel cell. Hydrogen can be used directly in
internal combustion (IC) engines as well.
3
1-2 Properties of Hydrogen
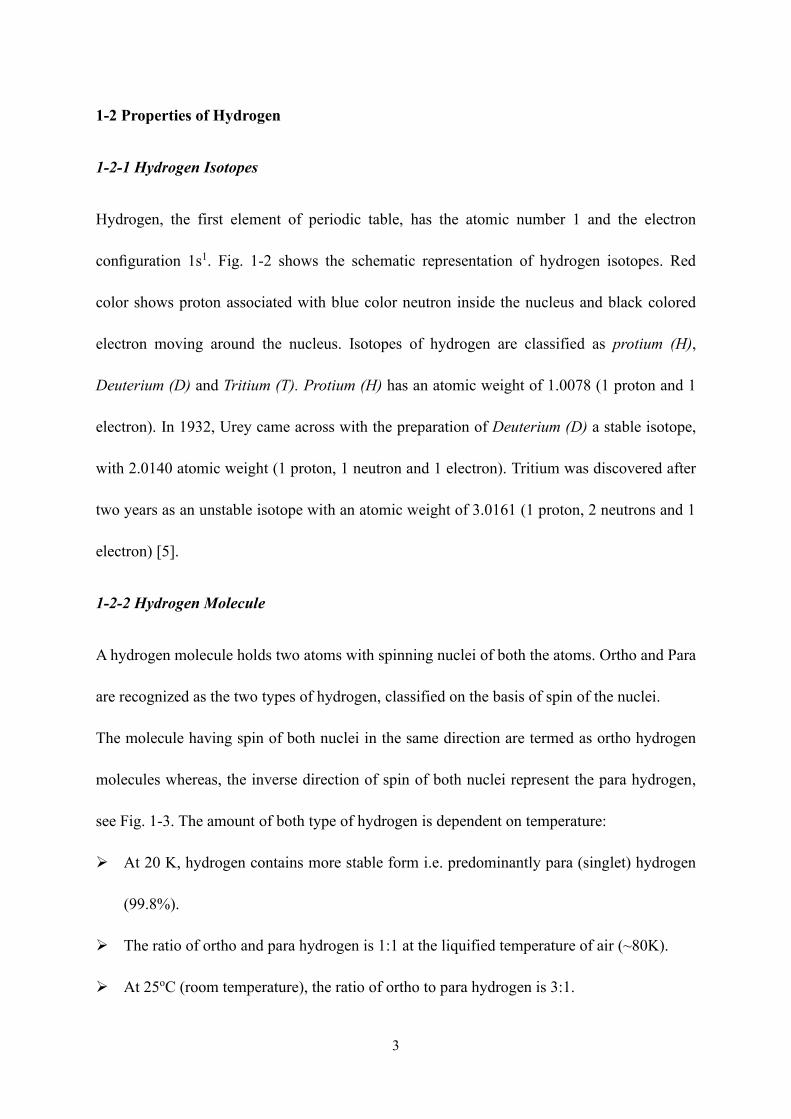
1-2-1 Hydrogen Isotopes
Hydrogen, the first element of periodic table, has the atomic number 1 and the electron
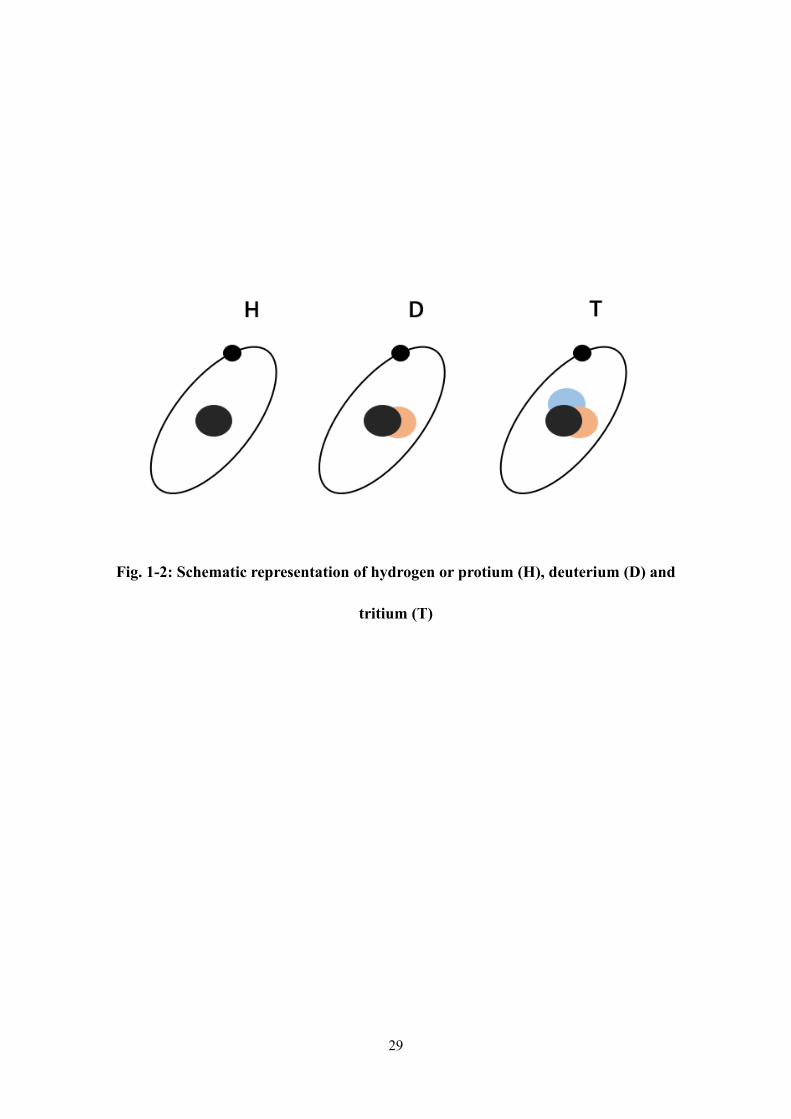
configuration 1s1. Fig. 1-2 shows the schematic representation of hydrogen isotopes. Red
color shows proton associated with blue color neutron inside the nucleus and black colored
electron moving around the nucleus. Isotopes of hydrogen are classified as protium (H),
Deuterium (D) and Tritium (T). Protium (H) has an atomic weight of 1.0078 (1 proton and 1
electron). In 1932, Urey came across with the preparation of Deuterium (D) a stable isotope,
with 2.0140 atomic weight (1 proton, 1 neutron and 1 electron). Tritium was discovered after
two years as an unstable isotope with an atomic weight of 3.0161 (1 proton, 2 neutrons and 1
electron) [5].
1-2-2 Hydrogen Molecule
A hydrogen molecule holds two atoms with spinning nuclei of both the atoms. Ortho and Para
are recognized as the two types of hydrogen, classified on the basis of spin of the nuclei.
The molecule having spin of both nuclei in the same direction are termed as ortho hydrogen
molecules whereas, the inverse direction of spin of both nuclei represent the para hydrogen,
see Fig. 1-3. The amount of both type of hydrogen is dependent on temperature:
➢ At 20 K, hydrogen contains more stable form i.e. predominantly para (singlet) hydrogen
(99.8%).
➢ The ratio of ortho and para hydrogen is 1:1 at the liquified temperature of air (~80K).
➢ At 25oC (room temperature), the ratio of ortho to para hydrogen is 3:1.
4
➢ Even at elevated temperatures, the ratio of ortho to para hydrogen cannot be exceeded
than 3:1.
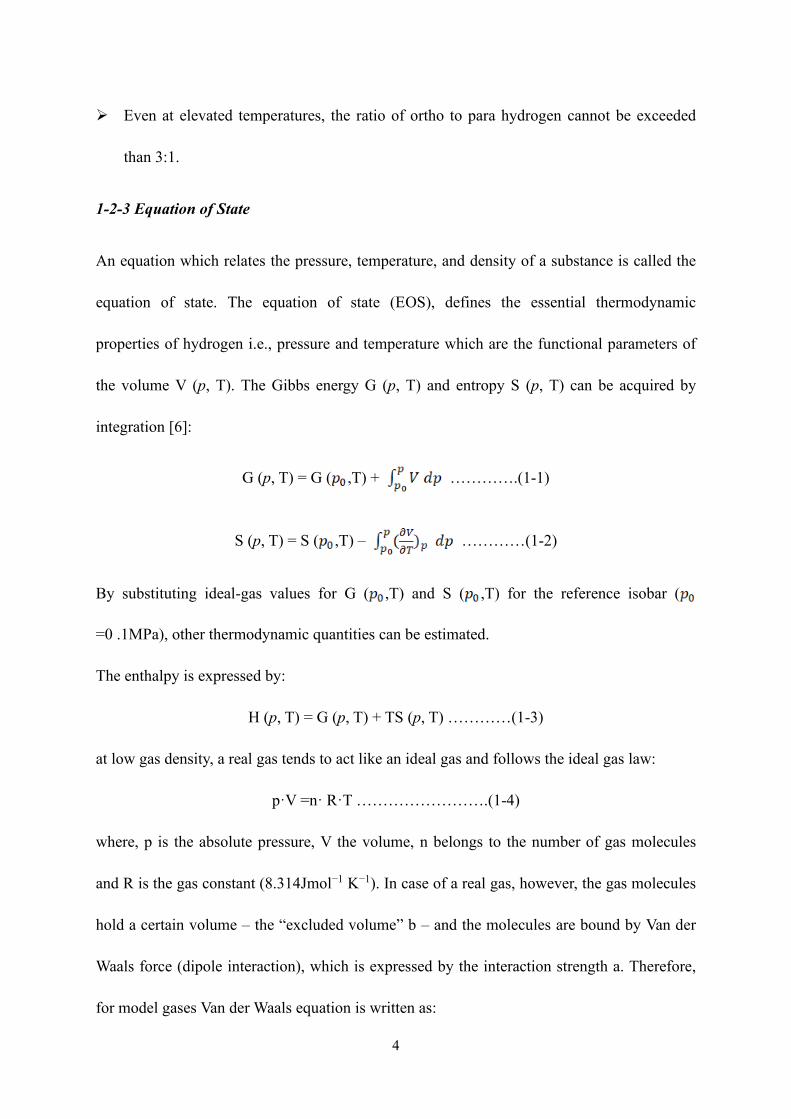
1-2-3 Equation of State
An equation which relates the pressure, temperature, and density of a substance is called the
equation of state. The equation of state (EOS), defines the essential thermodynamic
properties of hydrogen i.e., pressure and temperature which are the functional parameters of
the volume V (p, T). The Gibbs energy G (p, T) and entropy S (p, T) can be acquired by
integration [6]:
G (p, T) = G ( ,T) + ………….(1-1)
S (p, T) = S ( ,T) – …………(1-2)
By substituting ideal-gas values for G ( ,T) and S ( ,T) for the reference isobar (
=0 .1MPa), other thermodynamic quantities can be estimated.
The enthalpy is expressed by:
H (p, T) = G (p, T) + TS (p, T) …………(1-3)
at low gas density, a real gas tends to act like an ideal gas and follows the ideal gas law:
p·V =n· R·T …………………….(1-4)
where, p is the absolute pressure, V the volume, n belongs to the number of gas molecules
and R is the gas constant (8.314Jmol−1 K−1). In case of a real gas, however, the gas molecules
hold a certain volume – the “excluded volume” b – and the molecules are bound by Van der
Waals force (dipole interaction), which is expressed by the interaction strength a. Therefore,
for model gases Van der Waals equation is written as:

5
(p + ) {V-b(n)} = n· R·T……(1-5)
where, a(H2) = 2.476×10⁻² m6 Pa mol−2 and b(H2) = 2.661×10⁻⁵ m3 mol−1
The pressure as a function of the volume for a model gas is formulated as [6],[7]:
p (V) = ………… (1-6)
All the thermodynamic quantities can be obtained once the EOS is known [7].
There are several aspects which are needed to address in order to establish hydrogen economy.
Efficient hydrogen storage is one of these issues. The next section describes the various
storage methods of hydrogen.
1-3 Hydrogen Storage
Hydrogen storage is an important issue to consider while accounting the hydrogen as fuel.
The energy density of hydrogen [120 (LHV)-142 (HHV) MJ/kg] is almost 3 times of the
conventional fuels (natural gas: 43 MJ/kg and gasoline 44.4 MJ/kg). Less volumetric density
of hydrogen is the main issue of storage. The volumetric energy density of liquid hydrogen
(8.4 MJ/L) is less than half that of the other conventional fuels (natural gas 17.8 MJ/L,
gasoline 31.1 MJ/L) [8]. The target of hydrogen storage is to scale down the huge volume of
hydrogen gas i.e. to pack hydrogen as closely as possible. For this purpose, the volumetric
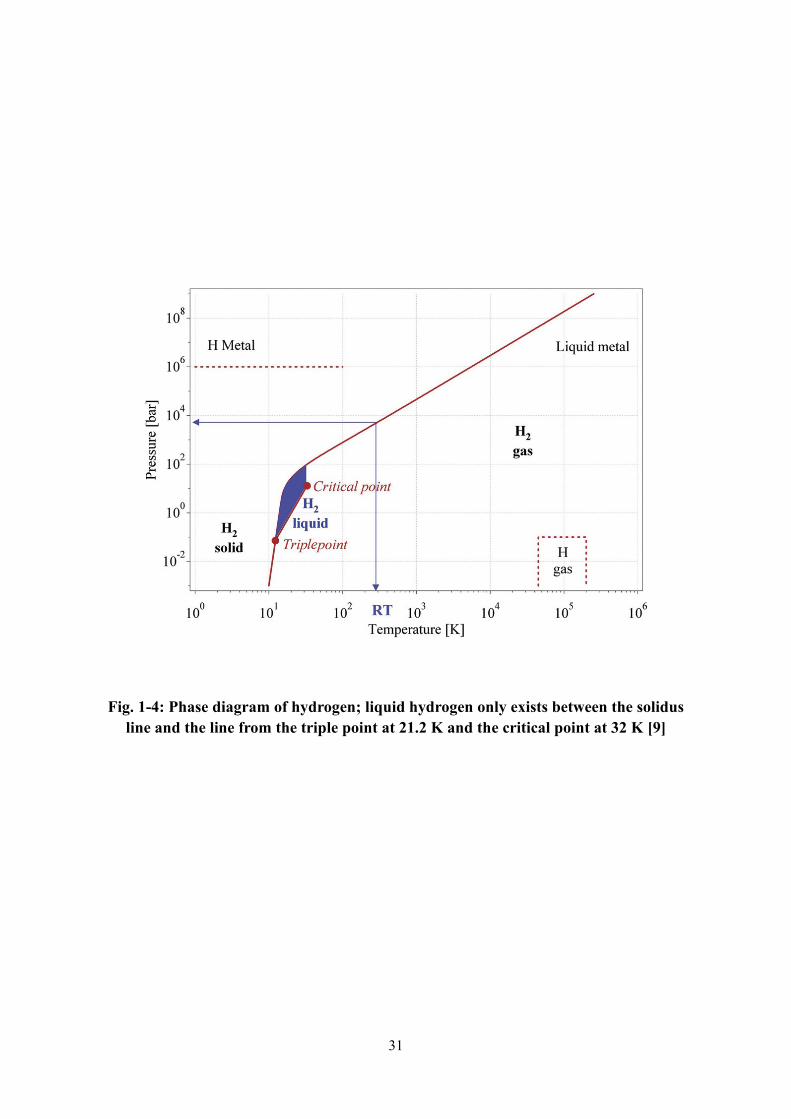
density should be highest by using smallest amount of storing material. Fig. 1-4 shows the
phase diagram of the hydrogen molecule H2. At lower temperatures (at 11K), hydrogen is a
solid with a density of 70.6 kg·m−3, and at higher temperatures (at 273K) it is a gas with a
density of 0.089886 kg·m−3 at atmospheric pressure. Hydrogen is in liquid form in a small
zone between the triple and critical points with a density of 70.8 kg·m−3 at 20K. To get high
6
density of hydrogen, several works have been accomplished to compress the gas and reduce
the temperature under the critical point. Following factors should be kept in mind when
planning to compact hydrogen: ease of technology, choice of material, refueling time,
handling, cost, safety aspects, high gravimetric and volumetric density at ambient
temperature and atmospheric pressure [9],[10],[11]. DOE targets for hydrogen storage
materials for onboard vehicles has been proposed time to time [12]. There is plenty of hope
because of the space shuttle program where hydrogen was used successfully by NASA [8].
Continuous efforts have been carried out by several government agencies, non-profitable
organizations and academicians. Several methods have been investigated by researchers and
scientists across the world to store hydrogen for onboard use [9],[10],[11],[13].
1-3-1 Storing hydrogen as a gas
Storing hydrogen in molecular form is possible, only in gas or liquid form. Storing hydrogen
under pressure is an oldest technique and has been used for many years. At present, gaseous
pressure vessels are the most common way to store hydrogen. Pressure vessels are used for
onboard hydrogen storage, commercially in FCV’s as Toyota Mirai and the Honda Clarity.
There are several reasons related to properties of materials and the operating costs, due to
which hydrogen gas are not stored in bulk at pressures more than 15-20 MPa. Due to the
limitations of storage pressure, the available density of hydrogen is also limited i.e. 7.8 kg/m3
at 10 MPa and 20°C. Small density of hydrogen means an enormous storage specific volume
and thus, a massive speculated cost. The first fuel cell vehicle utilized on board storage vessel
with 70 MPa pressure, but the overall cost was high due to the maintenance of high pressure
and the use of high-quality materials, like carbon fiber. Consequently, the use of these high
7
pressure vessels are not contemplated feasible for large stationary usage [14],[15]. Apart from
the large salt cavity storages underground, the search of some other alternative storage
become necessity due to unavailability of geological sights everywhere across the world. One
such alternative is to store hydrogen in a metal container. Corrosion is another main issue
when storage system is underground thus special coating is needed against corrosion which is
itself a task with high cost [14],[16].
1-3-2 Liquid hydrogen
There is conventional hydrogen liquefaction process which follows the three steps:
compression, cooling and expansion. Hydrogen has extremely low boiling point (−253°C at
0.1 MPa) and hydrogen in gaseous form doesn’t cool down throughout the throttling
operation (i.e., adiabatic, isenthalpic expansion) for temperatures more than around −73°C.
We need liquid nitrogen evaporation for precooling in the process of liquefaction. The first
liquefaction of hydrogen was reported by Sir James Dewar in 1898 [17]. High cost of
liquefaction is an important factor to be noted. Liquid hydrogen storage offers almost double
capacity if we compare with the gaseous hydrogen storage, but the volumetric capacity is less
for onboard vehicles according to the target of DOE. At present, the largest liquefaction plant
capacity in US is about 70,000 kg/day and the smallest liquefaction plant has a capacity of
about 6,000 kg/day [18].
1-3-3 Hydrogen Storage in Solid-State Materials
Apart from gas and liquid storage techniques here is an interesting technique to store
hydrogen that is to store in solid state materials (intermetallic and complex hydrides). There
8
is no chance of over pressure which is dangerous in case of compressed hydrogen storage, no
need of extensive energy that is required for liquid hydrogen and moreover, this technology is
associated with large volumetric capacities. This is the safest technique because of relatively
low operating pressures [19]. Scientists in this field, focused towards this third potential
solution for hydrogen storage. Several metals have capabilities due to their specific properties
that can help to absorb hydrogen in their metal lattice. Hydrogen storage materials can be
classified according to physisorption and chemisorption properties. If hydrogen is stored as
physically (by weak van der waals forces) bounded hydrogen on to a metal surface, it is
known as physiosorbed. On the other hand, if hydrogen is bound chemically on the metal
surface (e.g. metal hydride and complex hydride), it is known as chemisorbed hydrogen and
can be released by heating at certain temperature. The next section describes the details about
interaction of hydrogen with solid-state materials as well as their thermodynamic and kinetic
aspects.
1-4 Interaction of Hydrogen with Solids
Molecular or atomic hydrogen interacts with the surface layer of the host metal and make a
solid solution and metal hydrides by the process of adsorption/absorption. A metal–hydrogen
reaction can be written as eq 1-7:
………….(1-7)
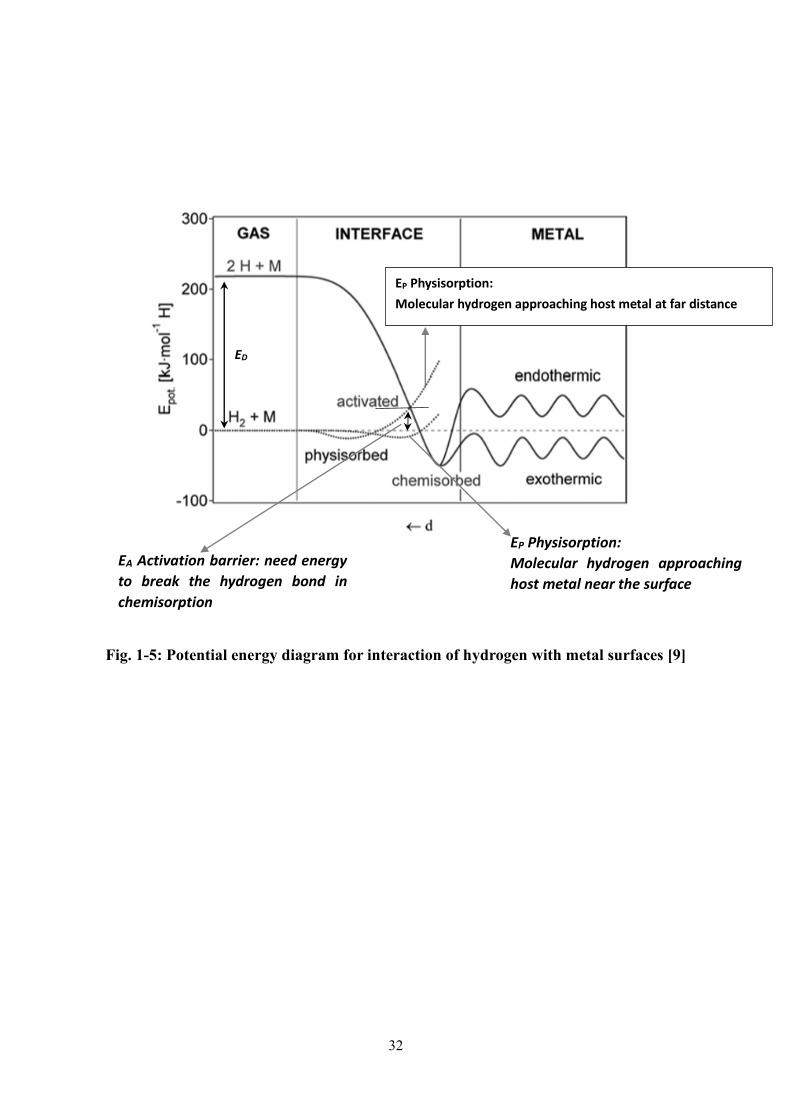
Hydrogen interaction with the metal surface can be understood by the potential energy
diagram as shown in Fig. 1-5. Far from the metal surface the molecular hydrogen and atomic
hydrogen are set apart by the heat of dissociation ED = 218 kJmol−1 H (4.746eV). The

9
potential energy curve for hydrogen approaching a solid surface typically shows two energy
minima with different depths; one at greater distance from the metal adsorbent (EPHYS = -5
kJ/mol H) corresponds to physical adsorption (shown as dotted line) and the other at smaller
distances (ECHEM = -50 kJ/mol H) corresponds to chemisorption (shown as solid line). The
first minima appear due to two different interactions when molecular hydrogen (gas)
approaching to metal surface. The first interaction is attractive interaction i.e. weak Van der
Waals force, while the other is repulsive terms, resulting into a shallow minimum at a
distance of approx. 1 molecular distance of hydrogen. In physisorption the gas is adsorbed to
the metal surface in its molecular state and not in atomic form. As we already discussed the
attraction is due to weak forces in physisorption thus it normally occurs at low temperatures.
Since there is no existence of activation energy barrier in physisorption, the process doesn't
have the kinetic issues. When hydrogen reach closer to the surface, the adsorbed hydrogen
molecule dissociates in atomic state at the metal surface by transferring an electron between
the metal and hydrogen and becomes chemisorbed. In this process, hydrogen molecule needs
to cross an activation barrier for dissociation which depends on the material properties. If
there are no activation energy barriers between the hydrogen molecule and material surface,
the molecule proceeds towards the surface without any trouble and dissociates into metal
atoms straight forward. On the other hand, if the activation energy is high, the reactants need
to be activated, either by heating or by adding some additives which can work as catalyst for
the reaction. For the dissociation of H–H bond, the total energy needed is, the energy required
to form metal hydride i.e. ΔHM−H and activation energy i.e. EA. Usually, at high temperature if
the barrier is higher and the potential well is smaller then, less stable hydride will be

10
formulated. On the other hand, in case of small activation barrier and deep potential well, a
stable hydride will form with fast kinetics [20],[21],[22].
1-4-1 Thermodynamics of Hydrogen Absorption/Desorption
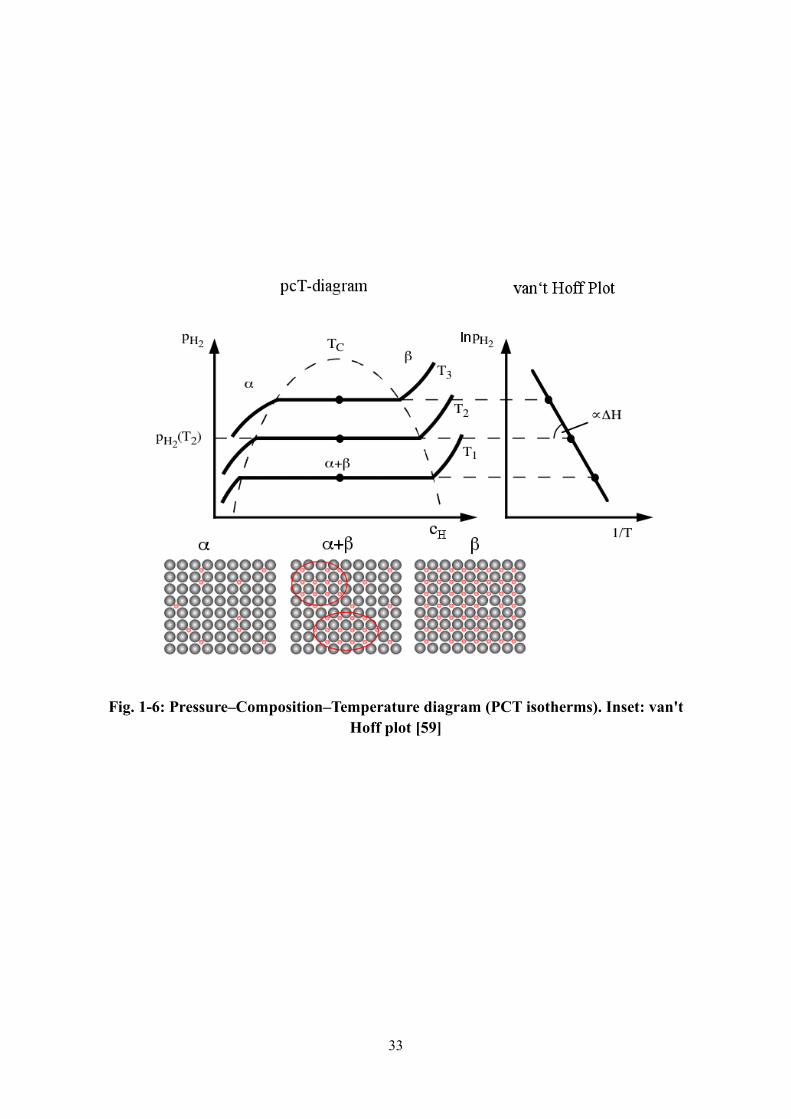
The thermodynamic features can be explained by Pressure–Composition isotherms (PCI) at
different temperatures, see fig. 1-6. Absorption process of hydrogen into the material begins
with the formation of solid solution (α phase) and when the utmost solid solution is gained, a
hydride phase (β phase) starts to form. At certain condition, the α phase and β phase exists
together and the isotherm shows a flat plateau. The length of plateau determines the quantity
of hydrogen stored in the metal. In β phase region, the hydrogen pressure increases sharply
with the hydrogen concentration. The two-phase region vanishes at the critical temperature
beyond which α phase changes to β phase continuously. Metal hydride formation can be
explained according to Gibbs phase rule:
…………(1-8)
Where, f = degree of freedom, c = number of components (metal and hydrogen), p = number
of phases (α, β and hydrogen gas)
At plateau there is just one degree of freedom exists. Therefore, a rise in hydrogen
concentration takes place with the depletion of α-phase at a constant pressure. When α-phase
is completely diminished, an additional degree of freedom is gained, and the hydrogen
concentration increases (β-phase) with the rising pressure of hydrogen. More stable hydrides
(ΔHf ⪡0) need elevated temperatures than that of less stable hydrides (ΔHf <0) to attain a
definite plateau pressure [21]. Gibbs free energy works as propulsion for the metal
hydride formation at a certain temperature and pressure. The negative Gibbs free energy -

11
suggest the thermodynamic feasibility of a reaction even if the sluggish kinetics due to high
activation barrier hinders the reaction to occur. Since is negative for hydriding reaction
( < 0), at low temperature, the large value of keeps negative during hydrogen
absorption. However, at elevated temperatures, - become larger than , resulting
to be positive. This makes dehydrogenation process thermodynamically favorable. This
explains why the hydrides in general need to be heated above 200oC for dehydrogenation
reaction [23].
For the simple reaction,
is then approximated by:
……………(1-9)
where, is the molar free energy at the reference state, is the hydrogen pressure,
is atmospheric pressure, R is gas constant and T is temperature
………………..(1-10)
Since is zero at equilibrium, combining above two equations gives the relation between
the equilibrium pressure ( ) and temperature (T), which is known as Van’t Hoff equation:
………………(1-11)
where, and are the changes in enthalpy and entropy, respectively. In the
hydrogenation process, the entropy change originate from the conversion of gaseous
hydrogen to solid hydrogen and its value is roughly equal to the standard entropy of hydrogen
and hence entropy of formation for all
metal-hydrogen system. for metal hydrides accompany to an important heat evolution
12
, (exothermic reaction) during the hydrogen absorption and vice versa in
desorption (endothermic reaction) of metal hydride. Hydrogen desorption below the room
temperature can get heat from environment itself. Whereas, if the desorption occurs beyond
the room temperature, the heat needs to provide from an outer source which may be the
burning of the hydrogen, at necessary temperature.
Enthalpy can specify the stability of metal hydride bond. The hydride enthalpy can be
calculated by the slope of the straight line gained by plotting versus 1/T. The
decomposition temperature for MPa (usually), Tdec = for . To
reach an equilibrium pressure of 0.1 MPa at 300 K, should amount to 39.2 .
The stability of metal hydrides is usually presented in the form of van’t Hoff plots. The
enthalpy of formation for the most stable hydrides are i.e. HoH2.
For the least stable hydride like , , the enthalpy of formations are
, and
respectively [22],[24].
1-4-2 Kinetics of hydrogen absorption and desorption
The rate of reaction cannot be obtained without the understanding of the hydrogen absorption
and desorption kinetics. The thermodynamic properties acquired from PCT measurements
can only give explanation about the driving force for the transformations, but it cannot
provide information on the speed of reaction. Activation barrier needs to overcome when it
comes to kinetic improvements. Fig. 1-7 shows a diagram of the energy barrier for the
hydrogenation/dehydrogenation reaction.
13
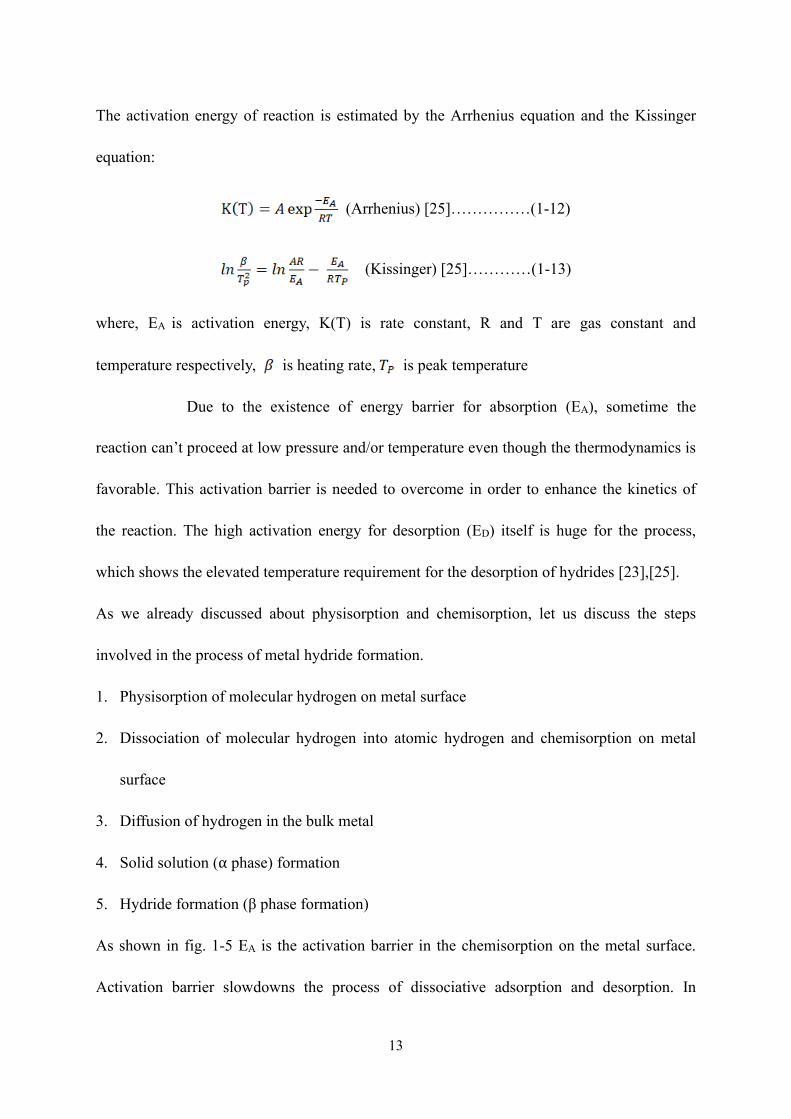
The activation energy of reaction is estimated by the Arrhenius equation and the Kissinger
equation:
(Arrhenius) [25]……………(1-12)
(Kissinger) [25]…………(1-13)
where, EA is activation energy, K(T) is rate constant, R and T are gas constant and
temperature respectively, is heating rate, is peak temperature
Due to the existence of energy barrier for absorption (EA), sometime the
reaction can’t proceed at low pressure and/or temperature even though the thermodynamics is
favorable. This activation barrier is needed to overcome in order to enhance the kinetics of
the reaction. The high activation energy for desorption (ED) itself is huge for the process,
which shows the elevated temperature requirement for the desorption of hydrides [23],[25].
As we already discussed about physisorption and chemisorption, let us discuss the steps
involved in the process of metal hydride formation.
1. Physisorption of molecular hydrogen on metal surface
2. Dissociation of molecular hydrogen into atomic hydrogen and chemisorption on metal
surface
3. Diffusion of hydrogen in the bulk metal
4. Solid solution (α phase) formation
5. Hydride formation (β phase formation)
As shown in fig. 1-5 EA is the activation barrier in the chemisorption on the metal surface.
Activation barrier slowdowns the process of dissociative adsorption and desorption. In
14
dissociation step, the hydrogen atom is highly mobile and is interactive with metal surface.
Further, chemisorbed atoms can penetrate in the sub-surface of metal and then diffuses into
the interstitial sites of the metal lattice. The kinetics in the bulk is strongly influenced by
mobility of atomic hydrogen. Fukai Y., [7] explains about the trapping phenomenon,
according to him hydrogen atom can be trapped at interstitial sites of some impurities and it
can jump to the neighbor sites by obtaining a heat energy from the phonon in the metal by
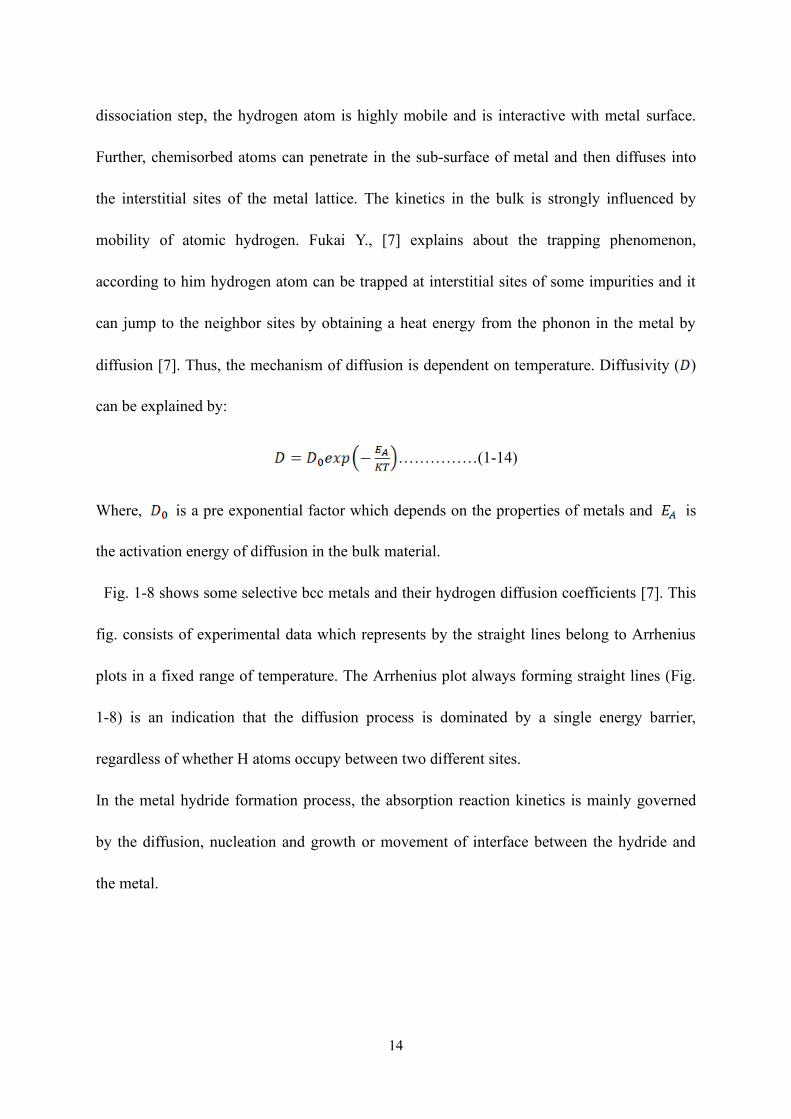
diffusion [7]. Thus, the mechanism of diffusion is dependent on temperature. Diffusivity ( )
can be explained by:
……………(1-14)
Where, is a pre exponential factor which depends on the properties of metals and is
the activation energy of diffusion in the bulk material.
Fig. 1-8 shows some selective bcc metals and their hydrogen diffusion coefficients [7]. This
fig. consists of experimental data which represents by the straight lines belong to Arrhenius
plots in a fixed range of temperature. The Arrhenius plot always forming straight lines (Fig.
1-8) is an indication that the diffusion process is dominated by a single energy barrier,
regardless of whether H atoms occupy between two different sites.
In the metal hydride formation process, the absorption reaction kinetics is mainly governed
by the diffusion, nucleation and growth or movement of interface between the hydride and
the metal.
15
1-5 How to tune thermodynamics and kinetics of hydrogen absorption /desorption
1-5-1 Thermodynamic Alteration
There are a lot of hydrides which have good thermodynamics which is helpful in taking and
releasing the hydrogen at ambient conditions. But search is still continuing to have a
combination of good kinetics and suitable thermodynamics of hydrides which can have better
gravimetric capacity and can compete with 70 MPa compressed vessel in terms of weight.
Several hydrides, borohydrides and complex hydrides such as LiH, MgH2 and LiBH4 have
high gravimetric density but cannot desorb hydrogen at appropriate temperature or pressure
due to thermodynamic constraints. To overcome this thermodynamic issue, usually a third
element/additive or reactive hydride composites can be introduced. By the addition of these
additives one can alter the enthalpy of reaction and hence improve the thermodynamics. To
understand this more precisely, we can take an example of metal hydride system which
desorb hydrogen to achieve its dehydrogenated state M with enthalpy X, see fig. 1-11. One
can achieve more stable state i.e. MAn than pure metal M by alloying with element A having
a formation energy Y, which in turn reduce the enthalpy equals to X-Y for a transition
between MAn + H2 (dehydrogenated state) and MH2 + nA (hydrogenated state). Thus, metal
hydride system MH could be destabilized efficiently [26]. LiBH4 has high gravimetric
capacity 18.5 wt% but it releases H2 at a temperature around 450°C. The addition of dual
cation borohydrides MLim-n(BH4)m (M = Zn, Al, Zr) and MClx in LiBH4 by ball milling was
introduced by Li et al. [27]. They found that these double-cation borohydrides were easy to
decompose, and the method was effective to adjust the thermodynamic stabilities of metal
borohydrides. Some researchers found that combining the borohydride with metal hydride
16
(MgH2) or complex hydrides (Mg2NiH4) was also effective technique to improve the
dehydrogenation properties of metal borohydrides like LiBH4 [28]. There is always an
aspiration to search an efficient hydrogen storage material having superior thermodynamics.
1-5-2 Kinetic Alteration
Various routes have been proposed for decreasing the activation barrier and increasing the
kinetics of hydrogen absorption/desorption, e.g. nano scaling and use of catalyst.
Nano-scaling is an efficient way to lower the activation barrier through the creation of fresh
and large surface, decreased diffusion distance for H atoms, however, agglomeration and
difficult preparation of nano-sized material create bottleneck to adopt this method for
practical/industrial use. On looking for the alternative approach, the use of catalysts plays a
vital role to overcome the activation energy barrier in metal–hydrogen reaction. Catalyst can
enhance the rate of reaction without changing the thermodynamics of Metal hydride system.
Amount of catalyst is important in sample, i.e. to maintain the overall gravimetric capacity of
the active sample, minimum amount of catalyst is possibly good. Highly dispersive catalyst
has the high efficiency to boost up the reaction. Some researchers reported that alloying is
one of the methods to alter the kinetics of reaction but in actual alloying change the
thermodynamics, not the kinetics.
KH as excellent catalyst for metal hydrogen system
A breakthrough discovery of potassium hydride as catalyst was achieved by Wang et al., to
stimulate Mg(NH2)2/2LiH system. They proposed that potassium diffused into the imide or
amide phases and then combined with nitrogen. Due to which the N-H bonds were

17
diminished, that directly affected the dehydrogenation of the system and enhanced it. The
hydrogen desorption peak was shifted for Mg(NH2)2/LiH system, to the lower temperature
132oC by the addition of KH from 186oC (without KH), as shown in fig. 1-9 [29]. This
discovery attracted the researchers towards this magical catalyst. Many researchers worked
on the mechanism of Li–Mg–N–H reaction with KH. In 2011, Teng et al. [30] proposed a
new mechanism that the dehydrogenation improvement was occurred because of the reaction
of KH with NH3 which produced KNH2 and then KNH2 again reacted with LiH to regenerate
KH. This process continued in loop and hence enhanced the decomposition of Mg(NH2)2/LiH
system through the pseudo-catalytic effect of potassium hydride. The hydrogen desorption
kinetics of LiH–NH3 system was drastically improved by the inclusion of a little amount of
KH and heating up to 100oC [30]. Later in 2012, Durojaiye et al. compared the two systems
LiNH2 + MgH2 and 2LiNH2 + MgH2 and found that the (2LiNH2 + MgH2) system had a
lesser decomposition temperature and a rapid kinetics. They concluded that KH was efficient
as catalyst to increase the hydrogen desorption rates of (2LiNH2 + MgH2) system but it
doesn’t have any influence on the (LiNH2 + MgH2) system. The activation energy was
decreased to 87 kJ/mol H2 (for 1.9LiNH2 + MgH2+0.1KH) from 119 kJ/mol H2 for 2LiNH2 +
MgH2 system [31]. Recently, LiNH2–LiH system was investigated for the effect of KH as
catalyst and the hydrogen release temperature was reduced by approx. 30°C. The activation
energy of the 5 mol% KH-added sample i.e. LiNH2–LiH–0.05KH sample was found 90.4 kJ
mol−1, lowered by ∼13% than undoped LiNH2–LiH (103.1 kJ mol−1) system. Dong et al.
claimed reactivity of KH with NH3 as a root cause for the enhancement of the desorption
kinetics. Also, KH acted as a catalyst to accelerate the liberation of hydrogen by cyclic
18
reactions [32]. Hence, we could understand the role of catalyst to improve the kinetics in
hydrogen storage systems. Apart from nano-sizing, use of appropriate catalyst like potassium
hydride (KH) can tune several systems kinetically. Many other systems need to be modified
and, in this context, the effect of KH as a magical catalyst can be explored to reduce the
activation barrier and advancement of research in hydrogen storage field.
1-6 Solid state hydrogen storage materials
The US Department of Energy (DOE) set the targets as long-term vision for hydrogen-storage
applications accounting handling and storage cost as well as environmental parameters [33].
These targets for hydrogen storage systems are given in Table 1-1.
Table 1-1: The US DOE hydrogen storage targets for automobile applications [33],[34]
Year 2006 2015 2020
Gravimetric capacity 2kWhkg-1system
(6wt% hydrogen)
3kWhkg-1system
(9wt% hydrogen)
1.5kWhkg-1system
(4.5wt% hydrogen)
Volumetric capacity 0.045kgH2L-1
system
0.081kgH2L-1
system
0.030kgH2L-1 system
Cost US$4/kWh US$2/kWh US$10/kWh
These data clearly indicate the importance of both gravimetric and volumetric capacity of the
storing media, as the storing media of hydrogen should not be large and bulky or shouldn’t
occupy too much volume. Cycling property is as well significant so that the storage can be
frequently cycled. Charging time is also important to consider and must not be longer than
3–5 minutes.
The hydrogen storage materials can be classified on the basis of binding nature of hydrogen:
19
physically bound hydrogen, chemically bound hydrogen (e.g. metal hydrides and complex
hydrides). In the first type of storage materials, hydrogen is attached to the surface through
weak van der waals interactions. Porous materials that lies in this category, are activated
carbon, carbon materials having high surface area, zeolites and metal–organic frameworks
(MOFs) [33]. Even though hydrogen physisorption process is weak exothermic, thus a heat
management problem at the time of refueling occurs, that requires liquid nitrogen
additionally to maintain the temperature at 77K. These reasons make porous materials
unattractive for automobile on-board storage, but room temperature and high-pressure
systems are still considered. However, they attracted the attention because of their reduced
cost in comparison of liquid hydrogen for tanks and availability of compatible sizes.
Metal hydrides have larger storage density (6.5 H atoms/cm3 for MgH2) in
comparison to the hydrogen gas (0.99H atoms/cm3) or liquid hydrogen (4.2H atoms/cm3),also
attractive while considering the safety points [35]. Thus, solid state hydride is considered as
safe with high energy density for onboard vehicular applications. An efficient storage
material needs the following properties:
➢ High energy density i.e. high hydrogen content per unit mass and volume
➢ Reduced temperature and pressure for dissociation
➢ Decreased heat of formation to reduce the required energy for dehydrogenation
➢ Good reversibility
➢ Less activation barrier i.e. good kinetics
➢ Reduced cost and good safety features
Enormous efforts were put for optimizing the conditions and to improve the various
20
materials used for hydrogen storage. MgH2, FeTi, LaNi5 and MmNi5 are some commonly
studied metal hydrides/materials. These storage materials are classified in 2 categories based
on their simplicity and bonding nature, which will be explained in the subsequent section.
1-6-1 Metal hydrides
Metal hydrides consist of metal and hydrogen by forming a single type bonding (covalent,
ionic or metallic) between them. These materials showed great potentials in the field of
hydrogen storage. Metal hydrides have wide variety of class and can be classified as
intermetallic compounds (AB5, AB, AB2, A2B and AB3-type alloys), where A is the element
with good hydrogen affinity, while B is the metal with no or low affinity with hydrogen just
to tune the hydrogenation properties of base metal. MgH2 has been considered as an efficient
metal hydride which contains a high H2 storage capacity i.e. 7.7wt% with adequate
reversibility and an additional benefit of small cost of magnesium. However, it needs high
decomposition temperature of 300℃ at 0.1 MPa pressure with the disadvantage of slow
absorption and desorption kinetics. Most of the magnesium-based materials have an excellent
cyclic stability, but the problem of high temperature and poor kinetics still remains to restrict
its use for on-board vehicles [35],[36]. LaNi5 is another popular material which has been
studied widely across the world. In comparison of MgH2, the intermetallic compound shows
better storage characteristics, but the problem is associated with the gravimetric amount of
stored hydrogen which is very low. At moderate temperature the hydrogen storage capacity of
LaNi5 doesn’t exceed than 1.4wt% [37],[38].
1-6-2 Complex hydride
21
Due to the low hydrogen content of conventional metal hydrides, several hydrides termed as
complex hydrides were developed by using light elements. Some typical example of these
complex hydrides include alanates (sodium, potassium, lithium and calcium alanates),
borohydrides (lithium, zinc, sodium and calcium borohydrides), amides (lithium amide),
metal ammine complexes, chemical hydrides and Mg-based alloys [39]. Complex hydrides
are salt like materials in which hydrogen is covalently bound to the central atoms and this
unit is attached with the cation through ionic bonding. Generally, the complex hydrides can
be represented as AxMeyHz, where A is preferentially occupied by elements of the 1st and 2nd
groups of the periodic table and Me is commonly employed by boron, aluminum or nitrogen.
An extreme interest has been grown in light weight complex hydrides such as alanates
[AlH4]-, amides [NH2]
-, imides and borohydrides [BH4]-. The term alanates also known as
aluminohydrides belongs to the compounds having hydrogen and aluminum associated with
metal. Solium aluminium hydride (NaAlH4) has been considered the most popular candidate
of the alanates family along with some more like LiAlH4, Mg(AlH4)2, KAlH4, Na2LiAlH6,
Ca(AlH4)2, K2NaAlH6. Imides and amides are also considered potential complex hydride due
to their excessive storage density and lesser operating temperature, but these are legging due
to their sluggish kinetics which limit them to be used practically onboard. Borohydrides
(tetrahydroborate), are the noteworthy types of complex hydrides which are formed through
covalently bonded hydrogen to the central atoms in the [BH4]− complex anion. They are
recognized because of their higher gravimetric and volumetric hydrogen capacity.
Borohydrides comprises of general formula M(BH4)n (M = Mn, Zn, Al, Be, Y, Dy, Gd, Zr, Rb,
Cs; n = 1, 2, 3, 4; B is boron and H belongs to hydrogen) and some of popular are NaBH4,
22
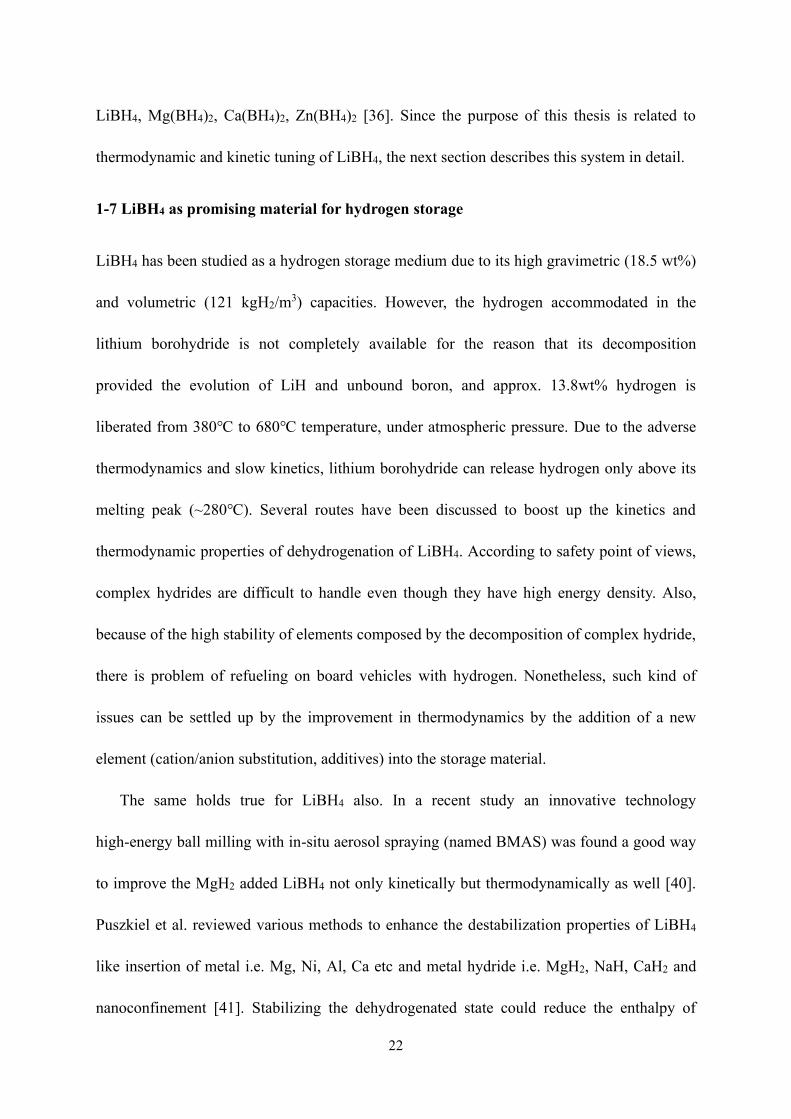
LiBH4, Mg(BH4)2, Ca(BH4)2, Zn(BH4)2 [36]. Since the purpose of this thesis is related to
thermodynamic and kinetic tuning of LiBH4, the next section describes this system in detail.
1-7 LiBH4 as promising material for hydrogen storage
LiBH4 has been studied as a hydrogen storage medium due to its high gravimetric (18.5 wt%)
and volumetric (121 kgH2/m3) capacities. However, the hydrogen accommodated in the
lithium borohydride is not completely available for the reason that its decomposition
provided the evolution of LiH and unbound boron, and approx. 13.8wt% hydrogen is
liberated from 380℃ to 680℃ temperature, under atmospheric pressure. Due to the adverse
thermodynamics and slow kinetics, lithium borohydride can release hydrogen only above its
melting peak (~280℃). Several routes have been discussed to boost up the kinetics and
thermodynamic properties of dehydrogenation of LiBH4. According to safety point of views,
complex hydrides are difficult to handle even though they have high energy density. Also,
because of the high stability of elements composed by the decomposition of complex hydride,
there is problem of refueling on board vehicles with hydrogen. Nonetheless, such kind of
issues can be settled up by the improvement in thermodynamics by the addition of a new
element (cation/anion substitution, additives) into the storage material.
The same holds true for LiBH4 also. In a recent study an innovative technology
high-energy ball milling with in-situ aerosol spraying (named BMAS) was found a good way
to improve the MgH2 added LiBH4 not only kinetically but thermodynamically as well [40].
Puszkiel et al. reviewed various methods to enhance the destabilization properties of LiBH4
like insertion of metal i.e. Mg, Ni, Al, Ca etc and metal hydride i.e. MgH2, NaH, CaH2 and
nanoconfinement [41]. Stabilizing the dehydrogenated state could reduce the enthalpy of

23
dehydrogenation and hence could increase the equilibrium hydrogen pressure. This approach
could be used to boost the thermodynamic properties of many hydrogen storage materials.
There is still a craving to improve the destabilization properties of LiBH4 in such a way that it
can be used practically onboard vehicles. Nanoconfinement or the addition of catalysts can
also be used for thermodynamic destabilization [42],[39]. An effective approach was
proposed by Reilly and Wiswall [43] in 1967, that the stability of a borohydride could be
lowered by combining it with a suitable reaction metal (such as aluminum, magnesium or
titanium). The main disadvantage of this approach was the reduced gravimetric hydrogen
storage capacity due to the additional weight of the metal. Instead of the metal doping the use
of an appropriate hydride could maintain a high hydrogen storage capacity with the formation
of fully reversible systems under moderate temperature and hydrogen pressure conditions.
Such systems are called Reactive Hydride Composites (RHC). Reactive Hydride Composite
systems are not only based on borohydrides in fact, one of the first reported RHC was the
LiNH2–LiH system [44],[45]. In case of borohydrides, the RHC approach attracted a lot of
attention, after the encouraging experimental results about the LiBH4–MgH2 system
published by Barkhordarian et al. [46] and Vajo et al. [47]. The enthalpy of the destabilization
reaction with a capacity of approx. 8-10 wt % was reduced by 25 kJ/mol H2 in comparison of
pure LiBH4. This system was reported to desorb hydrogen at 225oC at equilibrium pressure of
1 bar, thus showed nice destabilization of LiBH4 using MgH2, however the sorption kinetics
still remained an issue [48]. This interesting system is described in the subsequent section.
1-8 2LiBH4 - MgH2 System
According to Puszkiel et al. [41], the reaction for the destabilization of the LiBH4 system by

24
the inclusion of MgH2 is as follows:
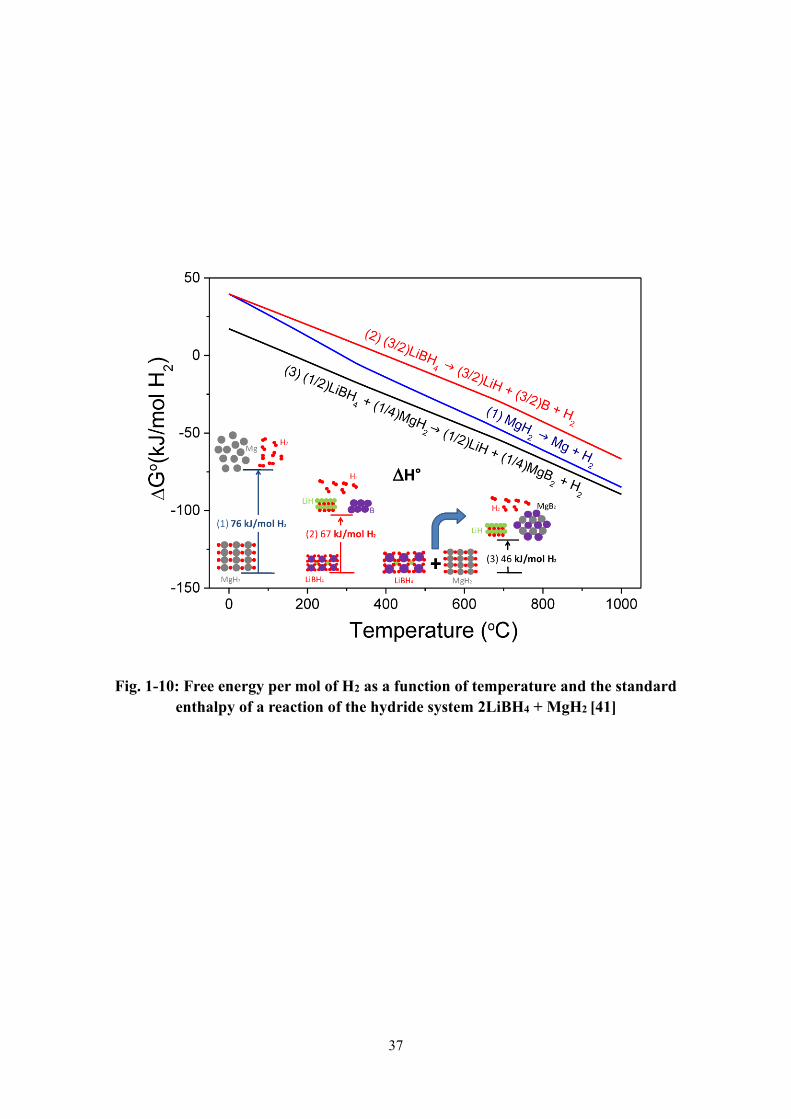
MgH2(s) + 2LiBH4(s) ⇆ MgB2(s) + 2LiH(s) + 4H2(g)…… (1-15)
The theoretical reaction enthalpy was decreased to 46 kJ mol−1 H2 than that of individual for
MgH2 and LiBH4 76 kJ mol−1 H2 and 67 kJ mol−1 H2 respectively [48]. Destabilizing both
hydrides (MgH2 and LiBH4) by the RHC concept was predicted to reduce the desorption
temperature till 40°C under 0.1MPa of H2 due to the low enthalpy value. The reaction is
exothermic and MgB2 is the formation product according to the reaction (1-15).
MgH2:2LiBH4 -RHC system has the theoretical gravimetric capacity of 11.4 wt%. Fig. 1-10
indicates the free energy and the standard enthalpy of reaction per mol of H2 emerging from
the united destabilization of LiBH4 and MgH2 [41]. In 2005, Vajo et al. [48] first published a
work about the destabilization of MgH2:2LiBH4-RHC system, and Barkohrdarian et al. [46]
also initiated the concept of RHC in 2006-07. The MgH2:2LiBH4-RHC system was found
different from the metal-hydrogen systems in terms of entropy values, this phenomenon was
found to be related with the [BH4]− cluster configuration upon hydrogen interaction. In order
to understand MgH2:2LiBH4-RHC system, investigations into reaction route considering
factors like temperatures, pressures, and stoichiometric compositions were executed by many
researchers. The findings were fascinated on the hydrogen release steps (pathways). In 2007,
Bösenberg et al. [49] firstly discussed the hydrogenation/dehydrogenation reaction steps of
MgH2:2LiBH4-RHC system. On hydrogenation of MgB2 + 2LiH system, lithium borohydride
and magnesium borohydride were promptly formed in one reaction step at quite moderate
conditions, 250–300°C temperature and 5 MPa of hydrogen pressure. A two steps process has
been noticed during this process: first, the dehydrogenation of MgH2 and after that the
25
decomposition of LiBH4. This system was decomposed into the MgB2 and lithium hydride
with the liberation of hydrogen gas. This two-stage reaction pathway revealed kinetic
limitations, resulting the elevated dehydrogenation temperatures more than 400℃ and below
0.3-0.5 MPa of hydrogen pressure. The thermodynamic and kinetic studies to check the
reversibility of the MgH2:2LiBH4-RHC system by the addition of TiCl3 was reported by
Pinkerton et al [50]. In their work, a phase diagram was established for the desorption process
from vacuum to 0.5 MPa pressure and from 250℃ to 500℃ temperature.
Thermodynamically and kinetically LiBH4 prefer to decompose into LiH and amorphous
boron whereas MgH2 decompose to Mg and H2, at pressure less than 3 bar and temperature
more than 400℃. Under the certain conditions i.e. from 280℃to 450℃ and pressures
between 0.3 and 0.5 MPa MgH2 and LiBH4 were decomposed separately, however, the
generation of MgB2 and LiH was encouraged as ultimate outcomes. The findings were on the
track and matched with the outcomes reported by Bösenberg et al [49]. Nakagawa et al. also
reported their investigations on the consequence of the hydrogen backpressure on the
hydrogen release of MgH2:2LiBH4-RHC [51]. They confirmed the presence of free boron and
metallic Mg upon dehydrogenation under an inert gas atmosphere. MgH2:2LiBH4-RHC
system represented sluggish kinetic behavior, needed long time for the hydrogen uptake and
release. To understand the reaction mechanism of MgH2:2LiBH4-RHC system, several
additives were enrolled by many researchers to speed up its kinetics. Despite of the fact the
hydrogen storage properties of MgH2:2LiBH4-RHC system were noticeably revamped, the
need of temperature more than 350℃ is still a vital hinderance for a feasible use [41].

26
1-9 LiBH4 as solid electrolyte and its use for Bi2X3 anode materials in all-solid-state
Li-ion battery
Apart from the hydrogen storage field, LiBH4 has also attracted attention because of its high
ionic conductivity [52]. It was proposed to be used as solid-state electrolyte in battery
applications for the first time by Takahashi et al.[53]. The cell was made of anode material Li,
electrolyte LiBH4 and cathode as LiCoO2. Even if LiBH4 showed excellent compatibility
with Li-electrodes, a resistance was found at the interface because of the reaction between
LiBH4 and LiCoO2. To overcome this issue, a layer linking electrolyte and cathode material
was developed which reduced the resistance and allowed the discharge capacity of 89 mAh
g−1 at a constant current density of 0.05 mA cm−2. They concluded that a complex
borohydride LiBH4 may be used as an excellent electrolyte with oxide-based electrodes [53].
After this, many other researchers used LiBH4 as solid electrolyte because it has high
conductivity at elevated temperatures i.e. more than 120oC. [54],[55],[56]. Recently our
group demonstrated that LiBH4 can be used as solid electrolyte for Li-ion batteries and Bi2Te3
nanostructures prepared by wet chemical method as anode material. Excellent discharge
capacities of 550.5 mAhg−1 & 539.6 mAhg−1 were achieved for nanoparticles and nanosheets.
These capacities were found higher than 401 mAhg−1 i.e. the theoretical capacity of Bi2Te3
nanostructures. Singh et al., discussed the possible reasons of the higher capacity than the
theoretical one. They mentioned that one of the possibilities is the side reaction between
Li-ions, acetylene black and oxide phase as well at the time of the charging of battery.
Another possible reason was the existence of non-reacted elemental bismuth and tellurium
that could take part in battery experiment. They mentioned the theoretical capacities as 384.7
mAhg−1 and 420 mAhg−1 respectively and not so high in case of elemental Bi and Te phases.
27
Therefore, the strong possibility was the side reaction of Li-ions with the acetylene black and
with oxide phase. Fortunately, this was matched with the obtained high theoretical capacity of
Bi2O3 and TeO2 i.e. 690.2 mAhg−1 and 1007.5 mAhg−1 respectively [57]. To further examine
the compatibility of LiBH4 with Bi2Te3, Kumari et al., [58] synthesized the Bi2Te3 nanosheets
by the solvothermal method and performed the electrochemical reaction between the Bi2Te3
nanosheets and Li-ion while using lithium borohydride as a solid electrolyte. The first
discharge and charge capacities were found to be 555 mAhg−1 & 1290 mAhg−1 for Bi2Te3
nanosheets as anode material. In the time of the charging-discharging experiment, an
unexpected but spectacular gas liberation was analyzed, which followed by an opening of the
battery. This motivated us to think of the role of chalcogenides (Bi2X3, X= S, Se and Te)
materials in the role of destabilization agent for LiBH4 and formed as one of the motivation
of this work.
28
Fig. 1-1: Energy consumption in between 2018-2050 [2]
29
Fig. 1-2: Schematic representation of hydrogen or protium (H), deuterium (D) and
tritium (T)

30
Fig. 1-3: Ortho and para hydrogen
31
Fig. 1-4: Phase diagram of hydrogen; liquid hydrogen only exists between the solidus
line and the line from the triple point at 21.2 K and the critical point at 32 K [9]
32
Fig. 1-5: Potential energy diagram for interaction of hydrogen with metal surfaces [9]
EP Physisorption:
Molecular hydrogen approaching host metal at far distance
EA Activation barrier: need energy
to break the hydrogen bond in
chemisorption
EP Physisorption:
Molecular hydrogen approaching
host metal near the surface
ED
33
Fig. 1-6: Pressure–Composition–Temperature diagram (PCT isotherms). Inset: van't
Hoff plot [59]
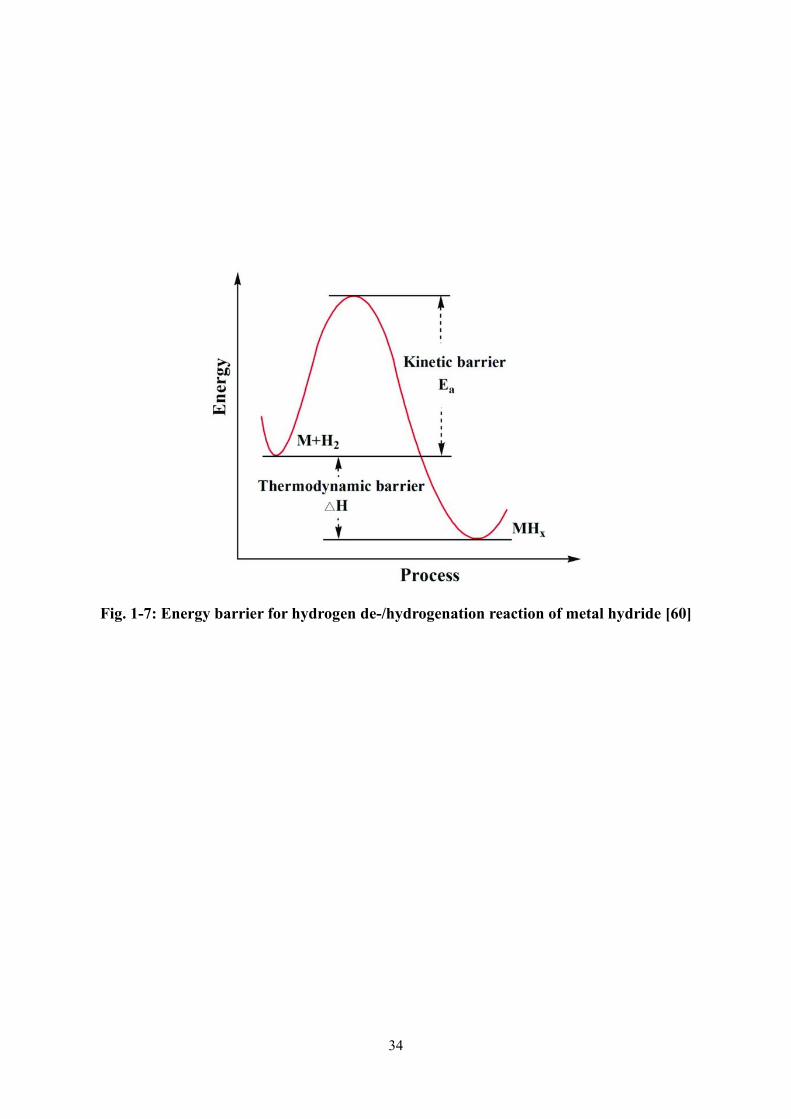
34
Fig. 1-7: Energy barrier for hydrogen de-/hydrogenation reaction of metal hydride [60]
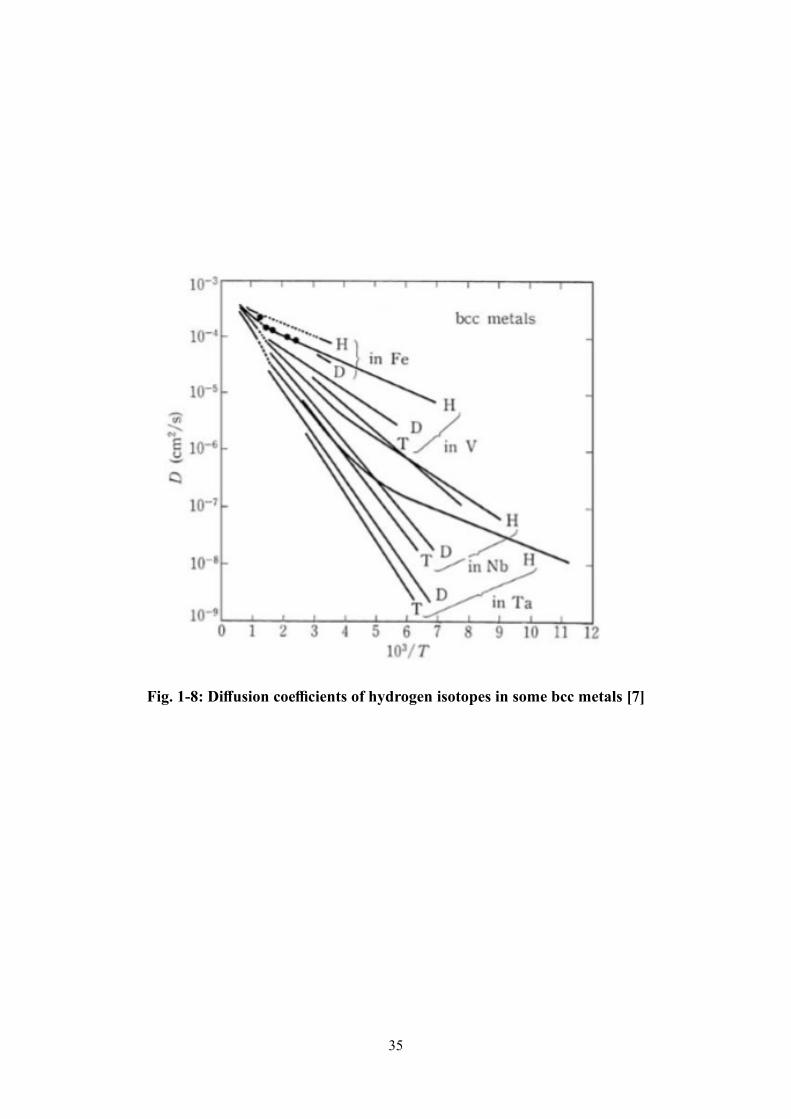
35
Fig. 1-8: Diffusion coefficients of hydrogen isotopes in some bcc metals [7]

36
Fig. 1-9: Temperature dependences of H2 and NH3 release from the potassium-modified
(—) and the pristine samples (‐ ‐ ‐ ‐) [29]
37
Fig. 1-10: Free energy per mol of H2 as a function of temperature and the standard
enthalpy of a reaction of the hydride system 2LiBH4 + MgH2 [41]
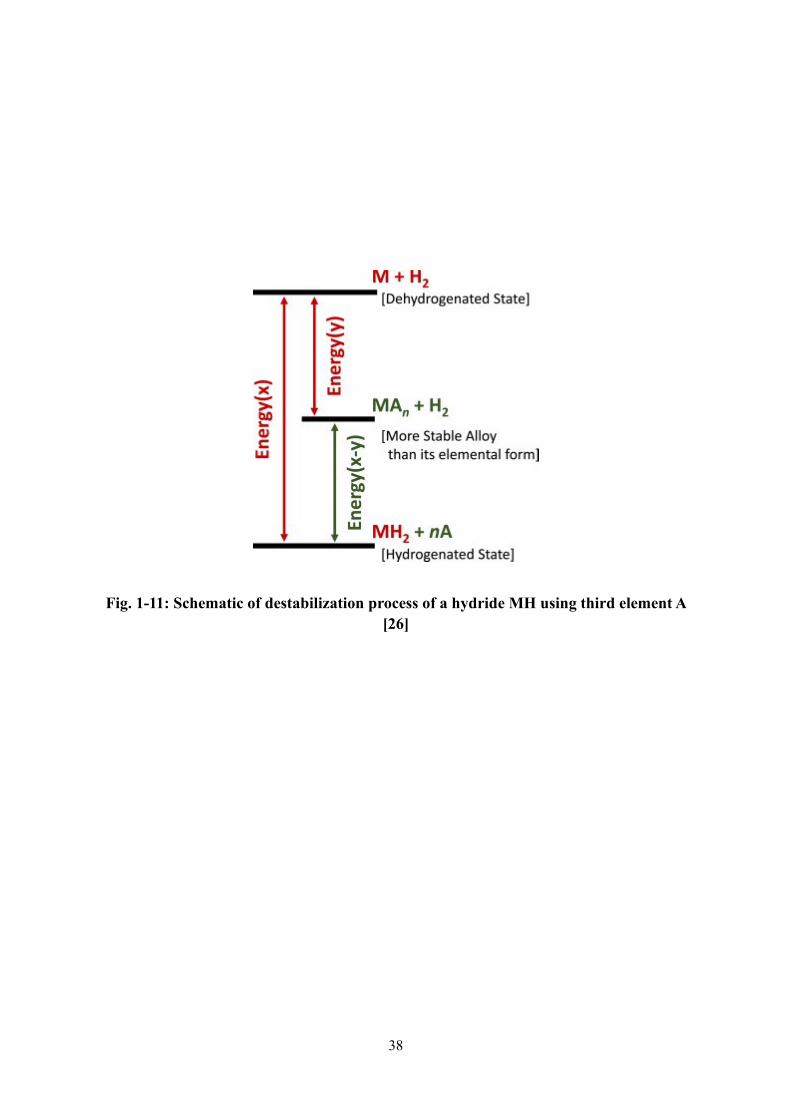
38
Fig. 1-11: Schematic of destabilization process of a hydride MH using third element A
[26]
39
Chapter-2
Purpose of thesis
Hydrogen has high gravimetric energy density; however, it suffers from the low volumetric
density. This has led the research community to develop efficient storage system for
hydrogen. By the time, metal borohydrides and their composites have become attractive
contender for stationary as well as transportation applications. LiBH4 is one of the
appropriate lightweight complex hydrides because it has high gravimetric (18.5 wt% H2) and
volumetric (121 g H2/L) densities. However, due to its high thermodynamic stability and slow
kinetics, it releases hydrogen completely above 900oC which makes it incompatible with
proton-exchange membrane (PEM) fuel cells [61]. Researchers have proposed many
solutions to lower the desorption temperature of LiBH4 (thermodynamic alteration) and to
enhance its dehydrogenation rate (kinetic alteration). In order to solve above two issues, there
were two objectives of this thesis related to the thermodynamic as well as kinetic alteration of
LiBH4 related systems. The first objective was to improve the kinetics of 2LiBH4-MgH2
system by adding a magical catalyst KH. The second objective was to destabilize LiBH4 itself
by the addition of Bi2X3 (X = S, Se, Te) chalcogenides as both the elements of these
chalcogenides i.e Bi and X have quite nice alloying ability with Li, which might cause an
effective destabilization. Following were the detailed objectives of this thesis:
Objective 1: Even though 2LiBH4-MgH2 system is destabilized in comparison to LiBH4, it
still possesses serious kinetic problem. Thus, in order to improve the kinetics of
2LiBH4-MgH2 system, the addition of potassium hydride (KH) as a catalyst was attempted.
40
Magical catalytic activities of potassium hydride [29] evoked us to give a trial on this
well-known complex hydrogen storage 2LiBH4-MgH2 system. Thus, the effect of KH
addition was studied using thermogravimetry coupled with differential thermal analysis
(TG-DTA) and differential scanning calorimetry (DSC) in this work. During the course of
this investigation, a unique phenomenon of eutectic melting was observed and elaborated in
detail in order to identify the eutectic composition and eutectic temperature.
Objective 2: Second objective was focused on the destabilization of LiBH4 itself. The
motivation of this study was emerged during our recent experiments on all-solid-state Li-ion
batteries [58], where an unexpected cell opening was observed during charging-discharging
measurement which interrupted the cell operation in very few cycles. That cell was made of
three major layers i.e. electrode material (composite of Bi2Te3/LiBH4/acetylene black), solid
electrolyte (LiBH4) and Li-foil. The cell opening was suspected to be caused by the gas
evolution during heating and electrochemical cycling. Thus, the thermolysis of Bi2Te3 /
LiBH4 composite was preliminarily investigated using TG-MS and the hydrogen evolution
was found to be initiated at less than 120oC [58], which indicated the reaction between Bi2Te3
and LiBH4. Similar behavior was observed during the charging cycle of Bi2S3 and Bi2Se3
electrode composites [62],[63] where the charging capacity at second plateau was found
larger than the theoretical capacity due to the unidentified thermochemical reaction. This
unwanted reaction resisted the above materials to be used in full potential window, which in
turn lowered the overall capacity. This motivated us to explore the effect of Bi2X3 (X= Te, Se
and S) addition on the decomposition temperature of LiBH4 systematically. Aiming on the
above, LiBH4-Bi2X3 composites were prepared by ball milling and the effect of Bi2X3

41
addition on the decomposition temperature of LiBH4 with a focus on structural changes was
analyzed using X-ray diffraction (XRD) and Transmission Electron Microscopy (TEM) in
this work. In addition to enhance the kinetics further, Bi2X3 nanostructures were also
prepared and their effect was also observed on the desorption properties of LiBH4.
42
Chapter-3
Materials and Methods
This chapter describes the information of commercially purchased materials,
procedures for the synthesis of required materials. For the basic understanding of materials
properties and their role in practical use, it is necessary to learn and utilize the
characterization techniques. Keeping this in mind, this chapter explained the basic principle
and methodology of used techniques.
3-1 Sample preparation
3-1-1 Materials
Materials used in this work are shown in Table 3-1. LiBH4 was used after heat treatment at
200oC for 24 h under dynamic vacuum to remove the solvent impurities. KH was washed
several times by hexane in order to remove the mineral oil and dried under vacuum for
several hours. MgH2, Bi2X3 were used without any treatment. All samples were handled
solely under inert gas conditions in an argon filled glovebox.
3-1-2 Mechanical ball milling method
Mechanical ball-milling method was employed to prepare 2LiBH4-MgH2 composite,
x(2LiBH4-MgH2) composite mixed with 1-x mol% KH (x = 5, 10, 20, 30, 40, 50, 55, 60, 65,
70, 80, 90) catalyst, LiBH4-bulk 50 wt% Bi2S3, LiBH4-bulk 50 wt% Bi2Se3 and LiBH4-bulk
50 wt% Bi2Te3. Mechanical ball-milling method can give physical energy to the sample and
therefore this method is used widely for various applications like synthesis of alloys,
43
borohydrides, complex hydrides, mechanochemical reaction, formation of small particles,
induction of defects etc.
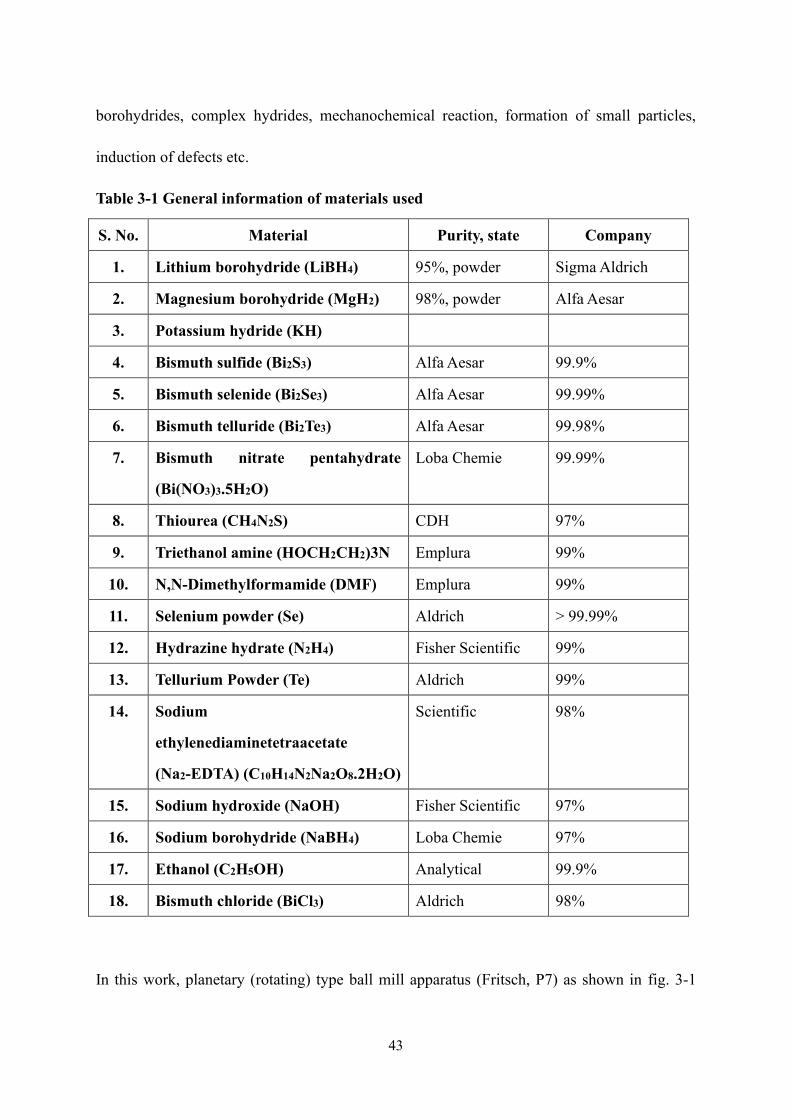
Table 3-1 General information of materials used
S. No. Material Purity, state Company
1. Lithium borohydride (LiBH4) 95%, powder Sigma Aldrich
2. Magnesium borohydride (MgH2) 98%, powder Alfa Aesar
3. Potassium hydride (KH)
4. Bismuth sulfide (Bi2S3) Alfa Aesar 99.9%
5. Bismuth selenide (Bi2Se3) Alfa Aesar 99.99%
6. Bismuth telluride (Bi2Te3) Alfa Aesar 99.98%
7. Bismuth nitrate pentahydrate
(Bi(NO3)3.5H2O)
Loba Chemie 99.99%
8. Thiourea (CH4N2S) CDH 97%
9. Triethanol amine (HOCH2CH2)3N Emplura 99%
10. N,N-Dimethylformamide (DMF) Emplura 99%
11. Selenium powder (Se) Aldrich > 99.99%
12. Hydrazine hydrate (N2H4) Fisher Scientific 99%
13. Tellurium Powder (Te) Aldrich 99%
14. Sodium
ethylenediaminetetraacetate
(Na2-EDTA) (C10H14N2Na2O8.2H2O)
Scientific 98%
15. Sodium hydroxide (NaOH) Fisher Scientific 97%
16. Sodium borohydride (NaBH4) Loba Chemie 97%
17. Ethanol (C2H5OH) Analytical 99.9%
18. Bismuth chloride (BiCl3) Aldrich 98%
In this work, planetary (rotating) type ball mill apparatus (Fritsch, P7) as shown in fig. 3-1
44
was used to synthesize the samples. The milling pot with the inner volume of about 30 cm3
was specially designed and made of Cr steel. Steel (SUJ-2; high-carbon chromium bearing
steel in conformity with JIS G 4805) balls with 7 mm in diameter or zirconium oxide (ZrO2)
balls with 8 mm diameter were chosen for ball milling depending on situation (material used).
In case of our first objective (i.e. 2LiBH4-MgH2 composite, 2LiBH4-MgH2 composite mixed
with x% KH) 20 balls of ZrO2 were opted with batches of 500 mg sample weight. The milling
was conducted for a total of 2 h with a 30 min pause after 1 h milling. The details of all the
studied samples with compositions are given in Table 3-2. For the preparation of samples for
the second objective, 50 wt% Bi2S3, Bi2Se3 and Bi2Te3 were separately mixed with heat
treated LiBH4 by mechanochemical treatment in a planetary ball mill under inert conditions
(Ar atmosphere). A total of 300 mg sample was prepared using 10 pieces of steel balls. The
milling was conducted at 400 rpm for a total of 2 h with 1 h milling followed by 30 min
pause pattern. The composites of prepared nanostructured Bi2X3 with heated LiBH4 were also
prepared using ball milling in a similar way adopted for the bulk Bi2X3 based composites.
3-1-3 Synthesis of nanostructures
All the nanostructures i.e. Bi2S3 nanoflowers, Bi2Se3 nanosheets and Bi2Te3 nanosheets were
synthesized using hydrothermal method.
Preparation of Bi2S3 nanoflowes
For the preparation of Bi2S3 nanoflowers, first 0.61gm high purity (99.99%) bismuth nitrate
pentahydrate (Bi(NO3)3.5H2O) and 0.25 gm thiourea (Tu) were mixed and dissolved in 60 ml
deionized water and were stirred at 250 rpm for 1 h. The solution was then transferred to a
sealed autoclave which was heated at 140oC. 2 h later on finishing the reaction it was cooled

45
down to room temperature. Then black color precipitate was collected after filtration and
washed by deionized water and ethanol for several times and dried at room temperature, see
fig. 3-2.
Preparation of Bi2Se3 nanosheets
Bi2Se3 nanosheets were also synthesized by hydrothermal process. High purity (99.99%) 2.6
mmol bismuth nitrate pentahydrate (Bi(NO3)3.5H2O) triturate was added in 5 ml of triethanol
amine and was mixed using stirrer. After 15 min, 15 mmol of NaOH was dissolved in 20 mL
DMF and 7.4 mmol of Se powder was also added in it under constant stirring. 0.8 ml
hydrazine hydrate (reducing agent) was also added during constant stirring. After continuous
stirring for 1.5 h, the mixture was transferred into a Teflon-lined autoclave with 80 ml DMF
and heated at 150 oC for 2 h. The black color precipitate was collected after cooling autoclave
at room temperature and washed off with deionized water. After washing with water, it was
washed using ethanol several times and then finally dried in the oven at 60 oC for 12 h, before
characterization see fig. 3-3.
Preparation of Bi2Te3 nanosheets
For the preparation of Bi2Te3 nanosheets, 75.67 mg bismuth chloride (BiCl3 - 99.99% purity)
was mixed with 45.93 mg tellurium (Te) and 1g sodium ethylenediaminetetraacetate
(Na2-EDTA). After that the mixture was poured in 60 ml distilled water and stirred at 250
rpm. After 10 min stirring, it was transferred into a teflon lined 100ml autoclave reactor.
Reducing agents 0.8gm sodium hydroxide (NaOH) and 0.8gm sodium borohydride (NaBH4)
were also mixed to the autoclaved sample after 30 min stirring. Reactor autoclave was then
sealed and kept for heating at 180 oC for 27 h. After the reaction completion autoclave was

46
cooled to room temperature and remaining black color precipitate was filtered and washed by
deionized water and then with ethanol for many times. At last it was ready to dry at room
temperature before characterizations, see fig. 3-4.
Table 3-2 Sample composition and molar ratio of components
Sample x(2LiBH4-MgH2) (1-x)KH Molar ratio
(LiBH4-MgH2-KH)
S0 (0% KH) 1.0 0.0 2.00:1.00:0.0
S1 (5% KH) 0.95 0.05 1.90:0.95:0.05
S2 (10% KH) 0.90 0.10 1.80:0.90:0.10
S3 (20% KH) 0.80 0.20 1.60:0.80:0.20
S4 (30% KH) 0.70 0.30 1.40:0.70:0.30
S5 (40% KH) 0.60 0.40 1.20:0.60:0.40
S6 (50% KH) 0.50 0.50 1.00:0.50:0.50
S7 (55% KH) 0.45 0.55 0.90:0.45:0.55
S8 (60% KH) 0.40 0.60 0.80:0.40:0.60
S9 (65% KH) 0.35 0.65 0.70:0.35:0.65
S10 (70% KH) 0.30 0.70 0.60:0.30:0.70
S11 (80% KH) 0.20 0.80 0.40:0.20:0.80
S12 (90% KH) 0.10 0.90 0.20:0.10:0.90
3-2 Characterization techniques
3-2-1 X-ray Diffraction Spectroscopy (XRD)
Principle
XRD is an important technique for the characterization of crystalline materials and to
determine their structures. When electrically accelerated thermoelectrons are irradiated to the
target material for the generation of X-rays, an electron from inner energy level (such as K
shell) is ejected. Then an electron from outer shell fall into the vacant place to make a stable
ground state with emitting X-rays. When the voltage of X-ray tube is increased to a certain
critical level, sharp intensity peak appears at specified wavelength, superimposed continuous
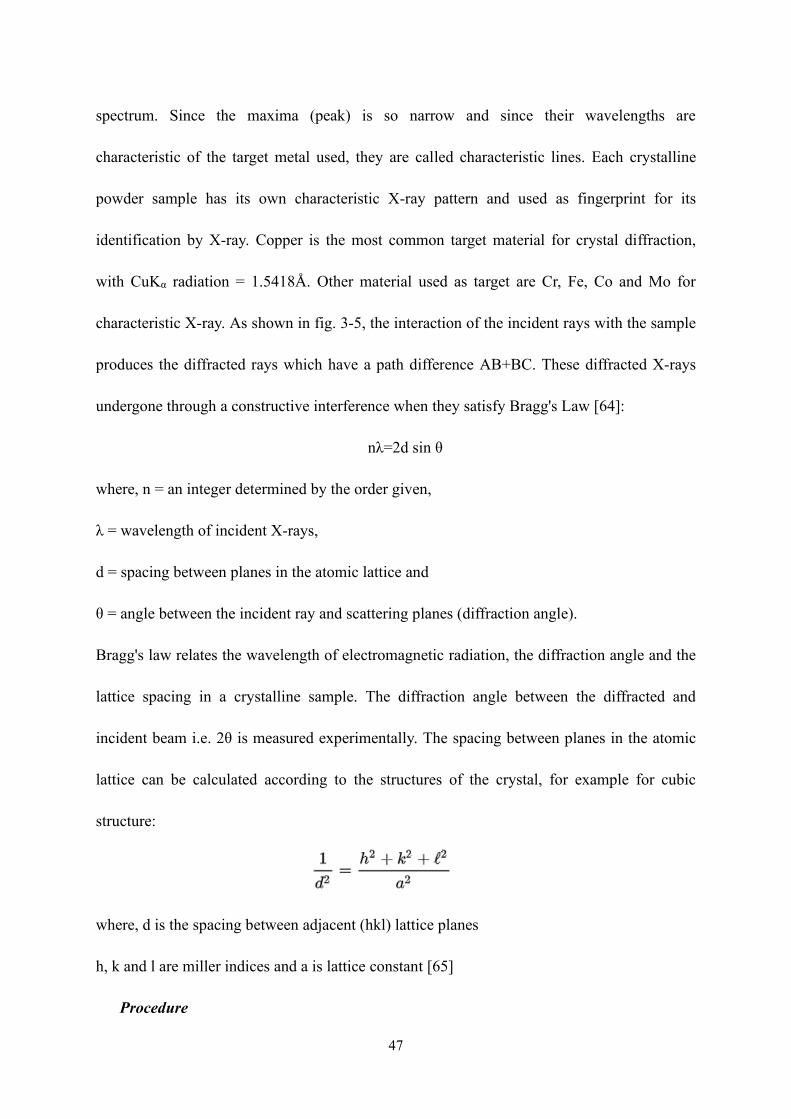
47
spectrum. Since the maxima (peak) is so narrow and since their wavelengths are
characteristic of the target metal used, they are called characteristic lines. Each crystalline
powder sample has its own characteristic X-ray pattern and used as fingerprint for its
identification by X-ray. Copper is the most common target material for crystal diffraction,
with CuKα radiation = 1.5418Å. Other material used as target are Cr, Fe, Co and Mo for
characteristic X-ray. As shown in fig. 3-5, the interaction of the incident rays with the sample
produces the diffracted rays which have a path difference AB+BC. These diffracted X-rays
undergone through a constructive interference when they satisfy Bragg's Law [64]:
nλ=2d sin θ
where, n = an integer determined by the order given,
λ = wavelength of incident X-rays,
d = spacing between planes in the atomic lattice and
θ = angle between the incident ray and scattering planes (diffraction angle).
Bragg's law relates the wavelength of electromagnetic radiation, the diffraction angle and the
lattice spacing in a crystalline sample. The diffraction angle between the diffracted and
incident beam i.e. 2θ is measured experimentally. The spacing between planes in the atomic
lattice can be calculated according to the structures of the crystal, for example for cubic
structure:
where, d is the spacing between adjacent (hkl) lattice planes
h, k and l are miller indices and a is lattice constant [65]
Procedure
48
Rigaku-RINT 2500 diffractometer equipped with CuKα radiation (as shown in fig. 3-6) was
used in this work. All the samples were prepared in high purity Ar-filled glove box. The
samples were set on glass plate spread with grease for high vacuum. All samples were
covered by a polyimide sheet (Dupont-Toray Co. Ltd., Kapton) of 8 thickness to protect
them from air as shown in fig. 3-7. This technique was used for the structural characterization
of all the samples after milling and heating treatment at different temperatures.
3-2-2 Thermal analysis for gas desorption
3-2-2-1 Thermogravimetry – Differential thermal analysis (TG-DTA)
Principle
TG-DTA is a thermal analysis technique as shown in fig. 3-8 and 3-9. Fig. 3-8 shows the
schematic representation of thermo-balance (apparatus), where, SDTA stands for single
differential thermal apparatus. The weight loss is detected during the desorption of gases as a
function of temperature. Thermo sensors attached to the balance can detect the heat flow due
to the gas desorption or phase transition of the sample. For the DTA measurement, an
exothermic or endothermic reaction takes place during the programmed heating or cooling of
the sample. In this process a phase transition of the sample, melting and desorption
temperature can be detected. There were two pans equipped in the machine, one was used as
reference pan and another holds the sample. In principle, the sample pan made of aluminum
(Al) and alumina (Al2O3) can be available up to 500 and 900oC, respectively or sometimes
platinum for higher temperature range. The choice of sample pan totally depends on the
studied material and related reaction mechanism. On increasing temperature, the temperature
difference (△T) was observed by the thermocouple equipped with each holder. The TG-DTA

49
apparatus used in this work was connected with thermal desorption mass spectroscopy which
is explained in next section. The desorbed gases during heating in TG-DTA flowed through a
capillary by flowing Ar as carrier gas, to the connected TDMS (thermal desorption mass
spectroscopy) apparatus. Hence, the partial pressure of desorbed gases was continuously
removed from the reaction area of TG-DTA to maintain zero partial pressure of desorbed
gases throughout the reaction. In case of hydrogen storage materials, if the desorbed gas is
only hydrogen then the weight loss will be corresponding to the capacity of hydrogen of the
sample [66].
3-2-2-2 Thermal Desorption Mass Spectroscopy (TDMS)
Principle
In this work, thermal gases desorption properties of all the samples were examined by
TG-DTA coupled with mass spectroscopy. This method enables the immediate determination
of volatile reaction products: a small part of the gas which is formed on heating in the DTA
furnace enters the ionization chamber of the mass spectrometer through a narrow capillary
and a valve, where it can be investigated immediately. The gas molecule desorbed from the
sample are ionized by confliction with electron beam in ionization part. Thus, the ionized gas
molecules can be expressed as m/z, where, m is mass of sample molecules and z is charge
number. A recorder shows the thermal effects as well as the composition of the gaseous
reaction products in dependence on the heating temperature.
Procedure
The thermal properties of all the samples synthesized in this thesis were investigated by
TG-DTA apparatus (Rigaku, TG8120) coupled with a mass spectrometer (MS, Anelva,
50
M-QA200TS) which was installed inside the glove box to minimize an influence of exposing
the samples to air see fig. 3-9. About 3 ~ 5 mg of the sample was put on a pan and set to the
balance in the TG-DTA apparatus. This instrument was used in both objectives of this thesis
to understand the reaction mechanism at different temperatures and phase change during the
heating process. TG coupled with DTA and Mass spectroscopy was performed under an argon
gas flow (300 ml/min), at the heating rate of 5°C/min. This technique was also helpful to
analyze the released gases during different stage of reaction.
3-2-2-3 Differential scanning calorimetry (DSC)
Principle
Heat flux (enthalpy change) with exothermic or endothermic reactions are measured by the
DSC (Differential scanning calorimetry). This technique is more effective than that of
previous one i.e. TG-DTA as heat quantity of the corresponding reaction can be detected
more sensitively than TG-DTA. Moreover, large amount of samples can be used for
analyzation in case of DSC resulting in clear signals. The integrated area of peaks observed in
DSC measurement theoretically corresponds to the heat of reaction. There are two types of
DSC, one is power compensated type DSC and second is heat flux type DSC. Heat flux type
of DSC was used in this work, see the schematic diagram in fig. 3-10 [66]. Enthalpy change
and heat capacity change in the sample causes a difference of temperature between the
sample and reference, which is recorded by DSC measurement. The DSC measurements are
able to perform under open system (gas flow system) and closed system within the maximum
pressure of 7MPa.
51
Procedure
The high pressurized DSC apparatus (Q10 PDSC, TA instruments) was installed in a glove
box to avoid the contact with air and impurity, see fig. 3-11. About 3 mg sample was put on
Al pan and set in furnace. The DSC measurements was carried out in the range of 30 to
500oC with the heating rate 5oC/min. Cooling was also recorded after completion of heating
measurement. All the measurements were performed under 0.1 MPa Ar gas.
3-2-4 Transmission Electron Microscopy (TEM)
Principle
TEM (Transmission Electron Microscopy) is an important technique to characterize the
microstructures and nanostructures in which electrons are radiated to the solid samples. The
electrons interact with sample and get transmitted through it and strike a fluorescent screen to
generate high resolution sample image. TEM works on the same principle as light microscope
but instead of light a high energy electron beam is used to produce an image. As De-Broglie
wavelength of the electrons is much smaller than that of photons so TEM can produce high
resolution images. The detailed information about sample crystal structure can be detected by
the TEM. Fig. 3-12 shows the interaction of incident electron beam with the specimen sample.
Some electrons are scattered without losing their energy (elastic scattering) and some
scattered with the partial loss of energy (inelastic scattering). Suppose a parallel electron
beam interacts with the specimen, some of the electrons penetrate through the sample
(transmitted) and others are diffracted at some angle. However, a diffraction pattern can be
obtained when a film is set at the point of focal back plane and an electron microscope image
can be produced when a film is set at the imaging plane see fig. 3-13. There are two modes in
52
TEM to construct an image, one is bright field image, and another is dark field mode image.
When an unscattered (transmitted) electron is selected with the aperture and the scattered
electron beam is restricted to pass through the back focal plane then a bright field image can
be obtained because of the transmission of electrons and hence less electron accumulation.
On the other hand, in dark field mode of image, a scattered beam is selected to pass through
and unscattered electrons are restricted to the aperture. Therefore, in dark field mode, the area
around the sample being examined appears light, rather than dark. Bright field images are the
most common one obtained from the TEM [67].
Procedure
In this thesis work, TEM experiments were performed using 200 kV TEM (JEOL JEM 2010)
to characterize nanostructured Bi2X3 (X = Te, Se, & S) samples and their composites with
LiBH4. In-situ study was performed to understand the reaction mechanism of these
composites at different temperatures. A molybdenum grid was used to hold the spread sample
and afterwards the sample was moved to TEM chamber. During the sample loading, plastic
bag method was adopted to reduce the air contact for TEM samples [68].
3-2-5 Scanning Electron Microscopy (SEM)
Principle
When electron beam is focused on the sample, it interacts with the atoms and penetrate in the
sample material. In case of SEM the interaction depends on volume of electrons in the sample.
There are some specified modes of imaging in the SEM, i.e. secondary electron, back
scattered and characteristics X-ray, see fig. 3-14 ejected by the primary beam from a shell.
When primary electrons interact with the atoms of the specimen secondary electron are

53
generated by the inelastic scattering. Due to the low energy (50 eV) these electrons are
generated from only few nanometers inside the sample surface, thus giving the information
about the surface morphology. In case of BSE (backscattered electrons), primary electron
beam deviate due to the interaction with the nuclei of the sample atom and by the elastic
scattering the BSE generated see fig. 3-15. For a sample, the volume of interaction depends
on mean atomic number, density and beam energy. BSE have high energy and can penetrate
deep within the sample. High atomic number elements can generate BSE more strongly than
the less atomic number elements. For example Au have large nuclei (z=79) therefore
providing more powerful effect to the path of the primary electron beam and developing the
large deviations [69]. Secondary electrons are used to study the topology of the materials
whereas characteristic X-rays are used to perform the elemental mapping of the samples. The
electron beam can be generated by choosing an electron gun. Two types of electron gun are
commonly used, i.e. thermoelectron and field emission (FE). The high resolution observation
can be obtained using FE type gun. Fig. 3-16 shows the schematic diagram of SEM.
Procedure
In this thesis, prepared nanostructures (Bi2S3, Bi2Se3 and Bi2Te3) were characterized by the
SEM instrument (Nova Nano FE-SEM 450 FEI). The accelerating voltage was used 15 kV
for the instrument. JEOL JSM 6380 was used to observe the surface morphology of materials
before and after heating (used instrument images are shown in fig. 3-17). The samples were
prepared inside the glove box and transferred to the SEM apparatus by using Sample transfer
stick as shown in fig. 3-17.
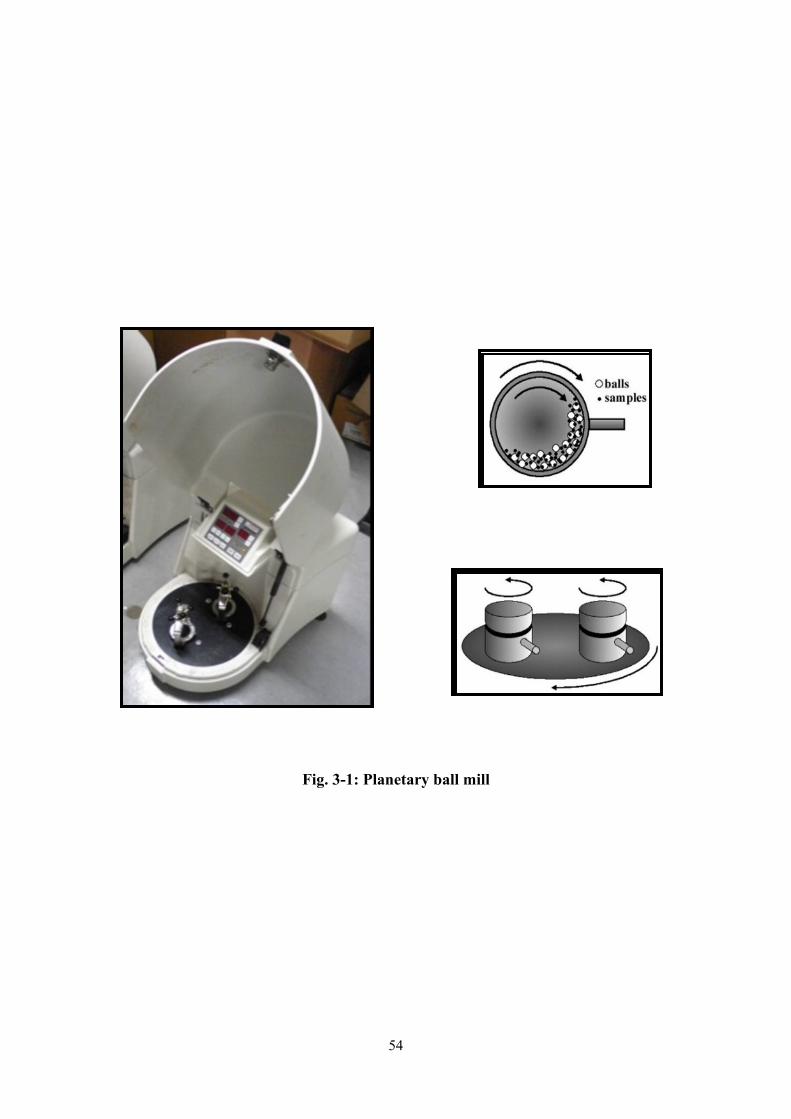
54
Fig. 3-1: Planetary ball mill
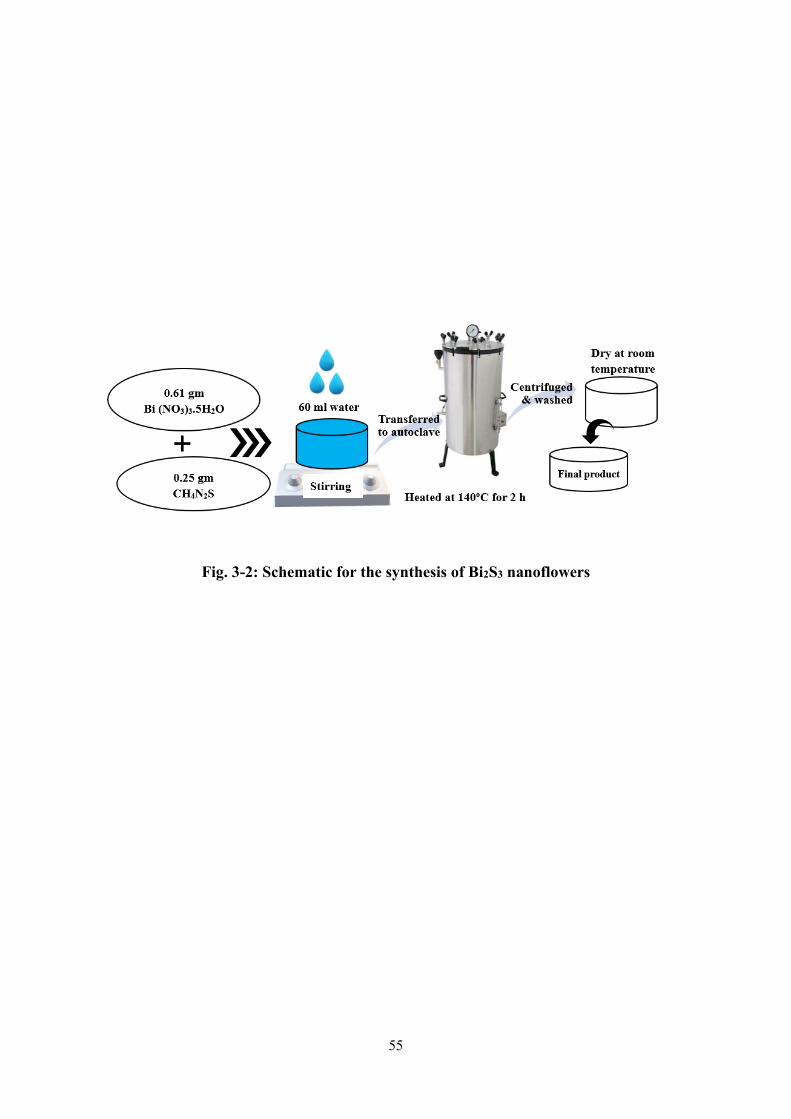
55
Fig. 3-2: Schematic for the synthesis of Bi2S3 nanoflowers
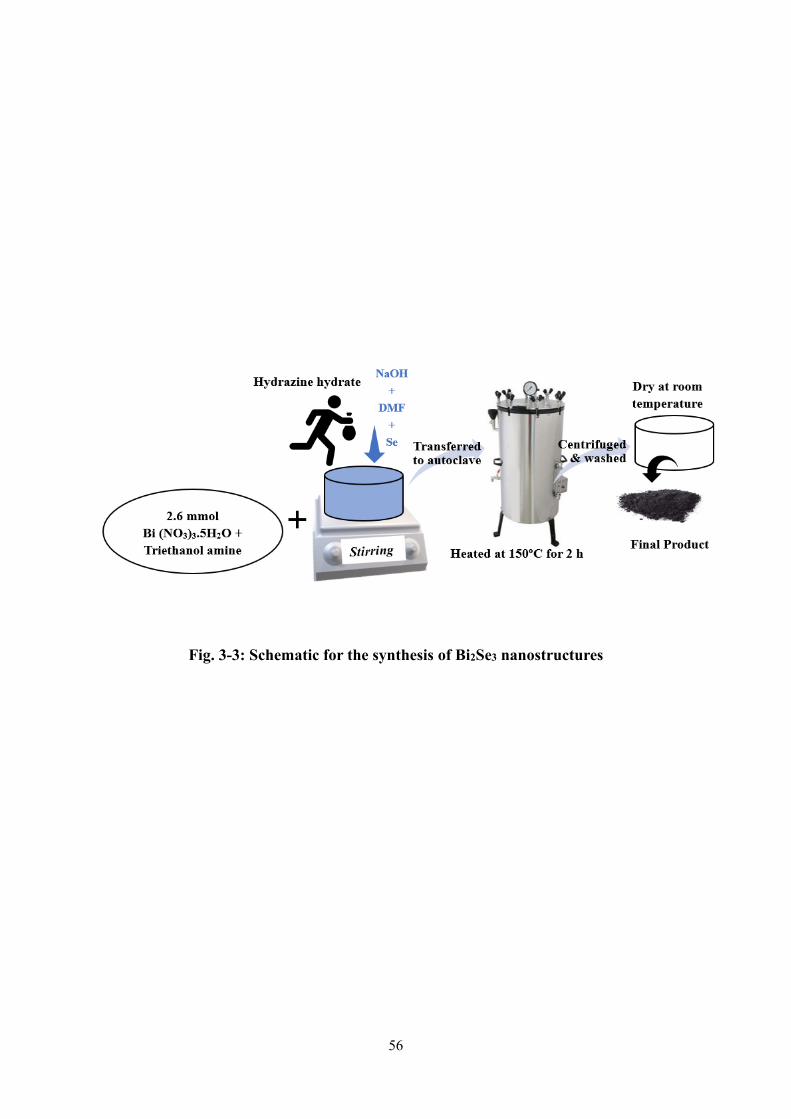
56
Fig. 3-3: Schematic for the synthesis of Bi2Se3 nanostructures
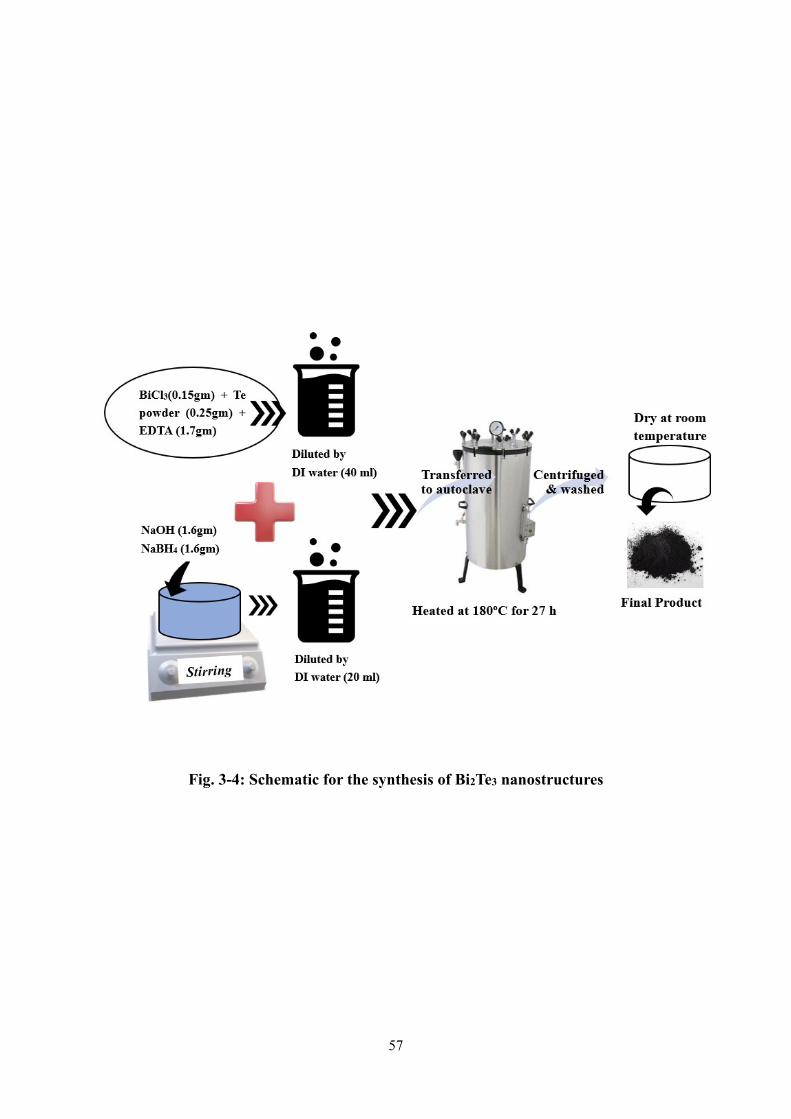
57
Fig. 3-4: Schematic for the synthesis of Bi2Te3 nanostructures
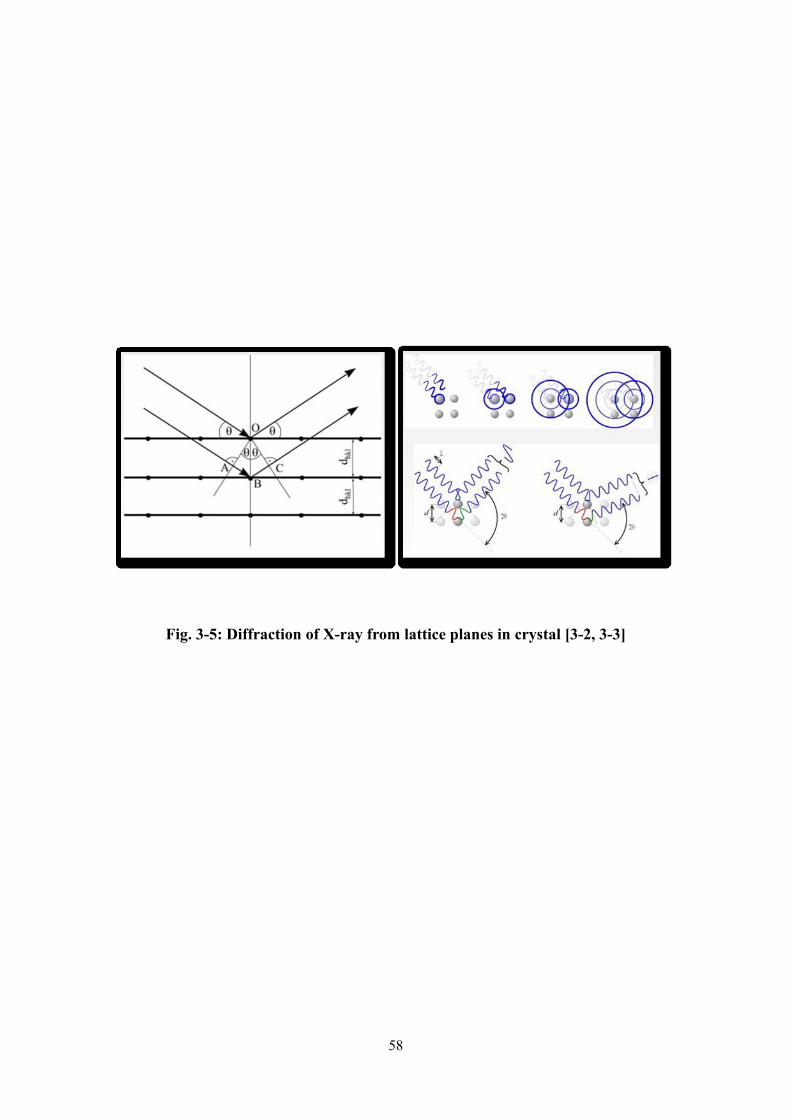
58
Fig. 3-5: Diffraction of X-ray from lattice planes in crystal [3-2, 3-3]
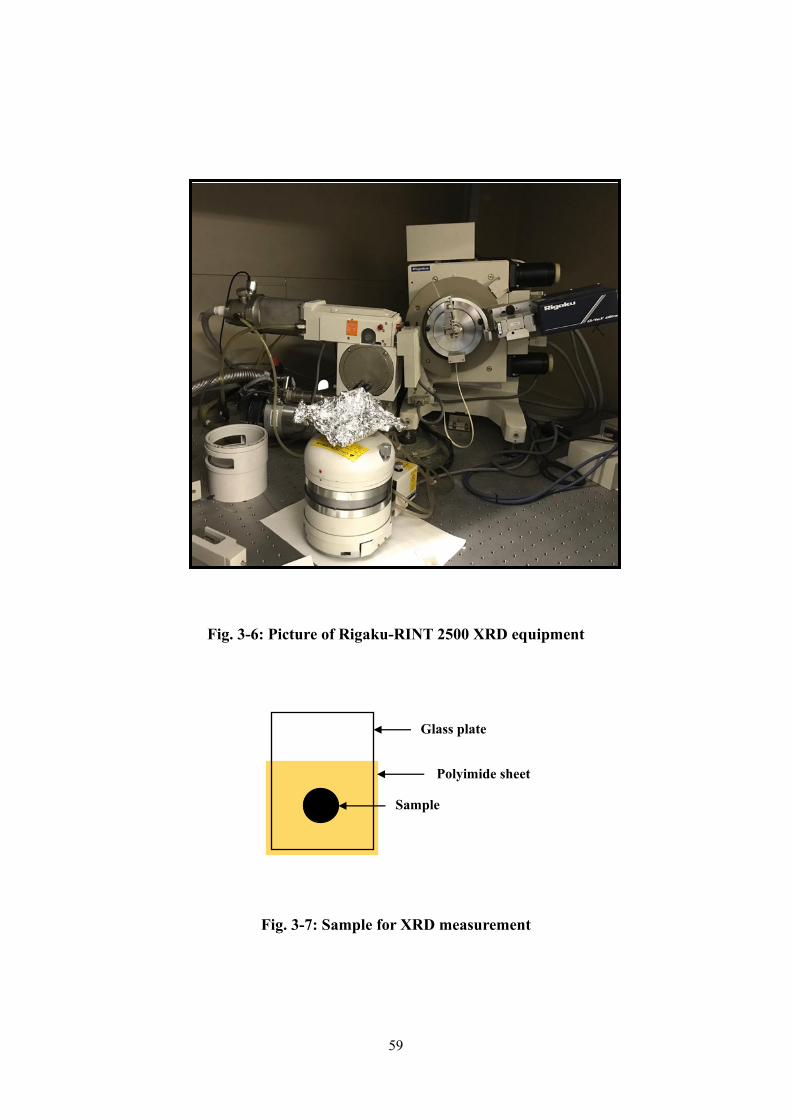
59
Fig. 3-6: Picture of Rigaku-RINT 2500 XRD equipment
Fig. 3-7: Sample for XRD measurement
Glass plate
Polyimide sheet
Sample
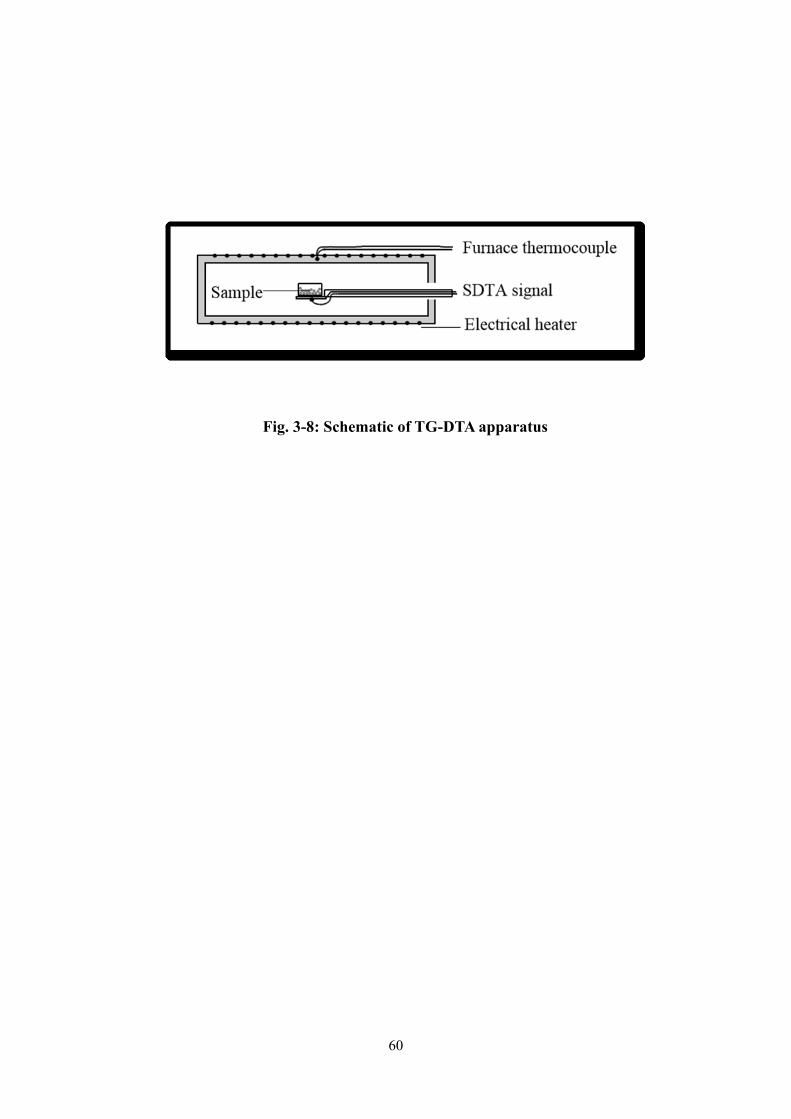
60
Fig. 3-8: Schematic of TG-DTA apparatus

61
Fig. 3-9: (a) Rigaku, TG8120 connected to a mass spectrometer (MS, Anelva,
M-QA200TS) glove box, (b) TG-DTA instrument inside the glove box
(a)
(b)
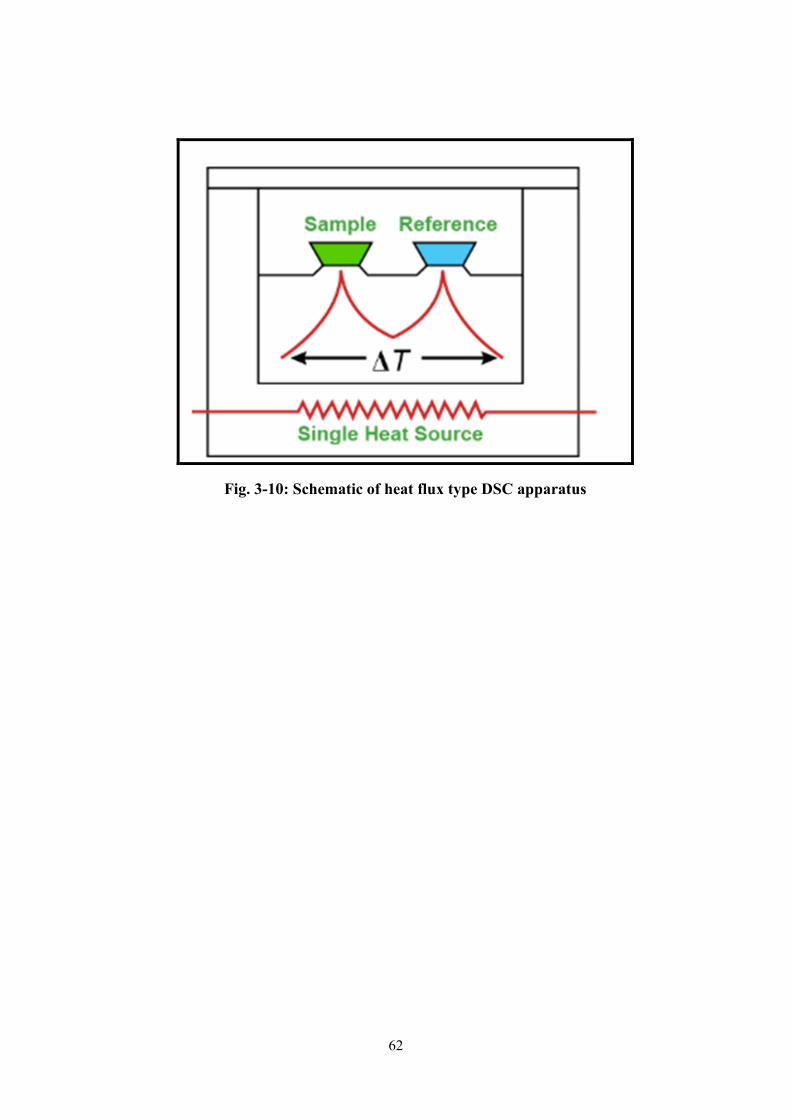
62
Fig. 3-10: Schematic of heat flux type DSC apparatus
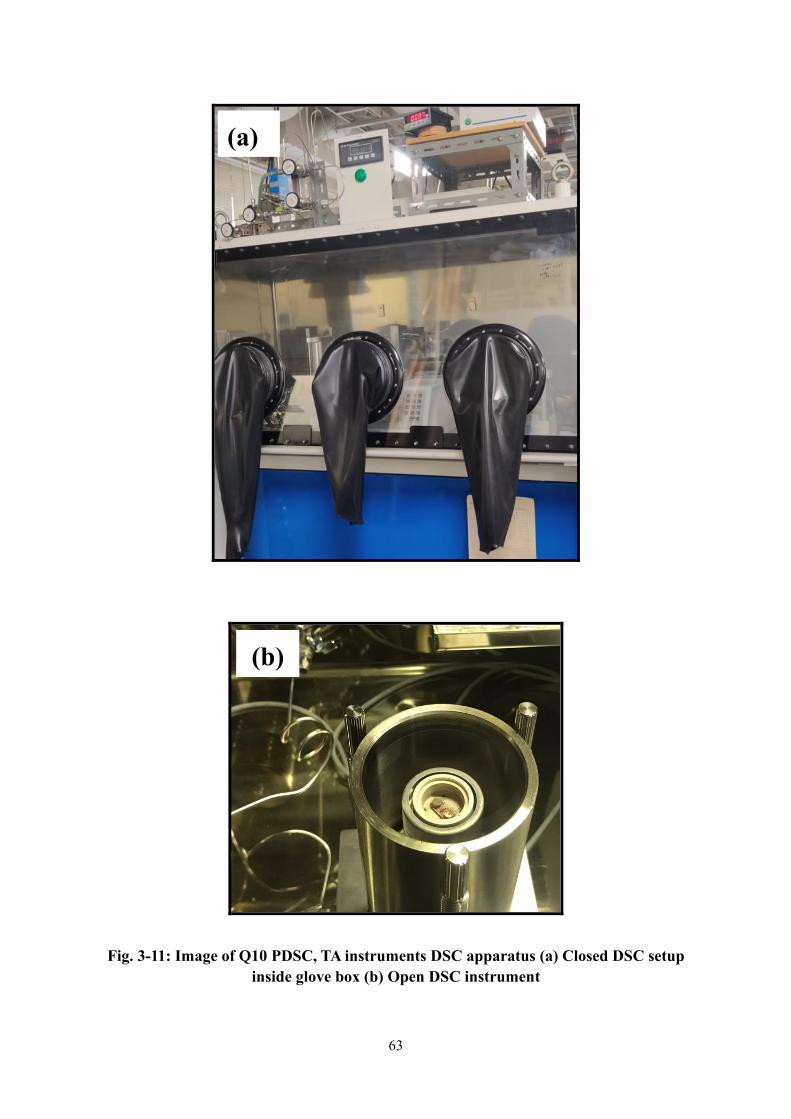
63
Fig. 3-11: Image of Q10 PDSC, TA instruments DSC apparatus (a) Closed DSC setup
inside glove box (b) Open DSC instrument
(a)
(b)
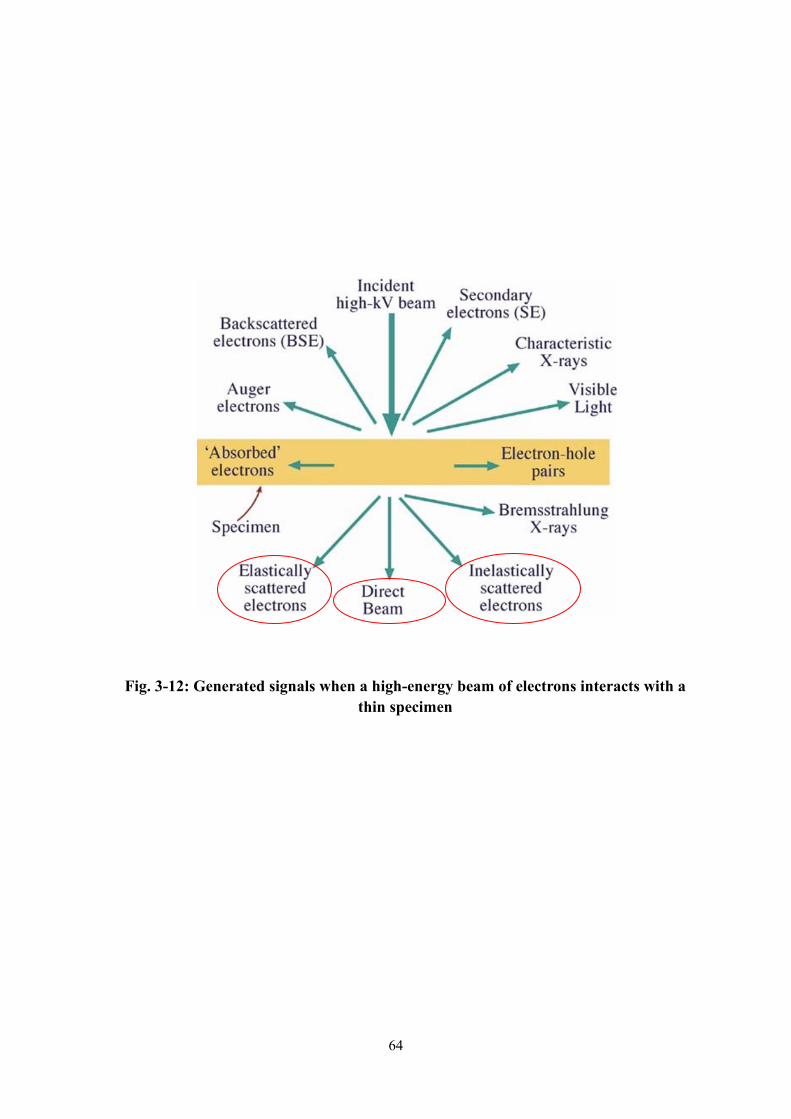
64
Fig. 3-12: Generated signals when a high-energy beam of electrons interacts with a
thin specimen
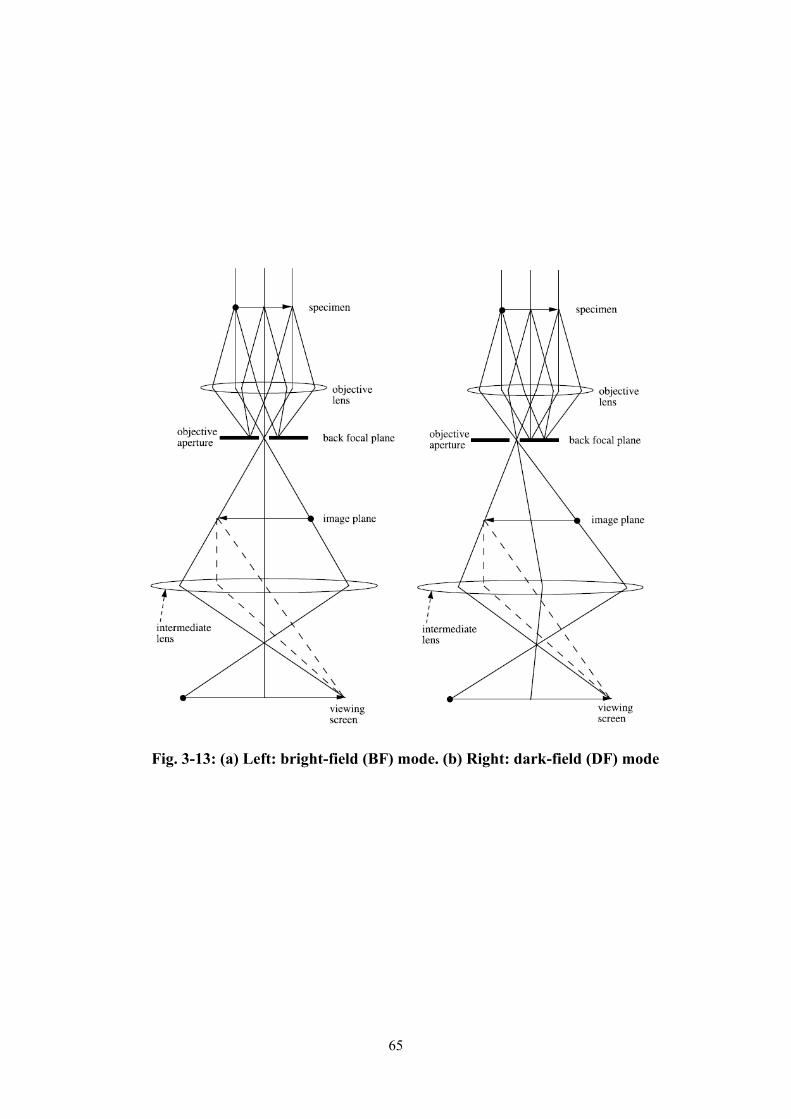
65
Fig. 3-13: (a) Left: bright-field (BF) mode. (b) Right: dark-field (DF) mode
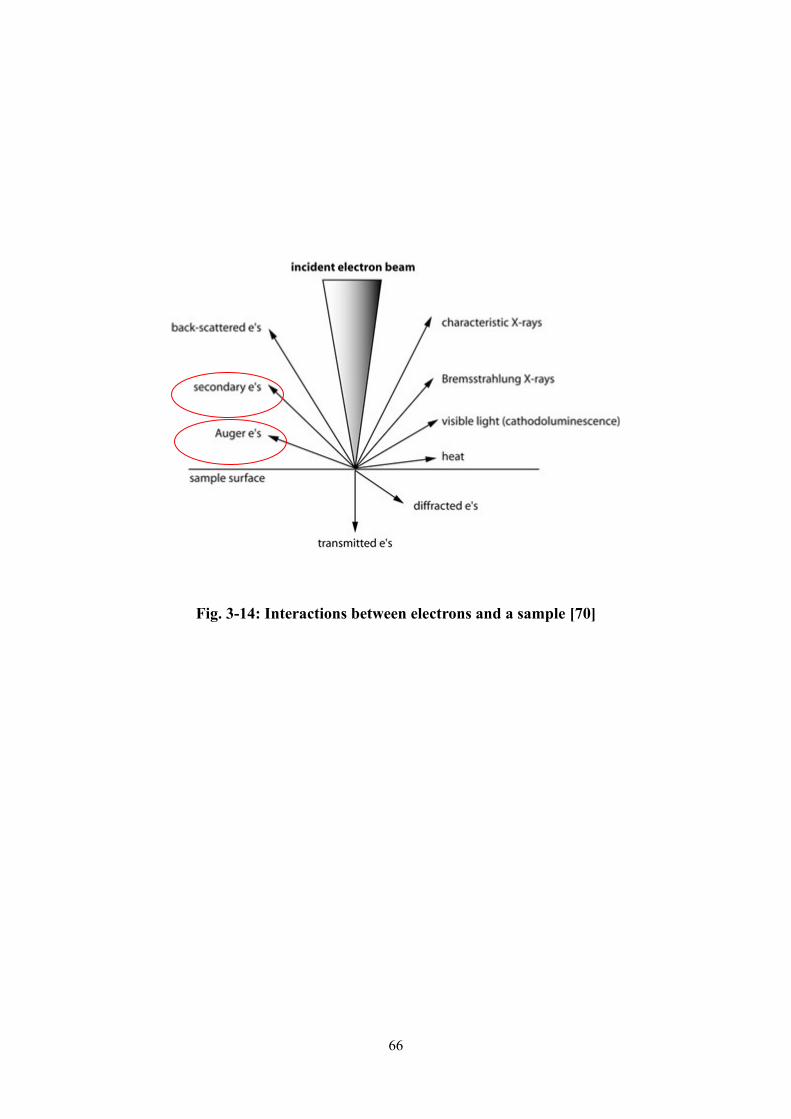
66
Fig. 3-14: Interactions between electrons and a sample [70]
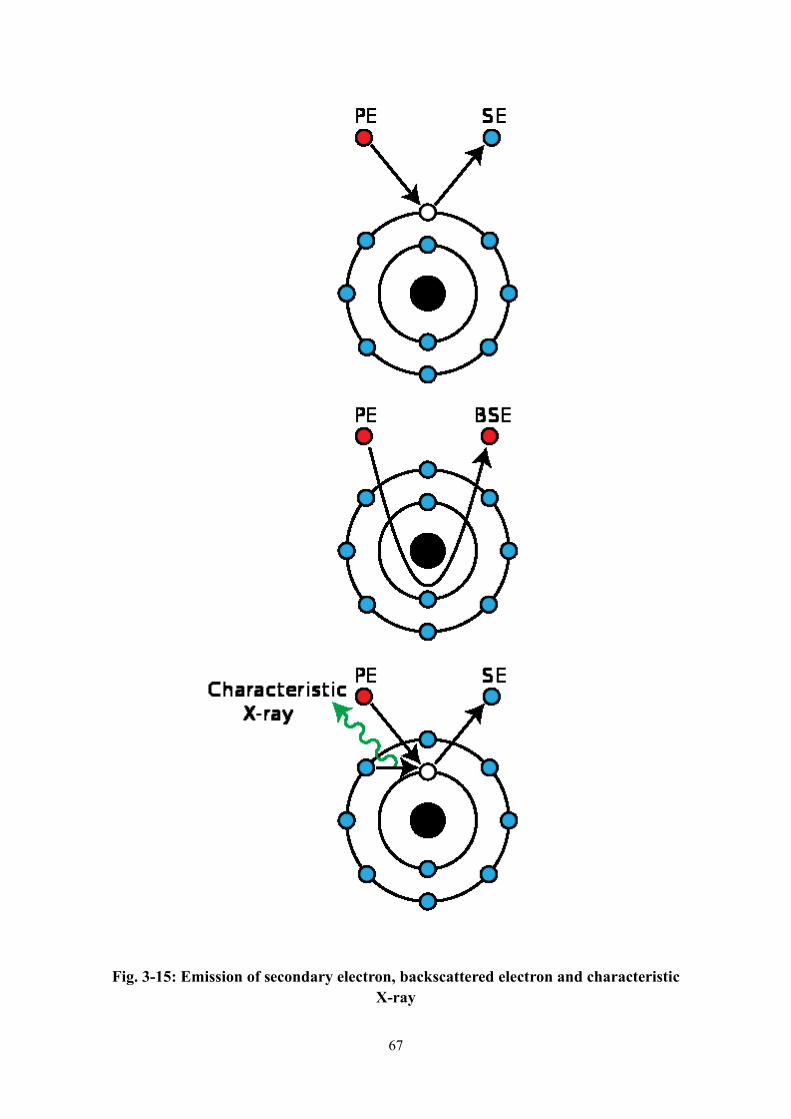
67
Fig. 3-15: Emission of secondary electron, backscattered electron and characteristic
X-ray
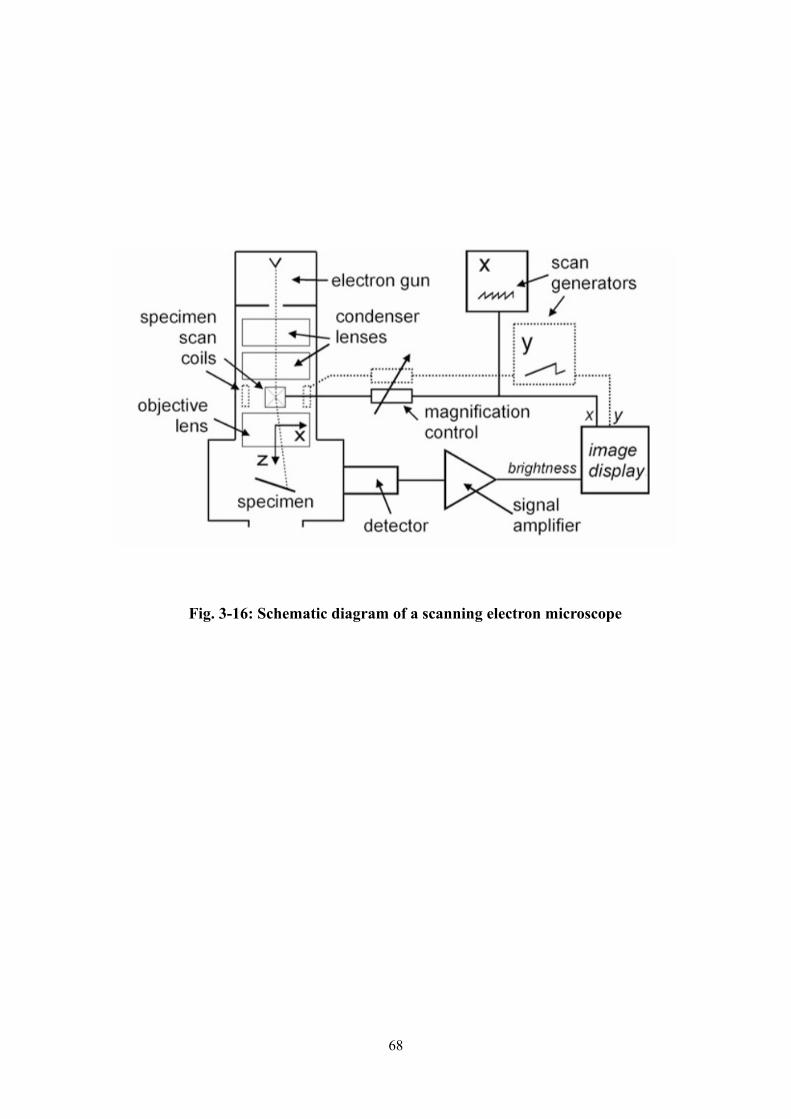
68
Fig. 3-16: Schematic diagram of a scanning electron microscope
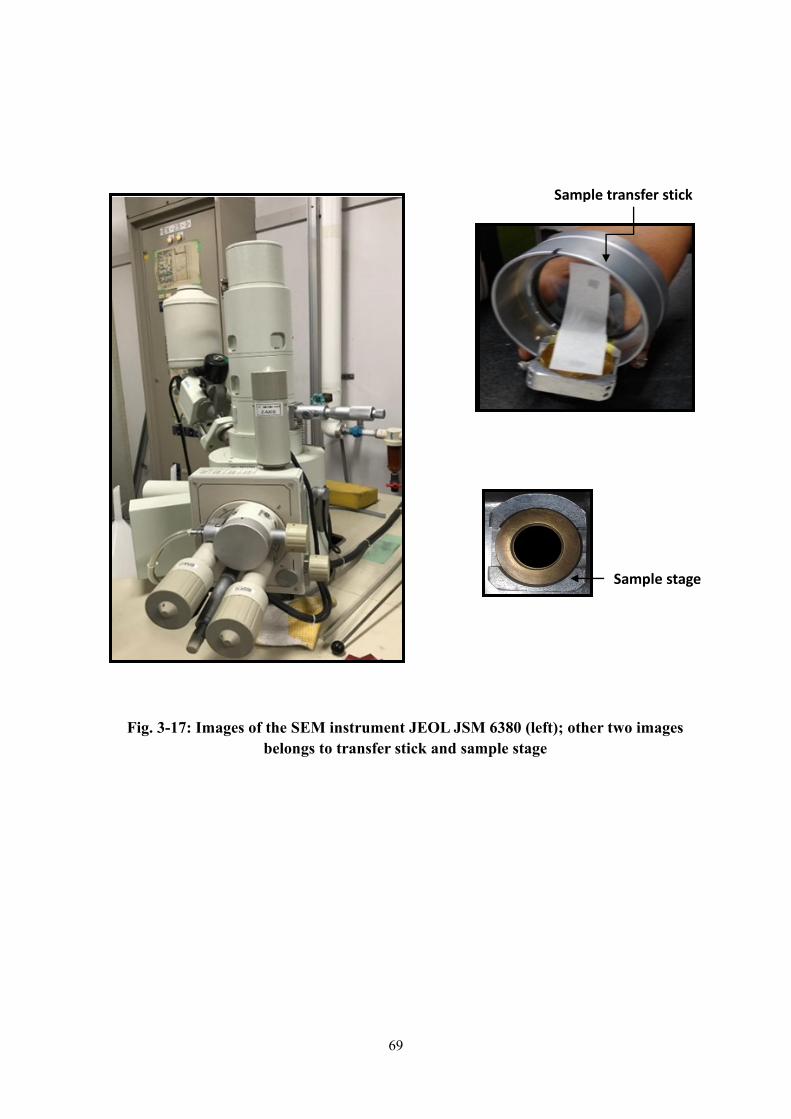
69
Fig. 3-17: Images of the SEM instrument JEOL JSM 6380 (left); other two images
belongs to transfer stick and sample stage
Sample transfer stick
Sample stage
70
Chapter-4
Improving the kinetics of 2LiBH4-MgH2 system by the
addition of potassium hydride (KH) as a catalyst
4-1 Introduction
As we discussed the storage systems in chapter-1 (section:1-8), 2LiBH4:MgH2-RHC specially
2LiBH4 + MgH2 system attracted our attention due to its suitable thermodynamics and
sorption properties. To use this system practically, there is still a need to reduce the
decomposition temperature which is still over 350℃ due to kinetic constraints as reported by
different researchers. Potassium hydride has been recognized as one of the magical catalyst,
which was first introduced for the improvement of Mg(NH2)2 – LiH system by Wang et al [29]
as discussed in chapter 1. Magical catalytic activities of potassium hydride evoked us to give a
trial on the well-known complex hydrogen storage system i.e. 2LiBH4-MgH2. Thus, the effect
of KH addition was studied by thermogravimetry coupled with differential thermal analysis
(TG-DTA) and differential scanning calorimetry (DSC) in this work. XRD analysis was also
performed after milling and heating at 290℃ for different compositions of KH in
2LiBH4-MgH2 system.
In this chapter, a comparative study between the 2LiBH4-MgH2 system and
2LiBH4-MgH2 system with 5 mol% KH was presented using TG-DTA and DSC. The next
section described the reactive composite 2LiBH4-MgH2 system without KH and with
increasing percentage of KH.
71
4-2 Effect of 5 mol% KH addition on the 2LiBH4-MgH2 system
TG-DTA results of the composite 2LiBH4-MgH2 with and without 5% KH are shown in fig.
4-1. Three endothermic peaks were found in the DTA profile for the 2LiBH4-MgH2 without
additives (shown by dashed line in upper panel of fig. 4-1). The first two peaks at 115℃ and
285℃ belongs to the structural phase transition and melting of LiBH4 respectively. The
weight loss was started around 340℃ as observed from TG (lower panel, dashed line), which
reflected the starting temperature of hydrogen desorption and the corresponding DTA peak
was detected at 365℃. The second step decomposition was observed at more than 400℃,
which is in line with the literature [61]. On the addition of 5 mol% KH, a shift in desorption
temperature was observed for the first step with a peak temperature of 268℃ (solid line),
while no significant change was observed for the second step decomposition. In addition to it,
an unusual but quite interesting phenomenon of shift in melting peak (285℃) was also
observed in DTA curve for KH added 2LiBH4-MgH2 system. It is well known that the
melting cannot be affected by the use of additive, unless it forms a eutectic mixture. Another
possibility can be associated with the occurrence of some unknown irreversible reaction. This
observation prompted us to investigate the effect KH addition to this system in more detail.
To investigate it more precisely, same samples were examined using DSC and the results are
depicted in fig. 4-2. The reversible nature of peak around 285℃ confirmed the melting
(during heating) and solidification (during cooling), whereas a clear shift to the lower
temperature was the testament of eutectic melting. In addition, a small endothermic event was
also observed with peak temperature of 110℃, just before the phase transition temperature of

72
LiBH4. This must be associated with the eutectic melting of eutectic composition. Although
the phenomenon of eutectic melting is complicated, we can describe it simply as follows: the
eutectic melting happens if two or more components sustain their liquid state below the
melting points of their pure components. These eutectic melts can be utilized as media in
which substances can dissolve with good solubility. Melting of complex systems like
borohydrides and mixture of metal borohydride, hydride and halides can also increase
reactivity and can improve kinetics for the release of hydrogen [71],[72]. Lowering melting
point, metal borohydrides and complex systems which showed eutectic melting behavior,
acted as ionic liquids and can be utilized for refueling of vehicles [73]. Deep eutectic
Mg(BH4)2/LiBH4 systems in complex borohydrides might behave as liquid in PEM fuel cell
which is advantageous in hydrogen reversibility [71]. Many researchers have focused on
lowering the eutectic melting points by using the combination of different complex hydride
systems due to its excellent onboard application. Bimetallic mixtures have been found to have
much lower melting points in comparison with monometallic borohydrides M(BH4)x, where
M = Li, Na, K, Mg or Ca [71],[72],[73]. For example, the bimetallic mixture of lithium and
potassium borohydrides 0.725LiBH4-0.275KBH4 have shown melting point Tm=105℃,
which was much lower than the individual borohydride [61]. Similarly,
0.62LiBH4-0.38NaBH4 system displayed the melting at 210-220℃ [72],[73],[74], lower than
the individual components. In case of composite LiBH4-Ca(BH4) system, it exhibited eutectic
melting at 200℃ and a partial reversibility has been confirmed for the first time [75]. The
xLiBH4-(1-x)Mg(BH4)2, x = 0.5-0.6 system exhibited a reduced initial temperature of
hydrogen release i.e. 180℃ (Tm= 180℃) [76]. Thus, to investigate the anticipated similar
73
phenomenon, a series of 2LiBH4-MgH2 with increasing mole percentage of potassium
hydride was prepared and was analyzed using differential scanning calorimetry (DSC) in a
temperature range of room temperature to 500℃.
4-3 Effect of varying KH content on the 2LiBH4-MgH2 system
Fig. 4-3 shows the DSC profile of samples up to 150℃. The onset temperature has been
considered as melting temperature. The compositional details of the prepared samples are
given in chapter 3 (Table 3-2). Sample S1 - S4 showed two very close peaks around
110-120℃ and one peak in the temperature range 160-235℃. The endothermic peak in
higher temperature range corresponded to the melting of the composite mixture and thus it
was not very interesting, but the lower temperature peaks were of special interest and these
could be assigned to the eutectic melting and phase transition respectively. With the
increasing content of KH, the eutectic melting peak height was found to be increasing and
shifting slightly to the lower temperature, whereas the peak corresponding to the phase
transition was getting modest. The melting peak corresponding to the composite melting was
also observed to be shifted to lower temperature. Finally, sample S5 shows only one peak that
corresponds to the complete melting thus eliminating the peak corresponding to phase
transition of LiBH4, as it was irrelevant in the melted state. Fig. 4-4 shows DSC profiles of
some selected samples to determine the lowest melting temperature. The lowest onset
temperature was found as 79℃ for sample S7 with a composition of
0.45(2LiBH4-MgH2)-0.55(KH).
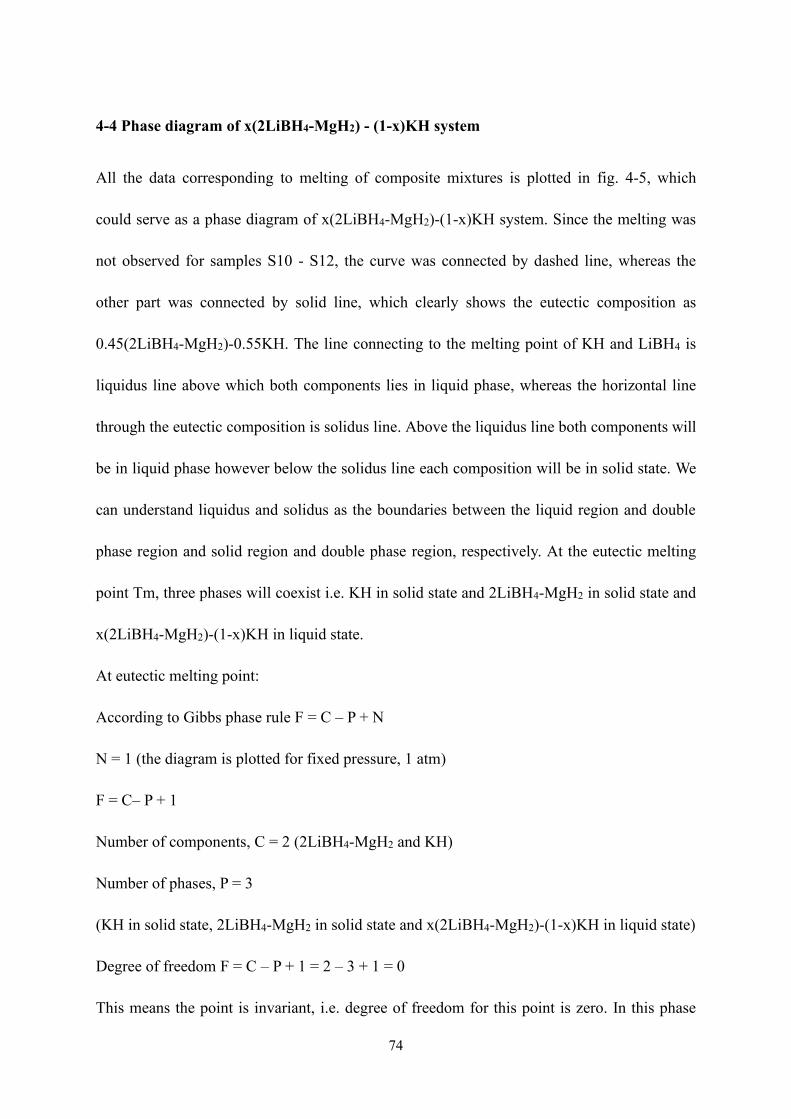
74
4-4 Phase diagram of x(2LiBH4-MgH2) - (1-x)KH system
All the data corresponding to melting of composite mixtures is plotted in fig. 4-5, which
could serve as a phase diagram of x(2LiBH4-MgH2)-(1-x)KH system. Since the melting was
not observed for samples S10 - S12, the curve was connected by dashed line, whereas the
other part was connected by solid line, which clearly shows the eutectic composition as
0.45(2LiBH4-MgH2)-0.55KH. The line connecting to the melting point of KH and LiBH4 is
liquidus line above which both components lies in liquid phase, whereas the horizontal line
through the eutectic composition is solidus line. Above the liquidus line both components will
be in liquid phase however below the solidus line each composition will be in solid state. We
can understand liquidus and solidus as the boundaries between the liquid region and double
phase region and solid region and double phase region, respectively. At the eutectic melting
point Tm, three phases will coexist i.e. KH in solid state and 2LiBH4-MgH2 in solid state and
x(2LiBH4-MgH2)-(1-x)KH in liquid state.
At eutectic melting point:
According to Gibbs phase rule F = C – P + N
N = 1 (the diagram is plotted for fixed pressure, 1 atm)
F = C– P + 1
Number of components, C = 2 (2LiBH4-MgH2 and KH)
Number of phases, P = 3
(KH in solid state, 2LiBH4-MgH2 in solid state and x(2LiBH4-MgH2)-(1-x)KH in liquid state)
Degree of freedom F = C – P + 1 = 2 – 3 + 1 = 0
This means the point is invariant, i.e. degree of freedom for this point is zero. In this phase
75
diagram, invariant is a point where 3 phases are in equilibrium (x(2LiBH4-MgH2)-(1-x)KH in
liquid state and KH in solid state, 2LiBH4-MgH2 in solid). However, at the liquidus line let
say some point is A (red color) see fig. 4-5 in phase diagram.
At point A:
C = 2
P = 2 (solid 2LiBH4-MgH2 and liquid 2LiBH4-MgH2)F = 1
Therefore, if we know the temperature, the component can be calculated automatically.
4-5 Structural observations after milling and heating
To confirm the above melting and non-occurrence of any other reaction, X-ray diffraction
(XRD) was performed for all the samples after milling as well as after DSC experiment up to
290℃. The XRD profiles of selected samples are shown in fig. 4-6. The XRD profile after
milling suggested the existence of MgH2 and LiBH4 phases, however, no peaks
corresponding to KH were visible for any samples up to the sample having 70% KH (S10). In
addition, some peaks could be indexed for KBH4 phase for the samples having 60% KH or
more (S8-S12). The formation of KBH4 revealed that the reaction between LiBH4 and KH
and anion exchange took place during milling. The formation of amorphous KBH4 can also
be expected for other samples with less KH content. Another possibility of the absence of
KBH4 peaks in XRD of sample S1-S7 can be attributed to the presence of KBH4 in very
small amount, which was not in the detection limit of XRD. This speculation was confirmed
from the XRD profile of sample S11 (80%KH), where the peaks corresponding to both
phases i.e. KH as well as KBH4 were present due to the excess amount of KH.
76
On the other side, for the samples after melting see fig. 4-7, KBH4 peaks were clearly visible
for the S1 sample with only 5% KH. It suggested the crystallization of KBH4 phase during
solidification. The peaks corresponding to MgH2 along with KBH4 were also visible in all the
samples after heating at 290℃. In addition, the peaks corresponding to potassium hydride
were also detected in samples S11 similar to the milled sample.
4-6 Summary
On combining the DSC and XRD data, it was concluded that the melting peak shift to the
lower temperature was purely due to melting which arose probably due to the eutectic
composition of LiBH4-KBH4 and no other side reaction took place during the heating range.
Eutectic melting in LiBH4- KBH4 has already been investigated by L.B. Morten group in
2014 [74] and the lowest eutectic temperature was reported as 105℃. In our case we
observed the lowest temperature as 79℃, which is different from the above, however, it
might be associated with the different starting materials and/or different measuring method
(TPPA in the above report, while DSC in this work). The effect of KH as a catalyst for the
first decomposition step of the above system can also be understood on the basis of this
eutectic melting. Since KH reacted with LiBH4 during the milling process, it changed to
KBH4 which formed a eutectic composition with LiBH4, thus reducing the melting
temperature of the above system. The ionic mobility was enhanced due to the weakening of
Li-B-H bonding in the molten state of LiBH4, thus enhancing the sorption kinetics and
reducing the decomposition temperature of first step reaction which corresponded to the
LiBH4 decomposition.
77
Fig. 4-1: DTA (upper panel) and TG analysis (lower panel) of 2LiBH4-MgH2 (dashed
lines) and 2LiBH4-MgH2 - 5%KH (solid lines)
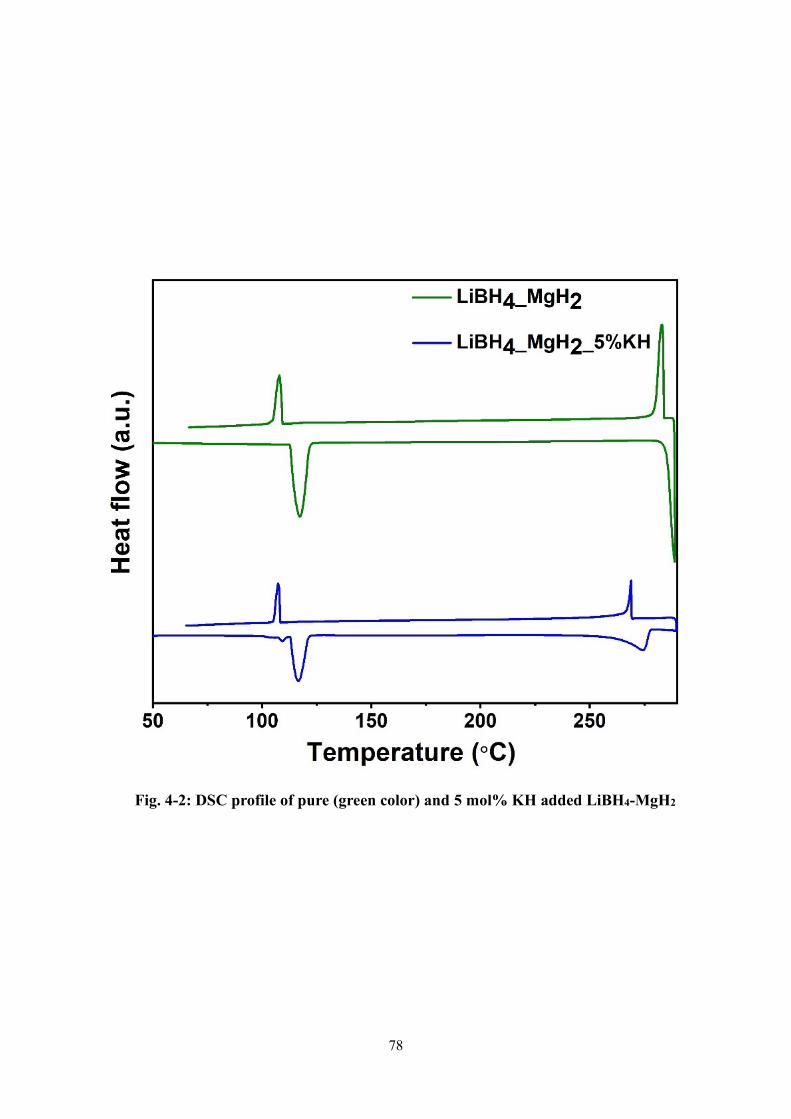
78
Fig. 4-2: DSC profile of pure (green color) and 5 mol% KH added LiBH4-MgH2

79
Fig. 4-3: DSC curves for pure 2LiBH4-MgH2 (first from upwards) and with the
different potassium hydride content. S0 is the sample 2LiBH4+MgH2 without
addition of KH i.e. 0% KH 2LiBH4+MgH2, S1 is 2LiBH4+MgH2 with 5mol%KH, S2
is 2LiBH4+MgH2 with 10mol%KH, S3 is 2LiBH4+MgH2 with 20mol%KH, S4 is
2LiBH4+MgH2 with 30mol%KH, S5 is 2LiBH4+MgH2 with 40mol%KH, S6 is
2LiBH4+MgH2 with 50mol%KH, S7 is 2LiBH4+MgH2 with 55mol%KH, S8 is
2LiBH4+MgH2 with 60mol%KH, S9 is 2LiBH4+MgH2 with 65mol%KH, S10 is
2LiBH4+MgH2 with 70mol%KH, S11 is 2LiBH4+MgH2 with 80mol%KH, S12 is
2LiBH4+MgH2 with 90mol%KH (See the table 3-2 in chapter 3 for detailed
information about samples from S0 to S12)
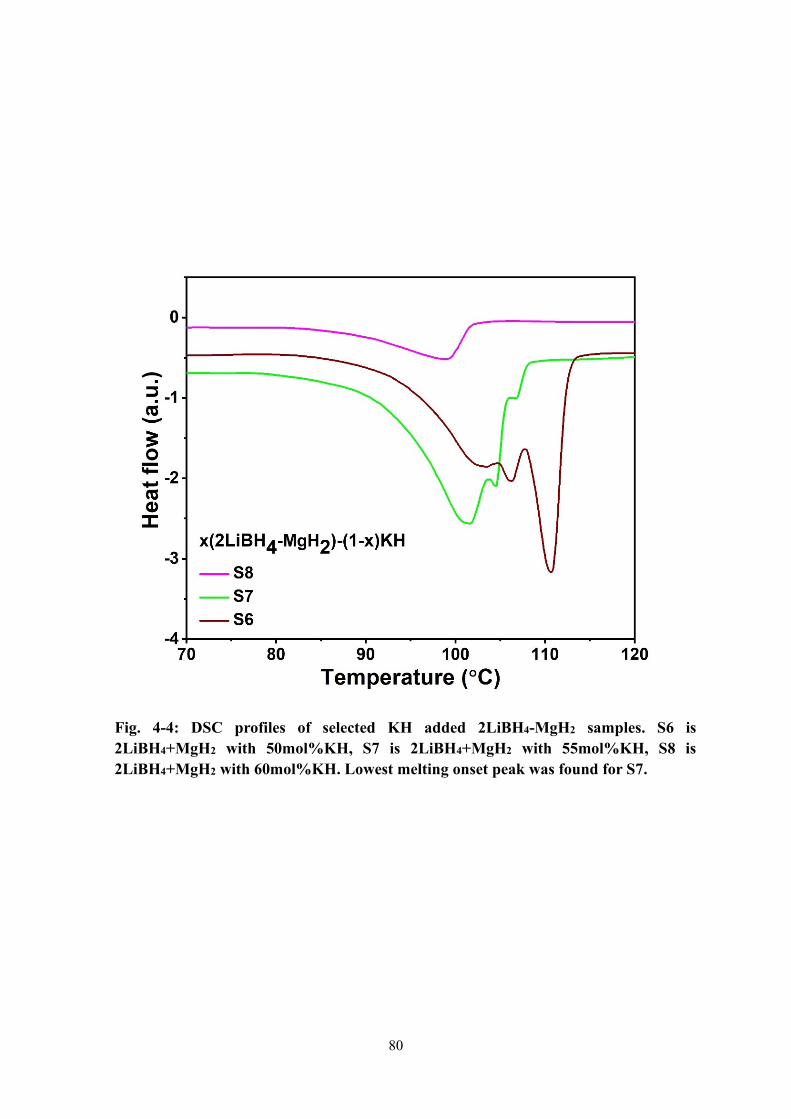
80
Fig. 4-4: DSC profiles of selected KH added 2LiBH4-MgH2 samples. S6 is
2LiBH4+MgH2 with 50mol%KH, S7 is 2LiBH4+MgH2 with 55mol%KH, S8 is
2LiBH4+MgH2 with 60mol%KH. Lowest melting onset peak was found for S7.

81
Fig. 4-5: Phase diagram of x(2LiBH4-MgH2)-(1-x)KH system
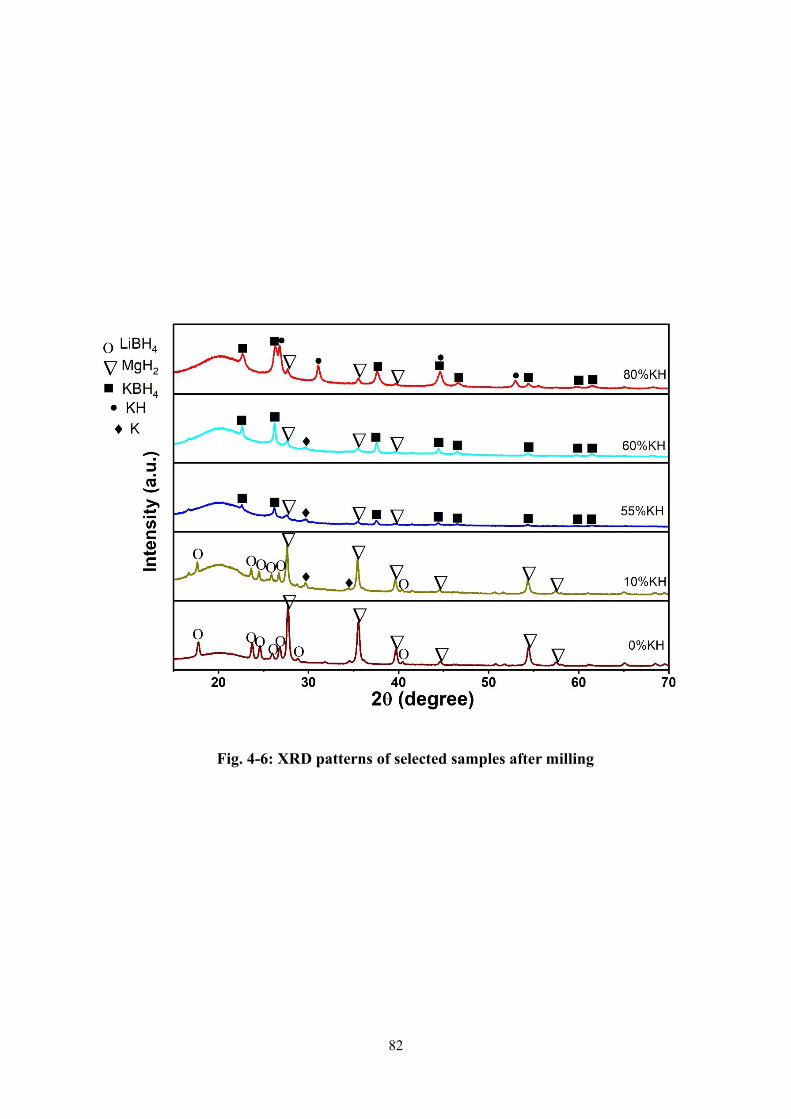
82
Fig. 4-6: XRD patterns of selected samples after milling
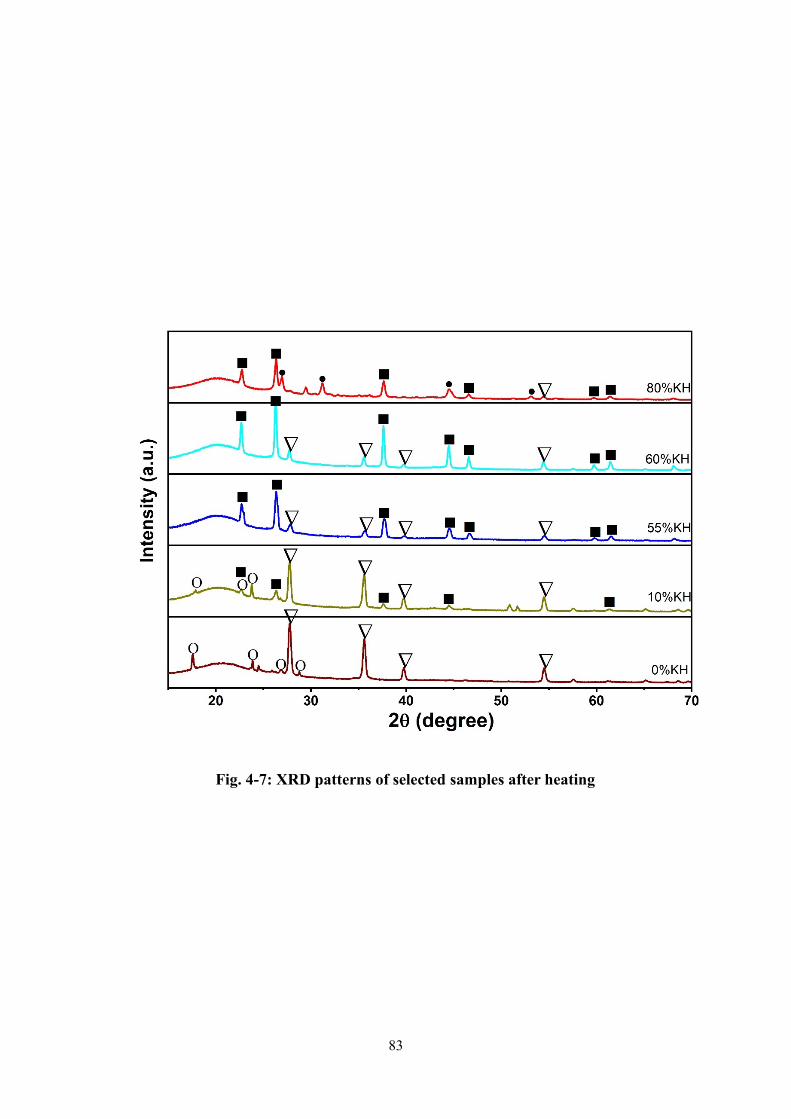
83
Fig. 4-7: XRD patterns of selected samples after heating

84
Chapter-5
Destabilization of LiBH4 by the infusion of Bi2X3 (X = S,
Se, Te): Structural and Morphological Investigation
5-1 Introduction
This chapter covers our second objective of this thesis, i.e. focus on decomposition properties
of LiBH4 by the addition of Bi2X3 chalcogenides. Structural and morphological
characterizations like XRD and TEM have been performed for all the prepared bulk and
nanostructures and their composites with LiBH4 to understand the reaction mechanism.
TG-DTA connected with MS was used to investigate the thermal profile of the bulk and nano
Bi2X3 mixed LiBH4. Finally, a reaction mechanism was established for these composites.
5-2 Dehydrogenation of LiBH4 – bulk Bi2X3 composites
The TG-DTA and MS profiles with heating rate 5℃/min in fig. 5-1, 5-2 and 5-3, show the
hydrogen desorption properties of heated LiBH4 mixed with bulk commercial samples of
Bi2X3 (X=S, Se and Te). DTA profiles of all three composites showed endothermic peaks at
117℃ and 283℃ corresponding to the phase transition and melting respectively. A tiny signal
corresponding to diborane was also observed in all the mass spectra which is negligible to
consider. The observations confirmed that the onset dehydrogenation temperature was
significantly reduced from 450℃ for pristine LiBH4 to 75℃ in case of LiBH4 - 50wt% bulk
Bi2S3. The MS profile of LiBH4-Bi2S3 composite (fig. 5-1) suggested 3 major steps for
decomposition with the onset temperature at 75℃, 340℃ and 445℃. A weight loss of
7.2wt.% was observed in first step followed by 3.3 and 2.1% in second and third step

85
respectively (TG profile in fig. 5-1). Fig. 5-2 shows the decomposition profile of LiBH4 -
50wt% bulk Bi2Se3. The first step decomposition could be started at 145℃ with weight loss
of 3.7wt.%. The onset of second and third step was quite similar to that of Bi2S3 composite i.e.
340℃ and 432℃ respectively, however the ending temperature of second step was found
slightly different. A total of 5.2wt% hydrogen was desorbed in these steps up to 500℃. The
LiBH4 - 50% bulk Bi2Te3 composite was also investigated by TG-MS to study the thermal
behaviors of the sample (fig. 5-3). The hydrogen sorption could be started at 185℃ and a
total of 2.76 wt% hydrogen was released during first step reaction with a minute amount of
B2H6, similar to other two cases. Second and third step reactions were observed to start at
same temperature as of Bi2S3 and Bi2Se3 based composites. A total weight loss of 5.24% was
observed in the second and third step of reaction up to 500℃. A total amount of 8 wt.%
hydrogen was liberated from LiBH4-50 wt% Bulk Bi2Te3. To understand the reaction
mechanism of above, XRD analysis was performed at different temperatures according to MS
profile. In addition, a fluctuation around 280℃ (the melting point of LiBH4) in all the TG
profiles was visible, which might be associated to the buoyancy effect [77],[78],[33],
commonly observed in borohydrides decomposition. Since the temperature of second and
third peak for all the three composites was found same, these were believed to correspond the
same type of reactions.
Although all the 3 composites showed a reduced decomposition temperature compared to
LiBH4, the onset temperature was still higher than it was observed in case of nano-Bi2Te3 [58].
This must be associated with the kinetic limitation. It is well known that nanomaterials and
nanostructures affect the kinetics of hydrogen absorption and dissociation by decreasing the
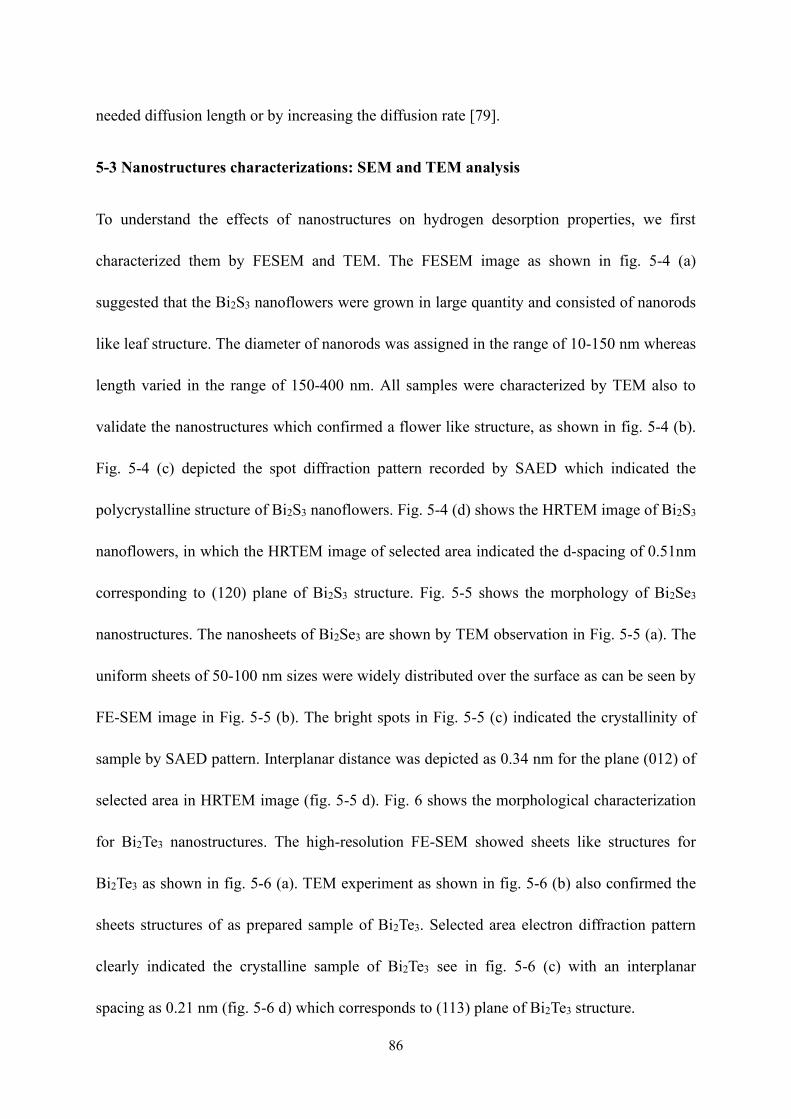
86
needed diffusion length or by increasing the diffusion rate [79].
5-3 Nanostructures characterizations: SEM and TEM analysis
To understand the effects of nanostructures on hydrogen desorption properties, we first
characterized them by FESEM and TEM. The FESEM image as shown in fig. 5-4 (a)
suggested that the Bi2S3 nanoflowers were grown in large quantity and consisted of nanorods
like leaf structure. The diameter of nanorods was assigned in the range of 10-150 nm whereas
length varied in the range of 150-400 nm. All samples were characterized by TEM also to
validate the nanostructures which confirmed a flower like structure, as shown in fig. 5-4 (b).
Fig. 5-4 (c) depicted the spot diffraction pattern recorded by SAED which indicated the
polycrystalline structure of Bi2S3 nanoflowers. Fig. 5-4 (d) shows the HRTEM image of Bi2S3
nanoflowers, in which the HRTEM image of selected area indicated the d-spacing of 0.51nm
corresponding to (120) plane of Bi2S3 structure. Fig. 5-5 shows the morphology of Bi2Se3
nanostructures. The nanosheets of Bi2Se3 are shown by TEM observation in Fig. 5-5 (a). The
uniform sheets of 50-100 nm sizes were widely distributed over the surface as can be seen by
FE-SEM image in Fig. 5-5 (b). The bright spots in Fig. 5-5 (c) indicated the crystallinity of
sample by SAED pattern. Interplanar distance was depicted as 0.34 nm for the plane (012) of
selected area in HRTEM image (fig. 5-5 d). Fig. 6 shows the morphological characterization
for Bi2Te3 nanostructures. The high-resolution FE-SEM showed sheets like structures for
Bi2Te3 as shown in fig. 5-6 (a). TEM experiment as shown in fig. 5-6 (b) also confirmed the
sheets structures of as prepared sample of Bi2Te3. Selected area electron diffraction pattern
clearly indicated the crystalline sample of Bi2Te3 see in fig. 5-6 (c) with an interplanar
spacing as 0.21 nm (fig. 5-6 d) which corresponds to (113) plane of Bi2Te3 structure.
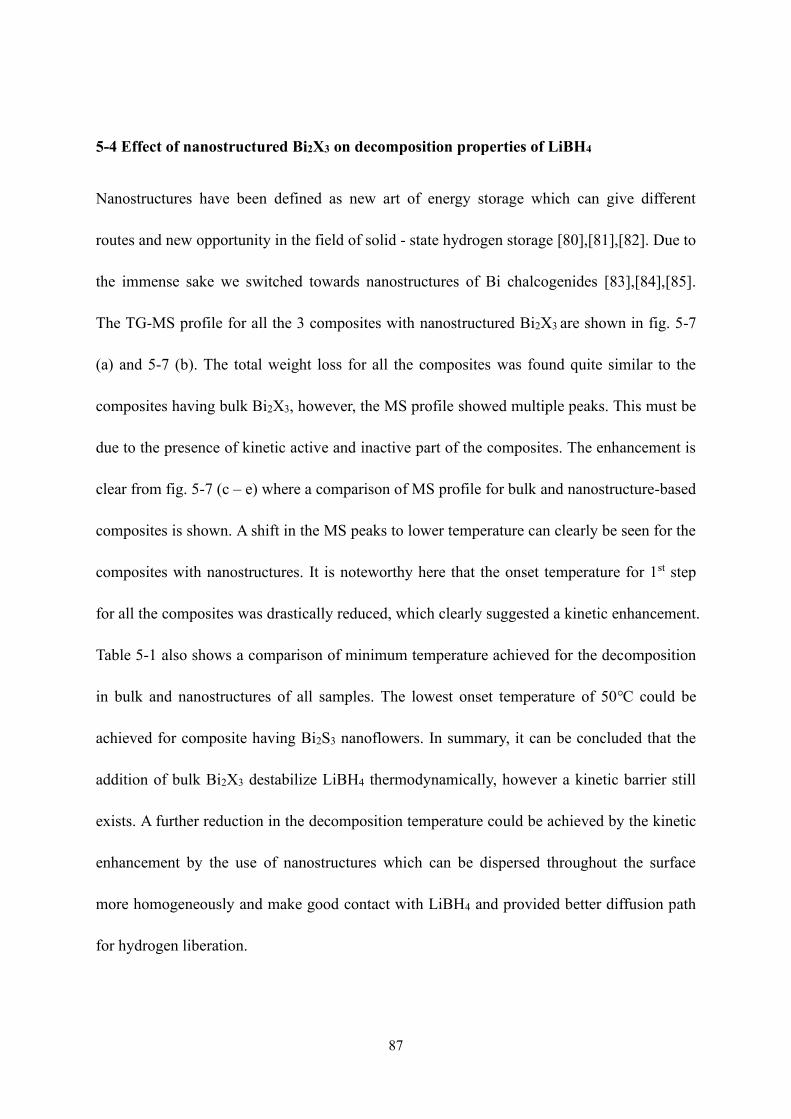
87
5-4 Effect of nanostructured Bi2X3 on decomposition properties of LiBH4
Nanostructures have been defined as new art of energy storage which can give different
routes and new opportunity in the field of solid - state hydrogen storage [80],[81],[82]. Due to
the immense sake we switched towards nanostructures of Bi chalcogenides [83],[84],[85].
The TG-MS profile for all the 3 composites with nanostructured Bi2X3 are shown in fig. 5-7
(a) and 5-7 (b). The total weight loss for all the composites was found quite similar to the
composites having bulk Bi2X3, however, the MS profile showed multiple peaks. This must be
due to the presence of kinetic active and inactive part of the composites. The enhancement is
clear from fig. 5-7 (c – e) where a comparison of MS profile for bulk and nanostructure-based
composites is shown. A shift in the MS peaks to lower temperature can clearly be seen for the
composites with nanostructures. It is noteworthy here that the onset temperature for 1st step
for all the composites was drastically reduced, which clearly suggested a kinetic enhancement.
Table 5-1 also shows a comparison of minimum temperature achieved for the decomposition
in bulk and nanostructures of all samples. The lowest onset temperature of 50℃ could be
achieved for composite having Bi2S3 nanoflowers. In summary, it can be concluded that the
addition of bulk Bi2X3 destabilize LiBH4 thermodynamically, however a kinetic barrier still
exists. A further reduction in the decomposition temperature could be achieved by the kinetic
enhancement by the use of nanostructures which can be dispersed throughout the surface
more homogeneously and make good contact with LiBH4 and provided better diffusion path
for hydrogen liberation.
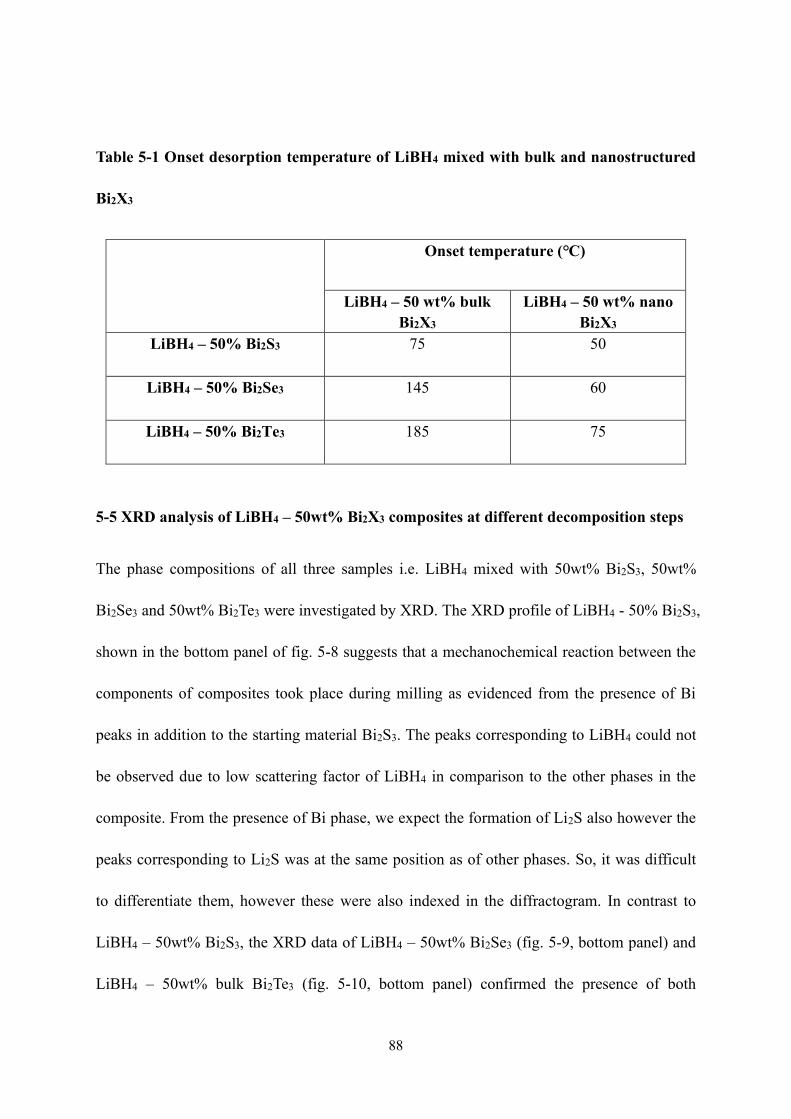
88
Table 5-1 Onset desorption temperature of LiBH4 mixed with bulk and nanostructured
Bi2X3
Onset temperature (℃)
LiBH4 – 50 wt% bulk
Bi2X3
LiBH4 – 50 wt% nano
Bi2X3
LiBH4 – 50% Bi2S3 75 50
LiBH4 – 50% Bi2Se3 145 60
LiBH4 – 50% Bi2Te3 185 75
5-5 XRD analysis of LiBH4 – 50wt% Bi2X3 composites at different decomposition steps
The phase compositions of all three samples i.e. LiBH4 mixed with 50wt% Bi2S3, 50wt%
Bi2Se3 and 50wt% Bi2Te3 were investigated by XRD. The XRD profile of LiBH4 - 50% Bi2S3,
shown in the bottom panel of fig. 5-8 suggests that a mechanochemical reaction between the
components of composites took place during milling as evidenced from the presence of Bi
peaks in addition to the starting material Bi2S3. The peaks corresponding to LiBH4 could not
be observed due to low scattering factor of LiBH4 in comparison to the other phases in the
composite. From the presence of Bi phase, we expect the formation of Li2S also however the
peaks corresponding to Li2S was at the same position as of other phases. So, it was difficult
to differentiate them, however these were also indexed in the diffractogram. In contrast to
LiBH4 – 50wt% Bi2S3, the XRD data of LiBH4 – 50wt% Bi2Se3 (fig. 5-9, bottom panel) and
LiBH4 – 50wt% bulk Bi2Te3 (fig. 5-10, bottom panel) confirmed the presence of both

89
counterparts of composites, thus suggesting no reaction between them.
To reveal the reaction mechanism of LiBH4-50wt% bulk Bi2X3 composites, structural
characterization was performed by collecting the XRD patterns after heating to various
temperatures according to TG experiment. Fig. 5-8 shows the XRD patterns for Bi2S3
composites, where mainly bismuth peaks were observed for the sample heated up to 220℃
after the first step reaction between LiBH4 and Bi2S3. The other expected phases i.e. Li2S and
LiBH4 could not be observed probably due to the low scattering factor of LiBH4 and Li2S in
comparison to Bi or due to less crystallinity ratio of these phases in comparison to Bi.
However, the presence of LiBH4 could be confirmed from the DTA profile (fig. 5-11) of
composite up to 300℃, where the profile during cooling showed the exothermic peaks at
273℃ and 102℃ corresponding to solidification and phase change of LiBH4 respectively.
Further heating up to 340℃ didn’t change the XRD profile much except the presence of
small peaks corresponding to LiBi phase which suggested further decomposition of LiBH4 in
a small extent and corresponded to very small weight loss in the temperature range of 270 to
340℃. In the next step of reaction (heated up to 445℃) LiBH4 further reacted with Bi and
LiBi to form Li3Bi which can be clearly seen from the XRD spectra for the sample heated up
to 445℃. Further heating to 500℃ didn’t change the XRD spectra, however, a weight loss
was observed in TG profile as well as a MS peak corresponding to H2 evolution could be
seen. This step must be due to the remaining excess LiBH4, which directly decompose in to
Li, B and H2 as reported in literature [86]. It is to be noted here that the weight ratio of LiBH4
and Bi2X3 was decided as 50:50 to keep the ratio almost same as that for electrode composite
material in our earlier report [58]. However, according to XRD results, less amount of LiBH4
90
should be added to exclude the third step i.e. direct decomposition of LiBH4, which needs
high temperature (>450℃). The expected reaction according to the products (as evidenced
from XRD) can be written as:
12 LiBH4 + Bi2Se3 → 2Li3Bi + 3Li2Se + 12B + 24H2
To examine the above reaction, a new composite with above ratio was prepared in a
similar way and the decomposition pathway was evaluated using TG-DTA-MS. The
TG-DTA-MS profile (fig. 5-12) showed similar decomposition peaks, however, a significant
amount of diborane was obtained during first step reaction around 150℃. Since the diborane
evolution has been considered as unwanted due to the loss of reversibility, it was concluded
here that excess amount of LiBH4 was necessary to suppress the diborane evolution. This was
the reason other composites were continued with the 50:50 weight ratio of LiBH4 and Bi2X3
for further studies. Fig. 5-9 shows the XRD patterns for LiBH4-50 wt% bulk Bi2Se3
composite at different steps. The XRD pattern after first step desorption (235℃) could be
indexed by bismuth (Bi) and lithium selenide (Li2Se) phases. Near the melting point of
LiBH4 (280℃), a very small weight loss was observed, however, no significant change was
observed in the XRD profile for the samples heated up to 325℃. Further heating to high
temperature gave rise to Li3Bi phase as observed in the XRD pattern for the sample heated up
to 430℃. No further changes in XRD pattern were found on increasing temperature up to
500℃, which again confirmed the decomposition of remaining excess LiBH4. For the
understanding of dehydrogenation process of LiBH4-50 wt% bulk Bi2Te3, the solid residues
at different heating stages were collected to get the XRD pattern and these are shown in fig.
5-10. Bismuth and lithium telluride (Li2Te) phases were the phases after the first step of
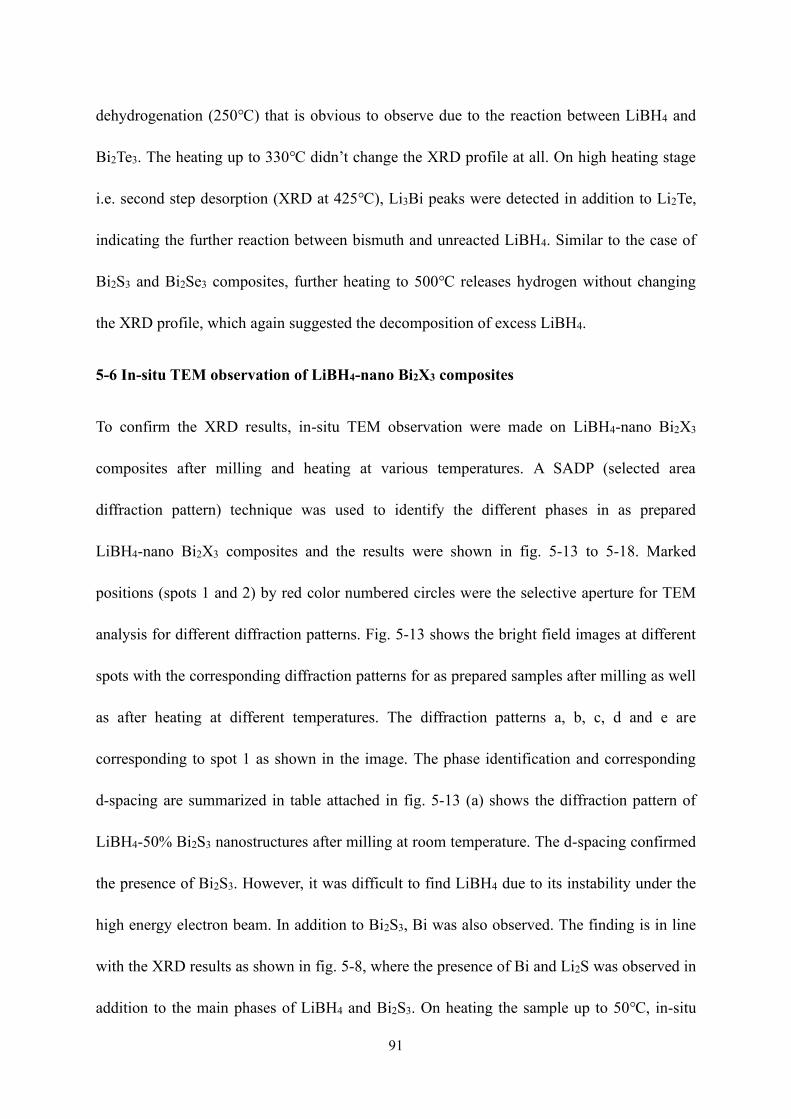
91
dehydrogenation (250℃) that is obvious to observe due to the reaction between LiBH4 and
Bi2Te3. The heating up to 330℃ didn’t change the XRD profile at all. On high heating stage
i.e. second step desorption (XRD at 425℃), Li3Bi peaks were detected in addition to Li2Te,
indicating the further reaction between bismuth and unreacted LiBH4. Similar to the case of
Bi2S3 and Bi2Se3 composites, further heating to 500℃ releases hydrogen without changing
the XRD profile, which again suggested the decomposition of excess LiBH4.
5-6 In-situ TEM observation of LiBH4-nano Bi2X3 composites
To confirm the XRD results, in-situ TEM observation were made on LiBH4-nano Bi2X3
composites after milling and heating at various temperatures. A SADP (selected area
diffraction pattern) technique was used to identify the different phases in as prepared
LiBH4-nano Bi2X3 composites and the results were shown in fig. 5-13 to 5-18. Marked
positions (spots 1 and 2) by red color numbered circles were the selective aperture for TEM
analysis for different diffraction patterns. Fig. 5-13 shows the bright field images at different
spots with the corresponding diffraction patterns for as prepared samples after milling as well
as after heating at different temperatures. The diffraction patterns a, b, c, d and e are
corresponding to spot 1 as shown in the image. The phase identification and corresponding
d-spacing are summarized in table attached in fig. 5-13 (a) shows the diffraction pattern of
LiBH4-50% Bi2S3 nanostructures after milling at room temperature. The d-spacing confirmed
the presence of Bi2S3. However, it was difficult to find LiBH4 due to its instability under the
high energy electron beam. In addition to Bi2S3, Bi was also observed. The finding is in line
with the XRD results as shown in fig. 5-8, where the presence of Bi and Li2S was observed in
addition to the main phases of LiBH4 and Bi2S3. On heating the sample up to 50℃, in-situ
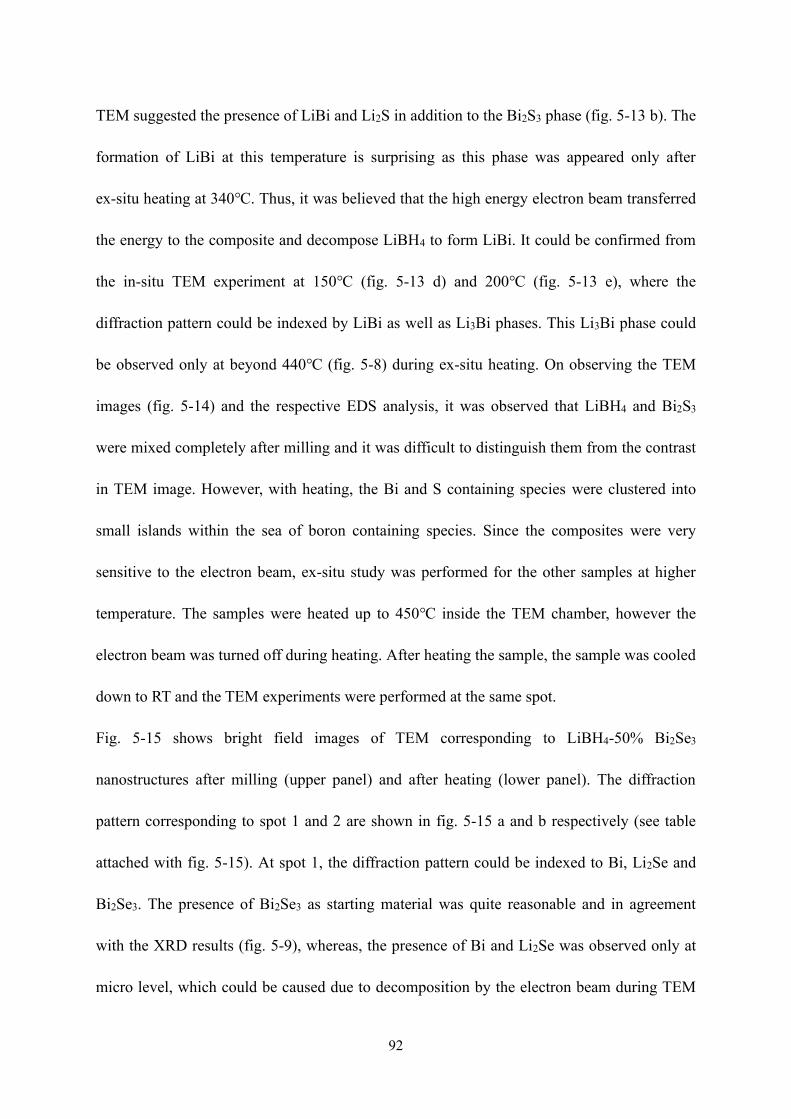
92
TEM suggested the presence of LiBi and Li2S in addition to the Bi2S3 phase (fig. 5-13 b). The
formation of LiBi at this temperature is surprising as this phase was appeared only after
ex-situ heating at 340℃. Thus, it was believed that the high energy electron beam transferred
the energy to the composite and decompose LiBH4 to form LiBi. It could be confirmed from
the in-situ TEM experiment at 150℃ (fig. 5-13 d) and 200℃ (fig. 5-13 e), where the
diffraction pattern could be indexed by LiBi as well as Li3Bi phases. This Li3Bi phase could
be observed only at beyond 440℃ (fig. 5-8) during ex-situ heating. On observing the TEM
images (fig. 5-14) and the respective EDS analysis, it was observed that LiBH4 and Bi2S3
were mixed completely after milling and it was difficult to distinguish them from the contrast
in TEM image. However, with heating, the Bi and S containing species were clustered into
small islands within the sea of boron containing species. Since the composites were very
sensitive to the electron beam, ex-situ study was performed for the other samples at higher
temperature. The samples were heated up to 450℃ inside the TEM chamber, however the
electron beam was turned off during heating. After heating the sample, the sample was cooled
down to RT and the TEM experiments were performed at the same spot.
Fig. 5-15 shows bright field images of TEM corresponding to LiBH4-50% Bi2Se3
nanostructures after milling (upper panel) and after heating (lower panel). The diffraction
pattern corresponding to spot 1 and 2 are shown in fig. 5-15 a and b respectively (see table
attached with fig. 5-15). At spot 1, the diffraction pattern could be indexed to Bi, Li2Se and
Bi2Se3. The presence of Bi2Se3 as starting material was quite reasonable and in agreement
with the XRD results (fig. 5-9), whereas, the presence of Bi and Li2Se was observed only at
micro level, which could be caused due to decomposition by the electron beam during TEM
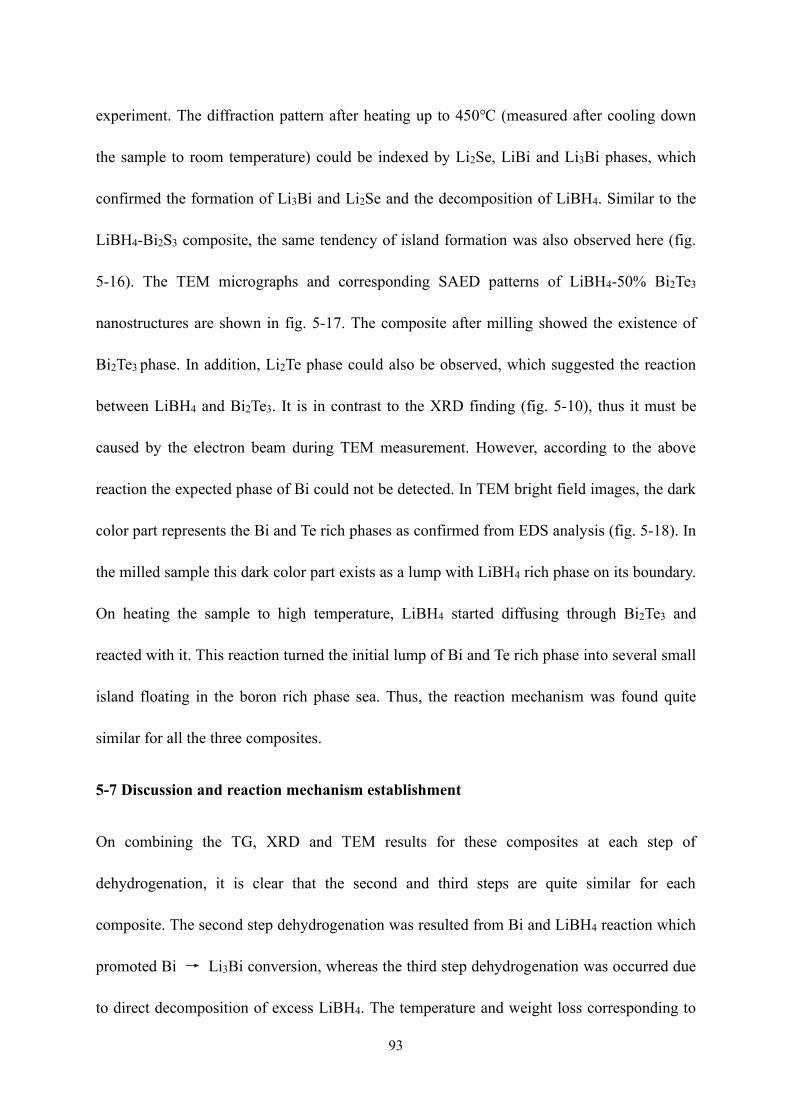
93
experiment. The diffraction pattern after heating up to 450℃ (measured after cooling down
the sample to room temperature) could be indexed by Li2Se, LiBi and Li3Bi phases, which
confirmed the formation of Li3Bi and Li2Se and the decomposition of LiBH4. Similar to the
LiBH4-Bi2S3 composite, the same tendency of island formation was also observed here (fig.
5-16). The TEM micrographs and corresponding SAED patterns of LiBH4-50% Bi2Te3
nanostructures are shown in fig. 5-17. The composite after milling showed the existence of
Bi2Te3 phase. In addition, Li2Te phase could also be observed, which suggested the reaction
between LiBH4 and Bi2Te3. It is in contrast to the XRD finding (fig. 5-10), thus it must be
caused by the electron beam during TEM measurement. However, according to the above
reaction the expected phase of Bi could not be detected. In TEM bright field images, the dark
color part represents the Bi and Te rich phases as confirmed from EDS analysis (fig. 5-18). In
the milled sample this dark color part exists as a lump with LiBH4 rich phase on its boundary.
On heating the sample to high temperature, LiBH4 started diffusing through Bi2Te3 and
reacted with it. This reaction turned the initial lump of Bi and Te rich phase into several small
island floating in the boron rich phase sea. Thus, the reaction mechanism was found quite
similar for all the three composites.
5-7 Discussion and reaction mechanism establishment
On combining the TG, XRD and TEM results for these composites at each step of
dehydrogenation, it is clear that the second and third steps are quite similar for each
composite. The second step dehydrogenation was resulted from Bi and LiBH4 reaction which
promoted Bi → Li3Bi conversion, whereas the third step dehydrogenation was occurred due
to direct decomposition of excess LiBH4. The temperature and weight loss corresponding to
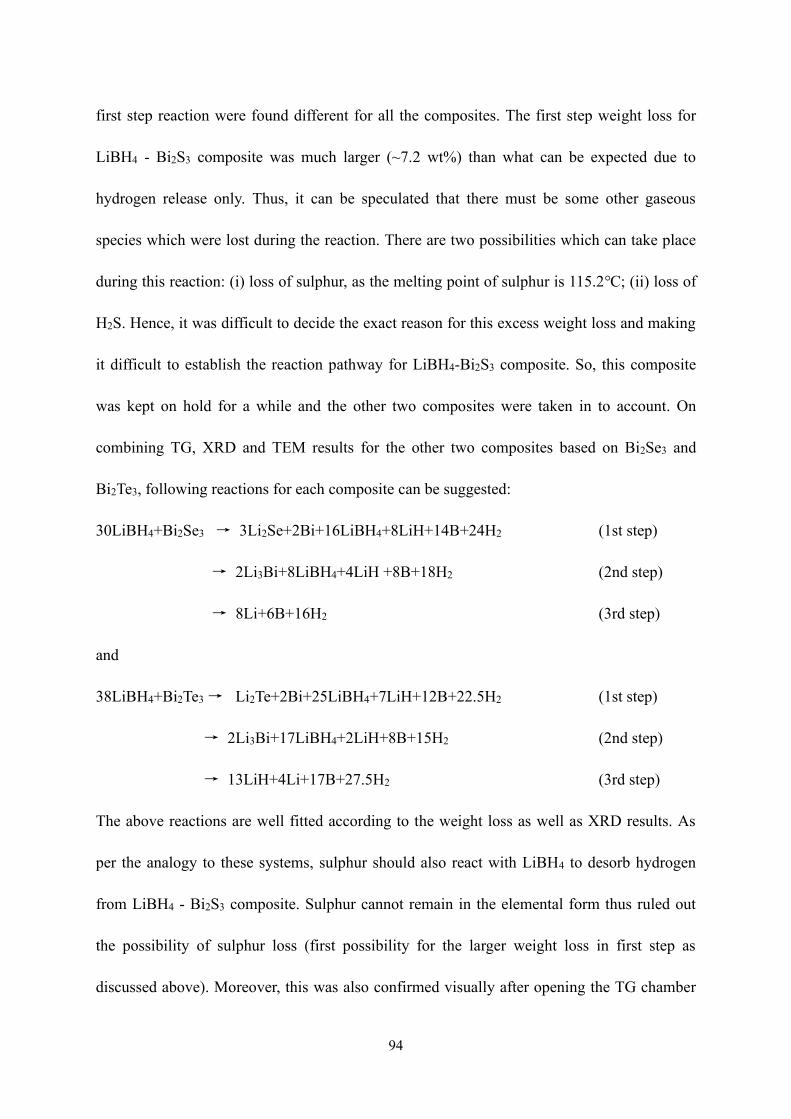
94
first step reaction were found different for all the composites. The first step weight loss for
LiBH4 - Bi2S3 composite was much larger (~7.2 wt%) than what can be expected due to
hydrogen release only. Thus, it can be speculated that there must be some other gaseous
species which were lost during the reaction. There are two possibilities which can take place
during this reaction: (i) loss of sulphur, as the melting point of sulphur is 115.2℃; (ii) loss of
H2S. Hence, it was difficult to decide the exact reason for this excess weight loss and making
it difficult to establish the reaction pathway for LiBH4-Bi2S3 composite. So, this composite
was kept on hold for a while and the other two composites were taken in to account. On
combining TG, XRD and TEM results for the other two composites based on Bi2Se3 and
Bi2Te3, following reactions for each composite can be suggested:
30LiBH4+Bi2Se3 → 3Li2Se+2Bi+16LiBH4+8LiH+14B+24H2 (1st step)
→ 2Li3Bi+8LiBH4+4LiH +8B+18H2 (2nd step)
→ 8Li+6B+16H2 (3rd step)
and
38LiBH4+Bi2Te3 → Li2Te+2Bi+25LiBH4+7LiH+12B+22.5H2 (1st step)
→ 2Li3Bi+17LiBH4+2LiH+8B+15H2 (2nd step)
→ 13LiH+4Li+17B+27.5H2 (3rd step)
The above reactions are well fitted according to the weight loss as well as XRD results. As
per the analogy to these systems, sulphur should also react with LiBH4 to desorb hydrogen
from LiBH4 - Bi2S3 composite. Sulphur cannot remain in the elemental form thus ruled out
the possibility of sulphur loss (first possibility for the larger weight loss in first step as
discussed above). Moreover, this was also confirmed visually after opening the TG chamber

95
after first step reaction, where no sign of melting was observed. On the other hand, there is
equal possibility of forming H2S in addition to Li2S during the reaction of Bi2S3 with LiBH4.
However, no MS peak for H2S was observed during first step (fig. 5-1 and fig. 5-12). The
absence of H2S - MS signal might be caused by the decomposition of H2S in to H2 and S
during the transfer of H2S gas from TG chamber to MS chamber through capillary, which was
kept at 200℃. Since H2S is unstable gas at high temperature and easy to decompose even at
room temperature in presence of metal catalyst [87],[88],[89] the above speculation is quite
reasonable to justify larger weight loss according to the following reaction:
24LiBH4+Bi2S3 → 1.2Li2S+1.8H2S+2Bi+18.5LiBH4+3LiH+5.5B+7.5H2 (1st step)
→ 2Li3Bi+9.5LiBH4+3LiH +9B+16.5H2 (2nd step)
→ 9.5LiH+9.5B+14H2 (3rd step)
It is clear from above that hydrogen desorption took place at significantly lower temperature.
The onset temperature for all the composites was found less than 100℃, which is quite
interesting for hydrogen storage application. On the other hand, it is much lower than the
operating temperature of coin cell (this must be the reason of coin cell opening during
electrochemical operation) in our previous work [58]. Thus, it can be concluded that such a
lower desorption temperature of these composites restricted the potential window and
affected the cyclic stability of these electrode materials drastically. To resolve this issue, these
composite materials should be operated at lower temperature for which LiBH4 should be
replaced by some other electrolytes which are capable to work at lower temperature. It can be
achieved by making composite of LiBH4 also, so that the high temperature phase of LiBH4
can be stabilized at room temperature [90]. This will prevent the thermochemical reaction
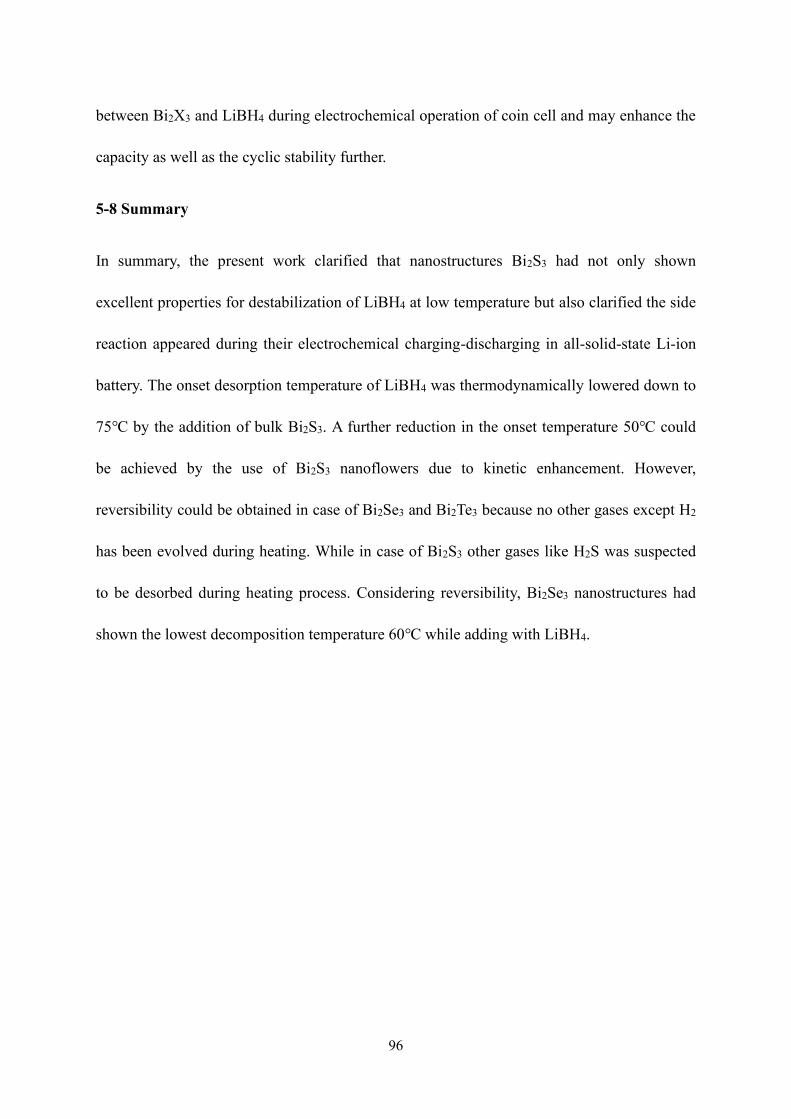
96
between Bi2X3 and LiBH4 during electrochemical operation of coin cell and may enhance the
capacity as well as the cyclic stability further.
5-8 Summary
In summary, the present work clarified that nanostructures Bi2S3 had not only shown
excellent properties for destabilization of LiBH4 at low temperature but also clarified the side
reaction appeared during their electrochemical charging-discharging in all-solid-state Li-ion
battery. The onset desorption temperature of LiBH4 was thermodynamically lowered down to
75℃ by the addition of bulk Bi2S3. A further reduction in the onset temperature 50℃ could
be achieved by the use of Bi2S3 nanoflowers due to kinetic enhancement. However,
reversibility could be obtained in case of Bi2Se3 and Bi2Te3 because no other gases except H2
has been evolved during heating. While in case of Bi2S3 other gases like H2S was suspected
to be desorbed during heating process. Considering reversibility, Bi2Se3 nanostructures had
shown the lowest decomposition temperature 60℃ while adding with LiBH4.

97
Fig. 5-1: TG-DTA and MS profile of milled LiBH4 – 50wt% bulk Bi2S3
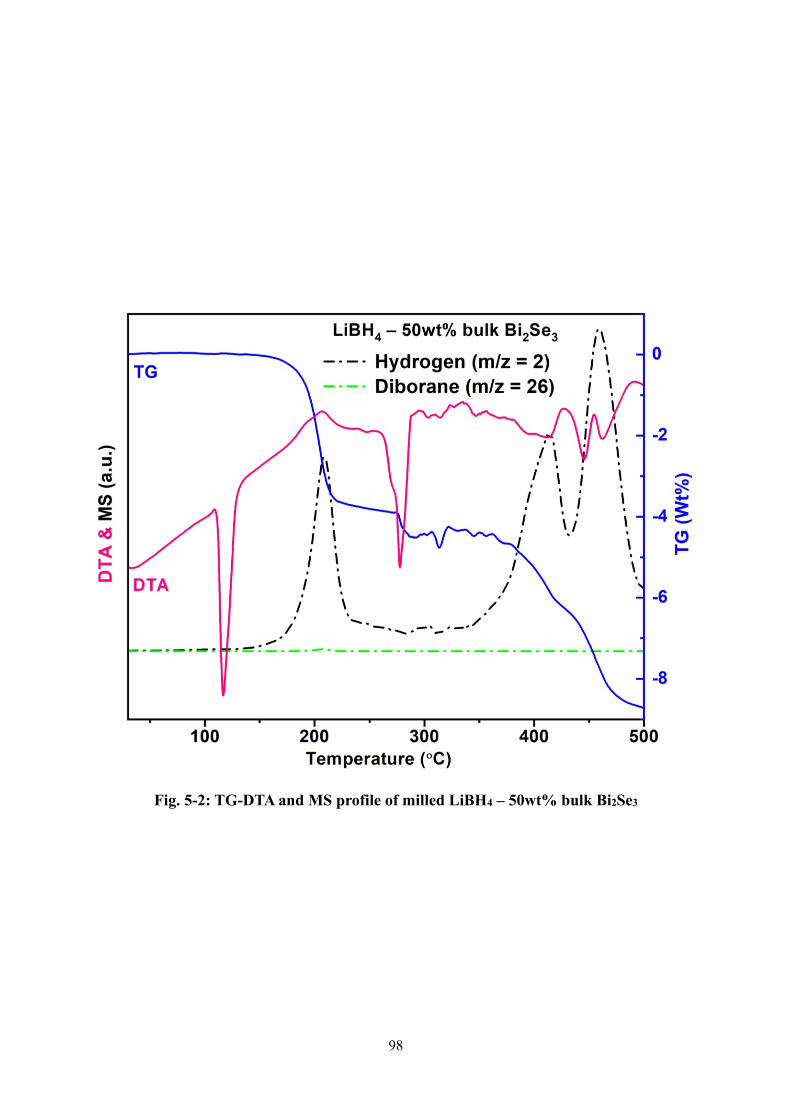
98
Fig. 5-2: TG-DTA and MS profile of milled LiBH4 – 50wt% bulk Bi2Se3
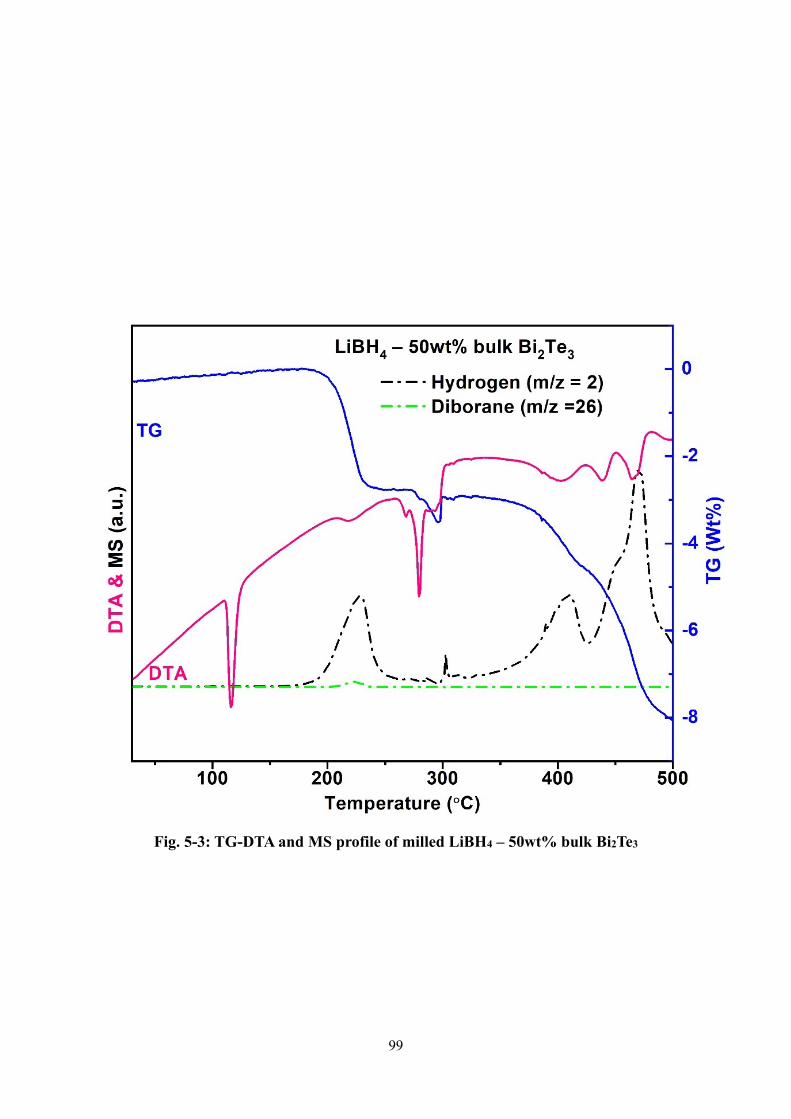
99
Fig. 5-3: TG-DTA and MS profile of milled LiBH4 – 50wt% bulk Bi2Te3
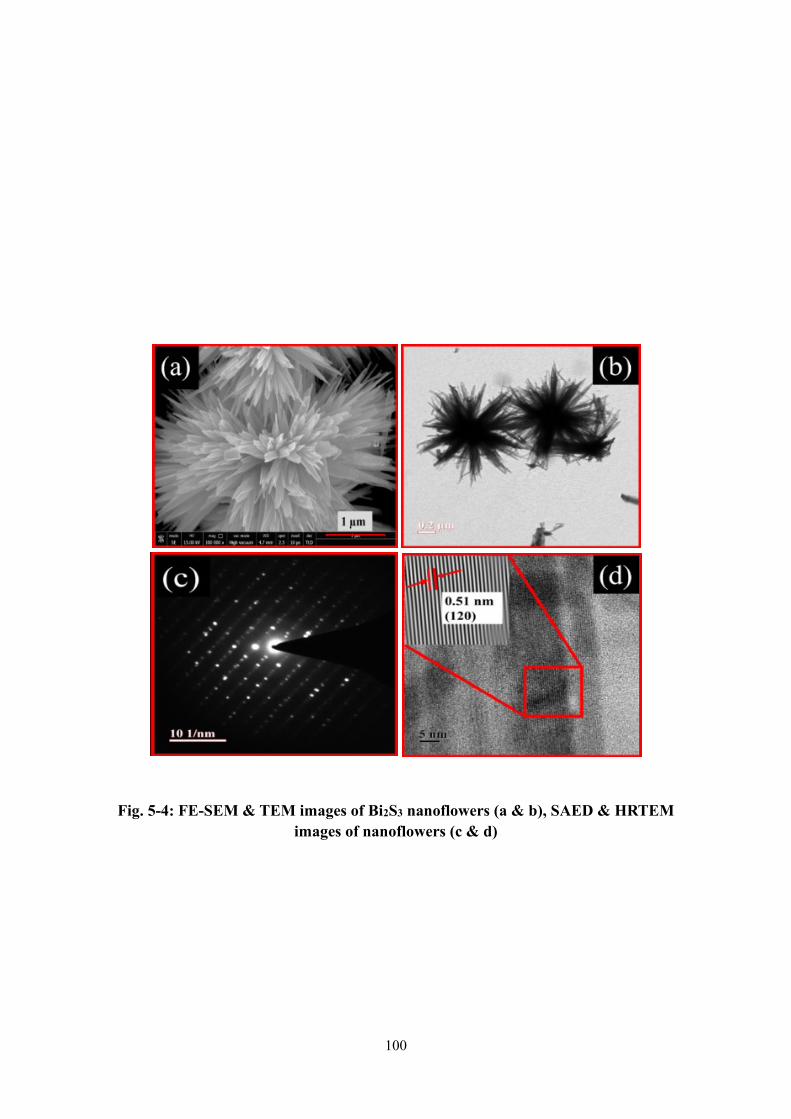
100
Fig. 5-4: FE-SEM & TEM images of Bi2S3 nanoflowers (a & b), SAED & HRTEM
images of nanoflowers (c & d)
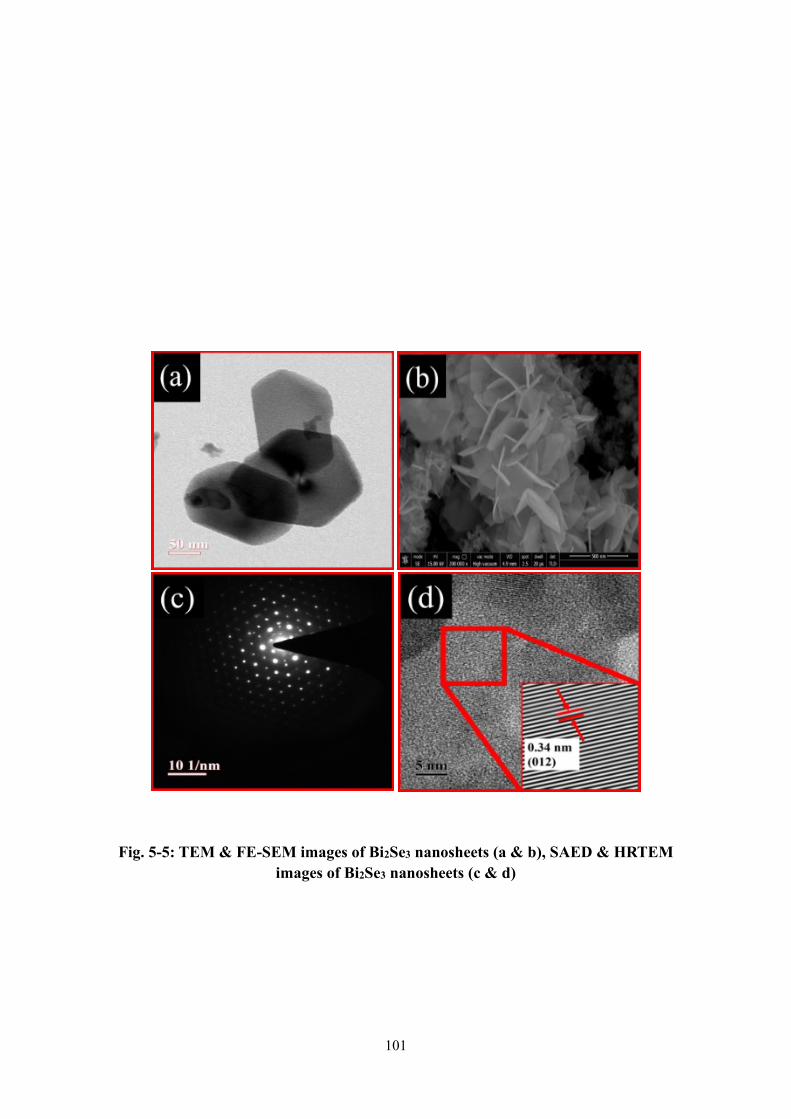
101
Fig. 5-5: TEM & FE-SEM images of Bi2Se3 nanosheets (a & b), SAED & HRTEM
images of Bi2Se3 nanosheets (c & d)
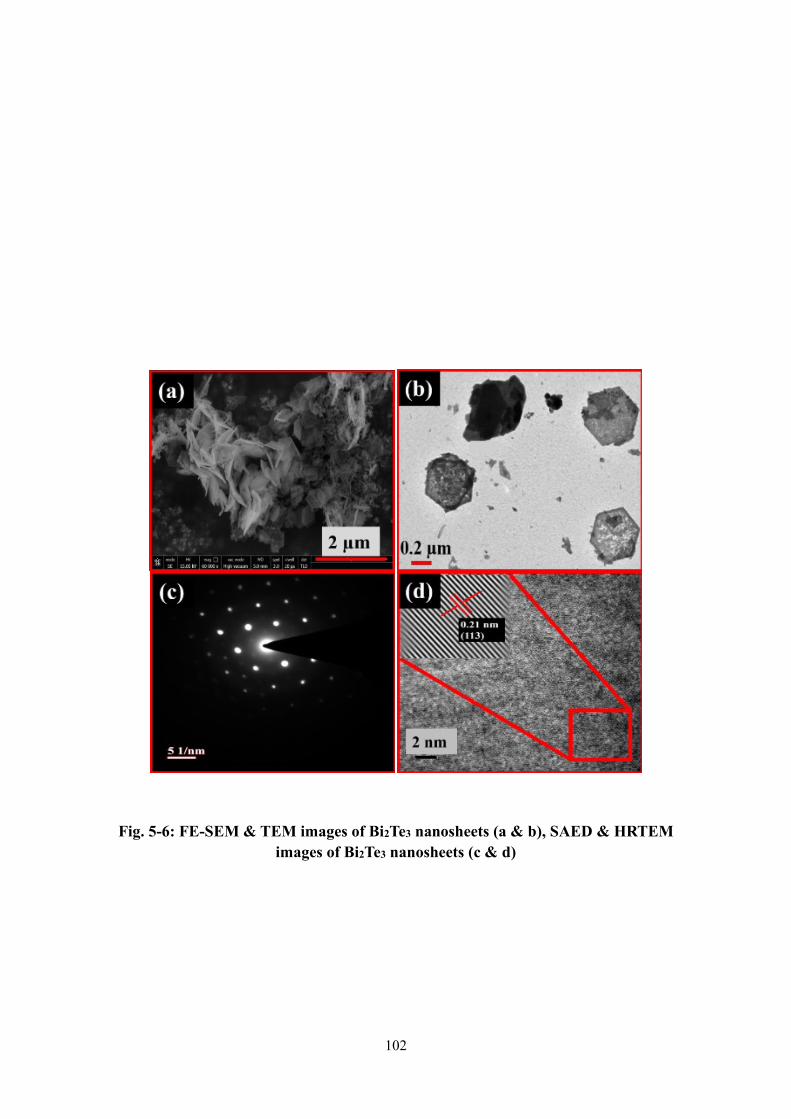
102
Fig. 5-6: FE-SEM & TEM images of Bi2Te3 nanosheets (a & b), SAED & HRTEM
images of Bi2Te3 nanosheets (c & d)
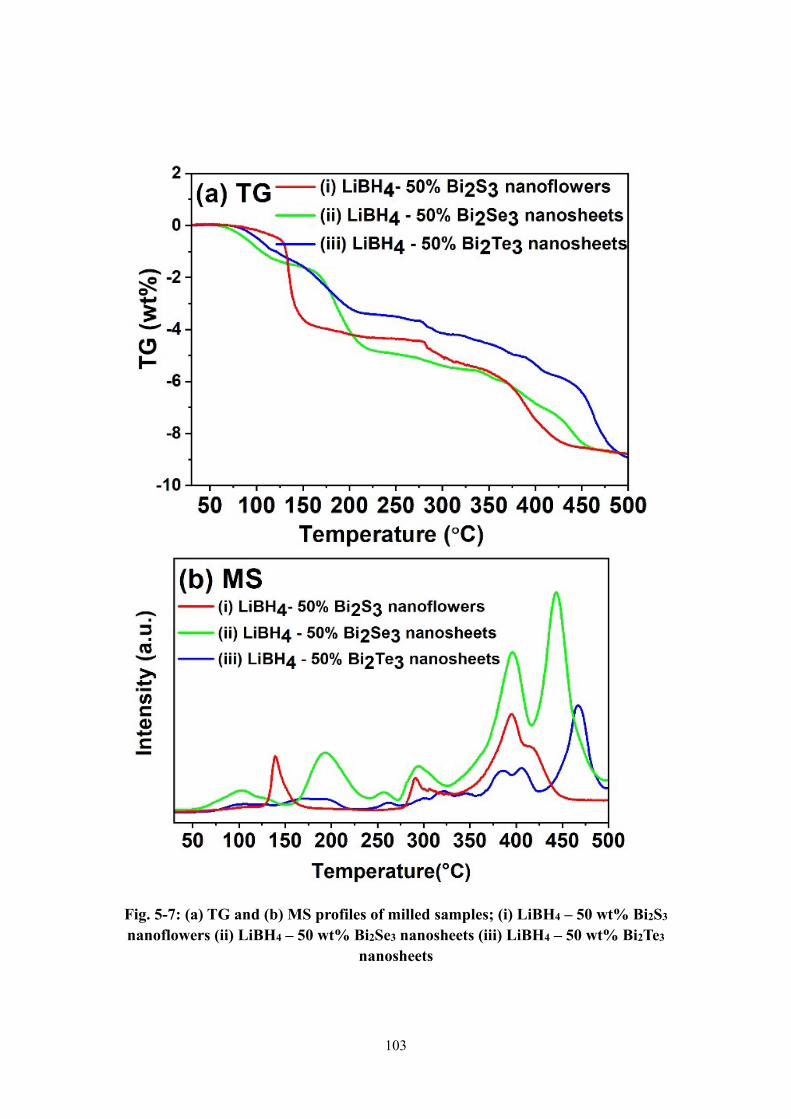
103
Fig. 5-7: (a) TG and (b) MS profiles of milled samples; (i) LiBH4 – 50 wt% Bi2S3
nanoflowers (ii) LiBH4 – 50 wt% Bi2Se3 nanosheets (iii) LiBH4 – 50 wt% Bi2Te3
nanosheets
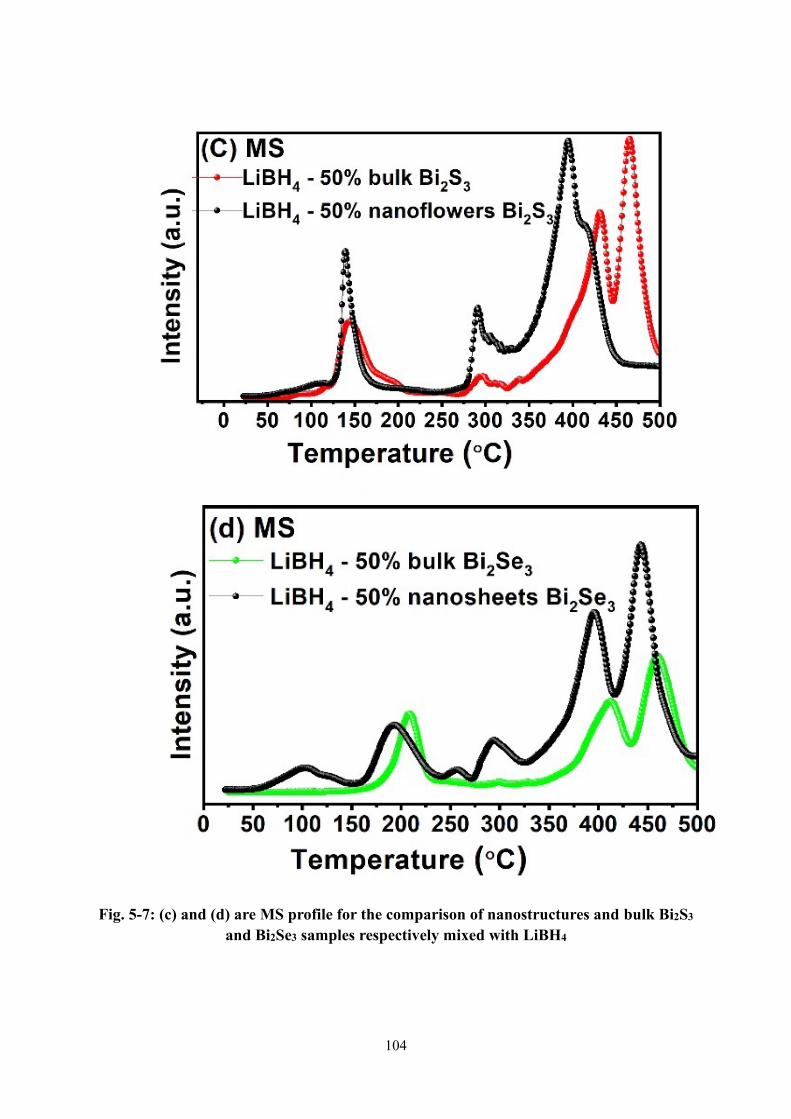
104
Fig. 5-7: (c) and (d) are MS profile for the comparison of nanostructures and bulk Bi2S3
and Bi2Se3 samples respectively mixed with LiBH4

105
Fig. 5-7: (e) MS profile for the comparison of nanostructures and bulk Bi2Te3 mixed
with LiBH4
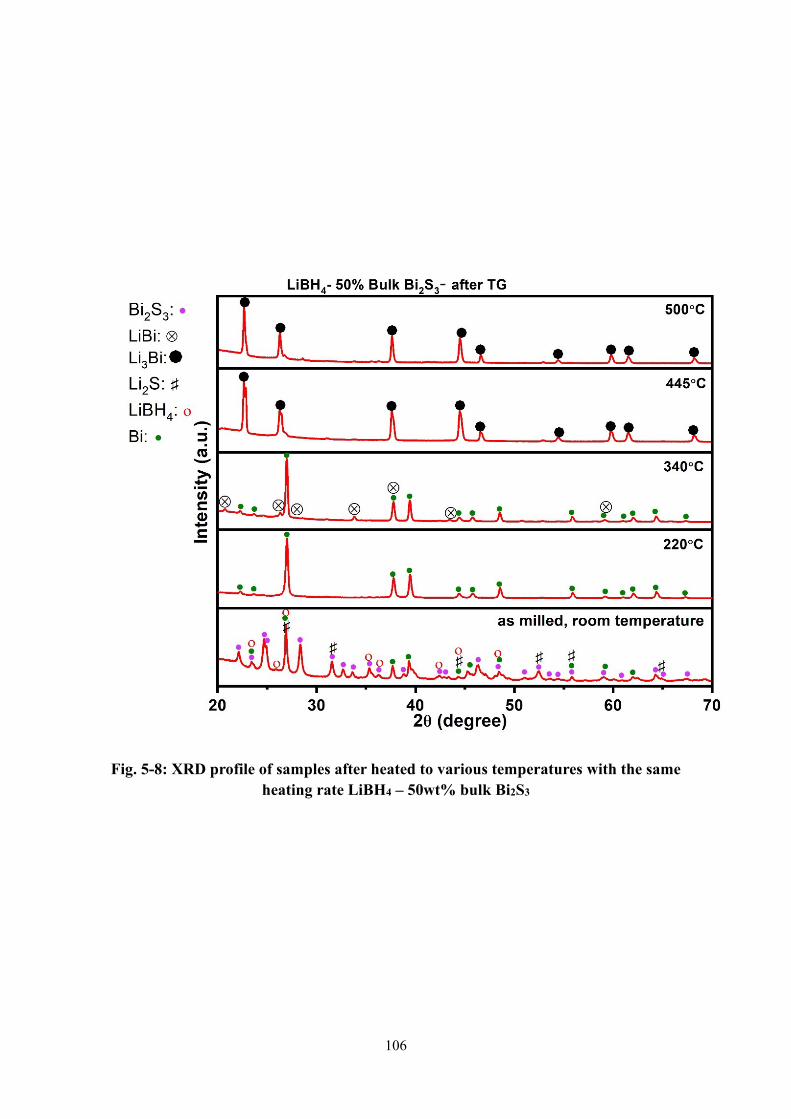
106
Fig. 5-8: XRD profile of samples after heated to various temperatures with the same
heating rate LiBH4 – 50wt% bulk Bi2S3
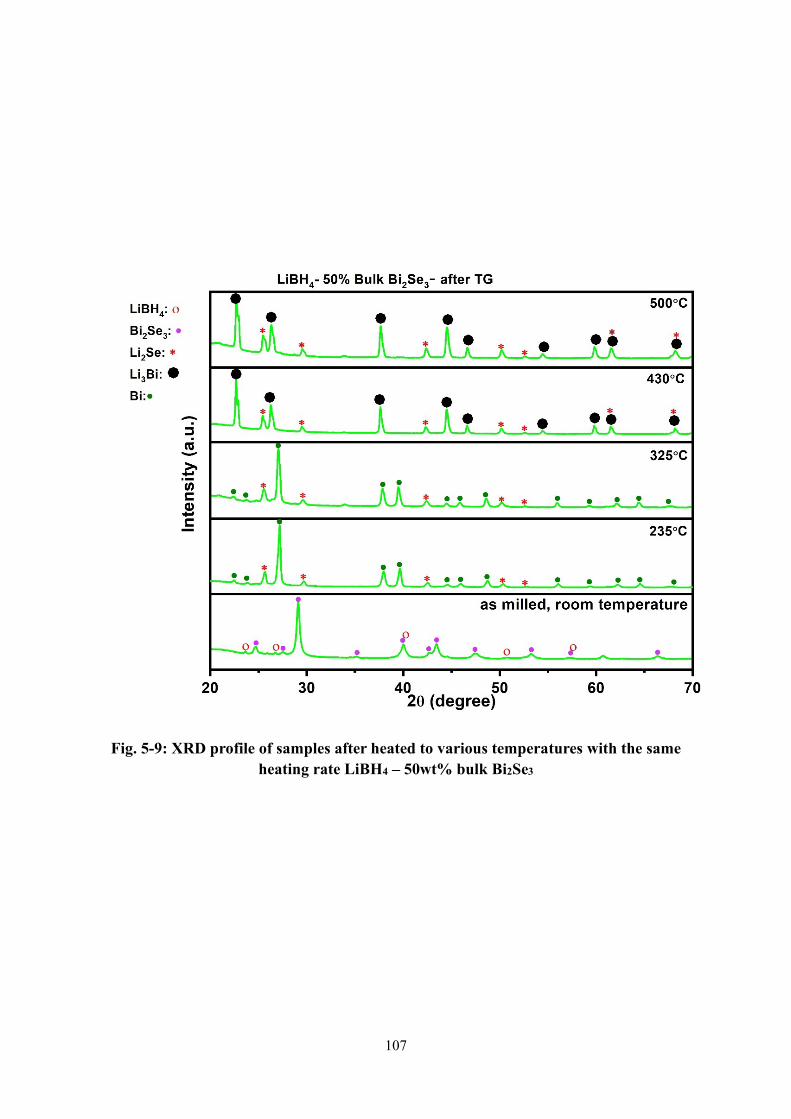
107
Fig. 5-9: XRD profile of samples after heated to various temperatures with the same
heating rate LiBH4 – 50wt% bulk Bi2Se3
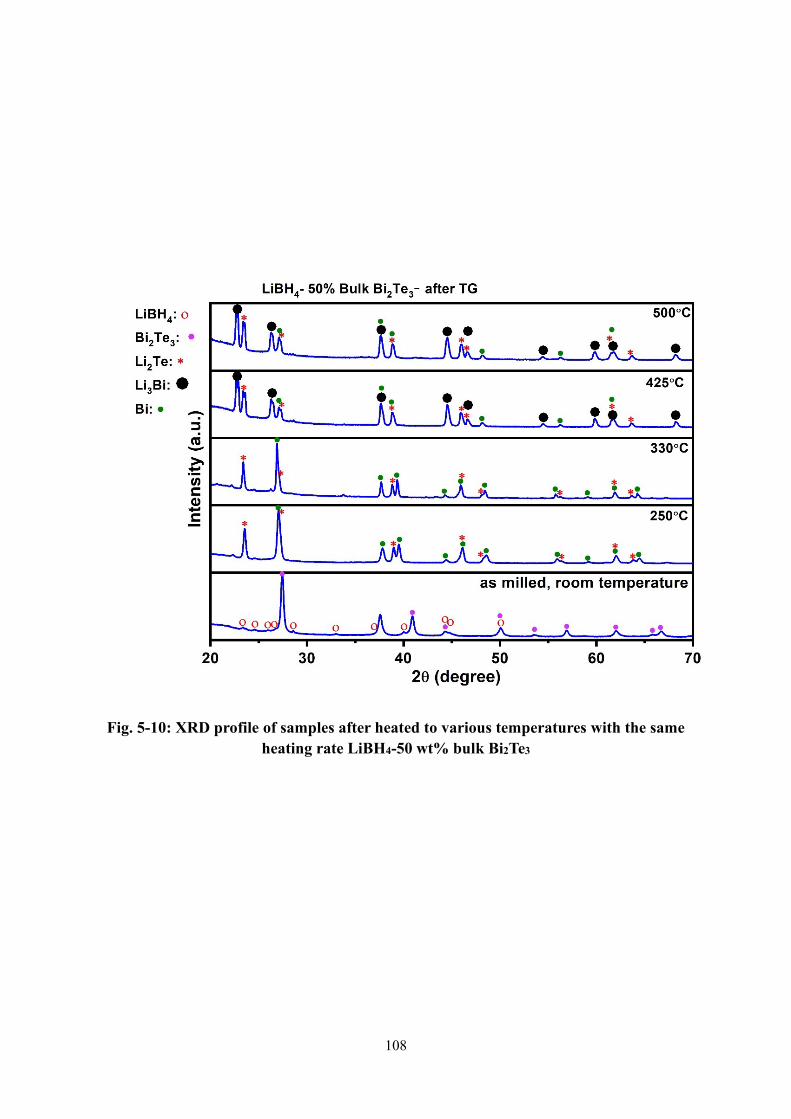
108
Fig. 5-10: XRD profile of samples after heated to various temperatures with the same
heating rate LiBH4-50 wt% bulk Bi2Te3

109
Fig. 5-11: DTA profile of LiBH4-50wt% Bi2S3 composite with heating (downwards; endo)
and cooling (upwards; exo) profiles
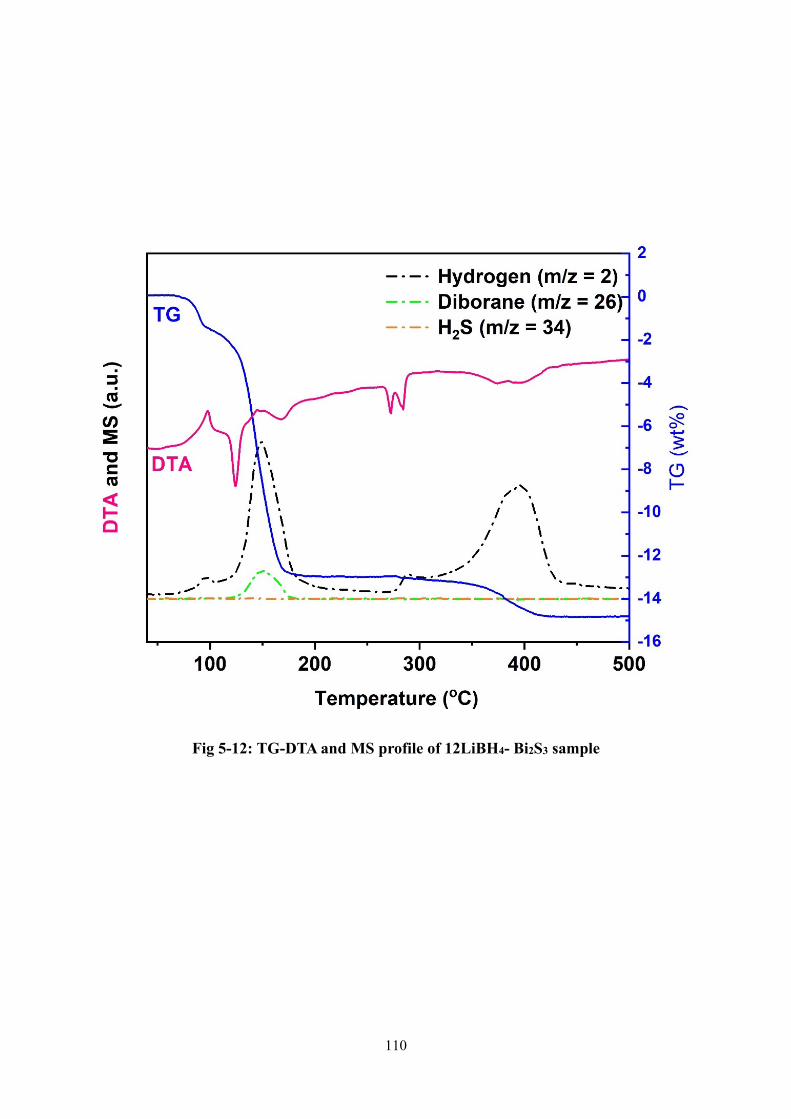
110
Fig 5-12: TG-DTA and MS profile of 12LiBH4- Bi2S3 sample
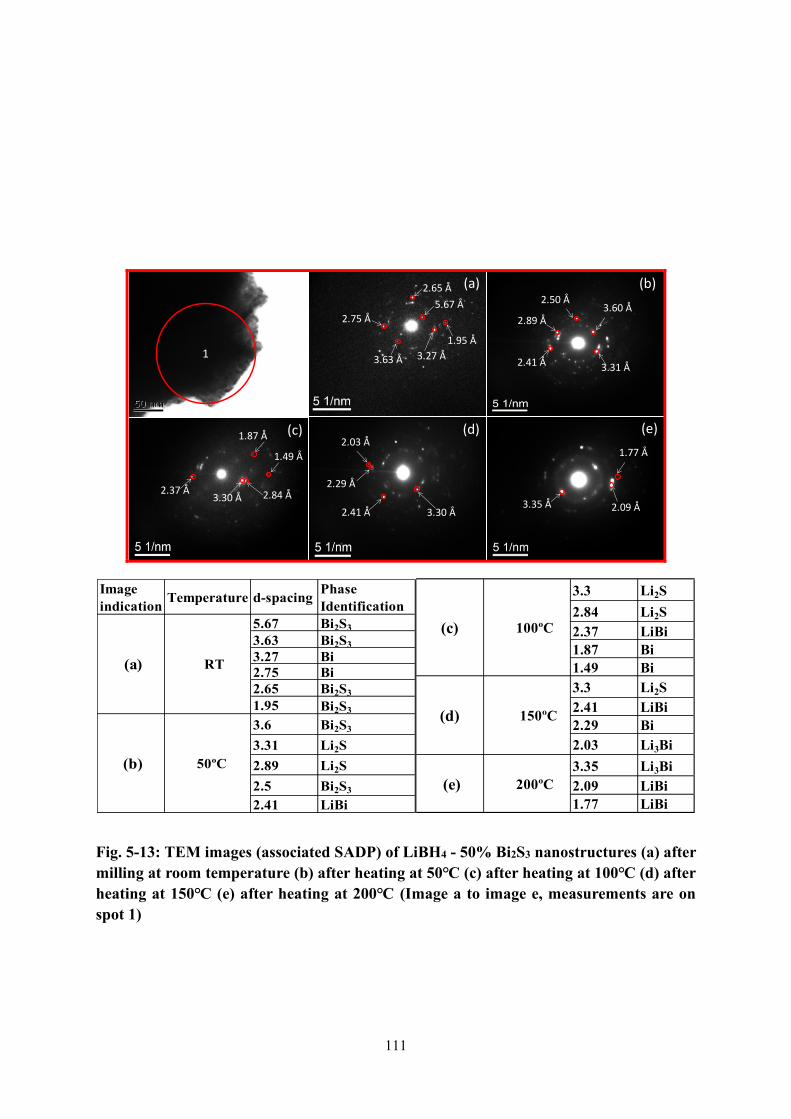
111
1
5.67 Å
3.63 Å 3.27 Å
1.95 Å
2.65 Å
2.75 Å
(a)
3.60 Å
3.31 Å
2.89 Å
2.50 Å
2.41 Å
(b)
3.30 Å 2.84 Å2.37 Å
1.87 Å
1.49 Å
(c)
3.30 Å2.41 Å
2.29 Å
2.03 Å(d)
3.35 Å 2.09 Å
1.77 Å
(e)
Image
indicationTemperature d-spacing
Phase
Identification
5.67 Bi2S3
3.63 Bi2S3
3.27 Bi
2.75 Bi
2.65 Bi2S3
1.95 Bi2S3
3.6 Bi2S3
3.31 Li2S
2.89 Li2S
2.5 Bi2S3
2.41 LiBi
(a) RT
(b) 50ºC
3.3 Li2S
2.84 Li2S
2.37 LiBi
1.87 Bi
1.49 Bi
3.3 Li2S
2.41 LiBi
2.29 Bi
2.03 Li3Bi
3.35 Li3Bi
2.09 LiBi
1.77 LiBi
(c) 100ºC
(d) 150ºC
(e) 200ºC
Fig. 5-13: TEM images (associated SADP) of LiBH4 - 50% Bi2S3 nanostructures (a) after
milling at room temperature (b) after heating at 50℃ (c) after heating at 100℃ (d) after
heating at 150℃ (e) after heating at 200℃ (Image a to image e, measurements are on
spot 1)
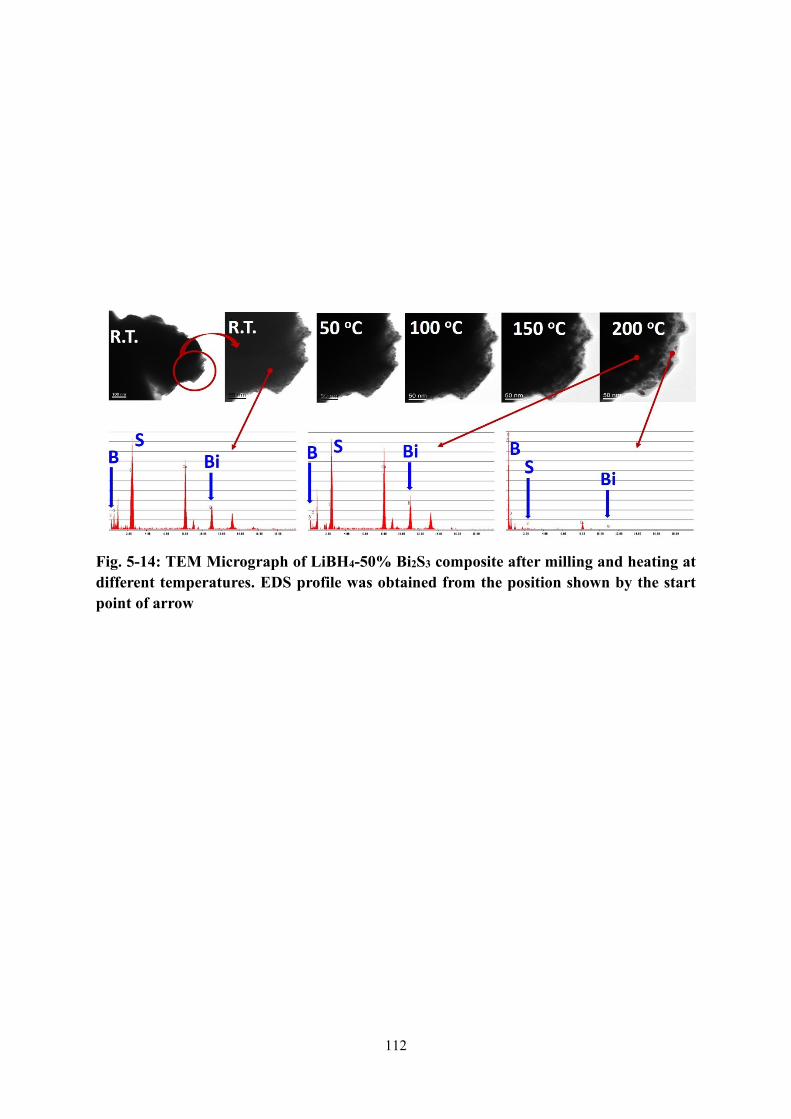
112
Fig. 5-14: TEM Micrograph of LiBH4-50% Bi2S3 composite after milling and heating at
different temperatures. EDS profile was obtained from the position shown by the start
point of arrow
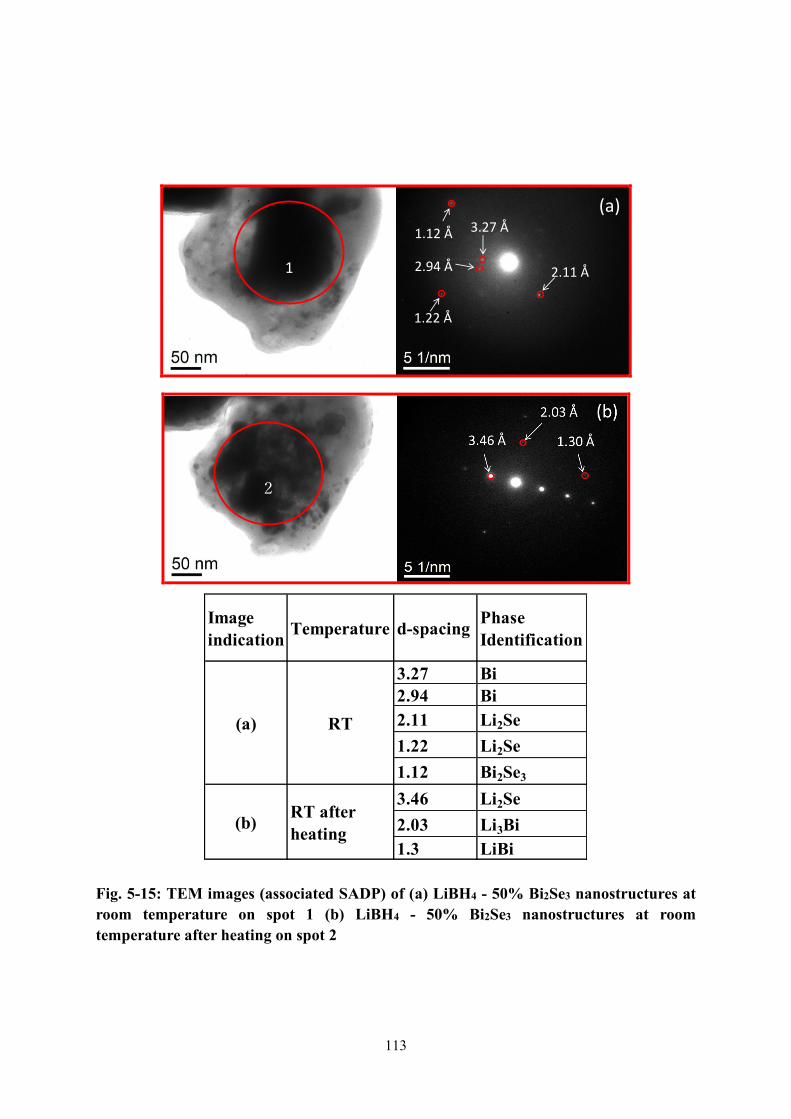
113
1
3.27 Å
2.94 Å
1.22 Å
2.11 Å
1.12 Å
(a)
2
Image
indicationTemperature d-spacing
Phase
Identification
3.27 Bi
2.94 Bi
2.11 Li2Se
1.22 Li2Se
1.12 Bi2Se3
3.46 Li2Se
2.03 Li3Bi
1.3 LiBi
(a) RT
(b)RT after
heating
Fig. 5-15: TEM images (associated SADP) of (a) LiBH4 - 50% Bi2Se3 nanostructures at
room temperature on spot 1 (b) LiBH4 - 50% Bi2Se3 nanostructures at room
temperature after heating on spot 2
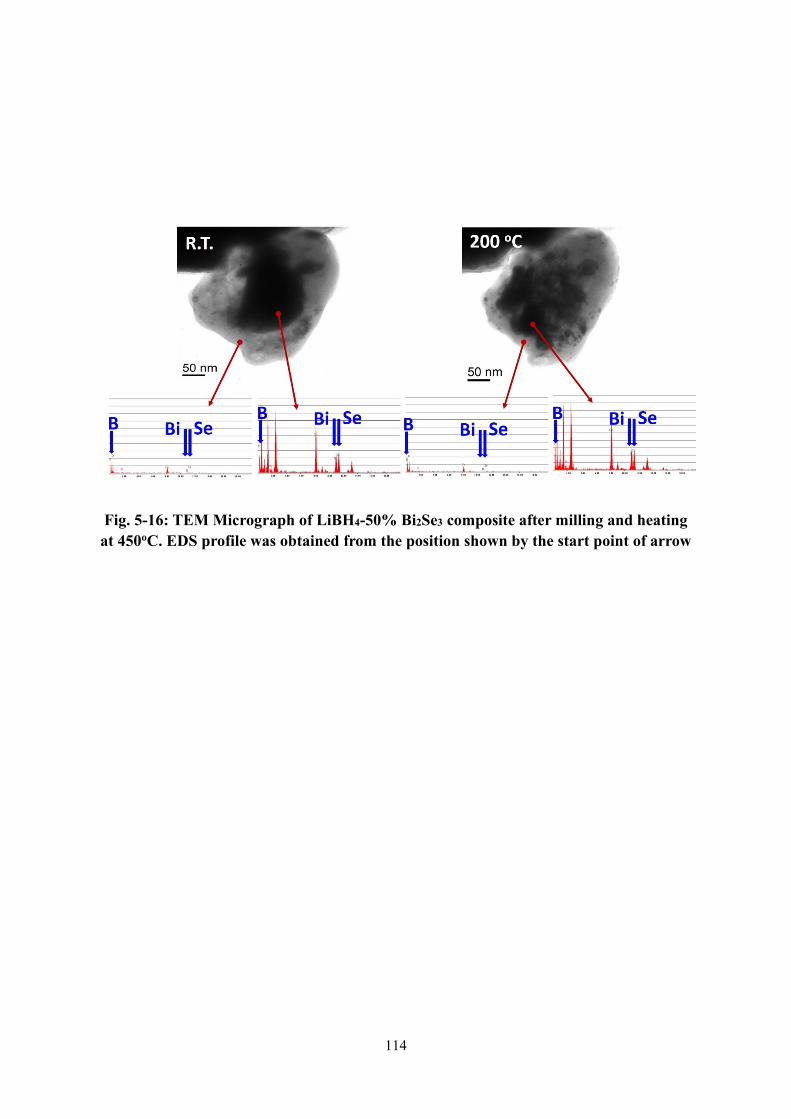
114
Fig. 5-16: TEM Micrograph of LiBH4-50% Bi2Se3 composite after milling and heating
at 450oC. EDS profile was obtained from the position shown by the start point of arrow
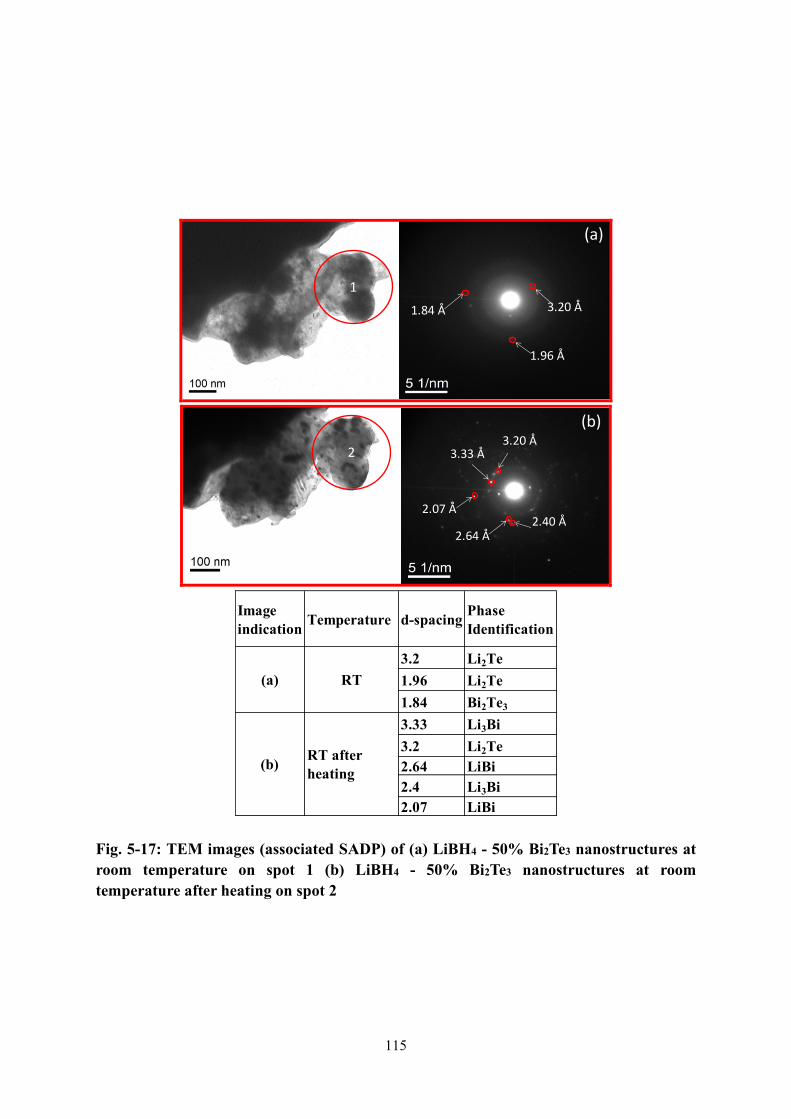
115
1
3.20 Å1.84 Å
1.96 Å
(a)
2
2.40 Å
3.20 Å
2.64 Å
2.07 Å
3.33 Å
(b)
Image
indicationTemperature d-spacing
Phase
Identification
3.2 Li2Te
1.96 Li2Te
1.84 Bi2Te3
3.33 Li3Bi
3.2 Li2Te
2.64 LiBi
2.4 Li3Bi
2.07 LiBi
(a) RT
(b)RT after
heating
Fig. 5-17: TEM images (associated SADP) of (a) LiBH4 - 50% Bi2Te3 nanostructures at
room temperature on spot 1 (b) LiBH4 - 50% Bi2Te3 nanostructures at room
temperature after heating on spot 2
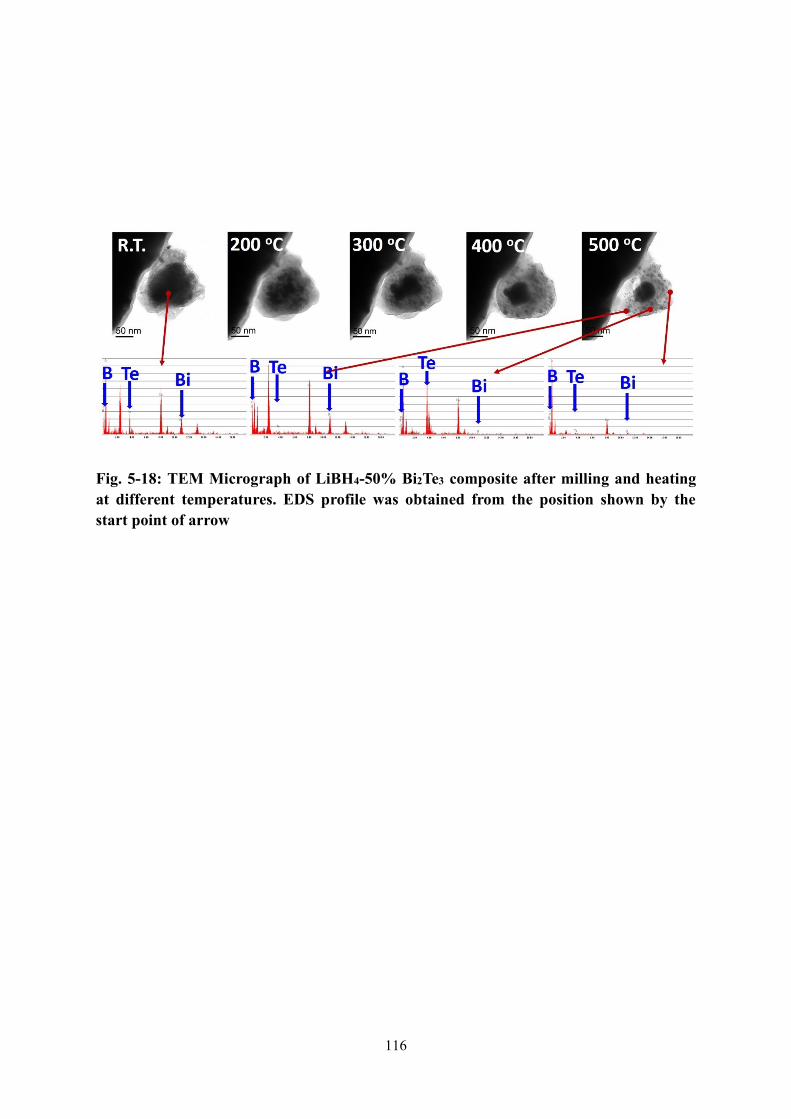
116
Fig. 5-18: TEM Micrograph of LiBH4-50% Bi2Te3 composite after milling and heating
at different temperatures. EDS profile was obtained from the position shown by the
start point of arrow
117
Chapter-6
Conclusions and Future work
In this thesis, the thermodynamic and kinetic tuning of LiBH4 and its composite with MgH2
was achieved by using additives.
The addition of KH to well-known 2LiBH4-MgH2 reduced the decomposition temperature of
1st step reaction, however, no significant effect could be observed for the 2nd major step of
decomposition. An interesting phenomenon of eutectic melting through the formation of
KBH4 as an intermediate was observed and a phase diagram was reported herein. The eutectic
composition for x(2LiBH4-MgH2) - (1-x)KH was assured to be x~ 0.45 using the
combination of differential scanning calorimetry and X-ray diffraction. The eutectic
composition was found to melt at ~79℃ (Tmin) which is the lowest melting temperature
reported for a complex borohydride-hydride mixture so far. This work suggests the new
possibilities to develop more complex hydride/borohydride systems to improve kinetic issues
associated with the hydrogen storage applications. Advancement in techniques to decrease the
decomposition temperature for on-board applications, while maintaining high hydrogen
capacity will be the future road map.
As a second part of this thesis, a thermodynamic alteration of LiBH4 was achieved by the
addition of Bi based chalcogenide materials. A systematic study for the decomposition of
LiBH4 at low temperature using Bi2X3 was performed, which is quite useful not only for the
hydrogen storage purpose but also for Li-ion battery application. The formation of Li2X and
Li3Bi was the thermodynamic driving force for this destabilization. The onset desorption
temperature of LiBH4 was thermodynamically lowered down to 75℃ by the addition of bulk
118
Bi2S3. A further reduction in the onset temperature could be achieved by the use of Bi2S3
nanoflowers due to kinetic enhancement. However, the formation of H2S during this reaction
was crucial in case of Bi2S3 addition which caused the loss of sulphur and thus the loss of
reversibility. From this point of view, the addition of Bi2Se3 nanostructure was found more
beneficial which allow the H2 evolution only (no other gaseous species e.g. B2H6) that can be
helpful to maintain the reversibility of LiBH4. The reversibility of these system will be
investigated in the future work. The establishment of reaction mechanism also enabled us to
understand the electrochemical operation of these composites. It is concluded that the high
capacity, observed in charging process in our previous work [62],[63] must be due to the
thermochemical reaction between LiBH4 and Bi2X3 at 120℃ (speculated in previous work),
which generated the cracks in electrode material and resulted in the capacity decay during
within few cycles. This finding directed us to design the composite system in such a way that
it can be operated at room temperature to avoid the thermochemical reaction between
electrode material and electrolyte.
119
References
[1] World Energy Consumption Statistics | Enerdata n.d.
https://yearbook.enerdata.net/total-energy/world-consumption-statistics.html (accessed
June 29, 2020).
[2] EIA projects nearly 50% increase in world energy usage by 2050, led by growth in
Asia - Today in Energy - U.S. Energy Information Administration (EIA) n.d.
https://www.eia.gov/todayinenergy/detail.php?id=42342 (accessed June 29, 2020).
[3] Jochem E. Reducing CO2 emissions - the West German plan. Energy Policy
1991;19:119–26. doi:10.1016/0301-4215(91)90127-A.
[4] Züttel A. Hydrogen storage methods. Naturwissenschaften 2004;91:157–72.
doi:10.1007/s00114-004-0516-x.
[5] Hydropole | The Swiss Hydrogen Association n.d. https://hydropole.ch/en/ (accessed
June 23, 2020).
[6] Züttel A, Borgschulte A, Schlapbach L, Chorkendorff I, Suda S. Properties of
Hydrogen. Hydrog as a Futur Energy Carr 2008:71–147.
doi:doi:10.1002/9783527622894.ch4.
[7] Fukai Y. The Metal-Hydrogen System Basic Bulk Properties. vol. 21. 2005.
doi:10.1007/978-3-662-02801-8_1.
[8] Colozza AJ. Hydrogen Storage for Aircraft. 2002.
[9] Züttel A. Materials for hydrogen storage. Mater Today 2003;6:24–33.
doi:https://doi.org/10.1016/S1369-7021(03)00922-2.
[10] Schlapbach L, Züttel A. Hydrogen-storage materials for mobile applications. Nature

120
2001;414:353–8. doi:10.1038/35104634.
[11] Krishna R, Titus E, Salimian M, Okhay O, Rajendran S, Rajkumar A, et al. Hydrogen
Storage for Energy Application, 2020. doi:10.5772/51238.
[12] Kurtz J, Ainscough C, Simpson L, Caton M. Hydrogen Storage Needs for Early
Motive Fuel Cell Markets 2012:85.
[13] Chen P, Zhu M. Recent progress in hydrogen storage. Mater Today 2008;11:36–43.
doi:https://doi.org/10.1016/S1369-7021(08)70251-7.
[14] Andersson J, Grönkvist S. Large-scale storage of hydrogen. Int J Hydrogen Energy
2019;44:11901–19. doi:https://doi.org/10.1016/j.ijhydene.2019.03.063.
[15] Rivard E, Trudeau M, Zaghib K. Hydrogen Storage for Mobility: A Review. Mater
2019;12. doi:10.3390/ma12121973.
[16] Stolten D, Emonts B. Handbook of Hydrogen Storage Ef fi cient Carbon Capture for
Coal Power Plants Transition to Renewable Energy Systems Hydrogen Storage
Technologies Hydrogen and Fuel Cells. 2016.
[17] Krasae-in S, Stang JH, Neksa P. Development of large-scale hydrogen liquefaction
processes from 1898 to 2009. Int J Hydrogen Energy 2010;35:4524–33.
doi:https://doi.org/10.1016/j.ijhydene.2010.02.109.
[18] Tamura H. 済 無 No Title No Title. J Chem Inf Model 2008;53:287.
doi:10.1017/CBO9781107415324.004.
[19] Gkanas EI, Khzouz M. Metal Hydride Hydrogen Compression Systems – Materials,
Applications and Numerical Analysis. Hydrog Storage Technol 2018:1–37.
doi:doi:10.1002/9781119460572.ch1.

121
[20] Griessen R, Giebels IAME, Dam B. Hydrogen as a Future Energy Carrier. Weinheim,
Germany: Wiley; 2008. doi:10.1002/9783527622894.
[21] Pukazhselvan D, Kumar V, Singh SK. High capacity hydrogen storage: Basic aspects,
new developments and milestones. Nano Energy 2012;1:566–89.
doi:https://doi.org/10.1016/j.nanoen.2012.05.004.
[22] Züttel A. Hydrogen Storage Materials (Solid) for Fuel Cell Vehicles BT -
Encyclopedia of Applied Electrochemistry. In: Kreysa G, Ota K, Savinell RF, editors.,
New York, NY: Springer New York; 2014, p. 1049–66.
doi:10.1007/978-1-4419-6996-5_199.
[23] Bérubé V, Radtke G, Dresselhaus M, Chen G. Size effects on the hydrogen storage
properties of nanostructured metal hydrides: A review. Int J Energy Res 2007.
doi:10.1002/er.1284.
[24] Song L, Wang S, Jiao C, Si X, Li Z, Liu S, et al. Thermodynamics study of hydrogen
storage materials. J Chem Thermodyn 2012;46:86–93.
doi:https://doi.org/10.1016/j.jct.2011.06.022.
[25] Jain A, Agarwal S, Ichikawa T. Catalytic Tuning of Sorption Kinetics of Lightweight
Hydrides: A Review of the Materials and Mechanism. Catal 2018;8.
doi:10.3390/catal8120651.
[26] Jain A, Miyaoka H, Ichikawa T. Destabilization of lithium hydride by the substitution
of group 14 elements: A review. Int J Hydrogen Energy 2016;41:5969–78.
doi:http://dx.doi.org/10.1016/j.ijhydene.2016.02.069.
[27] Li H-W, Orimo S, Nakamori Y, Miwa K, Ohba N, Towata S, et al. Materials designing
122
of metal borohydrides: Viewpoints from thermodynamical stabilities. J Alloys Compd
2007;446–447:315–8. doi:https://doi.org/10.1016/j.jallcom.2007.02.156.
[28] Li G, Matsuo M, Takagi S, Chaudhary A-L, Sato T, Dornheim M, et al.
Thermodynamic Properties and Reversible Hydrogenation of LiBH4–Mg2FeH6
Composite Materials. Inorganics 2017;5. doi:10.3390/inorganics5040081.
[29] Wang J, Liu T, Wu G, Li W, Liu Y, Araújo CM, et al. Potassium-modified
Mg(NH2)2/2 LiH system for hydrogen storage. Angew Chem Int Ed Engl
2009;48:5828–32. doi:10.1002/anie.200805264.
[30] Teng YL, Ichikawa T, Miyaoka H, Kojima Y. Improvement of hydrogen desorption
kinetics in the LiH-NH3 system by addition of KH. Chem Commun 2011;47:12227–9.
doi:10.1039/c1cc15523g.
[31] Durojaiye T, Goudy A. Desorption kinetics of lithium amide/magnesium hydride
systems at constant pressure thermodynamic driving forces. Int J Hydrogen Energy
2012;37:3298–304. doi:https://doi.org/10.1016/j.ijhydene.2011.11.071.
[32] Dong B-X, Wang L, Ge J, Ping C, Teng Y-L, Li Z-W. The effect of KH on enhancing
the dehydrogenation properties of the Li-N-H system and its catalytic mechanism.
Phys Chem Chem Phys 2018;20:11116–22. doi:10.1039/c8cp00470f.
[33] Walker G. Hydrogen storage technologies. Solid-State Hydrog Storage Mater Chem
2008:3–17. doi:10.1533/9781845694944.1.3.
[34] Department of Energy n.d. https://www.energy.gov/ (accessed June 21, 2020).
[35] Sakintuna B, Lamari-Darkrim F, Hirscher M. Metal hydride materials for solid
hydrogen storage: A review. Int J Hydrogen Energy 2007;32:1121–40.
123
doi:https://doi.org/10.1016/j.ijhydene.2006.11.022.
[36] Jain IP, Lal C, Jain A. Hydrogen storage in Mg: A most promising material. Int J
Hydrogen Energy 2010;35:5133–44.
doi:https://doi.org/10.1016/j.ijhydene.2009.08.088.
[37] Goto K, Hirata T, Yamamoto I, Nakao W. Suitability Evaluation of LaNi5 as
Hydrogen-Storage-Alloy Actuator by In-Situ Displacement Measurement during
Hydrogen Pressure Change. Mol 2019;24. doi:10.3390/molecules24132420.
[38] Briki C, de Rango P, Belkhiria S, Dhaou MH, Jemni A. Measurements of expansion of
LaNi5 compacted powder during hydrogen absorption/desorption cycles and their
influences on the reactor wall. Int J Hydrogen Energy 2019;44:13647–54.
doi:https://doi.org/10.1016/j.ijhydene.2019.04.010.
[39] Rusman NAA, Dahari M. A review on the current progress of metal hydrides material
for solid-state hydrogen storage applications. Int J Hydrogen Energy
2016;41:12108–26. doi:https://doi.org/10.1016/j.ijhydene.2016.05.244.
[40] Ding Z, Li S, Zhou Y, Chen Z, Yang W, Ma W, et al. LiBH4 for hydrogen storage -
New perspectives. Nano Mater Sci 2020;2:109–19.
doi:https://doi.org/10.1016/j.nanoms.2019.09.003.
[41] Puszkiel J, Gasnier A, Amica G, Gennari F. Tuning LiBH4 for Hydrogen Storage:
Destabilization, Additive, and Nanoconfinement Approaches. Mol 2020;25.
doi:10.3390/molecules25010163.
[42] Prachi P, Wagh MM, Aneesh G. A Review on Solid State Hydrogen Storage Material.
Adv Energy Power 2016. doi:10.13189/aep.2016.040202.
124
[43] Reilly JJ, Wiswall RH. Reaction of hydrogen with alloys of magnesium and nickel and
the formation of Mg2NiH4. Inorg Chem 1968;7:2254–6. doi:10.1021/ic50069a016.
[44] Chen P, Xiong Z, Luo J, Lin J, Tan KL. Interaction of hydrogen with metal nitrides
and imides. Nature 2002;420:302–4. doi:10.1038/nature01210.
[45] Ichikawa T, Hanada N, Isobe S, Leng H, Fujii H. Mechanism of Novel Reaction from
LiNH2 and LiH to Li2NH and H2 as a Promising Hydrogen Storage System. J Phys
Chem B 2004;108:7887–92. doi:10.1021/jp049968y.
[46] Barkhordarian G, Klassen T, Dornheim M, Bormann R. Unexpected kinetic effect of
MgB2 in reactive hydride composites containing complex borohydrides. J Alloys
Compd 2007;440:L18–21. doi:https://doi.org/10.1016/j.jallcom.2006.09.048.
[47] Vajo JJ, Li W, Liu P. Thermodynamic and kinetic destabilization in LiBH4/Mg2NiH4:
promise for borohydride-based hydrogen storage. Chem Commun 2010;46:6687–9.
doi:10.1039/C0CC01026J.
[48] Vajo JJ, Skeith SL, Mertens F. Reversible Storage of Hydrogen in Destabilized LiBH4.
J Phys Chem B 2005;109:3719–22. doi:10.1021/jp040769o.
[49] Bösenberg U, Doppiu S, Mosegaard L, Barkhordarian G, Eigen N, Borgschulte A, et al.
Hydrogen sorption properties of MgH2–LiBH4 composites. Acta Mater
2007;55:3951–8. doi:https://doi.org/10.1016/j.actamat.2007.03.010.
[50] Pinkerton FE, Meyer MS, Meisner GP, Balogh MP, Vajo JJ. Phase Boundaries and
Reversibility of LiBH4/MgH2 Hydrogen Storage Material. J Phys Chem C
2007;111:12881–5. doi:10.1021/jp0742867.
[51] Nakagawa T, Ichikawa T, Hanada N, Kojima Y, Fujii H. Thermal analysis on the
125
Li–Mg–B–H systems. J Alloys Compd 2007;446–447:306–9.
doi:https://doi.org/10.1016/j.jallcom.2007.02.097.
[52] Matsuo M, Nakamori Y, Orimo SI, Maekawa H, Takamura H. Lithium superionic
conduction in lithium borohydride accompanied by structural transition. Appl Phys
Lett 2007;91:224103. doi:10.1063/1.2817934.
[53] Takahashi K, Hattori K, Yamazaki T, Takada K, Matsuo M, Orimo S, et al.
All-solid-state lithium battery with LiBH4 solid electrolyte. J Power Sources
2013;226:61–4. doi:https://doi.org/10.1016/j.jpowsour.2012.10.079.
[54] Blanchard D, Nale A, Sveinbjörnsson D, Eggenhuisen TM, Verkuijlen MHW,
Suwarno, et al. Nanoconfined LiBH4 as a fast lithium ion conductor. Adv Funct Mater
2015;25:184–92. doi:10.1002/adfm.201402538.
[55] Unemoto A, Yasaku S, Nogami G, Tazawa M, Taniguchi M, Matsuo M, et al.
Development of bulk-type all-solid-state lithium-sulfur battery using LiBH4
electrolyte. Appl Phys Lett 2014;105. doi:10.1063/1.4893666.
[56] Lu F, Pang Y, Zhu M, Han F, Yang J, Fang F, et al. A High‐Performance Li–B–H
Electrolyte for All‐Solid‐State Li Batteries. Adv Funct Mater 2019;29:1809219.
doi:10.1002/adfm.201809219.
[57] Singh R, Kumari P, Rathore RK, Shinzato K, Ichikawa T, Verma AS, et al. LiBH4 as
solid electrolyte for Li-ion batteries with Bi2Te3 nanostructured anode. Int J Hydrogen
Energy 2018;43:21709–14. doi:https://doi.org/10.1016/j.ijhydene.2018.03.068.
[58] Kumari P, Pal P, Shinzato K, Awasthi K, Ichikawa T, Jain A, et al. Nanostructured
Bi2Te3 as anode material as well as a destabilizing agent for LiBH4. Int J Hydrogen
126
Energy 2019. doi:https://doi.org/10.1016/j.ijhydene.2019.06.175.
[59] Dornheim M. Thermodynamics of Metal Hydrides: Tailoring Reaction Enthalpies of
Hydrogen Storage Materials. Thermodyn. - Interact. Stud. - Solids, Liq. Gases, InTech;
2011. doi:10.5772/21662.
[60] Li J, Li B, Shao H, Li W, Lin H. Catalysis and Downsizing in Mg-Based Hydrogen
Storage Materials. Catalysts 2018;8:89. doi:10.3390/catal8020089.
[61] Zeng L, Miyaoka H, Ichikawa T, Kojima Y. Superior hydrogen exchange effect in the
MgH2-LiBH4 system. J Phys Chem C 2010. doi:10.1021/jp1042443.
[62] Kumari P, Singh R, Awasthi K, Ichikawa T, Kumar M, Jain A. Highly stable
nanostructured Bi2Se3 anode material for all solid-state lithium-ion batteries. J Alloys
Compd 2020. doi:10.1016/j.jallcom.2020.155403.
[63] Kumari P, Awasthi K, Agarwal S, Ichikawa T, Kumar M, Jain A. Flower-like Bi2S3
nanostructures as highly efficient anodes for all-solid-state lithium-ion batteries. RSC
Adv 2019. doi:10.1039/c9ra05055h.
[64] X-ray Powder Diffraction (XRD) n.d.
https://serc.carleton.edu/research_education/geochemsheets/techniques/XRD.html
(accessed June 23, 2020).
[65] B. D. CULLITY. X-Ray Diffraction Addison-Wesley Metallurgy Series. J Chem Inf
Model 1956;53:1689–99. doi:10.1017/CBO9781107415324.004.
[66] Wagner M, Wagner M. Thermal Analysis in Practice. Therm. Anal. Pract., 2017.
doi:10.3139/9781569906446.fm.
[67] Dorset DL. Transmission electron microscopy and diffractometry of materials. By B.
127
Fultz and J. M. Howe. pp. xix + 748pp. Heidelberg: Springer-Verlag, 2001. Price DM
179.00, US $89.95. ISBN 3-540-67841-7. . J Appl Crystallogr 2002.
doi:10.1107/s0021889801020532.
[68] Yao H, Isobe S, Wang Y, Hashimoto N, Ohnuki S. Plastic bag method for active
sample loading into transmission electron microscope. J Electron Microsc (Tokyo)
2011. doi:10.1093/jmicro/dfr072.
[69] How to Mix Backscattered and Secondary Electron Images n.d.
https://www.azom.com/article.aspx?ArticleID=16390 (accessed June 24, 2020).
[70] Electron Interactions n.d.
https://serc.carleton.edu/research_education/geochemsheets/electroninteractions.html
(accessed June 24, 2020).
[71] Paskevicius M, Ley MB, Sheppard DA, Jensen TR, Buckley CE. Eutectic melting in
metal borohydrides. Phys Chem Chem Phys 2013;15:19774–89.
doi:10.1039/c3cp53920b.
[72] Roedern E, Hansen BRS, Ley MB, Jensen TR. Effect of Eutectic Melting, Reactive
Hydride Composites, and Nanoconfinement on Decomposition and Reversibility of
LiBH4-KBH4. J Phys Chem C 2015. doi:10.1021/acs.jpcc.5b09228.
[73] Zavorotynska O, Deledda S, Li G, Matsuo M, Orimo SI, Hauback BC. Isotopic
Exchange in Porous and Dense Magnesium Borohydride. Angew Chemie - Int Ed
2015. doi:10.1002/anie.201502699.
[74] Ley MB, Roedern E, Jensen TR. Eutectic melting of LiBH4-KBH4. Phys Chem Chem
Phys 2014. doi:10.1039/c4cp03207a.

128
[75] Lee JY, Ravnsbæk D, Lee YS, Kim Y, Cerenius Y, Shim JH, et al. Decomposition
reactions and reversibility of the LiBH4-Ca (BH4)2 composite. J Phys Chem C
2009;113:15080–6. doi:10.1021/jp904400b.
[76] Bardají EG, Zhao-Karger Z, Boucharat N, Nale A, Van Setten MJ, Lohstroh W, et al.
LiBH4?Mg(BH4)2: A physical mixture of metal borohydrides as hydrogen storage
material. J Phys Chem C 2011;115:6095–101. doi:10.1021/jp110518s.
[77] Liu R, Book D. Mn-based borohydride synthesized by ball-milling KBH4 and MnCl2
for hydrogen storage. Int J Hydrogen Energy 2014;39:2194–200.
doi:10.1016/j.ijhydene.2013.11.125.
[78] Journal of Research of the National Bureau of Standards - United States. National
Bureau of Standards - Google Books n.d.
https://books.google.co.jp/books?hl=en&lr=&id=dRvWAAAAMAAJ&oi=fnd&pg=P
A117&ots=B2abENN3Sv&sig=rtzhwSGCEiOObEuci6YiEMUnKFY&redir_esc=y#v
=onepage&q&f=false (accessed June 24, 2020).
[79] Zaluska A, Zaluski L, Ström-Olsen JO. Nanocrystalline magnesium for hydrogen
storage. J Alloys Compd 1999. doi:10.1016/S0925-8388(99)00073-0.
[80] Callini E, Aguey-Zinsou KF, Ahuja R, Ares JR, Bals S, Biliškov N, et al.
Nanostructured materials for solid-state hydrogen storage: A review of the
achievement of COST Action MP1103. Int J Hydrogen Energy 2016.
doi:10.1016/j.ijhydene.2016.04.025.
[81] Niemann MU, Srinivasan SS, Phani AR, Kumar A, Goswami DY, Stefanakos EK.
Nanomaterials for hydrogen storage applications: A review. J Nanomater 2008.
129
doi:10.1155/2008/950967.
[82] Schneemann A, White JL, Kang S, Jeong S, Wan LF, Cho ES, et al. Nanostructured
Metal Hydrides for Hydrogen Storage. Chem Rev 2018.
doi:10.1021/acs.chemrev.8b00313.
[83] Ni J, Bi X, Jiang Y, Li L, Lu J. Bismuth chalcogenide compounds Bi2×3 (X=O, S, Se):
Applications in electrochemical energy storage. Nano Energy 2017.
doi:10.1016/j.nanoen.2017.02.041.
[84] Arabzadeh A, Salimi A. Facile Synthesis of Ultra-wide Two Dimensional Bi 2 S 3
Nanosheets: Characterizations, Properties and Applications in Hydrogen Peroxide
Sensing and Hydrogen Storage. Electroanalysis 2017;29:2027–35.
doi:10.1002/elan.201600808.
[85] Mamur H, Bhuiyan MRA, Korkmaz F, Nil M. A review on bismuth telluride (Bi2Te3)
nanostructure for thermoelectric applications. Renew Sustain Energy Rev
2018;82:4159–69. doi:10.1016/j.rser.2017.10.112.
[86] Yan Y, Remhof A, Hwang SJ, Li HW, Mauron P, Orimo SI, et al. Pressure and
temperature dependence of the decomposition pathway of LiBH 4. Phys Chem Chem
Phys 2012;14:6514–9. doi:10.1039/c2cp40131b.
[87] AN S. The Reaction Mechanisms of H2S Decomposition into Hydrogen and Sulfur:
Application of Classical and Biological Thermodynamics. J Thermodyn Catal 2017.
doi:10.4172/2157-7544.1000186.
[88] Startsev AN, Kruglyakova O V., Chesalov YA, Ruzankin SP, Kravtsov EA, Larina T
V., et al. Low temperature catalytic decomposition of hydrogen sulfide into hydrogen

130
and diatomic gaseous sulfur. Top. Catal., 2013. doi:10.1007/s11244-013-0061-y.
[89] Startsev AN. Diatomic sulfur: a mysterious molecule. J Sulfur Chem 2019.
doi:10.1080/17415993.2019.1588273.
[90] Maekawa H, Matsuo M, Takamura H, Ando M, Noda Y, Karahashi T, et al.
Halide-stabilized LiBH4, a room-temperature lithium fast-ion conductor. J Am Chem
Soc 2009;131:894–5. doi:10.1021/ja807392k.