thesis corrected approved.pdf
TRANSCRIPT

Production of inorganic nanohybrids by the
templating of carbon and peptide nanostructures
A thesis submitted to The University of Manchester for the degree of
Doctor of Philosophy
In the Faculty of Engineering and Physical Sciences
2013
Yanning Li
School of Materials

2
Table of Contents
List of tables…………………………………………………………………..…..8
List of figures………………………………………………………………..……9
List of abbreviations…………………………………………………………..…26
List of symbols………………………………………………………………..…29
Abstract…………………………………………………………………….……30
Declaration………………………………………………………………………31
Copyright………………………………………………………………………..32
Acknowledgements…………………………………………………………..…33
Chapter 1 Introduction…………………………………………………………..34
1.1 Overview ……………………………………………………………………34
1.2 Aims…………………………………………………………………………35
1.3 References……………………………………………………………...……37
Chapter 2 Literature Review……………………………………………….……40
2.1 Sol-gel chemistry……………………………………………………………40
2.2 CNT-Inorganic nanohybrids…………………………………………………43
2.2.1 Introduction to carbon nanotubes………………………………...……43
2.2.1.1 Structures………………………………………………….………43
2.2.1.2 Properties……………………………………………….…………44
2.2.1.3 Synthesis………………………………………………….………46
2.2.1.4 Applications………………………………………………………46
2.2.2 Functionalization of CNTs……………………………………….……47
2.2.2.1 Covalent functionalization………………………………..………48
2.2.2.2 Non-covalent functionalization…………………………...………51
2.2.3 CNT-inorganic nanohybrids ……………………………………….…57
2.2.3.1 Synthesis……………………………………………………….…58
2.2.3.2 CNT-SiO2 hybrids…………………………………………..……59
2.2.3.3 CNT-TiO2 hybrids………………………………………..………63
2.2.3.4 Inorganic nanotubes………………………………………………69
2.3 Peptide self-assembly and mineralization…………………………...………72

3
2.3.1 Introduction……………………………………………………………72
2.3.2 Strategy for peptide self-assembly……………………………….……72
2.3.2.1 β-sheets and α helices………………………………………….…72
2.3.2.2 Peptide amphiphiles………………………………………………75
2.3.2.2.1 All-amino acid peptide amphiphiles……………………...……75
2.3.2.2.2 Lipidated peptides……………………………………………78
2.3.2.3 Aromatic short peptide derivatives………………………..………79
2.3.3 Controlled self-assembly of peptides…………………………….……81
2.3.3.1 PH/ionic strength triggered ………………………………………81
2.3.3.2 Enzyme triggered …………………………………………...……82
2.3.4 Mineralisation…………………………………………………….……84
2.3.4.1 Biomineralization…………………………………………………84
2.3.4.2 Biomimetic mineralization………………………………..………88
2.4 Graphene and graphene based nanocomposites……………………..………91
2.4.1 Introduction to graphene………………………………………………91
2.4.1.1 Structure and properties of graphene……………………..………91
2.4.1.2 Production of graphene…………………………………...………94
2.4.1.2.1 Micromechanical cleavage…………………………...………95
2.4.1.2.2 Liquid phase exfoliation………………………………..……95
2.4.2 Graphene based nanocomposites and nanohybrids ………………….101
2.5 References…………………………………………………………….……105
Chapter 3 Experimental Methods……………………………………….…..…127
3.1 Materials……………………………………………………………………127
3.2 Experimental procedure……………………………………………………127
3.2.1 Synthesis of alignedCNT arrays by injection CVD method…………127
3.2.2 Adsorption Study of the surfactants on CNTs………………….……128
3.2.2.1 Adsorption of the surfactants on aligned CNT arrays………..…128
3.2.2.2 Adsorption of the surfactants on randomly aligned CNT
networks…………………………………………………………………134
3.2.2.3 Desorption of the surfactants from CNT arrays in H2O…………135
3.2.2.4 Freundlich adsorption isotherm …………………………....……135

4
3.2.2.5 Competitive binding from the Fmoc-AAs library on graphite…..136
3.2.2.6 Switchable surface chemistry……………………………..……..137
3.2.3 Synthesis of CNT-inorganic nanohybrids……………………………138
3.2.3.1 Synthesis of silica coated Fmoc-AA functionalized CNTs…..…138
3.2.3.2 Synthesis of TiO2 coated Fmoc-AA functionalized CNTs……...140
3.2.3.3 Combined sites…………………………………………….……142
3.2.4 Graphene and graphene based nanocomposites and nanohybrids..…143
3.2.4.1 GO-Inorganic nanohybrids ………………………………….…143
3.2.4.1.1 Preparation of aqueous dispersion of GO……………….…143
3.2.4.1.2 Preparation of GO-TiO2 nanohybrids………………………144
3.2.4.1.3 Preparation of GO-SiO2 nanohybrids………………………144
3.2.4.2 bwGO-Inorganic nanohybrids …………………………..………145
3.2.4.2.1 Preparation of bwGO dispersion……………………………145
3.2.4.2.2 Synthesis of bwGO-TiO2 nanohybrids…………………...…145
3.2.4.3 Exfoliated graphene (EG)-Inorganic nanohybrids………………146
3.2.4.3.1 Preparation of graphene dispersion ……………………...…146
3.2.4.3.2 Preparation of EG-TiO2 nanocomposites and nanohybrids…147
3.2.5 Mineralization of peptide self-assembled hydrogels…………………148
3.2.5.1 Fmoc-Y hydrogel preparation………………………………...…148
3.2.5.2 Fmoc-FY hydrogel preparation …………………………………148
3.2.5.3 Characterization …………………………………………………148
3.2.5.4 Silicification of Fmoc-Y gel ………………………………….…149
3.3 Analytical techniques………………………………………………………150
3.3.1 Scanning Electron Microscopy (SEM)………………………………150
3.3.2 Transmission Electron Microscopy (TEM)………….………………150
3.3.3 Energy Dispersive X-ray Spectroscopy (EDX)………………………153
3.3.4 Reversed-phase high-performance liquid chromatography (RP-HPLC)...153
3.3.5 Contact angle measurement………………………………………..…154
3.3.6 Raman spectroscopy …………………………………………………156
3.3.6.1 Background…………………………………………………...…156
3.3.6.2 Raman characterization of the exfoliated samples………………158

5
3.3.7 Atomic Force Microscopy (AFM)……………………………………159
3.4 References …………………………………………………………………161
Chapter 4 Dynamic Interaction of Fmoc-AAs with CNTs…………………..…163
4.1 Introduction ……………………………………………………………..…163
4.2 Synthesis of aligned MWNT arrays by injection CVD method ………...…163
4.3. Interaction of surface modifiers with CNTs……………………………….166
4.3.1 Adsorption behavior of modifiers on CNT aligned CNT arrays….…166
4.3.2 Adsorption behavior of modifiers on randomly oriented CNT
Networks…………………………………………………………………170
4.3.3 Desorption behavior of the modifiers in excess of water……………171
4.3.4 Freundlich isotherm model …………………………………………172
4.3.5 Competitive binding from the Fmoc-AAs library on graphite………173
4.3.6 Switchable surface chemistry…………………………………..……176
4.4 Conclusion…………………………………………………………………178
4.5 References…………………………………………………………………180
Chapter 5 Synthesis of CNT-inorganic nanohybrids and the corresponding
inorganic NTs using Fmoc-AAs as surface modifier………………………….181
5.1 Introduction…………………………………………………………..……181
5.2. Synthesis of CNT-silica nanohybrids using Fmoc-AAs as surface
modifier………………………………………………………………….182
5.2.1 Synthesis and morphology characterization……………………….…182
5.2.2 Discussion on the role of Fmoc-AA functionalization in controlling the
morphology of the hybrids……………………………………..……189
5.2.3 Growing mechanism of silica coating on Fmoc-AA functionalized
CNTs……………………………………………………………………..…189
5.2.4 Kinetics for silica growth………………………………………….....191
5.2.5 Annealing………………………………………………………….…193
5.3 Synthesis of CNT-TiO2 nanohybrids using Fmoc-AAs as surface
modifier………………………………………………………………….…194
5.3.1 Synthesis and morphology characterization ……………………...…194
5.3.2 Mechanism for the formation of TiO2 coating on the functionalized

6
CNTs………………………………………………………………………...…196
5.3.3Effect of CNT to TBOT ratio on the hybrid morphology……………198
5.3.4 Effect of modifier to CNT ratio on the hybrid morphology…………201
5.3.5Kinetics for TiO2 growth …………………………………………..…202
5.3.6 Synthesis of TiO2 NTs……………………………………………..…203
5.3.7 Phase transformation…………………………………………………211
5.3.8 Aligned arrays of TiO2 NTs …………………………………………214
5.4 Combined sites for catalyzing SiO2 and TiO2 deposition…………….……218
5.4.1 Synthesis of the biomimetic catalyst…………………………………219
5.4.2 Synthesis of SiO2 catalyzed by the combined sites……………….…220
5.4.3 Synthesis of TiO2 catalyzed by the combined sites……………….…221
5.5. Conclusion…………………………………………………………………223
5.6 References…………………………………………………………….……225
Chapter 6 Mineralization of peptide self-assembled hydrogels…………….…227
6.1 Introduction……………………………………………………………..…227
6.2 Enzymatic self-assembly of Fmoc-Y and Fmoc-FY hydrogels……………227
6.2.1 Fmoc-Y hydrogel…………………………………………………….227
6.2.2 Fmoc-FY hydrogel………………………………………………...…229
6.3 Silicification of hydrogel nanostructures…………………………………..231
6.3.1 Silicification of Fmoc-Y gel…………………………………………231
6.3.1.1 Silicification via vortexing TEOS in the diluted hydrogels
(Method 1)………………………………………………………….……231
6.3.1.2 Silicification via depositing TEOS/H2O mixture on hydrogels
(Method 2)………………………………………………...…….…….…234
6.4 Conclusion………………………………………………………………….238
6.5 References …………………………………………………………………239
Chapter 7 Graphene-Inorganic hybrids……………………………………...…240
7.1 GO-Inorganic nanohybrids…………………………………………………240
7.1.1 Characterization of GO dispersion…………………………….……240
7.1.2 Preparation of GO-TiO2 nanohybrids ………………………………242
7.1.3 Preparation of GO-SiO2 nanohybrids…………………………….…247

7
7.2 bwGO-Inorganic nanohybrids………………………………………...……251
7.2.1 bwGO dispersion……………………………………………………251
7.2.2 bwGO-TiO2 nanohybrids……………………………………...……253
7.2.2.1 Reaction in aqueous solution……………………………….……253
7.2.2.2 Reaction in EtOH…………………………………………..……255
7.3 Exfoliated graphene-Inorganic nanohybrids…………………………….…260
7.3.1 Effect of sonication time and centrifuge speed on the concentration of
the graphene dispersion ……………………………………………260
7.3.2 Evidence for exfoliation to graphene ………………………...……262
7.3.2.1 Raman characterization of the exfoliated samples…………..…262
7.3.2.2 TEM characterization of the exfoliated samples ………………273
7.3.2.3 AFM characterization of the exfoliated samples…………….…278
7.3.3 Preparation of exfoliated graphene (EG)-TiO2 nanohybrids………284
7.3.3.1 Preparation of EG-TiO2 hybrids in aqueous solution…………..284
7.3.3.2 Preparation of EG-TiO2 nanohybrids in EtOH…………………287
7.4 Conclusions………………………………………………………………...288
7.5 References……………………………………………………………….…290
Chapter 8 General conclusions and future work ………………………………293
8.1 General conclusions …………………………………………………….…293
8.2 Recommendation for future work …………………………………………297
8.3 References…………………………………………………………….....…297
Total Word Count: 65700

8
List of tables
Table 3.1 Calculated molar absorptivity ε for all the modifiers studied………134
Table 3.2 Conditions used for the preparation of graphene dispersions……….147
Table 4.1 Initial adsorption rate of the Fmoc-AAs on CNT arrays……………170
Table 4.2 Calculated adsorption capacity (k) and intensity (n) for Fmoc-AAs
adsorbed on CNT arrays. Note that the units for k depend on the value of n. The
quality of fit, R2, was also given for each Fmoc-AA…………………………..173
Table 5.1 Measured SiO2 coating thickness based on TEM images…………...187
Table 5.2 Correlation of the adsorption equilibrium of the Fmoc-AAs on CNT
mats with the morphology of the hybrids ……………………………………..189
Table 5.3 Measured thickness of the TiO2 coating based on the TEM
observation……………………………………………………………………..201
Table 5.4 Measured inner diameter of the synthesized TiO2 NTs……………...205
Table 5.5 Measured wall thickness of the synthesized TiO2 NTs……………...205
Table 5.6 Measured inner diameter and wall thickness of the resultant TiO2
NTs …………………………………………………………………….………218
Table 7.1 Measured concentrations of graphene dispersions produced with
various sonication time and centrifuge speed …………………………………262

9
List of figures
Figure 2.1 Schematic representation of sol-gel process of synthesis of
nanomaterials 7…………………………………………………………………..41
Figure 2.2 The structures of (a) SWNTs and (b) MWNTs 15……………………44
Figure 2.3 Schematic representation of a 2D graphene sheet with the lattice
vectors a1 and a2 and the roll-up vector Ch=na1+ma2. 18 …….………………….45
Figure 2.4 1,3-dipolar cycloaddition of an aminoethylene glycol linker to the
external surface of CNTs and the derivatization with N-protected glycine was
then obtained via amidation reaction. 85................................................................49
Figure 2.5 Fabrication of a glucose biosensor based on CNT nanoelectrode
ensembles 89……………………………………………………………………..50
Figure 2.6 Amine groups on a protein react with the anchored succinimidyl ester
to form amide bonds for protein immobilization.62…………………………….52
Figure 2.7(a) TEM micrographs of MWNTs dispersed with Fmoc-W (trp).
Arrows indicate the edge of the lattice structure upon which Fmoc-W aggregates
are apparent; (b) Optimized structures of (i) Fmoc-G (gly) and (ii) Fmoc-W
bound to [6,6] SWNTs with close-up images that highlight the orientation and
arrangement of Fmoc and the aromatic W ring 47……………………………….53
Figure 2.8 (i) SEM images of nano-1/SWNT fibres formed from a 100 μM
peptide/nanotube dispersion upon addition of no salt (A), 40 mM NaCl (B), and
120 mM NaCl (C). (ii) (A) SEM image of fibres formed from the addition of
0.0015% (by volume) DMF to a nano-1/SWNT dispersion. (B) Low-resolution

10
TEM image of the same fibres observed in i(A). The small dark spheres are Fe
catalyst particles from the HiPco SWNT synthesis. (C) High-resolution TEM
image of the same fibres showing alignment of nanotubes. The large dark areas
are Fe particles 49. ………………………………………………………………54
Figure 2.9 Proposed mechanism of nanotube isolation from bundle 120…..……56
Figure 2.10 Schematic representations of the mechanisms by which surfactants
help disperse SWNTs. 101…………………………………………………..……57
Figure 2.11. Scheme for the preparation of CNT–silica nanohybrids.196……..…62
Figure 2.12 Scheme of the reaction between MWCNT-OH and AEAPS for the
following synthesis of silica coated MWCNTs. 197……………………..……….63
Figure 2.13 Mechanism of photocatalysis on the surface of TiO2 in presence of
UV radiation. 216…………………………………………………………………64
Figure 2.14 Schematic representation of a dye-sensitized solar cell based on
particulate TiO2. 217 ……………………………………………………….……..65
Figure 2.15 Schematic representation of the electron path through a (a) percolated
and (b) oriented nanostructure. 220 …………………………….………………..66
Figure 2.16 Electron transport across nanostructured semiconductor films: (A) in
the absence and (B) in the presence of CNTs support. 222……………..………..67
Figure 2.17 Left: Scheme of the beneficial role of benzyl alcohol in the in situ
coating of pristine CNTs with TiO2. One possible conformation of two BA molecules
on the CNT surface is shown in Scheme. Right: SEM images of TiO2 on CNTs after
conversion from anatase to rutile: A) no BA and B) with BA.172…………………..68
11
Figure 2.18 (a) Primary structures of the K2 and (QL)6 series of peptides showing
the comparative domain size. (b) Proposed model of nanofibre self-assembly
indicating hydrophobic packing region, axis of hydrogen bonding, and repulsive
positive charges. 271…………………………………………………………..…74
Figure 2.19 Computer modelling of the designed self-assembling fibre 274….…75
Figure 2.20 Potential pathway of V6D peptide nanotube formation.279…………77
Figure 2.21 (A) chemical structure of a PA which includes three distinct regions:
a hydrophobic alkyl tail, a glycine containing region, and a charged head group.
(B) Three-dimensional representation of the regions within the PA nanofibre.
Region (a) is the hydrophobic core composed of aliphatic tails. Region (b) is the
critical β-sheet hydrogen bonding portion of the peptide. Region (c) is the
peripheral peptide region which is not constrained to a particular hydrogen
bonding motif and forms the interface with the environment. 282………………79
Figure 2.22 Some of the possible modes of π-π interactions that contribute to the
emissions in the gel phase. 289………………………………………………..…80
Figure 2.23 (A) A model structure was created of Fmoc-FF peptides arranged into an
anti-parallel β-sheet pattern (i) which then come together through π–π interactions
between the Fmoc groups (in orange) (ii) like a zipper to create a cylindrical structure
(iii & iv) (B) TEM image of the Fmoc-FF hydrogels composed of flat ribbons made
up of side-by-side packing of the fibrils. 292…………………………………….....81
Figure 2.24 (A) Suspension of Fmoc-Leu2-OMe and inversion of glass vial
demonstrates self-supporting gel formation of Fmoc-Leu2 after ester hydrolysis
using subtilisin (Entry 1). (B) Proposed mechanism of Fmoc-peptide ester
hydrolysis that self-assembles to form higher-order aggregates through π–π
interlocked β-sheets. 305…………………………………………………………83

12
Figure 2.25 Solutions of Fmoc-Thr-OH and Leu-OMe. The inversion of the glass
vial demonstrates self-supporting gel formation of Fmoc-Thr-Leu-OMe via
reversed hydrolysis by thermolysin (entry 6). 305……………………………….83
Figure 2.26 (i) Chemical structure of Nap-FFGEY. (ii) Reversible modification of
the peptide gelator by a phosphatase/kinase reaction. (iii) Optical images of (A)
gel formed initially (B) the solution obtained after adding a kinase to A (C) gel
restored after adding a phosphatase to B. 306…………………………………….84
Figure 2.27 Proposed mechanism of silicon ethoxide condensation catalyzed by
silicatein α. 316…………………………………………………………………...87
Figure 2.28 Proposed condensation reaction between silicic acid and serine on the
protein template of the silicalemma. Water by-product may be eliminated or
structurally incorporated into the forming frustule through hydrogen bonding with
the oxygens of silica. 318………………………………………………………..88
Figure 2.29 Schematic of the interaction between two GNPs (B,C) capped with
imidazole and hydroxyl functionalities (A). (D) TEM image of silica product with
entrapped GNPs. Selected area electron diffraction (inset) indicating amorphous
nature of silica. 337……………………………………………………………….91
Figure 2.30 Mother of all graphitic forms. Graphene is a 2D building material for
carbon materials of other dimensionalities.338…………………….…….………92
Figure 2.31 Preparation of graphene by chemical reduction of GO synthesized by
Hummers’ method. …………………………………………………..…………97
Figure 2.32 Schematic model of a GO sheet, with -COOH hanging on the edge
and -O- and –OH decorate the basal plane. 388………………………………….98

13
Figure 2.33 Schematic representation of as-produced GO: large oxidatively
functionalized graphene-like sheets with surface-bound debris. Note that the
graphene-like sheets extend further than depicted. 394……………..…………….98
Figure 2.34 TiO2-graphene composite and its response under UV-excitation.427…104
Figure 3.1 Schematic diagram showing the set-up for the CVD synthesis of
aligned CNT arrays………………………………………………………….…128
Figure 3.2 (a) Molecular structures of the modifiers studied. (b) Scheme
illustrating the UV-Vis measurement of the adsorption of the surfactant on (c)
aligned CNT arrays (side-view) and (d) randomly aligned CNT networks……130
Figure 3.3 Calibration curves of all the modifiers studied.……………………131
Figure 3.4 Schematic illustration of the competitive binding from the library
solution of Fmoc-AAs on graphite……………………………….…………….137
Figure 3.5 Molecular structure of THEOS……………………..………………145
Figure 3.6 Schematic diagram of a TEM. 11 ………………………..…………151
Figure 3.7 Ray path in a TEM operating in (a) image mode (b) diffraction mode.
12………………………………………………………………………………..152
Figure 3.8 Schematic representation of reversed-phase HPLC. The most
hydrophilic components (orange) elute from the column first, followed by the less
hydrophilic components (green), and finally the most hydrophobic components
(blue). 13……………………………………………………………….………..154

14
Figure 3.9 Schematic of a liquid drop on a solid surface, where the
solid–vapor interfacial energy is denoted by γsv, the solid–liquid interfacial
energy is denoted by γsl, and the liquid–vapor interfacial energy is denoted by
γlv. 14 ………………………………………………………………….………..155
Figure 3.10 Sessile drop method for determining the contact angle. The fitted
contour is shown in green. 15………………………………..…………………156
Figure 3.11 (a) Typical Raman spectra for bulk graphite and monolayer graphene
obtained using a 514 nm laser. (b) Comparison of the D band at 514 nm at the
edge of bulk graphite and monolayer graphene. The fit of D1 and D2 components
of the D band of bulk graphite is shown. 18……………………………………157
Figure 3.12 Measured 2D band for (a) monolayer, (b) bilayer, (c) trilayer, (d)
four-layer and (e) HOPG using a 514 nm laser. 20……………………………..158
Figure 3.13 Schematic diagram of the beam deflection system in an atomic force
microscope, using laser and photodetector to measure the beam position. 25 …160
Figure 4.1 SEM images of CNT arrays grown at 760 ºC from a 5wt% ferrocene in
toluene solution on SiO2 substrate for 1h. (a) Cross-sectional image of the aligned
CNT arrays. (b) Close-up view of the CNTs from the arrays. (c) TEM image of
the pristine CNTs with dark particles presented both in the hollow cavity and the
walls of CNTs (indicated by arrows). Scale bar, 0.2 μm. (d) HRTEM image
showing the multilayered structure of a synthesized CNT with the lattice fringes
clearly visible. Scale bar, 5 nm. (e) The corresponding SAED pattern was indexed
to the (002), (100) and (004) planes of MWNTs……..…………..…………….165
Figure 4.2 Adsorption profiles of (a) Fmoc-Trp (c) Fmoc-Phe (e) Fmoc-Tyr (g)
Fmoc-His (i) Fmoc-Gly and (l) BA on aligned CNT arrays. (b,d,f,h,j)
Determination of the initial adsorption rate of the corresponding modifiers on the
15
arrays. (k) Histogram showing the equilibrium loadings of the Fmoc-AAs on the
arrays.…………………………………………...……………………...………168
Figure 4.3 Adsorption profile of Fmoc-Trp on randomly aligned CNT
networks………………………………………………………………………..170
Figure 4.4 Desorption profiles of (a) Fmoc-Trp and (b) Fmoc-Phe from CNT
arrays in water…………………………………………………………………171
Figure 4.5 Plot of ln Q vs. ln C for the adsorption of Fmoc-Trp (red circles) and
Fmoc-Gly (blue triangles) on the arrays……………………………………….173
Figure 4.6 HPLC chromatogram of 0.4 mM of (a) Fmoc-Phe (b) Fmoc-Trp (c)
Fmoc-Tyr (d) Fmoc-Gly and (e) Fmoc-His. (f) The mixture of the 5 Fmoc-AAs
with the same volume ratio……………………………………………………175
Figure 4.7 (a) HPLC traces of the mixture consisting of the five Fmoc-AAs at 0 h
(upper) and after 173 h of competitive binding (lower). (b) Comparison of the
equilibrium loadings of the five Fmoc-AAs on graphite in individual adsorption
and competitive binding experiments………………………………..…………175
Figure 4.8 Displacement of Fmoc-Gly by Fmoc-Trp on HOPG surface………178
Figure 5.1 SEM images of (a) the product obtained from the control experiment
in which pristine CNTs were used as templates. (b) Silica coated Fmoc-Trp and (c)
Fmoc-His functionalized CNTs. (d) A mixture of partially coated and uncoated
CNTs in the presence of Fmoc-Tyr after reaction for 21 days. (e) EDX spectrum
of the product shown in (c). Note that the aluminum and some of the oxygen were
from the sample stub………………………………....………………………...183
Figure 5.2 TEM images of (a) pristine CNTs co-existed with isolated SiO2

16
particles. Note. The image was over-focused as it was taken during early stage of
the PhD. Silica coated Fmoc-Trp functionalized CNTs after reaction for (b) 3
days and (c) 21 days. Silica coated Fmoc-His functionalized CNTs after reaction
for (d) 3 days and (e) 21 days. Partially coated Fmoc-Tyr functionalized CNTs
after reaction for (f) 3 days and (g) 21 days. Scale bar, (a) 100nm, (b) 20nm,
(c)-(g) 50nm……….……..……………………………………………….……186
Figure 5.3 (a) Line profile taken perpendicular to the tube axis direction. Inset:
Dark field STEM image of the hybrid NT. The direction of the scan was marked
by the arrow. The analysis was conducted with the help of Xiaofeng Zhao. (b)
Cross sectional view of a SiO2 coated CNT. The interaction of electron beam
with the edge and the centre of the hybrid tube was indicated by the red and
yellow line respectively. Blue colour: silica coating…………….…………..…188
Figure 5.4 Proposed catalytic mechanisms for silica templating………………190
Figure 5.5 SEM images of silica coated Fmoc-His functionalized CNTs obtained
after a growth time of (a) 3 days (b) 7 days and (c) 21 days. (d) Plot of the
diameter of the hybrid NT against the growth time. The average value was
calculated based on 50 separate measurements..………………..…………..…192
Figure 5.6 TEM images of silica coated Fmoc-Trp functionalized CNTs (a) before
and (b) after annealing at 200°C, and silica coated Fmoc-His functionalized CNTs
(c) before and (d) after annealing under the same
condition……………………………………………….………………………193
Figure 5.7 SEM images of (a) the product obtained using pristine CNTs as
templates. TiO2 coated CNTs in the presence of (b) Fmoc-Trp (c) Fmoc-His (d)
Fmoc-Tyr and (e) BA. (f-h) EDX spectra measured for the hybrids shown in (b-d).
Note the Al signal was originated from SEM stub, and Pt signal was originated
from the conductive coating on the SEM sample to reduce charging effect. The

17
considerably stronger C signal in (h) was due to the application of a thin layer of
carbon on the SEM sample as the conductive coating………….……..………195
Figure 5.8 TEM images of (a) the product obtained using pristine CNTs as
templates. TiO2 coated CNTs in the presence of Fmoc-Trp with the CNT
concentration of (b) 30 wt% and (c) 12 wt%. TiO2 coated CNTs in the presence
of Fmoc-His with the CNT concentration of (d) 30 wt% and (e) 12 wt%. A
cluster of TiO2 nanoparticles were deposited on the smooth surface of the TiO2
coating in (e). TiO2 coated CNTs in the presence of Fmoc-Tyr with the CNT
concentration of (f) 30 wt% and (g) 12 wt%. TiO2 coated CNTs in the presence of
BA with the CNT concentration of (h) 30 wt% and (i) 12 wt%. The arrows
indicated the uncoated part of CNTs. Note. This was different from the cracks
resulting from the drying effect. (j) SAED pattern taken from the sample shown
in (f). (k) XRD pattern of the as-produced CNT-TiO2 nanohybrids. C: CNT. For
(c), (e), (g) and (i), scale bar = 200 nm. For (a), (b), (d), (f) and (h), scale bar =
100 nm.….……………………………………………...………………………199
Figure 5.9 SEM images of the structures produced with the addition of (a)
undiluted and (b) diluted Fmoc-His solutions (by a factor of 10)…………….202
Figure 5.10 SEM images of TiO2 coating growing on Fmoc-Trp functionalized
CNTs at different reaction times of (a) 10 min (b) 1 h and (c) 6.5 h. (d) Plot of the
diameter of the hybrid NT against the growth time. The average value was
calculated based on 50 separate measurements……..……….…………………203
Figure 5.11 SEM images of TiO2 nanotubes produced from (a) TiO2 coated
Fmoc-His functionalized CNTs (30 wt%) and (b) TiO2 coated Fmoc-Tyr
functionalized CNTs (12 wt%). (c) EDX spectrum of the hybrid after calcination
at 550 ºC. Note. Pt signal was originated from the conductive coating on the SEM
sample. Scale bar, (a) 500nm, (b) 1μm…...……………………………………204

18
Figure 5.12 TEM images of the calcined hybrids. (a) In the presence of Fmoc-Trp
and 30wt% of CNTs. (b) In the presence of Fmoc-Trp and 12wt% of CNTs. (c) In
the presence of Fmoc-His and 30wt% of CNTs. (d) In the presence of Fmoc-His
and 12wt% of CNTs. (e) In the presence of Fmoc-Tyr and 30wt% of CNTs. (f) In
the presence of Fmoc-Tyr and 12wt% of CNTs. (g) In the presence of BA and
30wt% of CNTs. (h) In the presence of BA and 12wt% of CNTs. (i-l) SAED
patterns taken from the samples shown in (b-d) and (f) respectively (upper half)
which confirmed the polycrystalline anatase phase of the NTs by showing
excellent agreement with those simulated from JCPDS 21-1272 (lower half). The
SAED patterns were indexed to the (101), (004), (200) and (211) planes of
anatase phase. (m) XRD pattern taken from the sample shown in (d). A: anatase.
For (a), (e) and (g), scale bar = 100 nm and for (b), (c), (d), (f) and (h), scale bar =
200 nm……...………………………………………………………………….208
Figure 5.13 HRTEM image of a synthesized TiO2 NT showing the lattice spacing
of 0.35 nm, corresponding to the (101) crystal planes of anatase. Scale bar,
10nm……………………………………………………………………………210
Figure 5.14 (a) TEM images of the hybrids after heat treatment in Ar at 900 ºC
followed by in air at 550 ºC with the ramp rate of 20 ºC/min. Scale bar, 20 nm. (b)
XRD pattern taken from the sample shown in (a). (c) TEM image of the hybrids
after heat treatment in Ar at 800 ºC followed by in air at 550 ºC with the ramp
rate of 20 ºC/min. Scale bar, 100 nm. (d) SAED pattern (upper half) taken from
the sample shown in (c). The pattern was indexed to the (101), (004), (200) and
(211) planes of anatase phase. (e) TEM image of the hybrids after heat treatment
in air at 400 ºC followed by in Ar at 800 ºC with a ramp rate of 20 ºC/min. Scale
bar, 100 nm. (f) XRD pattern taken from the sample shown in (e). A: anatase, R:
rutile, C: CNT. (g) TEM image of the hybrids after heat treatment in air at 400 ºC
followed by in Ar at 800 ºC with a ramp rate of 1 ºC/min. Scale bar, 200 nm. (h)
SAED pattern (upper half) taken from the sample shown in (g). The SAED

19
pattern was indexed to the (110), (111), (210), (211) and (220) planes of rutile
phase. ……………………………………………….………………..…….…..213
Figure 5.15 SEM images of (a) the product obtained from the control experiment
where as-produced CNT mat was used as templates. TiO2 NT arrays produced in
the presence of (b) Fmoc-Trp (c) Fmoc-His (d) Fmoc-Tyr and (e) BA……….216
Figure 5.16 TEM images of (a) the product obtained from the control experiment.
TiO2 NTs produced in the presence of (b) Fmoc-Trp (c) Fmoc-His and (d)
Fmoc-Tyr. (e) Collapsed NT structures obtained in the presence of BA. The red
arrow in (b) and (c) indicated the open ends of the TiO2 NTs. Note. CNT
templates were not completely removed after calcination as indicated by the black
arrows in (c). (f) XRD pattern taken from the sample shown in (b). Scale bar, (a-e)
200 nm………………………………………………………………………….217
Figure 5.17 SEM images showing (a) bundled fibers and (b) spherical aggregates
formed in the combined solutions. (c,d) Magnified images of the aggregates
shown in (a) and (b) respectively. (e) Fmoc-His f-CNTs and (f) Fmoc-Tyr
f-CNTs…………………………………………………………………………219
Figure 5.18 (a,b) SEM image of silica coated combined catalyst after heat
treatment. (c) EDX spectrum of the sample shown in (a)……………...………221
Figure 5.19 SEM images of (a) TiO2 nanorods coated CNT bundles (b) TiO2
nanorods coated individual CNTs (c) TiO2 nanorods coated CNT bundles after
heat treatment and (d) TiO2 particles formed on Si wafer. (e) and (f) EDX
spectrum of the sample shown in (a) and (c) respectively…………….……….222
Figure 6.1 (a) Schematic representation of the enzymatic dephosphorylation of
Fmoc-Y(p)-OH to Fmoc-Y. The corresponding optical images for Fmoc-Y(p)-OH
precursor solution before enzyme addition and the self-supporting hydrogels

20
formed were also shown. (b) Negatively stained TEM image of the diluted
Fmoc-Y hydrogel. (c,d) Negatively stained TEM image of the undiluted
hydrogel.. …………………………………………………………..…………..228
Figure 6.2 (a) AP catalyzed dephosphorylation reaction of Fmoc-FpY and a
schematic representation of the supramolecular transition from micelles to fibres2.
(b) Negative stained TEM image showing the Fmoc-FY self-assembled
nanofibrils. Scale bar, 100 nm. (c) HPLC trace of the conversion of Fmoc-FpY to
Fmoc- FY as a function of time. The gelation point is marked with an arrow. (d)
Fluorescence emission spectra of the solution of Fmoc-FpY and the hydrogel of
Fmoc-FY………………………………………………………………………230
Figure 6.3 TEM images of silica coating on Fmoc-Y self-assembled
nanostructures after reaction for (a) 1 h, (b) 2 h, (c,d) 4 h and (e) 5 h. Scale bar,
100 nm. (f) EDX spectrum of the mineralized peptide nanofibrils. (f) EDX
spectrum of the silicified fibrils…………………………………………...……232
Figure 6.4 Silicification process of Fmoc-Y hydrogel…………………………234
Figure 6.5 SEM analysis on (a) the upper aqueous phase and (c) the lower
hydrogel phase. (b) EDX spectrum of (a)……………..……………………….236
Figure 6.6 Unstained TEM images of (a) the network of silicified hydrogel
nanofibrils that were derived from the resulting clear gel. Scale bar, 100 nm. (b)
Fmoc-Y self-assembled hydrogel. Scale bar, 200 nm …………………………238
Figure 7.1 (a) SEM image of aggregated GO sheets. (b) TEM image of single
layer GO sheet with folds present at both sides (indicated by arrows). Scale bar,
100 nm. (c) Corresponding SAED pattern taken from the region marked by the
dashed box in (b). The pattern was labeled with Miller-Bravais indices. (d)
Intensity profile plot along the line between the arrows shown in (c). (e) Lower

21
magnification TEM image of GO sheets with the folds indicated by arrows. Scale
bar, 200 nm. (f) Corresponding SAED pattern taken from the region marked by
the dashed box in (e) showing three superimposed hexagonal patterns indicated
by yellow, red and blue colors………………………………………………….241
Figure 7.2 (a) TEM image of GO-TiO2 nanohybrids produced with lower TBOT
concentration for 4 h. Inset corresponds to the SAED pattern taken from the
region marked by the red dashed box. (b) A magnified image of the region shown
in the orange dashed box in (a). (c) EDX spectrum of (a). Note that Cu signal is
originated from the TEM grid. (d) TEM image of the hybrids produced with
lower TBOT concentration for 7 d. (e) TEM image of the hybrids produced with
higher TBOT concentration for 4 h. (f) Corresponding SAED pattern taken from
the region marked by the dashed box in (e) and the diffraction spots are labeled
using Miller-Bravais indices. (g) Intensity profile plot along the line between the
arrows shown in (f).…………………………………………………………….244
Figure 7.3 TEM images of the thermally treated nanohybrids obtained from (a)
the reaction with lower TBOT concentration for 4h and (b) the reaction with
higher TBOT concentration for 4h. The inset in (a) and (b) showed the
corresponding SAED patterns which were indexed to (c,e) GO (labeled using
Miller (hkl) indices) and (d,f) anatase TiO2 respectively. Note that the upper half
in (c)-(f) showed the experimental data while the lower half in (c) and (e) showed
the diffraction pattern of GO, and that in (d) and (f) showed the simulated
diffractions for anatase according to JCPDS 21-1272…………………………246
Figure 7.4 SEM images of (a) highly aggregated GO sheets. (b) GO-SiO2
nanohybrids with layered structure (indicated by arrows along the edges). (c)
Higher magnification image showing the partial separation of two hybrid sheets.
(d) EDX spectrum of the sample shown in (b)…………………………………248

22
Figure 7.5 (a) Low magnification TEM image of silica coated GO sheets. (b) A
magnified TEM image showing the ripples present on the GO sheet (indicated by
the arrow). The SAED pattern taken from the region marked by the dashed box
was labeled using Miller-Bravais indices………………………………………249
Figure 7.6 (a) TEM image of porous silica sheets obtained from the calcination of
GO-SiO2 hybrids. (b) Corresponding SAED pattern taken from the sample shown
in (a)……………………………………………………………………………250
Figure 7.7 Photographs of the aqueous dispersion of bwGO (a) in the absence and
(b) in the presence of Fmoc-Trp. The dispersions were allowed to stand for 35
days…………………………………………………………………………….252
Figure 7.8 (a) TEM image of bwGO sheets deposited from the dispersion in
Fmoc-Trp solution. (b) The corresponding SAED pattern taken from the sample
shown in (a). The pattern was labeled using Miller (hkl) indices……………...253
Figure 7.9 TEM image of bwGO-TiO2 nanohybrids prepared in aqueous solution.
The arrows indicate the wrinkles present in bwGO sheets. (b) The corresponding
SAED pattern taken from the sample shown in (a)……………………………254
Figure 7.10 Raman spectra for (a) bwGO deposited from the dispersion in
Fmoc-Trp solution (b) anatase TiO2 and (c) annealed bwGO-TiO2 nanohybrids
prepared in aqueous solution. The spectra were taken using a 633 nm HeNe laser.
Note that the peak at around 520 cm-1 was attributed to the SiO2/Si
substrate…………………………………………………………………….…..255
Figure 7.11 (a) SEM image of bwGO-TiO2 nanohybrids prepared in EtOH. (b)
EDX spectrum. Pt signal is originated from Pt coating on the SEM sample to
reduce charging effect……….…………………………………………………256
23
Figure 7.12 (a) TEM image of bwGO-TiO2 nanohybrids prepared in EtOH with
the addition of H2O. (b) Corresponding SAED pattern taken from the region
marked by the dashed box in (a). (c) TEM image of bwGO-TiO2 nanohybrids
prepared in EtOH with the addition of Fmoc-Trp solution. (d) Corresponding
SAED pattern taken from the region marked by the dashed box in (c). The pattern
was labeled using Miller-Bravais indices. (e) Intensity profile plot along the line
between the arrows shown in (d)………………………………………………257
Figure 7.13 Schematic illustration of the synthesis of bwGO-TiO2 nanohybrids in
(a) EtOH and (b) aqueous solution…………………………………………..…258
Figure 7.14 Raman spectra for (a) bwGO deposited from the dispersion in
Fmoc-Trp solution (b) anatase TiO2 and (c) annealed bwGO-TiO2 nanohybrids
prepared in EtOH. The spectra were taken using a 633 nm HeNe laser………260
Figure 7.15 Digital images of the graphene dispersions prepared under various
conditions………………………………………………………………………261
Figure 7.16 Raman spectra for (a) the starting graphite powder and the flakes
deposited from the dispersions prepared with (b) 1 h (c) 6 h and (d) 12 h of
sonication followed by centrifugation at 3000 rpm respectively. The spectra were
measured on SiO2/Si substrate and in all cases the excitation wavelength was
633nm. D, G, 2D and D’ bands are indicated in the Figure. All the spectra were
normalized to have the similar G band intensity and offset for
clarity…………………………………….…………………………….……….264
Figure 7.17 Raman spectra for (a) the starting graphite powder and the flakes
deposited from the dispersions prepared with centrifugation at (b) 500 rpm (c)
3000 rpm and (d) 6000 rpm following 6 h of sonication respectively. The spectra
were measured on SiO2/Si substrate and in all cases the excitation wavelength
was 633 nm. D, G, 2D and D’ bands are indicated in the Figure. All the spectra

24
were normalized to have the similar G band intensity and offset for
clarity………………………………………………………………………...…265
Figure 7.18 Histograms and normal distribution of the 2D band position for
varying sonication time and centrifuge speed…………………………………266
Figure 7.19 Mean 2D band position as a function of (a) sonication time and (b)
centrifuge speed. The data for the starting graphite powder was also shown for
comparison……………………………………………………………………267
Figure 7.20 Histograms and normal distribution of the 2D bandwidth for varying
sonication time and centrifuge speed…………………………………………267
Figure 7.21 Mean 2D bandwidth as a function of (a) sonication time and (b)
centrifuge speed………………………………………………………….……268
Figure 7.22 Histograms and normal distribution of I2D/IG ratio for varying
sonication time and centrifuge speed…………………………………………269
Figure 7.23 Mean I2D/IG ratio as a function of (a) sonication time and (b)
centrifuge speed………………………………………………………………270
Figure 7.24 Histograms and normal distribution of ID/IG ratio for varying
sonication time and centrifuge speed…………………………………………271
Figure 7.25 Mean ID/IG ratio as a function of (a) sonication time and (b)
centrifuge speed. The ratio for the starting graphite was also shown for
comparison…………………………………………………………………….272
Figure 7.26 Plot of ID/IG ratio against 2D band position for varying sonication
time and centrifuge speed. The data for the starting graphite was also shown for

25
comparison. The direction of the arrow corresponds to flakes of fewer layer and
smaller size……………………………………………………………………273
Figure 7.27 Representative TEM images of graphene flakes deposited from the
dispersions prepared with various sonication time and centrifugation speed….274
Figure 7.28 (a-e) Histograms and normal distribution of the flake area for varying
sonication time and centrifuge speed. (f) Mean flake area as a function of
sonication time. (g) Mean flake area as a function of centrifuge speed………277
Figure 7.29 AFM characterization of the exfoliated flakes……………………281
Figure 7.30 TEM images of the EG-TiO2 nanocomposites……………………285
Figure 7.31 TEM images of EG-TiO2 nanohybrids prepared in EtOH………..287

26
List of abbreviations
1D 1- dimensional
2D 2-dimensional
3D 3- dimensional
AFM Atomic force microscopy
Al Aluminum
Ala or A Alanine
ALD Atomic layer deposition
AP Alkaline phosphatase
APTES 3-aminopropyltriethoxyysilane
Asn or N Asparagine
Asp or D Aspartic acid
BA Benzyl alcohol
BSA Bovine serum albumin
bwGO Base-washed graphene oxide
C Carbon
CCG Chemically converted graphene
CD Circular dichroism
CMGs Chemically modified graphenes
CNT Carbon nanotube
Cu Copper
CVD Chemical vapour deposition
Cys or C Cysteine
D2O Deuterium oxide
dH2O Deionized H2O
DLS Dynamic light scattering
DMF Dimethylformamide
EDX Energy dispersive x-ray
EG Exfoliated graphene
EtOH Ethanol
FEGSEM Field emitter gun scanning electron microscope
FGSs Functionalized graphene sheets
Fmoc-AA N-(fluorenyl-9-methoxycarbonyl) terminated amino acid
Fmoc-FY Fmoc-Phenylalanine-Tyrosine
Fmoc-FpY Fmoc-Phenylalanine-Tyrosine (phosphate)
Fmoc-Y Fmoc-Tyrosine
Fmoc-Y(p)-OH Fmoc-Tyrosine (phosphate)-OH
FT-IR Fourier transform infrared spectroscopy
FWHM Full width at half maximum
Glu or E Glutamic acid
Gly or G Glycine
GNPs Golden nanoparticles
GO Graphene oxide

27
GS Graphene sheets
HA Hydroxyapatite
HeNe Helium–neon
HiPco High-pressure decomposition of carbon oxide
His or H Histidine
HOPG Highly orientated pyrolytic graphite
HPLC High performance liquid chromatography
HRTEM High-resolution transmission electron microscopy
H-bonding Hydrogen bonding
iTO in-plane transverse optical
Leu or L Leucine
LO longitudinal optical
Lys or K Lysince
MWNTs Multi-walled nanotubes
NaOH Sodium hydroxide
NMP N-Methyl-2-Pyrrolidone
NMR Nuclear magnetic resonance
NT Nanotube
O Oxygen
OD Oxidative debris
PA Peptide amphiphile
PECS Precision Etching Coating System
Phe or F Phenylalanine
Pt Platinum
QDs Quantum dots
RGO Reduced graphene oxide
rpm Revolutions per minute
SAED Selected area electron diffraction
SAF Self-assembling fibre
SDS Sodium dodecyl sulfate
SDBS Sodium dodecyl benzene sulfonate
SEM Scanning electron microscopy
Ser or S Serine
Si Silicon
SiO2 Silicon dioxide
STEM Scanning transmission electron microscopy
SWNTs Single-walled nanotubes
TBOT Tetrabutyl titanate
TEM Transmission electron microscopy
TEOS Tetraethyl orthosilicate
THEOS Tetrakis (2-hydroxyethyl) orthosilicate
Thr or T Threonine
Ti Titanium
TiO2 Titanium dioxide
Trp or W Tryptophan
Tyr or Y Tyrosine

28
UV-Vis Ultraviolet-visible light spectroscopy
Val or V Valine
wt% Weight%
XRD X-ray diffraction

29
List of Symbols
A Absorbance
a1, a2 Lattice vectors of graphene sheet
b Path length
C Equilibrium concentration of the solute in solution
c Concentration
Ch Chiral vector
d Crystal size
I Intensity
I2D Raman intensity for 2D band
IA Integrated intensity of anatase (101) peak
ID Raman intensity for D band
IG Raman intensity for G band
IR Integrated intensity of rutile (110) peak
K Shape factor
k Adsorption capacity constant
ki Initial adsorption rate
n Adsorption intensity constant
(n, m) Indices defining the nanotube structure
Q Amount of the solute adsorbed per unit weight of the
adsorbent
R2 Correlation coefficient
S Surface area
T Translation vector
t Time
V Volume
WR Percentage of rutile
β Full width at half maximum intensity
ε Molar absorptivity
λ Wavelength
θ Angle
30
Abstract
Silica and titania nanoparticles have been produced by using carbon nanotubes
(CNTs) and graphene as templates in a sol-gel reaction. A range of Fmoc
terminated amino-acids (Fmoc-AAs) were studied as surface modifiers to
encourage the templating on the nanocarbons. After annealing the deposited
structures, the carbon templates were either left in place to give hybrid structures
or oxidized to leave pure inorganic nanoparticles.
Absorption studies were initially conducted to identify Fmoc-AAs that would
bind well to the CNTs. Fmoc-Trp had the best affinity for CNTs out of the amino
acids studied. The fully reversible nature of the binding process was
demonstrated via the desorption of Fmoc-AAs from CNTs in water. The
equilibrium data were found to be well described by the Freundlich isotherm
model. The competitive binding from a library of Fmoc-AAs on graphite was
developed to efficiently identify the strongest binding candidate.
The synthesis of CNT-SiO2 and CNT-TiO2 nanohybrids were successfully
demonstrated. The morphology of the hybrids was found to be dependent on the
CNT:precursor and Fmoc-AA:CNT ratios. Fmoc-AAs were believed to play a
dual role: (1) electrostatically stabilizing the NT dispersion and (2) the
functionalities from the side chains of the amino acids providing binding sites for
SiO2 and TiO2 deposition. Uniform anatase nanotubes (NTs) were synthesized
after calcination of the CNT-TiO2 nanohybrids. Both the inner diameter and wall
thickness of the synthesized TiO2 NTs were controlled by the dimension of CNT
templates and the ratio of CNT:precursor. The transition from anatase to rutile
phase was found to be affected by heating temperature, pre-treatment and ramp
rate. A simple route towards the production of TiO2 NT arrays was also
demonstrated by using aligned CNT arrays as templates in the presence of the
Fmoc-AAs.
Graphene based nanohybrids were synthesized in the presence of graphene oxide
(GO), Fmoc-Trp stabilized base-washed graphene oxide (bwGO) and exfoliated
graphene via the sol-gel process. It was found that the morphology of the
products was highly dependent on the reaction media. Graphene dispersions were
prepared by direct exfoliation of graphite in Fmoc-Trp solution. Raman, TEM
and AFM analyses suggested the dispersion comprised of mainly few layer
graphene (<5 layers) with a broad size distribution and that the defects introduced
during sonication were predominately associated with the formation of new flake
edges due to sonication-induced cutting.
A preliminary study was conducted on the silicification of Fmoc-Y and Fmoc-FY
self-assembled hydrogels. The presence of a high density of –OH group on the
nanofibers’ surface was found to promote silica deposition.

31
Declaration
No portion of the work referred to in the thesis has been submitted in support of
an application for another degree or qualification of this or any other university or
other institute of learning.

32
Copyright Statement i. The author of this thesis (including any appendices and/or schedules to this
thesis) owns certain copyright or related rights in it (the “Copyright”) and s/he
has given The University of Manchester certain rights to use such Copyright,
including for administrative purposes.
ii. Copies of this thesis, either in full or in extracts and whether in hard or
electronic copy, may be made only in accordance with the Copyright, Designs
and Patents Act 1988 (as amended) and regulations issued under it or, where
appropriate, in accordance with licensing agreements which the University has
from time to time. This page must form part of any such copies made.
iii. The ownership of certain Copyright, patents, designs, trade marks and other
intellectual property (the “Intellectual Property”) and any reproductions of
copyright works in the thesis, for example graphs and tables (“Reproductions”),
which may be described in this thesis, may not be owned by the author and may
be owned by third parties. Such Intellectual Property and Reproductions cannot
and must not be made available for use without the prior written permission of
the owner(s) of the relevant Intellectual Property and/or Reproductions.
iv. Further information on the conditions under which disclosure, publication and
commercialisation of this thesis, the Copyright and any Intellectual Property
and/or Reproductions described in it may take place is available in the University
IP Policy (see http://documents.manchester.ac.uk/DocuInfo.aspx?DocID=487), in
any relevant Thesis restriction declarations deposited in the University Library,
The University Library’s regulations (see
http://www.manchester.ac.uk/library/aboutus/regulations) and in The University’s
policy on Presentation of Theses

33
Acknowledgements
The author would like to thank Prof. Ian Kinloch for his guidance and support
throughout. Further thanks go to Prof. Rein Ulijn who enabled the collaboration
and has offered guidance and encouragement at times of need.
Thanks also go to Chris, Polly, Alan, Gary, Andy, Xiaofeng for help with SEM,
UV-Vis, TEM, XRD, Raman, AFM and EDX linescan, Dr. Sarah Haigh for help
with TEM and discussion on diffraction pattern interpretation, Kate Thornton for
help with preparation of Fmoc-Tyr-OH hydrogel, Sangita Roy and Louise
Birchall for help with HPLC and fluorescence spectroscopy
Most of all, the author is indebted to her family for all their support and much
needed funding to complete the degree.

34
Chapter 1 Introduction
1.1 Overview Carbon nanotubes (CNTs) and more recently graphene have attracted
considerable interest owing to their unusual combination of electronic, thermal
and mechanical properties. Such remarkable properties have opened up a world of
possible applications, including photochemical, catalytic and electrochemical
technologies.
CNT-inorganic hybrid materials combine the physicochemical properties of
CNTs with the advantages of their inorganic components, leading to new
functionalities that do not exist in either building block 1,2. For example, the
hybrid materials exhibit a significant synergistic effect through size domain
effects and charge transfer processes across the CNT-inorganic interface.
Dielectric materials such as SiO2 and TiO2 are of particular interest amongst the
inorganic compounds. Owing to the high biocompatibility, hydrophilic nature and
easy surface functionalization of SiO2, CNT-SiO2 hybrids have found an
extensive range of applications, such as in biotechnology 3-5, nanoelectric devices
and reinforcement materials in composites 6-8. TiO2 has been extensively studied
as a highly active semiconductor photocatalyst material for applications in solar
energy conversion9, environmental purification10-20 and dye-sensitized solar
cells21-23. The combination of CNTs with the well-established photoactivity of
TiO2 has increased the charge-transfer efficiency, which further enhances the
photocatalytic activity 24-26.
Typically, inorganic compounds are coated onto CNTs using a sol-gel process
due to the mild reaction conditions (room temperate, near neutral pH etc.). The
morphology of the coating depends significantly on the surface chemistry of
CNTs, as the surface groups act as both catalysts and structural directors. Eder et
al. 27 employed benzyl alcohol as a surfactant to coat pristine CNTs with TiO2.
They assumed that the benzene ring of the surfactant adsorbed on CNT surface

35
via - stacking interactions, while the hydroxyl groups activated the hydrolysis
of the titanium precursor. Based upon this assumption, there should be a family of
surface modifiers which could enhance the inorganic templating process on the
nanotubes. For example, N-(fluorenyl-9-methoxycarbonyl) terminated amino
acids (Fmoc-AAs) are cheap and have previously been shown by the research
group 28 to bind well to CNTs and the amino acid group gives 26 different
functional motifs to explore for the templating reaction. The importance of the
amino acids is highlighted by studies on the biomineralization process of
silicateins in a marine sponge 29. The site-directed mutagenesis results have found
that both serine and histidine residues were required for the efficient catalysis of
the siloxane polymerization. Several synthetic counterparts have been developed.
For instance, peptide based self-assembled supramolecular structures have been
demonstrated to mimic the catalytic activity of silicateins for the templating of
silica 30, 31.
Graphene-TiO2 hybrid materials showed improved photocatalytic activity
compared with CNT-TiO2 attributed to the higher dye adsorption capacity and
enhanced charge separation and transportation properties. However, for such
applications to be achieved, suitable routes for graphene manufacturer have to be
developed. High-quality graphene has been produced by liquid-phase exfoliation
which includes the reduction of exfoliated GO 32,33 and sonication-assisted direct
exfoliation of graphite in solution34-39. Solvent exfoliation is particularly
attractive as it produces relatively defect-free graphene and can either be done in
a solvent such as NMP or in a surfactant solution. In particular for the latter, it
may be possible to select a surfactant that both enables exfoliation and can direct
templating.
1.2 Aims
Thus, this thesis initially aims to identify suitable Fmoc-AA surface modifiers for
CNTs and understand the adsorption process for these Fmoc-AA modifiers. The

36
Fmoc-AA coated CNTs will then be used as templates in the sol-gel deposition of
silica and titania, and their performance compared to that of the published benzyl
alcohol. The Fmoc-AA functionalized nanotubes also allow an attempt at
mimicking the catalytic active site of silicatein. The identified successful
Fmoc-AA will then be used as a surfactant to exfoliate graphene from graphite
and as a surface modifier in the production of inorganic-graphene hybrids using a
range of graphene materials.
More explicitly, the thesis aims to
(1) Study the non-covalent functionalization of CNTs through the adsorption of a
library of aromatic Fmoc-AAs on both aligned CNT arrays and randomly
aligned CNT networks.
(2) Synthesize silica and titania based nanohybrids via an in-situ sol-gel process
employing the Fmoc-AA functionalized CNTs as templates. Herein,
Fmoc-Trp, Fmoc-His and Fmoc-Tyr which render the templates’ surface
with the functionalities that have been reported to catalyze silica and titania
deposition were investigated as surface modifiers. The surface modifier is
expected to serve two purposes: helps to colloidally stabilize the CNT
dispersion as well as to promote the deposition of silica and titania on CNTs.
The role of the surface chemistry of CNTs in controlling the coating
morphology was also investigated.
(3) Prepare graphene dispersion by direct exfoliation of graphite in Fmoc-AA
solution and subsequently produce graphene–TiO2 nanohybrids employing the
exfoliated flakes as templates via sol-gel process. The degree of exfoliation
and quality of the exfoliated flakes was characterized by Raman spectroscopy,
TEM and AFM.
(4) Conduct a preliminary study on the silicification of Fmoc-Y and Fmoc-FY

37
self-assembled hydrogels. Both of the gels were prepared through an enzyme
catalyzed dephosphorylation. The presence of a high density of –OH group
on the nanofibers’ surface was expected to promote silica deposition.
1.3 References
1. Y. Zhang et al., Reinforcement of silica with single-walled carbon nanotubes
through covalent functionalization, J. Mater. Chem., 2006, 16, 4592.
2. M. Bottini et al., Non-destructive decoration of full-length multi-walled carbon
nanotubes with variable amounts of silica gel nanoparticles, Carbon, 2006, 44,
1301.
3. D. T. Mitchell et al., Smart Nanotubes for Bioseparations and Biocatalysis,
J. Am. Chem. Soc., 2002, 124, 11864.
4. S. Kapoor et al., Ultrasound-Triggered Controlled Drug Delivery and
Biosensing Using Silica Nanotubes, J. Phys. Chem. C, 2009,113, 7155.
5. C. C. Chen et al., Preparation of Fluorescent Silica Nanotubes and Their
Application in Gene Delivery, Adv.Mater., 2005, 17, 404.
6. M. Olek et al., Nanomechanical properties of silica-coated multiwall carbon
nanotubes-poly(methyl methacrylate) composites, Langmuir, 2005, 21, 3146.
7. J. Wang et al., Utilization of silane functionalized carbon nanotubes-silica
hybrids as novel reinforcing fillers for solution styrene butadiene rubber,
Polym. Compos., 2013, 34, 690.
8. W. Zhang et al., Polymer Nanocomposites Using Urchin-Shaped Carbon
Nanotube-Silica Hybrids as Reinforcing Fillers, Macromol. Rapid Commun.,
2004, 25, 1860.
9. S. Lee et al., Two-Step Sol-Gel Method-Based TiO2 Nanoparticles with
Uniform Morphology and Size for Efficient Photo-Energy Conversion Devices,
Chem. Mater., 2010, 22, 1958.
10. I. Sopyana et al., An efficient TiO2 thin-film photocatalyst: photocatalytic
properties in gas-phase acetaldehyde degradation, J. Photochem. Photobiol. A:
Chem., 1996, 98, 79.
11. Q. Li et al., Antimicrobial nanomaterials for water disinfection and microbial
control: potential applications and implications, Water Res., 2008, 42, 4591.
12. M. L. Sauer et al., Photocatalyzed Oxidation of Ethanol and Acetaldehyde in
Humidified Air, J. Catal., 1996, 158, 570.
13. T. N. Obee et al., TiO2 Photocatalysis for Indoor Air Applications: Effects of
Humidity and Trace Contaminant Levels on the Oxidation Rates of
Formaldehyde, Toluene, and 1,3-Butadiene, Environ. Sci. Technol., 1995, 29,
1223.
14. C.H. Aoa et al., Photodegradation of volatile organic compounds (VOCs) and
NO for indoor air purification using TiO2: promotion versus inhibition effect of
NO, Appl. Catal. B: Environ., 2003, 42, 119.
15. L. Petrov et al., Photocatalytic properties of modified TiO2 coatings for

38
purification of waste water and air, J. Environ. Prot. Ecol., 2007, 8, 881.
17. I. Salema et al., Recent Studies on the Catalytic Activity of Titanium,
Zirconium, and Hafnium Oxides, Catal. Rev. Sci. Eng., 2003, 45, 205.
18. Z. Liu et al., Efficient Photocatalytic Degradation of Gaseous Acetaldehyde
by Highly Ordered TiO2 Nanotube Arrays, Environ. Sci. Technol., 2008, 42, 8547.
19. O. Carp et al., Photoinduced reactivity of titanium dioxide, Prog. Solid State
Chem., 2004, 32, 33.
20. T. Hirakawa et al., Mechanism of Photocatalytic Production of Active
Oxygens on Highly Crystalline TiO2 Particles by Means of Chemiluminescent
Probing and ESR Spectroscopy, J. Phys. Chem. B, 2001, 105, 6993.
21. M. Grätzel et al., A low-cost, high-efficiency solar cell based on
dye-sensitized colloidal TiO2 films, Nature, 1991, 353, 737.
22. M. Grätzel et al., Photoelectrochemical cells, Nature, 2001, 414, 338.
23. M. Adachi et al., Formation of Titania Nanotubes and Applications for
Dye-Sensitized Solar Cells, Journal of the Electrochemical Society, 2003, 150,
G488.
24. Y. Yu et al., Enhancement of photocatalytic activity of mesoporous TiO2 by
using carbon nanotubes, Appl. Catal. A: Gen., 2005, 289, 186.
25. W. Wang et al., Visible light photodegradation of phenol on
MWNT-TiO2 composite catalysts prepared by a modified sol–gel method, J. Mol.
Catal. A: Chem., 2005, 235, 194.
26. W. Wang et al., Photocatalytic degradation of phenol on MWNT and titania
composite catalysts prepared by a modified sol–gel method, Appl. Catal., B, 2005,
56, 305.
27. D. Eder et al., Carbon–Inorganic Hybrid Materials, Adv.Mater., 2008, 20,
1787.
28. B. G. Cousins et al., Enzyme-Activated Surfactants for Dispersion of Carbon
Nanotubes, Small, 2009, 5, 587.
29. Y. Zhou et al., Efficient catalysis of polysiloxane synthesis by silicatein a
requires specific hydroxyl and imidazole functionalities, Angew.Chem.Int.Ed.,
1999, 38, 780.
30. J. N. Cha et al., Biomimetic synthesis of ordered silica structures mediated by
block copolypeptides, Nature, 2000, 403, 289.
31. V. M. Yuwono et al., Peptide Amphiphile Nanofibers Template and Catalyze
Silica Nanotube Formation, Lagmuir, 2007, 23, 5033.
32. S. Stankovich et al., Synthesis of graphene-based nanosheets via chemical
reduction of exfoliated graphite oxide, Carbon, 2007, 45, 1558.
33. S. Dubin et al., A One-Step, Solvothermal Reduction Method for Producing
Reduced Graphene Oxide Dispersions in Organic Solvents, ACS Nano, 2010, 4,
3845.
34. J. N. Coleman et al., Liquid-Phase Exfoliation of Nanotubes and Graphene,
Adv. Funct.Mater., 2009, 19, 3680.
35. S. De et al., Flexible, transparent, conducting films of randomly stacked
graphene from surfactant-stabilized, oxide-free graphene dispersions, Small, 2010,
6, 458.

39
36. J. N. Coleman et al., High-yield production of graphene by liquid-phase
exfoliation of graphite, Nature Nanotechnol., 2008, 3, 563.
37. U. Khan et al., High-concentration solvent exfoliation of graphene, Small,
2010, 6, 864.
38. M. Lotya et al., Liquid Phase Production of Graphene by Exfoliation of
Graphite in Surfactant/Water Solutions, J. Am. Chem. Soc., 2009, 131, 3611.
39. M. Lotya et al., High-concentration, surfactant-stabilized graphene
dispersions, ACS Nano, 2010, 4, 3155.

40
Chapter 2 Literature review
2.1 Sol-gel chemistry
The sol–gel process is the most popular technique for the production of glasses
and ceramic materials due to its low reaction temperatures compared to melting
glass or firing ceramics. Also, as a wet-chemical technique, it has many
advantages over other conventional "powder" routes, including 1: (1) The
rheological properties of sols and gels allow the production of various forms of
products including ultrafine powders, thin films, fibers and monoliths depending
on the processing conditions 2-4. (2) Easy deposition of good quality coatings onto
a variety of substrates. (3) Better control over the whole process and the synthesis
of "tailor-made" materials. (4) Production of high-purity materials at mild
reaction conditions which are highly desired in some applications such as
bioencapsulation and sensors 5,6.
The sol-gel process involves the formation of a colloidal suspension (sol) and the
transition of the liquid “sol” into a wet and continuous network (gel). Removal of
the liquid from the sol yields the gel, and the sol-gel transition controls the
particle size and shape. Calcination of the gel then produces the oxide. The gel
phase can be processed by various drying methods to develop materials with
distinct properties. Subsequent drying under supercritical conditions converts the
gel into a low-density, highly porous aerogel, while drying induced by heating
typically results in a xerogel (low temperature) or a dense ceramic (high
temperature) (Figure 2.1)7.

41
Figure 2.1 Schematic representation of sol-gel process of synthesis of nanomaterials 7.
Two reactions are typically used in the sol-gel process: (1) there is an initial
hydrolysis reaction through which the alkoxide group (-OR) of the precursor is
replaced by the hydroxyl group (Equation 2.1). For example, the mechanism is
based on the nucleophilic attack to the central Si atom in silica production; (2)
this is then followed by water or alcohol condensation reactions (Equation 2.2
and 2.3), in which two hydrolyzed species (monomeric and polymeric silica
reacting units) link together to form siloxane bonds (Si-O-Si) with the elimination
of water or alcohol. Under most conditions, polycondensation commences before
hydrolysis is complete. However, conditions such as, pH, H2O/Si molar ratio, and
catalyst can force completion of hydrolysis before condensation begins 8.
Additionally, because water and alkoxides are immiscible, a mutual solvent such
as an alcohol is utilized9. With the presence of this homogenizing agent,
hydrolysis is facilitated due to the miscibility of the alkoxide and water.

42
Typical sol-gel processes require strong acid or base for accelerating the
hydrolysis of the precursors. It is generally found that the alkaline conditions
usually favor the formation of “particulate” sols, whereas the acidic conditions
produce weakly branched “polymeric sols”. For example, the kinetics and
mechanism of silica-particle formation by the base-catalyzed hydrolysis of TEOS
in alcohol media have been studied extensively10. It was found that the dilute
NaOH-catalyzed hydrolysis of TEOS had a first-order dependence on the
concentrations of both TEOS and hydroxyl ion (OH-). While for
ammonia-catalyzed reaction (Stöber process), both the rates of silica-particle
growth and TEOS hydrolysis were first order with almost the same specific rate
constant, indicating that silica-particle growth was reaction-controlled by the
hydrolysis of TEOS.
Typical precursors for the sol-gel synthesis of oxide materials include metal
alkoxides and metal salts11,12, among which the most versatile precursors are
undoubtedly alkoxides because they react readily with water. Alkoxide materials
consist usually of a metal or metalloid element surrounded by the reactive ligands.
Sol-gel methods using metal alkoxides usually produce fine and spherical oxide
particles of uniform size. However, the disadvantage of such water reactivity is
that tight control of the reaction conditions is required.
(2.2)
(2.1)
(2.3)
43
The morphology and properties of a particular sol-gel inorganic network are
related to a number of factors that influence the rate of hydrolysis and
condensation reactions, such as, pH, temperature, reagent concentrations, alkyl
groups in the alkoxide, type of solvent, catalyst adopted and its concentration,
H2O/alkoxides molar ratio and drying 1, 9,13,14. Among the factors listed above, pH,
nature and concentration of catalyst, H2O/Si molar ratio, and temperature have
been identified as the most important.
2.2 CNT-Inorganic nanohybrids
2.2.1 Introduction to Carbon Nanotubes
2.2.1.1 Structures
Carbon nanotubes (CNTs) are the 1D allotrope of carbon and are formed by
predominantly sp2-bonded carbon atoms arranged in a honeycomb lattice. CNTs
are generally classified as either single-walled nanotubes (SWNTs) or
multi-walled nanotubes (MWNTs). A SWNT can be visualized as a single layer of
graphene sheet rolled into a seamless cylindrical tube with a diameter of 1–2 nm.
While a MWNT consists of several concentric and closed graphene tubules with
an overall diameter of ~10 to 100 nm and a length of up to centimeters. The
interlayer distance between the tubules is approximately 0.34 nm, similar to the
interlayer spacing in HOPG. Both types are displayed in Figure 2.2. CNTs can be
either open-ended or closed by a cap which in ideal models is described as a
hemispherical fullerene-type cap.

44
Figure 2.2 The structures of (a) SWNTs and (b) MWNTs 15.
2.2.1.2 Properties
Ever since their discovery in 1991 by Iijima 16, CNTs have drawn considerable
research attentions in the field of nanoscience and nanotechnology owing to their
rich electrical properties 17, high mechanical strength and excellent chemical and
thermal stability. CNTs possess high aspect ratio and large specific surface areas
attributed to their hollow geometry. While MWNTs are purely metallic, SWNTs
can be either metallic or semiconducting depending primarily on their diameter
and chirality.
The chirality is defined as the symmetry of a nanotube’s wall. A SWNT can be
considered as a rolled-up graphene sheet and is characterized by the way the
graphene sheet is conceptually rolled up to form it (Figure 2.3), i.e. the chiral
vector 18:
Ch=na1+ma2=(n, m) (2.4)
Where Ch is the chiral vector, a1 and a2 are unit vectors, n and m are integers
denote the number of unit vectors along two directions in the crystal lattice of
graphene. The length of Ch determines the tube diameter and the angle between
Ch and the (n,0) lattice vector, the chiral angle θ, determines the chirality.
(a) (b)
45
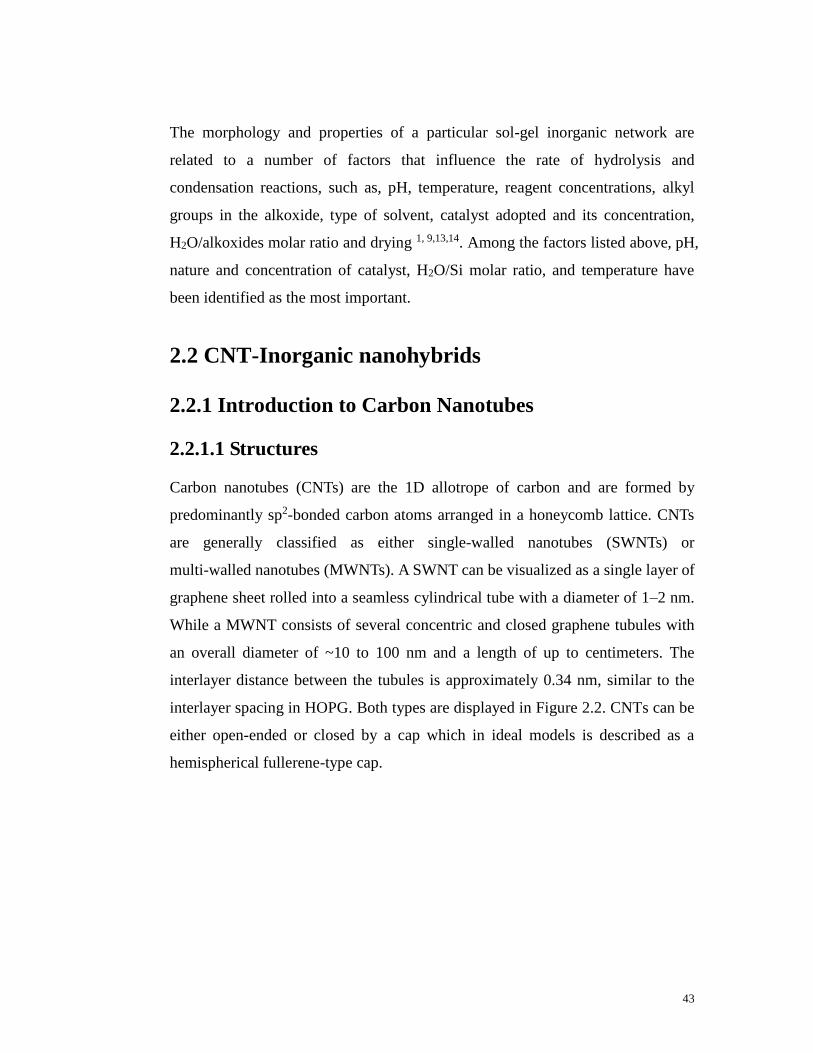
Tubes having n = m (θ= 30°) are called armchair NTs and those with m = 0 (θ= 0°)
are called zigzag NTs. Otherwise, they are called chiral NTs. Both armchair and
zigzag NTs have a high degree of symmetry. All the armchair tubes are metallic
and for zigzag and chiral NTs, when (n−m)/3 is an integer, the tubes are metallic
and otherwise semiconducting 19,20.
The situation in MWNT is complicated as their properties are determined by
contribution of all individual shells having different chiralities. However, it has
been reported for small diameter MWNTs that only one concentric tube needs to
be metallic for the overall electronic properties to be essentially metallic 21. In
large MWNTs quantum confinement is lost in the circumference.
Figure 2.3 Schematic representation of a 2D graphene sheet with the lattice vectors
a1 and a2 and the roll-up vector Ch=na1+ma2. The achiral cases, (n,0) zigzag and (n,
n) armchair are indicated with dashed lines. The translation vector T is along the
nanotube axis and defines the 1D unit cell. The shaded boxed area represents an
unrolled unit cell, defined by T and Ch. 18

46
2.2.1.3 Synthesis
There are three main methods for nanotube synthesis; electric arc discharge22,
laser ablation23, and chemical vapour deposition (CVD) 24. Although the former
two methods generally produce CNTs with fewer structural defects, they tend to
suffer from low yield issues and thus proves infeasible for mass production 25. On
the other hand, CVD shows great promise for possible industrial scaled-up due to
the relatively low growth temperature, high yields and high purities of the
synthesized CNTs 26. It is also capable of growing nanotubes directly onto the
desired substrate26, whereas the nanotubes produced from the other routes must
be subsequently processed and deposited in the required morphology. CVD
technique allows the growth of aligned CNTs of various packing densities which
may be useful for applications such as electrodes. Positional control of growth
has been achieved by patterned pre-deposition of the catalyst. In addition, this
method allows greater control over the morphology of CNTs by manipulating the
reaction parameters, such as reaction temperature, catalyst concentration and
reaction time 26-28.
In CVD technique, the nanotubes are grown from carbon containing gaseous
compounds (i.e. hydrocarbon) which are reacted with a metal catalyst at moderate
temperatures (≤ 1000 °C). The catalyst is present either in-situ from a precursor
or pre-produced on a substrate. However, this method is not without drawbacks.
Residual metal catalyst particles tend to remain in the CNT structures which limit
some of their applications, therefore post-production treatments are required to
purify the nanotubes.
2.2.1.4 Applications
The unique physical and chemical properties of CNTs have led to their diverse
use as supercapacitors29, reinforcement materials of polymers and ceramics 30-32,
electromechanical actuators 33, field emission devices 34, gas sensors 35,36 and
nanosize probe tips for AFM37. Recently their bioapplication as biosensor

47
materials has attracted increasing interests due to their ability to enhance the
electroactivity of biomolecules and to promote the electron-transfer between the
biomolecules’ active site and the electrochemical transducer.38-41 CNTs can also
act as supports for metal and semiconductor catalysts thanks to their high aspect
ratio 42-45.
To take advantages of the remarkable properties of CNTs, a popular solution is to
prepare composite materials based on CNTs and various other materials ranging
from ceramics, polymers to biomolecules 46. However, the as-produced CNTs
tend to be chemically inert due to their inherently hydrophobic nature which
provides little attractive interaction with the inorganic compounds. Thus, it is
necessary to modify their surface chemistry in order to achieve good interfacial
bonding with the matrix in the composites.
2.2.2 Functionalization of CNTs
Due to the hydrophobic nature of pristine CNTs, they tend to aggregate into
bundles in solvents held together by the strong van der Waals forces. This
bundling is a significant barrier to their processing and also perturbs the
electronic structure of the tubes. Functionalizaiton of CNTs has opened up the
possibilities of dispersing 47,48 and self-assembly of the nanocarbons49 which
allows for the generation of useful architectures50.
Two strategies are generally reported towards the functionalization of CNTs: (1)
covalent functionalization through attachment of chemical groups to the sidewall
of CNTs51,52 and (2) non-covalent adsorption of various functional molecules,
such as surfactants and polymers. Both non-covalent and covalent
functionalization have been reported to improve the solubility of CNTs 53 which
is necessary for their characterization and manipulation.
Recently, increasing interests have been focused on the functionalization of CNTs
48
with biomolecules as motivated by the prospects of using nanotubes as new types
of biosensor materials 54-56. Carbohydrates57, proteins 55,56, peptides58,59, and
single strand DNA55 have been demonstrated to modify CNTs through either
covalent 60 or non-covalent way49,61-63. The modification of nanotubes by these
biomolecules, as well as their analogs and precursors (such as oligosaccharide,
amino acids and peptide, etc.) represents a significant step toward the application
of CNTs in the field of biotechnology and the transfer of biomolecular
self-assembly techniques to nanomaterials.
2.2.2.1 Covalent functionalization
Covalent functionalization of CNTs provides more control over the location and
density of the attached groups than the non-covalent adsorption and thus leads to
more robust and predictable conjugates. Considerable progress has been made on
the open-end 64,65 and sidewall 52,66 modifications of CNTs using covalent
chemistry. Reactions that are usually employed to introduce chemical
functionalities onto CNTs include cycloadditions 67,68 nucleophilic additions 69,
ozonolysis70, halogenation 71 and radical additions 72-74.
The most popular example of covalent functionalization involves the oxidation of
CNTs in strong acids, such as HNO3 75,76 and HNO3/H2SO4 mixture 64,77. Acid
treatment introduces oxygen-containing functional groups (-COOH and –OH)
onto the sidewalls and open ends of CNTs 76,78 which significantly enhance their
aqueous solubility and facilitates further functionalization 79-83. Fu et al. 84 have
developed a milder route for attaching bovine serum albumin (BSA) protein to
CNTs via the esterification of nanotube-bound carboxylic acids by oligomeric
polyethylene glycol compounds followed by the ester-to-amide transformation
reactions with BSA protein. The entire conjugation procedure did not subject the
protein to any damaging experimental conditions, therefore, the method may be
valuable for the preparation of conjugates involving more fragile biological
species.

49
However, this method suffers from a major disadvantage of cutting the CNTs in
short lengths, making them useless for some applications. Soluble full-length
CNTs have been reported using the 1,3-dipolar cycloaddition of an
aminoethylene glycol linker to the external surface of CNTs and the
derivatization with N-protected glycine was then obtained via amidation reaction
(Figure 2.4). 85
Figure 2.4 1,3-dipolar cycloaddition of an aminoethylene glycol linker to the
external surface of CNTs and the derivatization with N-protected glycine was then
obtained via amidation reaction. 85
Biofunctionlization of CNTs has also been employed in the fabrication of
nanoscale biosensors base on enzyme-CNT86, DNA-CNT87 or antibody-CNT
conjugates88. Yu et al. 41 attached myoglobin and horseradish peroxidase
covalently onto the ends of vertically oriented SWNTs forest arrays, which were
used as electrodes. Results suggested that the “trees” in the nanotube forest
behaved electrically similar to a metal, conducting electrons from the external
circuit to the redox sites of the enzymes.
Lin et al. 89 have demonstrated a novel glucose biosensor based on CNT
nanoelectrode ensembles (NEEs) for the selective and sensitive detection of
glucose. Glucose oxidase (GOx) was covalently immobilized on CNT NEEs via
carbodiimide chemistry by forming amide linkages between their amine residues
and carboxylic acid groups on the CNT tips (Figure 2.5). The biosensor

50
effectively performed a selective electrochemical analysis of glucose in the
presence of common interferents (e.g., acetaminophen, uric and ascorbic acids),
avoiding the generation of an overlapping signal from such interferers. Such an
operation eliminates the need for permselective membrane barriers or artificial
electron mediators, thus greatly simplifying the sensor design and fabrication.
Figure 2.5 Fabrication of a glucose biosensor based on CNT nanoelectrode
ensembles: (A) Electrochemical treatment of the CNT NEEs for functionalization
(B) Coupling of the enzyme (GOx) to the functionalized CNT NEEs. 89
Covalent functionalization has been shown to introduce structural defects to
CNTs’ sidewall which lead to a disruption of the nanotubes’ delocalized π system
and consequently compromises their electronic and mechanical properties 90. This
will in turn lead to a significantly poorer performance of CNT-based composites.
To circumvent this problem, non-covalent modification of CNTs which do not
significantly alter their properties is required for the development of high
performance CNT-based hybrids. Nevertheless, the covalent route offers a

51
convenient and controllable means of tethering molecular species.
2.2.2.2 Non-covalent functionalization
In contrast to covalent functionalization, non-covalent binding, which utilizes π-π
stacking,62,91,92 hydrophobic interactions93,94, electrostatic interaction 95 and
hydrogen bonding has relatively less impact on the structural and functional
properties of CNTs.
Stable CNT dispersions in both aqueous and organic solutions have been
achieved through immobilization of ionic 96-98 and nonionic surfactants 99,100
respectively. This solubilization process opens the door to solution chemistry on
pristine CNTs. Commonly employed surfactants include the anionic sodium
dodecyl sulfate (SDS) 101-104 and sodium dodecyl benzene sulfonate (SDBS) 105,106,
cationic CTAB98 and nonionic surfactants such as Triton X-100 and Tween 80.
Synthetic aromatic ligands such as pyrenyl 107-112, porphyrin 113 as well as phenyl
groups are known to interact strongly with the sidewalls of CNTs via π-π stacking
interaction. The interaction is typically weaker for phenyl groups as compared
with the ligands with higher aromaticities. However, their smaller size favors the
higher density of the groups that can be immobilized on CNTs. Dai et al. 62 have
reported the non-covalent functionalization of the sidewalls of SWNTs with a
bifunctional molecule, 1-pyrenebutanoic acid, succinimidyl ester (Figure 2.6,
molecule 1), and subsequent immobilization of various biological molecules onto
nanotubes with a high degree of control and specificity.

52
Figure 2.6 Amine groups on a protein react with the anchored succinimidyl ester to
form amide bonds for protein immobilization.62
There has been increasing interest on using biologically based surfactants, which
then opens up the biochemistry tool kit to nanotechnology. Biomolecules such as
DNA112, polysaccharides57,114 and peptides62,91,92 have been reported for
functionalization of CNTs. Among the biosurfactants, peptides are of particular
interest owing to their designable chemistry. Phage display study has identified
the CNT binding peptide sequences which were invariably rich in aromatic amino
acids such as histidine (H) and tryptophan (W), with W, in particular, interacting
strongly with the nanotube surface 115. It was suggested that the aromatic rings in
these amino acid residues contributed to the observed affinities through π-π
stacking interactions92. However, these literatures tend to focus on the long chain
peptides which usually contain 12 or more residues that are expensive to produce.
As a cost-effective alternative, recent studies have reported using synthetic
aromatic ligands combined with aromatic amino acids for CNT dispersion.
Cousins et al. 47 have demonstrated the use of N-(fluorenyl-9-methoxycarbonyl)
terminated aromatic amino acids (Fmoc-AAs) as surfactants for preparing
homogeneous CNT dispersions (Figure 2.7a). (It should be noted that the author
of this thesis was a co-author on this paper.) Fmoc was selected as a particularly
promising ligand since it is used commonly as a protecting group in solid-state

53
peptide synthesis and it is known to be able to self-assemble into nanofibres via
π-π stacking interactions 116. The turbidity study of the dispersions of CNTs in the
Fmoc-AA solutions revealed the comparable ability of these biosurfactants to
disperse CNTs to those achieved by using commonly used surfactants such as
SDS and SDBS. The molecular interactions between the ligand and nanotube
surface were then confirmed by quantum mechanical modelling and it was found
that both the aromatic fluorenyl rings and the aromatic rings in the side chains of
the amino acid were stacked on the surface of CNTs to maximize their π-stacking
interactions (Figure 2.7b).
(a) (b)
Figure 2.7(a) TEM micrographs of MWNTs dispersed with Fmoc-W (trp). Arrows
indicate the edge of the lattice structure upon which Fmoc-W aggregates are
apparent; (b) Optimized structures of (i) Fmoc-G (gly) and (ii) Fmoc-W bound to
[6,6] SWNTs with close-up images that highlight the orientation and arrangement
of Fmoc and the aromatic W ring 47.
Although the approaches described above increase the solubility of CNTs, they
have not been generally adapted to control the assembly of the solubilized CNTs
into higher order architectures that are necessary for realizing many of their
applications. Dieckmann et al.49,50 have designed an amphiphilic α-helical peptide
(“nano-1”) not only to coat and solubilize CNTs into water, but also to control the
self-assembly of the peptide-coated nanotubes into supramolecular structures
through peptide-peptide interactions between adjacent peptide-wrapped
nanotubes. The CD measurements suggested that the α-helical conformation of
the peptide is stabilized in the presence of the nanotubes through the interaction
of the hydrophobic face of the helix with the nanotube surface. Electron

54
microscopy and polarized Raman studies revealed that the peptide-coated
nanotubes assemble into fibres with the nanotubes aligned along the fibre axis.
Most importantly, the size and morphology of the fibres can be controlled by the
addition of either salt in different concentrations or the amphiphilic additive DMF
which can affect the peptide-peptide charge interactions (Figure 2.8). This study
helps to realize the transfer of biomolecular self-assembly techniques to
nanomaterials.
(i) (ii)
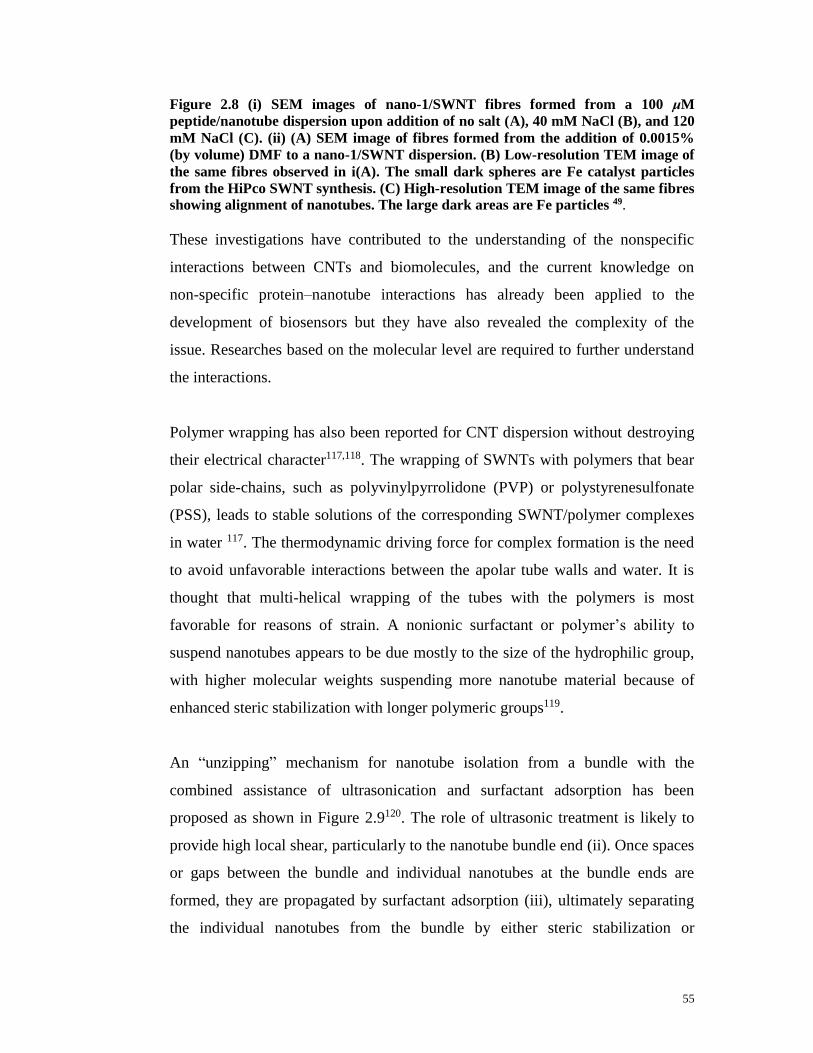
55
Figure 2.8 (i) SEM images of nano-1/SWNT fibres formed from a 100 μM
peptide/nanotube dispersion upon addition of no salt (A), 40 mM NaCl (B), and 120
mM NaCl (C). (ii) (A) SEM image of fibres formed from the addition of 0.0015%
(by volume) DMF to a nano-1/SWNT dispersion. (B) Low-resolution TEM image of
the same fibres observed in i(A). The small dark spheres are Fe catalyst particles
from the HiPco SWNT synthesis. (C) High-resolution TEM image of the same fibres
showing alignment of nanotubes. The large dark areas are Fe particles 49.
These investigations have contributed to the understanding of the nonspecific
interactions between CNTs and biomolecules, and the current knowledge on
non-specific protein–nanotube interactions has already been applied to the
development of biosensors but they have also revealed the complexity of the
issue. Researches based on the molecular level are required to further understand
the interactions.
Polymer wrapping has also been reported for CNT dispersion without destroying
their electrical character117,118. The wrapping of SWNTs with polymers that bear
polar side-chains, such as polyvinylpyrrolidone (PVP) or polystyrenesulfonate
(PSS), leads to stable solutions of the corresponding SWNT/polymer complexes
in water 117. The thermodynamic driving force for complex formation is the need
to avoid unfavorable interactions between the apolar tube walls and water. It is
thought that multi-helical wrapping of the tubes with the polymers is most
favorable for reasons of strain. A nonionic surfactant or polymer’s ability to
suspend nanotubes appears to be due mostly to the size of the hydrophilic group,
with higher molecular weights suspending more nanotube material because of
enhanced steric stabilization with longer polymeric groups119.
An “unzipping” mechanism for nanotube isolation from a bundle with the
combined assistance of ultrasonication and surfactant adsorption has been
proposed as shown in Figure 2.9120. The role of ultrasonic treatment is likely to
provide high local shear, particularly to the nanotube bundle end (ii). Once spaces
or gaps between the bundle and individual nanotubes at the bundle ends are
formed, they are propagated by surfactant adsorption (iii), ultimately separating
the individual nanotubes from the bundle by either steric stabilization or

56
electrostatic repulsions (iv).
Figure 2.9 Proposed mechanism of nanotube isolation from bundle (i) obtained by
ultrasonication and surfactant stabilization. Ultrasonic processing “fray” the
bundle end (ii), which then becomes a site for additional surfactant adsorption. This
latter process continues in an “unzippering” fashion (iii) that terminates with the
release of an isolated, surfactant-coated NT in solution (iv).120
Several mechanisms have been proposed for the stabilization of CNT dispersion
by surfactants. O'Connell et al. 96 have suggested the formation of SDS
cylindrical micelles around SWNT (Figure 2.10a) or the hemimicellar adsorption
of the surfactants on the tubes (Figure 2.10b) while Richard et al. 121 suggested
the formation of helices or double helices, and Yurekli et al.101 suggested that the
structureless random adsorption with no preferential arrangement of the head and
tail groups of the surfactants is responsible for the stabilization of the dispersions
(Figure 2.10c).
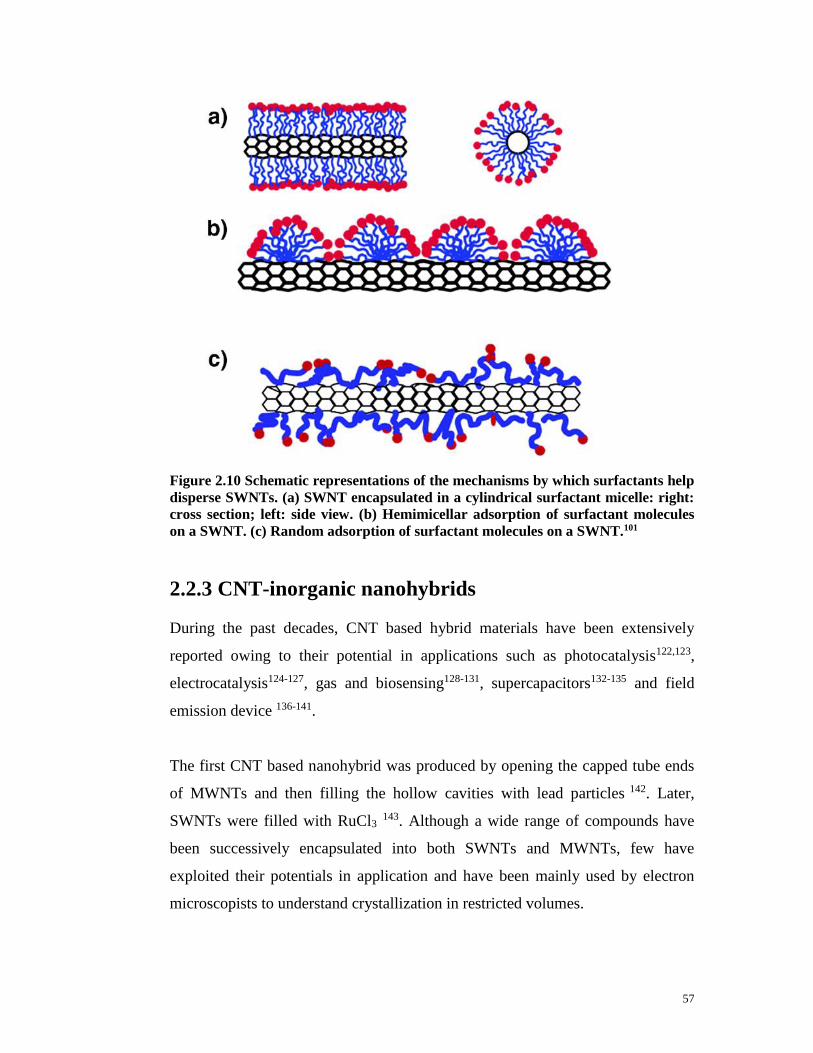
57
Figure 2.10 Schematic representations of the mechanisms by which surfactants help
disperse SWNTs. (a) SWNT encapsulated in a cylindrical surfactant micelle: right:
cross section; left: side view. (b) Hemimicellar adsorption of surfactant molecules
on a SWNT. (c) Random adsorption of surfactant molecules on a SWNT.101
2.2.3 CNT-inorganic nanohybrids
During the past decades, CNT based hybrid materials have been extensively
reported owing to their potential in applications such as photocatalysis122,123,
electrocatalysis124-127, gas and biosensing128-131, supercapacitors132-135 and field
emission device 136-141.
The first CNT based nanohybrid was produced by opening the capped tube ends
of MWNTs and then filling the hollow cavities with lead particles 142. Later,
SWNTs were filled with RuCl3 143. Although a wide range of compounds have
been successively encapsulated into both SWNTs and MWNTs, few have
exploited their potentials in application and have been mainly used by electron
microscopists to understand crystallization in restricted volumes.

58
Alternatively, a wide range of inorganic compounds have been anchored onto the
surface of CNTs for the preparation of hybrid materials. Among the inorganic
components, the most frequently studied are semiconductor oxide nanoparticles
such as SiO2144-147, Al2O3
148-150, SnO2151-153, ZnO154-156 and TiO2
157-163. Of
particular interest are dielectric materials such as silica and TiO2. TiO2 exists in
nature as three polymorphic forms, namely rutile, anatase and brookite, amongst
which, the most important being rutile and the metastable anatase phases. Both of
the phases have tetragonal structures. The properties and applications of TiO2 are
greatly dependent on their crystalline phase, particle size, and morphology, which
could be controlled by varying the reaction conditions 164. A number of studies
have reported the improved photocatalytic activity of CNT-TiO2 hybrids as
compared to the individual component for the oxidative degradation of organic
compounds 122,123,165.
2.2.3.1 Synthesis
The most important challenge in synthesizing such hybrid materials is optimizing
the interface between CNTs and the inorganic components. In general, two
strategies have been adopted for the synthesis of CNT-inorganic hybrids;
1. ex-situ techniques where the preformed inorganic components are
directly attached to the surface of CNTs,
2. in-situ techniques where the inorganic components form directly on the
surface of pristine or functionalized CNTs.
The ex-situ route is mainly used for the deposition of metal nanoparticles67,166 and
semiconductor QDs 167. Surfactants 168 are usually employed as the linking agents
in this approach which utilize both covalent 67,167,169 and non-covalent
interactions 169-176.
Although the ex-situ route holds the advantage of producing inorganic
components with desired structures and dimensions, it requires the chemical
modification of either CNTs or inorganic compounds for their attachment.

59
Furthermore, the in-situ route allows more flexibility of the morphology of the
deposited inorganic components as either discrete units in the form of
nanoparticles or a continuous film on CNTs, while the ex-situ way is typically
restricted to the formation of monolayers of nanoparticles. The presence of CNTs
also prevents the growth of crystals during crystallization and
phase-transformation thus provides an efficient way of synthesizing nanohybrids
with high specific surface area.
The in-situ techniques include (1) hydrothermal techniques132,148,155,159 (2) sol-gel
process 177 (3) electrochemical methods 178-181 and (4) gas phase deposition 182-184.
The main advantage of hydrothermal technique is that it enables the formation of
crystalline phase without the need for post-annealing and calcinations. However,
it typically requires high temperatures 132,148,155. Jitianu et al. 159 have compared
the morphologies of TiO2 coating on CNTs obtained from both sol-gel process
and hydrothermal methods and found that the coating produced with
hydrothermal method is less uniform and the nanotubes surface is partially
damaged due to the oxidizing medium of deposition.
To overcome the above problems, sol-gel process has been widely employed as
an alternative method to prepare CNT-inorganic nanohybrids benefiting from its
benign reaction conditions. Sol-gel process on both covalently152,161,185-188 and
non-covalently147, 189, 190 functionalized CNTs have been reported. During the
sol-gel process, CNT surface chemistry plays an important role in inducing
inorganic compound deposition as well as in controlling the structure and
property of the deposited coatings172.
2.2.3.2 CNT-SiO2 hybrids
Silica-CNT hybrids are of great interest due to their potential in the development
of nanoscale sensors and electric devices 191,192 as well as optical, magnetic, and
catalytic applications 193. CNT-SiO2 hybrids also combine the bioactivity of silica
and the conductivity of CNTs which facilitate their biomedical applications 194. In

60
particular, they can promote compatibility with existing silicon based technology.
CNTs have been widely used as reinforcing fillers for silica. However, due to
poor interfacial bonding of pristine CNTs with silica matrix, they are very easily
agglomerated in silica matrix, which greatly inhibits the effective load transfer.
Previous report has demonstrated the covalent functionalization of CNTs with
silane followed by covalent incorporation of the functionalized CNTs into the
silica matrix via the sol–gel process 32. More uniform dispersion of CNTs as well
as stronger interfacial interaction between CNTs and the matrix were achieved,
thus lead to improved mechanical properties and higher electron-transfer kinetics.
But for electronic applications, the covalent functionalization would inevitably
lead to disruption of the nanotubes’ delocalized π system. Alternatively, by
employing CNT-SiO2 nanohybrids as reinforcing filler, the unique electronic
property of CNTs was greatly preserved 32,195.
Seeger et al.144 have employed PEI as cationic surfactant to coat MWNTs with
SiOx. The adsorption of PEI creates positive charges on CNTs’ surface and thus
favors the deposition of negatively charged colloidal SiOx. The same author also
studied the interface between CNT and SiOx coating in a bulk composites
produced using sol-gel method. HRTEM analysis suggested that the outer
nanotube shells are strongly bonded to the SiOx matrix due to the carbothermal
reduction. Theoretical models accounting for the stable SiOx/CNT interfaces were
further proposed using density functional based tight binding method (DFTB) 145.
Bourlinos et al. 147 have prepared water-dispersible CNT–silica hybrids by
wetting the hydrophobic surface of pristine CNTs with vinylsilane molecules
through the non-covalent interactions between the vinyl groups and the aromatic
walls of CNTs. Subsequent condensation of silane leads to bonded oligomeric
siloxane species that upon calcination afford ultrafine silica nanoparticles
embedded in CNTs.

61
Whitsitt et al. 146 have investigated the effect of surfactants on the morphology of
silica coated SWNTs by employing two kinds of surfactants, i.e. the anionic
surfactant SDS and the cationic surfactant DTAB. It was found that the use of
SDS result in the formation of coated ropes while DTAB lead to individually
coated SWNTs. The author attributed this effect to the pH stability of the
surfactant-SWNT interaction. This paper also indicates that the coating does not
alter the electrical properties of SWNTs. Furthermore, the SiO2 coating allows
ready etching to selectively expose CNTs for applications in addressable SWNT
devices and sensor.
Li et al. 196 have reported a non-covalent strategy for the production of CNT-SiO2
nanohybrids based on the π-π stacking of a bifunctional molecule 1-aminopyrene
on CNTs (Figure 2.11a). Subsequently, the amino groups present on CNTs’
surface specifically adsorb silica precursors via electrostatic interactions (b)
followed by the in-situ formation of silica nanoparticles (c).
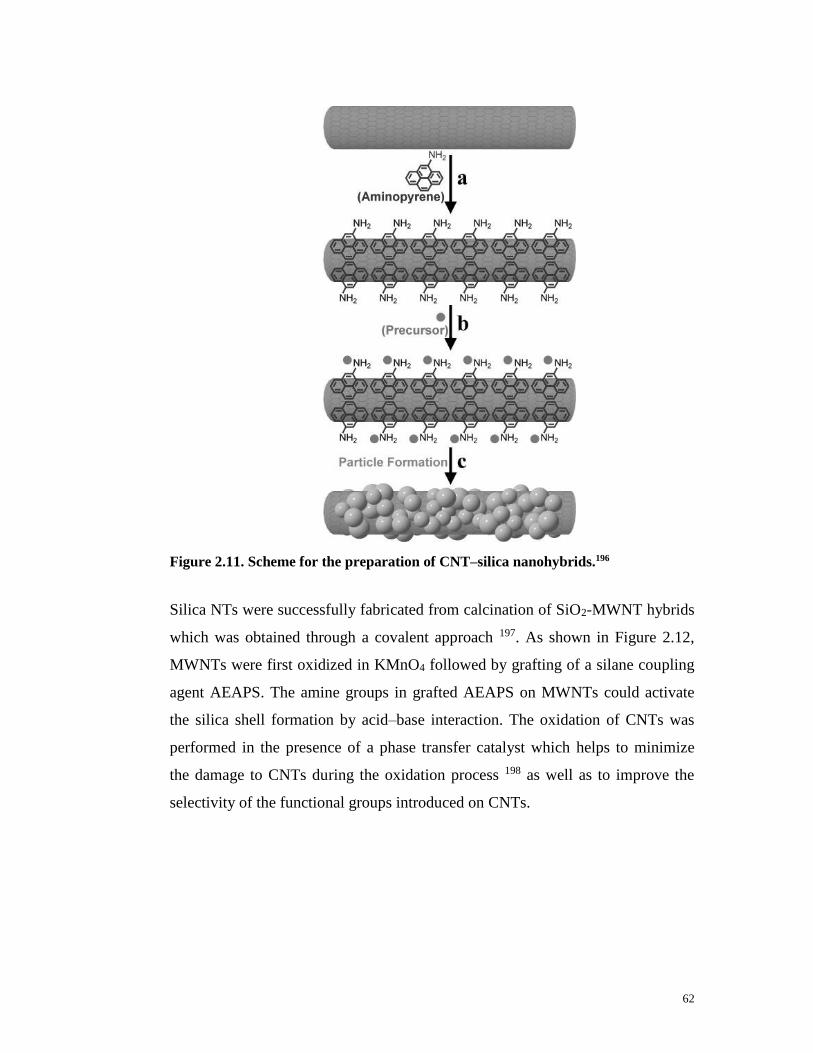
62
Figure 2.11. Scheme for the preparation of CNT–silica nanohybrids.196
Silica NTs were successfully fabricated from calcination of SiO2-MWNT hybrids
which was obtained through a covalent approach 197. As shown in Figure 2.12,
MWNTs were first oxidized in KMnO4 followed by grafting of a silane coupling
agent AEAPS. The amine groups in grafted AEAPS on MWNTs could activate
the silica shell formation by acid–base interaction. The oxidation of CNTs was
performed in the presence of a phase transfer catalyst which helps to minimize
the damage to CNTs during the oxidation process 198 as well as to improve the
selectivity of the functional groups introduced on CNTs.
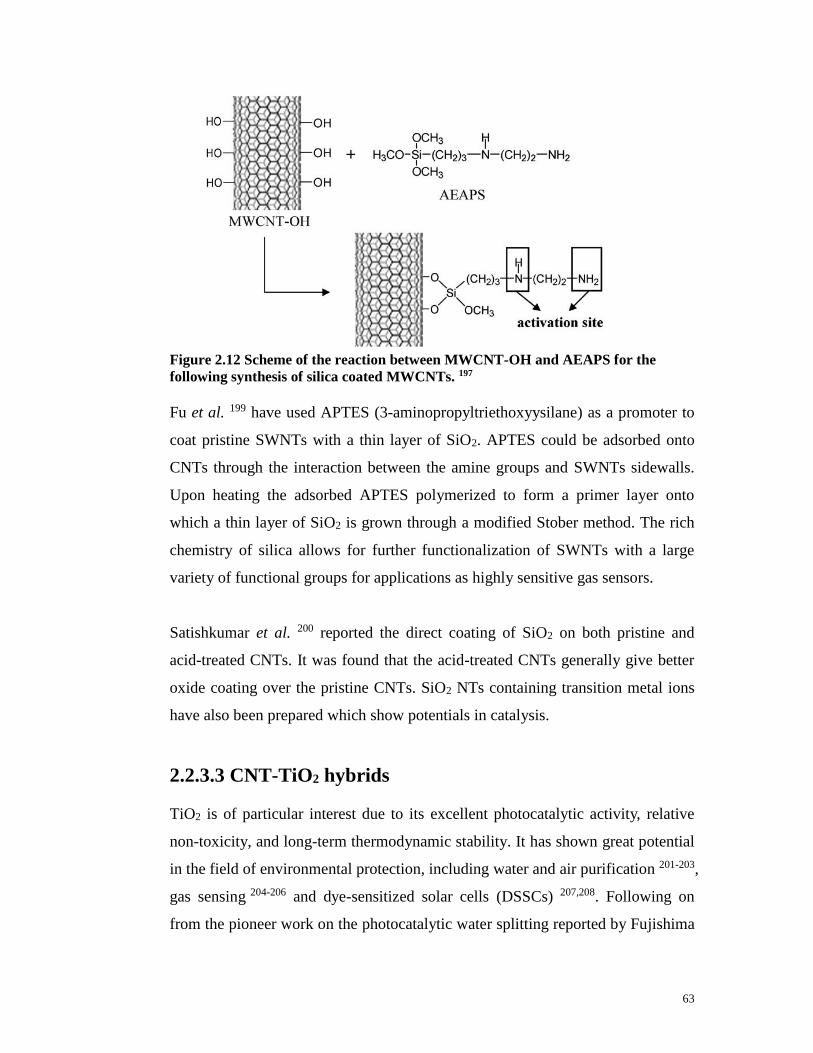
63
Figure 2.12 Scheme of the reaction between MWCNT-OH and AEAPS for the
following synthesis of silica coated MWCNTs. 197
Fu et al. 199 have used APTES (3-aminopropyltriethoxyysilane) as a promoter to
coat pristine SWNTs with a thin layer of SiO2. APTES could be adsorbed onto
CNTs through the interaction between the amine groups and SWNTs sidewalls.
Upon heating the adsorbed APTES polymerized to form a primer layer onto
which a thin layer of SiO2 is grown through a modified Stober method. The rich
chemistry of silica allows for further functionalization of SWNTs with a large
variety of functional groups for applications as highly sensitive gas sensors.
Satishkumar et al. 200 reported the direct coating of SiO2 on both pristine and
acid-treated CNTs. It was found that the acid-treated CNTs generally give better
oxide coating over the pristine CNTs. SiO2 NTs containing transition metal ions
have also been prepared which show potentials in catalysis.
2.2.3.3 CNT-TiO2 hybrids
TiO2 is of particular interest due to its excellent photocatalytic activity, relative
non-toxicity, and long-term thermodynamic stability. It has shown great potential
in the field of environmental protection, including water and air purification 201-203,
gas sensing 204-206 and dye-sensitized solar cells (DSSCs) 207,208. Following on
from the pioneer work on the photocatalytic water splitting reported by Fujishima

64
and Honda in 1972 209, the photocatalytic properties of TiO2 have been widely
used to convert solar energy into chemical energy in the form of hydrogen 210, 211
and hydrocarbons 212. The photocatalytic degradation of organic pollutants such
as phenol 213, acetaldehyde 214 and methylene blue dye 215 by TiO2 has also been
extensively studied.
The photocatalytic properties of TiO2 are derived from the formation of
photogenerated electrons and holes which occurs upon irradiation of UV light
with energy greater than the band gap of TiO2 (Figure 2.13)216 .The
photogenerated holes in the valence band diffuse to the TiO2 surface and react
with the adsorbed water molecules, forming hydroxyl radicals (•OH). The
photogenerated holes and the hydroxyl radicals oxidize nearby organic molecules
on the TiO2 surface. Meanwhile, the photogenerated electrons in the conduction
band participate in the reduction processes, which are typically reacted with
molecular oxygen in the air to produce superoxide radical anions (O2− •).
Figure 2.13 Mechanism of photocatalysis on the surface of TiO2 in presence of UV
radiation. 216
Factors incuding specific surface area, pore volume, pore structure, and
crystalline phase could significantly affect the photocatalytic performance of
TiO2. Nanostructured TiO2 materials offer higher specific surface area and show
enhanced sensitivity, electronic conductivity and photovoltaic activity. Both
anatase and rutile phases have been widely used as white pigments with anatase
showing greater potential in photocatalysis due to its higher photocatalytic

65
activity. Whilst rutile phase possesses a higher absorbance property and refrective
index which facilitate their use as sunscreens.
One of the widest uses of TiO2 in functional applications is in dye sensitized solar
cells (DSSCs). DSSCs are based on the photo-injection of electrons from dye
molecules into a wide band gap semiconductor and holes transport by a redox
electrolyte. Until now the most efficient DSSCs are still based on TiO2 electrodes.
The anodes of a typical Grätzel-type DSSC are usually constructed from
nanoporous dye-sensitized nanoparticulate TiO2 films (Figure 2.14) 217 which
could drastically enhance the solar energy conversion efficiency due to their high
surface area 218. Currently, the highest power conversion efficiency achieved for
DSSCs is up to 12% 219.
Figure 2.14 Schematic representation of a dye-sensitized solar cell based on
particulate TiO2. 217
However, the nanoparticulate structure is not optimized to carry electrons from
the injection site at the particle surfaces towards the anode. In contrast, the 1D

66
nanostructures, especially the nanotubular structures, allow for direct conduction
paths (Figure 2.15) 220,221 which is favorable for photocatalytic reactions.
Figure 2.15 Schematic representation of the electron path through a (a) percolated
and (b) oriented nanostructure. 220
CNTs act as good support materials for photocatalyst particles due to their high
mechanical and chemical stability as well as their mesoporous nature which
favors the diffusion of reacting species.
Taking advantage of the superb conductivity of CNTs, we may expect that the
combination of CNTs with TiO2 may produce interesting charge-transfer
behavior and further enhance the photocatalytic activity of TiO2. A considerable
progress has been made so far in the fabrication and application of these
promising hybrid materials and a few examples are worth noticing. For instance,
by coupling SWNTs with TiO2 in a photovoltaic device, the photo-conversion
efficiency was largely enhanced from 7% for the pure TiO2 to 15% for the hybrids 222.
This was attributed to the beneficial role of SWNTs as conducting scaffold to
collect and direct the flow of photogenerated electrons in nanostructured
semiconductor films thus considerably lower the probability of recombination
(Figure 2.16).
(a) (b)
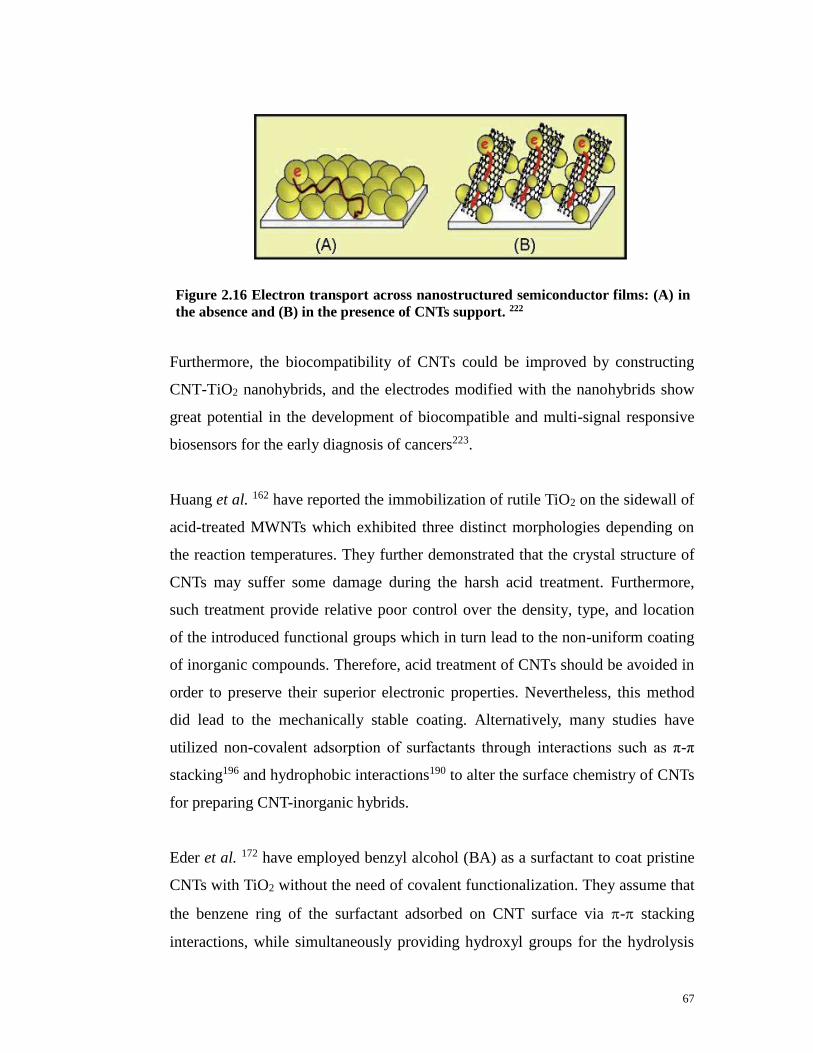
67
Furthermore, the biocompatibility of CNTs could be improved by constructing
CNT-TiO2 nanohybrids, and the electrodes modified with the nanohybrids show
great potential in the development of biocompatible and multi-signal responsive
biosensors for the early diagnosis of cancers223.
Huang et al. 162 have reported the immobilization of rutile TiO2 on the sidewall of
acid-treated MWNTs which exhibited three distinct morphologies depending on
the reaction temperatures. They further demonstrated that the crystal structure of
CNTs may suffer some damage during the harsh acid treatment. Furthermore,
such treatment provide relative poor control over the density, type, and location
of the introduced functional groups which in turn lead to the non-uniform coating
of inorganic compounds. Therefore, acid treatment of CNTs should be avoided in
order to preserve their superior electronic properties. Nevertheless, this method
did lead to the mechanically stable coating. Alternatively, many studies have
utilized non-covalent adsorption of surfactants through interactions such as π-π
stacking196 and hydrophobic interactions190 to alter the surface chemistry of CNTs
for preparing CNT-inorganic hybrids.
Eder et al. 172 have employed benzyl alcohol (BA) as a surfactant to coat pristine
CNTs with TiO2 without the need of covalent functionalization. They assume that
the benzene ring of the surfactant adsorbed on CNT surface via - stacking
interactions, while simultaneously providing hydroxyl groups for the hydrolysis
Figure 2.16 Electron transport across nanostructured semiconductor films: (A) in
the absence and (B) in the presence of CNTs support. 222

68
of the titanium precursor (Figure 2.17Left). The hypothesis is further confirmed
by the molecular dynamics simulation 224 which showed that the phenyl rings in
the BA favour an orientation parallel to the graphene sheet enabling π-π stacking.
Furthermore, the presence of BA was also found to strongly affect both the
crystallization and phase transformation by providing very small and uniform
anatase and rutile nanocrystals (Figure 2.17Right). However, BA also tended to
retard the phase transformation due to the formation of a carbon coating on TiO2
upon heating in argon. They further showed that the TiO2 coating catalyzed the
oxidation of CNTs via a Mars–van Krevelen mechanism, thus reducing the
required oxidation temperature by about 120 °C 160.
Figure 2.17. Left: Scheme of the beneficial role of benzyl alcohol (BA) in the in situ
coating of pristine CNTs with TiO2. One possible conformation of two BA molecules
on the CNT surface is shown in Scheme. Right: SEM images of TiO2 on CNTs after
conversion from anatase to rutile: A) no BA and B) with BA. 172
Both silica and titania coatings on SWNTs were achieved by templating a
multifunctional peptide P1R5 modified SWNTs, where the R5 peptide repeat unit
of silaffin that is involved in diatom biosilicification is capable of precipitating
silica from the hydrolyzed silica precursors at room temperature 91. The dual role
of the peptides has been demonstrated as: (1) to not only suspend SWNTs in
solution (2) but also direct the deposition of silica and titania at the surface of
CNTs. Electron microscopy analysis showed that SWNTs were embedded within
silica and TiO2 matrix rather than individually coated, and that the precipitation
reaction led to agglomeration of SWNTs.

69
2.2.3.4 Inorganic nanotubes
The inorganic NTs can be prepared by calcination of the corresponding
CNT-inorganic nanohybrids to remove CNT templates 200. The major advantage
of template-assisted sol-gel technique is that it allows ready control over the
dimension of the synthesized inorganic NTs by the size of the CNT templates and
by adjusting the reaction conditions, such as reaction time 151, reaction
composition, and the choice of metal precursor 160.
Previous study has demonstrated that the presence of inorganic coating could
affect the oxidation stability of CNTs, which can be utilized for the production of
inorganic nanotubes. A wide range of oxide NTs have been produced using CNTs
as templates, including V2O5 200,225, SiO2
197,200, Al2O3 200, RuO2
226, Fe2O3 227 and
TiO2 160, 228, 229. Their tubular morphology has facilitated their application in gas
sensing and photocatalysis.
Among the inorganic NTs, TiO2 nanotubes are of special interest. Several recent
studies have demonstrated the improved properties of TiO2 NTs compared with
colloidal and other forms of TiO2 for applications in photocatalysis 155, 230-232,
sensing233, dye-sensitized solar cells 234 and photovoltaics 234. Their improved
performance was generally attributed to the high specific surface area 231,235, the
high electron transfer 234 and ready access to the reactants provided by the tubular
structures 229. However, Bouazza et al. 236 have demonstrated the higher
photocatalytic activity of CNT-TiO2 hybrids over TiO2 NTs for the oxidation of
propene at low concentration which was attributed to the synergistic role of
CNTs.
Adachi et al. 237 have reported the synthesis of single-crystalline TiO2 nanotubes
using templates formed by LAHC/TIPT with an ACA system. The dye-sensitized
solar cells based on these NTs showed more than double the short-circuit current
density than those made of TiO2 nanoparticles in the thin-film thickness region.
This was attributed to the high electron transfer through single-crystalline TiO2

70
nanotubes compared to that through nanoporous TiO2 films composed of
nanoparticles. The photoconversion efficiency of the TiO2 nanotube cells was
around 5%. They also showed the highest photocatalytic activity compared to the
commercially available nanocrystalline TiO2 particles 234.
TiO2 NTs can also act as supports for metal nanoparticles 229, which shows great
potential for both sensing 238 and catalytic applications 239. Grimes et al. 233
reported the use of TiO2 NTs coated with palladium particles lead to a 1000 fold
higher sensitivity for sensing small H2 concentration in the atmosphere, compared
to particle-based substrate. Not simply surface area but the NT morphology that is
responsible for this unprecedented sensitivity. Meng et al. 240 have employed
Pt-TiO2 nanotube hybrid electrodes for methanol oxidation which showed a much
enhanced electrocatalytic activity compared with that of pure Pt electrode. Su et
al. 241 studied the effect of the structure on the photocatalytic activity of Pt-doped
TiO2 nanotubes. They showed that Pt-doped TiO2 nanotubes with longer length
exhibited higher photocatalytic activity for the degradation of methyl orange
under UV and visible irradiation. Yu et al. 242 also demonstrated the potential of
TiO2 nanotube-supported Pt as catalyst for CO2 recycling and methane
production. Sato et al. 243 investigated the catalytic behavior of Pt/TiO2-NTs for
the water gas shift as well as the hydrogenation of CO. The observed catalytic
activities were two to three times higher compared to the conventional
impregnated Pt/TiO2 catalysts.
Vertically aligned TiO2 NT arrays have been demonstrated to significantly
accelerate the growth rate of osteoblast cells 244. Enzymes have been successfully
immobilized to the inside walls of the TiO2 NT arrays and it was shown to retain
its catalytic activity for a minimum of 4 days 245. The highly aligned TiO2 NT
arrays were initially synthesized through hydrothermal treatment of TiO2 particles
in concentrated NaOH solution at temperatures above 110 °C 246-248. However, the
strongly basic condition as well as the elevated reaction temperature are not
environmental friendly. Therefore, methods such as anodization of titanium films
71
249-252 and sol–gel templating of porous alumina membrane253-256 were developed
for the fabrication of highly ordered TiO2 NT arrays.
The anodization route requires specialized setup and cost extra energy. The length
of the resultant nanotube array was limited to ~500 nm in the aqueous electrolyte
249 and significantly longer tubes were achieved in the non-aqueous electrolytes
257-259. However, the synthesized NT exhibited an uneven surface with rings
present on the outer walls periodically 233, 249 and extra chemical etching is
required to remove the barrier layer 260.
On the other hand, the template-directed routes have the advantage of producing
TiO2 NT arrays with tunable diameter and length compared with the
electrochemical anodization. Sander et al. have prepared aligned TiO2 NT arrays
with well controlled dimensions by atomic layer deposition (ALD) of TiO2 within
a porous alumina membrane. The production of porous alumina membrane
templates requires anodization of Al film followed by chemical etching 261.
Besides, the TiO2 overlayer must be removed by mechanical polishing prior to
etching away the alumina template 253. Another limitation reported for such
template is that due to the weak driving force, direct filling of the nanosized pores
is very difficult 262. Therefore, such method failed to produce nanofibers with
diameters <50 nm. To overcome this problem, Miao et al. 263 employed an
electrochemically induced sol-gel method to prepare TiO2 single-crystalline
nanowire arrays with diameters ranging from 10 to 40 nm.
Sol-gel template method also allows the growth of superlong NTs which is key to
achieve improved photocatalytic efficiency 264. Zhao et al.265 reported the
production of millimeter long aligned TiO2/CNT arrays via electrodeposition
using superlong CNTs as templates which were prepared by CVD method. The
resultant TiO2/CNT coaxial arrays exhibited minimized recombination of
photoinduced electron–hole pairs and fast photocurrent responses. This study
establishes the base for the synthesis of super-long TiO2 NT arrays.

72
2.3 peptide self-assembly and mineralization
2.3.1 Introduction
Molecular self-assembly is a powerful “bottom-up” approach for fabricating
nanoscale architectures, for example in nature, ribosomal proteins and RNA
coalesce into functional ribosomes. Molecular self-assembly is mediated by weak,
non-covalent bonds-notably hydrogen bonds, ionic bonds (electrostatic
interactions), hydrophobic interactions, van der Waals interactions and
water-mediated hydrogen bonds. Amongst all the self-assembling biomolecules,
peptides represent the most favorable building blocks for the design and synthesis
of nanostructures because they offer a great diversity of chemical and physical
properties.
2.3.2 Strategies for peptide self-assembly
There are two general categories into which designed self assembling peptide
systems fall, natural and non-natural. The first category utilises the basic
conformational units of naturally existing proteins, β-sheets and turns, α-helices
and coiled coils. Through the examination of protein sequences it has been
possible to derive simple rules that promote the formation of one of the basic
conformational units. The second category covalently links amino acids to other
molecules; either an alkyl chain to form a peptide amphiphile (PA), or to an
aromatic group to create π–π interactions between the aromatic groups.
2.3.2.1 β-sheets and α helices
β-sheets consist of multiple peptide chains that have an extended backbone
connected laterally by hydrogen bonds between the backbone amides and
carbonyls. β-sheets can be orientated so that all of the N-termini of successive
strands are oriented in the same direction, described as a parallel structure, or so
that the successive β strands alternate directions, described as an anti-parallel

73
structure. This has an important impact on the orientation of hydrogen bonds
between sheets and side chain orientations and interactions. For example, Aggeli
et al. 266 reported the hierarchical self-assembly of chiral rod-like molecules as a
model for peptide β-sheet tapes, ribbons, fibrils, and fibres, all of which vary in
the number of sheets that pack together to form the final structure.
Different from “infinitely” assembling systems such as self-assembled
monolayers (2D) and nanofibres (1D), finitely assembling systems in which all
dimensions of assembly are controlled can be prepared through the utilization of
“molecular frustration” in which two or more components of the assembler have
opposing preferences for solvation environment, attraction versus repulsion, or
compact and ordered packing versus disordered packing267-270. Dong et al. 271
described a multidomain peptide (MDP) which utilized molecular frustration to
control the length of the self-assembled nanofibres (Figure 2.18). The peptides
are organized into an ABA block motif in which the central B block is composed
of alternating hydrophilic and hydrophobic amino acids (glutamine and leucine,
respectively) which allows the amino acid side chains to segregate on opposite
sides of the peptide backbone when it is in a fully extended β-sheet conformation.
In water, packing between two such peptides stabilizes the extended
conformation by satisfying the desire of the leucine side chains to exclude
themselves from the aqueous environment. An intermolecular β-sheet
hydrogen-bonding network can then be created between two or more pairs of
these peptides eventually growing into long fibres. Flanking Block A consists of a
variable number of positively charged lysine residues whose electrostatic
repulsion works against the desire of B block to assemble. By balancing the
forces of block A against B, it is found that at neutral pH, K2(QL)6K2 can
self-assembles into β-sheets which are soluble in water. This observation is rare
among peptides that form β-sheet assemblies which tend to generate insoluble
materials. This architectural motif may be utilized for novel tissue regeneration
strategies and other systems which require control over chemical organization at
the nanoscale.

74
Figure 2.18 (a) Primary structures of the K2 and (QL)6 series of peptides showing
the comparative domain size. (b) Proposed model of nanofibre self-assembly
indicating hydrophobic packing region, axis of hydrogen bonding, and repulsive
positive charges. 271
Another design rule that derived by copying nature are α-helices which for the
purpose of self-assembly are used as components of coiled coils272, 273. The
Wolfson group274 has demonstrated a design of an extended coiled-coil fibre
based system using sticky “end” assembly (Figure 2.19). A heterodimeric parallel
coiled coil SAF-p1 (Self-Assembling Fibre Peptide 1) and SAF-p2
(Self-Assembling Fibre Peptide 2) was designed to have a staggered hydrophobic
interface. Due to the staggered nature of the system a peptide overhang or “sticky
end” is available to form a coiled-coil interface with another peptide and so
propagate the structure along the long axis of the coiled-coil. Electron
microscopic observation revealed a much thicker fibre than expected which was
due to the lateral association between the coiled coils.
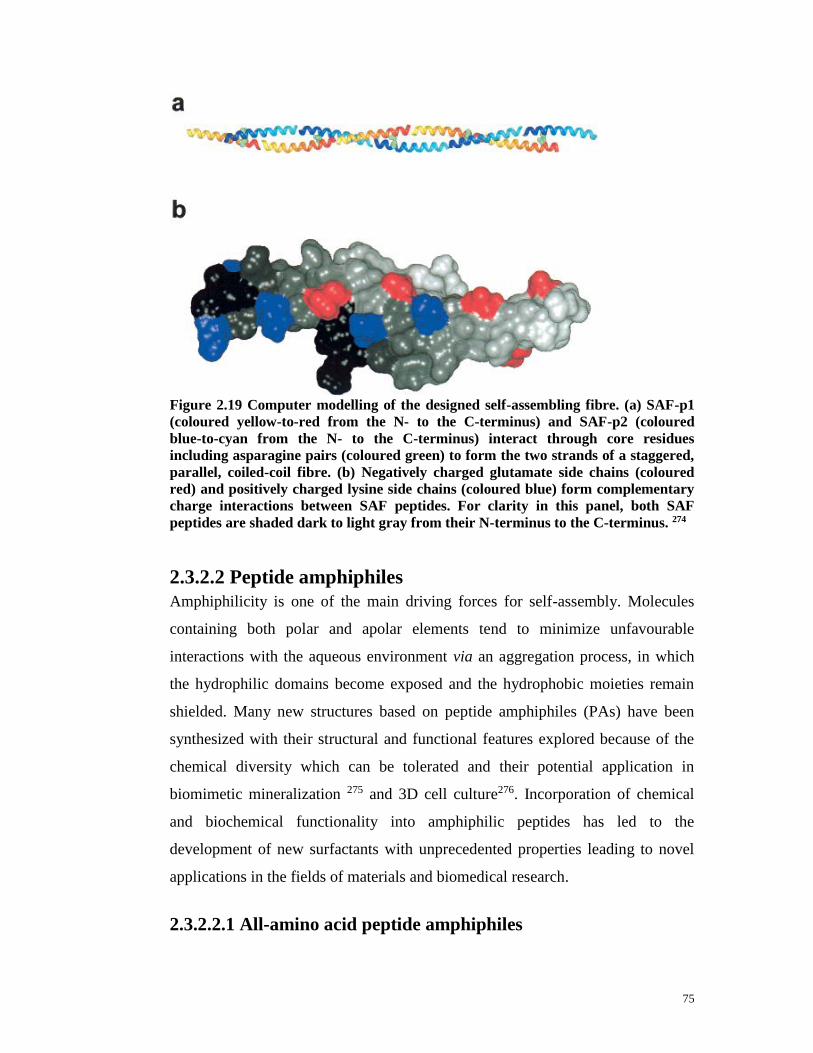
75
Figure 2.19 Computer modelling of the designed self-assembling fibre. (a) SAF-p1
(coloured yellow-to-red from the N- to the C-terminus) and SAF-p2 (coloured
blue-to-cyan from the N- to the C-terminus) interact through core residues
including asparagine pairs (coloured green) to form the two strands of a staggered,
parallel, coiled-coil fibre. (b) Negatively charged glutamate side chains (coloured
red) and positively charged lysine side chains (coloured blue) form complementary
charge interactions between SAF peptides. For clarity in this panel, both SAF
peptides are shaded dark to light gray from their N-terminus to the C-terminus. 274
2.3.2.2 Peptide amphiphiles
Amphiphilicity is one of the main driving forces for self-assembly. Molecules
containing both polar and apolar elements tend to minimize unfavourable
interactions with the aqueous environment via an aggregation process, in which
the hydrophilic domains become exposed and the hydrophobic moieties remain
shielded. Many new structures based on peptide amphiphiles (PAs) have been
synthesized with their structural and functional features explored because of the
chemical diversity which can be tolerated and their potential application in
biomimetic mineralization 275 and 3D cell culture276. Incorporation of chemical
and biochemical functionality into amphiphilic peptides has led to the
development of new surfactants with unprecedented properties leading to novel
applications in the fields of materials and biomedical research.
2.3.2.2.1 All-amino acid peptide amphiphiles

76
An important class of amphiphilic peptides is amphipathic sequences. These
sequences constitute solely of amino acids and are comprised of both
hydrophobic and hydrophilic domains when the peptide is appropriately folded. A
number of toxins like magainins277 and antibiotics such as Gramicidin S278 belong
to this class of peptide amphiphiles. To obtain a better understanding of their
assembly behaviour, research has focused on the design of all-amino acid based
amphiphilic model compounds.
Vauthey et al.279 designed a class of amphiphilic surfactant-like peptides with a
hydrophilic head group of negatively charged aspartic acid (D) at the C terminus,
thus containing two negative charges (one from the side chain carboxyl group and
the other from the C terminus) and a lipophilic tail made of hydrophobic amino
acids such as alanine (A), valine (V), or leucine (L). The N terminus is acetylated,
making it uncharged. When dissolved in water, these surfactant-like peptides tend
to self-assemble to isolate the hydrophobic tail from contact with water. Similar
to lipids and fatty acids, the supramolecular structure is characterized by the
formation of a polar interface that sequesters the hydrophobic tail from water.
(Figure 2.20)

77
Figure 2.20 Potential pathway of V6D peptide nanotube formation. Each peptide
monomer is 2 nm, and the diameter of the modeled bilayer nanotube is 50 nm. Red,
hydrophilic head; blue, hydrophobic tail. Each peptide may interact with one
another to form closed rings, which in turn stack on top of one another ultimately
yielding a nanotube. Three nanotubes are connected to each other through a
three-way junction.279
Another class of self assembling peptide is comprised of alternating hydrophobic
and hydrophilic moieties. Zhang et al.280 have described previously a class of
ionic self-complementary peptide with the sequence
(Ala-Glu-Ala-Glu-Ala-Lys-Ala-Lys)2 that spontaneously assembled to form
macroscopic membrane upon the addition of salt. The alternating hydrophilic and
hydrophobic sequence has a tendency to form an unusually stable β sheet
structure in water. When the peptides form a β sheet, they exhibit two surfaces, a

78
hydrophilic surface consisting of charged ionic side chains and a hydrophobic
surface with hydrophobic side chains. As a result, the self-assembly of these
peptides is facilitated by electrostatic interactions on one side and the
hydrophobic interaction on the other, in addition to the conventional β sheet
hydrogen bond along the backbones.
2.3.2.2.2 Lipidated peptides
The second category of peptide amphiphiles is constituted by hydrophilic peptide
sequences coupled to hydrophobic alkyl chains. It has been found that for many
single tail PAs the self-assembly leads to the formation of nanofibres which are
structurally similar to cylindrical micelles, in which the hydrophobic tails pack in
the core of the fibre while the hydrophilic peptide is displayed on the fibre’s
surface.
Since the discovery of these fibre forming PAs, their self-assembly process was
thought to occur mainly as a result of the hydrophobic interactions between
aliphatic carbon tails281. However, the work done by Paramonov et al.282
highlighted the importance of hydrogen bonding in addition to hydrophobic
packing for the stability of the nanofibres (Figure 2.21). They employed a series
of N-methylated PA molecules and it was found that blocking hydrogen bonding
in the first four amino acids after the alkyl tail prevented the gel formation and
resulted in the spherical micelles. While preventing hydrogen bonding of the
outer amino acids appeared to have little effect on the formation of a gel and thus
the molecular structure. The CD and FT-IR results suggested that the four amino
acids located in the interior of a nanofibre formed hydrogen bonds which
resemble parallel β-sheet-type interactions, while the amino acids situated on the
outer regions was able to adopt a variety of configurations.

79
Figure 2.21 (A) chemical structure of a PA which includes three distinct regions: a
hydrophobic alkyl tail, a glycine containing region, and a charged head group. (B)
Three-dimensional representation of the regions within the PA nanofibre. Region (a)
is the hydrophobic core composed of aliphatic tails. Region (b) is the critical β-sheet
hydrogen bonding portion of the peptide. Region (c) is the peripheral peptide region
which is not constrained to a particular hydrogen bonding motif and forms the
interface with the environment. 282
2.3.2.3 Aromatic short peptide derivatives
In the systems described above, the peptide chains usually contain at least ten
amino acids. However, much smaller peptides can be used by attaching aromatic
components to the peptides to take advantage of π-stacking interactions283-287.
Reches and Gazit have previously described the self-assembly of the aromatic
dipeptides FF (Phe-Phe) into straight nanotubes through π stacking288. Xu and
coworkers 289-291 were the first to report that certain Fmoc protected amino acid
and dipeptides can also spontaneously form fibrous scaffolds. The self-assembly
was triggered by enzymatic dephosphorolation of Fmoc-Yp which does not
self-assemble due to electrostatic repulsion by the charged phosphate groups. The
spectroscopic studies provide evidence for the possible molecular arrangements
in the hydrogel. The fluorenyl group stacked with both phenyl group and
themselves (in both antiparallel and parallel fashion) through π-π interactions
(Figure 2.22), which facilitate the formation of supramolecular polymers.
Self-assembly
A
B

80
Figure 2.22 Some of the possible modes of π-π interactions that contribute to the
emissions in the gel phase. 289
Recently Jayawarna et al.276 proposed a novel molecular architecture based on the
self assembly of Fmoc-FF. Smith et al.292 constructed a model of the
supramolecular structure based on a number of spectroscopic characterizations.
The proposed model accounts for the observed β-sheet signals for the peptide
portion of the molecule and the fluorescence signal from the aromatic portion of
the molecule. According to this model, the peptides are arranged as an
anti-parallel arrangement of β-sheets with the Fmoc groups acting like a zipper to
bring neighbouring sheets together, and because of the twist introduced by the
β-sheet structure the neighbouring sheets are rotated in relation to one another
creating a cylindrical structure (Figure 2.23A). These cylinders then line up
side-by-side to form a flat ribbon as observed through TEM. (Figure 2.23B) This
example and other closely related aromatic short peptide derivatives that are
known to form fibrous hydrogels have found applications in biological sensing 283
and 3D cell culture286.

81
Figure 2.23 (A) A model structure was created of Fmoc-FF peptides arranged into
an anti-parallel β-sheet pattern (i) which then come together through π–π
interactions between the Fmoc groups (in orange) (ii) like a zipper to create a
cylindrical structure (iii & iv) (B) TEM image of the Fmoc-FF hydrogels composed
of flat ribbons made up of side-by-side packing of the fibrils. 292
2.3.3 Controlled self-assembly of peptides
A major challenge in molecular self-assembly is to control the self-assembly
process. Many single or multi-component systems suffer from the problem that as
soon as the material is placed into water or buffer, self-assembly is initiated.
Therefore, there is major interest in developing systems that assemble on demand.
So far, several ways have been applied to trigger self-assembly including changes
in ionic strength, pH, and temperature, light stimulus, and addition of certain
chemical entities.291, 293-301
2.3.3.1 PH/ionic strength triggered
Application of pH switch is possibly the simplest way of inducing peptide self
assembly through the elimination or reduction of the net charges presented on the
peptide molecules. A number of designed peptides are inherently pH sensitive
due to the incorporation of amino acids with ionic side chains and thus their self
assembly behaviour is, in part, governed by the pH in relation to the pKa values
A B

82
of the amino acid residues. Besides, raising the ionic strength of a solution will
also achieve the same outcomes via shielding the electrostatic forces, therefore
removing pH responsiveness.302
2.3.3.2 Enzyme triggered
Enzymes have recently emerged as tools to control peptide self assembly under
physiological conditions by converting non-assembling precursors into
self-assembling building blocks under constant conditions of pH, ionic strength,
temperature. This has lead to their application in biomedical context.
Enzyme-assisted self assembly can be achieved either by catalysing the synthesis
of a self-assembly molecule303, or by removing a blocking group from a molecule
to allow assembly.
Xu and co-workers 289 reported the first example of an enzymatically driven
self-assembly process. They used alkaline phosphatase to remove a charged,
hydrophilic phosphate group from Fmoc-tyrosine phosphate to induce
hydrogelation. Based on this work, they further described the use of a
phosphatase to trigger the self-assembly of a derivative of β-amino acid, resulting
in the formation of supramolecular hydrogels, which exhibit excellent in vivo
biostability.304 Das et al.305 demonstrated two complementary enzymatic
approaches to prepare peptide nanomaterials based on aromatic short-peptide
derivatives: i) subtilisin-driven self-assembly via hydrolysis of Fmoc-peptide
methyl esters (Figure 2.24) and ii) thermolysin-driven self-assembly via amide
bond formation (reversed hydrolysis) of Fmoc-peptide-esters (Figure 2.25). The
morphology and dimensions of the nanostructures depend significantly on both
the route of self-assembly and the chemical nature of the building blocks.

83
Figure 2.24 (A) Suspension of Fmoc-Leu2-OMe and inversion of glass vial
demonstrates self-supporting gel formation of Fmoc-Leu2 after ester hydrolysis
using subtilisin (Entry 1). (B) Proposed mechanism of Fmoc-peptide ester
hydrolysis that self-assembles to form higher-order aggregates through π–π
interlocked β-sheets. 305
Figure 2.25 Solutions of Fmoc-Thr-OH and Leu-OMe. The inversion of the glass
vial demonstrates self-supporting gel formation of Fmoc-Thr-Leu-OMe via
reversed hydrolysis by thermolysin (entry 6). 305
A reversible system using two enzymes, kinase and phosphatase that catalyse
opposite reactions of phosphorylation and dephosphorylation respectively, was
demonstrated by Xu and coworkers.306 The peptide hydrogelator used is a
naphthalene linked to FFGEY (Nap-FFGEY, Figure 2.26i) which forms gel in
water (Figure 2.26iii (A)). Adding a kinase to the hydrogel induces a gel-sol
phase transition (Figure 2.26iii (B)) in the presence of adenosine triphosphates
(B)
(A)

84
(ATP) since the tyrosine residue is converted into tyrosine phosphate and further
treating the resulting solution with a phosphatase removes the phosphate group
(Figure 2.26ii) and restores the hydrogel (Figure 2.26iii (C)). This biomimetic
approach promises a new way to regulate the state and properties of
supramolecular hydrogels.
Figure 2.26 (i) Chemical structure of Nap-FFGEY. (ii) Reversible modification of
the peptide gelator by a phosphatase/kinase reaction. (iii) Optical images of (A) gel
formed initially (B) the solution obtained after adding a kinase to A (C) gel restored
after adding a phosphatase to B. 306
2.3.4 Mineralization
2.3.4.1 Biomineralization Biomineralization is the process by which living organisms produce minerals,
such as those found in mollusk shells,307,308 sea urchin spine,309,310 teeth311 and
diatom cell walls312. Natural mineralization creates the most intricately stunning
inorganic structures and in marked contrast to anthropogenic and geological
syntheses of minerals which typically require elevated temperatures or extremes
of pH, living systems produce such exquisite structures under mild physiological
conditions of ambient temperatures and near-neutral pH. Bone is a particular
complex example in which collagen molecules serve as nucleation sites for
(i) (ii)
(iii)
85
oriented crystals of hydroxyapatite (HA). The collagen fibrils are formed by
self-assembly of collagen triple helices and the HA crystals grow within these
fibrils in such a way that their c axes are oriented along the long axes of the fibrils
resulting in the excellent mechanical properties of bones.313
Such a high degree of organization is achieved, in part, through the presence of
organic macromolecules, which control many aspects of the mineralization
process, including crystal nucleation and growth.314 Therefore, understanding the
design of the biological macromolecules is vital to achieve the same outcome in
vitro.
Recent investigation of the mechanisms governing the biological synthesis of
silica in a marine sponge Tethya aurantia led to the surprising discovery that this
process is catalysed by a protein called silicateins (for silica proteins), which are
the subunits constituting the central protein filament (1–2 mm in length and 2 um
in diameter). These axial filaments of protein are occluded within the silica
spicules (1–2mm in length and 30 um in diameter) which account for 75% of the
dry weight of the organism. Characterization of silicatein α (the principal subunit
comprising nearly 70% of the mass of the filaments) and its cloned DNA
indicated that it is highly homologous to members of the cathepsin L subfamily of
the papain family of proteases, including similarities between their amino acid
sequences and three-dimensional structures. Besides, of the three residues of the
“catalytic triad” of the cathepsin active site, two, His (imidazole side chain) and
Asn, are conserved in silicatein α, but the third active-site residue in cathepsin,
Cys (sulfhydryl side chain), is replaced in silicatein α by Ser-26 (hydroxyl side
chain). At this position, the structure of silicatein α resembles that of the serine
proteases315.
Cha et al. 316 have demonstrated that the silicatein filaments and their constituent
subunits that were isolated from the sponge could catalyze the hydrolysis and
direct the polymerization of silica and silicone polymer networks both chemically
and spatially in vitro, under conditions at ambient temperatures, pressure and

86
neutral pH. Based on the structural homology between silicateins and the
corresponding proteases and that both the condensation of silicon alkoxides
promoted by the silicateins and the cleavage of peptides catalyzed by the
proteases must proceed through an obligatory hydrolysis reaction, and that both
are known to be accelerated by general acid–base catalysis, the author suggested
that silicatein α catalyzes the siloxane polymerization reaction through the
activity of the serine and histidine side chains that occupy positions
corresponding to the catalytically active, functionally related side chains in the
proteolytic enzymes of both the cathepsin L (cysteine - histidine) and
trypsin/chymotrypsin (serine-histidine) types. This was further supported by the
subsequent site-directed mutagenesis studies which confirmed the requirement for
both Ser-26 and His-165 residues to present at the active site of silicatein α for
efficient catalysis of alkoxysilane polycondensation at neutral pH. Besides, the
catalytic efficiency is also dependent on the precise three-dimensional
conformation of the native protein 317. Such a mechanism is illustrated in Figure
2.27 This mechanism may be harnessed for the development of environmentally
benign routes to the synthesis of patterned silicon-based materials.
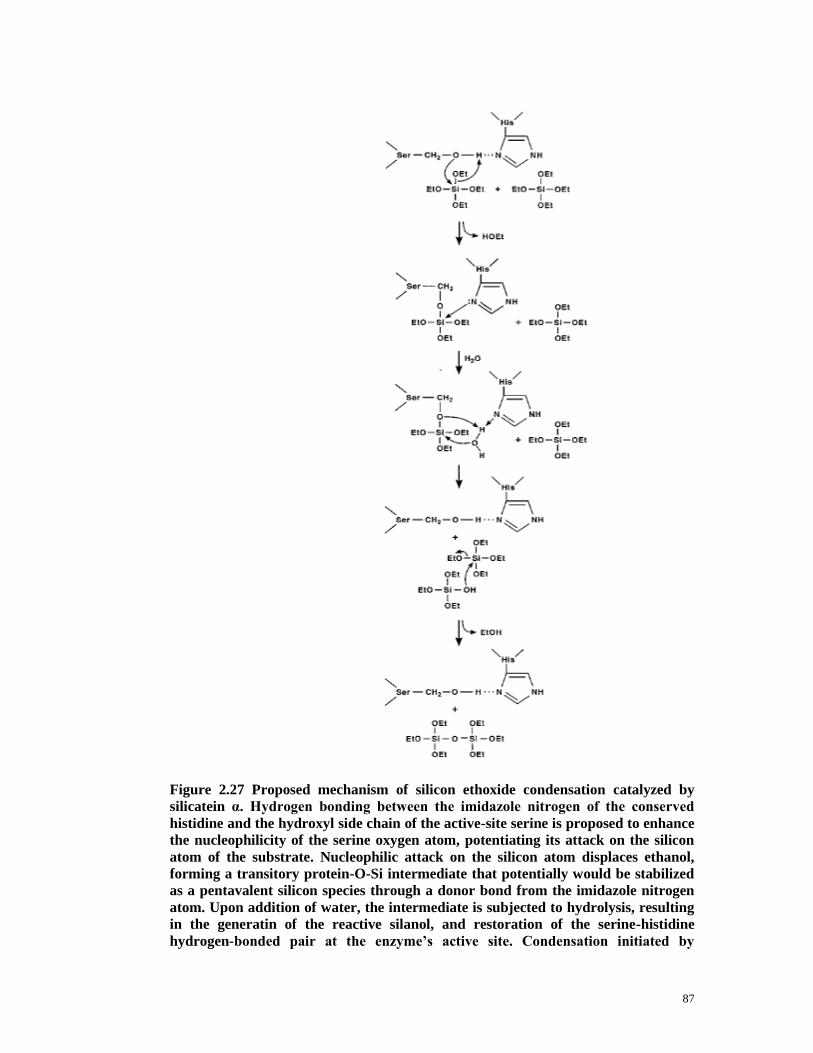
87
Figure 2.27 Proposed mechanism of silicon ethoxide condensation catalyzed by
silicatein α. Hydrogen bonding between the imidazole nitrogen of the conserved
histidine and the hydroxyl side chain of the active-site serine is proposed to enhance
the nucleophilicity of the serine oxygen atom, potentiating its attack on the silicon
atom of the substrate. Nucleophilic attack on the silicon atom displaces ethanol,
forming a transitory protein-O-Si intermediate that potentially would be stabilized
as a pentavalent silicon species through a donor bond from the imidazole nitrogen
atom. Upon addition of water, the intermediate is subjected to hydrolysis, resulting
in the generatin of the reactive silanol, and restoration of the serine-histidine
hydrogen-bonded pair at the enzyme’s active site. Condensation initiated by

88
nucleophilic attack of the released Si-O- on the silicon of the second substrate
molecule then forms the disiloxane product. 316
Hecky et al. 318 have studied the amino acid composition of the diatom cell-wall
protein which serves as the template for silica deposition. It was found to be
enriched in serine plus threonine (hydroxyl-containing amino acids), suggesting
that the hydroxyl group may mediate the silicification process in the diatom
cell-wall. The function proposed for the template protein is presented
schematically in Figure 2.28. The protein template presents a layer of hydroxyl
groups which can undergo condensation reactions with silicic acid molecules.
The initial layer of condensed silicic acid will then be held fixed to the protein
template, in a geometric arrangement that will favour further polymerization of
silicic acid to form the silica-rich frustule. This is kinetically more favorable than
simply allowing the silicic acid molecules to come together by random collisions.
This proposed mechanism was further supported by the thermodynamic
calculations 319. Such a mechanism may also contribute to the biosilicification in
marine sponge.
Figure 2.28 Proposed condensation reaction between silicic acid and serine on the
protein template of the silicalemma. Water by-product may be eliminated or
structurally incorporated into the forming frustule through hydrogen bonding with
the oxygens of silica. 318
However, the simple density of hydroxyls alone is not sufficient for
polymerization of the silicon alkoxides as evidenced by the lack of activity of the
hydroxyl-rich cellulose and silk polymers. The conformation of such groups in
the silicatein molecule may also play an important role.
2.3.4.2 Biomimetic mineralization

89
The success of nature in creating such well-defined and precisely controlled
inorganic structures is a source of inspiration for creating synthetic counterparts,
especially at the nanoscale. Furthermore, there is a growing demand for benign
synthetic conditions that will minimize adverse environmental effects.
Inspired by these natural examples of silicification, several synthetic templates
including polyamines 320-323, polypeptides324-328, peptide-polymer hybrids329 and
self-assembled peptides330-332 have been demonstrated for mimicking the catalytic
activity of silicateins and silaffins under ambient conditions, yielding hybrid
materials with diverse morphologies depending on factors such as temperature
and pH of the reaction medium333. Cha et al.334 have reported the use of
self-assembled cysteine-lysine block copolypeptides as templates for the
production of mesoporous silica spheres and tightly packed silica columns. The
nucleophilic group of cysteine is shown to be essential for the hydrolysis of the
silicon alkoxide, while the protonated amine group of lysine promotes the
polycondensation and deposition of silica. Systematic substitution of residues
used in the construction of these peptides showed that the rate of catalysis was
proportional to the strength of nucleophilicity of the nucleophilic side chain.
Similarly, Yuwono and Hartgerink335 have demonstrated templating of silica by
cationic peptide amphiphiles, which are β-sheet forming peptides with alkyl chain
conjugated at the N-terminus.
Based on the finding of the conserved residues in the active site of silicatein, Roth
et al.336 have evaluated an array of bifunctional small molecules containing both
nucleophilic group (such as –SH or -OH) and hydrogen-bonding acceptor group
(primary or substituted amine) for their catalytic activity in the in vitro formation
of silica from silicon alkoxides at neutral pH and room temperature. Among the
tested molecules, cysteamine and ethanolamine show the highest catalytic activity
while lacking either one of the two functionalities leads to significantly reduced
catalytic activity. The resulting silica nanoparticles showed no higher ordered
structures indicating that the small molecules have little ability to attract and align

90
nuclei, but rather act as a catalyst for the hydrolysis of silica precursors. The
potential of the small molecule catalyzed sol-gel synthesis of silica in the area of
biomaterial encapsulation was further demonstrated for enzymes, fluorescent
proteins, and live cells. The benign reaction conditions help to preserve the
activities of these encapsulated biological materials. This study support that the
two functional groups in close proximity to each other are required for catalyzing
the hydrolysis of TEOS.
Morse et al. 334,337 have demonstrated that the hydroxyl or imidazole group alone
was not sufficient to catalyze the hydrolysis of TEOS, but rather capable of
catalyzing silicic acid condensation 326, 327. However, another study using TMOS
as silica precursor have observed silica formation in the presence of
poly-histidine. 327
The translation of the mechanism to a more robust synthetic system was further
developed using golden nanoparticles (GNPs) functionalized with the appropriate
nucleophilic (hydroxyl) and hydrogen bonding (imidazole) functionalities
respectively (Figure 2.29 (A), (B), (C))337. The combination of the two
populations was found to successfully mimic the catalytic activity of silicateins.
Significant catalytic activity was also observed when imidazole functionality was
replaced with a primary amine as the hydrogen-bonding acceptor. Replacement of
either of these functionalities by a non-reactive methyl group abolished the
catalysis in this synthetic system. TEM image of the silica product showed that
the GNPs were entrapped in the silica network and the SAED pattern indicated
the amorphous nature of the silica product (Figure 2.29D).
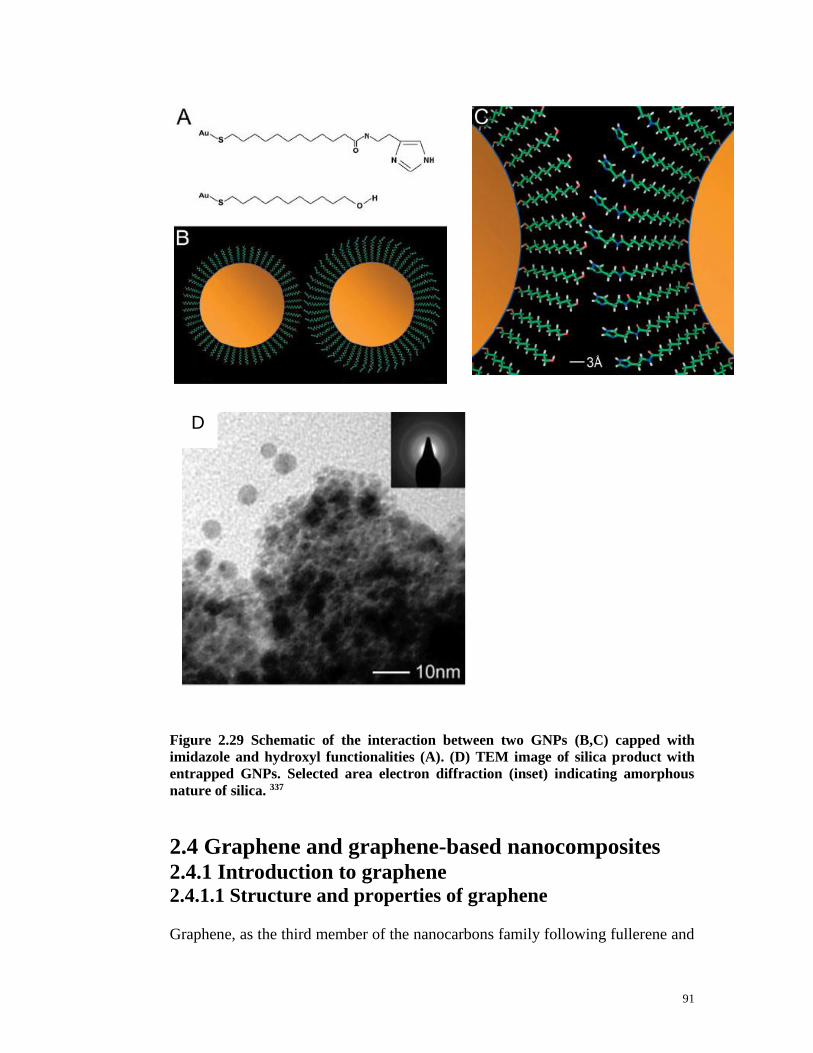
91
Figure 2.29 Schematic of the interaction between two GNPs (B,C) capped with
imidazole and hydroxyl functionalities (A). (D) TEM image of silica product with
entrapped GNPs. Selected area electron diffraction (inset) indicating amorphous
nature of silica. 337
2.4 Graphene and graphene-based nanocomposites 2.4.1 Introduction to graphene 2.4.1.1 Structure and properties of graphene
Graphene, as the third member of the nanocarbons family following fullerene and
D

92
CNTs, can be regarded as the basic constituent of graphitic systems (Figure 2.30) 338.
It consists of a single atom layers of carbon arranged in a hexagonal lattice. In the
graphene layers each carbon atom is trigonally bonded to the three nearest
neighbors by means of sp2 hybridized orbitals which form the strong covalent
C-C (σ) bonds. The overlap of the un-hybridized p-orbitals from each carbon
atom forms the delocalized π-bonds. The overlapping orbitals produce a fully
conjugated system, providing fast electron transfer within the layers.
Figure 2.30 Mother of all graphitic forms. Graphene is a 2D building material for
carbon materials of other dimensionalities. It can be wrapped up into 0D buckyballs
(left), rolled into 1D nanotubes (middle) or stacked into 3D graphite (right). 338
This 2D analogue of CNTs has recently received tremendous interest owing to its
exceptional properties 339. The electrons in high quality graphene move both
relativistically and ballistically with mobilities exceeding ~15,000 cm2 V-1 s-1 at
room temperature, which is faster by two orders of magnitude than that of Si 340
and is about an order of magnitude slower than that of CNTs. Graphene’s
outstanding mechanical stiffness (~1060 GPa) 341 and thermal conductivity
Graphene
93
(~3000 W m-1 K-1) 342 compete with the in-plane values for graphite. Their
biocompatibility 343 and extremely high specific surface area (up to 2600 m2/g) 344
which is larger than that of CNTs (> 1000 m2/g) makes it an attractive material
for a wide range of applications including next-generation nanoelectronic
devices345,346, photonic devices 347, catalyst supports 348, composite materials349,350,
drug delivery materials 351 and sensors 352,353. Additionally, the unique
combination of their optical transparency and excellent electricity and heat
conductivity makes them ideal for thin and flexible flatscreens and suitable for
replacing the ITO in photovoltaic cells.
Although graphene exhibit no advantages over CNTs, as for applications, there
are exciting fundamental effects which can be studied in graphene and may help
to understand the nanostructures in general and indirectly advance
nanotechnology. Furthermore, several studies have demonstrated that at low
nanofiller content graphene perform significantly better than CNTs in terms of
enhancing the mechanical properties of the nanocomposites 354. The superiority of
graphene platelets over CNTs in terms of mechanical properties enhancement is
mainly attributed to three distinct advantages of graphene: (1) their larger specific
surface area for considerably more contact with the matrix material than the
tube-shaped CNTs; (2) improved nanofiller-matrix adhesion benefiting from the
mechanical interlock of the wrinkled surface of graphene with the surrounding
matrix material; (3) the 2D geometry of graphene sheets are shown to be more
effective in suppressing crack propagation in polymers than the 1D
nanotubes354,355.
Du et al. 356 have demonstrated that the improving effect of graphene nanosheets
(GNSs) as conducting fillers on the electrical conductivity of their composites
was far lower than theoretically expected 357. GNS/high density polyethylene
(HDPE) composites showed much higher percolation threshold and lower
electrical conductivity than the MWNT/HDPE composites at the same filler
content. Regardless of the similar conductivity of the two fillers, these results can

94
be attributed to several reasons: (1) MWNTs were much easier to be isolatedly
dispersed within the HDPE matrix than GNSs; (2) the 2D structure of GNSs was
hardly to be maintained in the preparation of the composites; (3) the 2D GNSs
were not as effective as the 1D MWNTs in forming the conductive networks.
Therefore, to make a full use of the advantages of the 2D GNSs as conductive
fillers, measures such as the development of more effective composite
preparation techniques to avoid GNS rolling and aggregation and the construction
of the desired contact among GNSs are highly demanded.
While monolayer graphene attracts the most attention since their unusual
electronic band structure allows its carriers to behave as massless Dirac fermions,
there is also significant interest in few-layer graphene. Owing to their distinct
electronic band structures, AB-stacked bilayer 358 and trilayer 359 graphene have
extraordinary potential for next-generation optoelectronic and microprocessor
applications. However, the lack of bandgap for graphene significantly limits their
potential in electronics applications. Recently, great progress have been made on
the creation and precise tuning of a bandgap in bilayer graphene by applying a
vertical electric field 360-364 which introduce asymmetry into the bilayer structure,
thus leading to the formation of a bandgap. Trilayer graphene with ABC
crystallographic stacking was also reported to exhibit an induced bandgap under
the application of a perpendicular electric field 365. Single-layer graphene is
intrinsically semimetal, introducing an energy band gap requires patterning
nanometer-width graphene ribbons 366 or utilizing special substrates 367,368.
Furthermore, compared with monolayer, bilayer graphene has a lower electrical
noise and an intrinsic screening of the influence of trapped charges in the gate
dielectric. Such breakthrough opens up new possibility of bi and trilayer graphene
based electronics and photonics.
2.4.1.2 Production of graphene
Ever since its isolation in 2004 by mechanical cleavage of graphite 339, a wide
range of techniques have been reported for the synthesis of graphene. In general,

95
these techniques can be divided into ‘bottom-up’ and ‘top-down’ methods. The
bottom-up methods usually include epitaxial growth of graphene films on
single-crystal SiC 369,370 and chemical vapor deposition (CVD) on catalytic
metals371-373. These methods are not widely used because of their complexity,
limited scaling-up and high cost of the specialized fabrication systems. Large
scale production of high-quality graphene is usually achieved by the top-down
methods including liquid-phase exfoliation and thermal expansion of graphite 374.
Among these techniques, liquid phase exfoliation which includes the reduction of
exfoliated GO and sonication-assisted direct exfoliation of graphite in solution
are particularly attractive owing to their low cost and massive scalability 375,376.
They also facilitate the processing of graphene as well as offer the flexibility to
deposit them onto any desirable substrates. In addition, the reduction of GO
method benefits the further modification of graphene surface for the development
of functionalized graphene-based materials that hold huge potentials in energy
storage 377, catalysis, biosensing 378 and drug delivery 379. The advantages and
disadvantages of each of the methods were briefly reviewed below.
2.4.1.2.1 Micromechanical cleavage
Fabrication of graphene from graphite requires exfoliation of the individual layers.
This was originally achieved by micromechanical exfoliation, simply using
‘scotch tape’ to peel off micrometer-wide graphene sheet from HOPG 339.
Micromechanical cleavage produces the highest quality of graphene which are
suitable for fundamental studies. However, the extremely low productivity owing
to the manual effort combined with its high cost and failing to scale up for
commercially viable devices has considerably limit their practical applications.
2.4.1.2.2 Liquid phase exfoliation
Liquid phase exfoliation has been extensively developed in recent years for mass
production of graphene. Among the solution phase strategies, the most popular
route is the reduction of exfoliated GO to produce graphene-like nanosheets best
known as reduced graphene oxide (RGO) 375, 376. Three steps are commonly

96
involved (Figure 2.31): (1) Oxidation of graphite to hydrophilic graphite oxide in
which graphene basal planes are decorated with covalently bonded oxygen
functional groups. (2) The oxygenated graphite is exfoliated in aqueous solution
to give monolayer graphene oxide (GO). (3) Subsequently, GO nanosheets are
reduced chemically 375 or thermally 380 to partially restore the sp2- hybridized
network 381 to yield RGO or chemically converted graphene (CCG) 382.
The three routes that are typically employed for obtaining graphite oxide are the
Brodie383, Hummers’ 384 and Staudenmaier methods 385. The Hummers’ method is
the most commonly used due to its relatively short reaction time and absence of
hazardous gas during the synthesis. The GO suspension is indefinitely stable
owing to the polar nature of the functional groups introduced onto the graphene
sheets. Their good water dispersibility makes it easy to process them in aqueous
and polar solvents thus offers the convenience to cast thin films for various
technological advances 386. The presence of these oxygen-containing functional
groups not only renders GO good water solubility but also provides reactive sites
for the deposition of metal 387 and inorganic nanoparticles. GO is also the starting
material for most other chemically modified graphenes (CMGs), which are of
interest in their own right 388-390. GO is favorable for its tunable electronic and
chemical properties. Different degrees of oxidation 382 and species of oxygen
containing groups 391 would lead to a diverse energy gap and structure
distortion392, and thus cause different conductive and chemical properties of
graphene. TEM studies on GO revealed that the underlying carbon lattice
maintains the order and lattice spacings of graphene. It also shows that single GO
sheets are highly electron transparent and stable in the electron beam and
therefore ideal for use as TEM support films393.

97
Figure 2.31 Preparation of graphene by chemical reduction of GO synthesized by
Hummers’ method.
Although there is still much debate over the structure of GO (with uncertainty in
both the type and distribution of the oxygen-containing functional groups), the
most prevalent model currently appear to be 1, 2 epoxides and hydroxyls
distributed across the basal plane, with carboxyl groups at the edges
(Lerf–Klinowski model, Figure 2.32) 388. Studies have also demonstrated that the
fully oxidized GO has an atomic C/O ratio of roughly 2:1388.
(GO)

98
Figure 2.32 Schematic model of a GO sheet, with -COOH hanging on the edge and
-O- and –OH decorate the basal plane. 388
Recently, Wilson et al. 394 have proposed a new structure of GO by analogy with
oxidized CNTs. As shown in Figure 2.33, the GO comprises of oxidative debris
(OD) which non-covalently decorates oxidized graphene sheets (denoted as
base-washed GO, bwGO). These oxidative debris act as a surfactant to stabilize
the aqueous suspension and can be removed by washing with base. The OD was
found to be made up exclusively of small, low molecular weight compounds and
formed at least 30% of the weight of the original “graphene oxide”. Although the
degree of oxidative functionality is clearly reduced in bwGO compared with
as-produced GO, it is still significant. The electrical conductivity of bwGO film is
shown to be very similar to that of reduced GO.
Figure 2.33 Schematic representation of as-produced GO: large oxidatively
functionalized graphene-like sheets with surface-bound debris. Note that the
graphene-like sheets extend further than depicted. 394

99
The reduction of GO provides an efficient route for graphene production in terms
of commercial scalability and high throughput of predominantly monolayers with
large flake size, opening the door to integrate graphene with other materials to
form nanocomposites with improved performance 395,396. However, they still face
some drawbacks. For example, due to the incomplete removal of oxides397 as well
as the structural defects induced 375,382, the electronic property of RGO is still
largely degraded, which is several orders of magnitude lower than that of pristine
graphene 382,385, making them unattractive for electronics applications. Thus, a
non-covalent method for producing significant quantities of defect-free,
unoxidized graphene is urgently required.
The other solution phase pathway employs ultrasonic energy to directly exfoliate
graphite down to thin flakes 398-403. Exfoliation in both organic solvents and
aqueous surfactant solutions has been reported.
The trick to this method is to choose the solvents whose surface energy matches
well with that of graphite, thus allowing for strong interaction of the solvent with
graphite and minimizing the energy required for exfoliation. Commonly used
solvents include N-methyl-pyrrolidone (NMP) 400 and dimethylformamide
(DMF)347. However, such method tend to suffer from a major problem: the low
concentration of graphene in the solution that can be achieved 400 which is a
significant barrier to many of the applications, such as for producing
graphene/polymer composites 404. In order to maximize the concentration of
graphene while maintaining their quality, Coleman and coworkers 401 have
applied mild sonication for extended times (up to 146 h) in solvent NMP to
obtain graphene flakes of <10 layers at a concentration of up to 1 mg mL-1. The
mean flake length remains above 1 μm for up to 460 h of sonication. They further
employed a two-step sonication and successfully obtained the good-quality
dispersion at the concentration of 17 mg mL-1 which is the highest ever achieved
so far 405.

100
As the solvent–graphite interaction is van der Waals, solvent exfoliated graphene
exhibit minimal basal plane defects 400, therefore the property of pristine graphene
is largely preserved. It also provides a viable route for mass production of
graphene on a variety of substrates not available using cleavage or growth
methods, thus facilitate production of graphene based composites and films. The
defects present on RGO 406 and solvent exfoliated graphene 400 have distinguished
them from both the ideal graphene crystal and one another. While the deviations
from perfection deteriorate the performance of graphene-based devices, the
unique properties introduced owing to the presence of defects may lead to
interesting effects and potential applications 407.
However, this process is not without its drawbacks. These solvents are expensive
and require special care when handling. In addition, they tend to have high
boiling points, making it difficult to completely remove them. This can present
problems for flake deposition and composite formation. Coleman et al. have
recently reported preparation of graphene dispersion in low boiling point solvents
such as chloroform and isopropanol 408. Although using these low boiling point
solvents allows individual flakes to be deposited on substrates, the organic
solvent limit their application in bio related area. Unfortunately, the most useful
solvent of all, water, has a surface energy that is much too high to work on its
own as an exfoliant for graphene.
Surfactants mediated exfoliation of graphite has been recently developed 399,402,403.
Although compared with solvent exfoliation route, the concentration of the
dispersion and the percentage of monolayers present are low, it avoids the use of
toxic solvents and the aqueous environment brings its own advantages, such as
the ability to deposit individual flakes onto surfaces. Commonly used surfactants
for CNT dispersion, such as SDBS, have been employed for graphite exfoliation 402.
Coleman et al. have also demonstrated that for ionic surfactants, the
concentration of the dispersion is proportional to the magnitude of the
electrostatic potential barrier which stabilizes surfactant coated flakes against

101
aggregation, while for the non-ionic surfactants, the dispersed graphene
concentration scaled linearly with the magnitude of the steric potential barrier
stabilizing the flakes 409.
The Coleman group further extended the breakthrough to produce graphene
aqueous dispersion at a concentration of 0.3 mg mL-1 by using sodium cholate as
surfactant 403. Sodium cholate is believed to be a far-superior surfactant than
SDBS in terms of the concentration and the degree of exfoliation achievable. The
dispersions (with graphene concentration as high as 0.04 mg mL-1) were also used
to form transparent thin films which exhibit a direct current conductivity of up to
1.5x10⁴ S m-1 benefiting from their oxide and defect-free natures 399.
For surfactant-graphene dispersion, the concentration above 1 mg mL-1 has not
been achieved 403. Another significant issue facing is that this method tend to
yield size- and layer-polydispersed flakes, out of which a large population of
small flakes with lateral size of ~1 μm or less are produced that were useless for
many applications. To this end, a study has demonstrated the successful isolation
of monodisperse colloidal solutions of single graphene sheets and few-layer
graphene stacks from bulk graphene dispersions via density-gradient
ultracentrifugation 410. Khan et al. have also reported a size selection method by
controlled centrifugation 411.
2.4.2 Graphene based nanocomposites and nanohybrids
Among the diverse applications of graphene, a particularly active area of research
concerns the development of graphene-based composite and hybrid materials,
which seeks to combine the fascinating properties of the two-dimensional
nanocarbon with additional functionality provided by a second component.
Various metals including Au 412, Ag 413, Pt 414 and metal oxides 415-418 have been
anchored to the surface of graphene for the applications as electrochemical
sensors in which graphene serves as a support material providing larger

102
electrochemically active surface areas.
Especially, by combining the unique properties of graphene with the
well-established photoactivity of TiO2, the development of their composites and
hybrids with synergistic effect have found great potentials in the fields of
photocatalysis, dye-sensitized solar cells and hydrogen evolution. The remarkably
enhanced photocatalytic activity of graphene-TiO2 nanocomposites compared
with pure TiO2 was attributed to the high specific surface area of graphene for
high dye adsorption capacity and their role as electron acceptor to effectively
hinder the electron–hole pair recombination of TiO2 419. Furthermore, graphene
may exhibit the same photosensitizing effect as CNTs to enhance the utilization
of visible light in photocatalysis122. Graphene-TiO2 composites also showed
higher photocatalytic efficiency over CNT-TiO2 composites benefiting from the
better conductivity and higher surface area of graphene.
Many efforts have been made to fabricate graphene-TiO2 nanocomposites and
hybrids. The challenge is to uniformly integrate graphene sheets into the matrix
materials or to achieve uniform dispersion of the loaded TiO2 nanoparticles.
Strategies such as atomic layer deposition 420 and electron beam irradiation 421
have been reported, with the latter requires pretreated graphene as a raw material.
Meng et al. 420 have employed atomic-layer-deposition method for the
preparation of graphene-TiO2 nanocomposites with precisely controlled
morphology and phase of TiO2. However, since it is a gas-solid synthesis route, it
lacks the flexibility to deposit the nanocomposites on arbitrary substrate. Besides,
the process is probably not commercially viable since it requires a six-step
sequence with heat treatment at various temperatures.
Alternatively, methods including self-assembly 422, molecular grafting 423 and
sol-gel process 424 have been employed for the production of graphene-TiO2
nanocomposites and hybrids. Wang et al. 422 reported using SDS stabilized FGSs
(functionalized graphene sheets) for in-situ growth of TiO2 nanoparticles and the

103
resulting hybrid materials showed significantly enhanced Li-ion
insertion/extraction capacity in the hybrid electrodes at high charge/discharge
rates due to its high surface area and excellent conductivity, making graphene
sheets highly promising for Li-ion battery electrode materials. Tang et al.423
incorporated chemical exfoliated graphene sheets (GS) into TiO2 nanoparticle
films via a molecular grafting method for dye-sensitized solar cells. The
composite films showed significantly enhanced conductivity and photovoltaic
performance attributed to the creation of a continuous electron transfer network
as a result of the implanted GS, which lower the probability of recombination of
photoinjected electrons and the better dye loading of GS/TiO2 film.
Chen et al. 425 reported the fabrication of graphene sheets-wrapped anatase
hollow particles by first functionalizing the electroactive TiO2 hollow particles
with aminopropyltriethoxysilane to obtain a positively-charged surface. The
negatively charged GO sheets were then linked to these functionalized TiO2
hollow particles via electrostatic interaction. Finally, the GO sheets were reduced
to graphene sheets by thermal treatment, leading to the formation of
graphene–TiO2 composites. Similarly, Kim et al. 426 have prepared the core/shell
structure of nanographene sheets self-assembled onto TiO2 nanoparticles and it
was found to show higher photocatalytic and photoelectrochemical activities than
that of the conventional composites which has TiO2 nanoparticles loaded on the
micrometer-sized graphene sheets. This is attributed to the improved contact
between r-NGO and TiO2 NPs.
Kamat et al. 427,428 have reported that GO underwent photocatalytic reduction as it
accepted electrons from UV-irradiated TiO2 in GO-TiO2 nanocomposites (Figure
2.34). The work further revealed that approximately 50% of the oxygen sites are
able to accept electrons from TiO2 and undergo reduction. Thus the photocatalytic
reduction of GO-TiO2 opens up new ways to obtain graphene-semiconductor
composites that meet the requirement to both obtain graphene as individual sheets
and to maintain it in the reduced form. The advantage of photocatalytic reduction

104
over the conventional chemical reduction is that (1) use no toxic chemicals such
as hydrazine (2) it can be triggered on demand by tuning the UV-irradiation and
(3) the binding of the oxide particles keeps the exfoliated graphene sheets from
collapse after reduction while the chemical reduction by hydrazine induce the
irreversible reaggregation of graphene sheets 375.
Figure 2.34 TiO2-graphene composite and its response under UV-excitation. 427
The pioneering study by Kamat has stimulated an extensive range of studies on
the fabrication and application of graphene-TiO2 photocatalysts from the
reduction of GO-TiO2 nanocomposites. Zhang et al. 429 have reported the
preparation of a chemically bonded P25-graphene nanocomposite using GO and
P25 as starting reactants via a one-step hydrothermal method, during which both
of the reduction of GO and loading of P25 were achieved. The resulting
composite exhibited a significant enhancement of photocatalytic degradation of
methylene blue (MB) under both UV and visible light irradiation over bare P25.
Furthermore, G-P25 showed higher photocatalytic efficiency than P25-CNTs
with the same carbon content mainly due to its giant two-dimensional planar
structure, which facilitated a better platform for adsorption of dyes and charge
transportation.
Zhou et al. 430 reported the one-pot in-situ preparation of graphene-TiO2
nanohybrids via solvothermal reaction using GO and TBOT as starting materials.
The reduction of GO to graphene in GO-TiO2 nanohybrids via the solvothermal

105
reaction is claimed to be more effective in lowering the oxygen and defect levels
in graphene compared with using reductants like hydrazine and NaBH4 431.
Akhavan 432 reported the substantially improved antibacterial activity of the
reduced GO-TiO2 which is achieved by photocatalytic reduction of GO-TiO2
under UV-Vis light irradiation compared with that of GO-TiO2. This may due to
the fact that the reduced GO has better conductivity and thus result in better
charge separation between photoexcited electrons and holes leading to a reduction
in recombination rate of the pairs.
2.5 References
1. J. Livage et al., Sol-gel chemistry of transition metal oxides, J. Prog. Solid St.
Chem., 1988, 18, 259.
2. S. Sakka et al., The sol-gel transition in the hydrolysis of metal alkoxides in
relation to the formation of glass fibers and films, J. Non-Cryst. Solids, 1982, 48,
31.
3. L. L. Hench et al., Science of Ceramic Chemical Processing E, 1986, Wiley.
4. D.R. Ulrich Eds., Science of Ceramic Chemical Processing E, 1986, Wiley,
New-York, 237.
5. A. Walcarius et al., Electrochemical Applications of Silica-Based
Organic−Inorganic Hybrid Materials, Chem.Mater., 2001, 13, 3351.
6. I. Gill et al., Bio-doped Nanocomposite Polymers: Sol−Gel Bioencapsulates,
Chem. Mater., 2001, 13, 3404.
7. https://www.llnl.gov/str/May05/Satcher.html.
8. K. D. Keefer, Silicon Based Polymer Science: A Comprehensive Resource; eds.
J.M. Zeigler and F.W.G. Fearon, ACS Advances in Chemistry Ser. No. 224, 1990,
American Chemical Society: Washington, DC, pp. 227-240.
9. M. Prassas and L. L. Hench, Ultrastructure Processing of Ceramics, Glasses,
and Composites; eds. L.L Hench and D.R. Ulrich, 1984, John Wiley & Sons:
New York, pp. 100-125.
10. R. Aelion et al., Hydrolysis of Ethyl Silicate, J. Am. Chem. Soc., 1950, 72,
5705.
11. Z. Németh et al., Preparation of homogeneous titania coating on the surface of
MWNT, Composites Science and Technology, 2011, 71, 87.
12. T. Lin et al., The synthesis of silica nanotubes through chlorosilanization of
single wall carbon nanotubes, Nanotechnology, 2010, 21, 365604.
13. C. J. J. Brinker et al., Hydrolysis and condensation of silicates: Effects on
structure, Non-Crystalline Solids, 1988, 100, 31.
14. B. E. Yoldas et al., Hydrolysis of titanium alkoxide and effects of hydrolytic
polycondensation parameters, J. Mater. Sci., 1986, 21, 1087.

106
15. http://nanoparticles-environment.wikispaces.com/4.3.3+Nano-filtration
16. S.Iijima et al., Helical microtubules of graphitic carbon, Nature, 1991, 354,
56.
17. B. Q. Wei et al., Reliability and current carrying capacity of carbon nanotubes,
Applied Physics Letters, 2001, 79, 1172.
18. T. W. Odom et al., Scanning Probe Microscopy Studies of Carbon Nanotubes,
Topics Appl. Phys., 2001, 80, 173.
19. C. N. R. Rao et al., Nanotubes, Chem.Phys.Chem., 2001, 2, 78.
20. L. Dai et al., Controlled Synthesis and Modification of Carbon
Nanotubes and C60: Carbon Nanostructures for Advanced Polymeric
Composite Materials, Adv. Mater., 2001, 13, 899.
21. I. Dumitrescu et al., Electrochemistry at carbon nanotubes: perspective and
issues, Chem. Commun., 2009, 6886.
22. T. W. Ebbesen et al., Large-scale synthesis of carbon nanotubes, Nature, 1992,
358, 220.
23. T. Guo et al., Catalytic growth of single-walled manotubes by laser
vaporization, Chem. Phys. Lett., 1995, 243, 49.
24. M. José-Yacamán et al., Catalytic growth of carbon microtubules with
fullerene structure, Appl. Phys. Lett., 1993, 62, 657.
25. M. Bierdel et al., Industrial production of multiwalled carbon nanotubes,
Phys. Status Solid B, 2007, 244, 3939.
26. C. Singh et al., Production of controlled architectures of aligned carbon
nanotubes by an injection chemical vapour deposition method, Carbon, 2003, 41,
359.
27. C. Singh et al., Production of aligned carbon nanotubes by the CVD injection
method, Physica B, 2002, 323, 339.
28. C. Singh et al., Towards the production of large-scale aligned carbon
nanotubes, Chem. Phys. Lett., 2003, 372, 860.
29. K. H. An et al., Electrochemical Properties of High-Power Supercapacitors
Using Single-Walled Carbon Nanotube Electrodes, Adv. Funct. Mater., 2001, 11,
387.
30. P. Vincent et al., Inclusion of carbon nanotubes in a TiO2 sol–gel matrix,
J.Non-Cryst. Solids, 2002, 311, 130.
31. N. Yu et al., Effects of CNT Diameter on the Uniaxial Stress-Strain Behavior
of CNT/Epoxy Composites, J. Nanomater., 2008, 834248, 6.
32. Y. Zhang et al., Reinforcement of silica with single-walled carbon nanotubes
through covalent functionalization, J. Mater. Chem., 2006, 16, 4592.
33. R. H. Baughman et al., Carbon Nanotube Actuators, Science, 1999, 284,
1340.
34. W. A. de Heer et al., A Carbon Nanotube Field-Emission Electron Source,
Science, 1995, 270, 1179.
35. J. Kong et al., Nanotube Molecular Wires as Chemical Sensors, Science, 2000,
287, 622.
36. J. Kong et al., Functionalized Carbon Nanotubes for Molecular Hydrogen
Sensors, Adv. Mater., 2001, 13, 1384.

107
37. J. H. Hafner et al., Growth of nanotubes for probe microscopy tips, Nature,
1999, 398, 761.
38. Q. Zhao et al., Electrochemical Sensors Based on Carbon Nanotubes,
Electroanalysis, 2002, 14, 1609.
39. M. Musameh et al., Low-potential stable NADH detection at
carbon-nanotube-modified glassy carbon electrodes, Electrochem.Commun., 2002,
4, 743.
40. J. J. Gooding et al., Protein Electrochemistry Using Aligned Carbon
Nanotube Arrays, J. Am. Chem. Soc., 2003, 125, 9006.
41. X. Yu et al., Peroxidase activity of enzymes bound to the ends of single-wall
carbon nanotube forest electrodes, Electrochem. Commun., 2003, 5, 408.
42. J. M. Planeix et al., Application of Carbon Nanotubes as Supports in
Heterogeneous Catalysis, J. Am. Chem. Soc., 1994, 116, 7935.
43. Y. Li et al., Self-organized Ribbons of Aligned Carbon Nanotubes, Chem.
Mater., 2002, 14, 483.
44. B. C. Satishkumar et al., The decoration of carbon nanotubes by metal
nanoparticles, J. Phys. Appl. Phys., 1996, 29, 3173.
45. I. Robel et al., Single-Walled Carbon Nanotube–CdS Nanocomposites as
Light-Harvesting Assemblies: Photoinduced Charge-Transfer Interactions, Adv.
Mater., 2005, 17, 2458.
46. Y. Lin et al., Advances toward bioapplications of carbon nanotubes, J. Mater.
Chem., 2004, 14, 527.
47. B. G. Cousins et al., Enzyme-Activated Surfactants for Dispersion of Carbon
Nanotubes, Small, 2009, 5, 587.
48. W. Huang et al., Attaching Proteins to Carbon Nanotubes via
Diimide-Activated Amidation, Nano Lett., 2002, 2, 311.
49. G. R. Dieckmann et al., Controlled Assembly of Carbon Nanotubes by
Designed Amphiphilic Peptide Helices, J. Am. Chem. Soc., 2003, 125, 1770.
50. V. Zorbas et al., Preparation and Characterization of Individual
Peptide-Wrapped Single-Walled Carbon Nanotubes, J. Am. Chem. Soc., 2004,
126, 7222.
51. D. Chattopadhyay et al., A Route for Bulk Separation of Semiconducting
from Metallic Single-Wall Carbon Nanotubes, J. Am. Chem. Soc., 2003, 125,
3370.
52. P. J. Boul et al., Reversible sidewall functionalization of buckytubes, Chem.
Phys. Lett., 1999, 310, 367.
53. L. Vaisman et al., Dispersions of Surface-Modified Carbon Nanotubes in
Water-Soluble and Water-Insoluble Polymers, Adv. Funct. Mater., 2006, 16,
357.
54. S. C. Tsang et al., Corrigenda, J. Chem. Soc., Chem. Commun., 1995, 2579.
55. Z. Guo et al., Immobilization and Visualization of DNA and Proteins on
Carbon Nanotubes, Adv. Mater., 1998, 10, 701.
56. F. Balavoine et al., Helical Crystallization of Proteins on Carbon Nanotubes:
A First Step, towards the Development of New Biosensors, Angew. Chem., Int.
Ed., 1999, 38, 1912.

108
57. R. Bandyopadhyaya et al., Stabilization of Individual Carbon Nanotubes in
Aqueous Solutions, Nano Lett., 2002, 2, 25.
58. S. C. Tsang et al., Immobilization of small proteins in carbon nanotubes:
high-resolution transmission electron microscopy study and catalytic activity, J.
Chem. Soc., Chem. Commun., 1995, 1803.
59. J. J. Davis et al., The immobilisation of proteins in carbon nanotubes, Inorg.
Chim. Acta, 1998, 272, 261.
60. D. Pantarotto et al., Synthesis, Structural Characterization, and
Immunological Properties of Carbon Nanotubes Functionalized with Peptides,
J. Am. Chem. Soc., 2003, 125, 6160.
61. A. Ortiz-Acevedo et al., Diameter-Selective Solubilization of Single-Walled
Carbon Nanotubes by Reversible Cyclic Peptides, J. Am. Chem. Soc., 2005, 127,
9512.
62. R. J. Chen et al., Noncovalent Sidewall Functionalization of Single-Walled
Carbon Nanotubes for Protein Immobilization, J. Am. Chem. Soc., 2001, 123,
3838.
63. M. Zheng et al., DNA-assisted dispersion and separation of carbon nanotubes,
Nat. Mater., 2003, 2, 338.
64. J. Liu et al., Fullerene Pipes, Science, 1998, 280, 1253.
65. M. A. Hamon et al., Dissolution of Single-Walled Carbon Nanotubes, Adv.
Mater., 1999, 11, 834.
66. E. T. Mickelson et al., Solvation of Fluorinated Single-Wall Carbon
Nanotubes in Alcohol Solvents, J. Phys. Chem. B, 1999, 103, 4318.
67. J. Chen et al., Solution Properties of Single-Walled Carbon Nanotubes,
Science, 1998, 282, 95.
68. Y. Chen et al., Chemical attachment of organic functional groups to
single-walled carbon nanotube material, J. Mater. Res., 1998, 13, 2423.
69. E. V. Basiuk et al., Direct Solvent-Free Amination of Closed-Cap Carbon
Nanotubes: A Link to Fullerene Chemistry, Nano Lett., 2004, 4, 863.
70. S. Banerjee et al., Rational Sidewall Functionalization and Purification of
Single-Walled Carbon Nanotubes by Solution-Phase Ozonolysis, J. Phys. Chem.
B, 2002, 106, 12144.
71. A. Hamwi et al., Fluorination of carbon nanotubes, Carbon, 1997, 35, 723.
72. J. L. Bahr et al., Functionalization of Carbon Nanotubes by Electrochemical
Reduction of Aryl Diazonium Salts: A Bucky Paper Electrode, J. Am. Chem. Soc.,
2001, 123, 6536.
73. M. S. Strano et al., Electronic Structure Control of Single-Walled Carbon
Nanotube Functionalization, Science, 2003, 301, 1519.
74. J. L. Bahr et al., Highly functionalized carbon nanotubes using in situ
generated diazonium compounds. Chem. Mater., 2001, 13, 3823.
75. I. D. Rosca et al., Oxidation of multiwalled carbon nanotubes by nitric acid,
Carbon, 2005, 43, 3124.
76. B. Smith et al., Colloidal Properties of Aqueous Suspensions of Acid-Treated,
Multi-Walled Carbon Nanotubes, Environ. Sci. Technol., 2009, 43, 819.

109
77. Y. Shieh et al., Effects of polarity and pH on the solubility of acid-treated
carbon nanotubes in different media, Carbon, 2007, 45, 1880.
78. D. B. Mawhinney et al., Surface defect site density on single walled carbon
nanotubes by titration, Chem. Phys. Lett., 2000, 324, 213.
79. Y. Sun et al., Soluble Dendron-Functionalized Carbon Nanotubes:
Preparation, Characterization and Properties, Chem. Mater., 2001, 13, 2864.
80. J. Chen et al., Solution Properties of Single-Walled Carbon Nanotubes,
Science, 1998, 282, 95.
81. Y. F. Sun et al., Effect of Chemical Modification on Functionalization of
Carbon Nanotubes by Poly(ethylene glycol), Chinese J. Inorg. Chem., 2008, 24,
98.
82. X. Deng et al., The splenic toxicity of water soluble multi-walled carbon
nanotubes in mice, Carbon, 2009, 47, 1421.
83. M. Shen et al., Polyethyleneimine-Mediated Functionalization of Multiwalled
Carbon Nanotubes: Synthesis, Characterization and In Vitro Toxicity Assay, J.
Phys. Chem. C, 2009, 113, 3150.
84. K. Fu et al., Functionalization of carbon nanotubes with bovine serum
albumin in homogeneous aqueous solution, J. Nanosci. Nanotechnol., 2002, 2,
457.
85. V. Georgakilas et al., Amino acid functionalisation of water soluble carbon
nanotubes, Chem. Commun., 2002, 3050.
86. J. J. Gooding et al., Protein Electrochemistry Using Aligned Carbon
Nanotube Arrays, J. Am. Chem. Soc., 2003, 125, 9006.
87. A. Erdem et al., Direct DNA Hybridization at Disposable Graphite Electrodes
Modified with Carbon Nanotubes, Anal. Chem., 2006, 78, 6656.
88. X. Yu et al., Carbon Nanotube Amplification Strategies for Highly Sensitive
Immunodetection of Cancer Biomarkers, J. Am. Chem. Soc., 2006, 128, 11199.
89. Y. Lin et al., Glucose Biosensors Based on Carbon Nanotube Nanoelectrode
Ensembles, Nano Lett., 2004, 4, 191.
90. K. D. Ausman et al., Organic Solvent Dispersions of Single-Walled Carbon
Nanotubes: Toward Solutions of Pristine Nanotubes, J. Phys.Chem. B, 2000, 104,
8911.
91. M. J. Pender et al., Peptide-Mediated Formation of Single-Wall Carbon
Nanotube Composites, Nano Lett., 2006, 6, 40.
92. V. Zorbas et al., Importance of Aromatic Content for Peptide/Single-Walled
Carbon Nanotube Interactions, J. Am. Chem. Soc., 2005, 127, 12323.
93. J. Kong et al., Nanotube Molecular Wires as Chemical Sensors, Science, 2000,
287, 622.
94. L. E. Valenti et al., The adsorption-desorption process of bovine serum
albumin on carbon nanotubes, J. Colloid Interface Sci., 2007, 307, 349.
95. S. Liu et al., Immobilization and characterization of alcohol dehydrogenase
on single-walled carbon nanotubes and its application in sensing ethanol, J. Elec.
Chem., 2007, 602, 103.
96. M. J. O’Connell et al., Band Gap Fluorescence from Individual

110
Single-Walled Carbon Nanotubes, Science, 2002, 297, 593.
97. M. F. Islam et al., High Weight Fraction Surfactant Solubilization of
Single-Wall Carbon Nanotubes in Water, Nano Lett., 2003, 3, 269.
98. R. Colorado et al., Silica-Coated Single-Walled Nanotubes: Nanostructure
Formation, Chem. Mater., 2004, 16, 2691.
99. X. Gong et al., Surfactant-Assisted Processing of Carbon Nanotube/Polymer
Composites, Chem. Mater., 2000, 12, 1049.
100. C. Velasco-Santos et al., Dynamical–mechanical and thermal analysis of
carbon nanotube–methyl-ethyl methacrylate nanocomposites, J. Phys. D Appl.
Phys., 2003, 36, 1423.
101. K. Yurekli et al., Small-Angle Neutron Scattering from Surfactant-Assisted
Aqueous Dispersions of Carbon Nanotubes, J. Am. Chem. Soc., 2004, 126, 9902.
102. L. Jiang et al., Production of aqueous colloidal dispersions of carbon
nanotubes, J .Colloid Interface Sci, 2003, 260, 89.
103. T. Hertel et al., Spectroscopy of Single- and Double-Wall Carbon Nanotubes
in Different Environment, Nano Lett., 2005, 5, 511.
104. P. Poulin, et al., Films and fibers of oriented single wall nanotubes, Carbon,
2002, 40, 1741.
105. E. Camponeschi et al., Uniform Directional Alignment of Single-Walled
Carbon Nanotubes in Viscous Polymer Flow, Langmuir, 2006, 22, 1858.
106. Y. Tan, Dispersion of Single-Walled Carbon Nanotubes of Narrow Diameter
Distribution, J. Phys. Chem B, 2005, 109, 14454.
107. N. Nakashima et al., Water-Soluble Single-Walled Carbon Nanotubes via
Noncovalent Sidewall-Functionalization with a Pyrene-Carrying Ammonium Ion,
Chem. Lett., 2002, 638.
108. P. Petrov et al., Noncovalent functionalization of multi-walled carbon
nanotubes by pyrene containing polymers, Chem. Comm., 2003, 2904.
109. L. S. Fifield et al., Noncovalent Functionalization of Carbon Nanotubes with
Molecular Anchors Using Supercritical Fluids, J. Phys. Chem. B, 2004, 108,
8737.
110. A. B. Artyukhin et al., Layer-by-Layer Electrostatic Self-Assembly of
Polyelectrolyte Nanoshells on Individual Carbon Nanotube Templates, Langmuir,
2004, 20, 1442.
111. Y. Tomonari et al., Solubilization of Single-Walled Carbon Nanotubes by
using Polycyclic Aromatic Ammonium Amphiphiles in Water—Strategy for the
Design of High-Performance Solubilizers, J. Chem. Eur., 2006, 12, 4027.
112. N. Nakashima et al., Solubilization of single-walled carbon nanotubes with
condensed aromatic compounds, Science and Technology of Advanced
Materials, 2006, 7, 609.
113. A. Satake et al., Porphyrin−Carbon Nanotube Composites Formed by
Noncovalent Polymer Wrapping, Chem.Mater., 2005, 17, 716.
114. A. Star et al., Starched Carbon Nanotubes, Angew. Chem. Int. Ed., 2002, 41,
2508.
115. S. Wang et al., Peptides with selective affinity for carbon nanotubes, Nat.
Mater., 2003, 2, 196.
116. A. M. Smith et al., Fmoc-Diphenylalanine Self Assembles to a Hydrogel via

111
a Novel Architecture Based on π–π Interlocked β-Sheets, Adv. Mater., 2008, 20,
37.
117. M. O’Connell et al., Reversible water-solubilization of single-walled carbon
nanotubes by polymer wrapping, Chem. Phys. Lett., 2001, 342, 265.
118. A. Star et al., Preparation and Properties of Polymer-Wrapped
Single-Walled Carbon Nanotubes , Angew. Chem.,Int. Ed., 2001, 40, 1721.
119. V. C. Moore et al., Individually Suspended Single-Walled Carbon Nanotubes
in Various Surfactants, Nano Lett., 2003, 3, 1379.
120. M. S. Strano et al., The role of surfactant adsorption during ultrasonication
in the dispersion of single-walled carbon nanotubes, J. Nanosci. Nanotech., 2003,
3, 81.
121. C. Richard et al., Supramolecular Self-Assembly of Lipid Derivatives on
Carbon Nanotubes, Science, 2003, 300, 775.
122. W. D. Wang et al., Visible light photodegradation of phenol on
MWNT-TiO2 composite catalysts prepared by a modified sol–gel method, J. Mol.
Catal. A:Chem., 2005, 235, 194.
123. W. D. Wang et al., Photocatalytic degradation of phenol on MWNT and
titania composite catalysts prepared by a modified sol–gel method,
Appl.Catal.B:Environ., 2005, 56, 305.
124. B. Rajesh et al., Preparation of a Pt–Ru bimetallic system supported on
carbon nanotubes, J. Mater.Chem., 2000, 10, 1757.
125. M. Y. Wang et al., Preparation of Pt-MoOx/CNT Electrode and Its
Electrocatalytic Property for Ethanol Electrooxidation, Chin. J. Chem., 2006, 24,
881.
126. H. Song et al., Preparation and electrochemical properties of
sulfur–acetylene black composites as cathode materials, Electrochim. Acta, 2008,
53, 3708.
127. H. Yu et al., RuO2·xH2O Supported on Carbon Nanotubes as a Highly Active
Catalyst for Methanol Oxidation, J. Phys. Chem. C , 2008, 112, 11875.
128. B. Y. Wei et al., A novel SnO2 gas sensor doped with carbon nanotubes
operating at room temperature, Sens. Actuators B, 2004, 101, 81.
129. R. Wu et al, Promotive effect of CNT on Co3O4–SnO2 in a
semiconductor-type CO sensor working at room temperature, Sens. Actuators B,
2008, 131, 306.
130. Y. X. Liang et al., Low-resistance gas sensors fabricated from multiwalled
carbon nanotubes coated with a thin tin oxide layer, Appl. Phys. Lett., 2004,
85,666.
131. D.A. Beardsley et al., Substoichiometric determination of traces of gold by
radioactive isotope-dilution analysis, Talanta, 2008, 74, 879.
132. Z. Sun et al., Microstructural and electrochemical characterization of
RuO2/CNT composites synthesized in supercritical diethyl amine, Carbon, 2006,
44, 888.
133. J. H. Park et al., Carbon Nanotube/RuO2 Nanocomposite Electrodes for
Supercapacitors, J. Electrochem. Soc., 2003, 150, A864.
134. X. Xie et al., Characterization of a manganese dioxide/carbon nanotube
composite fabricated using an in situ coating method, Carbon, 2007, 45, 2365.

112
135. H. Zhang et al., Growth of Manganese Oxide Nanoflowers on
Vertically-Aligned Carbon Nanotube Arrays for High-Rate Electrochemical
Capacitive Energy Storage, Nano Lett., 2008, 8, 2664.
136. K. W. Nam et al., A Study of the Preparation of NiOx Electrode via
Electrochemical Route for Supercapacitor Applications and Their Charge Storage
Mechanism, J. Electrochem. Soc., 2002, 149, A346.
137. W. S. Kim et al., Improved emission stability of single-walled carbon
nanotube field emitters by plasma treatment, Appl. Phys. Lett., 2005, 87, 163112.
138. L. Huang et al., Local measurement of secondary electron emission from
ZnO-coated carbon nanotubes, Nanotechnology, 2006, 17, 1564.
139. L. Pan et al., Field Emission Properties of Titanium Carbide Coated Carbon
Nanotube Arrays, Adv. Eng. Mater., 2007, 9, 584.
140. L. Pan et al., Effect of MgO coating on field emission of a stand-alone
carbon nanotube, J. Vac. Sci. Technol., B, 2007, 25, 1581.
141. J. N. Heo et al., Effect of MgO film thickness on secondary electron
emission from MgO-coated carbon nanotubes, Physica B, 2002, 323, 174.
142. P. M. Ajayan et al., Capillarity-induced filling of carbon nanotubes, Nature,
1993, 361, 333.
143. K. Kalyanasundaram et al., Applications of functionalized transition metal
complexes in photonic and optoelectronic devices, Chem.commun., 1998, 3, 347.
144. T. Seeger et al., SiOx-coating of carbon nanotubes at room temperature,
Chem. Phys. Lett., 2001, 339, 41.
145. T. Seeger et al., Nanotube composites: novel SiO2 coated carbon nanotubes,
Chem. Commun., 2002, 34.
146. E. A. Whitsitt et al., Silica Coated Single Walled Carbon Nanotubes, Nano
Lett., 2003, 3, 775.
147. A. B. Bourlinos et al., Preparation of a water-dispersible carbon
nanotube–silica hybrid, Carbon, 2007, 45, 2126.
148. Z. Sun et al., Coating carbon nanotubes with metal oxides in a supercritical
carbon dioxide–ethanol solution, Carbon, 2007, 45, 2589.
149. K. Hernadi et al., Synthesis of MWNT-based composite materials with
inorganic coating, Acta Mat., 2003, 51, 1447.
150. K. Hernadi et al., Al(OH)3/Multiwalled Carbon Nanotube Composite:
Homogeneous Coverage of Al(OH)3 on Carbon Nanotube Surfaces, Langmuir,
2003, 19, 7026.
151. L. Zhao et al., Coating of multi-walled carbon nanotubes with thick layers of
tin(IV) oxide, Carbon, 2004, 42, 1858.
152. W. Han et al., Coating Single-Walled Carbon Nanotubes with Tin Oxide,
Nano.Lett., 2003, 3, 681.
153. M. H. Chen et al., Synthesis and characterization of SnO–carbon nanotube
composite as anode material for lithium-ion batteries, Mater. Res. Bull., 2003, 38,
831.
154. F. Vietmeyer et al., Anchoring ZnO particles on functionalized single wall
carbon nanotubes, Adv. Mater., 2007, 19, 2935.
155. K. Byrappa et al., Hydrothermal preparation of ZnO:CNT and TiO2:CNT
composites and their photocatalytic applications, J. Mater. Sci., 2008, 43, 2348.

113
156. C. S. Chen et al., Zinc oxide nanoparticle decorated multi-walled carbon
nanotubes and their optical properties, Acta Mater., 2006, 54, 5401.
157. Y. Yang et al., Electrophoresis Coating of Titanium Dioxide on Aligned
Carbon Nanotubes for Controlled Syntheses of Photoelectronic Nanomaterials,
Adv.Mater., 2007, 19, 1239.
158. Y. Lee et al., Spontaneous Formation of Transition-Metal Nanoparticles on
Single-Walled Carbon Nanotubes Anchored with Conjugated Molecules, Small,
2005, 1, 975.
159. A. Jitianu et al., Synthesis and characterization of carbon
nanotubes–TiO2 nanocomposites, Carbon, 2004, 42, 1147.
160. D. Eder et al, Morphology control of CNT-TiO2 hybrid materials
and rutile nanotubes, J. Mater. Chem., 2008, 18, 2036.
161. W. Wang et al., Preparation and characterization of nanostructured
MWCNT-TiO2 composite materials for photocatalytic water treatment
applications, Mater. Res. Bull., 2008, 43, 958.
162. Q. Huang et al., Immobilization of rutile TiO2 on multiwalled carbon
nanotubes, J. Mater. Chem., 2003, 13, 1517.
163. B. Liu et al., Carbon Nanotubes Supported Mesoporous Mesocrystals of
Anatase TiO2, Chem. Mater., 2008, 20, 2711.
164. J. Yu et al., The Effect of Calcination Temperature on the Surface
Microstructure and Photocatalytic Activity of TiO2 Thin Films Prepared by
Liquid Phase Deposition, J. Phys. Chem. B, 2003, 107, 13871.
165. Y. Yu et al., Enhancement of photocatalytic activity of mesoporous TiO2 by
using carbon nanotubes, Appl. Catal. A, 2005, 289, 186.
166. B. R. Azamian et al., Directly observed covalent coupling of quantum dots
to single-wall carbon nanotubes, Chem. Commun., 2002, 366.
167. S. Banerjee et al., Synthesis and characterization of carbon
nanotube−nanocrystal heterostructures, Nano Lett., 2002, 2, 195.
168. S. W. Feldberg, et al., On the dilemma of the use of the electroneutrality
constraint in electrochemical calculations, Electrochem. Commun., 2004, 7, 453.
169. P. A. Georgiev et al., In situ inelastic neutron scattering studies of the
rotational and translational dynamics of molecular hydrogen adsorbed in
single-wall carbon nanotubes (SWNTs), Carbon, 2004, 42, 895.
170. L. Han et al., A direct route toward assembly of nanoparticle-carbon
nanotube composite materials, Langmuir, 2004, 20, 6019.
171. C. Li et al, Decoration of multiwall nanotubes with cadmium sulfide
nanoparticles, Carbon, 2006, 44, 2021.
172. D. Eder et al., Carbon–Inorganic Hybrid Materials: The
Carbon-Nanotube/TiO2 Interface, Adv. Mater., 2008, 20, 1787.
173. K. Jiang et al., Selective Attachment of Gold Nanoparticles to
Nitrogen-Doped Carbon Nanotubes, Nano Lett., 2003, 3, 275.
174. M. A. Correa-Duarte et al., Aligning Au nanorods by using carbon nanotubes
as templates, Angew. Chem. Int. Ed., 2005, 44, 4375.
175. J. Wang et al., Solubilization of carbon nanotubes by Nafion toward the
preparation of amperometric biosensors, J. Am. Chem. Soc., 2003, 125, 2408.
176. H. Dong et al., Attaching titania nanoparticles onto shortened carbon

114
nanotubes by electrostatic attraction, Int. J. Appl. Ceram. Technol., 2009, 6, 216.
177. C. Li et al., In-situ coating of MWNTs with sol gel TiO2 nanoparticles, Adv.
Mat. Lett., 2010, 1, 75.
178. T. M. Day et al., Electrochemical templating of metal nanoparticles and
nanowires on single-walled carbon nanotube networks, J. Am. Chem. Soc., 2005,
127, 10639.
179. J. Qu et al., Preparation of hybrid thin film modified carbon nanotubes on
glassy carbon electrode and its electrocatalysis for oxygen reduction, Chem.
Commun., 2004, 34.
180. T. Kyotani et al., Formation of platinum nanorods and nanoparticles in
uniform carbon nanotubes prepared by a template carbonization method, Chem.
Commun., 1997, 701.
181. M. Kanungo et al., Quantitative Control over Electrodeposition of Silica
Films onto Single-Walled Carbon Nanotube Surfaces, J. Phys. Chem. C, 2007,
111, 17730.
182. A. Gomathi et al., Chemically Bonded Ceramic Oxide Coatings on Carbon
Nanotubes and Inorganic Nanowires, Adv. Mater., 2005, 17, 2757.
183. Q. Kuang et al., Controllable fabrication of SnO2-coated multiwalled carbon
nanotubes by chemical vapor deposition, Carbon, 2006, 44, 1166.
184. Y. Zhang et al., Metal coating on suspended carbon nanotubes and its
implication to metal–tube interaction, Chem. Phys. Lett., 2000, 331, 35.
185. H. Song et al., Ethanol electro-oxidation on catalysts with TiO2 coated
carbon nanotubes as support, Electrochem. Commun., 2007, 9, 1416.
186. J. Bai1 et al., Microwave-polyol Process for Functionalizing Carbon
Nanotubes with SnO2 and CeO2 Coating, Chem. Lett., 2006, 35, 96.
187. G. Arabale et al., Enhanced supercapacitance of multiwalled carbon
nanotubes functionalized with ruthenium oxide, Chem. Phys. Lett., 2003, 376,
207.
188. Y. K. Yang et al., A facile method to fabricate silica-coated carbon nanotubes
and silica nanotubes from carbon nanotubes templates, J. Mater. Sci., 2009, 44,
4539.
189. X. L. Li et al., Efficient Synthesis of Carbon Nanotube–Nanoparticle
Hybrids, Adv.Funct.Mater., 2006, 16, 2431.
190. M. Zhang et al., Fabrication of mesoporous silica-coated CNTs and
application in size-selective protein separation, J. Mater. Chem., 2010, 20, 5835.
191. G. Vasilis et al., Carbon Nanotube Sol−Gel Composite Materials, Nano Lett.,
2001, 1, 719.
192. K. Gong et al., Sol−Gel-Derived Ceramic−Carbon Nanotube
Nanocomposite Electrodes: Tunable Electrode Dimension and Potential
Electrochemical Applications, Anal. Chem., 2004, 76, 6500.
193. U. J. Kim et al., Enhancement of integrity of graphene transferred by
interface energy modulation, Carbon, 2006, 44, 165.
194. P. R. Supronowicz et al., Novel current-conducting composite substrates for
exposing osteoblasts to alternating current stimulation, J. Biomed. Mater. Res.,
2002, 59, 499.
195. Z. Zhou et al., Functionalization of multi-wall carbon nanotubes with silane

115
and its reinforcement on polypropylene composites, Composites Sci. and Technol.,
2008, 68, 1727.
196. X. L. Li et al., Efficient Synthesis of Carbon Nanotube–Nanoparticle
Hybrids, Adv. Funct. Mater., 2006, 16, 2431.
197. M. Kim et al., Fabrication of silica nanotubes using silica coated
multi-walled carbon nanotubes as the template, Journal of Colloid and Interface
Science, 2008, 322, 321.
198. G. Xing et al., Influences of Structural Properties on Stability of Fullerenols,
J. Phys. Chem. B, 2004, 108, 11473.
199. Q. Fu et al., Selective Coating of Single Wall Carbon Nanotubes with Thin
SiO2 Layer, Nano Lett., 2002, 2, 329.
200. B. C. Satishkumar et al., Oxide nanotubes prepared using carbon nanotubes
as templates, J. Mater. Res., 1997, 12, 604.
201. C. H. Ao et al., Photodegradation of volatile organic compounds (VOCs)
and NO for indoor air purification using TiO2: promotion versus inhibition effect
of NO, Appl. Catal. B: Environ., 2003, 42,119.
202. L. Petrov et al., Photocatalytic properties of modified TiO2 coatings for
purification of waste water and air, Journal of Environmental Protection and
Ecology, 2007, 8, 881.
203. A. Naldoni et al., Porous TiO2 microspheres with tunable properties for
photocatalytic air purification, Ultrason. Sonochem., 2013, 20, 445.
204. N. Savage et al., Composite n–p semiconducting titanium oxides as gas
sensors, Sens. Actuators, B: Chem., 2001, 79, 17.
205. G. S. Devi et al., Synthesis of mesoporous TiO2-based powders and their
gas-sensing properties, Sens. Act. B, Chemical, 2002, 87, 122. 206. D. Buso et al., Gold Nanoparticle-Doped TiO2 Semiconductor Thin Films:
Gas Sensing Properties, Adv. Funct. Mater., 2008, 18 , 3843.
207. B. O'Regan et al., A low-cost, high-efficiency solar cell based on
dye-sensitized colloidal TiO2 films, Nature, 1991, 353, 737.
208. M. Grätzel et al., Photoelectrochemical cells, Nature, 2001, 414, 338.
209. A. Fujishima et al., Electrochemical Photolysis of Water at a Semiconductor
Electrode, Nature, 1972, 238, 37.
210. K. Maedaa, Photocatalytic water splitting using semiconductor particles:
History and recent developments, J. Photochem. Photobiol. C, Photochem. Rev.,
2011, 12, 237.
211. A. Kudo et al., Heterogeneous photocatalyst materials for water splitting,
Chem. Soc. Rev., 2009, 38, 253.
212. T. Inoue et al., Photoelectrocatalytic reduction of carbon dioxide in aqueous
suspensions of semiconductor powders, Nature, 1979, 277, 637.
213. Z. Liu et al., Highly Ordered TiO2 Nanotube Arrays with Controllable
Length for Photoelectrocatalytic Degradation of Phenol, J. Phys. Chem. C, 2008,
112, 253.
214. Z. Liu et al., Efficient photocatalytic degradation of gaseous acetaldehyde by
highly ordered TiO2 nanotube arrays, Environ. Sci. Technol., 2008, 42, 8547. 215. T. Shibata et al., Photocatalytic properties of titania nanostructured films
fabricated from titania nanosheets, Phys. Chem. Chem. Phys., 2007, 9, 2413.
116
216. L. Gu et al., A novel incorporating style of polyaniline/TiO2 composites as
effective visible photocatalysts, J. Mol.Catal. A: Chemical, 2012, 357,19.
217.http://phome.postech.ac.kr/user/indexSub.action?codyMenuSeq=69390&siteI
d=lamp&menuUIType=top.
218. Jean Desilvestro et al., Highly efficient sensitization of titanium dioxide, J.
Am. Chem. Soc., 1985, 107, 2988.
219. A. Yella et al., Porphyrin-Sensitized Solar Cells with Cobalt (II/III)–Based
Redox Electrolyte Exceed 12 Percent Efficiency, Science, 2011, 334, 629.
220. A. Ghicov et al., Self-ordering electrochemistry: a review on growth and
functionality of TiO2 nanotubes and other self-aligned MOx structures, Chem.
Commun., 2009, 2791.
221. Y. Ohsaki et al., Dye-sensitized TiO2 nanotube solar cells: fabrication and
electronic characterization, Phys. Chem. Chem. Phys., 2005, 7, 4157.
222. A. Kongkanand et al., Single Wall Carbon Nanotube Scaffolds for
Photoelectrochemical Solar Cells. Capture and Transport of Photogenerated
Electrons, Nano Lett., 2007, 7, 676.
223. Q. Shen et al., Electrochemical Biosensing for Cancer Cells Based on
TiO2/CNT Nanocomposites Modified Electrodes, Electroanalysis, 2008, 20,
2526.
224. D. J. Cooke et al., The role of benzyl alcohol in controlling the growth of
TiO2 on carbon nanotubes, J. Phys. Chem. C, 2010, 114, 2462.
225. P. M. Ajayan et al., Carbon nanotubes as removable templates for metal
oxide nanocomposites and nanostructures, Nature, 1995, 375, 564.
226. B. C. Satishkumar et al., Synthesis of metal oxide nanorods using
carbonnanotubes as templates, J. Mater. Chem., 2000, 10, 2115.
227. Z. Sun et al., A Highly Efficient Chemical Sensor Material for H2S:
α-Fe2O3 Nanotubes Fabricated Using Carbon Nanotube Templates, Adv. Mater.,
2005, 17, 2993.
228. D. Eder et al., Pure rutile nanotubes, Chem. Commun., 2006, 13, 1448.
229. D. Eder et al., Anatase nanotubes as support for platinum nanocrystals,
Physica E, 2007, 37, 245.
230. S. Chu et al., Highly Porous (TiO2−SiO2−TeO2)/Al2O3/TiO2 Composite
Nanostructures on Glass with Enhanced Photocatalysis Fabricated by
Anodization and Sol−Gel Process, J.Phys.Chem.B, 2003, 107, 6586.
231. Z. Gao et al., Microwave assisted rapid and complete degradation of atrazine
using TiO2 nanotube photocatalyst suspensions, J. Hazard. Mater., 2007, 145,
424.
232. J. M. Macak et al., Self-Organized TiO2 Nanotube Layers as Highly
Efficient Photocatalysts, Small, 2007, 3, 300.
233. O. K. Varghese et al., Extreme Changes in the Electrical Resistance of
Titania Nanotubes with Hydrogen Exposure, Adv. Mater., 2003, 15, 624.
234. M. Adachi et al., Formation of Titania Nanotubes and Applications for
Dye-Sensitized Solar Cells, Journal of The Electrochemical Society, 2003, 150,
G488.
235. Y. Y. Hsu et al., Photocatalytic degradation of spill oils on TiO2 nanotube

117
thin films, Mar. Pollut. Bull., 2008, 57, 873.
236. N. Bouazza et al., TiO2 nanotubes and CNT–TiO2 hybrid materials for the
photocatalytic oxidation of propene at low concentration, Applied Catalysis B:
Environmental, 2009, 92, 377.
237. M. Adachi et al., Formation of titania nanotubes with high photo-catalytic
activity, Chem. Lett., 2000, 942.
238. S. Mahshid et al., Sensitive determination of dopamine in the presence of
uric acid and ascorbic acid using TiO2 nanotubes modified with Pd, Pt and Au
nanoparticles, Analyst, 2011, 136, 2322.
239. R. P. Antony et al., Efficient photocatalytic hydrogen generation by Pt
modified TiO2 nanotubes fabricated by rapid breakdown anodization,
Inter. J. Hydr. Ener., 2012, 37, 8268.
240. X. L. Meng et al., Electrocatalytic properties of Pt-TiO2 nanotubes electrode
prepared by pulse electrodeposition method, Chemical Journal of Chinese
Universities, 2012, 33, 1021.
241. Y. Su et al., Effect of structure on the photocatalytic activity of Pt-doped
TiO2 nanotubes, Applied Surface Science, 2011, 257, 9791.
242. K. Yu et al., Pt/titania-nanotube: A potential catalyst for CO2 adsorption and
hydrogenation, Applied Catalysis B: Environmental, 2008, 84, 112.
243. Y. Sato et al., The CO–H2 and CO–H2O reactions over TiO2 nanotubes filled
with Pt metal nanoparticles, Catalysis Today, 2006, 111, 164.
244. S. Oh et al., Significantly accelerated osteoblast cell growth on aligned
TiO2 nanotubes, J. Biomedical Materials Research Part A, 2006, 78A, 97.
245. B. B. Lakshmi et al., Sol−Gel Template Synthesis of Semiconductor Oxide
Micro- and Nanostructures, Chem. Mater., 1997, 9, 2544.
246. T. Kasuga et al., Formation of Titanium Oxide Nanotube, Langmuir, 1998,
14, 3160.
247. Q. Chen et al., Trititanate Nanotubes Made via a Single Alkali Treatment,
Adv. Mater., 2002, 14, 1208.
248. B. D. Yao et al., Formation mechanism of TiO2 nanotubes, Appl. Phys. Lett.,
2003, 82, 281.
249. D. Gong et al., Titanium oxide nanotube arrays prepared by anodic oxidation,
J. Mater. Res., 2001, 16, 3331.
250. J. M. Macák et al., High-Aspect-Ratio TiO2 Nanotubes by Anodization of
Titanium, Angew. Chem. Int. Ed., 2005, 44, 2100.
251. G. K. Mor et al., Transparent Highly Ordered TiO2 Nanotube Arrays via
Anodization of Titanium Thin Films, Adv. Funct. Mater., 2005, 15, 1291.
252. G. K. Mor et al., Use of Highly-Ordered TiO2 Nanotube Arrays in
Dye-Sensitized Solar Cells, Nano.Lett., 2006, 6, 215.
253. M. S. Sander et al., Template-Assisted Fabrication of Dense, Aligned Arrays
of Titania Nanotubes with Well-Controlled Dimensions on Substrates, Adv. Mater.,
2004, 16, 2052.
254. T. Maiyalagan et al., Fabrication and characterization of uniform TiO2
nanotube arrays by sol–gel template method, Bull. Mater. Sci., 2006, 29, 705.
255. H. Imai et al., Direct preparation of anatase TiO2 nanotubes in porous
alumina membranes, J. Mater. Chem., 1999, 9, 2971.

118
256. D. Wang et al., Novel Three-Dimensional Nanoporous Alumina as a
Template for Hierarchical TiO2 Nanotube Arrays, Small, 2013, 9, 1025.
257. M. Paulose et al., Anodic Growth of Highly Ordered TiO2 Nanotube Arrays
to 134 μm in Length, J. Phys. Chem. B, 2006, 110, 16179.
258. S. Yoriya et al., Fabrication of Vertically Oriented TiO2 Nanotube Arrays
Using Dimethyl Sulfoxide Electrolytes, J. Phys. Chem. C, 2007, 111, 13770.
259. K. Shankar et al., Highly-ordered TiO2 nanotube arrays up to 220 µm in
length: use in water photoelectrolysis and dye-sensitized solar cells,
Nanotechnology, 2007, 18, 065707.
260. M. Paulose et al., TiO2 Nanotube Arrays of 1000 μm Length by Anodization
of Titanium Foil: Phenol Red Diffusion, J. Phys. Chem. C, 2007, 111, 14992.
261. D. Xu et al., Preparation and characterization of CdS nanowire arrays by dc
electrodeposit in porous anodic aluminum oxide templates, Chemical Physics
Letters, 2000, 325, 340.
262. S. J. Limmer et al., Electrophoretic Growth of Lead Zirconate Titanate
Nanorods, Adv. Mater., 2001, 13, 1269.
263. Z. Miao et al., Electrochemically Induced Sol−Gel Preparation of
Single-Crystalline TiO2 Nanowires, Nano Lett., 2002, 2, 717.
264. Z. Liu et al., Efficient photocatalytic degradation of gaseous acetaldehyde by
highly ordered TiO2 nanotube arrays, Environ. Sci. Technol., 2008, 42, 8547.
265. Y. Zhao et al., Super-long aligned TiO2/carbon nanotube arrays,
Nanotechnology, 2010, 21, 505702.
266. A. Aggeli et al., Hierarchical self-assembly of chiral rod-like molecules as a
model for peptide β-sheet tapes, ribbons, fibrils, and fibers, Proc. Natl Acad. Sci.
USA, 2001, 98 ,11857.
267. E. R. Zubarev et al., Conversion of supramolecular clusters to
macromolecular objects, Science, 1999, 283, 523.
268. E. R. Zubarev et al., Self-Assembly of Dendron Rodcoil Molecules into
Nanoribbons, J. Am. Chem. Soc., 2001, 123, 4105.
269. H. A. Klok et al., Self-assembling biomaterials:
L-lysine-dendron-substituted cholesteryl-(L-lactic acid)n, Macromol., 2002, 35,
6101.
270. Z. Li et al., Multicompartment Micelles from ABC Miktoarm Stars in Water,
Science, 2004, 306, 98.
271. H. Dong et al., Self-Assembly of Multidomain Peptides: Balancing
Molecular Frustration Controls Conformation and Nanostructure,
J. Am. Chem. Soc., 2007, 129, 12468.
272. F. H. C. Crick et al., The packing of -helices: simple coiled-coils, Acta
Cryst., 1953, 6, 689.
273. L. Pauling et al., Compound Helical Configurations of Polypeptide Chains:
Structure of Proteins of the α-Keratin Type, Nature, 1953, 171, 59.
274. M. J. Pandya et al., Sticky-End Assembly of a Designed Peptide Fiber
Provides Insight into Protein Fibrillogenesis, Biochemistry, 2000, 39, 8728.
275. J. D. Hartgerink et al., Self-Assembly and Mineralization of
Peptide-Amphiphile Nanofibers, Science, 2001, 294, 1684.
276. T. C. Holmes et al., Extensive neurite outgrowth and active synapse

119
formation on self-assembling peptide scaffolds, Proc. Natl Acad. Sci. USA, 2000,
97, 6728.
277. K. Matsuzaki et al., Why and how are peptide–lipid interactions utilized for
self-defense? Magainins and tachyplesins as archetypes, Biochim. Biophys. Acta,
1999, 1462, 1.
278. E. J. Prenner et al., The interaction of the antimicrobial peptide gramicidin S
with lipid bilayer and biological membranes, Biochim. Biophys. Acta, 1999, 1462,
201.
279. S. Vauthey et al., Molecular self-assembly of surfactant-like peptides to form
nanotubes and nanovesicles, Proc. Natl Acad. Sci. USA, 2002, 99, 5355.
280. S. Zhang et al., Spontaneous assembly of a self-complementary oligopeptide
to form a stable macroscopic membrane, Proc. Natl Acad. Sci. USA, 1993, 90,
3334.
281. J. D. Hartgerink et al., Self-Assembly and Mineralization of
Peptide-Amphiphile Nanofibers, Science, 2001, 294, 1684.
282. S. E. Paramonov et al., Self-Assembly of Peptide−Amphiphile Nanofibers:
The Roles of Hydrogen Bonding and Amphiphilic Packing, J. Am. Chem. Soc.,
2006, 128, 7291.
283. Z. M. Yang et al., Self-assembly of small molecules affords multifunctional
supramolecular hydrogels for topically treating simulated uranium wounds, Chem.
Commun., 2005, 4414.
284. Z. M. Yang et al., Small molecule hydrogels based on a class of
anti-inflammatory agents, Chem. Commun., 2004, 208.
285. M. Reches et al., Formation of Closed-Cage Nanostructures by
Self-Assembly of Aromatic Dipeptides, Nano Lett., 2004, 4, 581.
286. V. Jayawarna et al., Nano-structured hydrogels for 3D cell culture through
self-assembly of Fmoc-dipeptides, Adv. Mater., 2006, 18, 611.
287. Z. A. C. Schnepp et al., Hybrid Biocomposites Based on Calcium Phosphate
Mineralization of Self-Assembled Supramolecular Hydrogels, Adv. Mater., 2006,
18, 1869.
288. M. Reches et al., Casting Metal Nanowires Within Discrete Self-Assembled
Peptide Nanotubes, Science, 2003, 300, 625.
289. Z. M. Yang et al., Enzymatic Formation of Supramolecular Hydrogels, Adv.
Mater., 2004, 16, 1440.
290. Z. M. Yang et al., Small molecule hydrogels based on a class of
anti-inflammatory agents, Chem. Commun., 2004, 208.
291. Y. Zhang et al., Supramolecular hydrogels respond to ligand-receptor
interaction, J. Am. Chem. Soc., 2003, 125, 13680.
292. A. M. Smith et al., Fmoc-Diphenylalanine Self Assembles to a
Hydrogel via a Novel Architecture Based on π-π Interlocked β-Sheets, Adv.
Mater., 2008, 20, 37.
293. G. A. Silva et al., Selective Differentiation of Neural Progenitor Cells by
High-Epitope Density Nanofibers, Science, 2004, 303, 1352.
294. W. A. Petka et al., Reversible Hydrogels from Self-Assembling Artificial
Proteins, Science, 1998, 281, 389.
295. A. Aggeli et al., pH as a Trigger of Peptide β-Sheet Self-Assembly and

120
Reversible Switching between Nematic and Isotropic Phases, J. Am. Chem. Soc.,
2003, 125, 9619.
296. J. H. Collier et al., Thermally and Photochemically Triggered Self-Assembly
of Peptide Hydrogels, J. Am. Chem. Soc., 2001, 123, 9463.
297. J. P. Schneider et al., Responsive Hydrogels from the Intramolecular Folding
and Self-Assembly of a Designed Peptide, J. Am. Chem. Soc., 2002, 124, 15030.
298. J. K. Kretsinger et al., Cytocompatibility of self-assembled beta-hairpin
peptide hydrogel surfaces, Biomaterials, 2005, 26, 5177.
299. B. Obzas et al., Salt-Triggered Peptide Folding and Consequent
Self-Assembly into Hydrogels with Tunable Modulus, Macromolecules, 2004, 37,
7331.
300. E. Westhaus et al., Triggered release of calcium from lipid vesicles: a
bioinspired strategy for rapid gelation of polysaccharide and protein hydrogels,
Biomaterials, 2001, 22, 453.
301. Z. Yang et al., Small molecule hydrogels based on a class of
anti-inflammatory agents, Chem. Commun., 2004, 2, 208.
302. H. Jun et al., Enzyme-Mediated Degradation of Peptide-Amphiphile
Nanofiber Networks, Adv. Mater., 2005, 17, 2612.
303. S. Toledano et al., Enzyme-Triggered Self-Assembly of Peptide Hydrogels
via Reversed Hydrolysis, J. Am. Chem. Soc., 2006, 128, 1070.
304. Z. Yang et al., In Vitro and In Vivo Enzymatic Formation of Supramolecular
Hydrogels Based on Self-Assembled Nanofibers of a β-Amino Acid Derivative,
Small, 2007, 3, 558.
305. A. K. Das et al., Exploiting Enzymatic (Reversed) Hydrolysis in Directed
Self-Assembly of Peptide Nanostructures, Small, 2008, 4, 279.
306. Z. Yang et al., Using a Kinase/Phosphatase Switch to Regulate a
Supramolecular Hydrogel and Forming the Supramolecular Hydrogel in Vivo,
J. Am. Chem. Soc., 2006, 128, 3038.
307. G. Fu et al., Acceleration of Calcite Kinetics by Abalone Nacre Proteins, Adv.
Mater., 2005, 17, 2678.
308. G. Fu et al., CaCO3 biomineralization: acidic 8-kDa proteins isolated from
aragonitic abalone shell nacre can specifically modify calcite crystal morphology,
Biomacromolecules, 2005, 6, 1289.
309. A. Berman et al., Interactions of sea-urchin skeleton macromolecules with
growing calcite crystals— a study of intracrystalline proteins, Nature, 1988, 331,
546.
310. A. Berman et al., Intercalation of sea urchin proteins in calcite: study of a
crystalline composite material, Science, 1990, 250, 664.
311. G. Daculsi et al., Length and shape of enamel crystals, Calc. Tissue Int.,
1984, 36, 550.
312. J. Coombs et al., Studies on the biochemistry and fine structure of
silica-shell formation in diatoms, Planta, 1968, 82, 280.
313. W. Traub et al., Three-dimensional ordered distribution of crystals in turkey
tendon collagen fibers, Proc. Natl Acad. Sci. USA, 1989, 86, 9822.
314. H. A. Lowenstam et al., On Biomineralization, 1989, Oxford University
Press: Oxford, U.K.,

121
315. K. Shimizu et al., Silicatein α: Cathepsin L-like protein in sponge biosilica,
Proc. Natl Acad. Sci. USA, 1998, 95, 6234.
316. J. N. Cha et al., Silicatein filaments and subunits from a marine sponge
direct the polymerization of silica and silicones in vitro, Proc. Natl Acad. Sci.
USA, 1999, 96, 361.
317. Y. Zhou et al., Efficient Catalysis of Polysiloxane Synthesis by
Silicatein α Requires Specific Hydroxy and Imidazole Functionalities, Angew.
Chem. Int. Ed., 1999, 38, 779.
318. R. E. Hecky et al., The amino acid and sugar composition of diatom
cell-walls, Mar. Biol., 1973, 19, 323.
319. K. D. Lobel et al., Computational model for protein-mediated
biomineralization of the diatom frustule, Mar. Biol. (Berlin), 1996,126, 353.
320. C. A. Bauer et al., Silica Particle Formation in Confined Environments via
Bioinspired Polyamine Catalysis at Near-Neutral pH, Small, 2007, 3, 58.
321. T. Mizutani et al., Silicic Acid Polymerization Catalyzed by Amines and
Polyamines, Bull.Chem.Soc.Jpn., 1998, 71, 2017.
322. S. V. Patwardhan et al., Effect of process parameters on the polymer
mediated synthesis of silica at neutral pH, Silicon Chem., 2002, 1, 47.
323. K. M. Delak et al., Amine-catalyzed biomimetic hydrolysis and
polymerization of organosilicate, Chem.Mater., 2005, 17, 3221.
324. K. J. C. van Bommel et al., Poly(L-lysine) Aggregates as Templates for the
Formation of Hollow Silica Spheres, Adv.Mater., 2001, 13, 1472.
325. S. V. Patwardhan et al., The Use of Poly-L-Lysine to Form Novel Silica
Morphologies and the Role of Polypeptides in Biosilicification, J. Inorg.
Organomet. Polym., 2001, 11, 193.
326. M. K. Liang et al., Imidazole catalyzed silica synthesis: Progress toward
understanding the role of histidine in (bio)silicification, J.Mater.Res., 2009, 24,
1700.
327. S. V. Patwardhan et al., Silicification and Biosilicification. Part 6.
Poly-L-Histidine Mediated Synthesis of Silica at Neutral pH,
J.Inorg.Organomet.Polym., 2003, 13, 49.
328. T. Coradin et al., Interactions of Amino-Containing Peptides with Sodium
Silicate and Colloidal Silica: A Biomimetic Approach of Silicification, Langmuir,
2002, 18, 2331.
329. S. Kessel et al., High Rate Silicification of Peptide-Polymer Assemblies
Toward Composite Nanotapes, Macromol. Rapid Commun., 2008, 29, 419.
330. J. E. Meegan et al., Designed self-assembled β-sheet peptide fibrils as
templates for silica nanotubes, Adv.Funct.Mater., 2004, 14, 31.
331. S.C. Holmstrom et al., Templating silica nanostructures on rationally
designed self-assembled peptide fibers, Langmuir, 2008, 24, 11778.
332. A. Altunbas et al., Peptide−Silica Hybrid Networks: Biomimetic Control
of Network Mechanical Behavior, ACS Nano, 2010, 4, 181.
333. H. Yang et al., The Role of Defects in the Formation of Mesoporous Silica
Fibers, Films, and Curved Shapes, Adv.Mater., 1998, 10, 883.
334. J. N. Cha et al., Biomimetic synthesis of ordered silica structures mediated
by block copolypeptides, Nature, 2000, 403, 289.

122
335. V. M. Yuwono et al., Peptide Amphiphile Nanofibers Template and Catalyze
Silica Nanotube Formation, Langmuir, 2007, 23, 5033.
336. K. M. Roth et al., Bifunctional Small Molecules Are Biomimetic Catalysts
for Silica Synthesis at Neutral pH, J. Am. Chem. Soc., 2005, 127, 325.
337. D. Kisailus et al., Functionalized gold nanoparticles mimic catalytic activity
of a polysiloxane-synthesizing enzyme, Adv. Mater., 2005, 17, 1234.
338. A. K. Geim et al., The rise of graphene, Nature Materials, 2007, 6, 183.
339. K. S. Novoselov et al., Electric field effect in atomically thin carbon films,
Science, 2004, 306, 666.
340. K. S. Novoselov et al., Two-dimensional gas of massless Dirac fermions in
graphene, Nature, 2005, 438, 197.
341. C. Lee et al., Measurement of the elastic properties and intrinsic
strength of monolayer graphene, Science, 2008, 321, 385.
342. A. A. Balandin et al., Superior Thermal Conductivity of Single-Layer
Graphene, Nano Lett., 2008, 8, 902.
343. H. Chen et al., Mechanically Strong, Electrically Conductive, and
Biocompatible Graphene Paper, Adv. Mater., 2008, 20, 3557.
344. M. D. Stoller et al., Graphene-Based Ultracapacitors, Nano Lett., 2008, 8,
3498.
345. R. M. Westervelt et al., Graphene Nanoelectronics, Science, 2008, 320, 324.
346. G. Eda et al., Large-area ultrathin films of reduced graphene oxide as a
transparent and flexible electronic material, Nat. Nanotechnol., 2008, 3, 270.
347. P. Blake et al., Graphene-Based Liquid Crystal Device, Nano Lett., 2008, 8,
1704.
348. R. I. Jafri et al., Nitrogen doped graphene nanoplatelets as catalyst support
for oxygenreduction reaction in proton exchange membrane fuel cell, J. Mater.
Chem., 2010, 20, 7114.
349. S. Watcharotone et al., Graphene−Silica Composite Thin Films as
Transparent Conductors, Nano Lett., 2007, 7, 1888.
350. G. Eda et al., Graphene-based Composite Thin Films for Electronics, Nano
Lett., 2009, 9, 814.
351. Z. Liu et al., PEGylated Nanographene Oxide for Delivery of
Water-Insoluble Cancer Drugs, J. Am. Chem. Soc., 2008, 130, 10876.
352. Y. Wang et al., Nitrogen-Doped Graphene and Its Application in
Electrochemical Biosensing, ACS Nano, 2010, 4, 1790.
353. Y. Shao et al., Graphene Based Electrochemical Sensors and Biosensors: A
Review, Electroanalysis, 2010, 22, 1027.
354. M. A. Rafiee et al., Enhanced Mechanical Properties of Nanocomposites at
Low Graphene Content, ACS Nano, 2009, 3, 3884.
355. M. A. Rafiee et al., Fracture and Fatigue in Graphene Nanocomposites,
Small, 2010, 6, 179.
356. J. Du et al., Comparison of electrical properties between multi-walled
carbon nanotube and graphene nanosheet/high density polyethylene composites
with a segregated network structure, Carbon, 2011, 49, 1094.
357. S. H. Xie et al., Comparison of the effective conductivity between
composites reinforced by graphene nanosheets and carbon nanotubes, Appl. Phys.

123
Lett., 2008, 92, 243121.
358. T. Ohta et al., Controlling the Electronic Structure of Bilayer Graphene,
Science, 2006, 313, 951.
359. M. F. Craciun et al., Trilayer graphene is a semimetal with a gate-tunable
band overlap, Nature Nanotech., 2009, 4, 383.
360. E. McCann et al., Asymmetry gap in the electronic band structure of bilayer
graphene, Phys. Rev. B, 2006, 74, 161403.
361. Y. Zhang et al., Direct observation of a widely tunable bandgap in bilayer
graphene, Nature, 2009, 459, 820.
362. T. Ohta et al., Controlling the Electronic Structure of Bilayer Graphene,
Science, 2006, 313, 951.
363. E. V. Castro et al., Biased Bilayer Graphene: Semiconductor with a Gap
Tunable by the Electric Field Effect, Phys. Rev. Lett., 2007, 99, 216802.
364. F. Xia et al., Graphene Field-Effect Transistors with High On/Off Current
Ratio and Large Transport Band Gap at Room Temperature, Nano Lett., 2010, 10,
715.
365. C. H. Lui et al., Observation of an electrically tunable band gap in trilayer
graphene, Nature Physics, 2011, 7, 944.
366. M. Y. Han et al., Energy Band-Gap Engineering of Graphene Nanoribbons,
Phys. Rev. Lett., 2007, 98, 206805.
367. T. Ohta et al., Controlling the Electronic Structure of Bilayer Graphene,
Science, 2006, 313, 951.
368. S. Y. Zhou et al., Substrate-induced bandgap opening in epitaxial graphene,
Nat. Mater., 2007, 6, 770.
369. C. Berger et al., Ultrathin Epitaxial Graphite: 2D Electron Gas Properties
and a Route toward Graphene-based Nanoelectronics, J. Phys. Chem. B, 2004,
108, 19912.
370. C. Berger et al., Electronic Confinement and Coherence in Patterned
Epitaxial Graphene, Science, 2006, 312, 1191.
371. A. N. Obraztsov et al., Chemical vapour deposition: Making graphene on a
large scale, Nat. Nanotechnol., 2009, 4, 212.
372. K. S. Kim et al., Large-scale pattern growth of graphene films for stretchable
transparent electrodes, Nature, 2009, 457, 706.
373. C. Diaz-Pinto et al., AB-stacked multilayer graphene synthesized via
chemical vapor deposition: a characterization by hot carrier transport, ACS Nano,
2012, 6, 1142.
374. M. J. McAllister et al., Single Sheet Functionalized Graphene by Oxidation
and Thermal Expansion of Graphite, Chem. Mater., 2007, 19, 4396.
375. S. Stankovich et al., Synthesis of graphene-based nanosheets via chemical
reduction of exfoliated graphite oxide, Carbon, 2007, 45, 1558.
376. H. Zhang et al., P25-Graphene Composite as a High Performance
Photocatalyst, ACS Nano, 2010, 4, 380.
377. K. Wang et al., Biocompatibility of Graphene Oxide, Nanoscale Res. Lett.,
2011, 6, 8.
378. S. Park et al., Biocompatible, Robust Free-Standing Paper Composed of a
TWEEN/Graphene Composite, Adv. Mater., 2010, 22, 1736.

124
379. O. Akhavan et al., Wrapping Bacteria by Graphene Nanosheets for Isolation
from Environment, Reactivation by Sonication, and Inactivation by Near-Infrared
Irradiation, J. Phys. Chem. B, 2011, 115, 6279.
380. I. Jung et al., Tunable Electrical Conductivity of Individual Graphene Oxide
Sheets Reduced at “Low” Temperatures, Nano Lett., 2008, 8, 4283.
381. H. He et al., A new structural model for graphite oxide, Chem. Phys. Lett.,
1998, 287, 53.
382. C. Gómez-Navarro et al., Electronic Transport Properties of Individual
Chemically Reduced Graphene Oxide Sheets, Nano.Lett., 2007, 7, 3499.
383. B. C. Brodie, Sur le poids atomique du graphite, Ann. Chim. Phys., 1860, 59,
466.
384. W. S. Hummers Jr et al., Preparation of Graphitic Oxide, J. Am. Chem. Soc.,
1958, 80, 1339.
385. S. Park et al., Chemical methods for the production of graphenes, Nat. Nano,
2009, 4, 217.
386. X. Wang et al., Transparent, Conductive Graphene Electrodes for
Dye-Sensitized Solar Cells, Nano Lett., 2008, 8, 323.
387. X. Z. Zhou et al., In Situ Synthesis of Metal Nanoparticles on Single-Layer
Graphene Oxide and Reduced Graphene Oxide Surfaces, J.Phys.Chem.C, 2009,
113, 10842.
388. D. R. Dreyer et al., The chemistry of graphene oxide, Chem. Soc. Rev., 2010,
39, 228.
389. S. Park et al., Aqueous Suspension and Characterization of Chemically
Modified Graphene Sheets, Chem. Mater., 2008, 20, 6592.
390. C. Nethravathi et al., Chemically modified graphene sheets produced by the
solvothermal reduction of colloidal dispersions of graphite oxide, Carbon, 2008,
46, 1994.
391. D. W. Boukhvalov et al., Modeling of Graphite Oxide, J. Am. Chem. Soc.,
2008, 130, 10697.
392. J. J. Kwiatkowski et al., The effect of morphology on electron field-effect
mobility in disordered C60 thin films, Nano Lett., 2009, 9, 1085.
393. N. R. Wilson et al., Graphene Oxide: Structural Analysis and Application as
a Highly Transparent Support for Electron Microscopy, ACS Nano, 2009, 3, 2547.
394. J. P. Rourke et al., The Real Graphene Oxide Revealed: Stripping the
Oxidative Debris from the Graphene-like Sheets, Angew. Chem. Int. Ed. 2011, 50,
3173.
395. Y. Xu et al., Strong and ductile poly(vinyl alcohol)/graphene oxide
composite films with a layered structure, Carbon, 2009, 47, 3538.
396. C. Chen et al., Synthesis of visible-light responsive graphene oxide/TiO2
composites with p/n heterojunction, ACS Nano, 2010, 4, 6425.
397. X. Li et al., Highly conducting graphene sheets and Langmuir-Blodgett
films, Nat.Nanotechnol., 2008, 3, 538.
398. J. N. Coleman et al., Liquid-Phase Exfoliation of Nanotubes and Graphene,
Adv.Funct.Mater., 2009, 19, 3680.
399. S. De et al., Flexible, transparent, conducting films of randomly stacked
graphene from surfactant-stabilized, oxide-free graphene dispersions, Small, 2010,
125
6, 458.
400. Y. Hernandez et al., High-yield production of graphene by liquid-phase
exfoliation of graphite, Nature Nanotechnol., 2008, 3, 563.
401. U. Khan et al., High-Concentration Solvent Exfoliation of Graphene, Small,
2010, 6, 864.
402. M. Lotya et al., Liquid Phase Production of Graphene by Exfoliation of
Graphite in Surfactant/Water Solutions, J. Am. Chem. Soc., 2009, 131, 3611.
403. M. Lotya et al., High-concentration, surfactant-stabilized graphene
dispersions, ACS Nano., 2010, 4, 3155.
404. U. Khan et al., Development of stiff, strong, yet tough composites by the
addition of solvent exfoliated graphene to polyurethane, Carbon, 2010, 48, 4035.
405. U. Khan et al., Solvent-exfoliated graphene at extremely high concentration,
Langmuir, 2011, 27, 9077.
406. C. Gómez-Navarro et al., Atomic Structure of Reduced Graphene Oxide,
Nano Lett., 2010, 10, 1144.
407. F. Banhart et al., Structural Defects in Graphene, ACS Nano, 2011, 5, 26.
408. A. O’Neill et al., Graphene Dispersion and Exfoliation in Low Boiling Point
Solvents, J. Phys. Chem. C, 2011, 115, 5422.
409. R. J. Smith et al., The importance of repulsive potential barriers for the
dispersion of graphene using surfactants, New Journal of Physics, 2010, 12,
125008.
410. A. A. Green et al., Solution Phase Production of Graphene with Controlled
Thickness via Density Differentiation, Nano Lett., 2009, 9, 4031.
411. U. Khan et al., Size selection of dispersed, exfoliated graphene flakes by
controlled centrifugation, Carbon, 2012, 50, 470.
412. J. Li et al., Au/graphene hydrogel: synthesis, characterization and its use for
catalytic reduction of 4-nitrophenol, J. Mater. Chem., 2012, 22, 8426.
413. S. Liu et al., Microwave-assisted rapid synthesis of Ag
nanoparticles/graphene nanosheet composites and their application for hydrogen
peroxide detection, J. Nanopart. Res., 2011, 13,4539.
414. F. Zhang et al., Microwave-Assisted Synthesis of Pt/Graphene
Nanocomposites for Nonenzymatic Hydrogen Peroxide Sensor, Int. J.
Electrochem. Sci., 2012, 7, 1968.
415. X. Yang et al., Novel Synthesis of Layered Graphite Oxide−Birnessite
Manganese Oxide Nanocomposite, Chem. Mater., 2003, 15, 1228.
416. C. Nethravathi et al., Graphite oxide-intercalated anionic clay and its
decomposition to graphene-inorganic material nanocomposites, Langmuir, 2008,
24, 8240.
417. Y. H. Chu et al., Synthesis of nanoporous graphite-derived carbon-silica
composites by a mechanochemical intercalation approach, Langmuir, 2005, 21,
2545.
418. B. Lia et al., ZnO@graphene composite with enhanced performance for the
removal of dye from water, J. Mater. Chem., 2011, 21, 3346.
419. X.Y. Zhang et al., Preparation and Photocatalytic Activity for Hydrogen
Evolution of TiO2/Graphene Sheets Composite, Chin.J.Inorg.Chem., 2009, 25,
1903.

126
420. X. Meng et al., Controllable synthesis of graphene-based titanium dioxide
nanocomposites by atomic layer deposition, Nanotechnology, 2011, 22, 165602.
421. H. Zhang et al., A Facile One-Step Synthesis of TiO2/Graphene Composites
for Photodegradation of Methyl Orange, Nano Res., 2011, 4, 274.
422. D. Wang et al., Self-Assembled TiO2–Graphene Hybrid Nanostructures for
Enhanced Li-Ion Insertion, ACS Nano, 2009, 3, 907.
423. Y. Tang et al., Incorporation of Graphenes in Nanostructured
TiO2 Films via Molecular Grafting for Dye-Sensitized Solar Cell Application,
ACS Nano, 2010, 4, 3482.
424. X. Zhang et al., Graphene/TiO2 nanocomposites: synthesis, characterization
and application in hydrogen evolution from water photocatalytic splitting,
J.Mater.Chem., 2010, 20, 2801.
425. J. S. Chen et al., Graphene-wrapped TiO2 hollow structures with
enhanced lithium storage capabilities, Nanoscale, 2011, 3, 2158.
426. H. Kim et al., Solar Photoconversion Using Graphene/TiO2 Composites:
Nanographene Shell on TiO2 Core versus TiO2 Nanoparticles on Graphene Sheet,
J. Phys. Chem. C, 2012, 116, 1535.
427. G. Williams et al., TiO2-Graphene Nanocomposites. UV-Assisted
Photocatalytic Reduction of Graphene Oxide, ACS Nano, 2008, 2, 1487.
428. N. J. Bell et al., Understanding the Enhancement in Photoelectrochemical
Properties of Photocatalytically Prepared TiO2-Reduced Graphene Oxide
Composite, J. Phys. Chem. C, 2011, 115, 6004.
429. H. Zhang et al., P25-Graphene Composite as a High Performance
Photocatalyst, ACS Nano, 2010, 4, 380.
430. K. Zhou et al., Preparation of graphene–TiO2 composites with enhanced
photocatalytic activity, New J. Chem., 2011, 35, 353.
431. H. Wang et al., Solvothermal Reduction of Chemically Exfoliated Graphene
Sheets, J. Am. Chem. Soc., 2009, 131, 9910.
432. O. Akhavan et al., Photocatalytic Reduction of Graphene Oxide Nanosheets
on TiO2 Thin Film for Photoinactivation of Bacteria in Solar Light Irradiation, J.
Phys. Chem. C, 2009, 113, 20214.
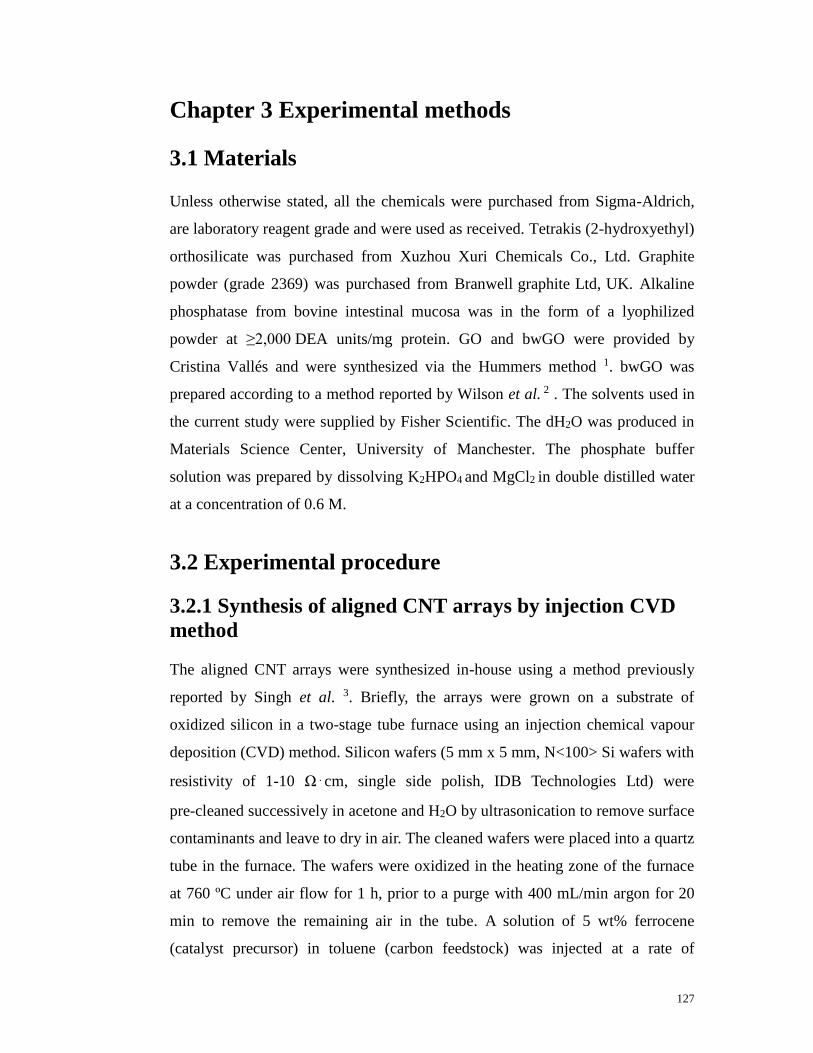
127
Chapter 3 Experimental methods
3.1 Materials Unless otherwise stated, all the chemicals were purchased from Sigma-Aldrich,
are laboratory reagent grade and were used as received. Tetrakis (2-hydroxyethyl)
orthosilicate was purchased from Xuzhou Xuri Chemicals Co., Ltd. Graphite
powder (grade 2369) was purchased from Branwell graphite Ltd, UK. Alkaline
phosphatase from bovine intestinal mucosa was in the form of a lyophilized
powder at ≥2,000 DEA units/mg protein. GO and bwGO were provided by
Cristina Vallés and were synthesized via the Hummers method 1. bwGO was
prepared according to a method reported by Wilson et al. 2 . The solvents used in
the current study were supplied by Fisher Scientific. The dH2O was produced in
Materials Science Center, University of Manchester. The phosphate buffer
solution was prepared by dissolving K2HPO4 and MgCl2 in double distilled water
at a concentration of 0.6 M.
3.2 Experimental procedure
3.2.1 Synthesis of aligned CNT arrays by injection CVD
method
The aligned CNT arrays were synthesized in-house using a method previously
reported by Singh et al. 3. Briefly, the arrays were grown on a substrate of
oxidized silicon in a two-stage tube furnace using an injection chemical vapour
deposition (CVD) method. Silicon wafers (5 mm x 5 mm, N<100> Si wafers with
resistivity of 1-10 Ω⋅cm, single side polish, IDB Technologies Ltd) were
pre-cleaned successively in acetone and H2O by ultrasonication to remove surface
contaminants and leave to dry in air. The cleaned wafers were placed into a quartz
tube in the furnace. The wafers were oxidized in the heating zone of the furnace
at 760 ºC under air flow for 1 h, prior to a purge with 400 mL/min argon for 20
min to remove the remaining air in the tube. A solution of 5 wt% ferrocene
(catalyst precursor) in toluene (carbon feedstock) was injected at a rate of

128
0.04mL/min into the pre-heating stage (200 ºC) of the furnace where the solution
was vaporized and carried by argon flowing at 100 mL/min into the heating zone
of the furnace. Aligned CNT arrays were grown from the oxidized silicon
substrate for 1 h at 760 ºC. The furnace was then cooled to room temperature
under the protection of argon to avoid oxidation of CNTs. The diagram of the
furnace set-up is displayed in Figure 3.1. The morphology and dimensions of the
as-grown CNT arrays were characterized using SEM and TEM.
Figure 3.1 Schematic diagram showing the set-up for the CVD synthesis of aligned
CNT arrays.
3.2.2 Adsorption study of the surfactants on CNTs
3.2.2.1 Adsorption of the surfactants on aligned CNT arrays
The adsorption behaviour of the surfactants (which acted as surface modifiers in
the inorganic coating experiments) was studied by monitoring the change in the
concentration of the surfactant solution in the presence of the nanotubes over time
using UV-Vis spectroscopy (Hitachi U-1800 spectrophotometer, U.K). A series
of aromatic Fmoc-AAs were studied to investigate the effect of amino acid side
chain on the adsorption behaviour. Figure 3.2a shows the four aromatic
Fmoc-AAs studied: Fmoc-tryptophan (Trp), Fmoc-phenylalanine (Phe),
Fmoc-tyrosine (Tyr), and Fmoc-histidine (His). Fmoc-Glycine (Gly) was also
used as a nonaromatic control.
Argon
Syringe containing 5wt%ferrocene in toluene
Preheating stage 200 ºC
Temperature control
Silicon oil
Quartz tube CNT arrays grown on silica
substrate
Heating zone 760 ºC

129
In a typical measurement, aligned CNT arrays on a 5 mm x 5 mm silicon wafer
(Figure 3.2c) were placed into a quartz cuvette containing 3 mL of 0.05 mM
Fmoc-Trp aqueous solution (Figure 3.2b). UV-Vis measurements were carried
out over time to monitor the change in the absorbance of the solution. The spectra
were also collected in the absence of the substrate as a reference. The same
measurement was performed for all the modifiers studied. The Fmoc group was
also compared with other aromatic ligands such as the benzyl group of benzyl
alcohol (Figure 3.2a).

130
Detector
UV/Vis Light Source
Modifier solution
(d)
10μm
(c)
Fmoc group R1 = any amino acid
Histidine (His) Glycine (Gly)
Tryptophan (Trp) Phenylalanine (Phe) Tyrosine (Tyr)
R1=
(a)
(b)
Benzyl
alcohol

131
Figure 3.2 (a) Molecular structures of the modifiers studied. (b) Scheme illustrating
the UV-Vis measurement of the adsorption of the surfactant on (c) aligned CNT
arrays (side-view) and (d) randomly aligned CNT networks.
The concentration of the solution was determined by using the Beer-Lambert law.
Which describes the linear relationship between the absorbance and concentration
of an absorbing species which is usually written as:
A= ε b c (3.1)
where A is the measured absorbance of the modifier solution (dimensionless), ε is
the molar absorptivity of the modifier molecule in solution (L mol-1cm-1), b is the
path length of the cuvette, which is 1 cm in the current study, and c is the
concentration of the modifiers in solution (mol L-1). According to Beer-Lambert
law, the absorbance is directly proportional to the concentration of the solution.
However, it should be noted that the Law is not obeyed at relatively high
concentrations. A calibration curve was constructed for calculating the
concentration of the solution from the absorbance. The calibration curve was
plotted by preparing a series of modifier solutions of known concentrations which
were spaced relatively equally apart and the absorbance at 265 nm (corresponding
to the absorbance of the Fmoc group) was measured. In the case of BA, the
absorbance at 257 nm was measured. The calibration curves of all the modifiers
studied are shown in Figure 3.3.
(a)
0
0.1
0.2
0.3
0.4
0.5
0 0.005 0.01 0.015 0.02 0.025
Concentration / mM
Ab
so
rban
ce

132
0
0.2
0.4
0.6
0.8
1
0 0.005 0.01 0.015 0.02 0.025 0.03 0.035 0.04 0.045
Concentration / mM
Ab
so
rban
ce
(b)
0
0.5
1
1.5
2
0 0.02 0.04 0.06 0.08 0.1 0.12
Concentration / mM
Ab
so
rban
ce
(c)
0
0.2
0.4
0.6
0.8
1
0 0.01 0.02 0.03 0.04 0.05 0.06
Concentration / mM
Ab
sorb
ance
(d)
133
Figure 3.3 Calibration curves of all the modifiers studied. (a) Fmoc-Trp. Equation
of line: y=20.07x+0.0081, correlation coefficient R2=0.99. (b) Fmoc-Tyr. Equation of
line: y=19.01x-0.0080, R2=1.00. (c) Fmoc-His. Equation of line: y =16.69x + 0.0173,
R2=1.00. (d) Fmoc-Phe. Equation of line: y=18.49x+0.0005, R2=1.00. (e) Fmoc-Gly.
Equation of line: y=17.30x+0.0023, R2=1.00. (f) BA. Equation of line:
y=0.23x-0.0195, R2=0.99.
The value of the molar absorptivity ε was determined from the slope of the
calibration curve according to equation 3.1 and was listed in Table 3.1.
0
0.2
0.4
0.6
0.8
1
0 0.01 0.02 0.03 0.04 0.05 0.06
Concentration / mM
Ab
so
rban
ce
(e)
(f)
0
0.2
0.4
0.6
0.8
1
1.2
1.4
1.6
0 1 2 3 4 5 6 7
Concentration / mM
Ab
so
rban
ce

134
Table 3.1 Calculated molar absorptivity ε for all the modifiers studied.
Fmoc-AAs ε (L mol-1cm-1)
Fmoc-Trp 2.007 ×10⁴
Fmoc-His 1.669 ×10⁴
Fmoc-Phe 1.849 ×10⁴
Fmoc-Tyr 1.901 ×10⁴
Fmoc-Gly 1.730 ×10⁴
BA 2.3 ×10²
The surface area of CNTs was determined by measuring their specific surface
area and mass. The specific surface area of CNTs was measured by the physical
adsorption of N2 on the sample at the temperature of liquid nitrogen following
BET (Brunauer, Emmett and Teller) method 4 using a Coulter SA 3100 surface
area and pore size analyzer. During the analysis, N2 was added into an evacuated
tube containing the sample in a series of controlled doses. During this process, the
sample tube was kept at a constant temperature. The pressure in the sample vessel
was measured after the adsorption equilibrium following each dose. The recorded
pressure was used to calculate the volume of gas adsorbed which was plotted as a
function of the relative pressure (the ratio of the pressure in the sample tube to the
saturation vapor pressure of the adsorbate gas) to construct the adsorption
isotherm. The specific surface area was then calculated from the resulting
isotherm. The mass of CNTs was calculated by subtracting the mass of the Si
substrate from that of the arrays which was measured prior to introduction to the
surfactant solution. The mass of the Si substrate was determined after scratching
the CNTs off the substrate. The morphology of CVD grown CNT arrays and
randomly aligned CNT networks were characterized by SEM.
3.2.2.2 Adsorption of the surfactants on randomly aligned
CNT networks
Randomly aligned CNT networks (Figure 3.2d) were also used as a model surface

135
to study the adsorption behavior of the modifiers. The substrate was prepared by
dispersing 0.2 mg of CNTs in EtOH followed by depositing onto a silicon wafer
of 1 cm x 1 cm. The dried substrate was placed into a quartz cuvette containing
3 mL of 0.05 mM Fmoc-Trp solution. UV-Vis measurements were carried out
over time to monitor the change in the concentration of the solution.
3.2.2.3 Desorption of the surfactants from CNT arrays in
H2O
The desorption behaviour of Fmoc-Trp and Fmoc-Phe from CNT arrays was
investigated in H2O. The functionalized arrays from the adsorption study were
placed into 3 mL of H2O and the UV-Vis spectra were recorded over time.
3.2.2.4 Freundlich adsorption isotherm
An adsorption isotherm is an equilibrium relationship between the quantity of the
adsorbate on the surface of an adsorbent and the equilibrium concentration of the
adsorbate in solution. There are two well established types of adsorption
isotherms: the Langmuir adsorption isotherm and the Freundlich adsorption
isotherm. The Langmuir isotherm is applicable to ideal sorption where monolayer
is formed. Whereas, the Freundlich isotherm model is applicable to non-ideal
sorption on heterogeneous surfaces where multilayers can be formed. The
Freundlich adsorption isotherm is an empirical equation based on the distribution
of the solute between the solid phase (the surface of an absorbent) and aqueous
phase at equilibrium, which is given by:
Q = k C1/n (n>1) (3.2)
Where, for the current purpose Q (mol kg -1) is the equilibrium loading of
Fmoc-AAs on unit weight of CNT arrays and C (mol m-3) is the equilibrium
concentration of Fmoc-AAs in solution. The constant k is effectively the
adsorption capacity or adsorption power of the surface for the modifiers, which
indicates the number of binding sites available on the surface. The constant n is
related to the lateral interaction between the adsorbed molecules and the
136
heterogeneity of the surface which prevents this interaction, i.e. the adsorption
intensity. Equation 3.2 is linearized into logarithmic form for data fitting as
follows:
ln Q = ln k + 1/n × ln C (3.3)
Thus the constant k and n can be calculated from the intercept and slope of the
linear plot of ln Q against ln C respectively according to equation 3.3.
In the current study, to obtain the adsorption isotherm of the modifiers on CNT
arrays, a series of Fmoc-Trp solutions with concentrations of 0.025, 0.033, 0.044
and 0.051 mM were prepared. CNT arrays of known mass were placed into 3 mL
of each of solution and the UV-Vis absorption was measured over time until there
was no change. The same measurement was also conducted with Fmoc-Gly and
BA solutions.
3.2.2.5 Competitive binding from the Fmoc-AAs library on
graphite
Graphite substrates were placed into 150 mL of the library solution consisting of
5 Fmoc-AAs at a concentration of 0.08 mM (Figure 3.4). Aliquots of the solution
was regularly analysed by reversed-phase HPLC (UltiMate® 3000 Intelligent LC
system with Acclaim® 120 silica-based reversed-phase columns and UVD 170U
detector, DIONEX) to determine the concentration of each species in the solution
until no further change in UV absorbance was observed. The absorbance was
recorded at 265 nm. The HPLC chromatogram of the individual Fmoc-AA
species involved as well as that of the library solution prior to addition of the
substrate was initially recorded for reference.

137
Figure 3.4 Schematic illustration of the competitive binding from the library
solution of Fmoc-AAs on graphite.
3.2.2.6 Switchable surface chemistry
In order to verify that the adsorbed Fmoc-AAs with a lower binding energy could
be displaced by those with a higher binding energy, a switchable surface was
demonstrated. Highly ordered pyrolytic graphite (HOPG) was selected as the
model surface since it is atomically flat and therefore provide a homogenous
surface for accurate contact angle measurement. A freshly cleaved HOPG surface
was obtained by peeling off the topmost layers using scotch tape.
The change in the surface chemistry was followed by water contact angle
measurement (KRÜSS drop shape analysis system DSA100). For the
measurement, a sessile drop of water (10 µL) was deposited on the sample
surface and the profile of the droplet was recorded and analysed with DSA1 v1.9
drop shape analysis software 5. The contact angle was measured on the
assumption that the droplet was at rest on the sample surface and reached
equilibrium quickly. The contact angles at both sides of the droplet were
measured and averaged. The measurements were repeated at 3 different locations
on each of the surfaces and averaged.
The contact angles on HOPG control surface and those functionalized with
Fmoc-Trp Fmoc-Phe Fmoc-Tyr Fmoc-His
Fmoc-Gly
Graphite
HPLC
UV-Vis Filtered

138
Fmoc-Trp and Fmoc-Gly were initially measured for reference. The
functionalized surfaces were prepared by placing the HOPG substrate into 3 mL
of 0.04 mM Fmoc-Trp and Fmoc-Gly solution respectively for 2 days. For the
displacement study, a freshly cleaved HOPG surface was initially placed in 3 mL
of 0.04 mM Fmoc-Gly (low binding energy) solution for 2 days followed by
drying under room temperature for contact angle measurement. The substrate was
then introduced to 3 mL of 0.04 mM Fmoc-Trp (high binding energy) solution for
2 days after which the same measurement was carried out.
3.2.3 Synthesis of CNT-inorganic nanohybrids
3.2.3.1 Synthesis of silica coated Fmoc-AA functionalized
CNTs
The catalyzing effect of the Fmoc-AAs on the sol-gel formation of silica was
initially tested without CNTs. 0.2 mL of TEOS solution (volume ratio of
TEOS:H2O:EtOH=2:1:4) was added to 15 mL of 0.04 mM Fmoc-Trp solution as
well as to H2O as a control. The mixture was sonicated for 30 min to avoid phase
separation followed by stirring for 3 days. Fmoc-His and Fmoc-Tyr solutions
were also tested under the same condition.
Subsequently, the Fmoc-AA functionalized CNTs were employed as templates
for the synthesis of CNT-silica nanohybrids via an in-situ sol-gel process at room
temperature and neutral pH (pH 7.6). In a typical experiment, 2 mg of CNTs were
dispersed in 15 mL of 0.05 mM Fmoc-Trp aqueous solution for 30 min using a tip
sonicator with a 20 s on/off pulse rate (Branson digital sonifier 250). The tip was
placed into the solution approximately one-third of the distance from the surface.
Operating in pulsed mode allows better temperature control than continuous
mode by retarding the rate of temperature increase in the medium. Additionally,
as surfactants are present, the suspension could foam during sonication, which
will interfere with the delivery of ultrasonic energy to the suspension. Pulse mode
operation allows the dissipation of the foam during the off periods. A control
dispersion in which no modifiers were added was also prepared. For the sol-gel

139
coating process, a mixture of TEOS, H2O and EtOH (0.2 mL, volume ratio of
TEOS:H2O:EtOH= 2:1:4) was slowly dropped into the above CNT dispersion and
sonicated for 30 min to avoid phase separation, followed by stirring at room
temperature. The products were collected at 3 days and 21 days by centrifugation
at 8000 rpm for 1 h followed by thorough wash with H2O and ethanol for 3 times
respectively before finally dried at 90 ºC. The same procedure was performed
using Fmoc-His and Fmoc-Tyr as modifiers. The morphology of the as-produced
nanohybrids was characterized by SEM and EDX equipped with SEM was
performed to study the elemental composition of the product. TEM analysis was
conducted on samples prepared for 3 d and 21 d. The dried products were heated
in air at 200 ºC for 2 h using a ramp rate of 1 ºC/min. The annealed samples were
characterized by TEM.
The elemental distribution across a hybrid NT was measured by EDX line scan
using Tecnai F30 operating at 300 kV equipped with an EDX spectrometer. The
line scan was recorded by rastering the electron beam in a line perpendicular to
the tube axis.
The kinetics for the growth of silica coating was studied by both NMR
spectroscopy and SEM. 29Si NMR has been reported previously as a useful tool
for studying the sol-gel process of silica at the molecular level 6,7. It allows
effective identification of numerous silicate species, from dimers to prismatic
hexamers, present in aqueous silicate solutions. In the current study, the 29Si
NMR spectra were obtained on a Bruker 400-MHz NMR spectrometer at room
temperature. The acquisition time was 1.02 s and a relaxation delay of 5 s was
used. Each spectrum consisted of 128 scans. The sample for NMR measurement
was prepared by mixing 0.8 mL of TEOS with 0.4 mL of Fmoc-His/D2O solution
and 1.6 mL of EtOH (MTEOS=1.4 M) under stirring. Samples were collected at
regular intervals until 7 days and examined by NMR. The NMR spectra were
internally referenced to a tetramethylsilane (TMS) standard.

140
The change in the thickness of SiO2 coating over reaction time was also
monitored by SEM to investigate the kinetics. It should be noted that this
approach does not follow silica polymerization but rather infers from the
thickness of the silica coating. The samples collected at 3, 7 and 21 days were
subjected to SEM analysis.
3.2.3.2 Synthesis of TiO2 coated Fmoc-AA functionalized
CNTs
CNT-TiO2 nanohybrids were prepared using the same surface modifiers as those
used for the silica coating experiment via the in-situ sol-gel process. Two
concentrations of CNTs (12wt% and 30wt% with respect to the expected mass of
TiO2) were used to study the role of nanotube concentration. Hybrids containing
30wt% CNTs were prepared by dispersing 2 mg of CNT in 15 mL of EtOH by
ultrasonication for 30 min, to which 1 mL of 0.05 mM Fmoc-Trp solution was
added under stirring at 0 ºC. 0.2 mL of 10% (v/v) TBOT/EtOH solution was then
added dropwise to the CNT dispersion whilst stirring. Similarly, 0.6 mL of 10%
(v/v) TBOT/EtOH solution was added to prepare the hybrids containing 12wt %
CNTs. The reaction was allowed to proceed for 1 h at 0 ºC. The products were
collected by vacuum filtering for the hybrids prepared with 12wt% CNTs, while
for those produced with 30wt% CNTs, the products were collected by
centrifugation. The products were then washed with EtOH for 3 times before
dried in air at room temperature. The same procedure was performed using
Fmoc-His, Fmoc-Tyr and BA as modifiers. A control experiment in which
pristine CNTs were used as templates was also conducted.
The morphology of the as-produced nanohybrids containing 30wt% CNTs was
characterized with SEM and EDX equipped with SEM was performed to study
the elemental composition of the products. The products prepared with both CNT
concentrations were characterized by TEM, SAED and XRD.

141
To investigate the effect of CNT to modifier ratio on the morphology of the
resultant hybrids, 10s diluted modifier solution was used. Briefly, 2 mg of CNTs
were dispersed in 15 mL of EtOH, to which 1 mL of 0.005 mM Fmoc-His
solution was added, followed by mixing with 0.2 mL of 10% (v/v) TBOT/EtOH
solution for 1 h at 0 ºC. The morphology of the product was characterized by
SEM.
Similar to the study of the growth of silica, the kinetics for the growth of TiO2
coating on CNTs was studied by recording SEM images of the hybrids for
different reaction times. 2 mg of CNTs were dispersed in 15 mL of EtOH, to
which 1 mL of 0.05 mM Fmoc-Trp solution was added, followed by mixing with
0.2 mL 10% (v/v) TBOT/EtOH solution under stirring at 0 ºC. Samples were
collected after reaction for 10 min, 1 h and 6.5 h for SEM characterization.
The as-produced hybrids were heated in air at 400 ºC for 2 h to induce
crystallization of the coating followed by at 550 ºC for 2 h to oxidatively remove
CNT templates using a ramp rate of 20 ºC/min. The morphology of the calcined
samples was characterized by SEM and TEM. EDX was performed to confirm
the removal of CNT template. SAED and XRD analysis was conducted to
examine the crystal structure and phase composition of the calcined samples.
XRD measurement was performed using a Philips Automatic Powder
Diffractometer (APD), with Cu Kα radiation, 50 kV/40 mA, λ= 1.5406 Å. The
scans were performed with a step size of 0.05° (2θ) and the collection time at
each step was 25 s.
The transition from anatase to rultile was induced by heat treatment in argon at
temperatures between 800 ºC and 900 ºC. Factors including heating temperature,
pre-treatment and ramp rate were investigated for their influence on phase
transformation.
(1) To study the effect of heating temperature, the as-produced hybrids were

142
heated in argon at 900 ºC and 800 ºC respectively for 2 h using a ramp rate of
20 ºC/min followed by calcination at 550 ºC for 2h.
(2) To study the effect of pre-treatment, the as-produced hybrids were initially
heated in air at 400 ºC for 2 h to induce crystallization of the coating to
anatase followed by heating in argon at 800 ºC for 2 h using a ramp rate of
20 ºC/min.
(3) To study the effect of ramp rate, the same heat treatment was performed as
that in (2) but with 1 °C/min ramp rate.
The thermally treated samples were characterized by TEM, XRD and SAED.
In a typical experiment, the aligned CNT arrays (on a 5 mm x 5 mm Si wafer)
were initially functionalized with the modifiers by immersing into 3 mL of
0.05mM Fmoc-Trp solution for 13 days to reach adsorption equilibrium. The
functionalized arrays were then placed into 0.4 mL of 10% (v/v) TBOT/EtOH
solution to which 1 mL of EtOH was added. The reaction was allowed to proceed
for 1 h at 0 ºC, after which the arrays were collected and left to dry in air. Similar
procedure was performed using Fmoc-His, Fmoc-Tyr and BA as surface
modifiers. A control experiment was also performed in which pristine CNT arrays
were coated in TBOT/EtOH solution. The dried sample was heated in air at
400°C for 2 h followed by at 550 ºC for 2 h using a ramp rate of 20 °C/min to
produce TiO2 NT arrays. The morphology of the thermally treated products was
characterized by SEM and TEM. XRD was conducted to study the crystal
structure and phase composition of the calcined samples.
3.2.3.3 Combined sites
Two dispersions were prepared by dispersing 1 mg of CNTs in 30 mL in either
0.05 mM Fmoc-His or 0.05 mM Fmoc-Tyr solution. For the single population

143
experiments, a dispersion was deposited onto Si wafer and left to dry in air before
SEM characterization. For preparation of the combined catalyst, the two
dispersions were mixed with equal volume on a roller mixer for 1h before being
deposited on Si wafer. The dried sample was also observed under SEM.
For sol-gel coating of SiO2, the coated silicon wafers were immersed in a TEOS
solution (volume ratio of TEOS:H2O:EtOH=2:1:4) for 6 d followed by wash in
EtOH. The dried product was annealed in air at 200 ºC for 3 h followed by at
650ºC for 2 h to remove the carbonaceous template. For sol-gel coating of TiO2,
the combined catalyst on silicon wafers were immersed in a 10% (v/v)
TBOT/EtOH solution for 1 h at 0 ºC followed by wash in EtOH. The dried
sample was annealed in air at 400 ºC for 2 h followed by at 550 ºC for 2 h. The
morphology of the samples was characterized by SEM and EDX was performed
on both the as-produced and annealed samples.
3.2.4 Graphene and graphene based nanocomposites and
nanohybrids
3.2.4.1 GO-Inorganic nanohybrids
3.2.4.1.1 Preparation of aqueous dispersion of GO
Aqueous dispersion of GO (1 mg/mL) was produced by dispersing the
as-produced graphite oxide powder (synthesized according to a modified
Hummers method 1) in H2O using an ultrasonic bath. The bath sonicator was
fitted with a cooling system to maintain a constant temperature of 25 ºC. The
obtained suspension was centrifuged at 3000 rpm for 1 h. Only a negligible
amount of unexfoliated particles was observed after centrifugation, leading to a
homogenous dispersion of GO with a concentration of ~1 mg/mL. The obtained
GO dispersion was used for the subsequent synthesis of GO-TiO2 and GO-SiO2
nanohybrids.

144
The morphology of GO was characterized by SEM and TEM. For SEM imaging,
highly diluted GO dispersion was deposited on Al stub and the dried sample was
imaged using an accelerating voltage of 10 kV. The corresponding SAED pattern
was also recorded.
3.2.4.1.2 Preparation of GO-TiO2 nanohybrids
GO-TiO2 hybrids were synthesized following an in-situ sol-gel process. In a
typical process, 0.4 mL of 1% (v/v) TBOT/EtOH solution was added dropwise to
8 mL of 1 mg/mL GO dispersion under vigorous stirring at room temperature.
The reaction was allowed to proceed for 4 h and 7 d respectively. The product
was collected by centrifugation and washed with H2O and EtOH before dried at
room temperature. Following the same procedure, hybrids with higher TBOT
concentration was also prepared by mixing 0.1 mL of 10% (v/v) TBOT/EtOH
solution with 8 mL of 1 mg/mL GO dispersion for 4 h. The morphology of the
as-produced hybrids was characterized by TEM and the corresponding SAED
patterns were recorded. EDX equipped with TEM was performed on the hybrids
prepared for 4 h with lower TBOT concentration.
The hybrids prepared with both TBOT concentrations for 4 h were heated in Ar at
500 °C for 2 h using a ramp rate of 20 ºC/min to induce TiO2 crystallization and
to avoid oxidation of GO. The annealed samples were studied by TEM and
SAED.
3.2.4.1.3 Preparation of GO-SiO2 nanohybrids
GO-SiO2 hybrids were synthesized using tetrakis (2-hydroxyethyl) orthosilicate
(THEOS) as water-soluble silica precursor via the in-situ sol-gel process. The
structure of THEOS was shown in Figure 3.5. For the sol-gel process, 15 mL of
1mg/mL GO dispersion was mixed with 150 mg of THEOS under stirring for 1
day followed by standing for 1 week. The product was collected by centrifugation
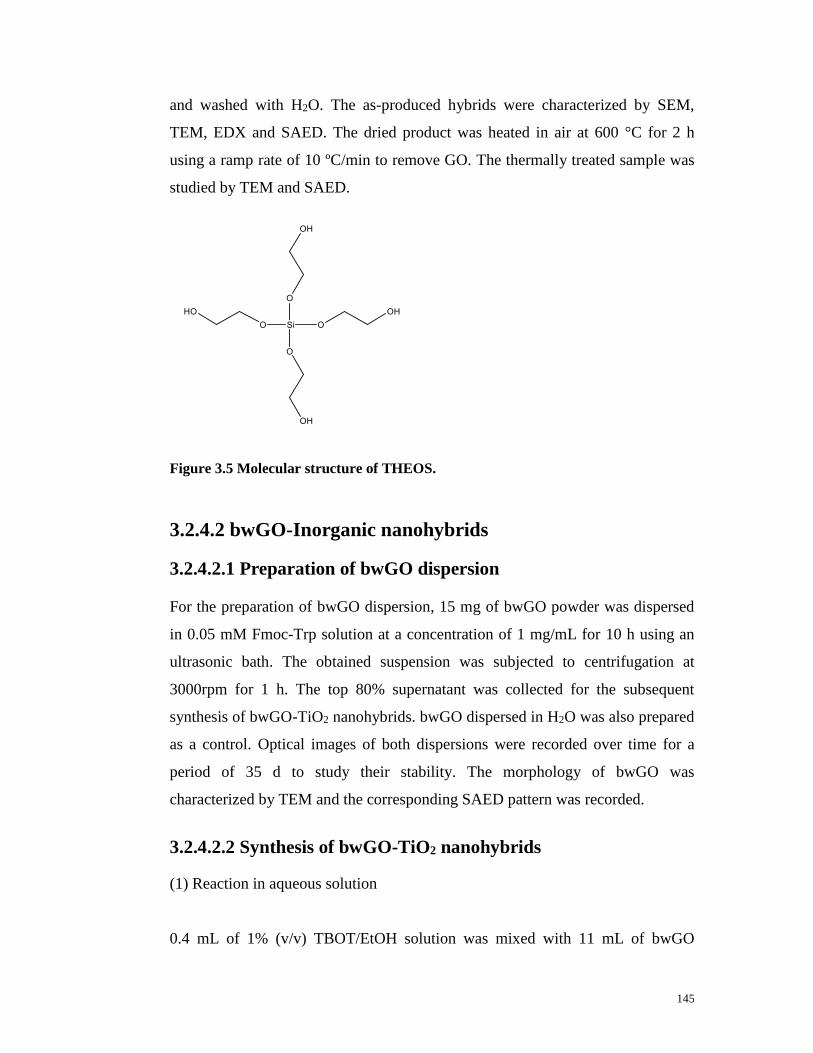
145
and washed with H2O. The as-produced hybrids were characterized by SEM,
TEM, EDX and SAED. The dried product was heated in air at 600 °C for 2 h
using a ramp rate of 10 ºC/min to remove GO. The thermally treated sample was
studied by TEM and SAED.
Figure 3.5 Molecular structure of THEOS.
3.2.4.2 bwGO-Inorganic nanohybrids
3.2.4.2.1 Preparation of bwGO dispersion
For the preparation of bwGO dispersion, 15 mg of bwGO powder was dispersed
in 0.05 mM Fmoc-Trp solution at a concentration of 1 mg/mL for 10 h using an
ultrasonic bath. The obtained suspension was subjected to centrifugation at
3000rpm for 1 h. The top 80% supernatant was collected for the subsequent
synthesis of bwGO-TiO2 nanohybrids. bwGO dispersed in H2O was also prepared
as a control. Optical images of both dispersions were recorded over time for a
period of 35 d to study their stability. The morphology of bwGO was
characterized by TEM and the corresponding SAED pattern was recorded.
3.2.4.2.2 Synthesis of bwGO-TiO2 nanohybrids
(1) Reaction in aqueous solution
0.4 mL of 1% (v/v) TBOT/EtOH solution was mixed with 11 mL of bwGO
146
dispersion whilst stirring for 4 h. The product was collected by centrifugation and
washed with EtOH.
(2) Reaction in EtOH
1 mg of bwGO was initially dispersed in 10 mL of EtOH followed by adding
1mL of 0.05 mM Fmoc-Trp solution. The mixture was further sonicated for
10min before mixing with 1 mL of 1% (v/v) TBOT/EtOH solution for 4 h. The
product was collected by centrifugation and washed with EtOH. A control
experiment in which 1 mL of H2O was added instead of Fmoc-Trp solution was
also conducted.
The products were characterized by SEM, EDX, TEM and SAED. The dried
products from both reactions were annealed in Ar at 600 ºC for 2 h to induce
crystallization of TiO2 for Raman characterization. Raman spectra for bwGO and
anatase TiO2 were also recorded for reference.
3.2.4.3 Exfoliated graphene (EG)-Inorganic nanohybrids
3.2.4.3.1 Preparation of graphene dispersion
A set of graphene dispersions were prepared by direct exfoliation of graphite in
Fmoc-Trp solution using a range of sonication times and centrifuge speeds. The
procedure is similar to that reported for using sodium dodecyl benzene sulfonate 8
and sodium cholate as surfactants 9. In a typical procedure, graphite powder
(grade 2369) was added to 30 mL of 0.05 mM Fmoc-Trp solution to give an
initial concentration of 3 mg/mL. The mixture was sonicated in a bath sonicator
for 1 h. As the sonic energy input to the sample is sensitive to the exact position
of the sample in the bath and the water level 10, all the samples were sonicated in
a fixed position in the bath. To minimize water evaporation as a result of the
temperature increase for prolonged sonication, the bath sonicator is fitted to a
cooling system to stabilize the temperature of the bath at 25 ºC. A black liquid
consisting of a homogenous phase and large numbers of shiny graphite particles

147
was obtained after sonication. The suspension was subjected to centrifugation at
3000 rpm for 1 h. The top 80% supernatant was decanted by pipette for the
subsequent analysis. The same procedure was performed for the preparation of
graphene dispersions under other conditions as listed in Table 3.2. Digital images
of the dispersions were recorded and their stability was studied by monitoring the
change in homogeneity of the dispersion over a period of 1 week.
Table 3.2 Conditions used for the preparation of graphene dispersions
Dispersion Initial concentration
(mg/mL)
Sonication time
(h)
Centrifuge speed
(rpm)
1 3 1 3000
2 3 6 3000
3 3 12 3000
4 3 6 500
5 3 6 6000
In order to determine the exact concentration of the dispersion, a relatively large
amount of freshly prepared dispersion of known volume was vacuum filtered
through an alumina membrane of known mass. The film formed on the membrane
was washed with H2O to remove residual modifiers followed by drying in
vacuum oven overnight at room temperature. The mass of the dried film was then
determined using a microbalance.
3.2.4.3.2 Preparation of EG-TiO2 nanocomposites and
nanohybrids
(1) Preparation of EG-TiO2 nanocomposites in aqueous solution
0.2 mL of 1% (v/v) TBOT/EtOH solution was mixed with 11 mL of graphene
dispersion prepared with 6 h of sonication followed by centrifugation at 6000 rpm
and 3000 rpm respectively under sonication for 30 min followed by stirring for 4h.
The product was collected by centrifugation and washed with EtOH.
(2) Preparation of EG-TiO2 nanohybrids in EtOH

148
1.1 mg of graphite powder was initially dispersed in 15 mL of EtOH for 2 h,
followed by adding 1 mL of 0.05 mM Fmoc-Trp solution to stabilize the
dispersion. The mixture was further sonicated for 6 h before mixing with 1 mL of
1% (v/v) TBOT/EtOH solution. After a further sonication for 2 h, the reaction
was allowed to proceed for another 2 h under stirring. The product was collected
by centrifugation and washed with EtOH.
The products obtained from both reactions were characterized by TEM, SAED
and Raman spectroscopy.
3.2.5 Mineralization of peptide self-assembled hydrogels
3.2.5.1 Fmoc-Y hydrogel preparation
Fmoc-Tyrosine (phosphate)-OH (Fmoc-Y(p)-OH) was dissolved in 3 mL of 0.6M
phosphate buffer at a concentration of 40 mM and the pH was adjusted to neutral.
To this solution, alkaline phosphatase (10 DEA μL-1) was added and the
self-supporting hydrogel of Fmoc-Tyr was formed after the solution had been
kept at 37 ºC for 2 h.
3.2.5.2 Fmoc-FY hydrogel preparation
For preparing 2 mL of gel, 12.6 mg of Fmoc-FpY was dissolved into 1 mL of
phosphate buffer to which 10 μL of 1 M HCl was added. The mixture was
vortexed for 30 s before made up to 2 mL by adding buffer. 200 μL of AP solution
of 3 DEA was added to the Fmoc-FpY solution followed by vortex for 20 s. The
resulting solution was left for gelation at room temperature after 90 min.
3.2.5.3 Characterization
The structure of the hydrogels was characterized by TEM. The sample was
negatively stained prior to TEM observation to improve image contrast. The

149
formvar-carbon coated grids were initially glow discharged followed by placing
the grid formvar side down on a drop of the hydrogel (~1-3 μL) for 10 s. Excess
gel was removed by placing the grid on a drop of distilled water (~10 μL) for 60 s
followed by blotting with filter paper. The washed grid was stained by placing on
a 10 μL droplet of 2% (w/v) uranyl acetat for 60 s followed by blotting with filter
paper.
The conversion of Fmoc-FpY into Fmoc-FY by enzymatic dephosphorylation
was followed using reverse phase HPLC. Aliquots of the sample solution were
collected at time points: t=0, 5, 10, 30 and 90 min and was mixed with an
acetronitrile/water mixture (50:50) containing 0.1% trifluoroacetic acid for HPLC
analysis.
Fluorescence spectroscopy was carried out to examine the supramolecular
arrangement within the self-assembled Fmoc-FY fibres. Fluorescence emission
spectra of both the Fmoc-FY hydrogel and the solution of Fmoc-FpY were
measured on a Jasco FP-6500 spectrofluorometer with excitation at 295 nm.
3.2.5.4 Silicification of Fmoc-Y gel
Two different methods were performed for the silicification of Fmoc-Y gel.
Method 1: 4 μL of TEOS was vortexed in the diluted Fmoc-Y hydrogel (8 mM)
for 30 s to allow homogeneous distribution of the precursor. The sol-gel process
was then allowed to proceed for different periods under ambient conditions prior
to TEM analysis. The composition of the mineralized sample was studied by
EDX.
Method 2: A mixture of TEOS in water was added onto the top of a volume of
Fmoc-Y hydrogel at 40 mM (volume ratio of hydrogel:TEOS:H2O=1:1:1) and
was allowed to stand at room temperature. After aging for 1 month, two phases
separated by a white layer were observed. The white layer was characterized by

150
TEM and EDX. Both the upper aqueous phase and the lower hydrogel phase were
characterized by SEM.
3.3 Analytical techniques
3.3.1 Scanning Electron Microscopy (SEM)
SEM is a microscopy technique that images the sample surface by scanning it
with a focused beam of high-energy electrons in a raster scan pattern. A variety of
signals are produced from the interaction of the electrons with the atoms at or
near the surface of the sample, which contain information about the sample's
surface topography and composition. Among the generated signals, secondary
electron imaging shows the higher resolution of the surface topographical
characteristics than backscattered electron imaging. SEM can produce very
high-resolution images of a sample surface, revealing details less than 1 nm in
size.
In the current study, a field emitter gun scanning electron microscope (FEGSEM,
Philips XL30) was employed to study the morphology of the samples. Unless
otherwise specified, an accelerating voltage of 20 kV was used. Samples for SEM
analysis were prepared by depositing sample dispersion in EtOH onto the
polished aluminium stub (Agar Scientific) and leave to dry in air. In order to
image the CNT arrays, the sample was mounted onto the holder using carbon tape
with the axis of the tube perpendicular to the incident electron beam. For
nonconductive samples, a thin coating of Pt or C was sputtered on the sample
using a Precision Etching Coating System (PECS, Gatan) to reduce charging
effect. After coating, silver paint was applied to form a conductive “bridge” from
the sample surface to the sample holder. The obtained micrographs were analyzed
using ImageJ software.
3.3.2 Transmission Electron Microscopy (TEM)

151
In a TEM instrument, a beam of electrons is emitted from an electron gun and is
focused to a thin and coherent beam by the condenser lenses. The beam is
restricted by the condenser aperture, knocking out high-angle electrons, before
interacting with the sample as it passes through. The transmitted beam is focused
and enlarged by the objective and projector lens respectively and form an image
on the phosphor screen. Figure 3.6 illustrates a schematic diagram of a TEM.
TEM offers two modes of operation: image mode and diffraction mode. The
diffraction mode is used to study the structure and composition of crystals. The
difference between the two modes may only be the strength of the intermediate
lens (Figure 3.7). Instead of focusing on the first image plane in image mode,
the diffracted beams are brought to a focus in the back focal plane of the
objective lens in diffraction mode. In imaging mode, an objective aperture is
inserted in the back focal plane to enhance contrast by blocking out high-angle
diffracted electrons (Figure 3.7a). For selected area electron diffraction (SAED), a
selected area aperture in the plane of the first intermediate image defines the
region of which the diffraction is obtained (Figure 3.7b). The contrast observed in
the TEM image may be brought about by several mechanisms including
mass-thickness contrast, diffraction contrast and phase contrast.

152
Figure 3.6 Schematic diagram of a TEM. 11
Figure 3.7 Ray path in a TEM operating in (a) image mode (b) diffraction mode. 12
In the present study, a Philips CM200 TEM operating at 200 kV was used to
characterize the morphology of the samples. For TEM observation, the samples
were prepared by depositing a droplet (~10 μL) of the sample dispersion in EtOH
onto a holey-carbon coated Cu grid (Agar scientific, 400 mesh) followed by
solvent evaporation in air. The obtained micrographs were analyzed using ImageJ
software. The corresponding SAED patterns were also acquired.
To determine the dimensions of the exfoliated flakes, the sample dispersion was
deposited onto holey carbon coated Cu grid for TEM analysis. The flake size
distribution was studied by measuring 40 flakes from each of the dispersions and
(b) (a)

153
the flake area was calculated using AxioVision Rel. 4.8 software. SAED analysis
was performed on the sample prepared with 6h/500 rpm.
3.3.3 Energy Dispersive X-ray Spectroscopy (EDX)
EDX is a microanalytical technique that uses the characteristic spectrum of
X-rays emitted by the specimen after excitation by high-energy electrons to
obtain information about its elemental composition. EDX is typically used to
detect elements of high atomic number. The spatial resolution is determined by
the probe size, beam broadening within the specimen, and the effect of
backscattered electrons on the specimen around the point of analysis.
In the current study, the elemental composition of the samples was analyzed with
an energy-dispersive X-ray spectrometer equipped with SEM (FEGSEM, Philips
XL30) operating at 10 kV.
3.3.4 Reversed-phase high-performance liquid
chromatography (RP-HPLC)
An HPLC system consists of a stationary phase (column) and a mobile phase
(solvent). When the sample is injected into the system, it is carried by the mobile
phase flowing through the stationary phase. The different affinities between the
sample components to the mobile phase and to the stationary phase result in the
separation. The sample component attracting to the stationary phase has a longer
retention time, thus coming out of the column at the last while those attracting to
the mobile phase come out of the column very quickly. When a non-polar
material is chosen to be the stationary phase, the HPLC system is called
RP-HPLC. When using this technique, the component with the highest
hydrophobicity has the longest retention time (Figure 3.8).
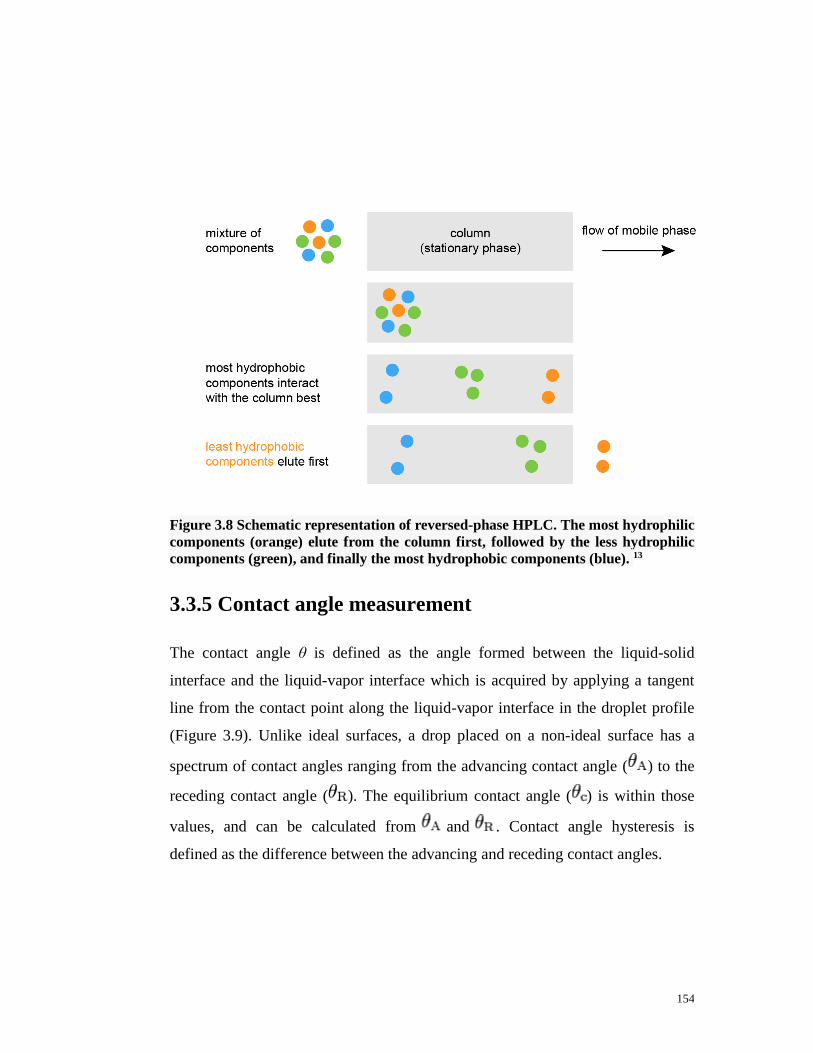
154
Figure 3.8 Schematic representation of reversed-phase HPLC. The most hydrophilic
components (orange) elute from the column first, followed by the less hydrophilic
components (green), and finally the most hydrophobic components (blue). 13
3.3.5 Contact angle measurement
The contact angle θ is defined as the angle formed between the liquid-solid
interface and the liquid-vapor interface which is acquired by applying a tangent
line from the contact point along the liquid-vapor interface in the droplet profile
(Figure 3.9). Unlike ideal surfaces, a drop placed on a non-ideal surface has a
spectrum of contact angles ranging from the advancing contact angle ( ) to the
receding contact angle ( ). The equilibrium contact angle ( ) is within those
values, and can be calculated from and . Contact angle hysteresis is
defined as the difference between the advancing and receding contact angles.

155
Figure 3.9 Schematic of a liquid drop on a solid surface, where the
solid–vapor interfacial energy is denoted by γsv, the solid–liquid interfacial energy
is denoted by γsl, and the liquid–vapor interfacial energy is denoted by γlv. 14
The contact angle quantifies the wettability of a solid surface by a liquid. A
contact angle less than 90° indicates that wetting of the surface is favorable, such
as hydrophilic surfaces; while contact angles greater than 90° generally means
that wetting of the surface is unfavorable such as hydrophobic surfaces.
The contact angle is determined using the sessile drop method (Figure 3.10). A
droplet of water is deposited on the sample surface through a syringe needle. The
profile of the drop is recorded with a camera and analysed using DSA1 v1.9 drop
shape analysis software 5. The baseline which is defined as the projection of the
sample surface in the drop image is first determined automatically. A contour
recognition is carried out based on a grey-scale analysis of the image. A
geometrical model describing the drop shape is then fitted to the contour. The
contact angle is given by the angle between the calculated drop shape function
and the sample surface using circle fitting method.

156
Figure 3.10 Sessile drop method for determining the contact angle. The fitted
contour is shown in green. 15
3.3.6 Raman spectroscopy
3.3.6.1 Background
Raman spectroscopy has been historically used to characterize the structure and
quality of graphitic materials 16,17 and it has recently been proved as a reliable and
nondestructive tool for capturing the electronic structures of graphene 18.
Raman spectrum for defect-free graphitic materials typically shows two
characteristic features (Figure 3.11a): G band at ~1580 cm-1 and 2D band at
~2700 cm-1 with 514 nm laser excitation. The G band originates from a single
resonance process associated with the doubly degenerate (iTO and LO) phonon
modes (E2g symmetry) at the Brillouin zone center 19,20. The 2D band which is
historically named G’ band is the second order of D band. The 2D band is
associated with two phonon inter-valley double resonance scattering involving
iTO phonon near the K point20. In defected graphitic materials, a defect-induced
D band is observed at ~1350 cm-1 with 514 nm laser excitation (Figure 3.11b).

157
The D band originates from a second-order double resonance Raman process
involving inter-valley scattering of iTO phonon near the K point of the Brillouin
zone 21. The defects are generally divided into edge defects 22 and structural
defects on the basal plane. The D peak intensity is proportional to the amount of
disorder 21. The intensity ratio of D to G band, ID/IG, is generally used to quantify
the defect content. Double resonance can also happen as intra-valley process, i.e.
connecting two points belonging to the same cone around the K or K’ points,
which gives rise to the so-called D' peak at ~1620 cm-1
in defected graphite 23.
Figure 3.11 (a) Typical Raman spectra for bulk graphite and monolayer graphene
obtained using a 514 nm laser. (b) Comparison of the D band at 514 nm at the edge
of bulk graphite and monolayer graphene. The fit of D1 and D2 components of the D
band of bulk graphite is shown. 18
Ferrari et al. 18 have suggested that the number of layers in few-layered graphene
(<5 layers) with AB stacking can be identified by the position, lineshape and
linewidth of 2D band. For monolayer graphene, the 2D band is fitted by a single
Lorentzian peak with a FWHM of ~30 cm-1 24, whereas it splits into four and six
components in bi- and trilayer graphene respectively 20 (Figure 3.12). Few-layer
graphene with more than 4 layers showed a more complex and broader 2D peak,
which is difficult to be distinguished from that of HOPG. For graphite, the 2D
band is described with two components, 2D1 and 2D2, which are roughly 1/4 and
1/2 the height of the G peak respectively. The distinct feature of monolayer is that
the 2D band in monolayer graphene is approximately 2 to 4 times more intense
G 2D

158
than that of the G band 20.
Figure 3.12 Measured 2D band for (a) monolayer, (b) bilayer, (c) trilayer, (d)
four-layer and (e) HOPG using a 514 nm laser. 20
3.3.6.2 Raman characterization of the exfoliated samples
The degree of exfoliation and the quality of the exfoliated flakes was investigated
using Raman spectroscopy. Raman spectra for the exfoliated samples and the
starting graphite powder were recorded on a Renishaw 2000 Raman spectroscopy
system (Renishaw Instruments, England) using a 633 nm HeNe excitation laser.
The laser beam was focused on the sample using a ×50 objective lens. A low
laser power of ~1mW was used to avoid laser induced sample heating. Spectra
were collected with an exposure time of 20 s and accumulation of 3 times.
Samples for Raman characterization were prepared by depositing the dispersion
onto SiO2/Si substrate (with 300 nm thick SiO2 layer) which was heated at 110 °C
on a hotplate to accelerate solvent evaporation. The SiO2/Si substrates were

159
cleaned by sonication in acetone followed by in H2O and isopropanol. At least 40
flakes deposited from each of the samples were randomly picked and measured
for statistical study. The spectra were fitted using a Lorentzian function to
determine the parameters of the bands using WiREInterface software.
3.3.7 Atomic Force Microscopy (AFM)
AFM is a type of scanning probe microscopy (SPM), providing a 3D profile of
the surface with a resolution on the order of fractions of a nanometer.
A typical AFM system consists of a cantilever with a sharp tip at its end (with a
typical radius of a few to tens of nm) which is used to scan the sample surface.
When the tip is brought into proximity of a surface, forces between the tip and the
sample lead to a deflection of the cantilever according to Hooke's law. The
deflection is typically measured using a laser beam reflected off the top surface of
the cantilever into a position-sensitive photodiode detector (Figure 3.13). The
measured deflections are used to generate a map of the surface topography.
There are 3 primary imaging modes in AFM: contact mode, non-contact mode
and tapping mode (intermittent-contact mode or Dynamic Force Mode (DFM)).
In contact mode, the cantilever tip remains in contact with the sample surface
during scanning and the contours of the surface are obtained by maintaining a
constant cantilever deflection employing a feedback mechanism. In non-contact
mode, the cantilever is oscillated at or near its natural resonance frequency. The
detection scheme is based on monitoring changes in the resonant frequency or
amplitude of the cantilever using a feedback loop. The non-contact mode is
preferable to contact mode for measuring soft samples. The tapping mode
combines qualities of both modes by oscillating the cantilever tip at or near its
natural resonance frequency while allowing the tip to touch or tap the sample
surface intermittently during scanning. The advantage of tapping the surface is
the improved lateral resolution on soft samples.

160
Figure 3.13 Schematic diagram of the beam deflection system in an atomic force
microscope, using laser and photodetector to measure the beam position. 25
AFM measurement was performed on the exfoliated samples to study the degree
of exfoliation. The measurement was taken with a VEECO CPII Atomic Force
Microscope working in contact mode.
Samples for AFM measurements were prepared by depositing a drop (~100 μL)
of highly diluted graphene dispersion onto a freshly cleaved mica surface (Agar
Scientific) which was heated at ~110 °C on a hotplate to accelerate solvent
evaporation. AFM image of Fmoc-Trp solution was also recorded as a control.
All the images were analyzed using IP 2.1 software.
In order to accurately identify the number of layers per flake, it is necessary to
remove the modifiers from the flakes. Two approaches were attempted: (1) to
rinse the sample in H2O for 5 min followed by blowing dry under a stream of

161
argon (2) to anneal the sample in Ar at 300 ºC for 1 h. AFM images of the treated
samples were recorded.
3.4 Reference
1. W. S. Hummers Jr. et al., Preparation of Graphitic Oxide, J. Am. Chem. Soc.,
1958, 80, 1339.
2. J. P. Rourke et al., The Real Graphene Oxide Revealed: Stripping the Oxidative
Debris from the Graphene-like Sheets, Angew. Chem. Int. Ed., 2011, 50, 3173.
3. C. Singh et al., Production of aligned carbon nanotubes by the CVD injection
method, Physica B, 2002, 323, 339.
4. S. Brunauer et al., Adsorption of Gases in Multimolecular Layers,
J. Am. Chem. Soc., 1938, 60, 309.
5. DSA v1.9 Drop Shape Analysis Manual, p65-68.
6. L.W. Kelts et al., Sol-gel chemistry studied by 1H and 29Si nuclear magnetic
resonance, Journal of Non-Crystalline Solids, 1986, 83, 353.
7. J. C. Pouxviel et al., NMR study of the sol/gel polymerization, Journal of
Non-Crystalline Solids, 1987, 89, 345.
8. M. Lotya et al., Liquid Phase Production of Graphene by Exfoliation of
Graphite in Surfactant/Water Solutions, J. Am. Chem. Soc., 2009, 131, 3611.
9. S. De et al., Flexible, transparent, conducting films of randomly stacked
graphene from surfactant-stabilized, oxide-free graphene dispersions, Small, 2010,
6, 458.
10. U. Khan et al., High-Concentration Solvent Exfoliation of Graphene, Small,
2010, 6, 864.
11. http://ncmn.unl.edu/cfem/microscopy/TEM.shtml
12. http://www.microscopy.ethz.ch/TEMED.htm
13. http://www.atdbio.com/content/7/Purification-of-oligonucleotides
14. http://www.ramehart.com/contactangle.htm
15. http://www.kruss.de/services/education-theory/glossary/drop-shape-analysis/ 16. M. A. Pimenta et al., Studying disorder in graphite-based systems by Raman
spectroscopy, Phys.Chem.Chem.Phys., 2007, 9, 1276.
17. M. S. Dresselhaus et al., Raman spectroscopy of carbon nanotubes, Phys.
Rep., 2005, 409, 47.
18. A. C. Ferrari et al., Raman Spectrum of Graphene and Graphene Layers, Phys.
Rev. Lett., 2006, 97, 187401.
19. F. Tuinstra et al., Raman Spectrum of Graphite, J. Chem. Phys., 1970, 53,
1126.
20. L.M. Malard et al., Raman spectroscopy in graphene, Phys. Rep., 2009, 473,
51.
21. A. C. Ferrari et al., Interpretation of Raman spectra of disordered and
amorphous carbon, Physical Review B, 2000, 61, 14095.
22. C. Casiraghi et al., Raman Spectroscopy of Graphene Edges, Nano Lett., 2009,

162
9, 1433.
23. R. J. Nemanich et al., First- and second-order Raman scattering from
finite-size crystals of graphite, Physical Review B, 1979, 20, 392.
24. Y. F. Hao et al., Probing Layer Number and Stacking Order of Few-Layer
Graphene by Raman Spectroscopy, Small, 2010, 6, 195.
25. http://en.wikipedia.org/wiki/Atomic_force_microscopy.

163
Chapter 4 Dynamic Interaction of Fmoc-AAs with
CNTs
4.1 Introduction The majority of the research on the noncovalent functionalisation of CNTs using
biomolecules has tended to focus on the response of CNTs. For example, the
concentration of CNTs dispersed in solution is measured but the binding kinetics
of the biomolecules on the nanotubes is not considered. However, the interaction
energy is equally important as if it is low then the surfactants will be desorbed
from the CNTs’ surfaces when placed in excess solvent, causing the dispersion to
crash. Furthemore, it is crucial to investigate the adsorption behaviour of the
biosurfactants on CNTs’ surfaces before employing them as templates for
producing hybrid materials. To address this question, the dynamic adsorption of a
series of aromatic Fmoc-AAs on CNTs was investigated 1. The binding of the
Fmoc-AAs was considered initially by measuring the interactions of single
species with CNTs. The Freundlich isotherm model was used to describe the
adsorption isotherm. However, these experiments took considerable laboratory
time to identify the Fmoc-AA with the highest affinity for the nanotubes.
Therefore, a competitive binding approach was developed to screen efficiently a
library of Fmoc-AAs for the strongest binding candidate. Finally, a switchable
surface chemistry was demonstrated to verify that Fmoc-AAs with a higher
binding energy could displace those with a lower binding energy on the surface.
4.2 Synthesis of aligned MWNT arrays by injection
CVD method Aligned MWNTs arrays were successfully grown on oxidised silicon substrates
through an injection CVD method using ferrocene as catalyst and toluene as
carbon source. The ferrocene-toluene solution was injected into an argon carrier
gas preheated to 200 ºC, where they were vaporized and passed into the heating

164
zone of the furnace (760 ºC). Previous study has found that the synthesis
temperature of 760 ºC produced the nanotubes with the least defects 2. Fe catalyst
particles were produced by the decomposition of ferrocene and deposited on the
SiO2 layer of the substrate to catalyze the growth of CNTs.
The surface morphology of the synthesized CNTs was characterized using SEM.
The aligned CNT arrays showed an average length of ~430 μm (Figure 4.1a). A
magnified SEM image revealed generally good alignment of “wavy” CNTs along
their length, with the presence of some entanglements (Figure 4.1b). TEM
analysis of the CNTs found their diameter in the range of 22-97 nm, with an
average value of 56.6 nm and a standard deviation of 16.6 nm (Figure 4.1c). The
dark particles (with an average diameter of a few nanometers) entrapped either
within the hollow cavity or the walls of the NTs (indicated by arrows in Figure
4.1c) represented the Fe catalyst residues. The HRTEM image revealed the
multi-walled nature of the CNT which showed a relatively clean surface (Figure
4.1d). Only a negligible layer of amorphous carbon was observed to deposit on
the graphitic layers. The corresponding SAED pattern (Figure 4.1e) exhibited a
bright arc for the (002) diffraction together with a ring for the (100) diffraction,
and a faint arc for the (004) diffraction of MWNTs.

165
Figure 4.1 SEM images of CNT arrays grown at 760 ºC from a 5wt% ferrocene in
toluene solution on SiO2 substrate for 1h. (a) Cross-sectional image of the aligned
CNT arrays. (b) Close-up view of the CNTs from the arrays. (c) TEM image of the
pristine CNTs with dark particles presented both in the hollow cavity and the walls
of CNTs (indicated by arrows). Scale bar, 0.2 μm. (d) HRTEM image showing the
multilayered structure of a synthesized CNT with the lattice fringes clearly visible.
Scale bar, 5 nm. (e) The corresponding SAED pattern was indexed to the (002), (100)
and (004) planes of MWNTs.
200 μm
430 μm
(a)
5μm
(b)
(c
)
(d) (002)
(e) (004)
(100)
(002)

166
4.3 Interaction of surface modifiers with CNTs
An effective and well-studied interface between the biosurfactants and CNTs is
essential to their application in biology as well as the performance of CNT based
hybrid materials. To this end, the adsorption behaviour of a library of Fmoc-AAs
on CNTs as a function of the amino acid was evaluated. The four aromatic amino
acids (Trp, Phe, His and Tyr) were studied with Gly as a control as these amino
acids had shown promise as surfactants for dispersing CNTs 3. The adsorption
isotherm of benzyl alcohol (BA) was also studied as a reference surfactant as it
has been previously used in the literature as a surface modifier for the production
of CNT-TiO2 nanohybrids4. The effect of surface chemistry of CNTs on the
morphology of the synthesized hybrid materials was investigated in later
Chapters.
4.3.1 Adsorption behavior of the modifiers on aligned
CNT arrays
The synthesized CNT arrays were used as the model surface as they did not
disperse into solution hence allow the concentration of the modifiers in solution
to be measured. The adsorption process of single Fmoc-AA species on CNT
arrays was monitored by recording the UV-Vis spectra of the solution in the
presence of the arrays over time. The spectra were also collected in the absence of
the surface as a reference. Take Fmoc-Trp for example, as shown in Figure 4.2a,
the concentration of Fmoc-Trp control solution remained constant over a period
of 3 days suggesting that its precipitation and settling did not occur. In contrast, in
the presence of the CNT arrays, a significant drop in the concentration of the
Fmoc-Trp solution was observed within the first 100 min, after which the rate of
change slowed and eventually a nearly constant concentration value was reached
indicating adsorption equilibrium. Similar profiles were obtained for the other
Fmoc-AA solutions studied (Figure 4.2c,e and i) except for Fmoc-His which still
had not reached equilibrium after 6 days (Figure 4.2g). The affnity of the studied
Fmoc-AAs for CNTs was evaluated in terms of their equilibrium loading and

167
initial adsorption rate which were normalised to surface area of CNTs. Fmoc-Trp
was found to have the best affinity for CNTs by showing an equilibrium loading
of 0.000325 mmol/m2 CNT (Figure 4.2k) while the non-aromatic Fmoc-Gly had
the lowest loading of 0.000072 mmol/m2 CNT due to the lack of interaction
between the non-aromatic side chain and CNTs. The adsorption profiles confirm
that the Fmoc group was an efficient anchor, which could be improved by the
addition of an aromatic amino acid. Quantum mechanical modelling has
highlighted the importance of π-π stacking interactions in these systems 3. Having
studied the effect of the amino acid side chains on the affinity for CNTs, Fmoc
was compared with other aromatic ligands with different degree of aromaticity,
such as the benzyl group of BA. The adsorption profile of BA on CNT arrays
showed a significant increase in the concentration of BA solution after 1 day
(Figure 4.2l). This was caused by the slow evaporation of the solvent although the
UV-Vis cuvette was sealed. This result suggests the poorer affinity of BA for
CNTs which is possibly attributed to the lower degree of aromaticity of the
benzyl ring compared with that of the fluorenyl ring of the Fmoc group.
The initial adsorption rate, ki, is an important characteristic in defining the
adsorption efficiency. ki is given by the initial change in the moles of the
adsorbate on unit surface area of the adsorbent per unit time:
Sdt
VdC
Sdt
dnki (4.1)
Where, for the current purpose, n (nmol) is the amount of Fmoc-AAs adsorbed on
the arrays, S (m2) is the surface area of CNTs, C (nmol/L) is the concentration of
Fmoc-AAs in solution and V (L) is the volume of the solution. dC/dt is obtained
by drawing the tangent to the adsorption profile at the initial linear phase. Take
Fmoc-Trp for example, the adsorption rate was determined over the initial linear
region of the profile from 0 to 60 min with a coefficient of determination R2 of
0.98 (Figure 4.2b). The initial adsorption rates for the other Fmoc-AAs studied
were determined using the same method (Figure 4.2d,f,h and j) and summarized

168
in Table 4.1. All the adsorption curves were found to display linearity over the
same time range with Fmoc-Trp being adsorbed the most quickly while Fmoc-His
showing the lowest rate.
0 1 2 3 4 50.03
0.04
0.05
0.06
Fmoc-Phe control
In the presence of CNT mats
Co
nce
ntr
atio
n o
f F
mo
c-P
he
/ m
M
Time / day
(c)
0 1 2 3 4 50.03
0.04
0.05
0.06
Fmoc-Tyr control
In the presence of CNT mats
Co
nce
ntr
atio
n o
f F
mo
c-T
yr
/ m
M
Time / day
(e)
0 1 2 3 40.03
0.04
0.05
0.06
Fmoc-Trp control
in the presence of CNT mats
Co
nce
ntr
atio
n o
f F
mo
c-T
rp /
mM
Time / day
(a)
0 20 40 60 800.044
0.046
0.048
0.050
0.052
0.054
Co
nce
ntr
atio
n o
f F
mo
c-T
rp /
mM
Time / min
(b)
0 20 40 60
0.047
0.048
0.049
0.050
0.051
Co
nce
ntr
atio
n o
f F
mo
c-P
he /
mM
Time / min
(d)
0 20 40 60 80
0.047
0.048
0.049
0.050
0.051
Concentr
ation o
f F
moc-T
yr
/ m
M
Time / min
(f)
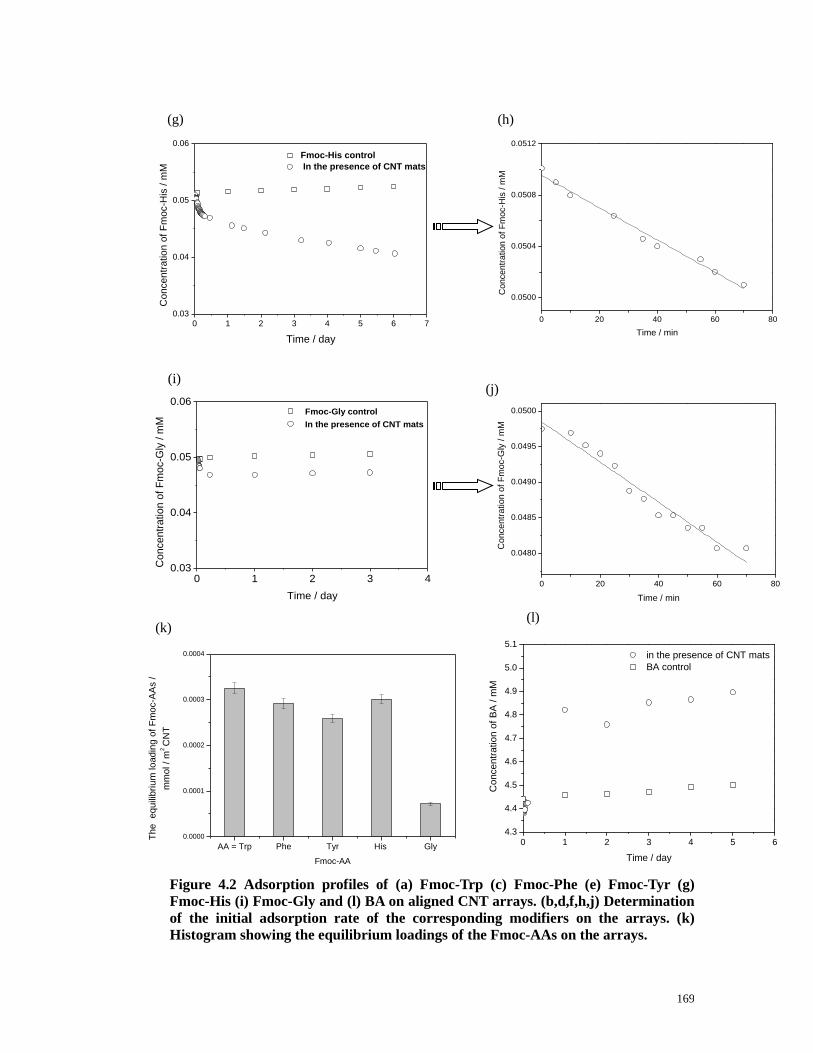
169
Figure 4.2 Adsorption profiles of (a) Fmoc-Trp (c) Fmoc-Phe (e) Fmoc-Tyr (g)
Fmoc-His (i) Fmoc-Gly and (l) BA on aligned CNT arrays. (b,d,f,h,j) Determination
of the initial adsorption rate of the corresponding modifiers on the arrays. (k)
Histogram showing the equilibrium loadings of the Fmoc-AAs on the arrays.
0 1 2 3 40.03
0.04
0.05
0.06
Fmoc-Gly control
In the presence of CNT mats
Co
nce
ntr
atio
n o
f F
mo
c-G
ly /
mM
Time / day
(i)
(g)
0 1 2 3 4 5 6 7
0.03
0.04
0.05
0.06
Fmoc-His control
In the presence of CNT matsC
oncentr
ation o
f F
moc-H
is /
mM
Time / day
(k)
AA = Trp Phe Tyr His Gly
0.0000
0.0001
0.0002
0.0003
0.0004
The
equili
bri
um
loadin
g o
f F
moc-A
As /
mm
ol /
m2
CN
T
Fmoc-AA
0 1 2 3 4 5 6
4.3
4.4
4.5
4.6
4.7
4.8
4.9
5.0
5.1
in the presence of CNT mats
BA control
Co
nce
ntr
atio
n o
f B
A /
mM
Time / day
(l)
0 20 40 60 80
0.0480
0.0485
0.0490
0.0495
0.0500
Co
nce
ntr
atio
n o
f F
mo
c-G
ly /
mM
Time / min
(j)
0 20 40 60 80
0.0500
0.0504
0.0508
0.0512
Concentr
ation o
f F
moc-H
is /
mM
Time / min
Equation
Weight
Residual Sum of Squares
Pearson's r
Adj. R-Square
B
B
(h)

170
Table 4.1 Initial adsorption rate of the Fmoc-AAs on CNT arrays
Initial adsorption rate
(nmol m-2 min-1)
R2
Fmoc-Trp 0.00263±0.00013 0.98
Fmoc-Phe 0.00116±0.00009 0.96
Fmoc-Tyr 0.00102±0.00003 0.99
Fmoc-His 0.00037±0.00002 0.98
Fmoc-Gly 0.00083±0.00005 0.96
4.3.2 Adsorption behavior of the modifiers on randomly
oriented CNT networks
To examine whether the modifiers could diffuse into the lower part of the arrays,
the adsorption of the Fmoc-AAs on randomly aligned CNT network was studied.
As shown in the adsorption profile (Figure 4.3), the concentration of Fmoc-Trp
solution decreased linearly over time and after 9 days of adsorption the
equilibrium was not reached. The spectra recorded after this period observed the
blue shift of the peak from 264 nm to 258 nm, possibly due to the precipitation of
the amino acid. The loading of Fmoc-Trp on the network after 9 days was
calculated to be 0.16 mmol/g CNT, while the loading on the arrays was
determined to be 0.058 mmol/g CNT, indicating that the full surface area of CNTs
in the arrays was not accessible to the modifiers.
Figure 4.3 Adsorption profile of Fmoc-Trp on randomly aligned CNT networks.
0 2 4 6 8 10
0.038
0.040
0.042
0.044
0.046
0.048
0.050
0.052
Co
nce
ntr
atio
n o
f F
mo
c-T
rp / m
M
Time / day

171
4.3.3 Desorption behavior of the modifiers in excess of
water
To establish if the interaction between Fmoc-AAs and CNTs are dynamic, the
desorption behaviour of Fmoc-Trp and Fmoc-Phe from CNT arrays was studied
in excess of H2O. As shown in Figure 4.4, the desorption profiles of both
Fmoc-AAs revealed a new adsorption equilibrium after ~50 h with the desorbed
Fmoc-AAs accounted for ~27% of the overall Fmoc-AAs previously adsorbed on
the arrays.
Figure 4.4 Desorption profiles of (a) Fmoc-Trp and (b) Fmoc-Phe from CNT arrays
in water.
This result verifies the reversible nature of the binding process of Fmoc-AAs
which were in dynamic equilibrium between solution and adsorption on CNT
arrays (Equation 4.2). The adsorption equilibrium is a function of temperature, as
at higher temperatures more Fmoc-AAs will exceed their binding energy and
enter solution.
T Fmoc-AAs in solution
T
↓
↑ (Desorption dominate) (Adsorption dominate) (4.2) Fmoc-AAs adsorbed on CNT arrays
0 20 40 60 80 100 120
0
10
20
30
40
Pe
rce
nta
ge
of F
mo
c-T
rp d
eso
rbe
d / %
Time / h
Model
Equation
Reduced Chi-Sqr
Adj. R-Square
B
B
B
B
B
B
B
Model
Equation
Reduced Chi-Sqr
Adj. R-Square
B
B
B
(a)
0 50 100 150 200
0
10
20
30
40
Pe
rce
nta
ge
of
Fm
oc-P
he d
eso
rbe
d /
%
Time / h
(b)

172
4.3.4 Freundlich isotherm model
The previous TEM analysis has shown that Fmoc-AAs absorbed heterogeneously
on CNTs and tended to form spherical aggregates, ranging from 5 to 10 nm in
diameter 3. Therefore, adsorption isotherm such as the Langmuir isothermal
which describes the formation of a monolayer is inappropriate for the Fmoc-AA
system. Instead, the Freundlich isotherm model which is applicable to non-ideal
sorption on heterogeneous surfaces where multilayers can be formed was used.
The adsorption isotherms of Fmoc-Trp, Fmoc-Gly and BA on CNT arrays were
studied. As shown in Figure 4.5, the equilibrium data for both Fmoc-Trp and
Fmoc-Gly were found to follow the Freundlich isotherm model over the initial
concentration range between 0.025-0.055 mM with a coefficient of determination,
R2, of the linear regression greater than 0.90. While all the adsorption experiments
of BA showed an increased concentration of the solution over time, similar to that
observed in section 4.3.1. This result further confirmed that Fmoc was a more
effective ligand than the benzyl ring of BA due to the higher degree of
aromaticity of the fluorenyl ring.
The values of the constants k and n for Fmo-Trp and Fmoc-Gly were determined
from the plot and given in Table 4.2. It was found that the value of k for
Fmoc-Trp was 25 times that for Fmoc-Gly, indicating the higher adsorptive
capacity of CNTs for Fmoc-Trp. The molecular modeling study has shown the
greater interaction energy of ionized Fmoc-Trp with SWNTs (-47.7 kcal/mol)
over ionized Fmoc-Gly (-36.2 kcal/mol)3. Furthermore, it was found that the
aromatic side chain in Trp encouraged the flattening of Fmoc-Trp against the NT
by following its curvature, which favors the formation of multilayer films,
whereas the side chain of Gly lifted away from the NT surface. Both the higher
binding energy and flat conformations of Fmoc-Trp on CNTs’ surface
contributed to the higher adsorption capacity.
For Freundlich isotherm, n>1 represents favourable adsorption conditions and

173
thus the calculated values of n for both Fmoc-AAs suggested that they were
favourably adsorbed on CNT arrays. Fmoc-Gly had a greater n than Fmoc-Trp
suggesting that the Fmoc-Gly molecules interacted more between themselves
within the adsorbed layer.
Figure 4.5 Plot of ln Q vs. ln C for the adsorption of Fmoc-Trp (red circles) and
Fmoc-Gly (blue triangles) on the arrays.
Table 4.2 Calculated adsorption capacity (k) and intensity (n) for Fmoc-AAs
adsorbed on CNT arrays. Note that the units for k depend on the value of n. The
quality of fit, R2, was also given for each Fmoc-AA.
Fmoc-AAs k n R2
Fmoc-Trp 5.65 m3 kg-1 1.0 0.90
Fmoc-Gly 0.23 mol1/3 m2 kg-1 1.5 0.98
4.3.5 Competitive binding from the Fmoc-AAs library on
graphite
Although the affinity of the Fmoc-AAs for CNTs could be evaluated by
measuring the adsorption profile of each species, however this method is very
time consuming. Therefore, if a solution containing a library of Fmoc-AAs was
used instead of a singular species, it is expected that there would be competition
-4.5 -4.0 -3.5 -3.0 -2.5 -2.0
-5
-4
-3
-2
-1
Fmoc-Trp
Fmoc-Gly
ln Q
ln C

174
between the species to absorb onto the NTs’ surface.
The competitive binding from the Fmoc-AAs library on graphitic surfaces was
assessed using graphite as model surface by reversed-phase HPLC. The retention
time for the individual Fmoc-AA species was measured for reference (Figure
4.6a-e). The HPLC chromatogram of the library solution was then recorded prior
to introducing the graphite substrates (Figure 4.6f). The HPLC traces of the
mixture were recorded over time until the adsorption equilibrium was reached. It
was found that out of all the library components, only the concentration of
Fmoc-Trp became significantly lower when equilibrium was reached (173 h),
whereas the other Fmoc-AAs showed little change in their concentrations (Figure
4.7a). These results suggested that Fmoc-Trp had come out of solution and
predominately bound to the surface of graphite, while the others with poorer
affinity would be predominantly in solution. It is proposed that the stronger
binding Fmoc-AAs would displace the Fmoc-AAs which bound more weakly
from graphite. Over time, the strongest binding Fmoc-AA would be
predominantly on the surface of graphite whereas the weaker binding Fmoc-AAs
would be predominantly in solution.
The equilibrium loading of each component from the competitive binding
experiments was calculated and compared to those from the individual adsorption
experiments. In contrast to the individual adsorption experiment in which all the
aromatic Fmoc-AAs adsorbed at a similar level 1, the competitive binding
approach clearly identified the strongest binder as Fmoc-Trp which showed 3.5
times the loading of the next strongest Fmoc-AA (Fmoc-Phe) (Figure 4.7b). Such
a competitive binding approach allows a number of binding candidates with
similar binding energies to be evaluated simultaneously for identifying the
strongest binder in a very efficient manner. The data for the individual adsorption
experiments are taken from the Master’s work 1.

175
Figure 4.6 HPLC chromatogram of 0.4 mM of (a) Fmoc-Phe (b) Fmoc-Trp (c)
Fmoc-Tyr (d) Fmoc-Gly and (e) Fmoc-His. (f) The mixture of the 5 Fmoc-AAs with
the same volume ratio.
0
200
400
600
800
14 19 24 29 34
Time / min
UV absorbance / a.u.
His Gly
Tyr
173 h
0 h
Trp Phe
(a)
0
2000
4000
6000
8000
10000
14 19 24 29 34
Time / min
UV
ab
so
rba
nce
/ a
.u.
Mixture of 5 Fmoc-AAs
Fmoc-His-OH
Fmoc-Gly-OH
Fmoc-Tyr-OH
Fmoc-Trp-OH
Fmoc-Phe-OH
(f)
(e)
(d)
(c)
(b)
(a)

176
Figure 4.7 (a) HPLC traces of the mixture consisting of the five Fmoc-AAs at 0 h
(upper) and after 173 h of competitive binding (lower). (b) Comparison of the
equilibrium loadings of the five Fmoc-AAs on graphite in individual adsorption and
competitive binding experiments.
4.3.6 Switchable surface chemistry
In order to verify that the Fmoc-AAs with a higher binding energy could displace
those with a lower binding energy on the surface, a switchable surface chemistry
was demonstrated through sequential exposure of HOPG surface to Fmoc-Gly
(low binding energy) and Fmoc-Trp (high binding energy). The change in the
surface chemistry was followed using contact angle measurement. The contact
angles on control HOPG surface and those immobilized with Fmoc-Trp and
Fmoc-Gly were initially measured for reference. As shown in Figure 4.8a, The
contact angles on control HOPG surface was 89.8 ° ± 2.8 ° indicating its
hydrophobic nature whereas those on Fmoc-Trp (Figure 4.8b) and Fmoc-Gly
(Figure 4.8c) functionalised HOPG surfaces were 76.1° ± 0.7 ° and 53.3 ° ± 1.6 °
respectively. The decrease in the contact angle suggested that after
Fmoc-Trp-OH Fmoc-Phe-OH Fmoc-Tyr-OH Fmoc-His-OH Fmoc-Gly-OH
0.00
0.04
0.08
0.12
0.16
Th
e e
qu
ilib
riu
m lo
ad
ing
of F
mo
c-A
As
(in
div
idu
al a
dso
rptio
n)
/ m
mo
l/m2 g
rap
hite
equilibrium loading in individual adsorption
euqilibrium loading in competitive binding
0
1
2
3
4
5
Th
e e
qu
ilib
riu
m lo
ad
ing
of F
mo
c-A
As
(co
mp
etit
ive
bin
din
g)
/ m
mo
l/m2 g
rap
hite
(b)
177
immobilization with Fmoc-Trp and Fmoc-Gly, the surface become more
hydrophilic due to the presence of the carboxylic groups on the surface. The
lower contact angle for Fmoc-Gly functionalized HOPG surface was due to that
Fmoc-Gly was more hydrophilic than Fmoc-Trp.
The clear difference in contact angles between the two functionalized surfaces
was then utilized to examine the displacement of Fmoc-Gly by Fmoc-Trp on the
surface. After introducing Fmoc-Gly functionalized HOPG surface to Fmoc-Trp
solution for 2 days, the contact angle increased from 53.3° ± 1.6 ° to 77.1° ± 1.1 °,
which was similar to that on the Fmoc-Trp functionalised HOPG surface,
suggesting that Fmoc-Gly was partially displaced by Fmoc-Trp from the HOPG
surface.

178
θ = 89.8 ° ± 2.8 ° θ = 53.3 ° ± 1.6 ° θ = 77.1 ° ± 1.1 °
Figure 4.8 Displacement of Fmoc-Gly by Fmoc-Trp on HOPG surface. Contact
angle measurements on (a) freshly cleaved HOPG surface (b) Fmoc-Trp
functionalized HOPG surface and (c) Fmoc-Gly functionalized HOPG surface. (d)
Schematic representation of the displacement of Fmoc-Gly by Fmoc-Trp on the
surface. (e-g) Corresponding contact angle measurements on the surfaces presented
in (d). Note that Figure (c) and (f) were repeats of the same experimental condition.
4.4 Conclusion
The adsorption behavior of a series of aromatic Fmoc-AAs on aligned CNT
HOPG
(a)
θ= 89.8 º ± 2.8 º
HOPG + Fmoc-Trp
(b)
θ= 76.1 º ± 0.7 º
(c)
HOPG + Fmoc-Gly
θ= 53.3 º ± 1.6 º
(d)
Fmoc-Trp Fmoc-Gly
(e)
HOPG HOPG + Fmoc-Gly
(f)
After displacement
(g)

179
arrays was studied. The adsorption kinetics and equilibrium of single Fmoc-AA
species on the surface were measured using UV-Vis spectroscopy. Among the
Fmoc-AAs studied, Fmoc-Trp was found to have the best affinity for CNTs by
showing the highest equilibrium loading and initial adsorption rate, whilst the
non-aromatic control Fmoc-Gly showed the lowest equilibrium loading. These
results confirmed that the Fmoc group was an efficient anchor, which could be
improved by the addition of an aromatic amino acid. The adsorption behaviour of
the Fmoc-AAs on randomly aligned CNT networks was also studied and the
result indicated that the modifiers could not diffuse into the lower part of the
arrays, thus could not access the full surface area of the nanotubes. The fully
reversible nature of the binding process was demonstrated via the desorption of
the modifier from CNTs’ surface in excess of water.
The equilibrium data were well fitted to the Freundlich isotherm model over the
initial concentration range between 0.025-0.055 mM. Both the higher binding
energy and flat conformations of Fmoc-Trp on CNTs’ surface contributed to the
higher adsorption capacity compared with Fmoc-Gly.
The competitive binding from the library of Fmoc-AAs on graphite was
developed. Fmoc-Trp was identified as the strongest binding candidate at the
expense of the other components studied, leading to a significantly different
binding behavior compared with the individual adsorption experiments. It is
proposed that the stronger binding Fmoc-AAs would displace the Fmoc-AAs
which bound more weakly from graphite. This approach provides an efficient
way to screen a wide range of binding candidates with similar binding energies
simultaneously for the strongest binder.
A switchable surface chemistry was demonstrated through the sequential
displacement of Fmoc-Gly by Fmoc-Trp from a HOPG surface. This observation
supported the hypothesis that the Fmoc-AAs with a higher binding energy could
displace those with a lower binding energy from the surface.

180
This study on the dynamic interaction between these aromatic amino acid
derivatives and CNTs not only provides a step forward for their bioapplication
where an effective and well-studied interface is required but also pave the way
towards the subsequent utilization of these functionalized CNTs as templates for
the production of hybrid materials.
4.5 References
1. Y. Li et al., A study of the dynamic interaction of surfactants with graphite and
carbon nanotubes using Fmoc-amino acids as a model system, Langmuir, 2009,
25, 11760.
2. C. Singh et al., Production of controlled architectures of aligned carbon
nanotubes by an injection chemical vapour deposition method, Carbon, 2003, 41,
359.
3. B. G. Cousins et al., Enzyme-Activated Surfactants for Dispersion of Carbon
Nanotubes, Small, 2009, 5, 587.
4. D. Eder et al., Carbon–inorganic hybrid materials: the carbon-nanotube/TiO2
interface, Adv. Mater., 2008, 20, 1787.
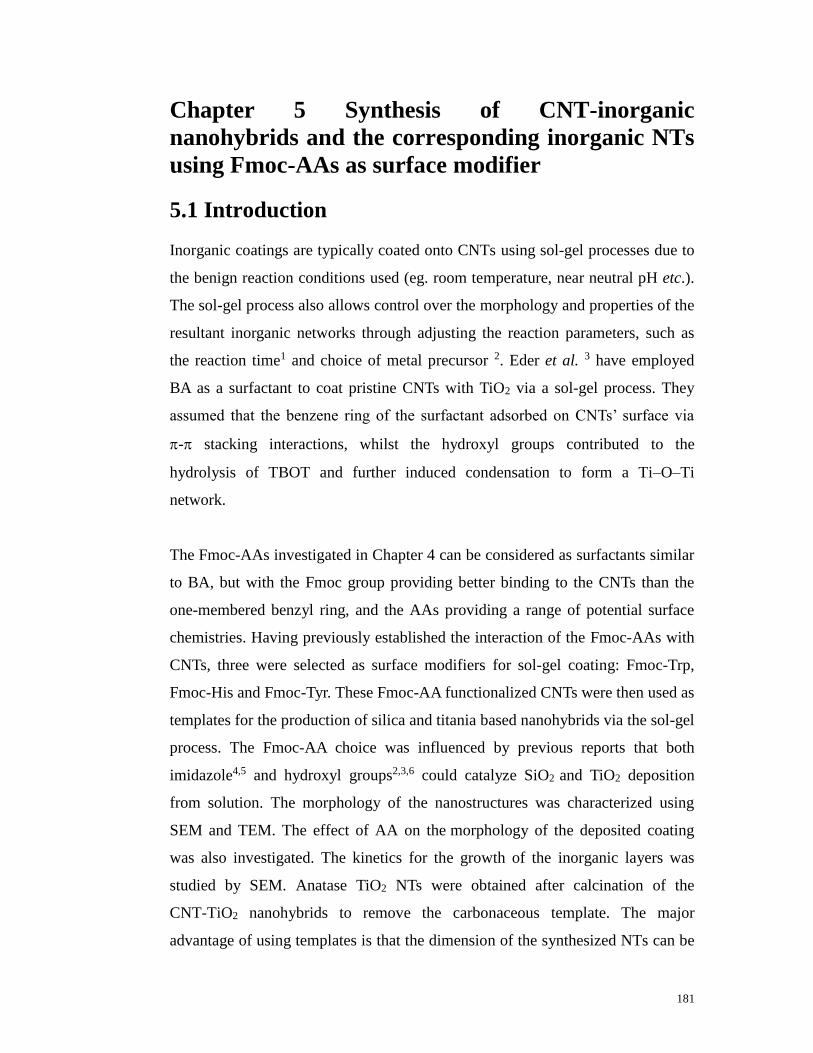
181
Chapter 5 Synthesis of CNT-inorganic
nanohybrids and the corresponding inorganic NTs
using Fmoc-AAs as surface modifier
5.1 Introduction
Inorganic coatings are typically coated onto CNTs using sol-gel processes due to
the benign reaction conditions used (eg. room temperature, near neutral pH etc.).
The sol-gel process also allows control over the morphology and properties of the
resultant inorganic networks through adjusting the reaction parameters, such as
the reaction time1 and choice of metal precursor 2. Eder et al. 3 have employed
BA as a surfactant to coat pristine CNTs with TiO2 via a sol-gel process. They
assumed that the benzene ring of the surfactant adsorbed on CNTs’ surface via
- stacking interactions, whilst the hydroxyl groups contributed to the
hydrolysis of TBOT and further induced condensation to form a Ti–O–Ti
network.
The Fmoc-AAs investigated in Chapter 4 can be considered as surfactants similar
to BA, but with the Fmoc group providing better binding to the CNTs than the
one-membered benzyl ring, and the AAs providing a range of potential surface
chemistries. Having previously established the interaction of the Fmoc-AAs with
CNTs, three were selected as surface modifiers for sol-gel coating: Fmoc-Trp,
Fmoc-His and Fmoc-Tyr. These Fmoc-AA functionalized CNTs were then used as
templates for the production of silica and titania based nanohybrids via the sol-gel
process. The Fmoc-AA choice was influenced by previous reports that both
imidazole4,5 and hydroxyl groups2,3,6 could catalyze SiO2 and TiO2 deposition
from solution. The morphology of the nanostructures was characterized using
SEM and TEM. The effect of AA on the morphology of the deposited coating
was also investigated. The kinetics for the growth of the inorganic layers was
studied by SEM. Anatase TiO2 NTs were obtained after calcination of the
CNT-TiO2 nanohybrids to remove the carbonaceous template. The major
advantage of using templates is that the dimension of the synthesized NTs can be

182
easily controlled by the size of the templates. The influence of heating
temperature, pre-treatment and ramp rate on the crystallization and phase
transformation was also investigated by TEM, XRD and ED.
Aligned TiO2 NT arrays have been previously synthesized by anodization of
titanium thin films 7,8 and atomic layer deposition (ALD) of TiO2 within a porous
alumina membrane 9. However, such methods either require specialized setup or
suffer from the limited length of the obtained arrays. To the best of my
knowledge there has been no report on the sol-gel templating of TiO2 NT arrays
using aligned CNT arrays as templates. The challenge is to coat individual CNTs
while preserving the morphology of the CNT structures. In the present study, a
simple route towards the synthesis of aligned TiO2 NT arrays was demonstrated
using CVD grown CNT arrays as templates in the presence of the same surface
modifiers.
5.2 Synthesis of CNT-silica nanohybrids using
Fmoc-AAs as surface modifier
5.2.1 Synthesis and morphology characterization
The possibility of the Fmoc-AAs acting as catalysts for the sol-gel formation of
silica was initially investigated by adding TEOS solution to Fmoc-Trp, Fmoc-His
and Fmoc-Tyr solution respectively as well as to H2O as a control. In the
presence of the Fmoc-AAs, precipitation was observed after reaction for 3 days,
indicating the formation of silica structures. In absence of the Fmoc-AAs, the
reaction mixture was still clear after the same period of time. This result suggests
that the Fmoc-AAs are catalysts for the sol-gel synthesis of silica.
The Fmoc-AA functionalized CNTs were then employed as templates for the
synthesis of CNT-silica nanohybrid materials at room temperature and neutral pH
(pH 7.6) via the in-situ sol-gel process. Tetraethyl orthosilicate (TEOS) was used
as the silica precursor. In absence of the Fmoc-AAs, TEOS were found to

183
randomly nucleate to form separate silica particles without attaching to the CNTs
which showed a smooth surface with an average diameter of 56.0 ± 10.1 nm
(Figure 5.1a). This lack of interaction was due to there being no affinity between
the pristine CNTs and silica precursors. In contrast, in presence of Fmoc-Trp and
Fmoc-His, a relatively uniform layer of coating was observed on the individual
CNTs as evidenced by the presence of a rougher surface (Figure 5.1b and c). Free
SiO2 particles were rarely present in the samples. As for Fmoc-Tyr functionalized
CNTs, a mixture of partially coated and uncoated CNTs were observed (Figure
5.1d). This observation suggests the importance of the surfactants in controlling
the morphology of the final hybrid materials. The elemental composition of the
product was analyzed using energy-dispersive spectroscopy. The presence of
elemental signals of C,O and Si confirmed the existence of SiO2 coating on CNTs
(Figure 5.1e). The Al signal was originated from the SEM stub. The quantitative
analysis revealed that the atomic ratio of O:Si was ~4. The rather high value may
be due to the presence of a very thin layer of Al2O3 on the top of the aluminum
substrate or the EDX analysis software assuming depth, take-off angles and
absorption values for a solid planar surface.
500nm
(b)
500nm
(a)
silica particle uncoated
500nm

184
Figure 5.1 SEM images of (a) the product obtained from the control experiment in
which pristine CNTs were used as templates. (b) Silica coated Fmoc-Trp and (c)
Fmoc-His functionalized CNTs. (d) A mixture of partially coated and uncoated
CNTs in the presence of Fmoc-Tyr after reaction for 21 days. (e) EDX spectrum of
the product shown in (c). Note that the aluminum and some of the oxygen were
from the sample stub.
In order to study the change in the silica coating morphology over reaction time,
TEM images were taken on samples which had been coated for periods between 3
to 21 days. In absence of Fmoc-AAs, silica precipitated in solution in form of
large clusters and the nanotubes remained uncoated (Figure 5.2a). In contrast, a
relatively uniform layer of silica was found on Fmoc-Trp (Figure 5.2b and c) and
Fmoc-His functionalized CNTs (Figure 5.2d and e) respectively. There were
several difficulties in accurately measuring the thickness of SiO2 coating.
Although the diameter of SiO2 coated CNTs can be determined based on SEM
Element at. %
C 57.77
Al 35.1
Si 1.12
Cu 1.57
O 4.44
(e)
0 2 4 6
0
2000
4000
6000
8000
10000
Co
un
ts (
a.u
.)
Energy (keV)
C
Cu
Al
Si O
500nm
(c)
uncoated
coated
(d)
500nm

185
images, the CNT template was not visible, making it impossible to directly
measure the thickness of the coatings. It was possible to measure the thickness in
TEM, however in bright field imaging it was difficult to determine exactly where
the interface between the SiO2 coating and the CNT was, leading to errors in the
measurement. The average coating thickness was determined to be 3.6 ± 0.6 nm
and 4.7 ± 0.5 nm for Fmoc-Trp (Figure 5.2b) and Fmoc-His (Figure 5.2d)
functionalized CNTs respectively after 3 days of reaction. Whereas, Fmoc-Tyr
functionalized CNTs were only partially covered (Figure 5.2f). No agglomeration
of the CNTs was observed during the coating process indicating that the aromatic
Fmoc-AAs were highly effective in dispersing CNTs in aqueous solution and
preventing the formation of bundles. After 21 days reaction, the silica coating on
Fmoc-Trp and Fmoc-His functionalized CNTs became thicker and less uniform
compared with those formed at 3 days, with the thickness increasing to
7.3±0.6nm (Figure 5.2c) and 6.8 ± 2.6 nm (Figure 5.2e) respectively. In contrast,
Fmoc-Tyr functionalized CNTs still exhibited a partial coating (Figure 5.2g).
These observations are in good agreement with the SEM analysis. The measured
coating thickness is summarized in Table 5.1.

186
3 days 21 days
Control
Fmoc-Trp
Fmoc-His
Fmoc-Tyr
(a)
(b) (c)
(d) (e)
uncoated
(f) (g)
uncoated
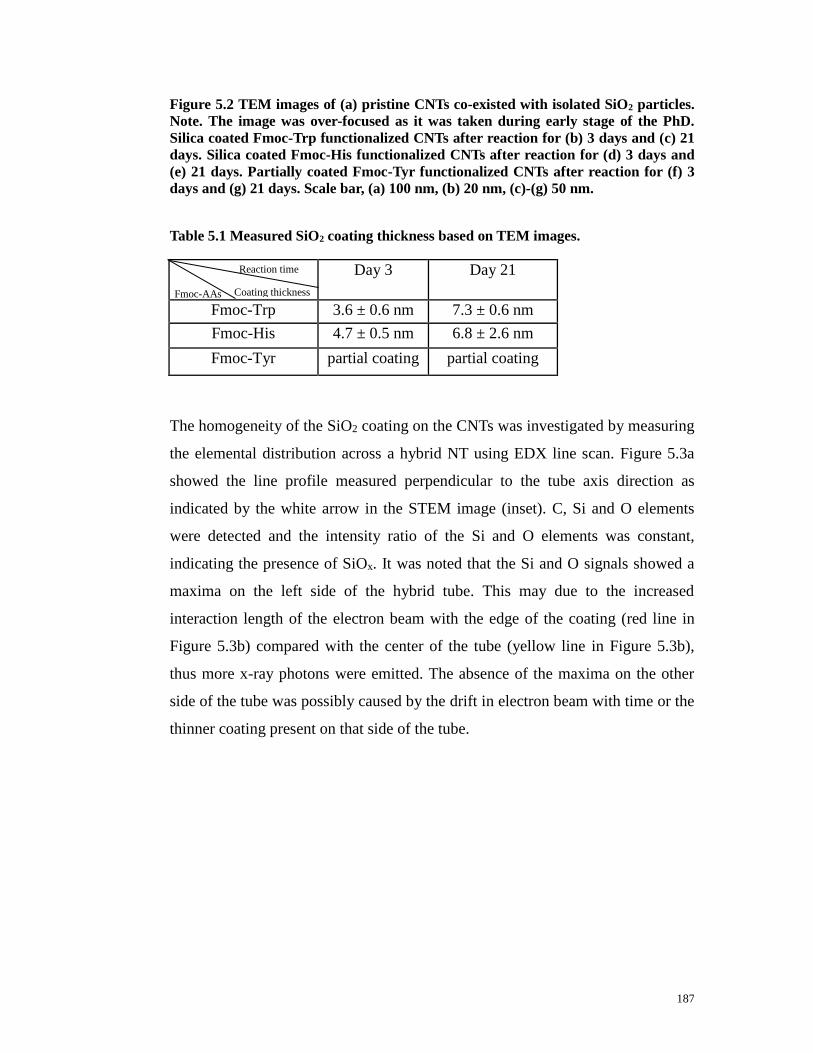
187
Figure 5.2 TEM images of (a) pristine CNTs co-existed with isolated SiO2 particles.
Note. The image was over-focused as it was taken during early stage of the PhD.
Silica coated Fmoc-Trp functionalized CNTs after reaction for (b) 3 days and (c) 21
days. Silica coated Fmoc-His functionalized CNTs after reaction for (d) 3 days and
(e) 21 days. Partially coated Fmoc-Tyr functionalized CNTs after reaction for (f) 3
days and (g) 21 days. Scale bar, (a) 100 nm, (b) 20 nm, (c)-(g) 50 nm.
Table 5.1 Measured SiO2 coating thickness based on TEM images.
Day 3 Day 21
Fmoc-Trp 3.6 ± 0.6 nm 7.3 ± 0.6 nm
Fmoc-His 4.7 ± 0.5 nm 6.8 ± 2.6 nm
Fmoc-Tyr partial coating partial coating
The homogeneity of the SiO2 coating on the CNTs was investigated by measuring
the elemental distribution across a hybrid NT using EDX line scan. Figure 5.3a
showed the line profile measured perpendicular to the tube axis direction as
indicated by the white arrow in the STEM image (inset). C, Si and O elements
were detected and the intensity ratio of the Si and O elements was constant,
indicating the presence of SiOx. It was noted that the Si and O signals showed a
maxima on the left side of the hybrid tube. This may due to the increased
interaction length of the electron beam with the edge of the coating (red line in
Figure 5.3b) compared with the center of the tube (yellow line in Figure 5.3b),
thus more x-ray photons were emitted. The absence of the maxima on the other
side of the tube was possibly caused by the drift in electron beam with time or the
thinner coating present on that side of the tube.
Reaction time
Fmoc-AAs Coating thickness
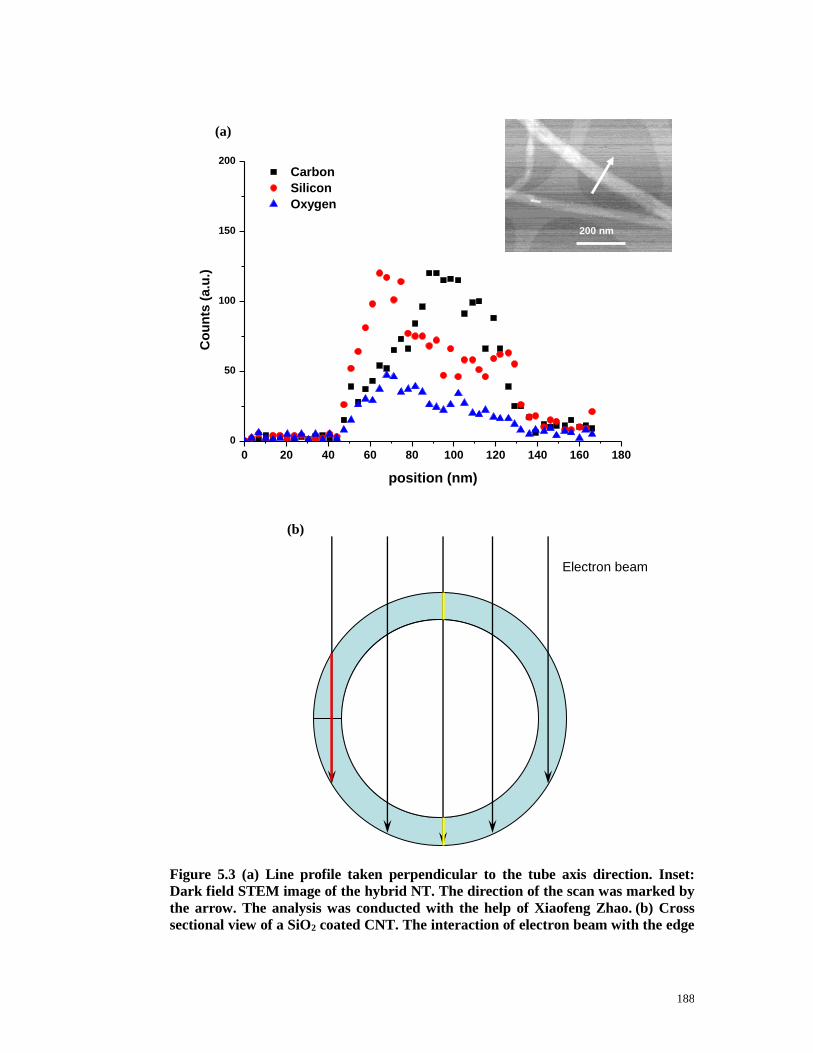
188
Figure 5.3 (a) Line profile taken perpendicular to the tube axis direction. Inset:
Dark field STEM image of the hybrid NT. The direction of the scan was marked by
the arrow. The analysis was conducted with the help of Xiaofeng Zhao. (b) Cross
sectional view of a SiO2 coated CNT. The interaction of electron beam with the edge
200 nm
0 20 40 60 80 100 120 140 160 180
0
50
100
150
200
Carbon
Silicon
OxygenC
ou
nts
(a
.u.)
position (nm)
(a)
Electron beam
(b)

189
and the centre of the hybrid tube was indicated by the red and yellow line
respectively. Blue colour: silica coating.
5.2.2 Discussion on the role of Fmoc-AA functionalization
in controlling the morphology of the hybrids
Table 5.2 Correlation of the adsorption equilibrium of the Fmoc-AAs on CNT mats
with the morphology of the hybrids
Fmoc-AAs Equilibrium loading
(mmol /m2 CNT)
Structures produced
None - No coating, only isolated SiO2 particles
Fmoc-Trp 0.000325 Uniform coating with thickness of 7.3 ± 0.6 nm
Fmoc-His 0.000301 Uniform coating with thickness of 6.8 ± 2.6 nm
Fmoc-Tyr 0.000258 Mixture of partially coated and uncoated CNTs
Table 5.2 shows the correlation of the adsorption equilibrium of the Fmoc-AAs
on CNTs with the structure of the obtained hybrids. It was found that with more
Fmoc-AAs adsorbed on CNTs, more uniform coating was observed. This could
be attributed to the presence of a lower density of binding sites on Fmoc-Tyr
functionalized CNTs for silica deposition compared with Fmoc-Trp and
Fmoc-His functionalized CNTs. It is probable that the weaker H-bonding
interaction between Tyr and hydrolyzed TEOS (O−H… :O = 21 kJ/mol) compared
with those between Trp or His and hydrolyzed TEOS (O−H… :N = 29 kJ/mol)
also contributed to the partial coating of CNTs.
5.2.3 Growing mechanism of silica coating on Fmoc-AA
functionalized CNTs
The surface modifier is proposed to play a dual role in the coating process. Firstly,
the Fmoc-AA acts as an electrostatic surfactant as under the neutral pH of the
reaction medium, the carboxylic acid group exposed on the amide backbone is
deprotonated to produce overall negative charge which stabilize the dispersion of
CNTs 10. This dispersion favours individually coated CNTs. Secondly, the
functionalities such as indole, imidazole and hydroxyl groups provides binding

190
sites for silica deposition. Previous studies 11,12 have demonstrated that the
hydroxyl or imidazole group alone was not sufficient to catalyze the hydrolysis of
TEOS. Therefore the functionalities studied in the present work were only
capable of catalyzing silicic acid condensation 4,5. The schematic illustration for
the interaction between the hydrolyzed TEOS and the Fmoc-AAs is shown in
Figure 5.4. For example, under the neutral pH of the reaction medium, the
imidazole side chain of Fmoc-His could strongly attract the hydrolyzed precursor
towards CNTs’ surface through both electrostatic (Figure 5.4a) and H-bonding
interactions (Figure 5.4b). This attraction results in an increase in the local
concentration of silica precursors in the vicinity of CNTs and consequently SiO2
nuclei are preferentially formed on the surface of CNTs through
polycondensation between adjacent precursors. The nuclei will further adsorb and
condense with the additional precursors from solution to build up of the SiO2
coating. Whereas, the indole and hydroxyl side chains of Fmoc-Trp (Figure 5.4c)
and Fmoc-Tyr (Figure 5.4d) respectively can only form H-bonds with the
hydrolyzed TEOS due to their unionizable natures at neutral pH. This observation
was in contrary to the proposed mechanism that the presence of both imidazole
side chain of histidine-165 and hydroxy group of serine-26 was required for the
efficient catalysis of silica synthesis at neutral pH 13.
(a)
(b)

191
Figure 5.4 Proposed catalytic mechanisms for silica templating. (a) Electrostatic
attraction between the protonated imidazole group of Fmoc-His and silicate anion.
H-bonding between (b) imidazole group of Fmoc-His, (c) indole group of Fmoc-Trp,
(d) hydroxyl group of Fmoc-Tyr and silanol group of hydrolyzed TEOS.
5.2.4 Kinetics for silica growth
Previous studies have reported that 29Si NMR can be used to study the sol-gel
process of silica at the molecular level 14 as it allows effective identification of
numerous silicate species, from dimers to prismatic hexamers, present in aqueous
silicate solutions. Therefore, the kinetics of silica polymerization in the presence
of Fmoc-AAs was followed with 29Si NMR. A mixture of TEOS and
Fmoc-His/D2O solution and EtOH with the volume ratio of 2:1:4 was examined
without CNTs due to the presence of magnetic Fe catalyst particles in CNTs
which would interfere with the measurement. The NMR spectrum of the 29Si
nucleus measured for the sample showed only the monomer peak after standing
for 7 days despite the same experiment conducted outside the NMR observed the
precipitation of silica after reaction for the same period of time.
(c)
(d)

192
Given the issues with the NMR approach, the change in the thickness of SiO2
coating was monitored over time by SEM to investigate the kinetics. This
approach of course does not follow the polymerization reaction but rather infers
from the thickness of the silica coating. The reaction was allowed to proceed for 3,
7 and 21 days. Due to the issue with SEM observation, the corresponding SiO2
coating thickness can not be measured. Instead, the change in the diameter of the
hybrid NT was followed by SEM and plotted against the growth time (Figure
5.5d). It was found that the average diameter of the hybrid NTs increased from
69.1 ± 14.3 nm after 3 days (Figure 5.5a) to 88.6 ± 13.5 nm after 7 days (Figure
5.5b) and to 111.4 ± 23.2 nm after 21 days of reaction (Figure 5.5c). This
observation reveals the potential of sol-gel method in controlling the thickness of
inorganic coating via tuning the reaction time.
(a) (b)
(c)
0 5 10 15 20 25
0
50
100
150
Dia
me
ter
of th
e h
yb
rid
NT
/ n
m
Growth time / day
(d)

193
Figure 5.5 SEM images of silica coated Fmoc-His functionalized CNTs obtained
after a growth time of (a) 3 days (b) 7 days and (c) 21 days. (d) Plot of the diameter
of the hybrid NT against the growth time. The average value was calculated based
on 50 separate measurements.
5.2.5 Annealing
The hybrid NTs were annealed in air at 200 °C for 2 h. TEM images of the treated
samples revealed more uniform and compact coverage of silica on CNTs (Figure
5.6b and d) as compared with those observed for the as-produced hybrids (Figure
5.6a and c), possibly due to the further crosslinking between the non-bridged
silanol groups in the coating at high temperature.
Before annealing
After annealing
Fmoc-Trp
Fmoc-His
Figure 5.6 TEM images of silica coated Fmoc-Trp functionalized CNTs (a) before
and (b) after annealing at 200 °C, and silica coated Fmoc-His functionalized CNTs
(c) before and (d) after annealing under the same condition. Scale bar, 50 nm.
(a) (b)
(c) (d)

194
5.3 Synthesis of CNT-TiO2 nanohybrids using
Fmoc-AAs as surface modifier
5.3.1 Synthesis and morphology characterization
The same Fmoc-AAs that were used for the silica coating experiments described
above were also used as surface modifiers for the synthesis of CNT-TiO2
nanohybrids. Titanium butoxide (TBOT) was used as titania precursor and all the
reactions proceed under 0 °C for 1h. The concentration of CNTs was 30 wt% with
respect to the expected mass of TiO2. The morphology of the products was
studied by SEM. A control experiment was run in which pristine CNTs were used
as templates. Similar to the synthesis of CNT-SiO2 nanohybrids, large amounts of
isolated TiO2 particles were observed to randomly co-exist with uncoated CNTs
in the resulting mixture as evidenced by the diameter of the NTs which closely
matched that of the pristine CNTs (Figure 5.7a). In contrast, uniform coating was
observed on individual CNTs in the presence of Fmoc-Trp (Figure 5.7b),
Fmoc-His (Figure 5.7c) and Fmoc-Tyr (Figure 5.7d) as evidenced by the increase
in the diameter of the NTs to 78.3 ± 17.4 nm, 86.3 ± 14.3 nm and 104.5 ±16.0 nm
respectively. BA was also used as the surface modifier for comparison. A partial
and thin coating was deposited on CNTs in the presence of BA, along with the
presence of isolated TiO2 particles (Figure 5.7e). This observation suggests the
weaker π–π stacking interaction between BA and CNTs compared with that of the
aromatic Fmoc-AAs, possibly attributed to the lower degree of aromaticity of BA,
which was consistent with the adsorption study in Chapter 4. It is worth noting
that the uniform TiO2 coating on BA functionalized CNTs observed in Eder’s
study 2,3 was not achieved in the current study due to the addition of considerably
lower amount of BA to make the results comparable. Based on these results, it is
concluded that the surface chemistry of CNTs played a key role in controlling the
morphology of the hybrids. EDX analysis confirmed the presence of C, Ti and O
in all of the synthesized nanohybrids (Figure 5.7f-h). Quantitative EDX analysis
revealed that the atomic ratio of O:Ti was ~2.4, which was slightly higher than
that of TiO2, possibly due to the same issue as discussed in Section 5.2.1.

195
0 2 4 60
500
1000
1500
2000
2500
3000
3500
Co
un
ts (
a.u
.)
Energy (keV)
C
O
Al
Ti
(h)
Cu
Element at. %
Ti 2.86
Cu 1.65
Al 32.6
C 57.07
O 5.82
(e)
1μm
1μm
(d)
1μm
(c)
(b)
1μm
(a)
0 2 4 60
500
1000
1500
2000
2500
3000
3500
Co
un
ts (
a.u
.)
Energy (keV)
C O
Al
Pt Ti
(g)
Cu
0 2 4 60
500
1000
1500
2000
2500
3000
3500
Co
un
ts (
a.u
.)
Energy (keV)
C
O Pt Ti
Al
(f)
Cu
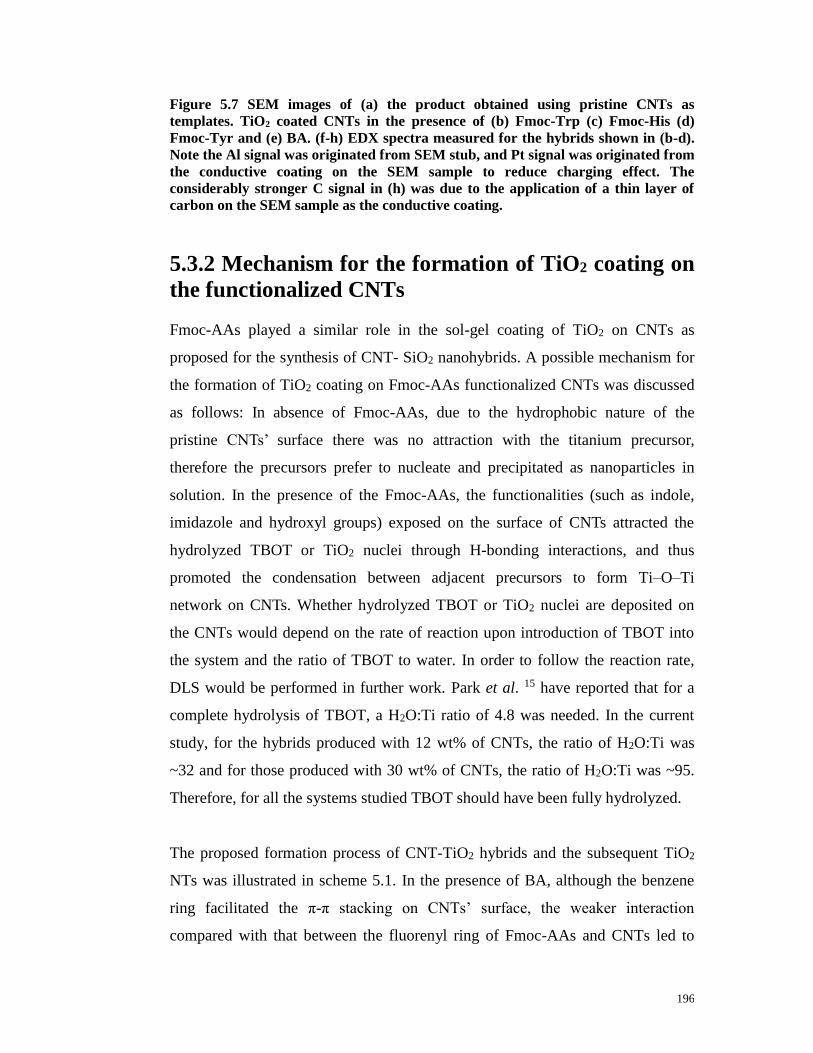
196
Figure 5.7 SEM images of (a) the product obtained using pristine CNTs as
templates. TiO2 coated CNTs in the presence of (b) Fmoc-Trp (c) Fmoc-His (d)
Fmoc-Tyr and (e) BA. (f-h) EDX spectra measured for the hybrids shown in (b-d).
Note the Al signal was originated from SEM stub, and Pt signal was originated from
the conductive coating on the SEM sample to reduce charging effect. The
considerably stronger C signal in (h) was due to the application of a thin layer of
carbon on the SEM sample as the conductive coating.
5.3.2 Mechanism for the formation of TiO2 coating on
the functionalized CNTs
Fmoc-AAs played a similar role in the sol-gel coating of TiO2 on CNTs as
proposed for the synthesis of CNT- SiO2 nanohybrids. A possible mechanism for
the formation of TiO2 coating on Fmoc-AAs functionalized CNTs was discussed
as follows: In absence of Fmoc-AAs, due to the hydrophobic nature of the
pristine CNTs’ surface there was no attraction with the titanium precursor,
therefore the precursors prefer to nucleate and precipitated as nanoparticles in
solution. In the presence of the Fmoc-AAs, the functionalities (such as indole,
imidazole and hydroxyl groups) exposed on the surface of CNTs attracted the
hydrolyzed TBOT or TiO2 nuclei through H-bonding interactions, and thus
promoted the condensation between adjacent precursors to form Ti–O–Ti
network on CNTs. Whether hydrolyzed TBOT or TiO2 nuclei are deposited on
the CNTs would depend on the rate of reaction upon introduction of TBOT into
the system and the ratio of TBOT to water. In order to follow the reaction rate,
DLS would be performed in further work. Park et al. 15 have reported that for a
complete hydrolysis of TBOT, a H2O:Ti ratio of 4.8 was needed. In the current
study, for the hybrids produced with 12 wt% of CNTs, the ratio of H2O:Ti was
~32 and for those produced with 30 wt% of CNTs, the ratio of H2O:Ti was ~95.
Therefore, for all the systems studied TBOT should have been fully hydrolyzed.
The proposed formation process of CNT-TiO2 hybrids and the subsequent TiO2
NTs was illustrated in scheme 5.1. In the presence of BA, although the benzene
ring facilitated the π-π stacking on CNTs’ surface, the weaker interaction
compared with that between the fluorenyl ring of Fmoc-AAs and CNTs led to

197
lower number density of binding sites on CNTs for TiO2 deposition. This
observation indicated the important role of the aromatic Fmoc-AAs in the
formation of the hybrid nanostructures. Presumably, TiO2 coating is not formed
via a Ti–O–C bond, as is the case for acid-treated CNTs, but rather via π-π
stacking interaction between CNTs and the fluorenyl ring of Fmoc-AAs 3.
Scheme 5.1 Schematic illustration of the preparation of CNT-TiO2 nanohybrids and
TiO2 NTs in the presence of Fmoc-His. The exposed imidazole groups on CNT’s
Calcination
TiO2 NT TiO2 coated CNT
TBOT
Hydrolysis
Condensation
Fmoc-His
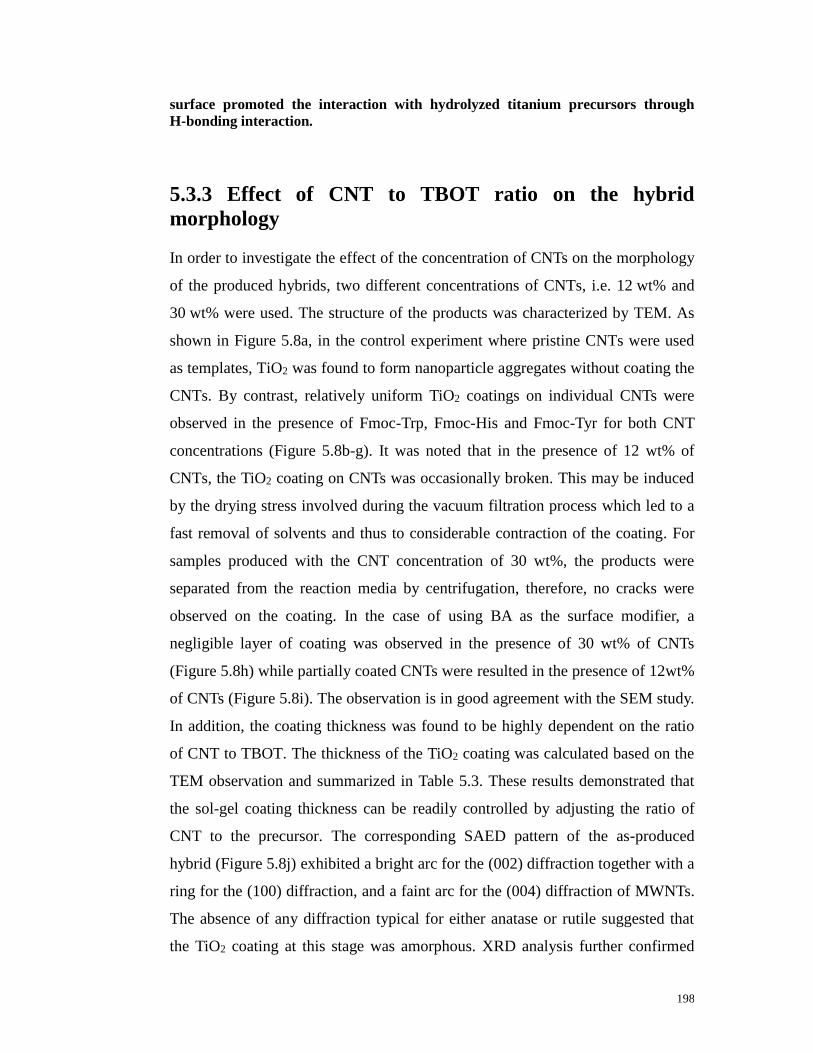
198
surface promoted the interaction with hydrolyzed titanium precursors through
H-bonding interaction.
5.3.3 Effect of CNT to TBOT ratio on the hybrid
morphology
In order to investigate the effect of the concentration of CNTs on the morphology
of the produced hybrids, two different concentrations of CNTs, i.e. 12 wt% and
30 wt% were used. The structure of the products was characterized by TEM. As
shown in Figure 5.8a, in the control experiment where pristine CNTs were used
as templates, TiO2 was found to form nanoparticle aggregates without coating the
CNTs. By contrast, relatively uniform TiO2 coatings on individual CNTs were
observed in the presence of Fmoc-Trp, Fmoc-His and Fmoc-Tyr for both CNT
concentrations (Figure 5.8b-g). It was noted that in the presence of 12 wt% of
CNTs, the TiO2 coating on CNTs was occasionally broken. This may be induced
by the drying stress involved during the vacuum filtration process which led to a
fast removal of solvents and thus to considerable contraction of the coating. For
samples produced with the CNT concentration of 30 wt%, the products were
separated from the reaction media by centrifugation, therefore, no cracks were
observed on the coating. In the case of using BA as the surface modifier, a
negligible layer of coating was observed in the presence of 30 wt% of CNTs
(Figure 5.8h) while partially coated CNTs were resulted in the presence of 12wt%
of CNTs (Figure 5.8i). The observation is in good agreement with the SEM study.
In addition, the coating thickness was found to be highly dependent on the ratio
of CNT to TBOT. The thickness of the TiO2 coating was calculated based on the
TEM observation and summarized in Table 5.3. These results demonstrated that
the sol-gel coating thickness can be readily controlled by adjusting the ratio of
CNT to the precursor. The corresponding SAED pattern of the as-produced
hybrid (Figure 5.8j) exhibited a bright arc for the (002) diffraction together with a
ring for the (100) diffraction, and a faint arc for the (004) diffraction of MWNTs.
The absence of any diffraction typical for either anatase or rutile suggested that
the TiO2 coating at this stage was amorphous. XRD analysis further confirmed

199
the amorphous nature of the as-produced TiO2 coating. Figure 5.8k showed the
(002) diffractions of C (2θ=26.2°) superimposed by a broad background which
indicated the presence of an amorphous phase.
30 wt% CNTs 12 wt% CNTs
Control
Fmoc-Trp
Fmoc-His
(b) (c)
(d) (e)
(a)

200
Figure 5.8 TEM images of (a) the product obtained using pristine CNTs as
templates. TiO2 coated CNTs in the presence of Fmoc-Trp with the CNT
concentration of (b) 30 wt% and (c) 12 wt%. TiO2 coated CNTs in the presence of
Fmoc-His with the CNT concentration of (d) 30 wt% and (e) 12 wt%. A cluster of
TiO2 nanoparticles were deposited on the smooth surface of the TiO2 coating in (e).
TiO2 coated CNTs in the presence of Fmoc-Tyr with the CNT concentration of (f)
30 wt% and (g) 12 wt%. TiO2 coated CNTs in the presence of BA with the CNT
concentration of (h) 30 wt% and (i) 12 wt%. The arrows indicated the uncoated
(004) (100)
(002)
(j)
20 30 40 50 60
0
5000
10000
15000
20000
Inte
nsity / a
.u.
2θ / º
C (002)
(k)
Fmoc-Tyr
BA
(f) (g)
(h) (i)

201
part of CNTs. Note. This was different from the cracks resulting from the drying
effect. (j) SAED pattern taken from the sample shown in (f). (k) XRD pattern of the
as-produced CNT-TiO2 nanohybrids. C: CNT. For (c), (e), (g) and (i), scale bar =
200 nm. For (a), (b), (d), (f) and (h), scale bar = 100 nm.
Table 5.3 Measured thickness of the TiO2 coating based on the TEM observation
30 wt%
12 wt%
Fmoc-Trp 10.4 ± 2.3 48.3 ± 7.3
Fmoc-His 13.4 ± 1.1 49.7 ± 7.9
Fmoc-Tyr 12.7 ± 3.8 70.0 ± 2.2
BA 4.3 ± 1.0 17.7 ± 2.1
5.3.4 Effect of modifier to CNT ratio on the hybrid
morphology
Zhang et al. 16 highlighted the critical role of the ratio of surfactants to CNTs in
determining the morphology of the SiO2 coating. Herein, to investigate the effect
of the ratio of the Fmoc-AAs to CNTs on the morphology of the resulting hybrids,
Fmoc-His solution was diluted by a factor of 10 while the other parameters were
kept constant. SEM images revealed the strong influence of the concentration of
Fmoc-His on the morphology of the hybrids which undergoes a dramatic change
from uniformly coated CNTs at high Fmoc-His loadings (Figure 5.9a) to random
coexistence of isolated TiO2 particles and uncoated CNTs at low Fmoc-His
loadings (Figure 5.9b). The lack of coating at low Fmoc-His loading is believed
to be due to an insufficient density of Fmoc-His on CNTs’ surface to induce TiO2
deposition. This observation further emphasizes the role of the Fmoc-AAs in the
synthesis of the hybrid nanostructures.
Surface
modifier
Concentration
of CNTs
Thickness of
coating (nm)
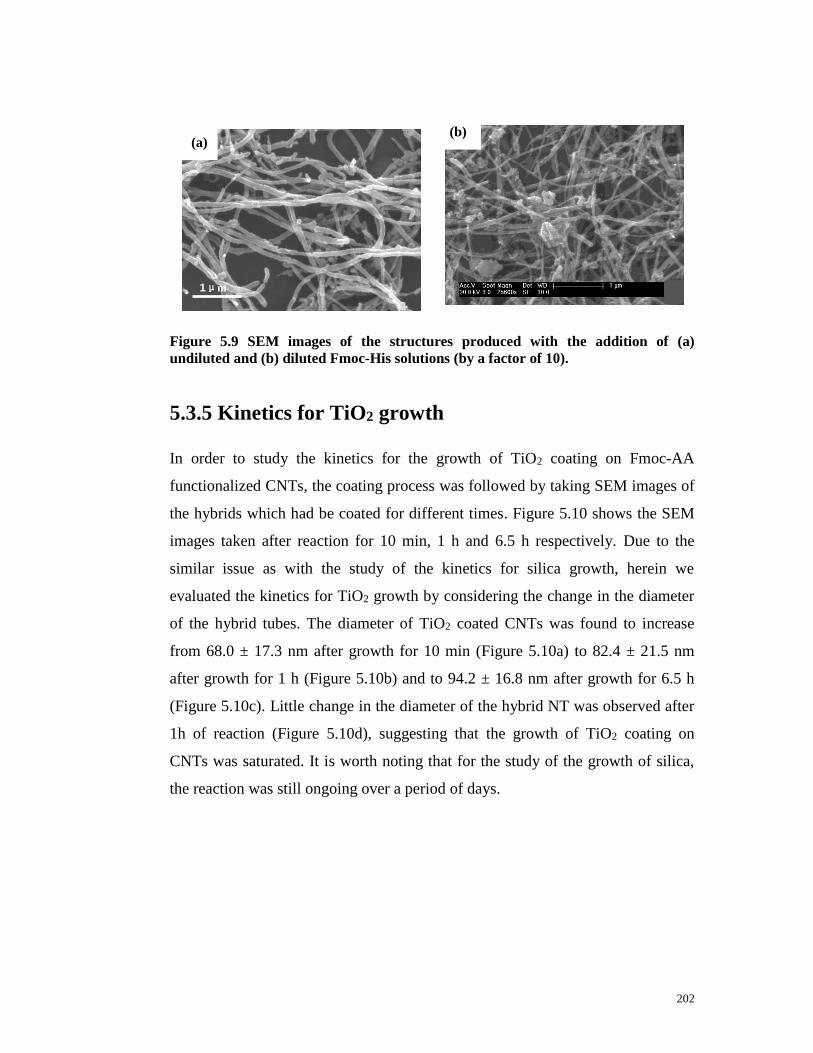
202
Figure 5.9 SEM images of the structures produced with the addition of (a)
undiluted and (b) diluted Fmoc-His solutions (by a factor of 10).
5.3.5 Kinetics for TiO2 growth
In order to study the kinetics for the growth of TiO2 coating on Fmoc-AA
functionalized CNTs, the coating process was followed by taking SEM images of
the hybrids which had be coated for different times. Figure 5.10 shows the SEM
images taken after reaction for 10 min, 1 h and 6.5 h respectively. Due to the
similar issue as with the study of the kinetics for silica growth, herein we
evaluated the kinetics for TiO2 growth by considering the change in the diameter
of the hybrid tubes. The diameter of TiO2 coated CNTs was found to increase
from 68.0 ± 17.3 nm after growth for 10 min (Figure 5.10a) to 82.4 ± 21.5 nm
after growth for 1 h (Figure 5.10b) and to 94.2 ± 16.8 nm after growth for 6.5 h
(Figure 5.10c). Little change in the diameter of the hybrid NT was observed after
1h of reaction (Figure 5.10d), suggesting that the growth of TiO2 coating on
CNTs was saturated. It is worth noting that for the study of the growth of silica,
the reaction was still ongoing over a period of days.
(b)
1μm
(a)

203
Figure 5.10 SEM images of TiO2 coating growing on Fmoc-Trp functionalized
CNTs at different reaction times of (a) 10 min (b) 1 h and (c) 6.5 h. (d) Plot of the
diameter of the hybrid NT against the growth time. The average value was
calculated based on 50 separate measurements.
5.3.6 Synthesis of TiO2 NTs In order to induce crystallization of the coating and to produce TiO2 NTs, the
as-produced hybrid materials were calcined at 400 °C 17 for 2 h followed by at
550 ºC for 2 h to remove CNT templates. Previous studies have shown that 550ºC
was sufficiently high to oxidize CNT templates but not so high as to destroy the
TiO2 nanotube morphology 18. The oxidation proceeds from inside the hollow
region of CNTs rather than from outside graphitic layers 19.
The morphology of the thermally treated hybrids was characterized by SEM and
(a) (b)
(c)
0 1 2 3 4 5 6 7 8
0
50
100
150
Dia
me
ter
of th
e h
yb
rid
NT
/ n
m
Growth time / h
(d)
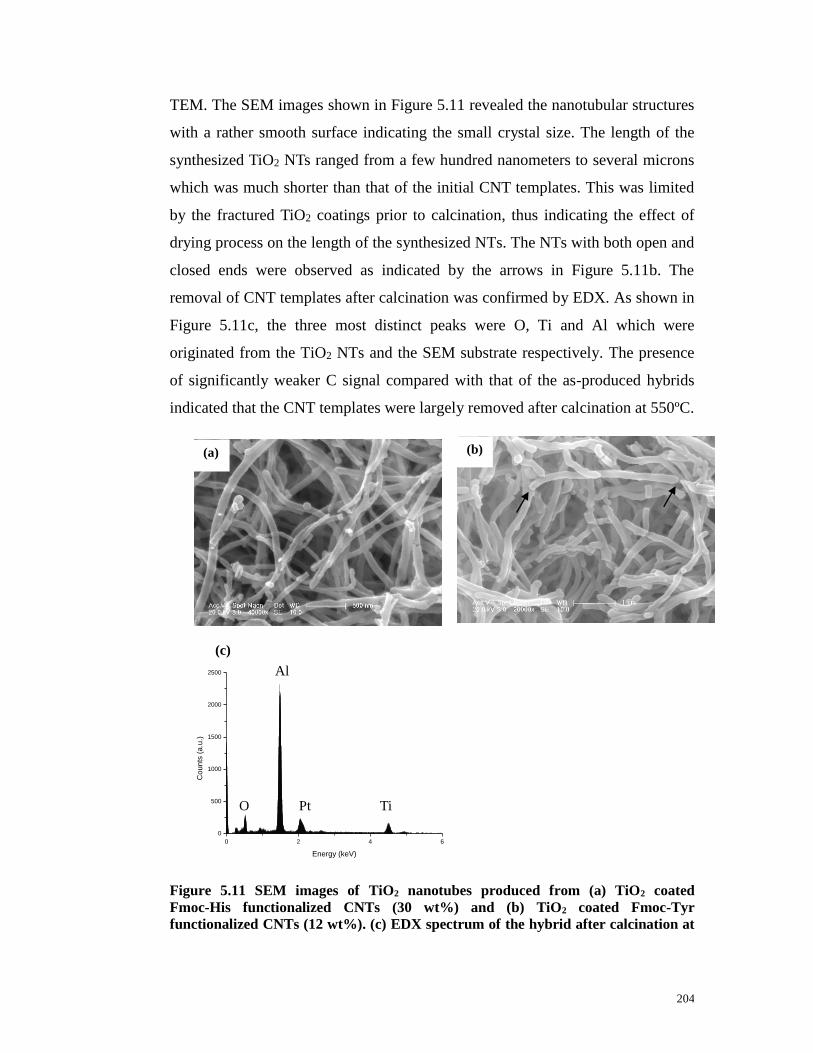
204
TEM. The SEM images shown in Figure 5.11 revealed the nanotubular structures
with a rather smooth surface indicating the small crystal size. The length of the
synthesized TiO2 NTs ranged from a few hundred nanometers to several microns
which was much shorter than that of the initial CNT templates. This was limited
by the fractured TiO2 coatings prior to calcination, thus indicating the effect of
drying process on the length of the synthesized NTs. The NTs with both open and
closed ends were observed as indicated by the arrows in Figure 5.11b. The
removal of CNT templates after calcination was confirmed by EDX. As shown in
Figure 5.11c, the three most distinct peaks were O, Ti and Al which were
originated from the TiO2 NTs and the SEM substrate respectively. The presence
of significantly weaker C signal compared with that of the as-produced hybrids
indicated that the CNT templates were largely removed after calcination at 550ºC.
Figure 5.11 SEM images of TiO2 nanotubes produced from (a) TiO2 coated
Fmoc-His functionalized CNTs (30 wt%) and (b) TiO2 coated Fmoc-Tyr
functionalized CNTs (12 wt%). (c) EDX spectrum of the hybrid after calcination at
(a) (b)
0 2 4 6
0
500
1000
1500
2000
2500
Co
un
ts (
a.u
.)
Energy (keV)
O
Al
Pt Ti
(c)

205
550 ºC. Note. Pt signal was originated from the conductive coating on the SEM
sample. Scale bar, (a) 500nm, (b) 1μm.
The TEM images gave further information about the structure of the produced
TiO2 NTs. As shown in Figure 5.12, calcination of the hybrids produced with
30wt% of CNTs resulted in very thin and collapsed NT structures (Figure 5.12a,e
and g) except for that produced from Fmoc-His functionalized CNTs (Figure
5.12c) which exhibited well-defined NT structures with the inner diameter of
58.9± 17.4 nm and wall thickness of 12.5 ± 1.3 nm. TiO2 NTs with uniform inner
diameter and wall thickness were obtained after calcination of the hybrids
produced with 12wt% of CNTs (Figure 5.12b,d and f) except for that produced in
the presence of BA which showed a collapsed tubular structure (Figure 5.12h).
The measured inner diameter and wall thickness of all the synthesized TiO2 NTs
were summarized in Table 5.4 and 5.5 respectively.
Table 5.4 Measured inner diameter of the synthesized TiO2 NTs
30wt%
12wt%
Fmoc-Trp very thin and collapsed NTs 62.5 ± 13.0
Fmoc-His 58.9 ± 17.4 50.6 ± 17.4
Fmoc-Tyr very thin and collapsed NTs 56.2 ±12.6
BA collapsed NTs collapsed NTs
Table 5.5 Measured wall thickness of the synthesized TiO2 NTs
30wt%
12wt%
Fmoc-Trp very thin and collapsed NTs 33.0 ± 6.0
Fmoc-His 12.5 ± 1.3 23.9 ± 3.2
Fmoc-Tyr very thin and collapsed NTs 33.6 ±7.3
BA collapsed NTs collapsed NTs
The mesoporous nature of the synthesized TiO2 NTs was evidenced by the high
range in contrast in the micrograph. Higher magnification image revealed that the
TiO2 NT was composed of many spherical nanocrystals with 9.9 ± 1.6 nm in
Surface
modifier
Inner diameter
of TiO2 NT (nm)
Concentration
of CNTs
Surface
modifier
Concentration
of CNTs
Wall thickness
of TiO2 NT (nm)
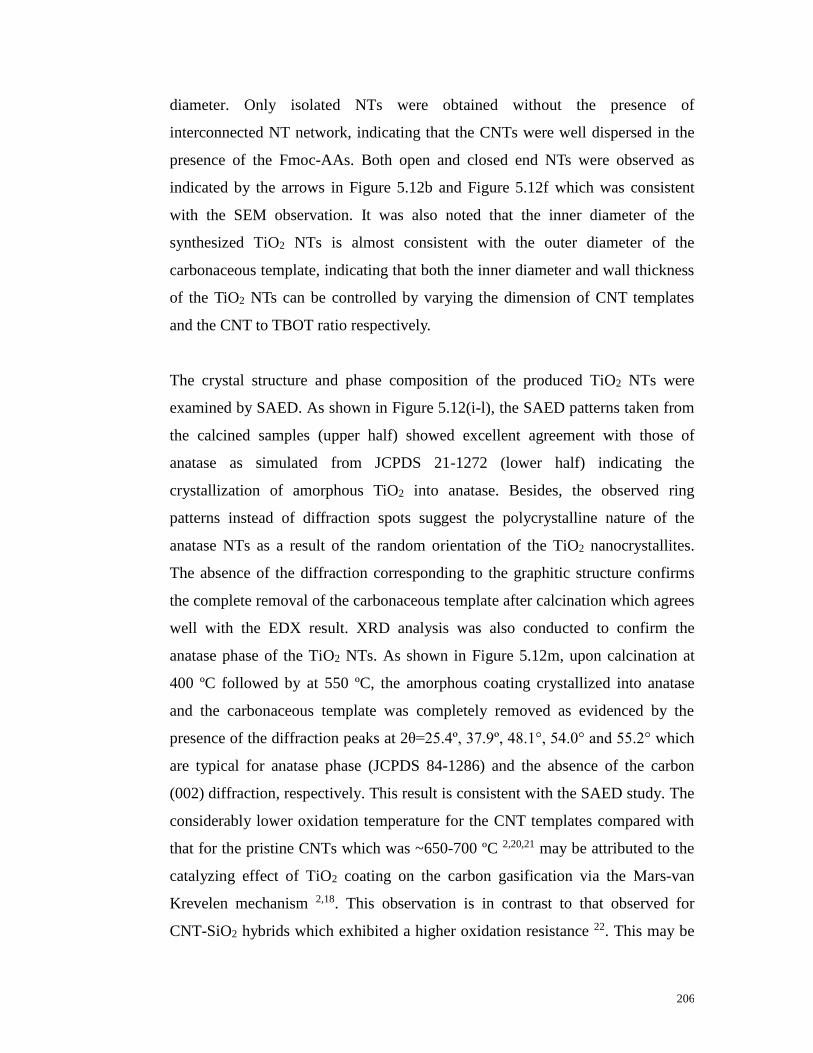
206
diameter. Only isolated NTs were obtained without the presence of
interconnected NT network, indicating that the CNTs were well dispersed in the
presence of the Fmoc-AAs. Both open and closed end NTs were observed as
indicated by the arrows in Figure 5.12b and Figure 5.12f which was consistent
with the SEM observation. It was also noted that the inner diameter of the
synthesized TiO2 NTs is almost consistent with the outer diameter of the
carbonaceous template, indicating that both the inner diameter and wall thickness
of the TiO2 NTs can be controlled by varying the dimension of CNT templates
and the CNT to TBOT ratio respectively.
The crystal structure and phase composition of the produced TiO2 NTs were
examined by SAED. As shown in Figure 5.12(i-l), the SAED patterns taken from
the calcined samples (upper half) showed excellent agreement with those of
anatase as simulated from JCPDS 21-1272 (lower half) indicating the
crystallization of amorphous TiO2 into anatase. Besides, the observed ring
patterns instead of diffraction spots suggest the polycrystalline nature of the
anatase NTs as a result of the random orientation of the TiO2 nanocrystallites.
The absence of the diffraction corresponding to the graphitic structure confirms
the complete removal of the carbonaceous template after calcination which agrees
well with the EDX result. XRD analysis was also conducted to confirm the
anatase phase of the TiO2 NTs. As shown in Figure 5.12m, upon calcination at
400 ºC followed by at 550 ºC, the amorphous coating crystallized into anatase
and the carbonaceous template was completely removed as evidenced by the
presence of the diffraction peaks at 2θ=25.4º, 37.9º, 48.1°, 54.0° and 55.2° which
are typical for anatase phase (JCPDS 84-1286) and the absence of the carbon
(002) diffraction, respectively. This result is consistent with the SAED study. The
considerably lower oxidation temperature for the CNT templates compared with
that for the pristine CNTs which was ~650-700 ºC 2,20,21 may be attributed to the
catalyzing effect of TiO2 coating on the carbon gasification via the Mars-van
Krevelen mechanism 2,18. This observation is in contrast to that observed for
CNT-SiO2 hybrids which exhibited a higher oxidation resistance 22. This may be

207
explained by that the presence of SiO2 coating tended to hinder the thermal
decomposition of CNTs by preventing the access of oxygen 23.
The size of the anatase nanocrystallites was estimated from the XRD pattern
using Scherrer equation, following:
cos
Kd (5.1)
Where, d is the crystal size of anatase, K is the shape factor (usually taken as 0.9),
λ is the wavelength of X-ray radiation, β is the full width of the anatase (101)
peak at half maximum intensity (FWHM, in radians) and θ is the corresponding
diffraction angle. The peak was fitted by Gaussian function. The value of β was
determined using OriginPro 8.1 software. The average crystal size of anatase was
calculated to be ~14 nm which was comparable to that reported by Eder 2. The
slightly higher value of the crystal size measured according to XRD compared
with that determined by TEM could be attributed to the Scherrer equation tending
to overestimate the size of particles with diameters less than 10 nm 24. It should
be also noted that the factors such as the instrumental broadening effect and strain
(lattice distortion) were not considered in the present study which also contribute
to the peak broadening.
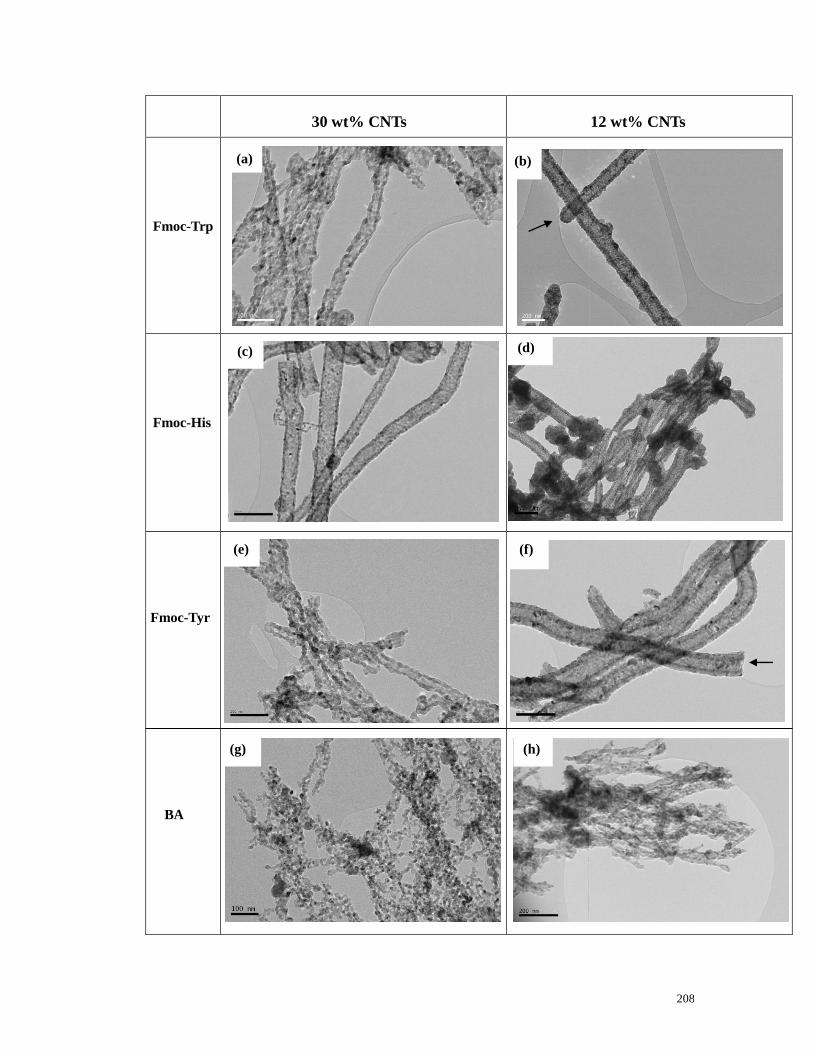
208
(a) (b)
(g)
30 wt% CNTs
12 wt% CNTs
Fmoc-Trp
Fmoc-His
(c) (d)
(e) (f)
(h)
Fmoc-Tyr
BA
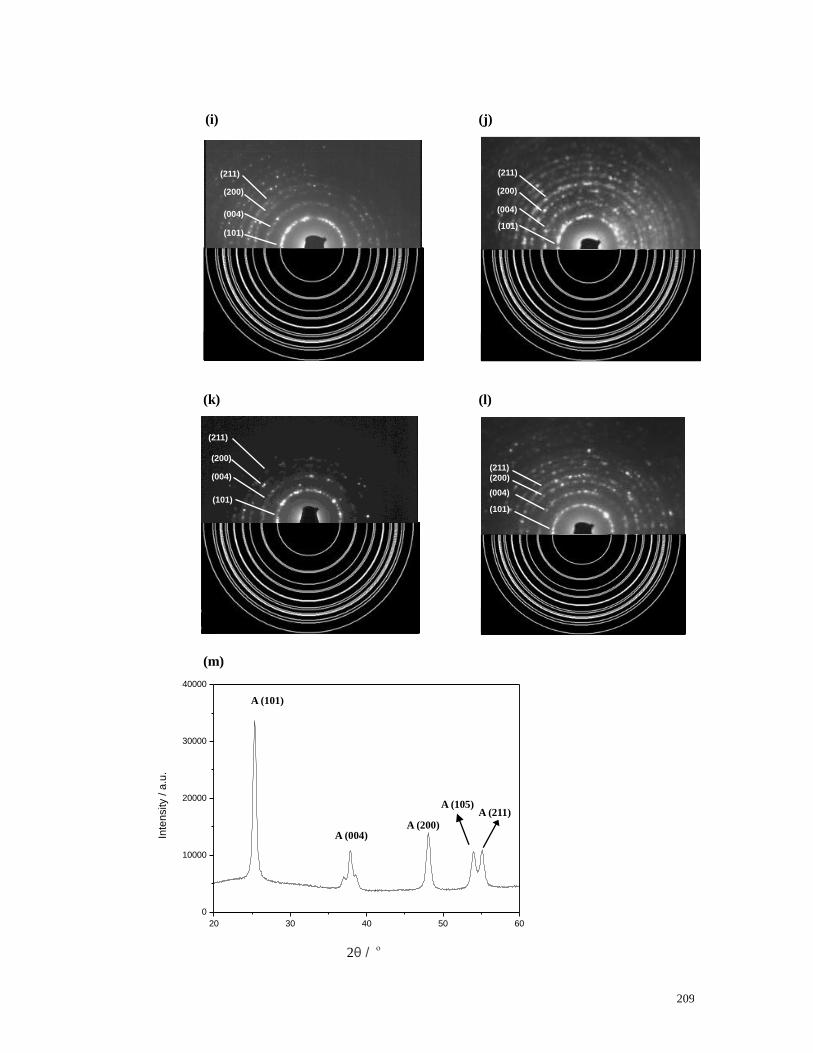
209
20 30 40 50 60
0
10000
20000
30000
40000
Inte
nsity / a
.u.
2θ / º
A (101)
A (004) A (200)
A (105) A (211)
(m)
(101)
(004)
(200)
(211)
(101)
(004)
(200)
(211)
(i)
(101)
(004)
(200)
(211)
(k)
(101)
(004)
(211)
(200)
(l)
(101)
(004)
(200)
(211)
(j)
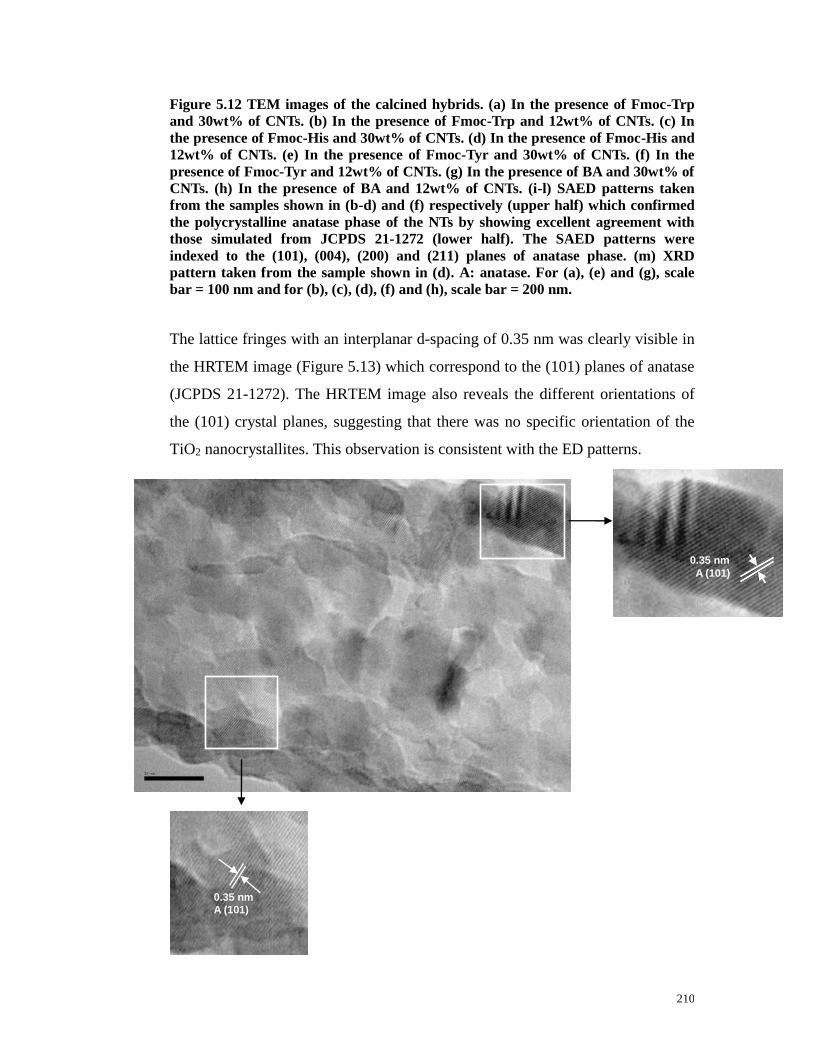
210
Figure 5.12 TEM images of the calcined hybrids. (a) In the presence of Fmoc-Trp
and 30wt% of CNTs. (b) In the presence of Fmoc-Trp and 12wt% of CNTs. (c) In
the presence of Fmoc-His and 30wt% of CNTs. (d) In the presence of Fmoc-His and
12wt% of CNTs. (e) In the presence of Fmoc-Tyr and 30wt% of CNTs. (f) In the
presence of Fmoc-Tyr and 12wt% of CNTs. (g) In the presence of BA and 30wt% of
CNTs. (h) In the presence of BA and 12wt% of CNTs. (i-l) SAED patterns taken
from the samples shown in (b-d) and (f) respectively (upper half) which confirmed
the polycrystalline anatase phase of the NTs by showing excellent agreement with
those simulated from JCPDS 21-1272 (lower half). The SAED patterns were
indexed to the (101), (004), (200) and (211) planes of anatase phase. (m) XRD
pattern taken from the sample shown in (d). A: anatase. For (a), (e) and (g), scale
bar = 100 nm and for (b), (c), (d), (f) and (h), scale bar = 200 nm.
The lattice fringes with an interplanar d-spacing of 0.35 nm was clearly visible in
the HRTEM image (Figure 5.13) which correspond to the (101) planes of anatase
(JCPDS 21-1272). The HRTEM image also reveals the different orientations of
the (101) crystal planes, suggesting that there was no specific orientation of the
TiO2 nanocrystallites. This observation is consistent with the ED patterns.
0.35 nm
A (101)
0.35 nm
A (101)

211
Figure 5.13 HRTEM image of a synthesized TiO2 NT showing the lattice spacing of
0.35 nm, corresponding to the (101) crystal planes of anatase. Scale bar, 10 nm.
5.3.7 Phase transformation
The transition from anatase to rutile is kinetically unfavorable at lower
temperatures. Therefore, temperatures between 600 ºC and 900 ºC is normally
required to induce phase transformation 25. However, at such temperatures, the
unsupported TiO2 NTs tend to collapse due to the stress associated with the
reconstruction of phase. Eder et al. 18 have shown that CNTs can support the
anatase coating during the phase transformation and be subsequently removed to
produce phase-pure rutile nanotubes.
Herein, the as-produced hybrids were heated in argon to prevent CNT oxidation.
An additional benefit of argon is that it has been previously reported that heating
in argon can lower the phase transformation temperature by at least 100 ºC 2. The
influence of heating temperature, pre-treatment and ramp rate on the phase
transformation was investigated. First, to study the effect of heating temperature,
the as-produced hybrids were heated in argon at 900 ºC and 800 ºC for 2 h using a
ramp rate of 20 ºC/min for phase transformation. Both samples were then
calcined at 550 ºC with the aim of removing the CNT templates. As shown in
Figure 5.14a, the CNTs survived the heat treatment in argon at 900 ºC followed
by in air at 550 ºC. Rod-like TiO2 nanocrystals with an average length of ~ 74 nm
and a diameter of ~48 nm were deposited on the surface of the nanotubes. These
nanocrystals were aligned approximately parallel to the long axis of the CNTs
and the XRD analysis showed that they were pure rutile phase (Figure 5.14b).
The average size of the rutile crystals was also determined from the X-ray line
broadening to be ~ 20 nm. The large discrepancy between the value calculated
from the XRD data and that from the TEM observation may due to the fact that
the shape factor K of 0.9 is only used for spherical particles, so it gave a poor
estimation of the particle size for rod-like crystallites. In contrast, the CNTs were
burnt out to leave anatase NTs after heating the as-produced hybrids in argon at
800 °C followed by in air at 550 ºC (Figure 5.14c) as supported by the SAED

212
pattern (Figure 5.14d, upper half) which showed excellent agreement with those
of anatase as simulated from JCPDS 21-1272 (lower half). This observation is in
contrast to the study which demonstrated that the onset of transition from anatase
to rutile was above 700 °C 2,18.
Furthermore, two different ways of inducing phase transformation were compared:
(1) to heat the as-produced hybrids directly in argon at 800 ºC and (2) to heat the
hybrids first in air at 400 ºC to induce crystallization followed by heating the
anatase coated CNTs in argon at 800 ºC. The ramp rates were kept at 20 ºC/min
for both methods. In contrast to those shown in Figure 5.14c, TEM image of the
sample prepared using the 2nd method showed that spherical TiO2 nanocrystals
with the average size of ~43 nm were deposited on CNTs’ surface (Figure 5.14e).
Corresponding XRD pattern (Figure 5.14f) revealed the presence of new
diffraction peaks typical for rutile phase (2θ=27.5°,36.1°,41.3°,44.1°, 54.4° and
56.7°, JCPDS 88-1175) in addition to anatase, indicating partial phase
transformation. Similar observation has previously been reported by Eder 3 who
demonstrated that the presence of BA tended to retard the phase transformation
which was attributed to the increased surface strain induced by the adsorbed
surfactants. The size of the anatase and rutile crystals was calculated from the
XRD data to be ~32 nm and ~40 nm respectively which showed moderate
agreement with the TEM study. The mass fraction of rutile phase which indicated
the extent of phase transformation was also determined from the relative
integrated peak intensities, following3:
R
A
R
I
IW
88.01
1
(5.2)
Where, WR is the percentage of rutile, IA and IR are the integrated intensity of
anatase (101) and rutile (110) peaks respectively, which were determined using
OriginPro 8.1 software. The calculated value indicated that more than 60% of
anatase has transformed to rutile. Mehranpour et al. 26 have observed complete

213
phase transformation at 800 ºC. The slower kinetics of phase transformation in
the current study may due to the non-uniform morphology and wide size
distribution of the TiO2 nanoparticles as well as the different method of
preparation 27.
Finally, the effect of ramp rate was studied with the heat treatment performed at
20 ºC/min and 1 °C/min respectively. With 1 ºC/min of heating rate, closely
packed TiO2 nanocrystals with a much smaller size of ~17 nm were observed to
uniformly coat CNTs (Figure 5.14g), indicating that the lower heating rate
favored the formation of smaller crystals and denser coverage. SAED analysis
(Figure 5.14h, upper half) confirmed the rutile phase of the TiO2 nanocrystals by
showing agreement with the diffractions of rutile as simulated from JCPDS
21-1276 (Figure 5.14h, lower half).
(c)
20 30 40 50 60
0
1000
2000
3000
4000
5000
6000
Inte
nsity / a
.u.
2θ /
R
R
R R
R
(b)
2θ / °
(d)
(211)
(200)
(004)
(101)
(a)
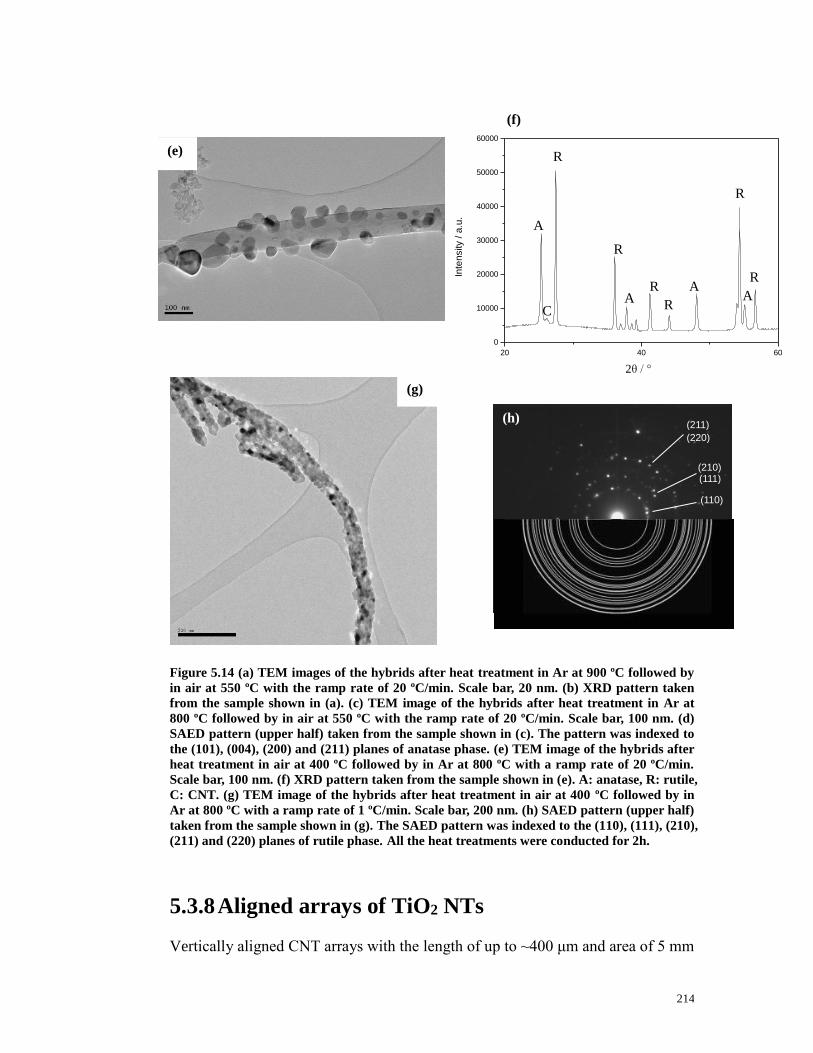
214
Figure 5.14 (a) TEM images of the hybrids after heat treatment in Ar at 900 ºC followed by
in air at 550 ºC with the ramp rate of 20 ºC/min. Scale bar, 20 nm. (b) XRD pattern taken
from the sample shown in (a). (c) TEM image of the hybrids after heat treatment in Ar at
800 ºC followed by in air at 550 ºC with the ramp rate of 20 ºC/min. Scale bar, 100 nm. (d)
SAED pattern (upper half) taken from the sample shown in (c). The pattern was indexed to
the (101), (004), (200) and (211) planes of anatase phase. (e) TEM image of the hybrids after
heat treatment in air at 400 ºC followed by in Ar at 800 ºC with a ramp rate of 20 ºC/min.
Scale bar, 100 nm. (f) XRD pattern taken from the sample shown in (e). A: anatase, R: rutile,
C: CNT. (g) TEM image of the hybrids after heat treatment in air at 400 ºC followed by in
Ar at 800 ºC with a ramp rate of 1 ºC/min. Scale bar, 200 nm. (h) SAED pattern (upper half)
taken from the sample shown in (g). The SAED pattern was indexed to the (110), (111), (210),
(211) and (220) planes of rutile phase. All the heat treatments were conducted for 2h.
5.3.8 Aligned arrays of TiO2 NTs
Vertically aligned CNT arrays with the length of up to ~400 μm and area of 5 mm
(f)
(e)
(g)
20 40 60
0
10000
20000
30000
40000
50000
60000
Inte
nsity / a
.u.
A
C
R
R
A R
R
A A
R
R
2θ / °
(f)
(110)
(111) (210)
(220)
(211) (h)

215
x 5 mm were used for the templating of TiO2 NT arrays on Si/SiO2 substrate.
SEM analysis of the sample produced in the absence of the surfactants showed
randomly oriented nanofibers between which sheets had grown (Figure 5.15a).
This observation could be explained by that in the presence of pristine CNTs,
there was no driving force for the diffusion of TBOT into the hydrophobic arrays,
which instead formed a film on the top of the arrays. Moderately aligned
nanofibrous structures were obtained in the presence of Fmoc-Trp (Figure 5.15b),
Fmoc-His (Figure 5.15c) and Fmoc-Tyr (Figure 5.15d). The length of the
resultant arrays was up to ~300 μm, indicating that the surfactants could penetrate
into the arrays to adsorb on the lower portion of CNTs and subsequently promote
the diffusion of TBOT. It was noted in Figure 5.15(b) and (d) that although the
TiO2 NTs were well aligned within the arrays, the vertical alignment of the arrays
with respect to the substrate was lost, possibly during (1) the adsorption of
Fmoc-AAs in solution or (2) the coating process in TBOT/EtOH solution or (3)
the calcination process. Whilst the bundled up arrays shown in Figure 5.15c
revealed a reasonably good vertical alignment with the upper part decurved. In
contrast, the products obtained in the presence of BA showed broken NT
structures due to the low density of deposited TiO2 nanoparticles on CNTs prior
to calcination (Figure 5.15e). This result further supported that the Fmoc-AAs
were more efficient binders for CNTs than BA.

216
Figure 5.15 SEM images of (a) the product obtained from the control experiment
where as-produced CNT mat was used as templates. TiO2 NT arrays produced in
the presence of (b) Fmoc-Trp (c) Fmoc-His (d) Fmoc-Tyr and (e) BA.
TEM analysis was also conducted to further characterize the internal structures of
the products. In contrast to the control experiment which resulted in the formation
of collapsed TiO2 NTs (Figure 5.16a), well-defined TiO2 NTs with relatively
(a)
(c) (d)
(b)
(e)

217
uniform inner diameter and wall thickness were obtained in the presence of the
Fmoc-AAs (Figure 5.16b-d). The measured inner diameter and wall thickness of
the resultant NTs were summarized in Table 5.6. It was noted that the inner
diameter of the produced TiO2 NTs was smaller than the outer diameter of the
CNT templates (56.6 ± 16.6 nm) which could be attributed to the stress induced
contraction during the oxidative removal of CNTs. Black arrows in (c) indicated
the presence of residual CNT templates after calcination. In the presence of BA,
collapsed NT structures were observed (Figure 5.16e) due to the weaker π–π
stacking interactions between BA and CNTs. The TEM result agreed well with
the SEM observation. XRD analysis confirmed the anatase phase of the TiO2 NTs.
The absence of carbon (002) diffraction indicated the complete removal of CNT
templates after calcination.
(a) (b)
(c) (d)

218
Figure 5.16 TEM images of (a) the product obtained from the control experiment.
TiO2 NTs produced in the presence of (b) Fmoc-Trp (c) Fmoc-His and (d)
Fmoc-Tyr. (e) Collapsed NT structures obtained in the presence of BA. The red
arrow in (b) and (c) indicated the open ends of the TiO2 NTs. Note. CNT templates
were not completely removed after calcination as indicated by the black arrows in
(c). (f) XRD pattern taken from the sample shown in (b). Scale bar, (a-e) 200 nm.
Table 5.6 Measured inner diameter and wall thickness of the resultant TiO2 NTs
Inner diameter (nm) Wall thickness (nm)
Fmoc-Trp 44.3 ± 10.0 9.5 ± 2.2
Fmoc-His 50.0 ± 15.1 10.7 ± 1.7
Fmoc-Tyr 38.0 ± 10.1 7.7 ± 0.7
5.4 Combined sites for catalyzing SiO2 and TiO2
deposition
Morse et al. 11 demonstrated the synthesis of silica catalyzed by the interface of
two populations of gold nanoparticles, one of which had either been
functionalized with serine residues and the other with histidine residues. This
interface between the two residues mimicked the catalytically active site of
silicateins. This concept was developed further in this study, by combining two
populations of CNTs, one functionalized with Fmoc-His and the other with
Fmoc-Tyr which expose imidazole (hydrogen bonding) and hydroxyl
(nucleophilic) functionalities respectively. These combined populations were then
studied for the biomimetic catalytic synthesis of silica and titania.
(e)
20 30 40 50 60
0
1000
2000
3000
4000
5000
6000
Inte
nsity / a
.u.
A (101)
A (004) A (200)
2θ / º
(f)

219
5.4.1 Synthesis of the biomimetic catalyst
The assembly of two populations of functionalized CNTs was initially studied.
SEM characterization revealed two distinct morphologies; bundled fibers (Figure
5.17a) and spherical aggregates with an average diameter of 37.7 ± 8.0 μm
(Figure 5.17b). High magnification micrographs (Figure 5.17c and d) revealed
densely entangled CNTs in both aggregates. The driving force for this
aggregation was believed to be the H-bonding between the two populations of
functionalized CNTs. A control experiment was also conducted where CNTs
functionalized with single Fmoc-AA species was characterized by SEM. Both
Fmoc-His functionalized CNTs (Figure 5.17e) and Fmoc-Tyr functionalized
CNTs (Figure 5.17f) showed only randomly aligned CNT networks.
(a)
(d) (c)
(b)

220
Figure 5.17 SEM images showing (a) bundled fibers and (b) spherical aggregates
formed in the combined solutions. (c,d) Magnified images of the aggregates shown
in (a) and (b) respectively. (e) Fmoc-His f-CNTs and (f) Fmoc-Tyr f-CNTs.
5.4.2 Synthesis of SiO2 catalyzed by the combined sites
The templating of the combined catalyst system was subsequently studied. The
combined populations of nanotubes were first deposited on a silicon wafer, which
was then immersed in a TEOS solution for 6 d. The product was then annealed in
air at 200 ºC for 3 h followed by annealing at 650 ºC for 2 h to remove the
carbonaceous template. The thermally treated sample comprised of ribbons
approximately 100-500 nm wide surrounded by short fibres (Figure 5.18a and b).
These ribbons are believed to be the result of coating the bundled fibres of CNTs.
However, no structures relating to the spherical aggregates were observed. EDX
analysis (Figure 5.18c) confirmed the silica nature of the annealed sample and the
presence of rather weak C signal indicated that the CNT templates were largely
removed after calcination.
(e) (f)

221
Figure 5.18 (a,b) SEM image of silica coated combined catalyst after heat treatment.
(c) EDX spectrum of the sample shown in (a).
5.4.3 Synthesis of TiO2 catalyzed by the combined
sites
The silicon wafer coated with the dried combined populations of nanotubes was
also immersed into a TBOT solution. TiO2 nanorods with an average length of
114.4 ± 26.4 nm and width of 31.0 ± 5.4 nm were uniformly deposited on both
bundled NTs (Figure 5.19a) and individual NTs (Figure 5.19b). EDX analysis
(a)
0 2 4 6
0
5000
Inte
nsity
Energy (keV)
C
O Cu
Si
Al
(c)
(b)

222
shown in Figure 5.19e confirms the TiO2 coating on CNT bundles. Such coating
morphology is different from those observed with the reaction proceed in solution
which led to rather smooth TiO2 coating (section 5.3.1). After heat treatment in
air at 400 ºC followed by at 550 ºC, TiO2 particle aggregates as well as thin fibres
were observed (Figure 5.19c). EDX analysis confirms the removal of CNT
templates after calcination by showing a negligible C signal (Figure 5.19f). A
control experiment with direct depositing TBOT solution on Si wafer was
performed (Figure 5.19d). TiO2 nanorods with similar dimensions to those
obtained in the presence of the combined sites were observed to coexist with
larger TiO2 particles. The exact mechanism for the formation of TiO2 nanorods is
unclear at this stage.
(a
)
(c
) (d)
(b)

223
(e) (f)
Figure 5.19 SEM images of (a) TiO2 nanorods coated CNT bundles (b) TiO2
nanorods coated individual CNTs (c) TiO2 nanorods coated CNT bundles after heat
treatment and (d) TiO2 particles formed on Si wafer. (e) and (f) EDX spectrum of
the sample shown in (a) and (c) respectively.
5.5 Conclusion
In this chapter, an in-situ sol-gel method was demonstrated for the synthesis of
CNT-SiO2 and CNT-TiO2 nanohybrids at low temperature and neutral pH. Both
SEM and TEM observation confirm the formation of uniform SiO2 coating from
TEOS on individual CNTs in the presence of Fmoc-Trp and Fmoc-His, indicating
good dispersion of CNTs. Fmoc-Tyr functionalized CNTs resulted in a mixture of
partially coated and uncoated CNTs due to the poorer affinity of Fmoc-Tyr for
CNTs as well as its weaker H-bonding interaction with the hydrolyzed TEOS. A
similar dependence of the degree of coating on the Fmoc-AA structure was
observed for coating CNTs with TiO2 from TBOT, except for the case of
Fmoc-Tyr which led to uniform coating of TiO2. The morphology of the resultant
hybrids was found to be highly dependent on the CNT to TBOT ratio and the
modifier to CNT ratio. The coating of CNTs functionalized with BA, as reported
by Eder et al. was also studied. It was found that the TiO2 coating obtained on
these BA functionalized CNTs was not as uniform as on the Fmoc-AA
0 2 4 6
0
200
400
600
800
1000
1200
Co
un
ts (
a.u
.)
Energy (keV)
C
O
Al
Pt
Ti
0 2 4 6
0
500
1000
1500
2000
2500
Co
un
ts (
a.u
.)
Energy (keV)
O
Pt
Al
Ti

224
functionalized nanotubes. This difference in coating was attributed to the weaker
π–π stacking interactions between BA and CNTs as a result of the lower degree
of aromaticity of the benzyl ring.
The formation mechanism of the SiO2 and TiO2 coating on the Fmoc-AAs
functionalized CNTs was proposed. The surface modifiers were believed to play a
dual role: (1) To stabilize CNT dispersion by acting as electrostatic surfactants. (2)
The presence of indole, imidazole and hydroxyl functionalities from the side
chains of the amino acid moieties provide binding sites for SiO2 and TiO2
deposition.
Anatase TiO2 NTs were synthesized after calcination of the CNT-TiO2
nanohybrids as confirmed by XRD and ED analysis. HRTEM image revealed that
these NTs were the aggregates of many TiO2 nanocrystallites with no preferential
orientation. Both the inner diameter and wall thickness of the synthesized TiO2
NTs can be controlled by varying the dimension of CNT templates and the ratio
of CNT to TBOT. The transition from the anatase to rutile phase was achieved via
heat treatment of the hybrids in argon to prevent CNT oxidation. Heating
temperature, pre-treatment and ramp rate were found to affect the phase
transformation.
A simple route toward the production of TiO2 NT arrays was also demonstrated
using the CVD grown vertically aligned CNT arrays as templates in the presence
of the Fmoc-AAs. The length of the TiO2 NT arrays was up to ~300 μm,
benefiting from the avoidance of extended sonication. SEM analysis confirmed
the good alignment of TiO2 NTs in the arrays although the vertical alignment
with respect to the substrate was lost. Such structures may be useful for the
development of electronic units.
The noncovalent approach presented in this study permits the preservation of the
structure and properties of pristine CNTs. The template-directed synthesis

225
technique also allows control over the morphology of the inorganic
nanostructures.
5.6 References
1. L. Zhao et al., Coating of multi-walled carbon nanotubes with thick layers of
tin(IV) oxide, Carbon, 2004, 42, 1858.
2. D. Eder et al., Morphology control of CNT-TiO2 hybrid materials and rutile
nanotubes, J.Mater.Chem., 2008, 18, 2036.
3. D. Eder et al., Carbon–Inorganic Hybrid Materials: The Carbon-Nanotube/
TiO2 Interface, Adv.Mater., 2008, 20, 1787.
4. M. Liang et al., Imidazole catalyzed silica synthesis: Progress toward
understanding the role of histidine in (bio)silicification, J. Mater. Res., 2009, 24,
1700.
5. S. V. Patwardhan et al., Silicification and Biosilicification. Part 6.
Poly-L-Histidine Mediated Synthesis of Silica at Neutral pH,
J.Inorg.Organomet.Polym., 2003, 13, 49.
6. F. Rodríguez et al., Study of the Chemical and Physical Influences upon in
Vitro Peptide-Mediated Silica Formation, Biomacromolecules, 2004, 5, 261.
7. Z. Liu et al., Efficient photocatalytic degradation of gaseous acetaldehyde by
highly ordered TiO2 nanotube arrays, Environ. Sci. Technol., 2008, 42, 8547.
8. G. K. Mor et al., Use of Highly-Ordered TiO2 Nanotube Arrays in
Dye-Sensitized Solar Cells, Nano Lett., 2006, 6, 215.
9. M. S. Sander et al., Template-Assisted Fabrication of Dense, Aligned Arrays of
Titania Nanotubes with Well-Controlled Dimensions on Substrates, Adv. Mater.,
2004, 16, 2052.
10. B. G. Cousins et al., Enzyme-Activated Surfactants for Dispersion of Carbon
Nanotubes, Small, 2009, 5, 587.
11. D. Kisailus et al., Functionalized Gold Nanoparticles Mimic Catalytic Ativity
of a Polusiloxane-Synthesizing Enzyme, Adv. Mater., 2005,17,1234.
12. J.N.Cha et al., Biomimetic synthesis of ordered silica structures mediated by
block copolypeptides, Nature, 2000, 403, 289.
13. Y. Zhou et al., Efficient Catalysis of Polysiloxane Synthesis by Silicatein a
Requires Specific Hydroxy and Imidazole Functionalities, Angew. Chem. Int. Ed.,
1999, 38, 779.
14. L.W. Kelts et al., Sol-gel chemistry studied by 1H and 29Si nuclear magnetic
resonance, Journal of Non-Crystalline Solids, 1986, 83, 353.
15. J. K. Park et al., J. Korean Chem. Soc. 1998, 22, 281.
16. M. Zhang et al., Fabrication of mesoporous silica-coated CNTs and
application in size-selective protein separation, J. Mater. Chem., 2010, 20, 5835.
17. Z. Németh et al., Preparation of homogeneous titania coating on the surface
of MWNT, Composites Science and Technology, 2011, 71, 87.
18. D. Eder et al., Pure rutile nanotubes, Chem. Commun., 2006, 1448.
19. B. C. Satishkumar et al., Oxide nanotubes prepared using carbon nanotubes as

226
templates, J.Mater.Res., 1997, 12, 604.
20. O. M. Yaghi et al., Selective binding and removal of guests in a microporous
metal–organic framework, Nature, 1995, 378, 703.
21. P. M. Ajayan et al., Carbon nanotubes as removable templates for metal oxide
nanocomposites and nanostructures, Nature, 1995, 375, 564.
22. T. Seeger et al., Nanotube composites: novel SiO2 coated carbon nanotubes,
Chem.Commun., 2002, 34.
23. A. B. Bourlinos et al., Preparation of a water-dispersible carbon
nanotube–silica hybrid, Carbon, 2007, 45, 2136.
24. S. P. Sree et al., Synthesis of uniformly dispersed anatase nanoparticles inside
mesoporous silica thin films via controlled breakup and crystallization of
amorphous TiO2 deposited using atomic layer deposition, Nanoscale, 2013, 5,
5001.
25. S. R. Yoganarasimhan et al., Mechanism of crystal structure transformations.
Part 3.—Factors affecting the anatase-rutile transformation, Trans. Faraday Soc.,
1962, 58, 1579.
26. H. Mehranpour et al., Study on the Phase Transformation Kinetics of
Sol-Gel Drived TiO2 Nanoparticles, Journal of Nanomaterials, Volume 2010,
Article ID 626978, doi:10.1155/2010/626978.
27. Y. Iida et al., Grain Growth and Phase Transformation of Titanium Oxide
During Calcination, J. Am. Ceram. Soc., 1961, 44, 120.

227
Chapter 6 Mineralization of peptide self-assembled
hydrogels
6.1 Introduction
Xu et al. have reported the self-assembly of Fmoc-AA hydrogelator induced by
enzyme 1. They have proposed a model for the supramolecular structure of the gel
based on the spectroscopic studies which suggested the presence of large number
of hydroxyl groups on the nanofibres’ surface. The presence of such high density
of -OH groups may catalyze the deposition of silica. Therefore, in the current
study, enzyme triggered Fmoc-Y and Fmoc-FY self-assembled hydrogels were
employed as templates for silica deposition.
6.2 Enzymatic self-assembly of Fmoc-Y and Fmoc-FY
hydrogels
6.2.1 Fmoc-Y hydrogel
Alkaline phosphatase (AP)-catalyzed dephosphorylation convert the ionic PO43-
group of Fmoc-tyrosine (phosphate)-OH (Fmoc-Y(p)-OH) into a neutrual group
(Figure 6.1a), leading to a hydrogelator Fmoc-Tyr (Fmoc-Y) that self-assembled
into supramolecular hydrogels. Negatively stained TEM image of the diluted
hydrogel revealed a network of nanofibres with a uniform width of 19.3 ± 3.2 nm
(Figure 6.1b). The gel appeared opaque indicating the presence of wider fibres or
bundles of self-assembled nanofibrils 1. The undiluted hydrogel showed a mixture
of nanofibrils and nanoribbons (Figure 6.1c and d). The ribbons were quite flat
while the nanofibrils revealed a very regular morphology with distance between 2
successive ‘pinched joints’ of 270.8 ± 21.9 nm (and width at the widest section
being 33.2 ± 4.0 nm). Such twisted morphology was not observed in previous
studies.

228
Error!
Figure 6.1 (a) Schematic representation of the enzymatic dephosphorylation of
Fmoc-Y(p)-OH to Fmoc-Y. The corresponding optical images for Fmoc-Y(p)-OH
precursor solution before enzyme addition and the self-supporting hydrogels
formed were also shown. (b) Negatively stained TEM image of the diluted Fmoc-Y
hydrogel. Scale bar, 50 nm. (c,d) Negatively stained TEM image of the undiluted
hydrogel. Scale bar, 100 nm.
nanoribbon
nanofibres
(d)
Alkaline Phosphatase
pH 7.03, 37ºC
(a)
Fmoc-Y(p)-OH Fmoc-Y
(b
)
270nm
100 nm
(c)

229
6.2.2 Fmoc-FY hydrogel
The 2nd template studied is Fmoc-FY self-assembly hydrogel. The self-assembly
mechanism for Fmoc-FY is better established and the Fmoc-FY hydrogel is more
stable and reproducible than Fmoc-Y hydrogel. AP catalyzed dephosphorylation
converts the ionic PO43- group of Fmoc-FpY into a neutrual –OH group, leading
to the transformation from a micellar solution into a fibrous hydrogel2 (Figure
6.2a). The phosphorylated hydroxyl group of Fmoc-FpY adds a polar character to
the C-terminus, a micellar structure is therefore expected to form with the
hydrophobic Fmoc group sequestered inside and the hydrophilic phosphate head
group in contact with the solvents.
TEM image showed nanofibres with the average width of 24.0 ± 2.3 nm (Figure
6.2b). HPLC trace was recorded to monitor the dephosphorylation process. As
shown in Figure 6.2c, the gelation occurred when ~70% Fmoc-FpY have been
converted which took ~ 90 min. The supramolecular arrangement within both the
micelles and fibres was further studied by fluorescence emission spectroscopy.
The solution of Fmoc-FpY exhibited a peak centered at 320 nm (Figure 6.2d)
which was attributed to the unassembled Fmoc group and a shoulder between 350
and 370 nm. Upon addition of AP, the Fmoc peak red shifted slightly to 325 nm,
whereas the shoulder peak disappeared. The loss of the shoulder peak at 370 nm
indicated the disassembly of the micelles 2. The decreased intensity of 320 nm
peak as well as a small red-shift indicated the self -assembly of Fmoc-FY into
fibre networks 3. This result is consistent with the previous study on the
production of Fmoc-FY gel.

230
(a)
(b)
0
10
20
30
40
50
60
70
80
0 20 40 60 80 100
Time / min
Co
nv
ers
ion
%
gelation
(c)

231
Figure 6.2 (a) AP catalyzed dephosphorylation reaction of Fmoc-FpY and a
schematic representation of the supramolecular transition from micelles to fibres2.
(b) Negative stained TEM image showing the Fmoc-FY self-assembled nanofibrils.
Scale bar, 100 nm. (c) HPLC trace of the conversion of Fmoc-FpY to Fmoc- FY as a
function of time. The gelation point is marked with an arrow. (d) Fluorescence
emission spectra of the solution of Fmoc-FpY and the hydrogel of Fmoc-FY.
6.3 Silicification of the hydrogel nanostructures
6.3.1 Silicification of Fmoc-Y gel
6.3.1.1 Silicification via vortexing TEOS in the diluted
hydrogels (Method 1)
TEM was conducted to characterize the structure of the silicified nanostructures.
Two silicified structures were observed, i.e. coated nanofibres and coated
nanoribbons. The silica coating on the small nanofibres was not continuous, but
rather consisted of a very regular 25.2 ± 4.5 nm long coated regions with a
periodicity of 35 ± 5.6 nm (Figure 6.3a). The periodicity of the coating was not
observed on the nanoribbons. The periodicity of the silica coating was not
correlated with the helical pitch of the peptide nanofibres. Coatings with an
average thickness of ~ 8.4 ± 2.4 nm were observed on individual nanofibril after
reaction for 1 h with only a small number of non-templated silica present
0
50
100
150
200
250
300 350 400 450 500 550 600
Wavelength / nm
Inte
ns
ity
/ a
.u.
Fmoc-FpY solution
Fmoc-FY hydrogel
(d)
370 nm
320 nm

232
indicating the high affinity of the precursor for the peptide fibrils (Figure 6.3a).
After reaction for 2 h (Figure 6.3b) and 4 h (Figure 6.3d), the coating thickness
increased to 10.6 ± 3.5 nm and 10.4 ± 3.8 nm respectively. The coating of silica
on the fibrils was confirmed by EDX (Figure 6.3f).
The coating on the nanoribbons had a very different morphology to that on the
nanofibres. For the nanoribbons, the coating consisted of many aggregated
individual particles (~ 3.3 ± 0.7 nm in diameter, Figure 6.3b). The distribution of
the overall coating thickness was found to be broad and ranged from 13 to 48 nm.
One possibility is that the particles in these coatings were formed in solution by
the polymerization of TEOS and then deposited onto the ribbons. This will be
tested by using a control of TEOS vortexed in buffer solution to find if such
particles were produced.
One final observation which needs further investigation and confirmation is that it
appeared that the ratio of nanoribbons to nanofibres increased over reaction time.
Few ribbons were present during the early stage of the reaction (Figure 6.3a),
whilst large, broad ribbons were seen after 5 h (Figure 6.3e) which had formed
interconnected structures.
(a)

233
(b)
(c)
(d)

234
Figure 6.3 TEM images of silica coating on Fmoc-Y self-assembled nanostructures
after reaction for (a) 1 h, (b) 2 h, (c,d) 4 h and (e) 5 h. Scale bar, 100 nm. (f) EDX
spectrum of the mineralized peptide nanofibrils. (f) EDX spectrum of the silicified
fibrils.
6.3.1.2 Silicification via depositing TEOS/H2O mixture on the
hydrogels (Method 2)
0h
TEOS
H2O
10μm
(a)
(e)
(f)
Energy (keV)
Co
un
ts
6.05.04.03.02.01.00.0
30
20
10
0
Si
O
C
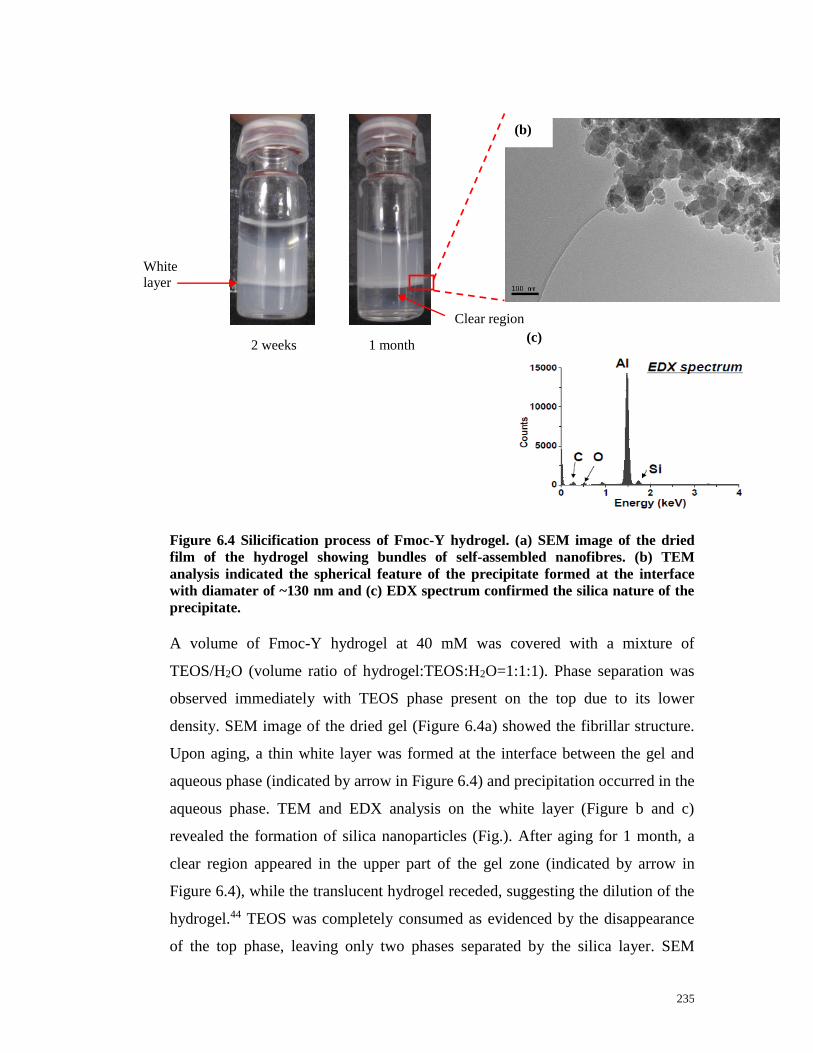
235
Figure 6.4 Silicification process of Fmoc-Y hydrogel. (a) SEM image of the dried
film of the hydrogel showing bundles of self-assembled nanofibres. (b) TEM
analysis indicated the spherical feature of the precipitate formed at the interface
with diamater of ~130 nm and (c) EDX spectrum confirmed the silica nature of the
precipitate.
A volume of Fmoc-Y hydrogel at 40 mM was covered with a mixture of
TEOS/H2O (volume ratio of hydrogel:TEOS:H2O=1:1:1). Phase separation was
observed immediately with TEOS phase present on the top due to its lower
density. SEM image of the dried gel (Figure 6.4a) showed the fibrillar structure.
Upon aging, a thin white layer was formed at the interface between the gel and
aqueous phase (indicated by arrow in Figure 6.4) and precipitation occurred in the
aqueous phase. TEM and EDX analysis on the white layer (Figure b and c)
revealed the formation of silica nanoparticles (Fig.). After aging for 1 month, a
clear region appeared in the upper part of the gel zone (indicated by arrow in
Figure 6.4), while the translucent hydrogel receded, suggesting the dilution of the
hydrogel.44 TEOS was completely consumed as evidenced by the disappearance
of the top phase, leaving only two phases separated by the silica layer. SEM
1 month
(b)
(c) 2 weeks
Clear region
White
layer

236
observation of the upper aqueous phase revealed that the hydrogel nanofibrils
were embedded in the silica nanoparticle aggregates (Figure 6.5a) as verified by
EDX (Figure 6.5b). It was noted that the hydrogel nanofibrils in the composite
appeared much thinner than those observed in the bottom gel phase (Figure 6.5c).
This may due to the dilution-induced disassembly of the thicker nanofibrils in the
aqueous phase. Interestingly, silica nanoparticles were also observed along with
the hydrogel fibrils in the bottom hydrogel phase (Figure 6.5c), which may be
introduced during sample collection (pipette tip breaks the silica layer and
pipetting silica together with the gel). A control experiment in which TEOS was
deposited on equal volume of H2O was also conducted. After standing for 2
month, no precipitation was observed and only the volume of TEOS reduced due
to slow evaporation.
Based on the above observations I proposed a reaction mechanism as follows:
TEOS slowly dissolved and hydrolyzed in the aqueous phase followed by
condensation to form silica nanoparticles which settled on the top of the hydrogel
phase. Simultaneously, the hydrogel at the bottom phase gradually dissolved into
the aqueous phase and disassembled into thinner fibrils. As more and more silica
nanoparticles were deposited on the top of the gel phase, a layer of silica was
formed at the interface preventing the remaining hydrogel nanofibrils from
dissolving into the aqueous phase.
2 m
(a)

237
Figure 6.5 SEM analysis on (a) the upper aqueous phase and (c) the lower hydrogel
phase. (b) EDX spectrum of (a).
Interestingly, during the sample collection at 1 month stage, the silica layer was
broken. After settling for another 1 month, the upper aqueous phase transformed to a
very weak clear gel and the lower gel phase remained clear. The unstained TEM image
of the resulting clear gel revealed a network of silicified nanofibrils (Figure 6.6a)
as evidenced by the coverage of a higher contrast layer on the hydrogel
nanofibers. The unstained hydrogel nanofibrils were hardly visible under TEM
due to very weak electron contrast (Figure 6.6b). The periodicity of the coating
was not observed here. This observation suggested that after the breakage of the
silica layer at the interface, the remaining hydrogel nanofibrils entered into the
2 m
0 2 4 6
0
5000
10000
15000
20000
25000
Co
un
ts (
a.u
.)
Energy (keV)
C
O
Si
Al
(b)
(c)

238
upper aqueous phase and subsequently catalyzed the deposition of silica. The
observed circular features were attributed to the bubbles formed in the silica
coating.
Figure 6.6 Unstained TEM images of (a) the network of silicified hydrogel
nanofibrils that were derived from the resulting clear gel. Scale bar, 100 nm. (b)
Fmoc-Y self assembled hydrogel. Scale bar, 200 nm.
6.4 Conclusion
The silicification of peptide based self-assembled supramolecular structures was
studied employing the self-assembled Fmoc-Y and Fmoc-FY hydrogels as
templates. Both of the gels were prepared through an enzyme triggered
dephosphorylation. The presence of a high density of –OH group on the
nanofibers’ surface was found to promote silica deposition.
The
(a)
(b)

239
6.5 References
1. B. Xu et al., Enzymatic Formation of Supramolecular Hydrogels, Adv.Mater.,
2004, 16, 1440.
2. J. W. Sadownik et al., Micelle to fibre biocatalytic supramolecular
transformation of an aromatic peptide amphiphile, Chem. Comm., 2011, 47, 728.
3. A. M. Smith et al., Fmoc-Diphenylalanine Self Assembles to a Hydrogel via a
Novel Architecture Based on π-π Interlocked β-Sheets, Adv. Mater., 2008, 20, 37.

240
Chapter 7 Graphene-Inorganic hybrids
7.1 GO-Inorganic nanohybrids
7.1.1 Characterization of GO dispersion
The GO sheets were found to readily dispersible in water due to the presence of
the hydrophilic functionalities, resulting in homogenous and stable colloidal
dispersions which show no signs of agglomeration over a period of 1 month.
These dispersions possessed a brown color which is characteristic of highly
oxidized GO due to the adsorption of highly oxidative aromatic debris on their
surface 1. SEM analysis (Figure 7.1a) revealed random aggregates of crumpled
GO sheets with bright-field TEM image (Figure 7.1b) showing that these sheets
were fairly flat with folds present at both sides (indicated by arrows). The SAED
pattern (Figure 7.1c) taken from the centre of the sheet (indicated by the dashed
box) exhibited sharp diffraction spots arranged in the typical sixfold symmetry.
This leads to the conclusion that short-range order is present in the structure of
GO, contradictory to some of the previous reports claiming that GO is completely
amorphous 2. Wilson et al. 3 suggested that GO is not only comprised of fully
amorphous regions due to the presence of sp3 domains formed during oxidation
but some crystalline regions (unoxidized sp2 domains) are also present. The
diffraction peaks are labeled using Miller-Bravais (hkil) indices. It has been
previously proposed that the relative intensities of the 1-100 and 2-1-10 type
reflections can be used to identify the layer numbers of graphene 4. The intensity
profile plot along the line between the arrows shown in Figure 7.1c revealed an
intensity ratio of I0-110/I1-210 and I-1010/I-2110 ~1.3 (Figure 7.1d), indicating the
monolayer nature of the GO sheet 3,4.
Figure 7.1e showed a lower magnification TEM image of GO sheets with many
folds clearly visible (indicated by arrows). The corresponding SAED pattern
(Figure 7.1f) taken from the region marked by the dashed box revealed a
superposition of three hexagonally symmetric patterns (indicated by yellow, red

241
and blue colors) rotated by 24° and 37º respectively, which is in accordance with
the observations by Wilson3 and Wang5. This is probably due to the
misorientation between three overlapped GO sheets as a result of the fold (red
arrow) present along the left side within the dashed box.
(c)
(1-210)
(1-100)
(-1010) (-2110)
(0-110)
(-1-120)
(b)
10 μm
(a
)
0 100 200 300 400 500 600
20
40
60
80
Inte
nsity (
a.u
.)
(d)
1-210
0-110
-2110
-1010

242
Figure 7.1 (a) SEM image of aggregated GO sheets. (b) TEM image of single layer
GO sheet with folds present at both sides (indicated by arrows). Scale bar, 100 nm.
(c) Corresponding SAED pattern taken from the region marked by the dashed box
in (b). The pattern was labeled with Miller-Bravais indices. (d) Intensity profile plot
along the line between the arrows shown in (c). (e) Lower magnification TEM image
of GO sheets with the folds indicated by arrows. Scale bar, 200 nm. (f)
Corresponding SAED pattern taken from the region marked by the dashed box in
(e) showing three superimposed hexagonal patterns indicated by yellow, red and
blue colours.
7.1.2 Preparation of GO-TiO2 nanohybrids
GO-TiO2 nanohybrids were prepared from the hydrolysis of TBOT in the
presence of aqueous dispersion of GO. Two concentrations of TBOT (1.5 mM
and 3.7 mM) were studied for their effect on the morphology of the hybrids
whilst keeping the other conditions constant. Upon addition of TBOT solution
into the GO dispersion, precipitation was observed immediately. TEM analysis
showed that the reaction of GO with lower concentration of TBOT for 4 h led to
uniform dispersion of TiO2 nanoparticles with an average diameter of 16.1±2.9nm
on GO sheets (Figure 7.2a). The internal mesoporous structure of the TiO2
nanoparticles was evident by the presence of voids in the form of white dots
within individual nanoparticles (Figure 7.2b). The SAED pattern (inset) taken
from the region marked by the red dashed box revealed two sharp rings resulted
from the superposition of individual diffraction spots corresponding to different
crystallographic orientations. This is likely due to the presence of folds or
(e) (f)
Can use image J,
Double click on the
“line symbol”, change
width, 划 线 ,
“Analysis-plot profile”,
copy and paste in
excel.
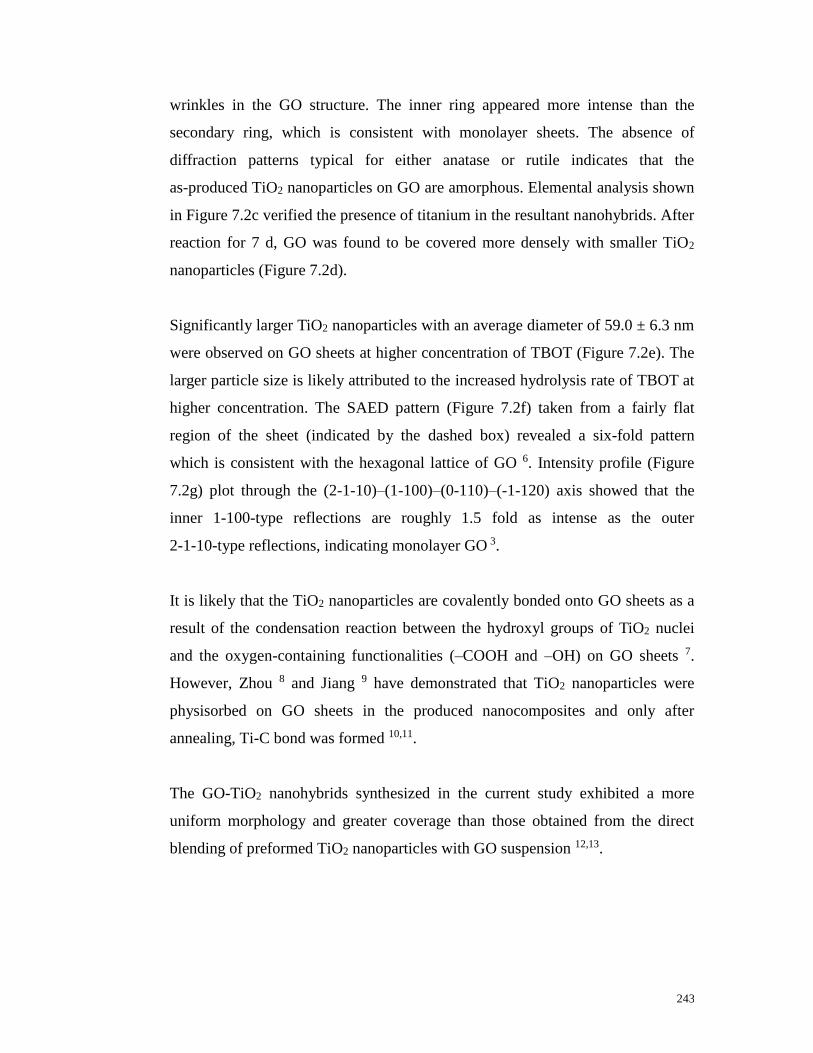
243
wrinkles in the GO structure. The inner ring appeared more intense than the
secondary ring, which is consistent with monolayer sheets. The absence of
diffraction patterns typical for either anatase or rutile indicates that the
as-produced TiO2 nanoparticles on GO are amorphous. Elemental analysis shown
in Figure 7.2c verified the presence of titanium in the resultant nanohybrids. After
reaction for 7 d, GO was found to be covered more densely with smaller TiO2
nanoparticles (Figure 7.2d).
Significantly larger TiO2 nanoparticles with an average diameter of 59.0 ± 6.3 nm
were observed on GO sheets at higher concentration of TBOT (Figure 7.2e). The
larger particle size is likely attributed to the increased hydrolysis rate of TBOT at
higher concentration. The SAED pattern (Figure 7.2f) taken from a fairly flat
region of the sheet (indicated by the dashed box) revealed a six-fold pattern
which is consistent with the hexagonal lattice of GO 6. Intensity profile (Figure
7.2g) plot through the (2-1-10)–(1-100)–(0-110)–(-1-120) axis showed that the
inner 1-100-type reflections are roughly 1.5 fold as intense as the outer
2-1-10-type reflections, indicating monolayer GO 3.
It is likely that the TiO2 nanoparticles are covalently bonded onto GO sheets as a
result of the condensation reaction between the hydroxyl groups of TiO2 nuclei
and the oxygen-containing functionalities (–COOH and –OH) on GO sheets 7.
However, Zhou 8 and Jiang 9 have demonstrated that TiO2 nanoparticles were
physisorbed on GO sheets in the produced nanocomposites and only after
annealing, Ti-C bond was formed 10,11.
The GO-TiO2 nanohybrids synthesized in the current study exhibited a more
uniform morphology and greater coverage than those obtained from the direct
blending of preformed TiO2 nanoparticles with GO suspension 12,13.
244
(c)
(e)
(a)
(d)
(-1-120)
(0-110)
(1-210)
(1-100) (-1010)
(2-1-10)
(f)
(b)

245
Figure 7.2 (a) TEM image of GO-TiO2 nanohybrids produced with lower TBOT
concentration for 4 h. Inset corresponds to the SAED pattern taken from the region
marked by the red dashed box. (b) A magnified image of the region shown in the
orange dashed box in (a). (c) EDX spectrum of (a). Note that Cu signal is originated
from the TEM grid. (d) TEM image of the hybrids produced with lower TBOT
concentration for 7 d. (e) TEM image of the hybrids produced with higher TBOT
concentration for 4 h. (f) Corresponding SAED pattern taken from the region
marked by the dashed box in (e) and the diffraction spots are labeled using
Miller-Bravais indices. (g) Intensity profile plot along the line between the arrows
shown in (f).
The samples produced with both TBOT concentrations for 4 h were subsequently
heated in Ar at 500 °C for 2h to induce TiO2 crystallization. It is clearly observed
in Figure 7.3(a) and (b) that for both of the samples, TiO2 nanocrystals were
uniformly distributed on the surface of GO sheets after heat treatment. For the
sample produced with lower TBOT concentration, the edges of GO sheets were
explicitly identified under the TiO2 nanocrystals (indicated by arrows in Figure
7.3a). Whilst the sample produced with higher TBOT concentration showed
crumpled GO sheets (Figure 7.3b) which may be induced by the elevated
temperature used during annealing 14.
SAED analysis of the thermally treated hybrid nanosheets revealed a pattern of
concentric rings (inset in Figure 7.3a and b), suggesting their polycrystalline
nature. Both of the diffraction patterns showed good agreement with those of GO
0 100 200 300 400 500 600 700
50
100
150
In
tensity (
a.u
.)
2-1-10
1-100
0-110
-1-120
(g)

246
(Figure 7.3c and e) and anatase TiO2 (Figure 7.3d and f), indicating the
crystallization of amorphous TiO2 into anatase and that the structure of GO is
well preserved during the heat treatment. Akhavan et al. have previously reported
that heat treatment could lead to the formation of Ti–C bonds between GO and
TiO2 11. The better linkage between the two materials will facilitate the electron
transfer and potentially enhances the photocatalytic efficiency.
(a) (b)
GO
(c) (110)
(100)
(d)
(211)
(004)
(101)
Anatase

247
Figure 7.3 TEM images of the thermally treated nanohybrids obtained from (a) the
reaction with lower TBOT concentration for 4h and (b) the reaction with higher
TBOT concentration for 4h. The inset in (a) and (b) showed the corresponding
SAED patterns which were indexed to (c,e) GO (labeled using Miller (hkl) indices)
and (d,f) anatase TiO2 respectively. Note that the upper half in (c)-(f) showed the
experimental data while the lower half in (c) and (e) showed the diffraction pattern
of GO, and that in (d) and (f) showed the simulated diffractions for anatase
according to JCPDS 21-1272.
7.1.3 Preparation of GO-SiO2 nanohybrids
GO-SiO2 nanohybrids were produced by the in-situ growth of silica nanoparticles
on GO sheets using tetrakis (2-hydroxyethyl) orthosilicate (THEOS) as
water-soluble silica precursor. The hydroxyl groups of THEOS could condense
with the oxygenated functional groups (–COOH and –OH) on GO sheets, giving
rise to uniform seeding of silica on GO surface. An advantage of using THEOS
over the commonly used TEOS is that no organic solvents are needed owing to
the complete solubility of THEOS in water.
The morphology of the resultant product was characterized by SEM. In contrast
to pristine GO which revealed an agglomeration of highly crumpled sheets
(Figure 7.4a), the synthesized nanohybrids showed a fairly flat and layered
GO
(f)
Anatase
(211)
(004)
(101)
(200)
Anatase
(e)
(110)
(100)
GO

248
structure (indicated by arrows along the edges, Figure 7.4b) with a rather smooth
surface. This may be attributed to the silica film formed on GO sheets that makes
them more rigid. A higher magnification image (Figure 7.4c) showed the partial
separation of two hybrid sheets with the silica coating acting as spacer to prevent
the re-stacking of the sheets. The EDX spectrum for the SEM sample (Figure
7.4d) confirmed the coverage of silica on GO sheets.
Figure 7.4 SEM images of (a) highly aggregated GO sheets. (b) GO-SiO2
nanohybrids with layered structure (indicated by arrows along the edges). (c)
Higher magnification image showing the partial separation of two hybrid sheets. (d)
EDX spectrum of the sample shown in (b).
TEM analysis was further performed to investigate the attachment of SiO2 on GO
sheets. As shown in Figure 7.5a, rather flat GO sheets with no visible wrinkles
2 μm
(b)
0 1 2 3 4 5
0
5000
10000
15000
20000
25000
Co
un
ts (
a.u
.)
Energy (keV)
C
O Si
Al
(d)
10 μm
(a)
1 μm
(c)

249
were covered with a dense silica film composed of closely packed silica
nanoparticles as a result of the uniform seeding of silica on GO sheets. This
observation is consistent with the SEM image showing that the flat GO sheets
were coated with a smooth silica layer. As shown in the magnified image (Figure
7.5b), the presence of the wrinkles on the underlying GO sheets suggests that they
were extended beyond the image and hence the silica coating was rather present
on certain area of GO instead of uniformly covering the entire sheet. The SAED
pattern taken from the region marked by the dashed box confirmed the presence
of GO sheet in the synthesized hybrids.
Figure 7.5 (a) Low magnification TEM image of silica coated GO sheets. (b) A
magnified TEM image showing the ripples present on the GO sheet (indicated by
the arrow). The SAED pattern taken from the region marked by the dashed box
was labeled using Miller-Bravais indices.
(a)
0.2 μm 200 nm
(b)
(2-1-10)
(1-100)
(0-110)
(-1-120)
(-1010)
(1-210)
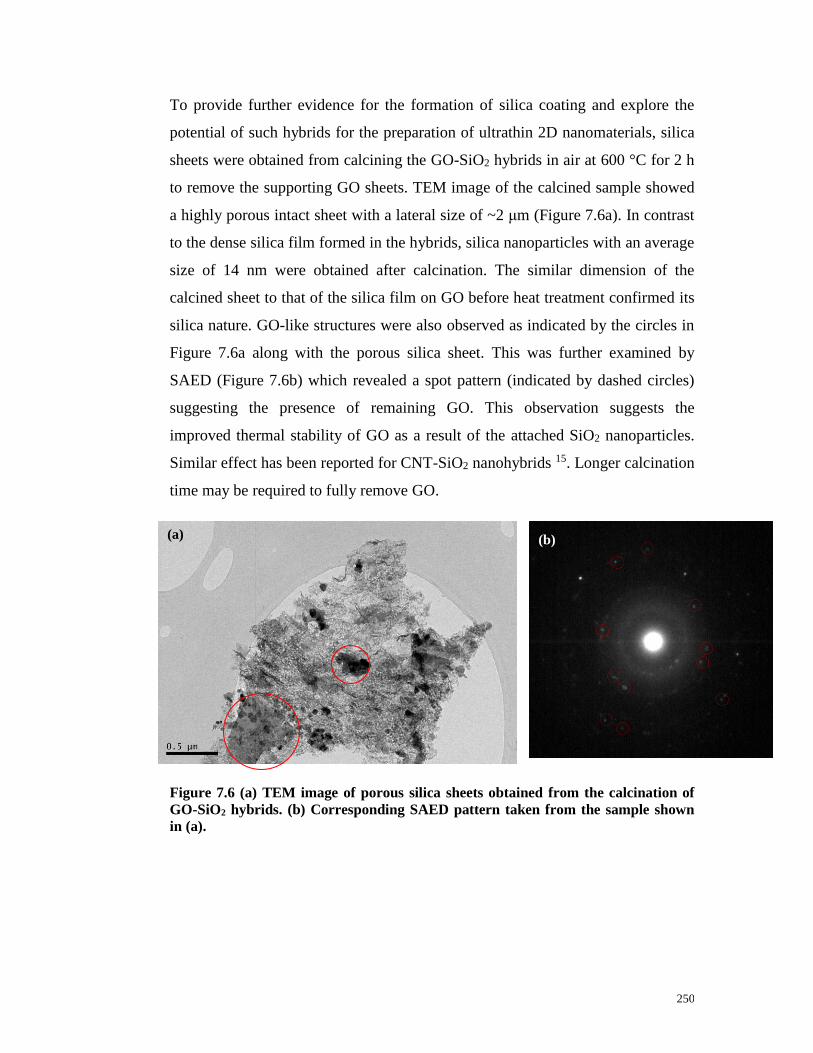
250
To provide further evidence for the formation of silica coating and explore the
potential of such hybrids for the preparation of ultrathin 2D nanomaterials, silica
sheets were obtained from calcining the GO-SiO2 hybrids in air at 600 °C for 2 h
to remove the supporting GO sheets. TEM image of the calcined sample showed
a highly porous intact sheet with a lateral size of ~2 μm (Figure 7.6a). In contrast
to the dense silica film formed in the hybrids, silica nanoparticles with an average
size of 14 nm were obtained after calcination. The similar dimension of the
calcined sheet to that of the silica film on GO before heat treatment confirmed its
silica nature. GO-like structures were also observed as indicated by the circles in
Figure 7.6a along with the porous silica sheet. This was further examined by
SAED (Figure 7.6b) which revealed a spot pattern (indicated by dashed circles)
suggesting the presence of remaining GO. This observation suggests the
improved thermal stability of GO as a result of the attached SiO2 nanoparticles.
Similar effect has been reported for CNT-SiO2 nanohybrids 15. Longer calcination
time may be required to fully remove GO.
Figure 7.6 (a) TEM image of porous silica sheets obtained from the calcination of
GO-SiO2 hybrids. (b) Corresponding SAED pattern taken from the sample shown
in (a).
(a) (b)
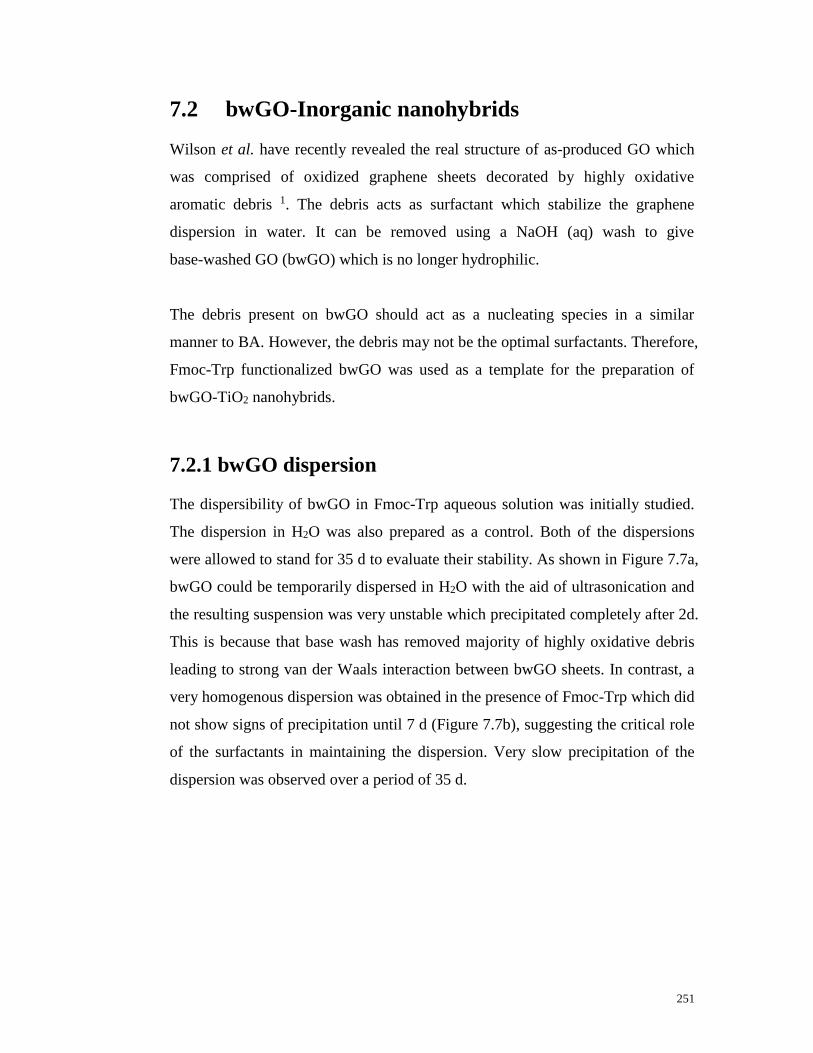
251
7.2 bwGO-Inorganic nanohybrids
Wilson et al. have recently revealed the real structure of as-produced GO which
was comprised of oxidized graphene sheets decorated by highly oxidative
aromatic debris 1. The debris acts as surfactant which stabilize the graphene
dispersion in water. It can be removed using a NaOH (aq) wash to give
base-washed GO (bwGO) which is no longer hydrophilic.
The debris present on bwGO should act as a nucleating species in a similar
manner to BA. However, the debris may not be the optimal surfactants. Therefore,
Fmoc-Trp functionalized bwGO was used as a template for the preparation of
bwGO-TiO2 nanohybrids.
7.2.1 bwGO dispersion
The dispersibility of bwGO in Fmoc-Trp aqueous solution was initially studied.
The dispersion in H2O was also prepared as a control. Both of the dispersions
were allowed to stand for 35 d to evaluate their stability. As shown in Figure 7.7a,
bwGO could be temporarily dispersed in H2O with the aid of ultrasonication and
the resulting suspension was very unstable which precipitated completely after 2d.
This is because that base wash has removed majority of highly oxidative debris
leading to strong van der Waals interaction between bwGO sheets. In contrast, a
very homogenous dispersion was obtained in the presence of Fmoc-Trp which did
not show signs of precipitation until 7 d (Figure 7.7b), suggesting the critical role
of the surfactants in maintaining the dispersion. Very slow precipitation of the
dispersion was observed over a period of 35 d.

252
(a)
0 min 1 d 2 d 7 d 35 d
(b)
0 min 1 d 2 d 7 d 35 d
Figure 7.7 Photographs of the aqueous dispersion of bwGO (a) in the absence and
(b) in the presence of Fmoc-Trp. The dispersions were allowed to stand for 35 days.
TEM analysis of bwGO deposited from the dispersion in Fmoc-Trp solution
revealed crumpled sheets measuring over 1 μm in diameter (Figure 7.8a). The
corresponding SAED pattern (Figure 7.8b) observed sharp rings composed of
resolved diffraction spots due to the presence of wrinkles or overlapping with
different sheets. The two rings were indexed to the (100) and (110) planes of
graphite. The higher diffraction intensities of the inner ring than the secondary
ring indicate the exfoliation of bwGO to single layer in Fmoc-Trp solution.

253
Figure 7.8 (a) TEM image of bwGO sheets deposited from the dispersion in
Fmoc-Trp solution. (b) The corresponding SAED pattern taken from the sample
shown in (a). The pattern was labeled using Miller (hkl) indices.
7.2.2 bwGO-TiO2 nanohybrids
7.2.2.1 Reaction in aqueous solution
The preparation of bwGO-TiO2 nanohybrids in aqueous solution starts with the
dispersion of bwGO in Fmoc-Trp solution, proceeding with mixing the dispersion
with TBOT solution. The morphology of the obtained bwGO-TiO2 nanohybrids
was characterized by TEM. As shown in Figure 7.9a, bwGO sheets were found to
be evenly coated with spherical TiO2 nanoparticles which showed a relatively
broad size distribution ranging from a few to several tens of nanometers. Fast
condensation rates in aqueous solution may cause the broad particle size
distributions 16. The corresponding SAED pattern shown in Figure 7.9b revealed
two sharp rings characteristic of graphitic structures. The diffraction intensities of
the inner ring were higher than the secondary ring, suggesting that the bwGO
sheets remained well dispersed during the coating process. It was noted that the
synthesized bwGO-TiO2 nanohybrids exhibited a more uniform and denser
coating compared with GO-TiO2 nanohybrids shown in section 7.1.2. This may
due to the higher density of adsorbed Fmoc-Trp on bwGO sheet than that of the
oxidative debris present in the as-produced GO.
(a) (b) (110)
(100)

254
Figure 7.9 TEM image of bwGO-TiO2 nanohybrids prepared in aqueous solution.
The arrows indicate the wrinkles present in bwGO sheets. (b) The corresponding
SAED pattern taken from the sample shown in (a).
The existence of TiO2 in the resultant nanohybrids was proved using Raman
spectroscopy. Since the as-produced TiO2 is amorphous which shows no Raman
peaks, the nanohybrid was annealed in argon at 600 ºC to induce crystallization of
TiO2. The Raman spectra for bwGO and anatase TiO2 were also recorded for
reference. The typical Raman spectrum for bwGO (Figure 7.10a) shows two
broad peaks, the G band at 1591 cm-1 and the defect-induced D band at around
1338 cm-1. The intense D band of bwGO indicates that the oxidation induced
disorders are still present after base wash, which is consistent with the model
proposed by Wilson et al. 1. The similar frequencies of D and G bands for the
nanohybrids (Figure 7.10c) to that for bwGO (Figure 7.10a) confirmed that its
electronic structure was largely preserved after annealing, which is likely
attributed to the stabilization by the attached anatase nanocrystals. A weak peak
observed at 144 cm-1 (Figure 7.10c) is assigned to the E1g mode of anatase
phase17, thus verifying the existence of TiO2 in the produced nanohybrids.
(b) (a)
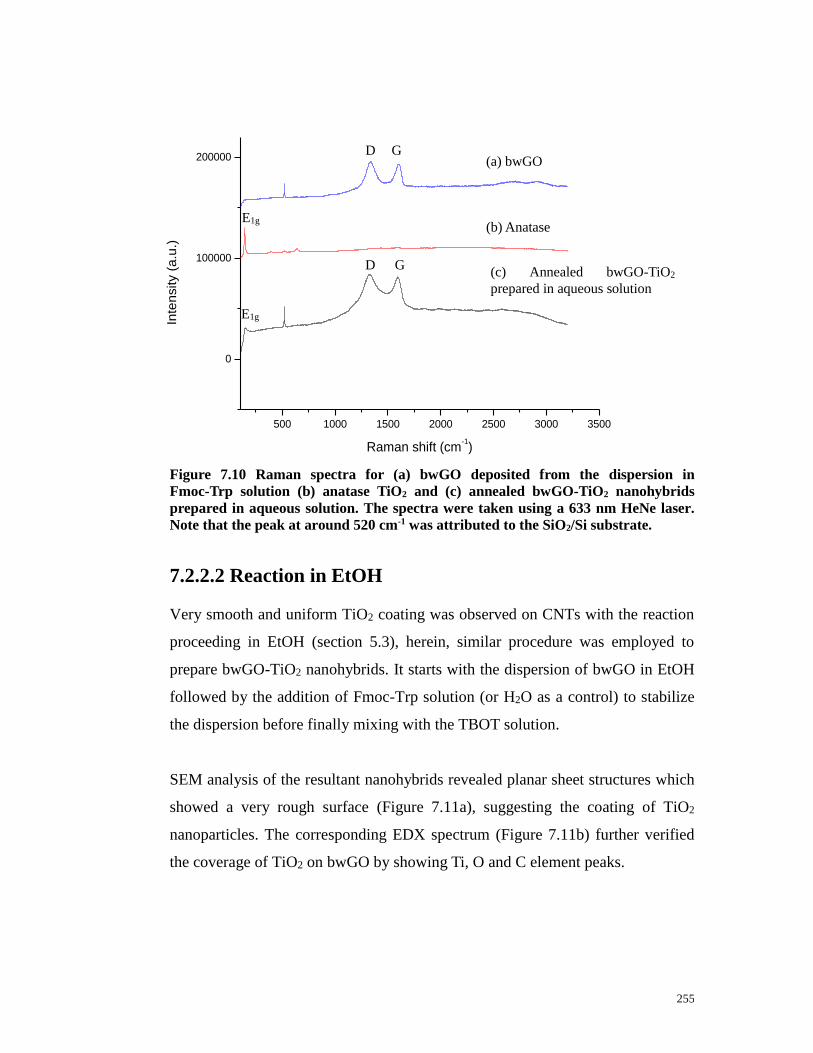
255
Figure 7.10 Raman spectra for (a) bwGO deposited from the dispersion in
Fmoc-Trp solution (b) anatase TiO2 and (c) annealed bwGO-TiO2 nanohybrids
prepared in aqueous solution. The spectra were taken using a 633 nm HeNe laser.
Note that the peak at around 520 cm-1 was attributed to the SiO2/Si substrate.
7.2.2.2 Reaction in EtOH
Very smooth and uniform TiO2 coating was observed on CNTs with the reaction
proceeding in EtOH (section 5.3), herein, similar procedure was employed to
prepare bwGO-TiO2 nanohybrids. It starts with the dispersion of bwGO in EtOH
followed by the addition of Fmoc-Trp solution (or H2O as a control) to stabilize
the dispersion before finally mixing with the TBOT solution.
SEM analysis of the resultant nanohybrids revealed planar sheet structures which
showed a very rough surface (Figure 7.11a), suggesting the coating of TiO2
nanoparticles. The corresponding EDX spectrum (Figure 7.11b) further verified
the coverage of TiO2 on bwGO by showing Ti, O and C element peaks.
500 1000 1500 2000 2500 3000 3500
0
100000
200000
Inte
nsity (
a.u
.)
Raman shift (cm-1)
G (a) bwGO
(b) Anatase
D
(c) Annealed bwGO-TiO2
prepared in aqueous solution
D G
E1g
E1g

256
Figure 7.11 (a) SEM image of bwGO-TiO2 nanohybrids prepared in EtOH. (b) EDX
spectrum. Pt signal is originated from Pt coating on the SEM sample to reduce
charging effect.
TEM analysis was further performed to study the effect of reaction media on the
morphology of the resultant hybrids. As shown in Figure 7.12(a) and (c),
uniformly coated bwGO sheets were observed for the samples prepared in EtOH.
The size of the TiO2 nanoparticles was too small to be clearly distinguished.
Although the precise mechanism for the formation of the hybrids is unclear, we
tentatively speculate the mechanism as follows: Upon addition into EtOH
dispersion, hydrolyzed TBOT bind onto bwGO surface through both H-bonding
interaction with the adsorbed Fmoc-Trp and condensation with the oxidized
functionalities on the sheet before heterogeneous nucleation to form TiO2 nuclei
(Figure 7.13a). While upon addition into aqueous dispersion, fast hydrolysis and
condensation rates lead to homogenous nucleation in solution, and subsequently
the nuclei bind onto bwGO surface where they grow to form TiO2 nanoparticles
(Figure 7.13b). Therefore, less uniform coating of larger particles was formed.
The role of the surfactants in the formation of the hybrids was also studied. ED
analysis of the sample prepared in the absence of Fmoc-Trp revealed ring patterns
(Figure 7.12b) with the inner ring showing a higher intensity suggesting
Ti Pt
Al
0 1 2 3 4 5
0
2500
5000
Co
un
ts (
a.u
.)
Energy (keV)
C
O
(b)
1 μm
(a)

257
randomly restacked monolayer sheets. This may due to that without the
surfactants, temporarily dispersed bwGO sheets restack prior to coating with TiO2
despite the presence of oxygenated functionalities on their surface. In contrast,
the SAED pattern for the sample prepared with the addition of Fmoc-Trp solution
(Figure 7.12d) showed diffraction spots arranged in six-fold symmetry. It’s clear
from the intensity profile (Figure 7.12e) that the inner 1-100-type reflections are
more intense than the outer 2-1-10-type reflections, with an intensity ratio of ~1.5,
indicating individually coated sheets which are stabilized by Fmoc-Trp.
(a)
(b)
(c)
(-1-120)
(2-1-10)
(0-110)
(d)
(1-100)
(1-210)
(-1010)

258
Figure 7.12 (a) TEM image of bwGO-TiO2 nanohybrids prepared in EtOH with the
addition of H2O. (b) Corresponding SAED pattern taken from the region marked
by the dashed box in (a). (c) TEM image of bwGO-TiO2 nanohybrids prepared in
EtOH with the addition of Fmoc-Trp solution. (d) Corresponding SAED pattern
taken from the region marked by the dashed box in (c). The pattern was labeled
using Miller-Bravais indices. (e) Intensity profile plot along the line between the
arrows shown in (d).
0 100 200 300 400 500 600
50
100
150
200
In
ten
sity (
a.u
.)
2-1-10
1-100 0-110
-1-120
(e)
OH
OH
In EtOH
Nucleation
bwGO-TiO2 nanohybrids
~ TiO2 nanoparticle
(a)

259
Figure 7.13 Schematic illustration of the synthesis of bwGO-TiO2 nanohybrids in (a)
EtOH and (b) aqueous solution.
Raman spectroscopy was also conducted to verify the existence of TiO2 coating
in the hybrids prepared in EtOH. The hybrids were annealed in argon at 600 ºC to
induce crystallization of TiO2 as well as to avoid the oxidation of bwGO. Raman
spectrum for the annealed sample (Figure 7.14c) showed the characteristic peak
for the E1g mode of anatase TiO2 at 149 cm-1 and the broad D and G bands which
were indexed to bwGO. This result provides further evidence for the coverage of
TiO2 on bwGO sheets.
OH
OH
OH
OH
HO
HO
OH
Growth
OH
OH
OH
HO
HO
OH
OH
OH
HO
HO
OH
OH
OH
HO
HO OH
OH
OH
HO
HO
bwGO-TiO2 nanohybrids
OH
OH
OH
HO
HO
In aqueous solution
~ TiO2 nuclei
~ TiO2 nanoparticle
(b)

260
Figure 7.14 Raman spectra for (a) bwGO deposited from the dispersion in
Fmoc-Trp solution (b) anatase TiO2 and (c) annealed bwGO-TiO2 nanohybrids
prepared in EtOH. The spectra were taken using a 633 nm HeNe laser. Note that
the peak at around 520 cm-1 was attributed to the SiO2/Si substrate.
7.3 Exfoliated graphene-Inorganic nanohybrids
By analogy with the successful dispersion of CNTs in Fmoc-AA solution, herein,
Fmoc-Trp was used as surfactant for the direct exfoliation of graphite. The
quality of the resultant dispersion (dispersed concentration, flake size and
thickness) was assessed by Raman spectroscopy, TEM and AFM prior to the
preparation of exfoliated graphene (EG)-TiO2 nanohybrids.
7.3.1 Effect of sonication time and centrifuge speed on
the concentration of the graphene dispersion
A series of graphene dispersions were prepared via ultrasonicating graphite in
Fmoc-Trp solution with various sonication time and centrifuge speed to study
their effect on the concentration of the resultant dispersion. The photographs of
the dispersions prepared with increasing sonication time (at a constant centrifuge
500 1000 1500 2000 2500 3000
0
20000
40000
60000
80000
100000
Inte
nsity (
a.u
.)
Raman shift (cm-1)
D G (a) bwGO
(b) Anatase
(c) Annealed bwGO-TiO2
prepared in EtOH
E1g
E1g
E1g
D G

261
speed of 3000 rpm) and centrifuge speed (at a constant sonication time of 6 h)
were shown in Figure 7.15(a) and (b) respectively. All of the obtained dispersions
were homogenous and the color of the dispersion prepared with longer sonication
time and lower centrifuge speed appeared darker, indicating higher concentration
of graphene. The exact concentration of the dispersion prepared under each of the
conditions was determined using a simple filtering and weighing method and is
summarized in Table 7.1. The concentration increased from 0.016 mg/mL for 1 h
of sonication to 0.03 mg/mL for 12 h of sonication while fell from 0.070 mg/mL
after centrifugation at 500 rpm to 0.015 mg/mL after centrifugation at 6000 rpm,
which is consistent with the darkness of the dispersion in the photographs. These
values are comparable to those reported in the literature for surfactant stabilized
graphene 18,19 and are approximately 10 times lower than the reported
concentration of graphene dispersed in NMP which was prepared under the same
condition 20. Although the concentration is smaller than those achieved in
solvents, working in aqueous system brings its own advantages.
Figure 7.15 Digital images of the graphene dispersions prepared under various
conditions: (a) with increasing sonication time (at a constant centrifuge speed of
3000 rpm) (b) with increasing centrifuge speed (at a constant sonication time of 6 h).
1 h 6 h 12 h
(a)
500 rpm 3000 rpm 6000 rpm
(b)

262
Table 7.1 Measured concentrations of graphene dispersions produced with various
sonication time and centrifuge speed
In addition, the stability of the dispersion was studied by monitoring the change
in the homogeneity of the dispersion over time. Similar to the colloidal
stabilization of CNTs by Fmoc-Trp, the dispersion of graphene in Fmoc-Trp
solution was found to be fairly stable over a period of 1 week by showing only
moderate degree of sedimentation.
7.3.2 Evidence for exfoliation to graphene
7.3.2.1 Raman characterization of the exfoliated samples
Raman spectroscopy has been proved as a powerful and nondestructive tool for
capturing the electronic structures of graphene 21. Therefore, to probe the degree
of exfoliation and to evaluate the quality of the exfoliated flakes, the resultant
dispersion was deposited on SiO2/Si substrate for Raman measurement. At least
40 flakes from each of the samples were randomly chosen and measured under
laser excitation of 633 nm. The spectrum for the starting graphite powder was
also recorded for comparison. All the peaks were fitted with Lorentzians. The
Raman spectrum for the starting graphite powder (Figure 7.16a) exhibited a
single and sharp G band at ~ 1581 cm-1, a negligible D band at ~1333 cm-1, and a
2D band at ~2686 cm-1. The negligible D band suggests a nearly defect-free
structure of the starting graphite. The 2D band is composed of 2 components, 2D1
and 2D2, which are roughly 1/4 and 1/2 the height of the G peak respectively.
Raman spectra for all the exfoliated samples (Figure 7.16b-d and Figure 7.17b-d)
were in striking contrast to that for graphite by showing a considerably
pronounced D band at ~1331 cm-1, a weak shoulder peak D’ at ~1617 cm-1 and a
500 3000 6000
1 0.016
6 0.070 0.024 0.015
12 0.030
Centrifuge speed (rpm)
Sonication
time (h) Concentration (mg/mL)
263
symmetric 2D band which was force fitted to a single Lorentzian peak for
comparison purposes. The 2D band position range from 2656 to 2668 cm-1 with a
bandwidth of 60-90 cm-1 which is typical for few layer graphene (< 5 layers)
dispersed in solvents or surfactant solutions 19,20,22,23. It should be noted that due
to the aggregation of the flakes on the substrate during solvent evaporation and
the larger size of the laser spot compared with that of the flakes, the obtained
Raman spectra include contributions from all the flakes in the aggregate which
lead to the broadening and symmetry of the 2D band. The I2D/IG ratio for the
exfoliated samples is found to be ~0.5, again suggesting their few layer nature 24.
A significantly stronger D band was observed for all the exfoliated samples as
compared to the starting graphite, indicating the introduction of large amounts of
defects during the sonication process. These defects can be either basal-plane
defects or defects associated with the new edges formed as the flake size is
reduced during the extensive sonication. Coleman et al. have identified the
introduced defects being associated with the formation of new flake edges rather
than body defects by showing the time dependence of the difference between
ID/IG for exfoliated graphene versus graphite powder 19,20. This implies that the
sonication process is relatively non-destructive which yields flakes with good
quality.
A weak shoulder peak D’ is observed for all the exfoliated samples, similar to the
observation in previous study of graphene exfoliated in surfactant solution, which
is mostly attributed to the edge defects 25.
It is also noted that the G band for the exfoliated samples slightly upshifted
(1583cm-1) compared with that of graphite (1581 cm-1). Graf et al. 26 have
demonstrated that only mono- and bilayer graphene show upshifted G band
compared with that of HOPG. Ferrari et al. have also reported the upshift of the G
peak of monolayer graphene compared with that of bulk graphite which was
partially attributed to chemical doping 21. Gupta et al. 27 have shown that the G

264
band frequency exhibited an almost linear dependence on 1/n (n = number of
graphene layers) and according to their result, 3 and 4 layers are dominant in the
present study.
Figure 7.16 Raman spectra for (a) the starting graphite powder and the flakes
deposited from the dispersions prepared with (b) 1 h (c) 6 h and (d) 12 h of
sonication followed by centrifugation at 3000 rpm respectively. The spectra were
measured on SiO2/Si substrate and in all cases the excitation wavelength was 633
nm. D, G, 2D and D’ bands are indicated in the Figure. All the spectra were
normalized to have the similar G band intensity and offset for clarity.
1500 2000 2500
0
5000
10000
15000
20000
25000
30000
35000
40000
In
ten
sity (
a.u
.)
Raman shift (cm-1)
D
G 2D
D’
(a)
(b) 1 h, 3000 rpm
(c) 6 h, 3000 rpm
(d) 12 h, 3000 rpm
Graphite

265
Figure 7.17 Raman spectra for (a) the starting graphite powder and the flakes
deposited from the dispersions prepared with centrifugation at (b) 500 rpm (c) 3000
rpm and (d) 6000 rpm following 6 h of sonication respectively. The spectra were
measured on SiO2/Si substrate and in all cases the excitation wavelength was 633
nm. D, G, 2D and D’ bands are indicated in the Figure. All the spectra were
normalized to have the similar G band intensity and offset for clarity.
Approximately 40 flakes produced under each condition were analyzed to
generate the statistics that allow further investigation of the effect of sonication
time and centrifuge speed on the degree of exfoliation and flake dimensions.
Firstly, the 2D band position was considered. The statistical data for the 2D band
position under varying conditions are plotted as histograms in Figure 7.18. Figure
7.19 shows the mean 2D band position as a function of sonication time and
centrifuge speed, as calculated from the distributions in Figure 7.18. The mean
2D band position stayed roughly constant at 2662 cm-1 for all the sonication time
used (Figure 7.19a). In contrast, it shifted to lower wavenumber with increasing
centrifuge speed (Figure 7.19b) suggesting that thinner flakes remain dispersed at
higher rotation rate.
1500 2000 2500
0
5000
10000
15000
20000
25000
30000
35000
40000
Inte
nsity (
a.u
.)
Raman shift (cm-1)
D
G 2D
(a) Graphite
(b) 6 h, 500 rpm D’
(c) 6 h, 3000 rpm
(d) 6 h, 6000 rpm

266
Figure 7.18 Histograms and normal distribution of the 2D band position for varying
sonication time and centrifuge speed.
1h, 3000 rpm
2652 2656 2660 2664 2668 2672
0
2
4
6
8
10
Count
Raman shift (cm-1
)
(a)
2652 2656 2660 2664 2668 26720
2
4
6
8
10
12
14
16
18
Co
un
t
Raman shift (cm-1)
6h, 500 rpm (d)
2652 2656 2660 2664 2668 26720
2
4
6
8
10
Co
un
t
Raman shift (cm-1
)
6h, 3000 rpm (b)
2652 2656 2660 2664 2668 26720
2
4
6
8
Co
un
t
Raman shift (cm-1)
6h, 6000 rpm (e)
2652 2656 2660 2664 2668 26720
2
4
6
8
10
12
14
Co
un
t
Raman shift (cm-1)
12h, 3000 rpm
(c)

267
Figure 7.19 Mean 2D band position as a function of (a) sonication time and (b)
centrifuge speed. The data for the starting graphite powder was also shown for
comparison.
The statistics of the 2D bandwidth under varying conditions was also investigated.
The histograms show that the 2D bandwidth for the exfoliated samples fall into
the range of 60-90 cm-1 (Figure 7.20). The mean 2D bandwidth is found to hardly
vary with both sonication time and centrifuge speed by displaying a relatively
constant value of 77 cm-1 (Figure 7.21).
0 5 10 15
2600
2620
2640
2660
2680
2700
2D
ba
nd
po
sitio
n
Sonication time t (h)
Graphite (a)
0 2000 4000 6000 8000
2600
2620
2640
2660
2680
2700
2D
ba
nd
po
sitio
n
Centrifuge speed (rpm)
Graphite (b)
40 60 80 100 1200
2
4
6
8
10
12
14
16
18
20
Co
un
t
band width
1h, 3000 rpm (a)
40 60 80 100 1200
2
4
6
8
10
12
14
16
Co
un
t
band width
6h, 3000 rpm (b)

268
Figure 7.20 Histograms and normal distribution of the 2D bandwidth for varying
sonication time and centrifuge speed.
Figure 7.21 Mean 2D bandwidth as a function of (a) sonication time and (b)
centrifuge speed.
40 60 80 100 1200
2
4
6
8
10
12
Co
un
t
band width
(c) 12h, 3000 rpm
40 60 80 100 120 140 1600
5
10
15
20
25
Co
un
t
band width
6h, 500 rpm (d)
40 60 80 100 120 140 1600
2
4
6
8
10
Co
un
t
band width
6h, 6000 rpm (e)
0 5 10 15
0
40
80
120
160
2D
ba
nd
wid
th
Sonication time (h)
(a)
0 2000 4000 6000 8000
0
40
80
120
160
2D
ba
nd
wid
th
Centrifuge speed (rpm)
(b)

269
Ni et al. have suggested that the number of graphene layers is sensitive to the
I2D/IG ratio 28. The histograms of I2D/IG ratio for the exfoliated samples (Figure
7.22) show an average value of 0.52 apart from the sample prepared with 6 h of
sonication followed by centrifugation at 500 rpm which reveals a smaller value of
0.43. Such values are comparable to those for bi- and trilayer graphene 29, thus
verifying the few layer nature of the exfoliated flakes. As shown in Figure 7.23,
the ratio stays roughly constant with varying sonication time, while increases
steadily with centrifuge speed, suggesting that thinner flakes are dominating the
dispersion at higher centrifuge rate. This observation is in good agreement with
the previous study 26.
However, Berciaud et al. showed that the I2D/IG ratio for the suspended part of
monolayer is 4 times larger than that for the supported portion which exhibited
spatially varying doping levels arise from the interaction with the substrate 30.
Therefore, the I2D/IG ratio is not reliable in estimating the number of graphene
layers due to the non-uniform adhesion of graphene on the substrate.
0.3 0.4 0.5 0.6 0.70
1
2
3
4
5
6
7
8
Co
un
t
I2D
/IG
1h, 3000 rpm (a)
0.3 0.4 0.5 0.6 0.70
1
2
3
4
5
6
7
8
Co
un
t
I2D
/IG
6h, 500 rpm (d)
0.3 0.4 0.5 0.6 0.70
2
4
6
8
Co
un
t
I2D
/IG
6h, 3000 rpm (b)
0.3 0.4 0.5 0.6 0.70
2
4
6
8
Co
un
t
I2D
/IG
12h, 3000 rpm (c)

270
Figure 7.22 Histograms and normal distribution of I2D/IG ratio for varying
sonication time and centrifuge speed.
Figure 7.23 Mean I2D/IG ratio as a function of (a) sonication time and (b) centrifuge
speed.
It is also critical to study the defects formed during the sonication process. We do
this by monitoring the ID/IG ratio. It is found that the ID/IG ratio for the exfoliated
samples is larger than the typical value reported for surfactant stabilized flakes
(Figure 7.24)19.
We also compare the ID/IG ratio as a function of sonictaion time and centrifuge
speed. As shown in Figure 7.25a, the ratio is surprisingly insensitive to sonication
0.3 0.4 0.5 0.6 0.70
1
2
3
4
5
6
7
8
Co
un
t
I2D
/IG
6h, 6000 rpm (e)
0 5 10 15
0.0
0.5
1.0
I 2D/I
G
Sonication time (h)
(a)
0 2000 4000 6000 8000
0.0
0.5
1.0
I 2D/I
G
Centrifuge speed (rpm)
(b)
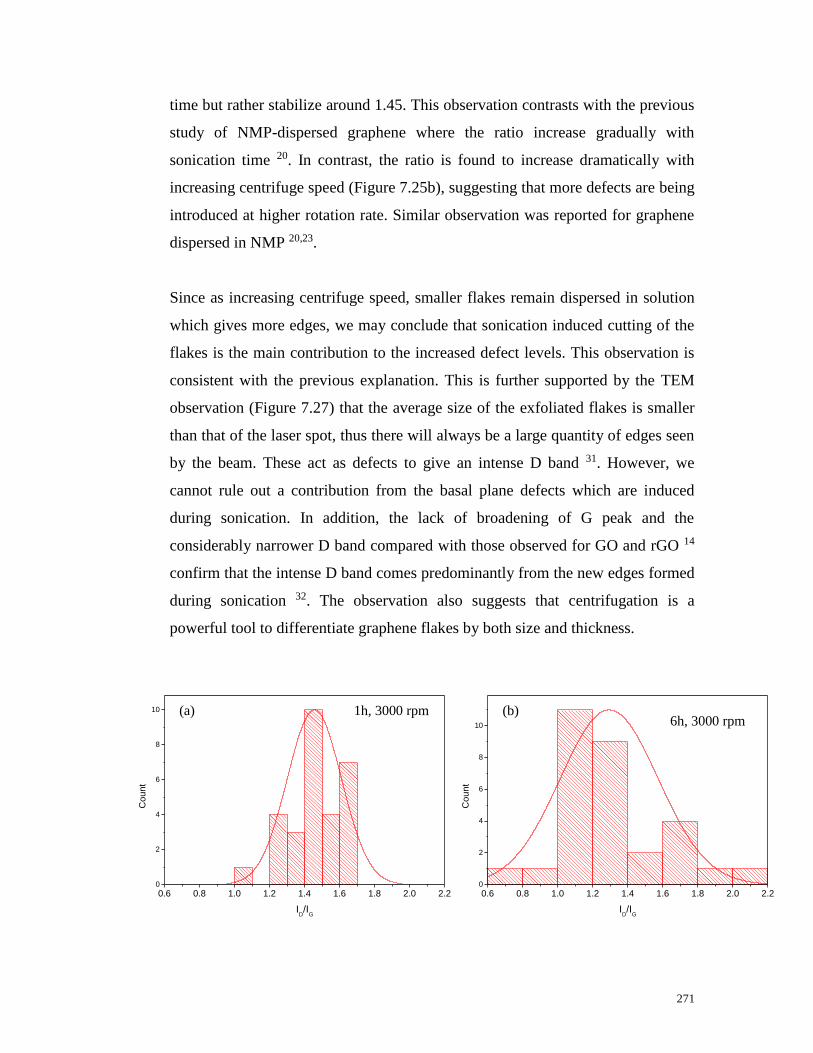
271
time but rather stabilize around 1.45. This observation contrasts with the previous
study of NMP-dispersed graphene where the ratio increase gradually with
sonication time 20. In contrast, the ratio is found to increase dramatically with
increasing centrifuge speed (Figure 7.25b), suggesting that more defects are being
introduced at higher rotation rate. Similar observation was reported for graphene
dispersed in NMP 20,23.
Since as increasing centrifuge speed, smaller flakes remain dispersed in solution
which gives more edges, we may conclude that sonication induced cutting of the
flakes is the main contribution to the increased defect levels. This observation is
consistent with the previous explanation. This is further supported by the TEM
observation (Figure 7.27) that the average size of the exfoliated flakes is smaller
than that of the laser spot, thus there will always be a large quantity of edges seen
by the beam. These act as defects to give an intense D band 31. However, we
cannot rule out a contribution from the basal plane defects which are induced
during sonication. In addition, the lack of broadening of G peak and the
considerably narrower D band compared with those observed for GO and rGO 14
confirm that the intense D band comes predominantly from the new edges formed
during sonication 32. The observation also suggests that centrifugation is a
powerful tool to differentiate graphene flakes by both size and thickness.
0.6 0.8 1.0 1.2 1.4 1.6 1.8 2.0 2.20
2
4
6
8
10
Co
un
t
ID/I
G
(a) 1h, 3000 rpm
0.6 0.8 1.0 1.2 1.4 1.6 1.8 2.0 2.20
2
4
6
8
10
Co
un
t
ID/I
G
6h, 3000 rpm (b)

272
Figure 7.24 Histograms and normal distribution of ID/IG ratio for varying sonication
time and centrifuge speed.
Figure 7.25 Mean ID/IG ratio as a function of (a) sonication time and (b) centrifuge
speed. The ratio for the starting graphite was also shown for comparison.
0.6 0.8 1.0 1.2 1.4 1.6 1.8 2.0 2.2 2.40
1
2
3
4
5
6
7
8
Co
un
t
ID/I
G
(e) 6h, 6000 rpm
0.6 0.8 1.0 1.2 1.4 1.6 1.8 2.0 2.2 2.40
2
4
6
8
10
12
14
16
18
Co
un
t
ID/I
G
6h, 500 rpm (d)
0.6 0.8 1.0 1.2 1.4 1.6 1.8 2.0 2.20
2
4
6
8
10
12
Co
un
t
ID/I
G
12h, 3000 rpm (c)
0 5 10 15
-1
0
1
2
I D/I
G
Sonication time (h)
(a)
Graphite
0 2000 4000 6000 8000
-1
0
1
2
I D/I
G
Centrifuge speed (rpm)
(b)
Graphite
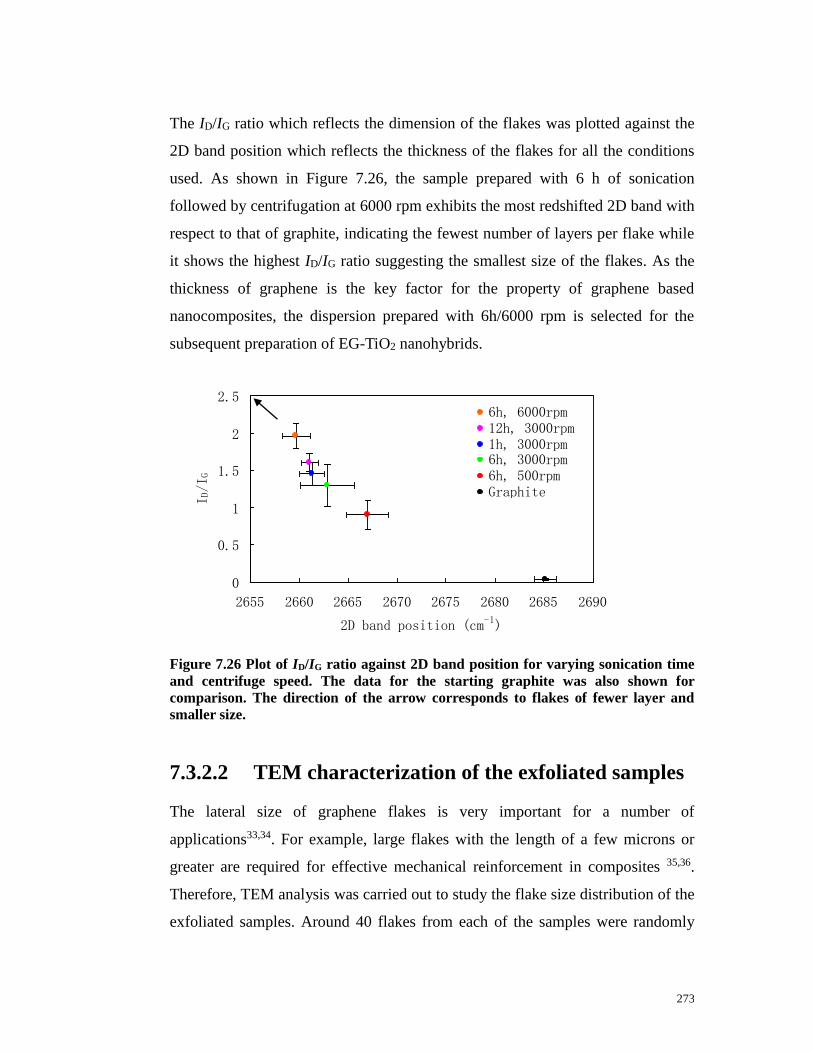
273
The ID/IG ratio which reflects the dimension of the flakes was plotted against the
2D band position which reflects the thickness of the flakes for all the conditions
used. As shown in Figure 7.26, the sample prepared with 6 h of sonication
followed by centrifugation at 6000 rpm exhibits the most redshifted 2D band with
respect to that of graphite, indicating the fewest number of layers per flake while
it shows the highest ID/IG ratio suggesting the smallest size of the flakes. As the
thickness of graphene is the key factor for the property of graphene based
nanocomposites, the dispersion prepared with 6h/6000 rpm is selected for the
subsequent preparation of EG-TiO2 nanohybrids.
Figure 7.26 Plot of ID/IG ratio against 2D band position for varying sonication time
and centrifuge speed. The data for the starting graphite was also shown for
comparison. The direction of the arrow corresponds to flakes of fewer layer and
smaller size.
7.3.2.2 TEM characterization of the exfoliated samples
The lateral size of graphene flakes is very important for a number of
applications33,34. For example, large flakes with the length of a few microns or
greater are required for effective mechanical reinforcement in composites 35,36.
Therefore, TEM analysis was carried out to study the flake size distribution of the
exfoliated samples. Around 40 flakes from each of the samples were randomly
0
0.5
1
1.5
2
2.5
2655 2660 2665 2670 2675 2680 2685 2690
2D band position (cm-1)
I D/I
G
6h, 6000rpm12h, 3000rpm1h, 3000rpm6h, 3000rpm6h, 500rpmGraphite

274
chosen and measured.
Generally, well-exfoliated flakes were obtained as evidenced by the high degree
of transparency of the flakes to the electron beam (Figure 7.27). It was observed
in Figure 7.27(a) and (l) that small flakes tend to aggregate in a disordered
manner to form thicker flakes. The flakes also showed a great tendency to fold
leading to an irregular shape (Figure 7.27b-d). A few thick objects (<15%) were
occasionally observed at the lowest centrifuge speed of 500 rpm (Figure 7.27h)
which is believed to be poorly exfoliated nanographite particles. At rotation rates
of 3000 rpm and above no such very thick objects were observed in the samples.
The ED pattern of a relatively flat flake shown in Figure 7.27g revealed the
typical 6-fold symmetry (Figure 7.27i) which matches well with those observed
for NMP exfoliated graphene 32. The intensity profile plot through the
(2-1-10)–(1-100)–(0-110)–(-1-120) axis revealed an intensity ratio of I1-100/I2-1-10
~ 0.32 and I0-110/I-1-120 ~ 0.55 (Figure 7.27j), suggesting the multilayer nature of
the flakes 37 which retain the Bernal (AB) stacking of the source graphite 4.
Although this result is consistent with previously reported ratio for bilayer
graphene 4,21,32, it is hard to determine the precise number of layers for few-layer
graphene.
(a) (b)

275
(h) (g)
(c)
(f)
(i) (j)
(d)
-1010
(e)

276
Figure 7.27 Representative TEM images of graphene flakes deposited from the
dispersions prepared with (a,b) 1 h of sonication followed by centrifugation at 3000
rpm (c,d) 6 h of sonication followed by centrifugation at 3000 rpm (e,f) 12 h of
sonication followed by centrifugation at 3000 rpm (g,h) 6 h of sonication followed by
centrifugation at 500 rpm (i,j) 6 h of sonication followed by centrifugation at 6000
rpm. (k) Corresponding SAED pattern taken from the region marked by the dashed
box in (g). The pattern was labeled with Miller-Bravais indices. (l) Intensity profile
plot along the line between the arrows in (k).
The size of the flakes was determined by measuring their area using the software
AxioVision Rel. 4.8. An example of the measurement is shown in Figure 7.27d,
where a folded flake was outlined with the red line and according to the pixels of
the scale bar and that of the outlined region, the flake area is determine to be
0.1369 μm2. The statistical data for the calculated flake area under varying
conditions were summarized in Figure 7.28(a-e). The measured flake size showed
a broad distribution ranging from 0.02 to 0.89 μm2, which is lower than those
reported for solvent- 20 and surfactant-exfoliated graphene18,19. This is partly due
to the heavily folding of the flakes, leading to underestimation of the flake size.
The mean flake area appeared to be insensitive to sonication time by showing a
rather constant value around 0.13 μm2 (Figure 7.28f), which is consistent with the
Raman ID/IG ratio shown in Figure 7.25a. This observation is in contrast to that
observed for NMP-dispersed graphene where both the flake length and width
dropped off with increasing sonication time as a result of sonication-induced
(0-110) (-1010)
(1-100)
(-1-120)
(2-1-10)
(1-210)
(k)
0 100 200 300 400
50
100
150
200
250
In
ets
nity (
a.u
.)
2-1-10
1-100 0-110
-1-120
(l)

277
cutting 20. However, Lotya et al. 19 have reported a similar observation with
sodium cholate-dispersed graphene. A possible explanation is that in the presence
of the surfactants, within the first 1h of sonication, the flakes were cut to a certain
size and beyond this time sonication-induced cutting is limited possibly due to the
surfactant slippage at the graphene/surfactant/water double interface.
In contrast, the mean flake area decreases exponentially with centrifuge speed,
falling from 0.32 μm2 for sample prepared with centrifugation at 500 rpm to
0.08μm2 for that prepared with centrifugation at 6000 rpm (Figure 7.28g). This
observation agrees well with the previous work on both NMP and
surfactant-dispersed graphene 19,20. This is also consistent with the inverse ID/IG
ratio shown in Figure 7.25b, further supporting that the defects introduced during
the sonication process are predominately associated with the new edges formed
due to sonication-induced cutting, not the structural defects formed on the basal
plane.
We must also note that the statistical data derived from the TEM observation may
be biased toward higher values due to the loss of small flakes through the holes in
TEM grid.
0.0 0.1 0.2 0.3 0.4 0.50
2
4
6
8
10
12
Co
un
t
Flake area (μm2)
(a) 1h, 3000 rpm
0.0 0.1 0.2 0.3 0.4 0.50
2
4
6
8
10
12
14
16
18
20
Co
un
t
Flake area (μm2)
(b) 6h, 3000 rpm

278
Figure 7.28 (a-e) Histograms and normal distribution of the flake area for varying
sonication time and centrifuge speed. (f) Mean flake area as a function of sonication
time. (g) Mean flake area as a function of centrifuge speed.
7.3.2.3 AFM characterization of the exfoliated samples
Coleman et al. have reported a method for estimating the number of graphene
0.0 0.1 0.2 0.3 0.4 0.50
1
2
3
4
5
6
7
Cou
nt
Flake area (μm2)
(e) 6h, 6000 rpm
0.0 0.1 0.2 0.3 0.4 0.50
1
2
3
4
5
6
Cou
nt
Flake area (μm2)
(c) 12h, 3000 rpm
0.0 0.2 0.4 0.6 0.8 1.00
1
2
3
4
5
6
7
Cou
nt
Flake area (μm2)
(d) 6h, 500 rpm
0 5 10 15
0.0
0.2
0.4
0.6
Fla
ke
are
a (μ
m2)
Sonication time (h)
(f)
0 2000 4000 6000 8000
0.0
0.2
0.4
0.6
0.8
Fla
ke
are
a (μ
m2)
Centrifuge speed (rpm)
Model
Equation
Reduced Chi-Sqr
Adj. R-Square
?$OP:F=1Model
Equation
Reduced Chi-Sqr
Adj. R-Square
?$OP:F=1
(g)
279
layers per flake by carefully counting the flake edges 18,20,32. However, it is very
difficult to identify the exact number of edges per flake based on the TEM images
obtained in the current study. It is also infeasible to identify the number of layers
based on the ED pattern, except for monolayer which shows more intense inner
diffraction spots than the outer’s. For trilayer and above, the ED pattern becomes
hardly distinguishable from that of bulk graphite.
AFM is the most commonly used tool to definitively identify the thickness of
graphene and few layer graphene flakes 18,32,38. Therefore, to provide further
evidence for the exfoliation, contact mode AFM measurement is performed. The
samples for AFM measurements were prepared by drop casting the highly diluted
dispersions onto freshly cleaved mica surface which was heated at ~110 ºC on a
hotplate to accelerate solvent evaporation.
It was very difficult to find measurable flakes for the dispersions prepared with
1h/3000 rpm, 6h/500 rpm and 6h/6000 rpm. Therefore, only those deposited from
the dispersions prepared with 12h/3000 rpm and 6h/3000 rpm were shown in
Figure 7.29. A ~1.5 μm wide flake with well defined edges was clearly visible in
Figure 7.29a. The shape of the flake appeared quite similar to those observed by
TEM. The height profiles shown in Figure 7.29b correspond to the measurements
along the white, black, blue and green lines shown in Figure 7.29a respectively. It
revealed two steps across the flake with the height of ~2.30 nm and ~1.37 nm,
suggesting partial exfoliation or folding of the flake. The height profile shown in
Figure 7.29d which corresponds to the measurement along the white line shown
in Figure 7.29c highlights a single step with the height of ~1.76 nm. Lotya et al.18
have shown the apparent height of graphene monolayers to be ~1 nm as measured
by AFM. Coleman et al. 32 have also reported the measured height for monolayer
graphene at around 1-2 nm (even up to 2.6 nm) rather than 0.34 nm which is
characteristic of individual pristine graphene sheet. This observation is probably
due to a combination of contrast issues and the presence of a residual NMP
between the monolayer and the substrate. While in the current study, both the

280
adsorbed surfactants and the attachment of smaller flakes (as evidenced by the
presence of brighter contrast region on the flake in the AFM image) may
contribute to the overestimation of the flake thickness. The measured heights for
the flakes deposited from the dispersion prepared with 12h/3000 rpm suggest the
number of layers below 3 which is in reasonable agreement with the Raman and
TEM results.
Figure 7.29(f) and (h) showed the height profiles acquired along the solid lines
shown in Figure 7.29(e) and (g) respectively. A single step from mica surface to
the flake revealed the height ranging from 3.90 to 4.63 nm, suggesting 4-8 layers
of the flakes deposited from the dispersion prepared with 6h/3000 rpm.
In addition to the exfoliated flakes, large numbers of spherical particles with
significantly brighter contrast were also observed (indicated by arrows in Figure
7.29), characterized by the height in excess of 20 nm. This may be attributed to
the aggregates of the surfactants. To test this, a control sample prepared by
depositing Fmoc-Trp solution on mica surface was imaged with AFM. As shown
in Figure 7.29i, the similar shape and thickness of the particles observed in the
control sample to those observed in the exfoliated samples confirms the presence
of surfactant aggregates.
It is necessary to remove the surfactants from the flakes in order to accurately
identify the number of layers per flake. Lotya et al.18 have reported the removal of
residual surfactants from both the substrate and the flakes by washing the
substrate with water. Therefore, in the present study, two approaches were
attempted to remove the residual Fmoc-Trp: (1) by dipping the sample in water
for 5 min followed by blowing dry with argon stream and (2) by annealing the
sample in argon at 300 ºC. However, similar AFM images were obtained after
both treatments with the aggregates of surfactants still present. As it is not
possible to fully remove the residual surfactants in the current study, AFM
measurement is very difficult to give reliable results on the accurate flake
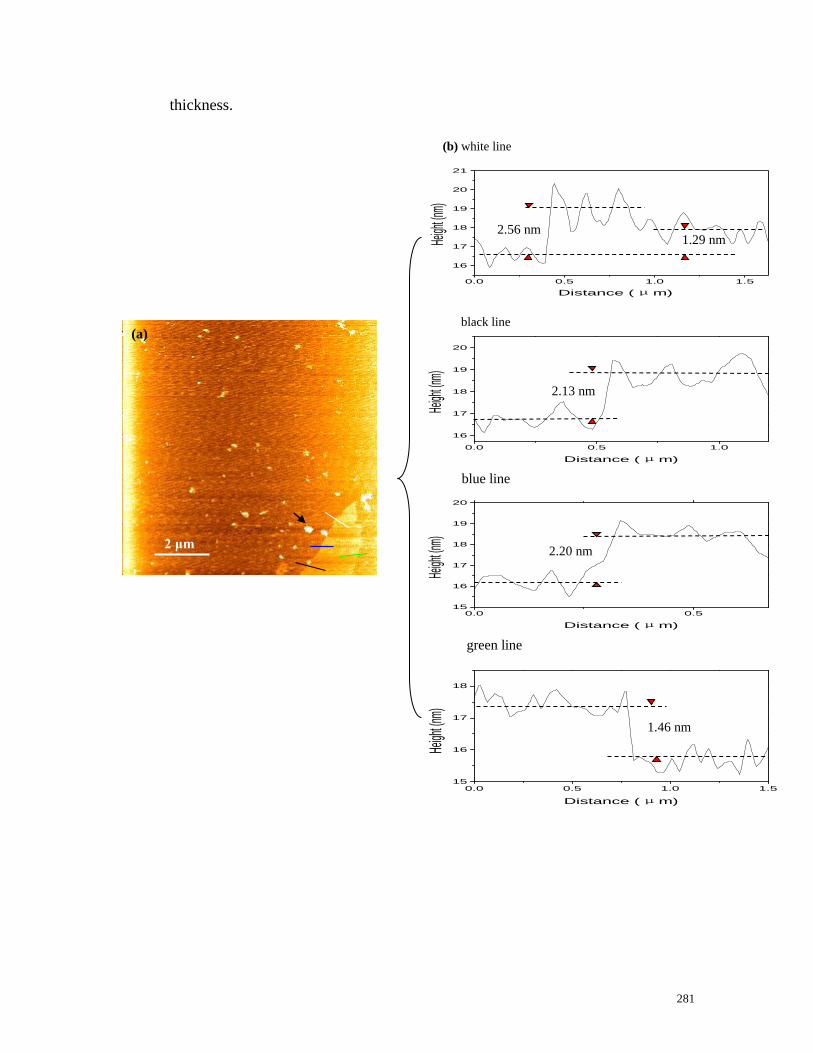
281
thickness.
2 μm
(a)
(b) white line
0.0 0.5 1.0 1.5
16
17
18
19
20
21
Heigh
t (nm)
Distance (μm)
2.56 nm 1.29 nm
black line
0.0 0.5 1.0
16
17
18
19
20
Heigh
t (nm)
Distance (μm)
2.13 nm
blue line
0.0 0.515
16
17
18
19
20
Heigh
t (nm)
Distance (μm)
2.20 nm
green line
0.0 0.5 1.0 1.515
16
17
18
Heigh
t (nm)
Distance (μm)
1.46 nm

282
0.0 0.5 1.0
10
11
12
13
Heigh
t (nm
)
Distance (μm)
1.76 nm
(d) white line
0.0 0.5 1.0 1.5 2.06
7
8
9
10
11
12
13
14
15
16
Heigh
t (nm
)
Distance (μm)
4.01 nm
(f) white line (e)
2 μm
2 μm
(c)

283
0.0 0.534
35
36
37
38
39
Heigh
t (nm
)
Distance (μm)
3.90 nm
0.0 0.5 1.0
34
35
36
37
38
39
40
Heigh
t (nm
)
Distance (μm)
4.63 nm
(h) white line
black line
0.0 0.532
33
34
35
36
37
38
39
40
41
42
Heigh
t (nm
)
Distance (μm)
4.50 nm
blue line
0.0 0.5 1.034
35
36
37
38
39
40
41
42
43
44
Heigh
t (nm
)
Distance (μm)
3.99 nm
green line
(g)
2 μm

284
Figure 7.29 AFM characterization of the exfoliated flakes deposited from the
dispersions prepared with (a,c) 12 h of sonication followed by centrifugation at 3000
rpm and (e,g) 6 h of sonication followed by centrifugation at 3000 rpm on a 10 μm ×
10 μm mica surface. (b,d,f,h) Height profiles measured along the corresponding
lines shown in the AFM images. (i) AFM image of Fmoc-Trp solution (control)
deposited on a 20 μm × 20 μm mica surface.
7.3.3 Preparation of exfoliated graphene (EG)-TiO2
nanohybrids
7.3.3.1 Preparation of EG-TiO2 hybrids in aqueous solution
The hybrids were prepared by mixing the exfoliated graphene into a TBOT
solution. The graphene dispersions were prepared by 6 h of sonication followed
by centrifugation at either 6000 rpm or 3000 rpm. The microstructure of the
resultant products was characterized by TEM. As shown in Figure 7.30(a) and (c),
graphene flakes were uniformly embedded in the TiO2 nanoparticle aggregates
for both of the samples as evidenced by the uniform distribution of the black
stripes (marked by the red arrows) in the composites which were attributed to the
wrinkles present in the graphene. The average size of the TiO2 nanoparticles was
25.4 ± 6.5 nm. The flakes were found to protrude from the aggregates as
highlighted by the black arrows in Figure 7.30(b) and (d). The presence of
2 μm
(i)

285
graphene in the aggregates was confirmed by SAED which showed the typical
six-fold symmetry expected for graphite/graphene 39, 40 (Figure 7.30e). Due to the
strong intensity of the fuzzy ring that is originated from the aggregated
amorphous TiO2 nanoparticles, the diffraction peak corresponding to (2-1-10) was
not observed. The intensity profile plot through the (1-100)–(0-110)–(-1-120)
axis revealed an intensity ratio of I0-110/I-1-120 ~1.4 (Figure 7.30f), which is
consistent with monolayer graphene 3,4. Raman spectrum for the nanocomposites
showed three pronounced peaks at 1324, 1575 and 2646 cm-1 (Figure 7.30g)
which are characteristic for the D, G and 2D band of graphene respectively. The
2D band position suggests the presence of monolayer graphene21, which is in
good agreement with the ED analysis.
(b)
(d) (c)
(a)
50 nm

286
Figure 7.30 TEM images of the EG-TiO2 nanocomposites produced using the
dispersion prepared with (a,b) 6h/6000 rpm and (c,d) 6h/3000 rpm. (e)
Corresponding SAED pattern taken from the region marked by the dashed box in
(a). The pattern was labeled with Miller-Bravais indices. (f) Intensity profile plot
along the line between the arrows shown in (e). (g) Raman spectrum for the
nanocomposites shown in (a,b). Note that the red arrows indicate the wrinkles
present in the flakes and the black arrows indicate the edges of the flakes which
protrude from the composites. Note that the peak at around 520 cm-1 was attributed
to the SiO2/Si substrate. Scale bar, (a) 50 nm, (b) and (d) 100 nm, (c) 200 nm.
500 1000 1500 2000 2500 3000
0
20000
40000
60000
80000
100000
120000
140000
In
ten
sity (
a.u
.)
Raman shift (cm-1)
(g)
D G
2D
0 100 200 300 400
50
100
150
In
tensity (
a.u
.)
1-100 0-110
-1-120
(f)
(1-210)
(1-100)
(-1-120)
(0-110) (-1010)
(e)

287
7.3.3.2 Preparation of EG-TiO2 nanohybrids in EtOH
The reaction was performed in EtOH in order to achieve more uniform TiO2
coating on individual graphene flakes. The graphene dispersion in EtOH was
stabilized by Fmoc-Trp prior to the introduction of the TBOT solution.
As shown in Figure 7.31a, a high-aspect-ratio flake with the length of ~5 μm was
observed to be uniformly coated with considerably smaller TiO2 nanoparticles.
The magnified image (Figure 7.31b) of the protruding region shown in the dashed
box in Figure 7.31a revealed the staggered edges of five individual layers within
the flake (indicated by arrows). However, due to the dense TiO2 coverage, it is
very difficult to identify the exact number of layers. The corresponding SAED
pattern (Figure 7.31c) revealed the typical six-fold symmetry. It was noted that
the diffraction peaks within the same hexagon showed varied intensities, which
may be explained by that the surface of the hybrid was not normal to the incident
electron beam as a result of sample tilting 4. The resultant hybrid was further
characterized using Raman spectroscopy to probe the degree of exfoliation of the
flakes in the hybrids. As shown in Figure 7.31d, the Raman spectrum for the
as-produced nanohybrids exhibited three intense peaks at ~1331 (D band), 1583
(G band) and 2671 cm-1 (2D band) which are typical for multilayer graphene 21.
This result indicates the lower degree of exfoliation in EtOH as compared with
that in Fmoc-Trp solution and is consistent with the TEM observation.
(a) (b)
Staggered
edges

288
Figure 7.31 TEM images of EG-TiO2 nanohybrids prepared in EtOH. (a) Lower
magnification image of the resultant hybrid. (b) A magnified image of the region
shown in the dashed box in (a). The arrows indicate the staggered edges of
individual layers comprising the flake. (c) Corresponding SAED pattern taken from
(b). The pattern was labeled with Miller-Bravais indices. (d) Raman spectrum
acquired for the hybrids. Note that the peak at around 520 cm-1 was attributed to
the SiO2/Si substrate.
7.4 Conclusion
GO-TiO2 nanohybrids have been synthesized via the sol-gel process of TBOT in
the presence of a GO aqueous dispersion at near neutral pH and room temperature.
Relatively uniform TiO2 coverage was observed, with higher TBOT
concentration leading to significantly larger TiO2 nanoparticles. TEM and SAED
analysis confirmed the monolayer nature of the GO sheets in the hybrids.
GO-SiO2 nanohybrids was prepared by in-situ growth of silica nanoparticles on
GO using water soluble THEOS as precursors. The direct condensation between
the hydroxyl groups of THEOS and the oxygenated functional groups on GO
sheets gives rise to uniform seeding thus smooth SiO2 coating on GO. Highly
porous silica nanosheets were obtained after calcination.
The synthesis of bwGO-TiO2 nanohybrids was successfully demonstrated using
Fmoc-Trp as surfactants in both aqueous solution and EtOH. The reaction in
500 1000 1500 2000 2500 3000
0
10000
20000
30000
40000
50000
60000
Inte
nsity (
a.u
.)
Raman shift (cm-1)
G
2D
D
(d)
(2-1-10)
(1-100) (-1010)
(0-110)
(-1-120) (1-210)
(c)

289
EtOH resulted in the formation of more uniform hybrids with considerably
smaller TiO2 nanoparticles. Individually coated bwGO sheets were observed in
the presence of Fmoc-Trp, which stabilized the dispersion of bwGO during
coating process.
Finally, graphene dispersions were obtained by direct exfoliation of graphite in
Fmoc-Trp solution. The concentration of the dispersion was found to increase
with sonication time and decrease with centrifuge speed. The dispersions were
fairly stable with moderate degree of sedimentation observed over a period of 1
week. The degree of exfoliation and the quality of the exfoliated flakes was
studied by Raman spectroscopy which exhibited symmetric 2D bands. The 2D
band position, bandwidth and the I2D/IG ratio suggested that few layer graphene
(<5 layers) were dominating the dispersion. The statistical data for the 2D band
position and I2D/IG ratio suggest that thinner flakes survived the dispersion at
higher centrifuge speed. The statistical data for the ID/IG ratio and the flake size
measured based on TEM observation suggest that the defects introduced during
sonication were predominately associated with the new flake edges formed due to
sonication-induced cutting rather than the structural defects formed on the basal
plane. This implies that the sonication process is relatively non-destructive which
yields flakes with relatively good quality. The statistical data for the flake size
showed a broad distribution ranging from 0.02 to 0.89 μm2. The smaller value
compared with those reported in literatures may be attributed partly to the heavily
folding of the flakes which lead to underestimation of the flake size. AFM
analysis of the flakes revealed a typical thickness between 1.29 and 4.63 nm,
proving their multilayer nature. Both the adsorbed surfactants and the attachment
of smaller flakes may contribute to the overestimation of the flake thickness.
However, after treatment by both washing in water and annealing in argon, the
surfactants were still present which make it very difficult to accurately determine
the number of layers per flake. Together, the Raman, TEM and AFM analysis of
the exfoliated samples suggest that the dispersions predominately contain
graphene flakes with a thickness of less than 5 layers. Finally, graphene-TiO2

290
nanocomposites and hybrids were produced in aqueous solution and EtOH
respectively using the surfactant stabilized exfoliated graphene as templates. With
reaction in aqueous solution, well-exfoliated graphene flakes were uniformly
embedded in the TiO2 nanoparticle aggregates. Whilst with the reaction in EtOH,
more uniform coating of significantly smaller TiO2 nanoparticles on individual
multi-layer graphene were observed.
The noncovalent nature of the approach reported in this chapter allows the
preservation of the structures and properties of pristine graphene in the hybrids.
Furthermore, the solution-based method facilitates the deposition or film-casting
of the nanocomposites and nanohybrids on a wide range of substrates, thus may
benefit many potential applications such as in thin film technology 41.
7.5 References
1. J. P. Rourke et al., The Real Graphene Oxide Revealed: Stripping the Oxidative
Debris from the Graphene-like Sheets, Angew. Chem. Int. Ed. 2011, 50, 3173.
2. G. Wang et al., Facile Synthesis and Characterization of Graphene Nanosheets,
J. Phys. Chem. C, 2008, 112, 8192.
3. N. R. Wilson et al., Graphene Oxide: Structural Analysis and Application as a
Highly Transparent Support for Electron Microscopy, ACS Nano, 2009, 3, 2547.
4. J. C. Meyer et al., On the roughness of single- and bi-layer graphene
membranes, Solid State Commun., 2007, 143, 101.
5. Y. Wang et al., One-pot facile decoration of graphene nanosheets with Ag
nanoparticles for electrochemical oxidation of methanol in alkaline solution,
Electrochemistry Communications, 2012, 17, 63.
6. D. C. Marcano et al., Improved Synthesis of Graphene Oxide, ACS Nano, 2010,
4, 4806.
7. Y. Tang et al., Incorporation of Graphenes in Nanostructured
TiO2 Films via Molecular Grafting for Dye-Sensitized Solar Cell Application,
ACS Nano, 2010, 4, 3482.
8. K. Zhou et al., Preparation of graphene–TiO2 composites with enhanced
photocatalytic activity, New J. Chem., 2011, 35, 353.
9. G. Jiang et al., TiO2 nanoparticles assembled on graphene oxide nanosheets
with high photocatalytic activity for removal of pollutants, Carbon, 2011,
492693.
10. Z. Hu et al., Visible light driven photodynamic anticancer activity of graphene
oxide/TiO2 hybrid, Carbon, 2012, 50, 994.

291
11. O. Akhavan et al., Photocatalytic Reduction of Graphene Oxide Nanosheets
on TiO2 Thin Film for Photoinactivation of Bacteria in Solar Light Irradiation, J.
Phys. Chem. C, 2009, 113, 20214.
12. W. L. Zhang et al., Fast and facile fabrication of
a graphene oxide/titania nanocomposite and its electro-responsive characteristics,
Chem.Commun., 2011, 47, 12286.
13. H. Zhang et al., P25-Graphene Composite as a High Performance
Photocatalyst, ACS Nano, 2010, 4, 380.
14. S. Stankovich et al., Synthesis of graphene-based nanosheets via chemical
reduction of exfoliated graphite oxide, Carbon, 2007, 45, 1558.
15. T. Seeger et al., Nanotube composites: novel SiO2 coated carbon nanotubes,
Chem.Commun., 2002, 34.
16. K. Woan et al., Photocatalytic Carbon-Nanotube–TiO2 Composites, Adv.
Mater., 2009, 21, 2233.
17. D. Eder et al., Carbon–Inorganic Hybrid Materials: The
Carbon-Nanotube/TiO2 Interface, Adv. Mater., 2008, 20, 1787.
18. M. Lotya et al., Liquid Phase Production of Graphene by Exfoliation of
Graphite in Surfactant/Water Solutions, J. Am. Chem. Soc., 2009, 131, 3611.
19. M. Lotya et al., High-concentration, surfactant-stabilized graphene
dispersions, ACS Nano, 2010, 4, 3155.
20. U. Khan et al., High-Concentration Solvent Exfoliation of Graphene, Small,
2010, 6, 864.
21. A. C. Ferrari et al., Raman Spectrum of Graphene and Graphene Layers, Phys.
Rev. Lett., 2006, 97, 187401.
22. R. J Smith et al., The importance of repulsive potential barriers for the
dispersion of graphene using surfactants, New Journal of Physics, 2010, 12,
125008.
23. U. Khan et al., Size selection of dispersed, exfoliated graphene flakes by
controlled centrifugation, Carbon, 2012, 50,470.
24. Y. Y. Wang et al., Raman Studies of Monolayer Graphene: The Substrate
Effect, J. Phys. Chem. C, 2008, 112, 10637.
25. L.M. Malard et al., Raman spectroscopy in graphene, Phys. Rev., 2009, 473,
51.
26. D. Graf et al., Spatially Resolved Raman Spectroscopy of Single- and
Few-Layer Graphene, Nano Lett., 2007, 7, 238.
27. A. Gupta et al., Raman Scattering from High-Frequency Phonons in
Supported n-Graphene Layer Films, Nano Lett., 2006, 6, 2667.
28. Z. H. Ni et al., Graphene Thickness Determination Using Reflection and
Contrast Spectroscopy, Nano Lett., 2007, 7, 2758.
29. K. Wang et al., Ni induced few-layer graphene growth at low temperature by
pulsed laser deposition, AIP Advances, 2011, 022141.
30. S. Berciaud et al., Probing the Intrinsic Properties of Exfoliated Graphene:
Raman Spectroscopy of Free-Standing Monolayers, Nano Lett., 2009, 9, 346.
31. A. C. Ferrari et al., Raman spectroscopy of graphene and graphite: Disorder,
electron–phonon coupling, doping and nonadiabatic effects, Solid State
Communications, 2007, 14347.

292
32. Y. Hernandez et al., High-yield production of graphene by liquid-phase
exfoliation of graphite, Nanotechnology, 2008, 3, 563.
33. P. N. Nirmalraj et al., Nanoscale Mapping of Electrical Resistivity and
Connectivity in Graphene Strips and Networks, Nano Lett., 2011, 11, 16.
34. P. E. Lyons et al., The relationship between network morphology and
conductivity in nanotube films, J. Appl. Phys., 2008, 104, 044302.
35. L. Gong et al., Interfacial Stress Transfer in a Graphene Monolayer
Nanocomposite, Adv. Mater., 2010, 22, 2694.
36. P. May et al., Approaching the theoretical limit for
reinforcing polymers with graphene, J. Mater. Chem., 2012, 22, 1278.
37. S. Horiuchi et al., Carbon Nanofilm with a New Structure and Property, Jpn J.
Appl. Phys. Lett., 2003, 42, L1073.
38. S. Lee et al., Wafer Scale Homogeneous Bilayer Graphene Films by Chemical
Vapor Deposition, Nano Lett., 2010, 10, 4702.
39. J. C. Meyer et al., The structure of suspended graphene sheets, Nature, 2007,
446, 60.
40. J. C. Meyer et al., On the roughness of single- and bi-layer graphene
membranes, Solid State Commun., 2007, 143, 101.
41. S. De et al., Flexible, transparent, conducting films of randomly stacked
graphene from surfactant-stabilized, oxide-free graphene dispersions, Small, 2010,
6, 458.
293
CHAPTER 8 General conclusions and future work
8.1 General conclusions
Aligned CNT arrays were successfully grown on oxidized silicon substrates
through an injection CVD method using ferrocene as catalyst and toluene as
carbon source. The non-covalent functionalization of CNTs was studied through
the adsorption of a library of aromatic Fmoc-AAs on both aligned CNT arrays
and randomly aligned CNT networks. The adsorption kinetics and equilibrium of
single Fmoc-AA species on the surface were measured using UV-Vis
spectroscopy. Among the Fmoc-AAs studied, Fmoc-Trp was found to have the
best affinity for CNTs by showing the highest equilibrium loading and initial
adsorption rate, whilst the non-aromatic control Fmoc-Gly showed the lowest
equilibrium loading. These results confirmed that the Fmoc group was an
efficient anchor, which could be improved by the addition of an aromatic amino
acid. The effect of the aromatic ligands on the affinity for CNTs was also
investigated employing BA as surfactant. The poorer affinity of BA for CNTs
compared with the Fmoc-AAs was possibly attributed to the lower degree of
aromaticity of the benzyl ring compared with that of the fluorenyl ring of the
Fmoc group. The fully reversible nature of the binding process was demonstrated
via the desorption of the Fmoc-AAs from CNTs’ surface in excess of water. The
equilibrium data were found to well follow the Freundlich isotherm model. Both
the higher binding energy and flat conformations of Fmoc-Trp on CNTs’ surface
contributed to the higher adsorption capacity compared with Fmoc-Gly. The
competitive binding from the library of Fmoc-AAs on graphite was developed
which efficiently identified Fmoc-Trp as the strongest binding candidate, leading
to a significantly different binding behavior compared with the individual
adsorption experiments. This approach provides an efficient way to screen a wide
range of binding candidates with similar binding energies simultaneously for the
strongest binder. A switchable surface chemistry was demonstrated to verify the
hypothesis that the Fmoc-AAs with a higher binding energy could displace those
294
with a lower binding energy from the surface. This study on the dynamic
interaction between these aromatic amino acid derivatives and CNTs not only
provides a step forward for their bioapplication where an effective and
well-studied interface is required but also pave the way towards the subsequent
utilization of these functionalized CNTs as templates for the production of hybrid
materials.
An in-situ sol-gel method was employed for the synthesis of CNT-SiO2 and
CNT-TiO2 nanohybrids using the Fmoc-AA functionalized CNTs as templates at
low temperature and neutral pH. Both SEM and TEM observation confirm the
formation of uniform SiO2 coating from TEOS on individual CNTs in the
presence of Fmoc-Trp and Fmoc-His. Fmoc-Tyr functionalized CNTs resulted in
a mixture of partially coated and uncoated CNTs due to the poorer affinity of
Fmoc-Tyr for CNTs as well as its weaker H-bonding interaction with the
hydrolyzed TEOS. A similar dependence of the degree of coating on the
Fmoc-AA structure was observed for coating CNTs with TiO2 from TBOT,
except for the case of Fmoc-Tyr which led to uniform coating of TiO2. The
morphology of the hybrids was found to be highly dependent on the CNT to
TBOT ratio and the modifier to CNT ratio. The coating of CNTs functionalized
with BA, as reported by Eder et al., was also studied. It was found that the TiO2
coating obtained on these BA functionalized CNTs was not as uniform as on the
Fmoc-AA functionalized nanotubes. This difference in coating was attributed to
the weaker π–π stacking interactions between BA and CNTs as a result of the
lower degree of aromaticity of the benzyl ring. The formation mechanism of the
SiO2 and TiO2 coating on the Fmoc-AAs functionalized CNTs was proposed. The
surface modifiers were believed to play a dual role: (1) To stabilize CNT
dispersion by acting as electrostatic surfactants. (2) To render the templates’
surface with the functionalities that catalyze silica and titania deposition.
Anatase TiO2 NTs were obtained after calcination of the CNT-TiO2 nanohybrids
as confirmed by XRD and ED analysis. Both the inner diameter and wall

295
thickness of the synthesized TiO2 NTs were found to be controlled by varying the
dimension of CNT templates and the ratio of CNT to TBOT. Factors including
heating temperature, pre-treatment and ramp rate were found to affect the phase
transformation from anatase to rutile. A simple route toward the production of
TiO2 NT arrays was also demonstrated using the CVD grown vertically aligned
CNT arrays as templates in the presence of the Fmoc-AAs. This method avoids
extended sonication which causes shortening of the tubes, therefore TiO2 NTs of
up to ~300 μm long were obtained which may benefit their application in
dye-sensitized solar cells. SEM analysis confirmed the good alignment of the
NTs in the arrays although the vertical alignment with respect to the substrate was
lost due to the wet-chemical techinique used. Such structures may be useful for
the development of electronic units.
Two populations of CNTs, one functionalized with Fmoc-His and the other with
Fmoc-Tyr which expose imidazole (hydrogen bonding) and hydroxyl
(nucleophilic) functionalities respectively were combined for the biomimetic
catalytic synthesis of silica and titania. SEM characterization revealed two
distinct assembled morphologies; bundled fibers and spherical aggregates which
were capable of catalyzing SiO2 and TiO2 deposition.
GO-TiO2 and GO-SiO2 nanohybrids have been synthesized via the sol-gel
process of TBOT and THEOS in the presence of GO aqueous dispersion at near
neutral pH and room temperature. Relatively uniform TiO2 coverage on
monolayer GO sheets was observed, with higher TBOT concentration leading to
significantly larger TiO2 nanoparticles. The direct condensation between the
hydroxyl groups of THEOS and the oxygenated functional groups on GO sheets
gives rise to uniform seeding thus smooth SiO2 coating on GO.
The synthesis of bwGO-TiO2 nanohybrids was successfully demonstrated using
Fmoc-Trp as surfactants in both aqueous solution and EtOH. The morphology of
the hybrids was found to be dependant on the reaction medium. The reaction in

296
EtOH resulted in the formation of more uniform hybrids with considerably
smaller TiO2 nanoparticles. Individually coated bwGO sheets were observed in
the presence of Fmoc-Trp, which stabilized the dispersion of bwGO during
coating process.
Graphene dispersions were obtained by direct exfoliation of graphite in Fmoc-Trp
solution. The concentration of the dispersion was found to increase with
sonication time and decrease with centrifuge speed. The dispersions were fairly
stable with moderate degree of sedimentation observed over a period of 1 week.
The degree of exfoliation and the quality of the exfoliated flakes was studied by
Raman spectroscopy which exhibited symmetric 2D bands. The 2D band position,
bandwidth and the I2D/IG ratio suggested that few layer graphene (<5 layers) were
dominating the dispersion. The statistical data for the ID/IG ratio and the flake size
measured based on TEM observation suggest that the defects introduced during
sonication were predominately associated with the new flake edges formed due to
sonication-induced cutting rather than the structural defects formed on the basal
plane. This implies that the sonication process is relatively non-destructive which
yields flakes with relatively good quality. The statistical data for the flake size
showed a broad distribution ranging from 0.02 to 0.89 μm2. AFM analysis of the
flakes revealed a typical thickness between 1.29 and 4.63 nm, proving their
multilayer nature. Together, the Raman, TEM and AFM analysis of the exfoliated
samples suggest that the dispersions predominately contain graphene flakes with
a thickness of less than 5 layers. Subsequently, graphene-TiO2 nanocomposites
and hybrids were produced in aqueous solution and EtOH respectively employing
the surfactant stabilized exfoliated graphene as templates. With reaction in
aqueous solution, well-exfoliated graphene flakes were uniformly embedded in
the TiO2 nanoparticle aggregates. Whilst with the reaction in EtOH, more
uniform coating of significantly smaller TiO2 nanoparticles on individual
multi-layer graphene were observed.
The noncovalent approach reported in this study allows the preservation of the

297
structures and properties of pristine CNTs and graphene in the hybrids.
Furthermore, the solution-based method facilitates the deposition or film-casting
of the nanocomposites and nanohybrids on a wide range of substrates, thus may
benefit potential applications such as in thin film technology 1.
Finally, a preliminary study on the silicification of Fmoc-Y and Fmoc-FY
self-assembled hydrogels was conducted. Both of the gels were successfully
prepared under physiological conditions through an enzyme triggered
dephosphorylation and found to template silica deposition. The presence of a high
density of -OH groups on the nanofibers’ surface was believed to promote the
deposition of silica.
8.2 Recommendation for future work
It would be interesting to investigate the effect of the number of binding sites on
the interaction with CNTs using a dynamic combinational library of AAs. For
instance, to compare the adsorption behavior of Fmoc-Trp with that of
Fmoc-Trp-Trp-Gly and Fmoc-Trp-Trp-Trp-Gly on CNTs.
The concentration of the graphene dispersion achieved in the present study is still
too low for many of the applications. It would be interesting to employ a 2 cycle
dispersion strategy which has been reported previously to give extremely high
concentration of (up to 28 mg/mL) dispersed graphene in NMP 2.
The electrical property of the produced aligned TiO2 NT arrays could be
evaluated for their potential as electrode materials in dye-sensitized solar cells
and for water splitting.
8.3 References 1. S. De et al., Flexible, transparent, conducting films of randomly stacked
graphene from surfactant-stabilized, oxide-free graphene dispersions, Small, 2010,

298
6, 458.
2. U. Khan et al., Solvent-exfoliated graphene at extremely high concentration,
Langmuir, 2011, 27, 9077.