thesis - defense technical information center · naval postgraduate school monterey, california...
TRANSCRIPT

NAVAL POSTGRADUATE SCHOOL Monterey, California
THESIS
Approved for public release; distribution is unlimited.
PERFORMANCE EVALUATION OF VOICE OVER INTERNET PROTOCOL
by
Chaiporn Dechjaroen
December 2002
Thesis Advisor: Geoffrey Xie Second Reader: Burt Lundy

THIS PAGE INTENTIONALLY LEFT BLANK

i
REPORT DOCUMENTATION PAGE Form Approved OMB No. 0704-0188 Public reporting burden for this collection of information is estimated to average 1 hour per response, including the time for reviewing instruction, searching existing data sources, gathering and maintaining the data needed, and completing and reviewing the collection of information. Send comments regarding this burden estimate or any other aspect of this collection of information, including suggestions for reducing this burden, to Washington headquarters Services, Directorate for Information Operations and Reports, 1215 Jefferson Davis Highway, Suite 1204, Arlington, VA 22202-4302, and to the Office of Management and Budget, Paperwork Reduction Project (0704-0188) Washington DC 20503. 1. AGENCY USE ONLY (Leave blank)
2. REPORT DATE December 2002
3. REPORT TYPE AND DATES COVERED Master’s Thesis
4. TITLE AND SUBTITLE: Performance Evaluation of Voice over Internet Protocol
6. AUTHOR(S) Chaiporn Dechjaroen
5. FUNDING NUMBERS
7. PERFORMING ORGANIZATION NAME(S) AND ADDRESS(ES) Naval Postgraduate School Monterey, CA 93943-5000
8. PERFORMING ORGANIZATION REPORT NUMBER
9. SPONSORING /MONITORING AGENCY NAME(S) AND ADDRESS(ES) N/A
10. SPONSORING/MONITORING AGENCY REPORT NUMBER
11. SUPPLEMENTARY NOTES The views expressed in this thesis are those of the author and do not reflect the official policy or position of the Department of Defense or the U.S. Government. 12a. DISTRIBUTION / AVAILABILITY STATEMENT Approved for public release; distribution is unlimited.
12b. DISTRIBUTION CODE
13. ABSTRACT Voice over Internet Protocol (VoIP) was developed to emulate toll services with lower communication cost. In VoIP applications, voices are digitized and packetized into small blocks. These voice blocks are encapsulated in a sequence of voice packets using the Real-time Transport Protocol (RTP) and delivered by the User Datagram Protocol (UDP). To help VoIP applications deal with unpredictable network performance, the Real-time Transport Control Protocol (RTCP) is developed to monitor the performance of RTP packets and provide feedback to the VoIP applications. The feedback on packet delay, jitter, and loss rate enables the applications to adapt to network conditions to maintain a certain level of voice quality. With this architecture, the quality of service of VoIP relies on the effectiveness of the RTCP network performance report mechanism. This research collects RTCP performance reports from live traffic over real networks and compares their values with the statistics derived from direct measurements of RTP packets to evaluate the effectiveness of RTCP. The live experiments were conducted on networks resembling respectively, Local Area Network (LAN), Wide Area Network (WAN), campus network, and encrypted wireless LAN. Results from these experiments show that RTCP is effective for low delay networks but RTCP performance reports can be inaccurate for networks with large, volatile delays.
15. NUMBER OF PAGES
97
14. SUBJECT TERMS VoIP, RTCP, MOS, Telephony, Performance Evaluation
16. PRICE CODE
17. SECURITY CLASSIFICATION OF REPORT
Unclassified
18. SECURITY CLASSIFICATION OF THIS PAGE
Unclassified
19. SECURITY CLASSIFICATION OF ABSTRACT
Unclassified
20. LIMITATION OF ABSTRACT
UL NSN 7540-01-280-5500 Standard Form 298 (Rev. 2-89) Prescribed by ANSI Std. 239-18

ii
THIS PAGE INTENTIONALLY LEFT BLANK

iii
Approved for public released; distribution is unlimited.
PERFORMANCE EVALUATION OF VOICE OVER INTERNET PROTOCOL
Chaiporn Dechjaroen
Major, Royal Thai Army B.S., Chulachomklao Royal Military Academy, Thailand, 1993
M.S., University of Illinois, 1996
Submitted in partial fulfillment of the requirements for the degree of
MASTER OF SCIENCE IN COMPUTER SCIENCE
from the
NAVAL POSTGRADUATE SCHOOL December 2002
Author: Chaiporn Dechjaroen
Approved by: Geoffrey Xie
Thesis Advisor Burt Lundy Second Reader Peter J. Denning Chairman, Department of Computer Science

iv
THIS PAGE INTENTIONALLY LEFT BLANK

v
ABSTRACT
Voice over Internet Protocol (VoIP) was developed to emulate toll services with
lower communication cost. In VoIP applications, voices are digitized and packetized into
small blocks. These voice blocks are encapsulated in a sequence of voice packets using
the Real-time Transport Protocol (RTP) and delivered by the User Datagram Protocol
(UDP). To help VoIP applications deal with unpredictable network performance, the
Real-time Transport Control Protocol (RTCP) is developed to monitor the performance
of RTP packets and provide feedback to the VoIP applications. The feedback on packet
delay, jitter, and loss rate enables the applications to adapt to network conditions to
maintain a certain level of voice quality. With this architecture, the quality of service of
VoIP relies on the effectiveness of the RTCP network performance report mechanism.
This research collects RTCP performance reports from live traffic over real
networks and compares their values with the statistics derived from direct measurements
of RTP packets to evaluate the effectiveness of RTCP. The live experiments were
conducted on networks resembling respectively, Local Area Network (LAN), Wide Area
Network (WAN), campus network, and encrypted wireless LAN. Results from these
experiments show that RTCP is effective for low delay networks but RTCP performance
reports can be inaccurate for networks with large, volatile delays.

vi
THIS PAGE INTENTIONALLY LEFT BLANK

vii
TABLE OF CONTENTS
I. INTRODUCTION.......................................................................................................1 A. INTERNET TELEPHONY BACKGROUND ..............................................1 B. TELEPHONY AND VOIP..............................................................................2 C. IP TELEPHONY APPLICATIONS ..............................................................3 D. QUALITY OF SERVICE................................................................................3 E. RESEARCH ON VOIP PERFORMANCE ANALYSIS..............................4 F. SCOPE OF THIS THESIS..............................................................................4 G. THESIS ORGANIZATION ............................................................................5
II. IP TELEPHONY OVERVIEW..................................................................................7 A. TELEPHONY STANDARDIZATION ..........................................................7 B. H.323..................................................................................................................7 C. H.323 COMPONENTS ....................................................................................8
1. Terminal................................................................................................8 2. Gateway.................................................................................................9 3. Gatekeeper..........................................................................................10 4. Multipoint Control Unit (MCU) .......................................................10
D. H.323 SPECIFICATION...............................................................................10 1. Audio Codec........................................................................................10 2. Video Codec........................................................................................11 3. H.225 Registration, Admission, and Status (RAS)..........................11 4. H.225 Call Signaling ..........................................................................11 5. H.245 Control Signaling ....................................................................11
E. PROTOCOL STACK....................................................................................11 F. CALL SEQUENCE .......................................................................................12 G. VOIP IMPLEMENTATION ........................................................................13
III. VOIP ARCHITECTURE..........................................................................................15 A. BASIC VOICE FLOW..................................................................................15 B. VOICE COMPRESSION..............................................................................16 C. VOICE PACKET FORMAT ........................................................................17 D. REAL-TIME TRANSPORT PROTOCOL (RTP) .....................................17 E. REAL-TIME TRANSPORT CONTROL PROTOCOL (RTCP) .............19 F. RTP AND RTCP PORT NUMBER .............................................................22 G. TRANSMISSION PRIORITY......................................................................22 H. ERROR CONTROL TECHNIQUE ............................................................24
1. Automatic Repeat reQuest (ARQ)....................................................24 2. Forward Error Correction (FEC) ....................................................24
IV. VOIP PERFORMANCE ...........................................................................................25 A. VOICE QUALITY.........................................................................................25 B. DELAY............................................................................................................27
1. Coder or Processing Delay ................................................................28

viii
2. Algorithmic Delay ..............................................................................29 3. Packetization or Accumulation Delay..............................................30 4. Serialization Delay .............................................................................31 5. Queuing/Buffering Delay...................................................................31 6. Network Switching Delay ..................................................................32
C. CLARITY .......................................................................................................32 1. Packet Loss .........................................................................................32 2. Jitter ....................................................................................................33 3. Codec...................................................................................................34 4. Noise ....................................................................................................34 5. Voice Activity Detector......................................................................34 6. Environment .......................................................................................35
D. ECHO..............................................................................................................35 E. PERFORMANCE CONTROL MECHANISM ..........................................36
1. Congestion...........................................................................................36 2. Packet Residency................................................................................36 3. Bandwidth Consumption...................................................................36 4. WAN Traffic Inconsistency...............................................................36
V. PERFORMANCE MEASUREMENT .....................................................................37 A. VQ MEASUREMENT...................................................................................37
1. Measuring Clarity ..............................................................................37 2. Measuring Delay ................................................................................38 3. Measuring Echo .................................................................................38
B. MEASUREMENT METHODS ....................................................................39 1. Measurement with Virtual Voice .....................................................39
a. Model Simulation....................................................................40 b. Direct Measurement................................................................40 c. Agent-based Measurement .....................................................40
2. Measurement with actual voice ........................................................41 a. Pre-recorded Voice..................................................................41 b. Live Conversation....................................................................42
3. Comparison of Performance Measurement Methods ....................42 C. MEASUREMENT OF DELAY....................................................................43
1. RTCP Time Information...................................................................43 2. Clock Synchronization.......................................................................44 3. Sampling Delay...................................................................................44 4. Per-packet Delay ................................................................................46
D. MEASUREMENT OF JITTER....................................................................48 E. MEASUREMENT OF PACKET LOSS ......................................................50 F. MEAN OPINION SCORE............................................................................50 G. E-MODEL.......................................................................................................51
1. R-Value ...............................................................................................52 2. Mapping Objective Score to Subjective Score ................................52
H. PREVIOUS RESEARCHES ON MOS AND E-MODEL..........................53 1. Codec...................................................................................................54

ix
2. Packet Loss .........................................................................................54 3. Delay....................................................................................................55 4. Combination of All Factors ...............................................................55
VI. EXPERIMENT DESIGN ..........................................................................................59 A. TEST MATRIX..............................................................................................59 B. TOOLS USED ................................................................................................60 C. TEST DESCRIPTION...................................................................................60 D. OVERALL TEST SCHEMA........................................................................62 E. WAN TEST CONFIGURATION.................................................................63
1. WAN Test............................................................................................63 2. NPS Firewall Issues............................................................................64 3. Test Configuration.............................................................................64
F. DATA ANALYSIS METHOD......................................................................66
VII. TEST RESULTS ........................................................................................................67 A. TEST RECORD.............................................................................................67 B. TEST SUMMARY.........................................................................................67 C. LAN TEST......................................................................................................67 D. CAMPUS TEST .............................................................................................71 E. WAN TEST.....................................................................................................74 F. WIRELESS TEST .........................................................................................78 G. MOS RESULT ...............................................................................................79
VIII. DATA ANALYSIS .....................................................................................................81 A. GENERAL......................................................................................................81 B. CLOCK...........................................................................................................81 C. LAN TEST......................................................................................................82 D. CAMPUS TEST .............................................................................................82 E. WAN TEST.....................................................................................................82 F. WIRELESS TEST .........................................................................................84 G. MOS.................................................................................................................84 H. RATIO OF RTP AND RTCP PACKETS ...................................................85
IX. SUMMARY................................................................................................................87 A. TEST SUMMARY.........................................................................................87 B. FUTURE WORK...........................................................................................87
GLOSSARY............................................................................................................................89
LIST OF REFERENCES ......................................................................................................91
BIBLIOGRAPHY..................................................................................................................95
INITIAL DISTRIBUTION LIST.........................................................................................97

x
THIS PAGE INTENTIONALLY LEFT BLANK

xi
LIST OF FIGURES Figure 1. H.323 Terminals on Packet Network. (From: Ref 8).........................................8 Figure 2. H.323 Components (From: Ref 8) .....................................................................9 Figure 3. Gateway (From: Ref 8) ......................................................................................9 Figure 4. H.323 interoperates with other H.32X Networks (From: Ref 8) .....................10 Figure 5. H.323 Call Sequence (From: Ref 9) ................................................................12 Figure 6. Branch Office Application (From : Ref 10).....................................................13 Figure 7. Interoffice Trunking Application (From: Ref 10)............................................14 Figure 8. Cellular Network Interoperability (From: Ref 10)...........................................14 Figure 9. Voice Flow (From: Ref 11)..............................................................................15 Figure 10. Codec Function in Router (From: Ref 11).......................................................15 Figure 11. Codec Function in PBX (From: Ref 11) ..........................................................15 Figure 12. Voice Packet ....................................................................................................17 Figure 13. RTP Packet.......................................................................................................18 Figure 14. RTCP Sender Report........................................................................................20 Figure 15. RTCP Receiver Report.....................................................................................20 Figure 16. Layer 2 Priority Setting (From: Ref 14) ..........................................................23 Figure 17. Layer 3 Priority Setting (From: Ref 14) ..........................................................23 Figure 18. FEC Data Stream Pattern.................................................................................24 Figure 19. Relationship of VQ Components (From: Ref 15) ............................................26 Figure 20. Delay Effect (From: Ref15) .............................................................................28 Figure 21. Voice Compression (From: Ref 11).................................................................29 Figure 22. Pipelining Nature (From: Ref 11) ....................................................................31 Figure 23. De-jitter Buffer Operation (From: Ref 11) ......................................................33 Figure 24. VAD Behavior (From: Ref 15) ........................................................................34 Figure 25. Relationship between Echo Level, Delay, and Perception (From: Ref15) ......35 Figure 26. RTP and NTP Timestamp................................................................................44 Figure 27. DLSR and Roundtrip Time ..............................................................................45 Figure 28. Clock Drift and Time Recorded.......................................................................47 Figure 29. Jitter Calculation..............................................................................................49 Figure 30. Mapping of R-value to MOS (From: Ref 28) ..................................................53 Figure 31. R-value and MOS with User Satisfaction (From: Ref 28)...............................53 Figure 32. R-value as Function of Consecutive Loss (From: Ref 31) ..............................54 Figure 33. R-value as Function of One-way Delay (From: Ref 31)..................................55 Figure 34. R-values as Function of Delay and Packet Loss (From: Ref 31).....................56 Figure 35. R-values as Function of Delay and Codec (From: Ref 31)..............................56 Figure 36. R-values as Function of Delay and Echo (From: Ref 32)................................57 Figure 37. Test Schema .....................................................................................................62 Figure 38. WAN Test Schema...........................................................................................63 Figure 39. LAN Test Result (1).........................................................................................68 Figure 40. LAN Test Result (2).........................................................................................68 Figure 41. LAN Test Result (3).........................................................................................69

xii
Figure 42. LAN Test Result (4).........................................................................................69 Figure 43. LAN Test Result (5).........................................................................................70 Figure 44. LAN Test Result (6).........................................................................................70 Figure 45. Campus Test Result (1)....................................................................................71 Figure 46. Campus Test Result (2)....................................................................................72 Figure 47. Campus Test Result (3)....................................................................................72 Figure 48. Campus Test Result (4)....................................................................................73 Figure 49. Campus Test Result (5)....................................................................................73 Figure 50. WAN Test Result (1) .......................................................................................74 Figure 51. WAN Test Result (2) .......................................................................................75 Figure 52. WAN Test Result (3) .......................................................................................75 Figure 53. WAN Test Result (4) .......................................................................................76 Figure 54. WAN Test Result (5) .......................................................................................76 Figure 55. WAN Test Result (6) .......................................................................................77 Figure 56. WAN Test Result (7) .......................................................................................77 Figure 57. Wireless Test Result (1) ...................................................................................78 Figure 58. Wireless Test Result (2) ...................................................................................78 Figure 59. RTCP Consistency...........................................................................................83 Figure 60. RTCP Accuracy ...............................................................................................84

xiii
LIST OF TABLES Table 1. Codec Comparison...........................................................................................17 Table 2. VoIP Packet Priority Classification (After: Ref 14) ........................................23 Table 3. VQ Components (From: Ref 15) .....................................................................26 Table 4. Delay Specifications (From: Ref 11) ...............................................................28 Table 5. Coder or Processing Delay (After: Ref 11)......................................................29 Table 6. Algorithmic Delay (From: Ref 11) ..................................................................30 Table 7. Packetization Delay..........................................................................................30 Table 8. Serialization Delay...........................................................................................31 Table 9. Comparison of VoIP Performance Measurement ............................................42 Table 10. Mean Opinion Score ........................................................................................51 Table 11. Codecs’ MOS and R-Value (After: Ref 30) ....................................................54 Table 12. Network Ports used by NetMeeting (After: Ref 33)........................................64 Table 13. Test MOS.........................................................................................................79

xiv
THIS PAGE INTENTIONALLY LEFT BLANK

xv
ACKNOWLEDGMENTS
I would like to appreciate Professor Geoffrey Xie for his advice and all
equipments used in this research. I also thank the following students in the SAAM
research group for helping me conduct the tests: Valter Monterio and Matt Braun.
Finally, I appreciate the assist from the Casanova Team to allow me to perform a test
with the Linux server: Phuwadol Udomsilp, Thoetsak Jaiaree, and Seksrit Siripala.

xvi
THIS PAGE INTENTIONALLY LEFT BLANK

1
I. INTRODUCTION
During the last half decade, the computer communication business has been in an
era of a technological revo lution. Numerous new network applications were invented as a
result of the explosive growth of the Internet, especially those designed based on the
Internet Protocol (IP). The vast popularity of the Internet causes the total volume of
packet-based network traffic to exceed that of the traditional, circuit-switched voice
traffic [Ref 1]. To take advantage of the more efficient packet-switching technology, the
service providers have also been developing products to provide voice transmission
service over data networks like the Internet.
A. INTERNET TELEPHONY BACKGROUND
The first IP Telephony software was introduced in 1995. VocalTec Inc. [Ref. 2]
launched its multimedia PC-based product, the Internet Phone, to allow users to speak
into PC microphones and listen on PC speakers. It was a significant development in
computer technology to transport voice over packet networks. The PC-to-PC Internet
Phone software worked very well.
After entering the market, IP telephony has rapidly attracted global attention. This
technology has been improved to make the inter-networking conversation process easier
with better quality. Many Information Technology (IT) and telecommunication
companies have developed their own products to participate in this new market. With the
ability of these products to send all voice data over packet switching networks, a new era
of low-cost long distance voice communication has been started.
In 1996, the first IP telephony gateway was produced [Ref.2]. The emergence of
gateway servers was the key to bringing IP telephony to widespread uses. These
gateways act as an interface between Public Switching Telephone Networks (PSTN) and
the Internet. They facilitate the integration of the two types of networks, allowing voice
and data to travel on the same path of an integrated network. With the gateways, the users
can use standard phones for IP telephony. Other components that were developed are
gatekeepers, voice servers, trunking networks, and billing managers. Nowadays,
numerous IP telephony-related products are available in the marketplace.

2
Since IP telephony is in its infancy with a lot of room to grow, it is expected to
have an amazing future. According to an Allied Business Intelligence study in 2001, the
industry value of world telephony networks will be tripled by 2006 [Ref 3]. Voice
communication is expected to have a tremendous market size. The estimated global voice
market was already approximately 600 billion US dollars in 2000 [Ref 4]. The key
consideration is that VoIP is approximately 27 times cheaper than PSTN service [Ref 4].
Most service providers and large organizations move into VoIP to realize the cost benefit
and the opportunity for deployment of multimedia applications that integrate audio, video
and data. This integration cannot be offered by PSTN as efficiently. Some industry
analysts estimate that VoIP represents roughly 13 percent of the global voice traffic for
2002. This echoes a Department of Commerce report which puts the VoIP global market
scale at $63 billion [Ref 4].
Even though the market is heading towards the implementation of IP telephony,
this technology has not achieved the same quality criteria as the regular telephony. Many
problems in the areas of interoperability and standardization still exist. Thus, IP
telephony has a long journey before it reaches maturity.
B. TELEPHONY AND VOIP
The previously mentioned terminology “IP Telephony” sometimes is called
“Internet Telephony” because it can be deployed on the Internet by using IP protocol
stack. Most people use these terms interchangeably with “VoIP”, short for Voice over
Internet Protocol. However, their underlying technologies are not exactly the same. They
can be operated in different types of networks and provided at different service levels.
Internet Telephony consists of three types of voice services operated over the
public Internet: PC-to-PC, PC-to-Phone, and Phone-to-Phone. Telephony can integrate
other multimedia modes such as video and data into the specific applications. The
protocol, VoIP, is mentioned most frequently when the voice traffic is communicated
over managed intranet and extranets of enterprises, and from these enterprise networks to
the Internet as quality of service improves [Ref 5]. Based on these slightly different
definitions, VoIP seems to provide the better voice quality since it is typically deployed
on a dedicated and controllable network. However, both terms are currently used
interchangeably in general academic papers.

3
C. IP TELEPHONY APPLICATIONS
With the ability to converge voice network and data network to form a single
multimedia network, VoIP technology minimizes the distinction between voice and data
transfer. This technology is designed to run on many networks but the IP-based networks,
especially the Internet, are quite popular for most applications. Today VoIP has become
an accepted and proven technical solution for voice transmission in the commercial
environment. The ability to integrate voice, fax, and data into a single communication
pipeline offers a tremendous opportunity for most organizations to reduce their
communication expenses. Moreover, the integration of voice and data allows users to talk
and control multimedia applications, i.e., exchanging data and images in the same
session.
In the current market, there are many telephony applications for business
enterprises. It can be used to automate the access to information and process the
applications, e.g., audio-text, fax on demand, interactive voice response, interactive fax
response, and simultaneous voice and data. Moreover, telephony can increase the
efficiency of customer service in a message handling system, e.g., voice mail, fax server,
paging, unified messaging, and email reader.
Telephony can also automate the connection services among business entities.
These applications include contact center and help desk automation, call back services,
operator services, conferencing, telemarketing, and predictive/auto dialing. The
interesting products used in telephone companies consist of cellular telephony, voice
dialing, directory assistance, reverse yellow pages, payphone message forwarding, fax
mailbox, line conversion, and alternate operator services. These products can also be
adapted for uses in military applications.
D. QUALITY OF SERVICE
Network administrators face a new challenge with VoIP because they need to
deploy and manage a solution to find and allocate network capacity to VoIP applications.
Some of the networks that VoIP can be deployed are broadband, WAN, Intranet, Internet,
and even wireless networks. Currently, due to congestions caused by heavy contentions
for the Internet bandwidth, the benefit of VoIP on public networks is not fully realized as
in a corporate network. Some performance degradation can be expected especially during

4
a network congestion period. However, this cost- free communication is still gaining
popularity.
In VoIP applications, voices are digitized by voice-processing cards and encoded
into a bit stream format. Voice data then are wrapped up into a sequence of packets using
the Real-time Transport Protocol (RTP) and delivered using the User Datagram Protocol
(UDP) in the transport layer. Each voice packet is routed through the network using IP
until it reaches the destination terminal. The terminal detects voice packets, decodes the
bit stream into waveforms, and sends the waveforms to the speakers or other devices.
With this architecture, the QoS of a VoIP application therefore largely depends on
the quality of the underlying network service. In particular, network congestions may
cause large packet delays and a high packet loss rate, resulting in voice distortion, such as
error voice tone, clipping speech, and artificial silence gap.
E. RESEARCH ON VOIP PERFORMANCE ANALYSIS
The early research on VoIP focused on the development of a protocol architecture
to integrate with PSTN and mobile/cellular networks, and interoperability between
different vendors and QoS capabilities. Many VoIP quality studies were to test voice
models on network simulators while others used simulated voice on an actual network.
However, not much research has been done with real data collected from public data
networks.
The performance results of VoIP on existing data networks were compared with
voice quality on circuit-switched system to determine the feasibility of voice application
development for those networks.
F. SCOPE OF THIS THESIS
This thesis measures and evaluates the performance of the Real-time Transport
Control Protocol (RTCP), which is used to control VoIP applications on public data
networks. Microsoft NetMeeting is used in this experiment to generate voice traffic. Tests
are conducted on the NPS campus network and the public Internet.
Moreover, this research discusses the suitability of the NPS backbone for VoIP
deployment, which may be considered in the future to reduce communication cost and

5
promote multimedia communication in an academic environment. A VoIP performance
measurement on a local Ethernet is used as the baseline for performance comparison.
Furthermore, this research evaluates the delay effect of data encryption when
VoIP is used on laptops via a mobile network. The Wired Equivalent Privacy (WEP)
option of IEEE 802.11 is used in the study.
In all tests, public-domain tools such as Ethereal and WinPCap are used to capture
voice packets. Performance statistics are calculated and analyzed using Microsoft Excel
macros.
G. THESIS ORGANIZATION
This thesis is divided into several chapters.
• Chapter II describes the overview of IP Telephony.
• Chapter III explains the design of voice packet.
• Chapter IV discusses the performance factors
• Chapter V discusses the performance measurement of VoIP.
• Chapter VI explains the experiment.
• Chapter VII illustrates the results of data collection.
• Chapter VIII analyzes the data
• Chapter IX summarizes the results obtained and provides some recommendations for future work.

6
THIS PAGE INTENTIONALLY LEFT BLANK

7
II. IP TELEPHONY OVERVIEW
The primary function of IP Telephony is to record and packetize speech into
series of voice packets, then transmit them through the networks and release the entire
speech to the listener with acceptable delays. This chapter explains the architecture of this
technology and the relevant technical standards.
A. TELEPHONY STANDARDIZATION
As previously mentioned, IP telephony technology is still immature. Several
organizations are developing their own standards to serve the industry requirements and
some vendors are still using their proprietary design. However, most vendors tend to
support the approved standards to allow interoperability.
Currently, the first and most commonly-adopted standard of telephony is the
International Telecommunication Union - Telecommunication Standardization Sector
(ITU-T) Recommendation H.323 [Ref 6]. This standard is designed for multimedia
communication systems including voice applications. This standard of telephony, H.323,
was originally created in 1996, and the complete standard on version 4 was released in
November 2000. The advantages of this standard are that it is now completely open-
source with GUI and that it can operate on any operating systems [Ref 7].
A standard developed by the Internet Engineering Task Force (IETF) is the
Session Initiation Protocol (SIP). It addresses some drawbacks of H.323. The SIP offers
less complexity and provides more flexibility. The latest SIP standard is released in RFC
3261 posted in July, 2002. All new VoIP application designs support H.323 or both
H.323 and SIP. As SIP is a relatively new standard, in this chapter, H.323 is presented as
the main telephony architecture.
B. H.323
The ITU-T designed H.323 to be part of the H.32X recommendation family [Ref
8], so it can work with other standards for different networks as following:.
• H.324 over switched circuit network (SCN) and wireless network
• H.320 over integrated services digital networks (ISDN)

8
• H.321 and H.310 over broadband ISDN (B-ISDN)
• H.322 over LAN with guaranteed QoS
The H.323 standard specifies the technical requirements - such as components,
protocols, and procedures - for packet-based multimedia communication systems,
including real- time audio, video, and data communications. It covers all applications
deployed on IP-based and IPX-based (Internet packet exchange) networks, i.e., local area
networks (LAN), enterprise networks (EN), wide area networks (WAN), metropolitan
area networks (MAN), and Internets. The H.323 is designed for different mixes of data
types: audio only (IP telephony), audio-video (video-telephony), audio-data, and audio-
video-data. This design also supports multipoint multimedia communications.
Figure 1. H.323 Terminals on Packet Network. (From: Ref 8)
C. H.323 COMPONENTS
The H.323 incorporates four main components: terminal, gateway, gatekeeper,
and a multipoint control unit (MCU) [Ref 8]. Their interaction is illustrated in Figure 2. If
all components are located in the same area, with only one gatekeeper, they are
considered to be in the same H.323 zone.
1. Terminal
An H.323 terminal can be either a personal computer or any standalone device
running an H.323 protocol stack and multimedia applications. The required basic service
is audio communications, while video or data service is optional. Since the primary goal
of this standard is to interoperate with other multimedia terminals, the H.323 terminal can

9
talk to all terminals in the H.32X family. The terminal also supports multipoint
conferences.
Figure 2. H.323 Components (From: Ref 8)
2. Gateway
To interconnect heterogeneous systems, a gateway is introduced for binding
H.323 networks and non-H.323 networks. Normally the gateway is used to link H.323
terminals to PSTN. It also provides translating protocols for call setup and release,
converts media format, and transfers information. However, a gateway is not always
required within an H.323 region.
Figure 3. Gateway (From: Ref 8)

10
3. Gatekeeper
The gatekeeper is designed to be a control center of all calls in an H.323 network.
It performs many important tasks such as addressing, authorizing and authenticating of
terminals and gateways, bandwidth management, accounting, billing, charging, and call-
routing services. A gatekeeper is not required if these services are not needed.
4. Multipoint Control Unit (MCU)
For multi-party communication with at least three terminals, the MCU is required.
All terminals connect with the MCU, which serves as a central point of the conference. It
checks and manages the conference resources, negotiates between terminals to determine
codec type, and handles the media streams.
All four components are logically separate, but they can be implemented on the
same device.
Figure 4. H.323 interoperates with other H.32X Networks (From: Ref 8)
D. H.323 SPECIFICATION
The H.323 recommendation specifies several protocols for multimedia
communication processing and controlling. [Ref 8]
1. Audio Codec
The audio codec encodes voice signals from the sender’s microphone into packets
and at the receiver decodes these packets to reproduce the voice signals for playout by the

11
receiver’s speakers. Each terminal must support at least one default audio codec, G.711.
Additional codecs like G.722, G.723.1, G.728, and G.729 may be provided.
2. Video Codec
The video codec encodes video signals from the sender’s camera into packets and
at the receiver decodes these packets to reproduce the video signals for display on the
receiver’s monitor. In H.323, this codec is optional. The video codec specification is
defined in the H.261 recommendation.
3. H.225 Registration, Admission, and Status (RAS)
In H.225, RAS is used to establish some management functions between
endpoints (terminals and gateways). Its responsibilities include registration, admission
control, bandwidth change, status, and a disengage procedure between endpoints and
gatekeepers. The messages of RAS are exchanged via an RAS channel which is the
signaling channel connecting between endpoints.
4. H.225 Call Signaling
A connection between two H.323 endpoints is established by exchanging H.225
messages on the call signaling channel. This channel is opened between an endpoint and
the gatekeeper.
5. H.245 Control Signaling
The end-to-end control messages managing the operation of all endpoints are
exchanged with H.245 control signaling. The control messages encapsulate the
information on capability exchange, logical channel opening and closing, flow control,
and command and indication.
E. PROTOCOL STACK
The voice protocol suit is designed to support packet transmission behavior
requirement. Since VoIP tries to emulate regular speech communication on PSTN, the
interactive communication quality is the key consideration that distinguishes voice from
data packet. On a traditional data network, data packets are loss-sensitive and delay-
tolerant. On the other hand, voice packets are loss-tolerant and delay-sensitive. As a
result, the transport layer in the VoIP protocol stack is implemented with UDP to carry
voice instead of TCP. However, TCP is still used to carry signaling messages, such as
call establishment and capability exchange.

12
Moreover, as voice communication requires real-time interactions, RTP is used on
top of UDP to deliver end-to-end services. The RTP is designed for real-time applications
and to provide payload type identification, sequence numbering, timestamp, and delivery
monitoring.
Real-time Transport Control Protocol (RTCP) serves as a control counterpart of
the RTP operation. This protocol reports the data distribution quality periodically in the
form of sender and receiver reports. The RTP source can also use RTCP to help its
receiver synchronize audio and video input.
In addition, Resource reSerVation Protocol (RSVP) is implemented in routing
devices to set up and maintain a suitable transmission path for each communication. This
can improve the transmission quality by avoiding congested links.
F. CALL SEQUENCE
The ITU incorporates H.323 with its T.120 data-conferencing standard. The call
sequence consists of three steps and messages that are delivered over two transport layer
protocols. The TCP is first used to setup call establishment with Q.931 and to exchange
capability with H.245 messages. Then UDP is used to carry RTP and RTCP payloads
after the communication pipeline is opened between the endpoints. The call sequence is
illustrated in the following figure.
Figure 5. H.323 Call Sequence (From: Ref 9)

13
G. VOIP IMPLEMENTATION
A wide variety of IP Telephony applications used in the corporate networks is
normally called VoIP. Some of these applications are discussed here to give a general
idea of how voice packets practically move around corporate units located in different
areas. [Ref 10]
The first application is for large companies with many branch offices. The packet
network used for standard data transmission is enhanced to carry voice traffic along with
data. Voice traffic should be compressed to save bandwidth. The inter-working function
(IWF), which is the physical implementation of hardware and software, allows the mixed
voice-data traffic to access the packet network. In this case, the IWF must support analog
interfaces that directly connect to telephones. The IWF has two responsibilities; it works
as a private branch exchange (PBX) at branches and it behaves like a telephony terminal
at home office as demonstrated in this architecture.
Figure 6. Branch Office Application (From : Ref 10)
The next usage of VoIP is a trunking application. The packet network, installed
between remote offices, completely replaces the original telephone lines being used to
link the PBXs. Voice and data traffic volume is higher than the branch office scenario;
therefore, the IWF must support a larger capacity digital channel, such as T1/E1

14
interfaces. The IWF also emulates the PBX signaling responsibilities. Figure 7 displays
this scenario.
Figure 7. Interoffice Trunking Application (From: Ref 10)
Furthermore, VoIP can interoperate with cellular networks as shown in Figure 8.
In a digital cellular network, voice is already compressed and packetized by the cellular
phones. The voice network then transmits these packets to destinations. Finally, IWF
performs the transcoding to convert the cellular voice data to PSTN voice format.
Figure 8. Cellular Network Interoperability (From: Ref 10)

15
III. VOIP ARCHITECTURE
A. BASIC VOICE FLOW
Based on the current VoIP architecture, voice is digitized using pulse code
modulation (PCM) by a voice codec. Then the PCM samples are compressed and packed
into IP packets for transmission. The number of samples packed into one packet can be
customized. At the receiver side, the samples are decompressed and converted back to
analog signal in the reverse order. This flow of voice data is illustrated in Figure 9. [Ref
11]
Figure 9. Voice Flow (From: Ref 11)
Figure 10. Codec Function in Router (From: Ref 11)
Figure 11. Codec Function in PBX (From: Ref 11)

16
In an analog voice system without a digital PBX, a router serves as codec and
compressor as shown in Figure 10. If a digital PBX is installed, the PBX is responsible
for codec function and the router processes only the compressor task as shown in Figure
11.
B. VOICE COMPRESSION
The router can use a variety of compression algorithms depending on the network
capacity and application specifics. Some prevailing compression techniques, standardized
for telephony and voice packets by ITU-T G.-series, are listed below: [Ref 12]
G.711 Pulse Code Modulation (PCM)
G.723.1 Multi Purpose Maximum Likelihood Quantization (MP-MLQ) and
Multi Purpose Algebraic Code Excited Linear Prediction (MP-ACELP)
G.726 Adaptive Differential Pulse Code Modulation (AD-PCM)
G.728 Loy Delay Code Excited Linear Prediction (LD-CELP)
G.729 Conjugate Structure Code Excited Linear Prediction (CS-ACELP)
The group of voice samples carried in each packet is called a block. The size of
each block period is measured by the amount of time it takes to collect all samples for
one block. The typical block periods are 10, 20, or 30 milliseconds. Meanwhile, the byte
size of each voice block depends on the coding used and varies from 80 to 240 bytes.
The collected voice block in PCM signaling format is sampled at 8 kHz with 8
bits per sample. This results in a data rate of 64 kbps. However, each codec collects voice
blocks with different time intervals, so the pre-compressed block size is different.
Moreover, each algorithm uses a different compression ratio for different voice quality.
This results in a different bandwidth requirement. Table 1 presents the characteristics of
each compression technique. The detail of compression characteristic such as block size
and block interval is discussed in Chapter 4.

17
Table 1. Codec Comparison
Coder Voice Block Size (bytes)
Compression Ratio
Bit Rate (kbps)
G.711 80 1:1 64.0 G.723.1 MP-MLQ 240 10:1 6.3 MP-ACELP 240 12:1 5.3 G.726 80 2:1 32.0 G.728 80 4:1 16.0 G.729A 80 8:1 8.0
Among various compression algorithms, ITU, in 1995, recommended G.729 for
audio codecs. However, in 1997, the VoIP Forum voted to recommend the G.723.1
specification as the industry standard. Moreover, the industry consortium, led by Intel
and Microsoft, agreed to use G.723.1. They decided to lower voice quality to gain more
bandwidth efficiency (G.723.1 requires 6.3 kbps, while G.729 requires 7.9 kbps) [Ref 9].
Currently G.723.1 is the most adopted codec in VoIP applications.
C. VOICE PACKET FORMAT
After being compressed, voice samples are ready for transmission. They are
encapsulated with the RTP header, UDP header, and IP header, before passed down to
the link layer. The link layer header size varies according to the media type. The size of a
typical IP-UDP-RTP header combo is 40 bytes as shown in the format shown in Figure
12.
Link Header
IP Header
UDP Header
RTP Header
Voice Payload
X bytes 20 bytes 8 bytes 12 bytes X bytes Figure 12. Voice Packet
D. REAL-TIME TRANSPORT PROTOCOL (RTP)
RTP, as defined in RFC 1889 [Ref 13], is designed to support the transport of
real-time media over packet networks. According to its intrinsic behavior, some packets
can be lost, delayed, and reordered. For loss detection, RTP provides timing information
so that the receiver can understand the original voice pattern and correctly handle jitter.

18
However, RTP does not reserve resources in the network to avoid packet loss and jitter.
As a result, RSVP is often used by an RTP application. The RTP packet format is shown
in Figure 13.
2 1 1 4 1 7 16
V P X CC M PT Sequence Number
V Version 2P PaddingX ExtensionCC CRSC CountM MarkerPT Payload Type (voice, video, compression, etc)
Timestamp
Synchronization Source Identifier (SSRC)
Contributing Source Identfier (CSRC)
Figure 13. RTP Packet
This packet format is designed for any multimedia payload. In IP telephony
application, the following parameters are used:
• “Payload type” identifies the media application (mode) since each mode
uses different coding and delay threshold.
• “Sequence number” is initially assigned with a random positive integer
value and incremented by one for each RTP data packet sent. Thus this
field may be used by the receiver to detect packet loss and reordering in
the data stream.
• “Timestamp” represents the sampling instant of the first octet in the RTP
data packet. It can be used by the receiver to measure delay and jitter and
adaptively determine the playout buffer size. Typically, the RTP
timestamp is assigned a random value initially and incremented by one
after each sampling period.

19
• “Synchronized Source ID” (SSRC) is useful when the communication is
for a multiparty conference, in which it uniquely represents the persistent
indicator of each participant.
E. REAL-TIME TRANSPORT CONTROL PROTOCOL (RTCP)
Also being defined in RFC 1889 [Ref 13], RTCP is a counterpart control protocol
of RTP. It provides the network traffic status information to all participants in session.
The transmission mechanism of RTCP is different from that of RTP. Since RTP packets
are sent out every block interval. For example, An VoIP source using G.723.1 standard
sends out voice packets every 30 milliseconds. On the other hand, RTCP packets are sent
approximatly every 5 seconds. While RTP messages can be sent either unicast or
multicast, RTCP messages are sent from each participant (sender or receiver) in the
communication session to all other hosts in that particular session. Hosts can recognize
each other based on the source identifier (SSRC).
The information provided inside RTCP messages can be used to evaluate the
performance of the associated real-time continuous media application because RTCP
indirectly reports the quality of service in the network. Each report block is sent with the
collective management information, such as the latest sequence number received, the
number of missing packets, and jitter. However, RFC 1889 does not specify how to use
these values.
The specification of RTCP defines five message types to carry the control
information: sender report, receiver report, source description, ending, and application
specific function. Two most likely used messages are sender report (SR) and receiver
report (RR). The SR message is sent from a transmission source, while RR is sent from a
receiver in an RTP session. These two RTCP packet formats are displayed in the Figure
14 and 15.

20
Figure 14. RTCP Sender Report
Figure 15. RTCP Receiver Report
These two messages provide important information for a VoIP control
mechanism. In the sender section, the report contains these pertinent parameters:
2 1 5 8 16V=2 P RC PT=SR=201 Length Header
Report Block 1
ReportBlock 2
V Version 2 RC RC Reception Report CountP Padding PT Packet Type
SSRC of Packet Sender
SSRC_1 (SSRC of first source)Fraction lost Cumulative number of packet lost
Extended highest sequence number received
…
Interarrival jitterLast SR (LSR) timestamp
Delay since last LSR (DLSR) timestamp
SSRC_2 (Source of second source)
2 1 5 8 16V=2 P RC PT=SR=200 Length Header
SenderInfo
Report Block 1
ReportBlock 2
V Version 2 RC RC Reception Report CountP Padding PT Packet Type
RTP TimestampSender's Packet CountSender's Octet Count
SSRC of Sender
NTP Timestamp, most significant wordNTP Timestamp, least significant word
SSRC_1 (SSRC of first source)Fraction lost Cumulative number of packet lost
SSRC_2 (Source of second source)…
Extended highest sequence number receivedInterarrival jitter
Last SR (LSR) timestampDelay since last LSR (DLSR) timestamp

21
• “NTP timestamp” represents the local time when the SR message was
sent. This timestamp uses the format of the Network Time Protocol
(NTP).
• “Sender’s packet count” gives the total cumulative number of RTP packets
sent from this host since the session starts. It counts until this SR is
written. Therefore, the difference of this number in two SR messages is
the expected number of RTP packets that the destination terminal should
receive during the time period between the SR generations.
• “Sender’s octet count” indicates the total cumulative number of RTP
payload bytes sent since the session began.
• “RTP timestamp” corresponds to the same time as the NTP timestamp
described above, but it is in the unit of sampling count.
The receiver report section provides these following values for each source
(SSRC_1, SSRC_2, etc.):
• “Highest sequence number received” is derived from all arrived packets.
The difference of this number in two RRs equals the total number of
packets received from the source during the time period between the RR
generations.
• “Cumulative number of packet lost” is determined from the total number
of successfully arrived packets since the start of that session. However,
this total does not exclude late or duplicated packets. The total number of
transmitted packets (equaling highest sequence number received less
initial sequence number) subtracted by the total number of received
packets gives the cumulative number of packet losses for the source. If the
number is negative, this field is set to zero.
• “Inter-arrival jitter” is reported in RTP timestamp unit. This is not the pure
jitter but formulated with the cumulative jitter value.

22
• “Last SR timestamp” is extracted from the middle 32 bits of NTP
timestamp (total 64 bits) in the last SR packet sent by the source.
• “Delay since last LSR” is the calculated elapsed time since the last SR
message is received from the source. This value can be used by the source
to determine a roundtrip delay sample.
F. RTP AND RTCP PORT NUMBER
As stated in RFC 1889, RTP and RTCP use the random contiguous port number
scheme. Both use UDP as transport. Each media type separately uses a pair of adjacent
UDP ports (2n, 2n+1). The RTP occupies the lower even number (2n) while RTCP uses
the higher odd number (2n+1).
G. TRANSMISSION PRIORITY
In the current IP-based network, traffic by default is routed with a best-effort
scheme. To expedite the transmission, VoIP packets should be prioritized for a higher
level of service in layers 2 and 3. Currently, classification tools may be used to mark a
packet or flow with a specific treatment at the network switching device.
Cisco VoIP design [Ref 14] puts the traffic classification at the network edge,
normally at the wiring closet or within the IP phone or voice endpoint. Two packet-
classifications in separate layers are implemented in Cisco equipment.
• Layer 2 Class of Service (CoS) : Use the priority bit of the 802.1p portion
in 802.1Q header as illustrated in the Figure 16.
• Layer 3 Type of Service (ToS) : Use the IP precedence of Differentiate
Service Code Point (DSCP) inside Type of Service field in the IPv4
header as shown in Figure 17.

23
802.1p
802.1Q Header
Figure 16. Layer 2 Priority Setting (From: Ref 14)
Figure 17. Layer 3 Priority Setting (From: Ref 14)
All IP phone RTP and RTCP packets are tagged with separate values summarized
in Table 2. However for this method to work, the on-route IP devices must support DSCP
priority scheme.
Table 2. VoIP Packet Priority Classification (After: Ref 14)
Layer 3 ToS Layer 2 CoS Packet Condition IP Precedence ToS Bits DSCP
Cisco Recommend
CoS 0 Routine 0 000 xxx 00 0-7 CoS 1 Priority 1 001 xxx 00 8-15 CoS 2 Immediate 2 010 xxx 00 16-23 CoS 3 Flash 3 011 xxx 00 24-31 RTCP CoS 4 Flash-override 4 100 xxx 00 32-39 CoS 5 Critical 5 101 xxx 00 40-47 RTP CoS 6 Internet 6 110 xxx 00 48-55 CoS 7 Network 7 111 xxx 00 56-63

24
Cisco plans to use the DSCP value of Expedited Forwarding (EF) for voice
packets and DSCP value of Assured Forwarding 31 (AF31) for control traffic.
H. ERROR CONTROL TECHNIQUE
When transmitting voice packets over the network, the transmissions may suffer
from packet loss, delay, jitter, bit error, and burst error. These problems may be
addressed with packet loss control and/or error control. Packet loss control methods like
RSVP cannot guarantee complete loss- free delivery, but they try to manage the routing
devices to anticipate and serve the needs of the designated flow as much as possible. On
the other hand, an error control method reacts to packet loss and error and attempts to
recover at the receiver. [Ref 17]
Error control methods can be categorized into two types: ARQ and FEC.
1. Automatic Repeat reQuest (ARQ)
This technique automatically retransmits lost or impaired packets when the
receiver discovers such problems in the data stream. Therefore the error control is
transparent to the application layer. However, if voice packets are retransmitted, the delay
and jitter might increase significantly. Thus, it is not appropriate for interactive real-time
applications.
2. Forward Error Correction (FEC)
This method sends enough redundant information so that the application can
reconstruct the original data even if some packets are lost. For example, multiple copies
of voice packet “n” can be duplicated and sent along with packet n+1, n+1,…, and n+k,
where k is the total number of redundant packets, no retransmission is required. The
packet loss rate, delay, and jitter are lower than ARQ. However, the bandwidth efficiency
is lower. Figure 18 shows the frame pattern. [Ref 17]
Packets
Pi Di-N+1 Di-N+2 Di-N+3 Di-N+4 .. Di
Pi+1 Di-N+2 Di-N+3 Di-N+4 Di Di+1
Pi+2 Di-N+3 Di-N+4 Di Di+1 Di+2
Pi+3 Di-N+4 Di Di+1 Di+2 Di+3 Figure 18. FEC Data Stream Pattern

25
IV. VOIP PERFORMANCE
Since VoIP is designed to emulate the toll services, the quality of packetized
voice is the key concern. In the existing environment, the public networks cannot
guarantee VoIP reliability and sound quality like the PSTN communication due to the
limitation on network bandwidth. To determine the performance of VoIP, several factors
should be considered. - especifically delay, jitter, packet loss, and echo. This chapeter
discusses these factors and the source of voice degradation.
A. VOICE QUALITY
The quality of speech can be considered as a measure for fidelity of speech,
intelligibility of speech, or the reliability of designed transport mechanism. The
International Engineering Consortium (IEC) [Ref 15] defines Voice Quality (VQ) as the
qualitative and quantitative measures of the sound and conversation quality of a
telephone call. Its technical papers also discuss some characteristics of VQ which are
summarized in this chapter.
The quality of voice should be evaluated from the perspective of end-to-end users.
The interactive partners should report their experience without dealing with hardware
equipment and transmission method. However, this perceptive quality is based on the
users’ expectation, context, physiology, and mood. These factors then make VQ highly
subjective and difficult to evaluate. As a result, IEC explains the evaluation of VQ by
comparing VoIP with the PSTN in order to cover all aspects in toll systems.
In any communication systems, the voice transmission is characterized by three
basic quality components - service, sound, and conversation - in which each component
somewhat relates to others. Service quality depends on the service provider’s business
strategy and slightly involves the technical aspect of network performance including
network device operation. The other two components, sound and conversation quality,
relate to the network deployment performance. These components are summarized in
Table 3.

26
Table 3. VQ Components (From: Ref 15)
Service Quality Sound Quality Conversation Quality • offered services • availability in any area • network availability - no
downtime, busy signal • reliability • price
• loudness • distortion • noise • fading • crosstalk
• loudness distortion noise • fading • crosstalk • echo • end-to-end delay • silence suppression
performance • echo cancellation
performance
According to the definition of VQ, there are three primary factors influencing VQ
of VoIP application. The first factor is the clarity which is normally intepreted as the
fidelity, clearness, lack of distortion, and intelligibility of voice signal. The next factor is
the end-to-end delay and the. last factor is echo. The intregation of these three quality
aspects represents the entire VQ as shown in the three-dimensional graph in Figure 19.
The relationship among each component presents the vector of VQ. As can be seen from
this graph, VQ increases when the plot is closer to the coordinate origin.
Figure 19. Relationship of VQ Components (From: Ref 15)

27
In overall, these three quality components are somehow related. The main
components of voice clarity - such as distortion and fidelity - are independent from delay;
for instance, voice may be clear during the long delay or may be unrecognizable during
the short transmission time. Contrary, the echo depends on the delay and also affects the
clarity of voice. The echo in network cannot be detected under the low delay threshold
because it is not long enough to be distinguished from the original speech phrase.
However, the clarity is degraded with large echo. The IEC uses this three dimensional
graph to represent only the conceptual model of VQ and there is no mathematical formula
used ot explain the relative vector of VQ.
According to typical human sensitivity, if only one of these components is
detected, user cannot understand the real behavior and then normally reports the overall
VQ as undesirable. Listener just simply concludes it as bad or good VQ, on the other
hand, the service provider and the network equipment manufacturer can address the
difference between the distortion and echo. So in order to conduct the detail analysis,
each component must be considered separately.
B. DELAY
The most challenge in the development of VoIP is the delay because it causes two
problems: echo and talker overlap. Echo deteriorates the communication quality when the
roundtrip delay exceeds 50 milliseconds. To cope with this problem, the echo
cancellation system should be implemented. Another problem, talker overlap, which is
the situation that a talker speaks while the other side’s speech just arrives, also interrupts
the conversation.
The following figure displays the conversation quality affected from user
experience according to voice delay time. This graph indicates that the reasonable
acceptable delay ranges from 100 to 250 milliseconds.

28
Figure 20. Delay Effect (From: Ref15)
At the point that the one-way delay exceeds 250 milliseconds, the significant
problem is detected. As a result, it can be said that the end-to-end delay is the major
constraint on voice quality. On private network, 200 ms delay is a reasonable goal and
250 ms is a limit. [Ref 10] The network administrators should configure the system to
minimize voice delay as possible. The ITU-T recommendation G.114 summarizes three
ranges of one-way delay as shown in the following table:
Table 4. Delay Specifications (From: Ref 11)
Delay (ms) Description 0-150 Acceptable for most user applications
150-400 Acceptable provided that administrators are aware of the transmission time and it’s impact on the transmission quality of user applications.
Above 400 Unacceptable for general network planning purposes, however, it is recognized that in some exceptional cases this limit will be exceeded.
Note: These recommendations are for connections with echo adequately controlled by echo
cancellers. Echo cancellers are required when one-way delay exceeds 25 ms.(G.131)
The analysis of voice packet delay categorizes each delay component in several
types such as coder, accumulation, processing, packetization, serialization, queuing,
network switching, propagation, and de-jitter delay. Cisco explains these delays in its
technical paper and are summarized as following. [Ref 11]
1. Coder or Processing Delay
Coder delay is the time taken by a digital signal processor (DSP) to compress a
block of PCM samples. This delay depends on a voice coding algorithm and a processor
speed. Generally, the coding/compressing time depends on the momentary loading of the

29
DSP. The example of G.729 voice coding interval (basic block size 10 ms) is illustrated
in the Figure 21.
Figure 21. Voice Compression (From: Ref 11)
If assume that there are total four voice channels on one DSP, the following table
displays the worst case compression time which is fourfold of the best case. Cisco uses
this worst case scenario in its router design for conservative purpose. [Ref 11]
Table 5. Coder or Processing Delay (After: Ref 11)
Coder Delay (ms) Coder Sample Block Size (ms) Best Case (1VC) Worst Case (4 VC)
G.723.1 6.3 kbps 30 5 20 5.3 kbps 30 5 20 G.726 10 2.5 10 G.729A 10 2.5 10 Notes: VC is Voice Channel on DSP
In addition, the decompression time is approximately 10% of the compression
time on each block. It is also proportional to the number of samples per frame.
2. Algorithmic Delay
During the coding period, some algorithm requires the coder to look ahead into
the next voice block “n+1” to gain some knowledge befor processing sample block “n”.
This algorithmic time increases the overall delay. Since the algorithmic time occurs
repetitively on every block, it is a constant value as listed in Table 6.

30
Table 6. Algorithmic Delay (From: Ref 11)
Coder Algorithmic Delay (ms)
G.723.1 7.5 G.726 0 G.729A 5.0
3. Packetization or Accumulation Delay
This delay is the time taken by vocoder to fill a packet payload with
encoded/compressed speech. It depends on the number of voice blocks accumulated in
each single voice frame. Cisco recommends to keep the packetization delay less than 30
milliseconds. In general, theG.729A coder puts two or three voice blocks into one frame,
while G.723.1 puts only one block. The following table calculates the accumulation delay
based on the payload size and number of voice block.
Table 7. Packetization Delay
Coder Number of Block per Frame
Payload Size (bytes)
Packetization Delay (ms)
G.711 2 160 20 3 240 30 G.723.1 6.3 kbps 1 24 30 2 48 60 5.3 kbps 1 20 30 2 40 60 G.726 2 80 20 3 120 30 G.729A 2 20 20 3 30 30
As previous ly menationed, the voice samples require the processing time,
algorithmic time, and packetization time. However, these delays overlap like a pipelining
nature and must be deducted. The calculation example shown in Figure 22 scenario
assumes that there is no algorithmic delay, and uses the best case processing delay.
Obvoiusly, the result shows that the main component of pipelining delay is the
packetization time.

31
Figure 22. Pipelining Nature (From: Ref 11)
4. Serialization Delay
The serialization delay is a fixed number of time to send voice or data frame to
the network interface. This value directly relates to the clock rate of trunk. The following
table displays the serialization time.
Table 8. Serialization Delay (unit: milliseconds)
Line Speed Frame Size (bytes) 64 kbps 256 kbps 512 kbps 1 Mbps 10 Mbps
64 8 2 1 0.5 0.05 256 32 8 4 2 0.2
5. Queuing/Buffering Delay
The queuing delay varies since it depends on a trunk speed and a queue state. It is
a time taken when voice frame is waiting in a buffer before being transmitted to the
network. Since it has the highest priority, voice packet must wait only for either the on-
transmitting data frame or a pending voice frame ahead in queue. The estimated buffer
delay can be calculated by adding the serialization time of one voice frame with the
multiplication of probability of waiting data frame and the serialization time of one data
frame.

32
6. Network Switching Delay
The network switching delay in the public network is the largest delay portion of
Internet Telephony. It is not easy to compute since there are many factors involved. This
delay consists of the fixed component such as propagation time, and the variable
component such as switch queuing time. The G.114 recommends to use the approximate
propagation time at 10 microseconds per mile or 6 microseconds per km. In typical US
carrier network, the frame relay connection delay is approximately 40 ms fixed and 25
ms variable for a total worst case of 65 ms.
The delay quantity in router depends on its configuration, performance, capacity,
and load. There is a rule of thumb to use 10 ms delay on each router [Ref 16].
C. CLARITY
The second component of VQ, voice clarity, is characterized with the level of
perceptual fidelity, clearness, non-distortion, and intelligibility. These meanings are
subjective and vague; for example, even though the voice signal is highly distorted, it is
possible to understand the entire conversation context due to the common sense in human
interactive conversation.
The quantification of voice clarity is quite complex and dependent on many
factors. For example, the frequency band is sensitive to speech content recognition,-
human ears are more sensitive to the distortion at 1000 to 1200 Hz than 250 to 800 Hz
band, the complete sentence is more intelligible than the series of unrelated words.
Among the various subjective concerns, the clarity of voice packet transmission
depends on the packet loss, jitter, codec, noise, voice activity detector, and external
environment.
1. Packet Loss
Since the IP network does not guarantee the level of service and the UDP
transmission mechanism does not promise the completion on delivery, the packet loss is
normally found in voice traffic, especially under the peak loads and congestion period. If
packet loss is higher than 5%, it significantly degrades the quality of conversation [Ref
16].

33
In order to mitigate the impact of voice frame loss, the following three
mechanisms are used. [Ref 10] The first method is to interpolate the lost speech packets
by replaying the last received frame before lost. This method is simple and appropriate
for the infrequent loss. However it is not good for the burst loss. The next method is to
send the redundant information along with regular traffic. This approach is called forward
error correction (FEC) scheme, discussed later. However, it consumes more bandwidth.
The voice frame “n” is duplicated and sent along with frame “n+1, n+2,…” depending on
window size. This method can solve the loss problem effectively but can cause greater
delay. The las method is to use the hybrid approach of the above. It requires less
bandwidth than the FEC approach. However, the delay problem remains.
2. Jitter
The jitter is a variable inter-packet arrival time introduced in the network. The de-
jitter buffer is allocated in the far-end routers to smooth speech signal before it leaves the
network. This buffer transforms the variable delay into a constant value by accumulately
holding the first received sample for a certain period before sending out. This period is
called the initial playout delay.
If the buffer is underrun, it causes speech gap. If the buffer is overrun, it causes
packet drop which also generates silence gap. So, the optimal initial playout time equals
to the total variable delay along the connection path.
Figure 23. De-jitter Buffer Operation (From: Ref 11)
To optimize the buffer size, the jitter buffer must be adjustable. The first adaptive
approach is to measure the variation of packet number stored in the jitter buffer over a
period of time and incrementally adapt it. This method is appropriate to the consistent
network such as ATM. The second approach is to calculate the adjusting ratio and use

34
this number to adjust buffer size. It needs some mechanism to count the number of late-
arrival packets and divide it with the number of successfully processed packets. This
approach suits the high inter-arrival jitter environment like IP networks. [Ref 10]
3. Codec
Codec, as explained in the previous chapter, performs compression and
packetization function . The compression algorithms implemented in different codecs
offfer the different speech distortion since they do not equa lly preserve the perceptual
importance of audio signal. This perceptual importance is sensitive to human physiology
and cognitive psychology. As a result, different codecs generate different waveform to
the listener. Among various coding algorithm, the linear codec, G.711, is rarely used due
to the high bandwidth consumption. On the other hand, the most popular non-linear
codec, G.723.1, cannot completely reproduce the original speech, and this cause voice
distortion in most VoIP applications. As the different compression techniques require the
different computing power and computing time, the codec selection also affects the delay.
4. Noise
Noise is generated from bit error on data transmission lines or analog lines. Since
noise exists before speech is digitized, it is always included by codec into the signal and
causes clarity distortion.
5. Voice Activity Detector
Voice activity detector (VAD) or silence suppression is used to optimize the
connection bandwidth. It operates at the sender side and can adapt to different noise and
voice level. As human conversation is normally half-duplex, VAD can save 50% of
bandwidth requirement. Its behavior is shown in the following figures.
Figure 24. VAD Behavior (From: Ref 15)

35
VAD checks the speech pattern and removes the unimportant portion from the
decompressed signal. So, it may inadvertently eliminate the speech content and decrease
the intelligibility of conversation. Too much front-end clipping (FEC) makes signal hard
to understand. Too much holdover time (HOT) deducts network efficiency while too
small holdover time causes chopping speech. Finally, the comfort noise generator (CNG)
is used to provide the signal during a silence periods. CNG must be matched with true
noise background to properly produce VQ.
6. Environment
Some environmental factors may make listener feel uncomfortable with voice
conversation even though the audio quality is pretty good. These factors are room noise,
user mood, and user expectations.
D. ECHO
Echo results from the signaling reflections of telephone speaker’s voice back into
telephone microphone. It is generated from the heterogeneous link especially from four-
wire link (digital cable) to two-wire link (telephone). This connection is normally
arranged at the local switch. If the impedance between each section does not exactly
match, the incoming signal is fed back in the outgoing signal. Generally signals keep
looping between two amplifiers and produce echo if the one-way delay is approximately
20-25 milliseconds [Ref 16]. Echo can also be created from the acoustic problem between
the speaker and microphone. It is called acoustic echo. If the echo level is lower than -25
dB, it may not be detected.
Figure 25. Relationship between Echo Level, Delay, and Perception (From: Ref15)

36
Thus, echo in packet switcing network usually causes a problem because the
roundtrip time is always higher than 50 ms. To eliminate this echo, the application
requires a special type of echo cancellation, called the far-end or tail-end echo
cancellation, otherwise, the speech cannot be understood. ITU G.165 standard explains
the requirement for echo canceller.
Echo canceller is provided at VoIP gateway or terminal, usually closed to the tail-
end host. It uses a mathematical model to estimate the expected echo and eliminate it out
from the transmitted voice signal. It can adapt to signal and circuit conditions.
E. PERFORMANCE CONTROL MECHANISM
As previously mentioned, VoIP performance depends mainly on the network
bandwidth. It works very well on private network but not on the public environment.
Moreover, the configuration of network switching device can eliminate the bottleneck on
some area. To solve the problem on low speed link, Cisco introduces the control
mechanism as following: [Ref 14]
1. Congestion
Congestion causes delay and jitter. It can be minimized by using intelligent
queuing which incorporates weighted fair queuing (WFQ), IP precedence, RSVP,
adaptive jitter buffer, and priority queue.
2. Packet Residency
If large packets are queued, the freeze-out is slow. So, it is better to use
interleaving technique, IP MTU size reduction, and adaptive jitter buffer.
3. Bandwidth Consumption
This situation is a problem when too large header size is used on low link. It can
be solved by compression technique applicable for codec and RTP header.
4. WAN Traffic Inconsistency
This is a problem of oversubscription and bursting. To minimize the problem,
network administrator has to use traffic management such as router traffic shaping, high
priority private virtual channel, link fragmentation, and data discard eligibility.
All solutions must be carefully considered and tailored to suit each network. The
performance evaluation is required after the VoIP design is implemented.

37
V. PERFORMANCE MEASUREMENT
Many researchers have conducted measurement studies on VoIP performance
during last few years. It is important to know the capability of network infrastructure
before deploying a VoIP application; otherwise, the application might not offer benefits
as expected. To evaluate the service level, all performance factors discussed previously
must be determined.
A. VQ MEASUREMENT
To measure VQ, the following quality components must be analyzed - clarity,
delay, and echo. The IEC [Ref 15] summarizes the evaluation of VQ in the following
guideline.
1. Measuring Clarity
A good method to quantify VQ is to use a large group of testers in a controlled
environment. The clarity is determined directly from the user hearing. However, this
method is time consuming and not flexible.
Another method called perceptual speech-quality measurement (PSQM) is
recommended in ITU-T P.861. The PSQM method is designed to be an automated human
listener that can objectively evaluate the speech quality in the bandwidth range of 300 to
3400 Hz. This measurement method focuses on the distortion, noise effect, and overall
perceptual fidelity. The newer version, called PSQM+, correlates the distortion to the
Mean Opinion Score (MOS) values.
The third method is called perceptual analysis measurement system (PAMS). It is
developed based on the PSQM model but provides test repeatability. Its signal processing
algorithm is more effective. PAMS generates listening quality score and listening effort
score, both of which can correlate to MOS.
Furthermore, VAD can be measured directly by using a simulated test signal. The
FEC, HOT, and CNG matches must be evaluated. This test is quite complicated because
it deals with the voice band signals in different tracer dyne tones.

38
2. Measuring Delay
To analyze the quality of voice, the end-to-end delay can be evaluated separately
from clarity because the delay does not affect the sound of voice conversation; it just
disrupts the rhythm and irritates the feel of communication. The IEC publishes two
methods to measure delay: Acoustic PING and MLSNCC.
Acoustic Packet Internet Groper (Acoustic PING) is the measurement technique
using a narrow audio spike to represent voice packet. This spike is pinged to the
destination to measure the end-to-end delay. However, it may be interfered by noise,
attenuation, and packet loss. So, acoustic PING should be used along with other method
to make the result more accurate.
Maximum length sequence normalized cross-correlation (MLSNCC) is the
technique used to verify the Acoustic PING. It uses DSP to send a special test signal,
similar to white noise, through the network. MLS noise is repeatable and predictable.
Then a received and original signals are analyzed to calculate the end-to-end delay. The
result from this method is more accurate than PING.
In this study, two more delay measurements are introduced by performing the
calculation directly from RTP and RTCP transmission times. The details are explained in
section C.
3. Measuring Echo
To determine echo, it is necessary to understand the echo level and echo return
time. The echo return loss (ERL) is the attenuating amount before echo arrives at the
receiver. The design of echo cancellation requires the value of ERL and echo delay. So,
the echo cancelling performance must be evaluated. It can be tested with these
parameters: convergence time, cancellation depth, and doubletalk robustness.
One way to test echo is to use a subjective measurement called Perceived
Annoyance Caused by Echo (PACE). The users report how much echo harms the
conversation. The ITU-T explains two algorithms to evaluate ceho: the first one is to test
with white noise in G.165 recommendation, and the other is to test with signal frequency
in G.168. However, these methods are only appropriate for laboratory environment with a

39
linear codec. On the other hand, PSQM and PAMS algorithms can be applied to measure
echo in the real networks.
B. MEASUREMENT METHODS
Generally, the performance of voice packets can be determined by objective and
subjective tests. The subjective measurement involves the human feeling. Each evaluator
listens to a live or recorded speech communication and gives a satisfactory score. Since
the performance value is directly given by people, it is acceptable to measure a telephony
system. However, it is time-consuming and expensive since a lot of resources must be
allocated to produce an accurate result. On the other hand, the objective measurement is
used to evaluate the speech qua lity by computing the quantitative distortion between the
original and the received signals. [Ref 18]
As the evaluation can be performed with either an objective or a subjective
approach, the best practice is to integrate both factors because the main design goal of IP
Telephony is to support time-sensitive and interactive communications. However, such a
combined approach is not easy to implement.
To measure the performance of VoIP, tests can be done with the actual voice or
with virtual (simulated) voice. Each approach has a different advantage and can be
explained as following.
1. Measurement with Virtual Voice
The approach to test the performance of IP telephony with simulated voice is
basic and simple. It is mostly adopted in the early researches in this area. Since no human
direct-participation is required during the test, it is flexible to any network environment.
The virtual speech is generated by computer using network programming in
which the payload portion in voice packet can be any bit stream. The important contents -
RTP, UDP, and IP header - carries network performance information, such as delay,
jitter, and packet loss.
This approach is categorized in three methods: model simulation, direct
measurement, and agent-based measurement.

40
a. Model Simulation
This method simulates all terminals and switching devices on modeling
software. Each node property and behavior can be configured to suit the test scenario.
The accuracy of application relies on the design of queue and finite state machine. The
example of this model is OPNET..
b. Direct Measurement
In order to measure the performance directly, voice packet is generated
and transmitted on the real network or on dedicated channel simulator. Test may include
a central office switch, gateway, and gatekeeper. Since voice packet can be manipulated
at a source, it is quite flexible to derive the output from a header info. After evaluation,
the analytical data collected at a receiver is compared to the source data. Finally, the
performance parameters - such as delay, jitter, packet loss, and packet unorder - can be
determined.
The major drawback of this method is that it can measure only the
objective parameters, not the subjective ones. Consequently, it is normally used to
measure the network performance, not for the VoIP performance. However, the
correlation of E-model, discussed later, can solve this problem.
c. Agent-based Measurement
This method uses similar concept with the direct measurement but using
the agent-based software to conduct the autonomous testing. Normally, it can test on the
large-scale network like WAN. To perform a test, an accessor software is written to
behave like an endpoint and assessor console. Then several endpoint agents are installed
on the designated computers at different test sites. As the software is autonomous, each
agent can emulate the codec behavior and form the virtual voice packets. It is also
capable to generate multiple calls according to the predefined call schedule. At the server
location, an assessor console serves as the coordinator of all endpoint agents. It
incorporates the assessor database which contains the codec script, the schedule of call,
and the result of test run.
When the test starts, the assessor console established connection with all
endpoint agents via TCP. It sends a call script indicating a codec, call group, and call
schedule to other endpoints. Then each endpoint starts generating the connection to the

41
other endpoints with RTP. The endpoint also detects the incoming call and measures the
performance parameters. These computed parameters are sent via TCP to the assessor
console and store in the assessor database. The example of this measurement method is
NetIQ assessor. [Ref 19]
With this approach, the delay, jitter, and packet loss can be determined
from the database. However, the subjective parameters cannot be assessed directly. It
relies on the translation method using E-model.
2. Measurement with actual voice
To test with actual voice, the human-generated speeches are digitized into voice
packets for performance evaluation. The evaluation yields us the performance of
network, encoding scheme, and some communication behaviors. Both subjective and
objective factor can be derived. The actual voice is categorized as the pre-recorded
speech and live conversation.
a. Pre-recorded Voice
The actual speeches are recorded in dedicated environment before being
compressed with different encoder. The background noises such as car, wind, hall echo,
or people chat may be included into a test. This test is designed to measure some
performance parameters, so each voice packet may be modified with different bit error
rate, burst error rate, signal to noise ratio, and silence period. Consequently, the test
scenarios are formed based on the combination of these factors. After each voice is
transmitted and the listeners evaluate, the results are compared with the baseline.
The benefit of ths approach is that it can measure the subjective
performance such as the Mean Opinion Score (MOS) of that network status. Morover, it
can test the objective parameters; for instance, the encoding, bit error rate, burst error
rate, s/n ratio, voice background percentage, silence period, link error, link load level,
data rate, echo cancellation, silence suppression, and bandwidth efficiency. This mothod
is appropriate to analyze a real-time application; not a real- time “interactive” one.
This evaluation should be conducted on the closed environment to limit
the number of parameters. If test is run on the opened public network to incorporate the

42
real environment, the delay will be large and not consistent due to the fluctuation of
traffic.
b. Live Conversation
Test with live communication extends the benefits of test on pre-recorded
speech with the interactive score. Each participant eva luates the conversation based on
continuity of speech, quick response, silence gap, echo, and noisy. The qualitative service
score is estimated under the designated numeric range. The average score of all subjects
represents the performance value of VoIP. The most acceptable test is MOS.
Measurement in real communication can also be used for objective test. It
requires some computation on packet header contents. Delay, jitter, and packet loss can
be determined from RTCP packet. Then all parameters can be converse to MOS by using
E-model.
3. Comparison of Performance Measurement Methods
The following table compares five measurement approaches.
Table 9. Comparison of VoIP Performance Measurement
Virtual Voice Actual Voice Performance Measurement Model
Simulation Direct
Measure Agent Based
Pre- recorded
Live Conversation
Test Control Variable Encoding N Y Y Y Y Error Rate Y Y N Y N Silence Compression Y N N Y N Data Rate Y Y Y Y Y Echo Cancellation Y N N N Y Link Loading Level Y Y N Y N Voice Background N N N Y N
Test Type Objective Measurement Delay Y Y Y Y Y Jitter Y Y Y Y Y Packet Loss Y Y Y Y Y Subjective Measurement MOS N N N Y Y R-Value N Y Y Y Y

43
C. MEASUREMENT OF DELAY
As discussed in the previous chapter, there are several delay components involved
VoIP application. Some components are constant like a encoding type, while some varie
such as a link speed, queuing buffer, or other factors. However, to measure the
performance, all delay elements must be aggegrated to a single delay parameter. The
main delay portion that most researchers pay attention to is a propagation delay between
terminals. This latency is expected to be lower than 250 milliseconds, otherwise voice
quality is poor. To measure this delay, RFC 1889 explains a simple calculation method to
determine a roundtrip delay by using the contents inside RTCP message.
1. RTCP Time Information
To measure the roundtrip time, RTCP, as a control companion of RTP, is the
appropriate tool to provide the sampling delay information. According to RFC 1889,
RTCP messages are sent from each host to all other participants in the same session. The
control packets are sent out with a slightly different interval. Each time, the interval is
randomized at the minimum of 5 seconds to avoid burst RTCP packets and unintended
synchronization from all participants. Every time a message is went, the source
timestamp is determined and recorded into a packet header. In the sender report, two
timestamp values are provided, the NTP and RTP timestamp.
The RTP timestamp cannot be used to derive delay time because it is recorded in
a sampling instant format. However, it is used to maintain the synchronization and
calculate a jitter. [Ref 20]
On the other hand, the NTP timestamp which is the wall clock time formatted in
64 bit unsigned fixed point number can be used to derive delay. As stated in RFC 1305
[Ref 21], it is a relative time to 0h on 1 January 1900 recorded in total 64 bits format. The
most significant word 32 bits in sender report is the integer number and the fraction part
is contained in the least significant word 32 bits. So, the time precision of this format is
about 200 picoseconds.
Figure 26 illustrates the incremental behavior of RTP and NTP timestamp. While
NTP always increases, RTP may stall during the silence gap or non-sampling period. As
a result, there is no direct relationship between both numbers.

44
timestamp
RTP
NTP
random
random
actual time Figure 26. RTP and NTP Timestamp
2. Clock Synchronization
Before start calculating a delay by using a NTP timestamp, all terminal clocks
must be synchronized. This can achieve by synchronizing them with one of them or the
standard time server. The time synchronization normally proceeds with one of these two
standard protocols, NTP and SNTP.
The Simple Network Time Protocol (SNTP), as explained in RFC 1769 [Ref 22],
is a simplified version of Network Time Protocol (NTP) with less degree of accuracy but
in acceptable level. As it requires less complicated calculation, SNTP is implemented in
the system time module of Windows 2000 Server, W32Time. The main reason that
Windows platform does not use the NTP is it does not require such high precision. How
well a time protocol can synchronize depends on the hardware and the design of
operating system. The clock granularity of Windows 2000 system ticks approximately
every 10 milliseconds. Then no matter what time protocol is used on Windows platform,
it cannot be accurate more than 10 milliseconds. In its design, W32Time uses loose
synchronization by controlling time on all clocks in the enterprise within 20 seconds
range, and all clock in a site within 2 seconds range. [Ref 23]
3. Sampling Delay
As explained in RFC 1889 [Ref 13], after all terminal clocks are synchronized,
the round trip delay can be calculated from the LSR and DLSR field.
The first field, Last sender report (LSR) timestamp, as the middle 32 bits of NTP
timestamp (total 64 bits) is derived, at the receiver, from the most recently received SR
and placed into the SSRC corresponding message. Since, the LSR is unique in each

45
session for each SR due to the time precision in NTP format, the LSR can be used to
identify the SR packet [Ref 20].
The second field, Delay since last SR (DLSR), is the elapsed time between the
last SR packet from SSRC is received and the subsequent RR message is returned. This
elapse time is reported in 1/65536 seconds format, so it offers a time granularity at
approximate 15 microseconds [Ref 20]. This number accounts to the duration between
RTCP SR and RR.
Figure 27 illustrates a DLSR between SR1 and RR1. The sender A sends RTCP
SR1 message, containing T1 in NTP timestamp field, to all participants in its session.
When the receiver B receives the message at time T2, it memorizes T1 value until the
moment that RR1 is generated. So, the reort message RR1 is sent out with middle bits of
T1 in LSR field and the time duration between T2 to T3 in DLSR field. Sender A
receives the RR1 messages at T4. It checks SSRC to find the report section and LSR with
its own memory recorded since SR1 is sent out.
Sender A Receiver B
d1
d2
RTCP SR1
RTCP RR1
DLSR of SR1
T1
T2
T3
T4
Figure 27. DLSR and Roundtrip Time
In RFC 1889, a sample computation is presented, when RTCP message places the
actual operating system clock into message, the roundtrip delay can be derived by this
equation. [Ref 13]
roundtrip time = T4 - LSR -DLSR

46
However if RTP does not use a standard NTP clock, it may cause the error
because LSR is not equal to T1. So, without clock synchronization, the sender A can still
compute the roundtrip time between A-B-A by using another simple offset calculation
[Ref 24].
round trip time = d1 + d2 = T4- T1 - DLSR
To use this formula, T1 and T4 must be obtained at the sender by using a packet
analyzer. However this number is an approximate value as it only represents the sampling
roundtrip delay in every 5 seconds, not the continuous delay. The one-way delay is
auumed to be half of this value with the symmetric link. This method uses RTCP
roundtrip time as RTP packet roundtrip delay.
Nevertheless, the actual delay on voice transmission is the delay on RTP packets,
not the RTCP packets. In G.723.1 encoding, RTP packet is sent every 30 milliseconds
while RTCP message is sent every approximate 5 seconds. This means that one control
message is sent out for every 166 voice messages. So, RTCP can statistically represent
only 0.6 percent of the entire actual sample space. Moreover, the delay of RTCP does not
necessary equal to the one of RTP because a voice packet and a control packet may use
different IP Precedence and DSCP. On the network that supports DiffServ
implementation, the buffer size is allocated differently for each codepoint and the
queuing time might be slightly different. So, another method to calculate delay on each
RTP packet is introduced next.
4. Per-packet Delay
In order to calculate the propagation delay on RTP message, it is better to
synchronize system clocks among all participants. Then each RTP packet must be
recorded the sending time and receiving time. The different between two values of the
same packet sequence number is one-way delay between hosts.
If the system clock is synchronized with GPS, all clocks are run with the lowest
stratum which offers the highest accuracy [Ref 25]. However the flexible approach is to

47
synchronize clock with any network time-servers provided by trusted organizations. After
system clock is synchronized by time protocol application, there is still a small drift
among all participants. This may happen from clock frequency, clock resolution, and
network latency during synchronization process between host and time-server. It is
important to determine this clock drift to adjust the system clocks. As the calculation of
the absolute drift between time-server and hosts is quite complicated, it is easier to
calculate the relative drift between source and destination hosts.
The relative drift can be determined by using two tools, a packet analyzer and
time-server synchronization application, the experiment is discussed in the following
chapter. A Packet analyzer is used to record an arrival time and departure time of RTP
messages. Time-syn application is used to minimize the error gap between hosts.
Figure 28 illustrates a time series and drift, assuming that both clocks are running
with the same clocking cycle speed and the clock on terminal B is a little bit ahead
terminal A. The protocol analyzers installed on both terminals can record packet
timestamps at T1a, T2b, T3b, and T4a. The notation d12 means the propagation delay of
packet between departure time T1a to the arrival time T2d.
Terminal A Terminal B
d12 = T2b - T1b = T2b -T1a - driftd34 = T4a - T3a = T4a -T3b + drift
d12
d34
RTP # 12
RTP # 34
T1a
T2b
T3a
T4a
0 0 + drift
T1b = T1a + drift
T3b
Figure 28. Clock Drift and Time Recorded.

48
If T1a and T1b are known, the calculation of drift is very easy but it is impossible
to get value of T1b. However, with the knowledge that T1b equals to T1a plus drift, the
following equation is used to derive time drift.
d34 - d12 = T4a - T3b + drift - (T2b -T1a - drift)
drift = 0.5 x ((d34 - d12) - (T2b - T1a) - (T4a - T3b)
All parameters above are read directly from a packet analyzer except d12 and d34.
Base on the assumption that network is symmetric, a number d12 equals d34 and then
cancel each other.
In real environment, delay on each direction does not exactly equal. However, the
difference on both side is not significant when comparing to 200-250 milliseconds delay
budget that VoIP can absorb. So, the assumption of symmetric link is reasonable and is
widely accepted in other researches.
After a clock drift is computed, the sending time T1b and T3a can be calculated.
Finally a one-way delay on each RTP packet can be determined.
D. MEASUREMENT OF JITTER
To optimize the buffer performance, it is necessary to adapt the buffer length of
jitter buffer. This value is required continuously while the communication is being
processed. RFC 1889 [Ref 13] explains the jitter information reported in RTCP packet. It
is computed as a statistical variance of the RTP data packet interarrival time. This
number is measures in RTP timestamp units and formatted as an unsigned integer.
To determine jitter, this RFC uses the concept of relative transit time. The relative
transit time is the difference between RTP timestamp and the arrival time recorded by
receiver clock in the same unit. First, the difference in relative transmit time is computed
as D. Interarrival jitter J then is calculated by using mean deviation of D. Figure 29
displays a time sequence and delay on each RTP packet.

49
Sender Receiver
S is sending time (RTP timestamp)R is receiving time (time of arrival in RTP timestamp units)
RTP i
RTP j
Si
Ri
Sj
Rj
Figure 29. Jitter Calculation
According to the definition of D, this pure jitter is calculated as
D(i,j) = (Rj-Ri) - (Sj-Si)
= (Rj-Sj) - (Ri-Si) pure jitter
This equation simplifies the computation because we don’t have to know the real
Si and Sj but only to check the difference between Sj and Si. So, this jitter can be
explained as the difference between signal spacing at sender and at receiver. [Ref 20]
After D is determined for each successive packet pair, the interarrival jitter J is
calculated for each particular source identified by SSRC. RFC 1889 determine J with the
following formula.
J = J + (|D(i-1, I)| - J) /16

50
This formula uses the optimal first-order estimator algorithm in which the gain
parameter 1/16 is used for noise reduction ratio in order to preserve the convergence rate
[Ref 13].
The interarrival jitter is continuously computed and instantly reported with that
moment value when RTCP RR message is constructed.
E. MEASUREMENT OF PACKET LOSS
Since this research focuses on the regular voice packet model without using an
error control technique, no FEC is implemented in the tested VoIP application. So each
packet loss represents one actual loss. The information on packet loss is also provided in
RTCP RR message in these two fields: fraction loss and cumulative number of packet
loss.
The fraction loss is the ratio of RTP packets lost since the previous SR or RR was
sent. It is the number of packet loss divided by the number of packet expected. The
original loss ratio is computed and multiplied with 256. Then the integer part of this
result is put in the fraction loss field.
The cumulative number of packet lost, on the other hand, reports the actual loss
amount since the beginning of session. It treats each packet as one arrival message. The
difference of this parameter in two successive RR messages is the number of RTP packet
loss counted during the transmission interval.
However, the RFC 1889 report mechanism counts only the number of packets
arrived at receiver, it does not consider the packet content whether it is duplicated or late-
arrival. This is one drawback of RTCP since the late packet is dropped at destination, but
it is not reported. To determine the real loss excluding playout error, all packets must be
check with sequence number with the playout threshold.
F. MEAN OPINION SCORE
Aas described in ITU-T P.800 [Ref 26], Mean Opinion Score (MOS) is the mostly
adopted subjective measurement. It reflects the voice quality by a group of listeners. The
normal test sentences and free conversations are evaluate with the listening impression.
The large group of listeners have to rate the impression on subjective scale such as
intelligibility, acceptability, quality, naturalness, etc.

51
Test requires a lot of time and effort to arrange huge group of listeners. Tens or
hundreds of evaluators must enter the testbed in same environment and in every rotation
of changing to new VQ parameters. The experimental must be strictly controlled on every
rotation. The results must be carefully analyzed. So, this is not an efficient method.
To determine the quality of voice communication system, MOS uses the Absolute
Category Rating (ACR) method. Each evaluator is required to rate the audio in five rating
scale corresponding to numerical points assigned. The score interpretation is shown in the
following table. [Ref 27]
Table 10. Mean Opinion Score
MOS Quality Rating Quality Equivalent Speech Quality 5 Excellent Face-to-face conversation,
or listen to CD Complete relaxation
4 Good Telephone grade Attention necessary 3 Fair Moderate Effort 2 Poor Considerable effort 1 Bad No meaning understood
Many voice samples are sufficiently used at each source to justify the accurate
score. All individual rating values are averaged to yield the final score on each voice
source. Test can be used to evaluate coding rate, language effect, link speed, etc. MOS at
4 or higher is generally considered toll quality. MOS below 3.6 means many users are not
satisfied with call quality.
As MOS is a subjective test, the actual score of same test may vary on different
listener groups. Moreover, the test environment can influent the listening evaluation. So,
score on different test should not be compared to others. Normally MOS score of
ADPCM is used as baseline for toll quality, the standard of PSTN call. [Ref 26]
G. E-MODEL
As previously mentioned, voice clarity can be objectively tested with PSQM or
PAMS. However both methods are originally designed for PSTN call quality evaluation
and only appropriate for testing in laboratory. These models are not effective for
conversation on data network because they can’t map back to the pertinent network

52
parameters such as delay, jitter, and packet loss. Moreover, the call quality is shown in
one direction at a time, different from real interactive conversation. So, these methods are
not the good candidates for VoIP evaluation on real network. [Ref 28]
In order to use the network parameters - such as delay, jitter, and packet loss - to
tune the data networks, these objective numbers must be mapped to the subjective value
such as MOS. The most acceptable conversion model called “E-model” is recommended
in ITU G.107 [Ref 29]. It is used by NetIQ [Ref 28] for VoIP performance testing
application. This model requires two mechanisms: calculaitn the R-Value and mapping to
MOS.
1. R-Value
E-model is developed to include some data network impairment parameters in its
single objective scalar R-value. This model is tested with varying degrees of impairments
to determine the subjective score. The maximum R-value is 100 and minimum number is
0. The higher the value, the better the voice quality is detected. The statistic from
empirical testing yields the following R-value formula.
R = Ro - Is - Id - Ie + A
where: Ro maximum value in perfect quality Is simultaneous impairments to the signal Id delays introduced from end-to-end Ie impairments introduced by the equipment, including packet loss A advantage factor e.g. mobile user may tolerate the lower quality because
of the convenience.
This model includes these factors: one-way delay, packet loss percentage, packet
loss burstiness, jitter buffer delay, data loss due to jitter buffer overrun, and codec
behavior.
2. Mapping Objective Score to Subjective Score
After the R-value is calculated, it can be directly mapped to an estimated MOS.
Since the inevitable degradation from voice conversion on packetization reduces the
theoretical maximum R-value, the derived R-value is adjusted to range from 0 to 93.2

53
corresponding to possible MOS from 1 to 4.4. The mapping is shown in the Figure 30.
The detailed calculation of this model can be found in the ITU G.107 Recommendation.
Figure 30. Mapping of R-value to MOS (From: Ref 28)
Figure 31. R-value and MOS with User Satisfaction (From: Ref 28)
H. PREVIOUS RESEARCHES ON MOS AND E-MODEL
Many researches are conducted to provide the relation between each pertinent
VoIP performance factor and the subjective performance especially MOS and R-Value.
The studies from different organizations yield different result because all tests are

54
established in various environments. Some relationships on performance factor - such as
codec, loss rate, delay, and echo - provide the expected value of satisfactory
quantification.
1. Codec
Cisco [Ref 30] tests the speech quality produced by several codecs and reports in
its technical paper. The evaluation uses MOS as shown in the following table. In
addition, NetPredict [Ref 31] provides the compatible R-Value on each compression
technique. The standard G.711, using original signal without compression, is considered
to be a benchmark on toll quality.
Table 11. Codecs’ MOS and R-Value (After: Ref 30)
Codec MOS R-Value G.711 4.10 83 G.726 3.85 76 G.728 3.61 70 G.729A 3.70 73 G.723.1 (6.3 mbps) 3.90 77 G.723.1 (5.3 mbps) 3.65 71
2. Packet Loss
Generally packet loss is found at the edge routers between LAN and WAN, where
the packets are cumulatively queued on different buffer for transmission. The distributed
loss is tolerably handled by voice reconstruction but the burst loss always causes content
alteration. The following figure displays the effect of consecutive loss on R-value.
Figure 32. R-value as Function of Consecutive Loss (From: Ref 31)

55
3. Delay
In order to compare the delay effect on voice quality, the G.711 is again used to
represent the perfect phone-graded signal before the different media delays are imposed.
Effect of delay variation on R-value is illustrated in the following figure. The acceptable
delay should be no more than 200-250 milliseconds corresponding to R-value of 80 as
shown on graph.
Figure 33. R-value as Function of One-way Delay (From: Ref 31)
4. Combination of All Factors
The following figures present the reduction on R-value according to pairs of
performance factors: delay - packet loss, delay -codec, and delay - echo. TELR (talker
echo loudness rating) is used to differentiate echo level. The standard TELR at 65 dB is
used as echo baseline.

56
Figure 34. R-values as Function of Delay and Packet Loss (From: Ref 31)
Figure 35. R-values as Function of Delay and Codec (From: Ref 31)
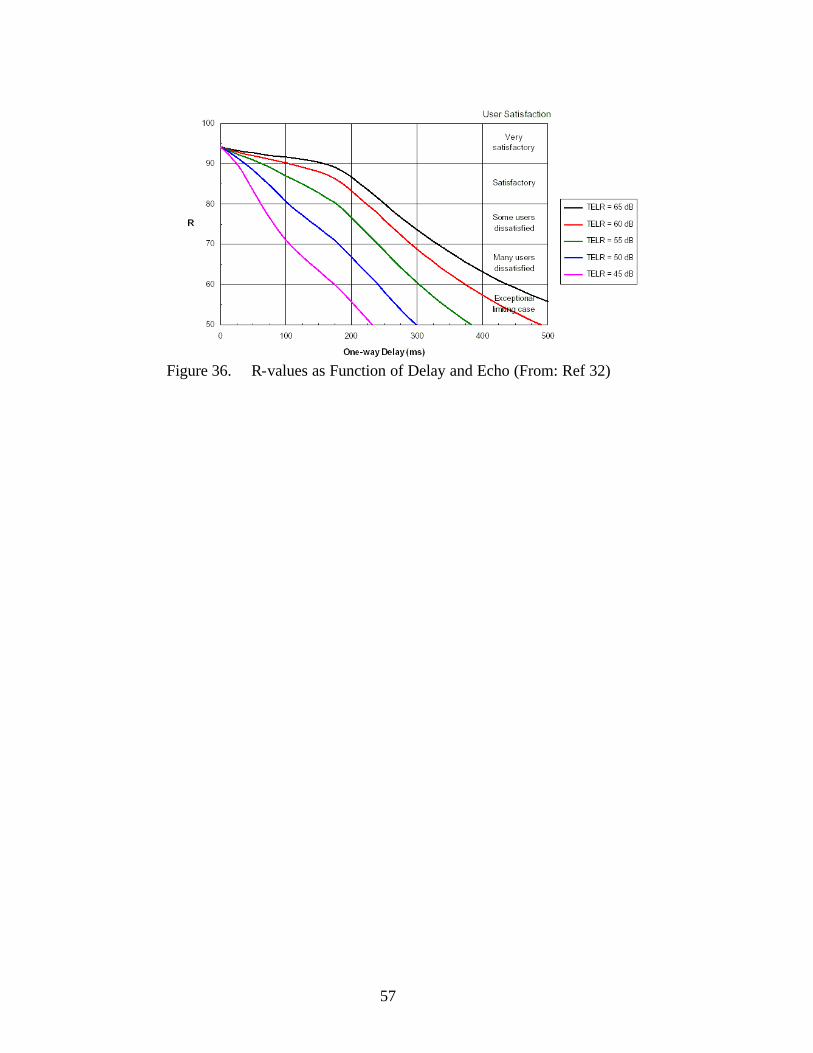
57
Figure 36. R-values as Function of Delay and Echo (From: Ref 32)

58
THIS PAGE INTENTIONALLY LEFT BLANK

59
VI. EXPERIMENT DESIGN
Using the correlation between subjective and objective scores as discussed in the
previous chapter, MOS of a VoIP session can be derived from the E-Model by using the
R-value conversion. The accuracy of the score relies on the fidelity of this model. For a
public network, the inherent complexity of its uncontrollable, volatile environments
makes the direct MOS measurement more appropriate. However, direct measurement
requires a lot of resources to conduct. The simplicity of E-model makes it widely adopted
in commercial VoIP quality monitoring applications.
A. TEST MATRIX
Voice quality (VQ) composes of three main components: clarity, delay, and echo.
Clarity and echo are independent while echo relies on delay threshold. The proportional
contribution that each factor affects VQ is pretty fuzzy since the subjective test can be
interpreted in different ways. To easily manage the evaluation, only some most
significant parameters should be strictly used on evaluation. However, the tested
parameters must encompass all VQ characteristics.
To practically measure VQ, it is possible to discard some unnecessary variables.
Four primary parameters sufficiently representing voice performance factors are delay,
jitter, loss rate, and codec.
The first and most recognizable component, clarity, is measured by loss rate,
jitter, and codec. However, since G.723.1 is the best codec choice selected by the
industry, the codec war eventually disappears and this codec is supported by most
applications. A test restricted by using this codec decreases the maximum MOS value as
discussed in the previous chapter. So in this study, the codec variable is discarded from
the tested parameter list. Only jitter and loss rate are evaluated for VQ clarity.
The next component, delay, is measured by the propagation time between hosts.
In addition, the compression and packetization times are included in the overall delay.
The last component, echo, should be measured by TELR (Talker Echo Loudness
Rating) and the end-to-end transmission time. According to the current VoIP application
design, the echo canceller on the tail-end host performs effectively and diminishes the

60
echo amplitude to lower than -25 dB, which is unrecognizable by human. Moreover, echo
presents a negative impact only when the end-to-end transmission time is beyond a
certain threshold. So TELR is ignored and only the transmission time is measured in this
study.
Therefore, the tests of this study are designed to measure delay, jitter, and loss
rate. These objective parameters are also used in E-model and many VoIP performance
measurement applications.
B. TOOLS USED
Microsoft NetMeeting 3.0 is selected due to its popularity and user- friendly
interface. It supports the H.323 standards with capability to communicate via voice,
video, chat, and whiteboard features. All call control, chat, and whiteboard use TCP
connections whereas voice and video use UDP on randomly selected ports. NetMeeting is
available at http://www.microsoft.com.
To collect all voice traffic, an open sourced protocol analyzer, Ethereal, is used.
As the time of this study, the software is released with version 0.9.7. This release
supports VoIP application protocols such as RTP, RTCP, TCP, UDP, and Q.931. Before
Ethereal can be used, a Windows-platform packet capture driver, WinPcap, which offers
the same functionality as TcpDump, must be installed. This test uses WinPcap 2.3 for
Windows 2000 and WindowsXP. Both tools are available at http://www.ethereal.com and
http://winpcap.polito.it.
The last tool used is a time synchronization application to manage system clocks
before testing. NetTime 2.0 is used which runs the Simple Network Time Protocol
(SNTP) on port 123. The standard NPS time server located on campus is referred from
every host used in the test. This tool is available at http://nettime.sourceforge.net/.
C. TEST DESCRIPTION
The purpose of this research is to study the behavior of live VoIP traffic on real
networks. Three objective performance parameters, delay, jitter, and loss rate, of the RTP
data streams are measured. The measurements are used to determine the accuracy of the
RTCP performance sampling method. Subjective VQ scores are also collected
simultaneously. Since the tests are conducted on actual networks, the subjective

61
satisfaction score directly correlates to the three objective parameters. This score can be
used to evaluate the accuracy of the E-model.
In all tests, NetMeeting with G.723.1 codec was used as the VoIP application.
The baseline configuration is set up on a LAN in the Advanced Network research Lab of
the Computer Science Department. The lab is located in Spanagel Hall room 238. No
router is required in the baseline test. All test systems’ clocks were synchronized to the
same time server “time1.nps.navy.mil”. No voice gateway or gatekeeper was installed.
Calls were established across the network with live conversation. Voice background in
the lab and external car noise were present during the test. Ethereal were installed on both
NetMeeting host machines and set in promiscuous mode to record all voice packets with
designated source and destination IP addresses. Echo cancellation and silence
suppression were used during the test. The experiment was carried out by two NPS
students who were already familiar with each other’s speech rhythm. Before testing, all
evaluators are briefed with test objective and score interpretation. Voice is recorded by
using the headset and headphone with microphone. During the test, some lab machines
generated HTTP traffic as in normal operation. Each test was conducted for 4-5 minutes.
The second test was conducted over WAN between NPS and an external
commercial ISP operated by AAAHawk Net. One side is a notebook connected on a
dedicated personal LAN with a Linux gateway that has dial-up link to the ISP. The
remote notebook is a Dell Latitude C600 with 1 GHz CPU, 1 GB RAM, and an ESS
Maestro audio card. The gateway was running a NAT server. The other side is a desktop
in the Advanced Network Research lab. This desktop is a Dell Precision 330 with 1.5
GHz CPU, 1 GB RAM, and a Turtle Beach Santa Cruz audio card. According to some
preliminary evaluation, the desktop soundcard performs much better than the one on
notebook. Test configuration is the same as the baseline test. During the test the remote
gateway also generated FTP cross traffic to simulate bandwidth variation in a true WAN.
More details on this test are presented in Section E below.
The third scenario was developed to test the NPS campus network after the recent
backbone upgrade. The host in the Advanced Network Research Lab and another

62
machine in Root Hall were used in the test. The machines were connected via some
switches and routers.
The fourth test was run over a wireless LAN with 64-bits encryption. The access
point is installed in the Advanced Network Research Lab. One participant is a notebook
equipped with D-Link Air DWL-650 adapters and capable to transmit messages using
802.11b protocol. The other node is a desktop in the same lab. During the test, the laptop
is located approximately 40 meters away from the access point.
D. OVERALL TEST SCHEMA
All four test scenarios are illustrated in the following schema.
Figure 37. Test Schema
ISP
WAN
Root Hall
Router
SAAM Lab
Campus Test
Wireless Test
WAN Test
LAN Test
ftp

63
E. WAN TEST CONFIGURATION
1. WAN Test
Testing on WAN was conducted by setting up a NetMeeting session between an
external laptop (berry) and a machine (cherry or magma) inside the NPS campus over a
dial-up link, as shown below. Two test configurations were used and they are labeled
case A and B in the diagram.
Figure 38. WAN Test Schema
ISP
WAN
SAAM Lab
Router
FTP server
RAS
Firewall
Linux DHCP Server
66.81.x.x 131.120.x.x
DHCP Clientberry
192.168.0.x
131.120.x.x
magma
NPS
Test A
Test B

64
2. NPS Firewall Issues
The ultimate goal of this test is to evaluate RTCP under large, fluctuating network
delays. However, running MS NetMeeting crossing the NPS firewall is quite difficult
because the NPS firewall rejects all external high-port (>1024) traffic. The NetMeeting
application requires some of these ports as listed in the following table.
Table 12. Network Ports used by NetMeeting (After: Ref 33)
Port Protocol Type Standard NetMeeting Use 389 TCP static LDAP Internet Locator Server (ILS)
522 TCP static ULP User Location Service (deprecated, use ILS)
1503 TCP static imtc-mcs T.120 1720 TCP static H323hostcall H.323 call setup 1731 TCP static msiccp Audio call control 1024-65535 TCP dynamic H.245 H.323 call control 1024-65535 UDP dynamic RTP/RTCP H.323 streaming (RTP)
3. Test Configuration
The first test linked two VoIP nodes (berry and magma) via NPS’s modem bank
and Remote Access Server (RAS). This test is shown as Test A. Everything worked fine
because the laptop (berry) was directly allocated an NPS internal IP address
(131.120.x.x). Voice packets were able to communicate in both directions. Ethereal at
magma (131.120.8.749) was able to record incoming voice packets and detect the source
host IP address. However, Ethereal at berry did not work. Further inspections confirmed
that Ethereal does not support dial-up links.
To address this limitation of Ethereal, a private LAN was created for the laptop
client and a Linux machine added as a router between the voice client and the dial-up link.
The Linux machine also performed as DHCP server and dynamically allocated its clients
with the IP addresses ranging from 198.168.0.2 to 198.168.0.254. This new test setup is
shown as Test B. During the test, the laptop communicated with the router via Ethernet,
which allowed Ethereal to capture its outgoing voice packets Moreover, to test on the
larger delay and fluctuated environment, a commercial ISP was used instead of NPS
RAS. However, voice packets were able to flow only one way, from the laptop to the

65
NPS machine magma. According to the captured information on berry, the client
application was putting magma’s address in the destination field and its own address
(192.168.0.x) in the source field of its outgoing voice packets. Consequently, the
outgoing voice packets from magma were assigned “192.168.0.x” in the destination field.
This address is not part of the NPS address space so all voice packets from magma were
blocked due to the NPS firewall policy. Thus, the client cannot hear any voice from the
school machine. However, other applications such as text chat or whiteboard worked in
both directions since all TCP high ports were opened, by firewall administrator after
special request for this particular test, to allow H.323 call control establishment as listed
in the previous port table. During the test, RTP-RTCP/UDP is used to convey voice
packets while TCP is used to establish the communication channel and exchange the
capability.
This problem was solved by installing a Network Address Translation (NAT)
with masquerading service to the DHCP server running on the Linux router. The
software, called e-smith, is available at http://www.e-smith.org. After installation of e-
smith, the server was able to provide dynamic IP addresses to all clients. Moreover, it
was configured to load the ip_masq_h323 module in order to map the inflow and outflow
addresses of VoIP streams.
This test also connected two nodes through the Internet via a local commercial
ISP. Before voice packets can be communicated, the NPS firewall must allow all high
port UDP traffic for RTP/RTCP and allow all high port TCP traffic for H.323 call
control. Configuring the NPS firewall proxy to permit these ports did not succeed in
allowing such traffic eithe r. The experiment was able to proceed after directly adjusting
the NPS firewall filter. Finally, additional FTP traffic was added to the test environment
to introduce variations of communication channel capacity at the Linux server. An FTP
connection was established to download a large data file from an FTP server at
www.freedrive.com and this file transfer required approximate 30 minutes to complete.
This duration was long enough to cover the entire VoIP test which lasted for about 5
minutes. Furthermore, some HTTP traffic was generated by using a web browser. Before
the real experiment data was collected, a few pre-tests were conducted to determine the
effect of cross traffic. With one FTP connection, NetMeeting was able to establish the

66
communication. With one FTP and one HTTP connection, the VoIP communication was
still possible. However, with one FTP and two HTTP connections, NetMeeting was not
able to setup the connection. So, the experiment on WAN was conducted with one FTP
and one HTTP connection as traffic.
As this configuration posed a security risk for the NPS network, an ad hoc IP
address (cherry - 131.120.8.143) was temporarily used for the internal machine during
the experiment. This address has been registered with the school DNS as a member of
the SAAM domain. After the test, the machine’s address was switched back to “magma”.
Moreover, Adware was used after each test to scan all memory, registry, and hard drive
to discover and deal with potential intrusions. Adware is available to download at
www.lavasoft.com.
F. DATA ANALYSIS METHOD
The captured packets were first loaded to Ethereal as UDP or TCP packets. Then
the decode option of Ethereal was used to instantiate RTP or RTCP packets based on port
numbers. Finally, the display filter was used to discard other types of packets.. Some
pertinent information was then gathered and written to text files by using the print option
available in Ethereal. The results were imported into MS Excel to determine RTP packet
delay and jitter statistics. Excel macros were written to allow repetitive calculation.
Analysis of data from the WAN test was quite difficult because, among more than ten
thousand RTP packets, there were many instances of packet reordering and packet loss.
Their detections required checking the RTP sequence number of each packet. Similar to
RTP, derivation of RTCP information required matching one packet’s LSR timestamp
with another packet’s MSW/LSW NTP timestamp. These processes are time-consuming
when analyzing without automatic tools.

67
VII. TEST RESULTS
A. TEST RECORD
After the tests were completed, the raw transmission time of each individual RTP
packet was determined. The clock drift was then estimated and the RTP packet delay was
adjusted accordingly. This RTP delay was also used to calculate the inter-arrival jitter.
Moreover, RTCP messages were analyzed to obtain the RTP delay and jitter samples.
There values were then plotted in the same graph for comparison purpose.
B. TEST SUMMARY
Tests on LAN were conducted twice, to compare the model accuracy. The campus
test, wireless test, and WAN test were performed once. For the wireless test, traffic in
only one direction (from laptop to desktop) could be recorded by Ethereal. To determine
the clock drift between the laptop and desktop, they were temporarily connected using a
crossover cable and a series of pings were sent from one host to the other. Ethereal
captured the departure and arrival times of these pings messages at the hosts. Since the
communication delay in this setup was negligible, the difference of the departure and
arrival times of a ping message was used as one sample for clock drift.
In all graphs presented below, the names of test computers are abbreviated in the
following the way: m for magma (desktop), c for cherry (desktop), and b for berry
(laptop).
According to the results from the LAN and campus tests, the transmission delay
of RTP packet in such environments is very low. For the wireless LAN test, the average
delay was a little bit longer. The WAN test produced the largest delays. Every test was
first evaluated based on the assumption of symmetric delay. Only for the WAN test,
asymmetric delays were also considered.
C. LAN TEST
Test Code : Test 101, 102
Description : VoIP on LAN
Location : SAAM Research Lab, SP-238

68
Figure 39. LAN Test Result (1)
Figure 40. LAN Test Result (2)
Propagation Time - LAN 101
-10
-8
-6
-4
-2
0
2
4
6
8
10
0 1,000 2,000 3,000 4,000 5,000 6,000
Packet No.
Del
ay (
ms)
RTP Delay m-->b RTP Delay b-->m RTCP Delay Poly. (RTCP Delay)
Jitter - LAN 101 (m->b)
-15
-10
-5
0
5
10
15
0 1,000 2,000 3,000 4,000 5,000 6,000
Packet No.
Jitt
er (
ms)
Jitter pure Dij Jitter RFC 1889 J RTCP Jitter on B Poly. (RTCP Jitter on B)

69
Figure 41. LAN Test Result (3)
Figure 42. LAN Test Result (4)
Propagation Time - LAN 102
-10
-8
-6
-4
-2
0
2
4
6
8
10
0 1,000 2,000 3,000 4,000 5,000 6,000
Packet No.
Del
ay (m
s)
RTP Delay m-->b RTP Delay b-->m RTCP Delay Poly. (RTCP Delay)
Jitter - LAN 101 (b->m)
-15
-10
-5
0
5
10
15
0 1,000 2,000 3,000 4,000 5,000 6,000
Packet No.
Jitt
er (
ms)
Jitter pure Dij Jitter RFC 1889 J RTCP Jitter on M Poly. (RTCP Jitter on M)

70
Figure 43. LAN Test Result (5)
Figure 44. LAN Test Result (6)
Jitter - LAN 102 (b->m)
-15
-10
-5
0
5
10
15
0 1,000 2,000 3,000 4,000 5,000 6,000
Packet No.
Jitt
er (
ms)
Jitter pure Dij Jitter RFC 1889 J RTCP Jitter on M Poly. (RTCP Jitter on M)
Jitter - LAN 102 (m->b)
-15
-10
-5
0
5
10
15
0 1,000 2,000 3,000 4,000 5,000 6,000
Packet No.
Jitt
er (
ms)
Jitter pure Dij Jitter RFC 1889 J RTCP Jitter on B Poly. (RTCP Jitter on B)

71
D. CAMPUS TEST
Test Code : Test 301
Description : VoIP on NPS Campus
Location : School network between Root Hall and Spanegel Hall
Figure 45. Campus Test Result (1)
RTCP Delay - Campus 301
-10
-5
0
5
10
15
20
0 2,000 4,000 6,000 8,000 10,000 12,000 14,000
Packet No.
Del
ay (
ms)
Symmetric RTCP Delay b->m Symmetric RTCP Delay m->b
Poly. (Symmetric RTCP Delay b->m) Poly. (Symmetric RTCP Delay m->b)

72
Figure 46. Campus Test Result (2)
Figure 47. Campus Test Result (3)
Propagation Time - Campus 301 (m->b)
-10
-5
0
5
10
15
20
0 2,000 4,000 6,000 8,000 10,000 12,000 14,000
Packet No.
Del
ay (m
s)
RTP Delay m->b Symmetric RTCP Delay m->b Poly. (Symmetric RTCP Delay m->b)
Propagation Time - Campus 301 (b->m)
-10
-5
0
5
10
15
20
0 2,000 4,000 6,000 8,000 10,000 12,000 14,000
Packet No.
Del
ay (m
s)
RTP Delay b->m Symmetric RTCP Delay b->m Poly. (Symmetric RTCP Delay b->m)

73
Figure 48. Campus Test Result (4)
Figure 49. Campus Test Result (5)
Jitter - Campus 301 (b->m)
-5
0
5
10
15
20
25
30
35
40
0 2,000 4,000 6,000 8,000 10,000 12,000 14,000
Packet No.
Jitt
er (
ms)
Jitter pure Dij Jitter RFC 1889 J RTCP Jitter
Jitter - Campus 301 (m->b)
-5
0
5
10
15
20
25
30
35
40
0 2,000 4,000 6,000 8,000 10,000 12,000 14,000
Packet No.
Jitt
er (
ms)
Jitter pure Dij Jitter RFC 1889 J RTCP Jitter

74
E. WAN TEST
Test Code : Test 201
Description : VoIP on WAN
Location : Link between computer in NPS network lab in Spanagel Hall and remote home computer using regular dial- in to commercial ISP
Figure 50. WAN Test Result (1)
RTCP Delay - WAN 201
0
500
1000
1500
2000
2500
0 2,000 4,000 6,000 8,000 10,000 12,000Packet No.
Del
ay (m
s)
Symmetric RTCP Delay b->c Symmetric RTCP Delay c->b
Poly. (Symmetric RTCP Delay b->c) Poly. (Symmetric RTCP Delay c->b)

75
Figure 51. WAN Test Result (2)
Figure 52. WAN Test Result (3)
Propagation Time - WAN 201 (c->b) Sym
0
500
1000
1500
2000
2500
3000
3500
4000
0 2,000 4,000 6,000 8,000 10,000 12,000 14,000Packet No.
Del
ay (m
s)
RTP Delay c-->b Symmetric RTCP Delay c->b Poly. (Symmetric RTCP Delay c->b)
Propagation Time - WAN 201 (b->c) Sym
0
500
1000
1500
2000
2500
3000
3500
4000
0 2,000 4,000 6,000 8,000 10,000 12,000 14,000Packet No.
Del
ay (m
s)
RTP Delay b-->c Symmetric RTCP Delay b->c Poly. (Symmetric RTCP Delay b->c)

76
Figure 53. WAN Test Result (4)
Figure 54. WAN Test Result (5)
Propagation Time - WAN 201 (c->b) Asym
0
500
1000
1500
2000
2500
3000
3500
4000
0 2,000 4,000 6,000 8,000 10,000 12,000 14,000Packet No.
Del
ay (m
s)
RTP Delay c-->b Asymmetric RTCP Delay c->b Poly. (Asymmetric RTCP Delay c->b)
Propagation Time - WAN 201 (b->c) Asym
0
500
1000
1500
2000
2500
3000
3500
4000
0 2,000 4,000 6,000 8,000 10,000 12,000 14,000Packet No.
Del
ay (m
s)
RTP Delay b-->c Asymmetric RTCP Delay b->c Poly. (Asymmetric RTCP Delay b->c)

77
Figure 55. WAN Test Result (6)
Figure 56. WAN Test Result (7)
Jitter - WAN 201 (b->c)
-1000
-800
-600
-400
-200
0
200
400
600
800
1000
0 2,000 4,000 6,000 8,000 10,000 12,000 14,000
Packet No.
Jitt
er (m
s)
Jitter pure Dij Jitter RFC 1889 J RTCP Jitter
Jitter - WAN 201 (c->b)
-1000
-800
-600
-400
-200
0
200
400
600
800
1000
0 2,000 4,000 6,000 8,000 10,000 12,000 14,000
Packet No.
Jitt
er (m
s)
Jitter pure Dij Jitter RFC 1889 J RTCP Jitter
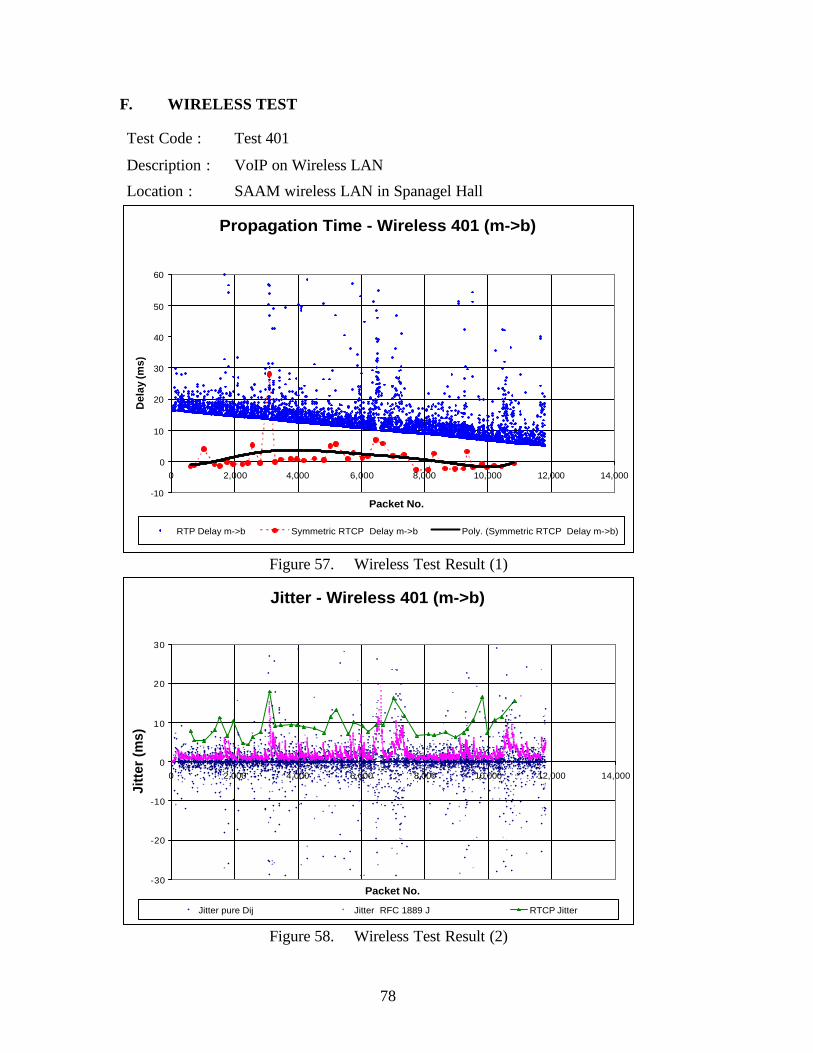
78
F. WIRELESS TEST
Test Code : Test 401
Description : VoIP on Wireless LAN
Location : SAAM wireless LAN in Spanagel Hall
Figure 57. Wireless Test Result (1)
Figure 58. Wireless Test Result (2)
Jitter - Wireless 401 (m->b)
-30
-20
-10
0
10
20
30
0 2,000 4,000 6,000 8,000 10,000 12,000 14,000
Packet No.
Jitt
er (
ms)
Jitter pure Dij Jitter RFC 1889 J RTCP Jitter
Propagation Time - Wireless 401 (m->b)
-10
0
10
20
30
40
50
60
0 2,000 4,000 6,000 8,000 10,000 12,000 14,000
Packet No.
Del
ay (m
s)
RTP Delay m->b Symmetric RTCP Delay m->b Poly. (Symmetric RTCP Delay m->b)

79
G. MOS RESULT
The following table summarizes the average score of the test result.
Table 13. Test MOS
MOS Test Magma to Berry Berry to Magma
LAN 2.7 2.7 Campus 2.2 3.5 WAN 2.7 3.2
Wireless 3.2 3.5

80
THIS PAGE INTENTIONALLY LEFT BLANK

81
VIII. DATA ANALYSIS
A. GENERAL
The collected data shows that all RTP packets are 78 bytes long while the RTCP
packet sizes range from 86 to 130 bytes depending on the type of report appended.
NetMeeting was configured to run with G.723.1 at 6.3 kbps data rate for audio using the
default silence suppression algorithm. The voice payload is 24 bytes long. The absence of
redundant voice blocks implies that NetMeeting did not use FEC mechanism.
In the 14 bytes of IP header, the TOS field had all zeros, corresponding to the
following priority:
0000 00 DSCP (Differentiate Service Code Point) Default 0 0 ECT (ECN-Capable Transport) Default 0 0 ECN-CE
The default code point indicates that no expedite request mechanism was turned on for all
voice packets. The UDP header is 8 bytes long while the RTP header has a regular length
of 12 bytes. In other words, no header compression was used during the tests.
Some RSVP messages were generated to reserve path for voice packets but they
have little impact since no WFQ, MPLS, and TOS mechanisms were set up on the
routers. The FTP cross traffic seemed to cause the delay to fluctuate in only one
direction.
B. CLOCK
Some RTP packets have negative delay value as a result of Microsoft Windows’
low clock granularity at 10 ms. These negative numbers are acceptable since they are
minimal. Testing on clock drift with a crossover cable shows that two different computers
may run on different clock speed. The system clock on the desktop with 1.5 GHz CPU
always runs slightly faster than the one on the notebook with 1 GHz CPU. The
phenomena makes clock drift between the two systems grow larger as time goes by.
Moreover, after restarting the system, the clock drift jumps significantly unlike the linear
drift increase during normal operation. The inconsistent drift makes all delay values on
each packet constantly deviate from the fixed number and shown as slant line in the
propagation time graphs of LAN, Campus, and Wireless tests.

82
C. LAN TEST
The average RTP propagation time during the LAN test is approximate 1 ms
while RTCP reports small negative delay values due to coarse clock granularity. The
average pure jitter and the RFC 1889 jitter have the same value while RTCP reports a
little higher number. This difference can be considered negligible. The packet loss is
reported as 0, consistent with the real RTP packet count. So, RTCP is accurate in a LAN
environment.
D. CAMPUS TEST
The test on NPS campus was conducted after a major infrastructure upgrade. All
results are very similar to those in the LAN environment. RTCP still reports small
negative delays while RTP propagation times are about 1 ms. Moreover, the jitter level is
small with an average of less than 10 ms. RTCP reports zero packet loss while the actual
loss rate is in the range of 0.01%. Therefore in this environment, RTCP is reliable to
report RTP behaviors.
The small delay and loss rate values indicate that NPS backbone is appropriate for
VoIP applications. However, audio card quality is found to be a major factor affecting
VQ. With a low-grade soundcard, testers can experience echo and voice distortion though
the voice was fully intelligible.
E. WAN TEST
Data collected from the WAN test shows that the FTP cross traffic causes large
delay fluctuations for RTP packets, ranging from 120 to 3900 ms. On the other direction
without FTP data traffic, the delay is pretty stable at approximate 121 ms. This value is
not exactly accurate due to clock drift, however, it lies within reasonable delay range. A
separate test with ping reported an average roundtrip time of 140 ms.
With the assumption that the propagation times are symmetric, the half value of
RTCP sample delays cannot represent the actual delay pattern of all RTP packets. When
asymmetric delays are considered by using a constant delay at 121 ms in one direction,
RTCP delay trend seems to be more realistic but is still not close to the real delay. For the
direction with large delay fluctuations, RTCP reports a packet loss rate of 4.7% while the
real loss rate is at 5.1%. So the difference is small. The other direction has 0 packet loss
rate, matching the 0 loss rate reported by RTCP in this direction.
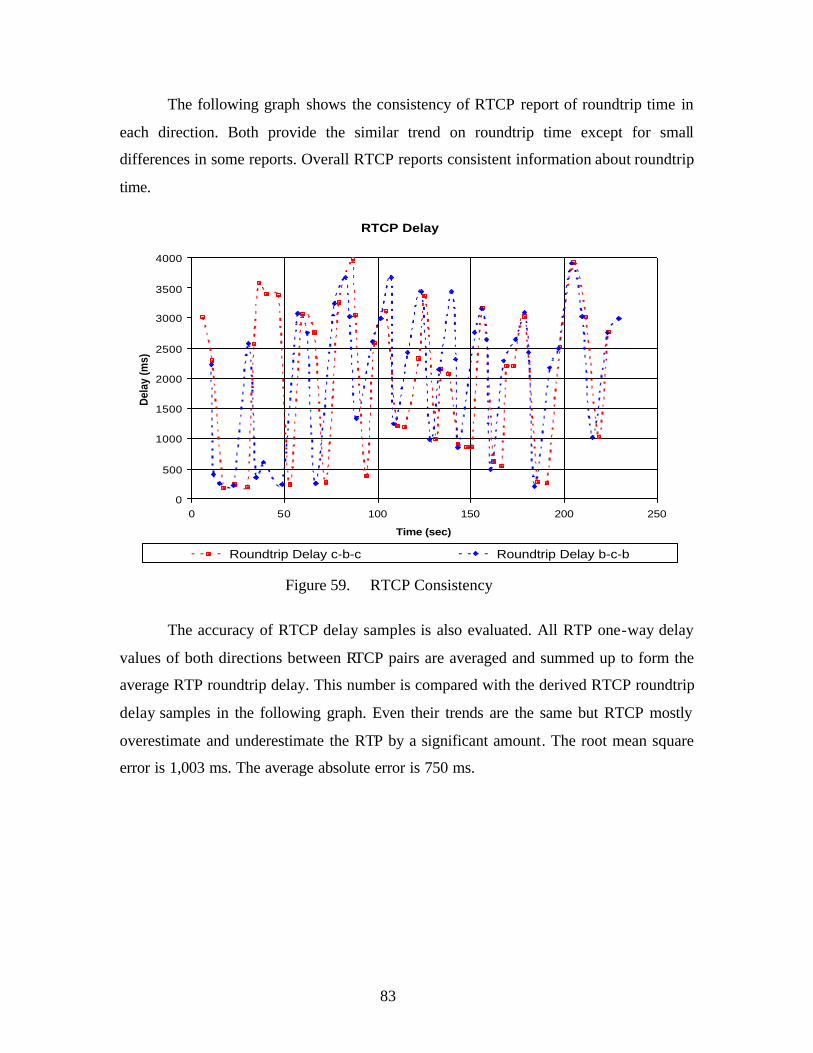
83
The following graph shows the consistency of RTCP report of roundtrip time in
each direction. Both provide the similar trend on roundtrip time except for small
differences in some reports. Overall RTCP reports consistent information about roundtrip
time.
Figure 59. RTCP Consistency
The accuracy of RTCP delay samples is also evaluated. All RTP one-way delay
values of both directions between RTCP pairs are averaged and summed up to form the
average RTP roundtrip delay. This number is compared with the derived RTCP roundtrip
delay samples in the following graph. Even their trends are the same but RTCP mostly
overestimate and underestimate the RTP by a significant amount. The root mean square
error is 1,003 ms. The average absolute error is 750 ms.
RTCP Delay
0
500
1000
1500
2000
2500
3000
3500
4000
0 50 100 150 200 250
Time (sec)
Del
ay (m
s)
Roundtrip Delay c-b-c Roundtrip Delay b-c-b

84
Figure 60. RTCP Accuracy
F. WIRELESS TEST
Data collected from the encrypted wireless LAN test indicates that the average
RTP packet delay is approximately 10 ms. This test was conducted in a worst case
scenario where the test node was far away from the access point and the signal strength
indicator turned yellow. The raw capacity was approximate 2 Mbps. RTCP works
consistently with RTP on reporting the delay. The jitter is minimal and there is no packet
loss.
G. MOS
Voice traffic with delay over 250 ms was still intelligible but a user must
temporarily wait before responding. Without echo, the VQ was considered acceptable
because the users already expect the quality to be less than the traditional telephone
grade. The quality of headphone is another issue to be considered since it affects a lot of
hearing satisfaction. Anyway, it is not suitable to use the test values to evaluate the E-
Comparison of Roundtrip Time
0
500
1,000
1,500
2,000
2,500
3,000
3,500
4,000
0 2,000 4,000 6,000 8,000 10,000 12,000
Packet No.
Tota
l Rou
ndtr
ip T
ime
(ms)
RTP 1W Delay Summation c-b-c RTCP Roundtrip Delay c-b-c
Poly. (RTP 1W Delay Summation c-b-c) Poly. (RTCP Roundtrip Delay c-b-c)

85
model because of the ad hoc selections of test environments and tester group. This may
be a good area for further study.
H. RATIO OF RTP AND RTCP PACKETS
The protocol analyzer collected a total of 84 RTCP packets and a total of 11,738
RTP packets. Thus the SR generation rate is approximate 0.72 % of that of RTP message
generation.

86
THIS PAGE INTENTIONALLY LEFT BLANK

87
IX. SUMMARY
A. TEST SUMMARY
To estimate the performance of a VoIP application, the most popular method is to
monitor the RTCP packets. Testing on low delay networks – such as LAN, campus
backbone, and wireless LAN – has demonstrated high reliability of the RTCP
performance sampling method even though there are small distortions due to coarse host
clock granularity. However, testing on a public network with large delay variations has
indicated a low accuracy for the RTCP report mechanism. This deficiency may be caused
by the low sampling rate of the RTCP method.
In a session with few participants, typically RTCP messages are sent
approximately every 5 seconds. However, in a multi-party conference, RTCP messages
may be sent out every 30 seconds because this protocol is designed to be scalable to
accommodate thousands of users. According to this design, the more participants in the
conference, the less frequently each terminal sends RTCP packets. As RTCP is designed
to provide feedback information on the quality of data distribution, the corresponding
VoIP application will use this data to diagnose faults and control how RTP packets might
be sent. Therefore, reliability of RTCP may become a major issue for large multi-party
conferences.
The WAN test shows that the symmetric delay approach that has been often used
in prior research may not be suitable. It is more appropriate to determine the delay in
each direction because each user may experience different VQ.
Finally, the test results indicate that NPS infrastructure is ready for deployment of
VoIP, even with encrypted wireless LAN extensions. The voice transport delay is found
to be very low and does not affect VQ. However, the network administrator should
configure routers to support DiffServ and RSVP to give voice data precedence over
relatively delay- insensitive traffic (Web, email, etc.).
B. FUTURE WORK
This study has discovered that the RTCP mechanism of estimating VoIP
performance may be ineffective over networks with large, volatile delays. Despite some
88
drawbacks, RTCP is widely used to determine the performance of real-time multimedia
applications. Therefore, RTCP should be enhanced to provide more accurate information.
It might be possible to adapt the RTCP report interval to suit such a requirement. This
implementation can be evaluated on the same WAN test environment used by this
research.
Another interesting area for future work is the E-model. Since E-model was
developed in a controlled environment and tested with one individual performance factor
at a time, there might be some redundancy when all factors are integrated to one model.
Testing on real environments can further validate this model but a lot of resources are
required.
Finally, it will be interesting to test the performance of video phone applications.
The integration of voice and video media may further test the reliability of RTCP since
the media frame size is much larger and more bandwidth is required.

89
GLOSSARY
ACR Absolute Category Rating ARQ Automatic Repeat reQuest CNG Comfort Noise Generator DSP Digital Signal Processor EN Enterprise Network ERL Echo Return Loss FEC Forward Error Correction FEC Front-End Clipping HOT Holdover Time IETF Internet Engineering Task Force IEC International Engineering Consortium IP Internet Protocol IPX Internet Packet Exchange ISDN Integrated Services Digital Network IT Information Technology IWF Inter-Working Function LAN Local Area Network LSR Last Sender Report MAN Metropolitan Area Network MCU Multipoint Control Unit MLSNCC Maximum Length Sequence Normalized Cross-Correlation MOS Mean Opinion Score NTP Network Time Protocol PAMS Perceptual Analysis Measurement System PBX Private Branch Exchange PCM Pulse Code Modulation PING Packet Internet Groper PSQM Perceptual Speech-Quality Measurement PSTN Public Switching Telephone Network RAS Registration, Admission, and Status RAS Remote Authentication Service RR Receiver Report

90
RSVP Resource Reservation Protocol RTCP Real-time Transport Control Protocol RTP Real-time Transport Protocol SCN Switched-Circuit Network SIP Session Initiation Protocol SNTP Simple Network Time Protocol SR Sender Report TCP Transmission Control Protocol TELR Talker Echo Loudness Rating UDP User Datagram Protocol VAD Voice Activity Detector VoIP Voice over Internet Protocol VPN Virtual Private Network VQ Voice Quality WAN Wide Area Network WEP Wired Equivalent Privacy WFQ Weighted Fair Queuing

91
LIST OF REFERENCES
[1] Lucent Technologies, “MultiVoice VoIP Solutions, Revenue Opportunities for Service Providers”, whitepaper, [http://www.lucent.com], 2000.
[2] Intel Corporation, “IP Telephony Basics”, [http://www.intel.com/network/csp/resources/white_papers/4070web.htm], 1999.
[3] Elachi, Joanna, “VoIP Market Growing Rapidly”, [http://www.commweb.com/article/COM2001040S0006], 2001.
[4] Lucent Technologies, “Voice over IP Profit Guide for Service Providers”, white paper, [http://www.lucent.com], 1999.
[5] TIA, Telecommunication Industry Association, “Market Development: VoIP Market Positioned for Sustained Robust Growth”, Pulse Online, Volume 2, Issue 9, [http://pulse.tiaonline.org], July 2001.
[6] ITU-T Recommendation H.323, Packet-Based Multimedia Communication Systems, 1999.
[7] Equivalence, “H.323 Standards”, [http://www.openh323.org], 2002.
[8] The Internet Engineering Consortium, “H. 323”, Web ProForum Tutorials, [http://www.iec.org], June 2002.
[9] The Internet Engineering Consortium, “Internet Telephony”, Web ProForum Tutorials, [http://www.iec.org], June 2001.
[10] The Internet Engineering Consortium, “Voice and Fax over Internet Protocol (V/FoIP)”, Web ProForum Tutorials, [http://www.iec.org], March 2002.
[11] Cisco System, “Understanding Delay in Packet Voice Networks”, white paper, [http://www.cisco.com], July 2002.
[12] Tom Sheldon and Big Sur Multimedia, “Compression Techniques”, [http://www.linktionary.com/c/compression.html], August 2002.
[13] RFC 1889, RTP: A Transport Protocol for Real-Time Applications, Schulzrinne, H., et al., January 1996.
[14] Cisco System, “Cisco IP Telephony QoS Design Guide”, white paper, [http://www.cisco.com], July 2002.
[15] The Internet Engineering Consortium, “Voice Quality (VQ) in Converging Telephony and IP Networks”, Web ProForum Tutorials, [http://www.iec.org], July 2002.

92
[16] Mockingbird Networks, “Transporting Voice over IP : The Issues of Quality, Echo, and Latency”, white paper, [http://www.mockingbirdnetworks.com/pdfs/wp_transportvoice.pdf], June 2002.
[17] Miyata, T., Fukuda, H., and Ono, S., “New Network QoS Measures for FEC-based Audio Applications on the Internet”, IEEE 1998, pp 355-362.
[18] Hall, Timothy A., “Objective Speech Quality Measures for Internet Telephony”, National Institute of Standards and Technology, April 2000.
[19] Pearsall, Susan, and Waller, John Q., “Doing a VoIP Assessment with Chariot VoIP Assessor”, white paper, [www.netiq.com], May 2002.
[20] Meeting conversation between Xie, Geoffrey, Naval Postgraduate School and the author, April-August 2002.
[21] RFC 1305, Network Time Protocol (version 3): Specification, Implementation, and Analysis, Mill, David L., March 1992.
[22] RFC 1769, Simple Network Time Protocol (SNTP), Mills, D., March 1995.
[23] Brandolini, Shala, and Green, Darin, “The Windows Time Service”, Microsoft Windows 2000 Server Technical Article, [www.microsoft.com/windows2000/server], April 2000.
[24] Fonseca, Jose and Stanton, Michael, “A Methodology for Performance Analysis of Real-Time Continuous Media Applications”, paper presented at the 12th International Workshop on Distributed Systems: Operations and Management (DSOM 2001), Nancy, France, 15 October 2001.
[25] GPS Clock, “GPS Clock for Time Synchronization”, [www.gpsclock.com], 2001.
[26] ITU-T Recommendation P.800, Methods for Subjective Determination of Transmission Quality.
[27] net.com, “The Mean Opinion Score”, white paper, [www.net.com/products/narrowband/repository/white_papers/mos_wp], March 2002.
[28] Walker, John Q., and Hicks, Jeffrey T., “Planning for VoIP”, Net IQ Corporation white paper, [www.netiq.com], April 2002.
[29] ITU-T Recommendation G.107, The E-Model, a computational model for use in transmission planning.
[30] Cisco System, “VoIP - Understanding Codecs: Complexity, Support, MOS, and Negotiation”, white paper, [http://www.cisco.com/warp/public/788/voip/codec_complexity.html], May 2002.

93
[31] NetPredict, “Assess the Ability of Your Network To Handle VoIP Before You Commit”, white paper, [www.netpredict.com], April 2002.
[32] Telecommunications Industry Association, “PN-4689 Voice Quality Recommendations for IP Telephony”, [ht tp://ftp.tiaonline.org/tr-41/Tr4112/Public/Latest_Revision_of_PN-4689/PN4689.pdf], June 2002.
[33] Shenton, Chris, “Netmeeting Security Concerns and Deployment Issues”, [http://www.shenton.org/~chris/nasa-hq/netmeeting/], October 1998.

94
THIS PAGE INTENTIONALLY LEFT BLANK

95
BIBLIOGRAPHY
Nguyen, T., et.al, “Voice over IP Service and Performance in Satellite Networks”, IEEE Communications Magazine, pp. 164-171, March 2001.

96
THIS PAGE INTENTIONALLY LEFT BLANK

97
INITIAL DISTRIBUTION LIST
1. Defense Technical Information Center Ft. Belvoir, Virginia
2. Dudley Knox Library Naval Postgraduate School Monterey, California
3. Professor Peter J. Denning, Code CS Naval Postgraduate School Monterey, CA 93943-5100
4. Professor Geoffry Xie, code CS/XI
Naval Postgraduate School Monterey, CA 93943-5100
5. Professor Burt Lundy, code CS/LN Naval Postgraduate School Monterey, CA 93943-5100