thinking inside the risky bucket
TRANSCRIPT

© STRATEGIC ASSET ALLIANCE, INC. Document not to be reproduced without the explicit consent of SAA.
Thinking Inside the Risky Bucket
March 19th, 2015
Mr. Alton Cogert, CFA, CPA, CAIA, CGMA
- President and Chief Executive Officer
Mr. Daniel G. Smereck
- Managing Director
Where are my peers taking risks?
What should be considered?
How to determine risk appetite?
2
Thinking Inside the Risky Bucket

WHERE ARE MY PEERS TAKING RISKS?
3Source: Strategic Asset Alliance, SNL

P/C INSURERS
4

5
Bonds Rated BBB/Surplus – P/C
Source: Strategic Asset Alliance, SNL
*NAIC bonds rated 2

6
High Yield/Surplus – P/C
Source: Strategic Asset Alliance, SNL
*NAIC rated bonds 3-6

7
Common Stock/Surplus – P/C
Source: Strategic Asset Alliance, SNL

8
Risk Assets/Surplus
Source: Strategic Asset Alliance, SNL
*Risk assets include High Yield, Common Stock, Preferred Stock, & Schedule Ba
9
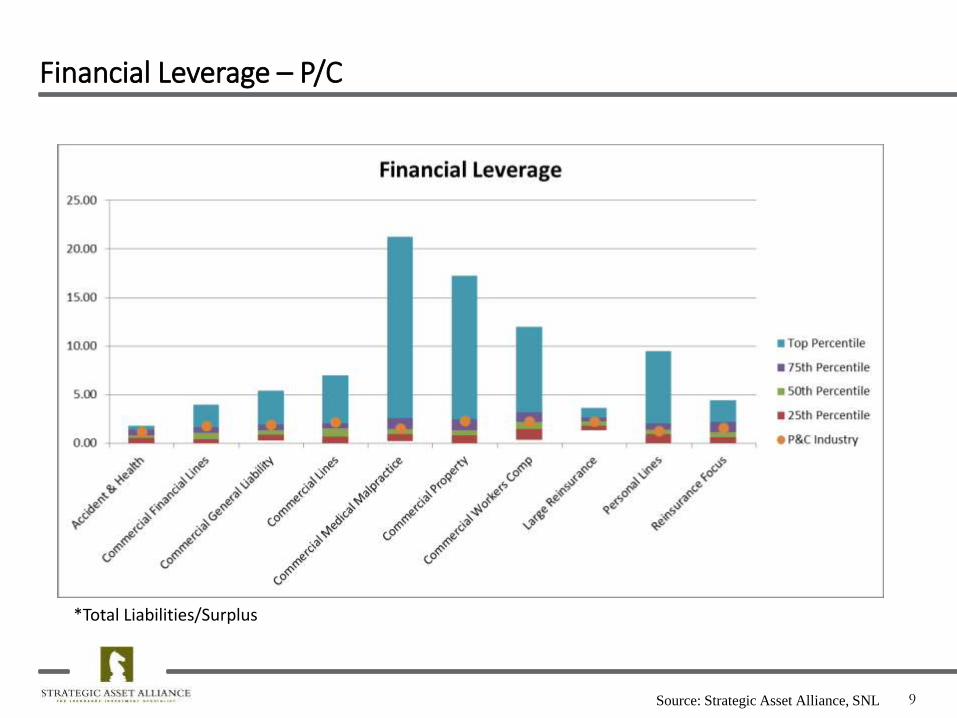
Financial Leverage – P/C
Source: Strategic Asset Alliance, SNL
*Total Liabilities/Surplus

10
Operating Leverage – P/C
Source: Strategic Asset Alliance, SNL
*Net Premiums/Surplus

LIFE INSURERS
11

12
Bonds Rated BBB/Surplus - Life
Source: Strategic Asset Alliance, SNL
*NAIC bonds rated 2

13
High Yield/Surplus - Life
Source: Strategic Asset Alliance, SNL
*NAIC rated bonds 3-6

14
Common Stock/Surplus - Life
Source: Strategic Asset Alliance, SNL

15
Risk Assets/Surplus - Life
Source: Strategic Asset Alliance, SNL
*Risk assets include High Yield, Common Stock, Preferred Stock, & Schedule Ba

16
Financial Leverage - Life
Source: Strategic Asset Alliance, SNL
*Total Liabilities/Surplus

17
Operating Leverage - Life
Source: Strategic Asset Alliance, SNL
*Net Premiums/Surplus

HEALTH INSURERS
18

19
Bonds Rated BBB/Surplus
Source: Strategic Asset Alliance, SNL
*NAIC bonds rated 2
20
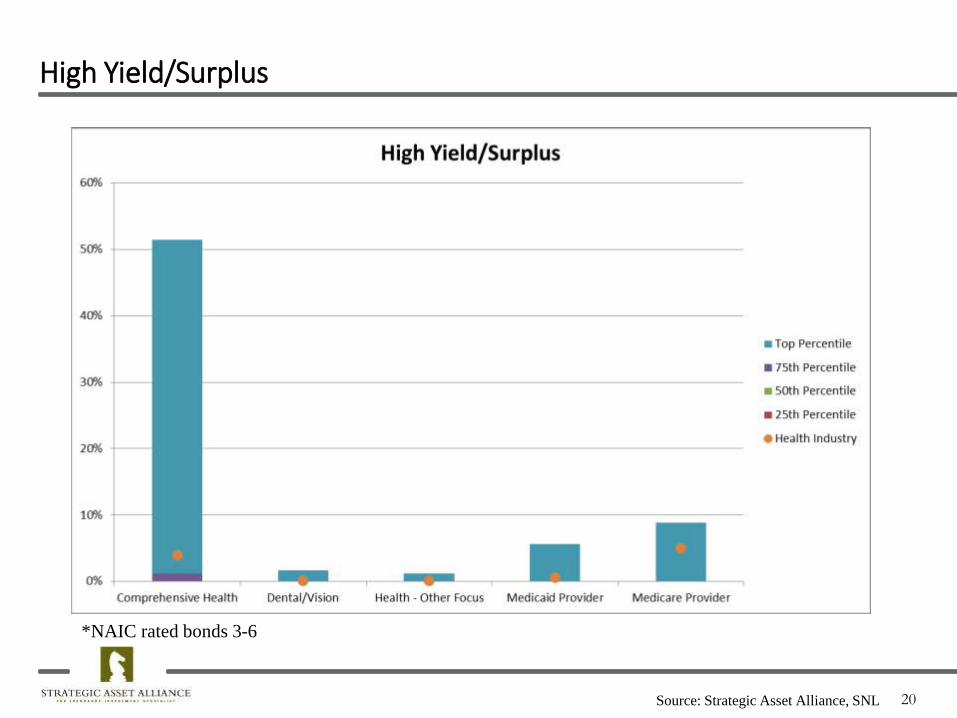
High Yield/Surplus
Source: Strategic Asset Alliance, SNL
*NAIC rated bonds 3-6

21
Common Stock/Surplus
Source: Strategic Asset Alliance, SNL

22
Risk Assets/Surplus
Source: Strategic Asset Alliance, SNL
*Risk assets include High Yield, Common Stock, Preferred Stock, & Schedule Ba

23
Financial Leverage
Source: Strategic Asset Alliance, SNL
*Total Liabilities/Surplus

24
Operating Leverage
Source: Strategic Asset Alliance, SNL
*Net Premiums/Surplus

GOVERNMENT RISK POOLS
25

SAA Governmental Pooling Clients
o 15 Clients (12 Primary / 3 Reinsurers)
o 25 Portfolios
o $2.6B In Assets
$2.2B Core Fixed Income (85%)
$0.4B Risk Assets (15%)
26
Peer Analysis Overview

27
Risk Asset Allocation: % of Members Equity
28
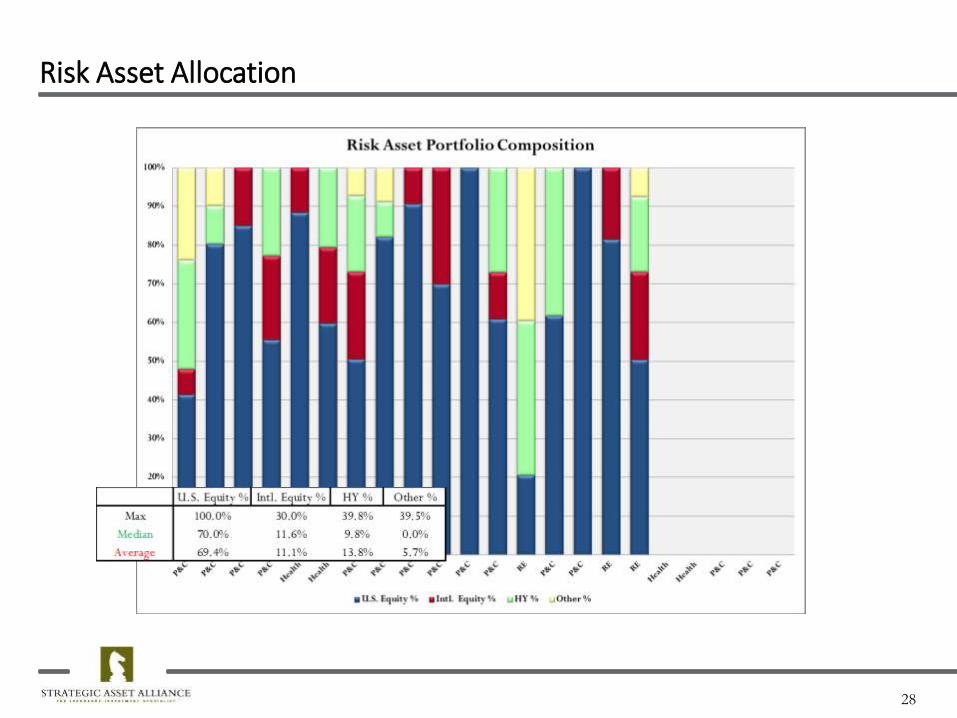
Risk Asset Allocation

29
Investment Leverage & Risk Asset Allocation
30
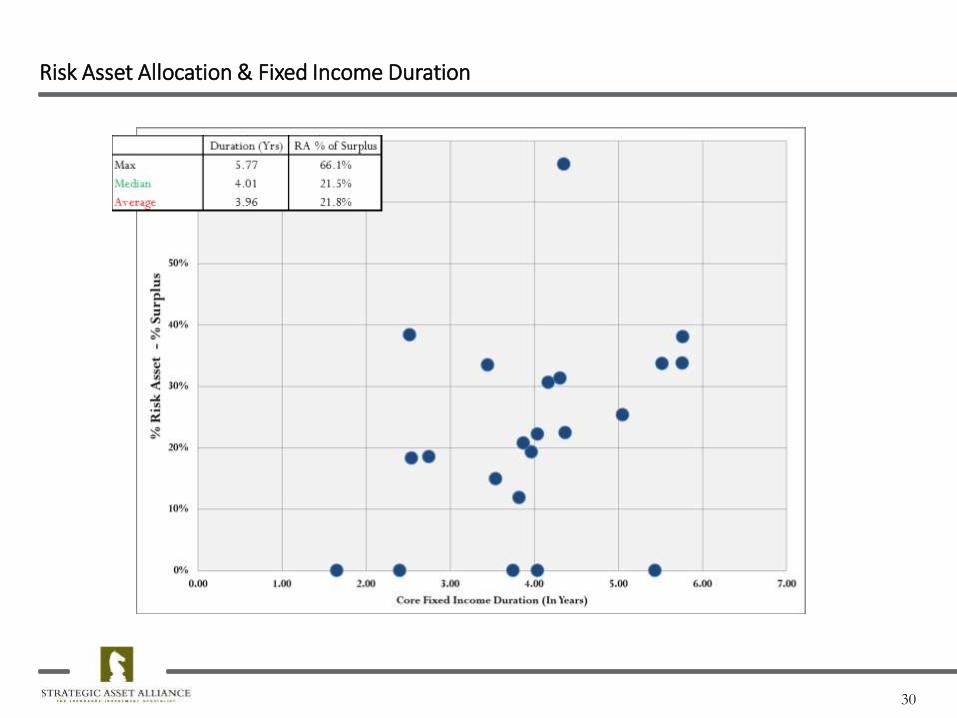
Risk Asset Allocation & Fixed Income Duration

WHAT SHOULD BE CONSIDERED?
31Source: Strategic Asset Alliance, SNL

© STRATEGIC ASSET ALLIANCE, INC. Document not to be reproduced without the explicit consent of SAA.
Asset classes not noted in Q3 US/Canada Searches that we have seen:
o Bank Loans
o Commercial Mortgage Loans
o High Grade High Yield Bonds
o Private Placements
Also seen, as in Q3 US/Canada Searches:
o Dividend Equity
o Emerging Market Equities
o Various Style Box Equities – US and Non-US – ETFs/Index Funds
What SAA has seen…

© STRATEGIC ASSET ALLIANCE, INC. Document not to be reproduced without the explicit consent of SAA.
Unconstrained Bond Strategies
Varied ETF Strategies
‘Smart’ Beta Strategies
‘New and Improved’ Structured Securities
Other
But there will be more to consider, including…

HOW TO DETERMINE RISK APPETITE?
34Source: Strategic Asset Alliance, SNL

35
Drawdown Analysis

36
A ‘More Reasonable’ Comparison

37
A ‘More Reasonable’ Comparison…?