third review of the pakistan-china fta and recommendations ... · pakistan-china bilateral trade...
TRANSCRIPT
Third Review of thePakistan-China FTA andRecommendations forPhase 2 Negotiations
Third Review of the Pakistan-China FTA andRecommendations for Phase 2 Negotiations
November 2016

Acknowledgements:
Team Leader: Samir S. AmirLead Researcher: Falak Hadi
Disclaimer:
The findings, interpretations and conclusions expressed herein do not necessarily reflect the views of the Board of Directors and Members ofthe Pakistan Business Council or the companies they represent.
Any conclusions of analysis based on ITC, IDB, CTS, UNCTSD and WTO data are the responsibility of the author(s) and do not necessarily reflectthe opinion of the WTO, IMF or UN.
Although every effort has been made to cross-check and verify the authenticity of the data, the Pakistan Business Council or the author(s) donot guarantee the data included in this work. All data and statistics used are correct as of 1st September, 2016, and may be subject to change.Unless otherwise stated, all monetary amounts are given in USD (millions).
For any queries or feedback regarding this report, please contact [email protected] or [email protected]
Third Review of the Pakistan-China FTA and Recommendations for Phase 2 NegotiationsII
Table of Contents
List of Tables..................................................................................................................................................................................................................................VList of Figures ..............................................................................................................................................................................................................................VIList of Acronyms........................................................................................................................................................................................................................VIIThe Pakistan Business Council: An Overview .....................................................................................................................................................................VIIIExecutive Summary ....................................................................................................................................................................................................................XIIntroduction ................................................................................................................................................................................................................................XII
Section I: OverviewPakistan at a Glance ....................................................................................................................................................................................................................03China at a Glance.........................................................................................................................................................................................................................04Pakistan-China Bilateral Trade & Discrepancies in Reported Data .....................................................................................................................................05The China-Pakistan Economic Corridor ..................................................................................................................................................................................06
Section II: Pakistan's Exports to ChinaPakistan's Top Exports to China in 2015 (HS-6)......................................................................................................................................................................09Pakistan's Top Exports to China: 2006 - 2015 Comparison ...................................................................................................................................................11Pakistan's Exports to China: Indicative Potential 2015 with Tariffs (HS-6) ........................................................................................................................13Pakistan's Exports to China: China's Top Trade Partners and Tariffs..................................................................................................................................16Pakistan's Exports to China as a Percentage Share.................................................................................................................................................................18Pakistan's Exports to China - Trade Indicators .......................................................................................................................................................................19Pakistan's Exports to China - Revealed Comparative Advantage .......................................................................................................................................21
Section III: Pakistan's Imports from ChinaPakistan's Top Imports from China in 2015.............................................................................................................................................................................25Pakistan's Imports from China as a Percentage Contribution ..............................................................................................................................................27Pakistan's Top Imports from China: 2006 - 2015 Comparison..............................................................................................................................................28
Third Review of the Pakistan-China FTA and Recommendations for Phase 2 Negotiations III
Third Review of the Pakistan-China FTA and Recommendations for Phase 2 NegotiationsIV
Section IV: Pakistan's Top Export Commodities OverviewApparel (Knitted or Crocheted): HS-61 ...................................................................................................................................................................................31Apparel (Not Knitted or Crocheted): HS-62............................................................................................................................................................................32Cereals: HS-10..............................................................................................................................................................................................................................33Cotton: HS-52...............................................................................................................................................................................................................................34Iron & Steel: HS-72 ......................................................................................................................................................................................................................35Leather: HS-42..............................................................................................................................................................................................................................36Plastics: HS-39..............................................................................................................................................................................................................................37
AnnexuresAnnexure A: Pakistan's Top Exports to China........................................................................................................................................................................41Annexure B: Pakistan's Top Imports from China ...................................................................................................................................................................46Sources ..........................................................................................................................................................................................................................................51Methodology................................................................................................................................................................................................................................51
Effects of the FTA: Sectorial PerspectivesCotton and Textile Products ......................................................................................................................................................................................................55Paper and Paperboard ................................................................................................................................................................................................................56Banking / Financial Sector..........................................................................................................................................................................................................60Automotive Vehicles and Parts .................................................................................................................................................................................................61Polyester Filament Yarn, Polyester Chips and Polyethylene Terephthalate (PET) Resin .................................................................................................62
Third Review of the Pakistan-China FTA and Recommendations for Phase 2 Negotiations V
List of Tables
Table 1: Pakistan's Exports to China (Pakistan-Reported Data) ...........................................................................................................................................05
Table 2: Pakistan's Imports from China (China-Reported Data) ..........................................................................................................................................05
Table 3: Pakistan's Top Exports to China in 2015....................................................................................................................................................................09
Table 4: Pakistan's Top Exports to China: Pre-FTA ................................................................................................................................................................11
Table 5: Pakistan's Top Exports to China: Indicative Potential .............................................................................................................................................13
Table 6: Pakistan's Exports to China: Tariff Comparison.......................................................................................................................................................17
Table 7: Pakistan's Exports to China: Trade Indicators ..........................................................................................................................................................19
Table 8: Revealed Comparative Advantage.............................................................................................................................................................................21
Table 9: Pakistan's Top Imports from China in 2015 ..............................................................................................................................................................25
Table 10: Pakistan's Top Imports from China Pre-FTA..........................................................................................................................................................28
Table 11: HS-61 Exports..............................................................................................................................................................................................................31
Table 12: HS-62 Exports..............................................................................................................................................................................................................32
Table 13: HS-10 Exports..............................................................................................................................................................................................................33
Table 14: HS-52 Exports..............................................................................................................................................................................................................34
Table 15: HS-72 Exports..............................................................................................................................................................................................................35
Table 16: HS-42 Exports..............................................................................................................................................................................................................36
Table 17: HS-39 Exports..............................................................................................................................................................................................................37
Third Review of the Pakistan-China FTA and Recommendations for Phase 2 NegotiationsVI
List of Figures
Figure 1: Population (Pakistan) .................................................................................................................................................................................................03Figure 2: GDP (Pakistan) ............................................................................................................................................................................................................03Figure 3: GDP Growth (Annual %) (Pakistan) ........................................................................................................................................................................03Figure 4: Trade Balance (Pakistan)............................................................................................................................................................................................03Figure 5: Population (China)......................................................................................................................................................................................................04Figure 6: GDP (China).................................................................................................................................................................................................................04Figure 7: GDP Growth (Annual %) (Pakistan) ........................................................................................................................................................................04Figure 8: Trade Balance (China) ................................................................................................................................................................................................04Figure 9: Pakistan's Exports to China .......................................................................................................................................................................................05Figure 10: Pakistan's Imports from China ...............................................................................................................................................................................05Figure 11: CPEC Planned Map ..................................................................................................................................................................................................06Figure 12: Pakistan's Exports to China as a Percentage .........................................................................................................................................................18Figure 13: Revealed Comparative Advantage.........................................................................................................................................................................21Figure 14: Pakistan's Imports from China 1006-2015 .............................................................................................................................................................25Figure 15: Pakistan's Top Imports from China as a Percentage............................................................................................................................................27Figure 16: HS-61 Trade ...............................................................................................................................................................................................................31Figure 17: Top HS-61 Export Partners ......................................................................................................................................................................................31Figure 18: HS-62 Trade ...............................................................................................................................................................................................................32Figure 19: Top HS-62 Trade Partners........................................................................................................................................................................................32Figure 20: HS-10 Trade ...............................................................................................................................................................................................................33Figure 21: Top HS-10 Trade Partners........................................................................................................................................................................................33Figure 22: HS-52 Trade ...............................................................................................................................................................................................................34Figure 23: Top HS-52 Trade Partners........................................................................................................................................................................................34Figure 24: HS-72 Trade ...............................................................................................................................................................................................................35Figure 25: Top HS-72 Trade Partners........................................................................................................................................................................................35Figure 26: HS-42 Trade ...............................................................................................................................................................................................................36Figure 27: Top H-42 Trade Partners ..........................................................................................................................................................................................36Figure 28: HS-39 Trade ...............................................................................................................................................................................................................37Figure 29: Top HS-39 Trade Partners........................................................................................................................................................................................37
Third Review of the Pakistan-China FTA and Recommendations for Phase 2 Negotiations VII
List of Acronyms
APTA Asian Pacific Trade AgreementASEAN Association of South-East Asian NationsCAGR Compound Annual Growth RateCPFTA China-Pakistan Free Trade AgreementEU European UnionFTA Free Trade AgreementGDP Gross Domestic ProductGSP/GSP Plus Generalized System of PreferencesHS Harmonized System (Codes)ITC International Trade CentreMFN Most Favored NationNTC National Tariff CommissionPak PakistanPBC Pakistan Business CouncilPKR Pakistani RupeeRCA Revealed Comparative AdvantageSAFTA South Asian Free Trade AreaUAE United Arab EmiratesUK United KingdomUN United NationsUS United States of AmericaUSD United States DollarWB World BankWITS World Integrated Trade SolutionWTO World Trade Organization
Third Review of the Pakistan-China FTA and Recommendations for Phase 2 NegotiationsVIII
The Pakistan Business Council: An OverviewThe Pakistan Business Council (PBC) is a business policy advocacy forum, representing private-sector businesses that have substantial investmentsin Pakistan's economy. It was formed in 2005 by 14 (now 58) of Pakistan's largest enterprises, including multinationals, to allow businesses tomeaningfully interact with government and other stakeholders.
The Pakistan Business Council is a pan-industry advocacy group. It is not a trade body nor does it advocate for any specific business sector.Rather, its key advocacy thrust is on easing barriers to allow Pakistani businesses to compete in regional and global arenas.
The PBC works closely with the relevant government departments, ministries, regulators and institutions, as well as other stakeholders includingprofessional bodies, to develop consensus on major issues which impact the conduct of business in and from Pakistan. The PBC has submittedkey position papers and recommendations to the government on legislation and other government policies affecting businesses. It also serveson various taskforces and committees of the Government of Pakistan as well as those of the State Bank, SECP and other regulators with theobjective to provide policy assistance on new initiatives and reforms.
The PBC conducts research and holds conferences and seminars to facilitate the flow of relevant information to all stakeholders in order to helpcreate an informed view on the major issues faced by Pakistan.
The PBC's Founding Objectives: To provide for the formation and exchange of views on any question connected with the conduct of businesses in and from Pakistan. To conduct, organize, set up, administer and manage campaigns, surveys, focus groups, workshops, seminars and field works for carrying
out research and raising awareness in regard to matters affecting businesses in Pakistan. To acquire, collect, compile, analyze, publish and provide statistics, data analysis and other information relating to businesses of any
kind, nature or description and on opportunities for such businesses within and outside Pakistan. To promote and facilitate the integration of businesses in Pakistan into the world economy and to encourage the development and growth
of Pakistani multinationals. To interact with Governments in the economic development of Pakistan and to facilitate, foster and further the economic, social and
human resource development of Pakistan.
The PBC is a Section 42 not-for-profit Company Limited by Guarantee. Its working is overseen by a Board of Directors elected every three yearsby the Membership with the Board being headed by a Non-Executive Chairman. The day-to-day operations of the PBC are run by a professionalsecretariat headed by a full-time, paid CEO. More information on the PBC, its members, and its workings, can be found on its website:www.pbc.org.pk
Third Review of the Pakistan-China FTA and Recommendations for Phase 2 Negotiations IX
The PBC’s Member Companies
Third Review of the Pakistan-China FTA and Recommendations for Phase 2 NegotiationsX
The PBC’s Member Companies
Executive SummarySince Phase I of the Pakistan-China Free Trade Agreement came into effect in January 2007, there has been great discourse on how Phase II should benegotiated. Pakistani industries have particularly focused on how Phase I was negotiated, and the hugely negative impact it has had on domesticindustries. As per the terms of Phase I of the FTA, negotiations for Phase II have been underway since July 2013. The current Study by the PBC updatesthe findings of the PBC's 'Second Review of Phase I of the Pakistan-China FTA and Recommendations for Phase II Negotiations' (published in 2015). This Studyfurther analyzes trade patterns and, where necessary, updates the recommendations made in 2015 for negotiating Phase II of the FTA. Another importantmilestone in Pakistan-China relations is the launch of the China-Pakistan Economic Corridor (CPEC), which is expected to lead to massive developmentsin manufacturing, employment, infrastructure, energy and logistics, amongst other things.
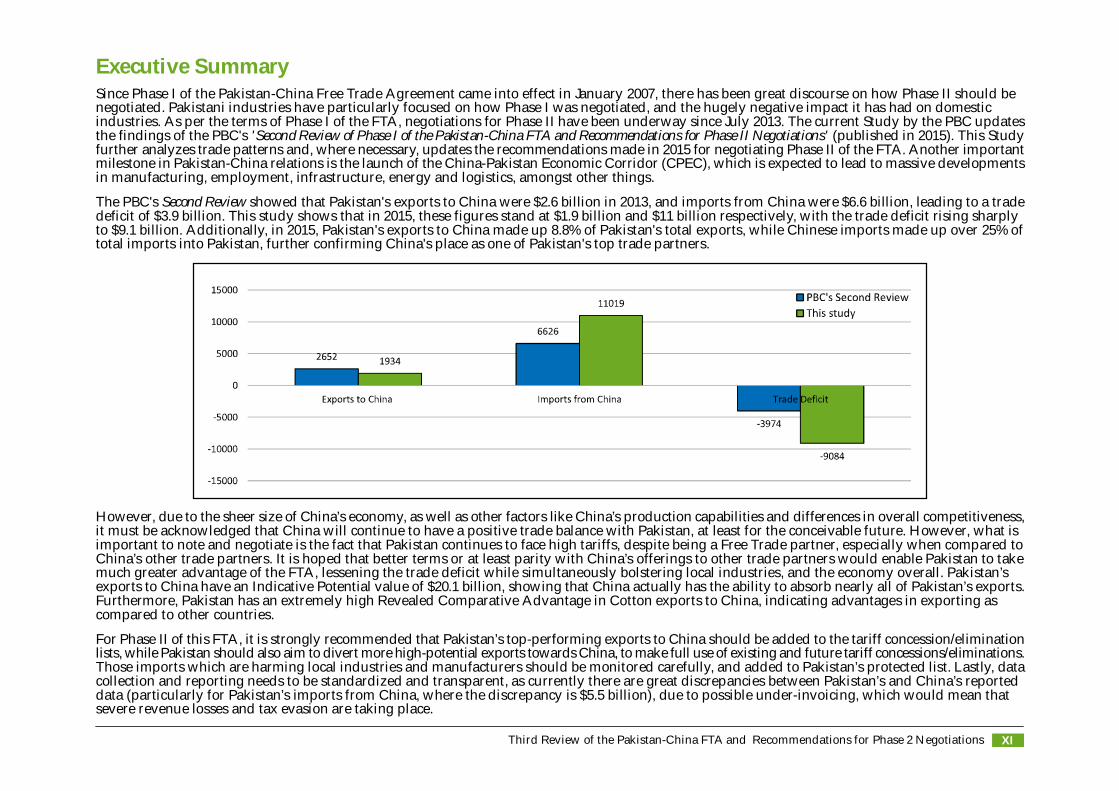
The PBC's Second Review showed that Pakistan's exports to China were $2.6 billion in 2013, and imports from China were $6.6 billion, leading to a tradedeficit of $3.9 billion. This study shows that in 2015, these figures stand at $1.9 billion and $11 billion respectively, with the trade deficit rising sharplyto $9.1 billion. Additionally, in 2015, Pakistan's exports to China made up 8.8% of Pakistan's total exports, while Chinese imports made up over 25% oftotal imports into Pakistan, further confirming China's place as one of Pakistan's top trade partners.
However, due to the sheer size of China’s economy, as well as other factors like China’s production capabilities and differences in overall competitiveness,it must be acknowledged that China will continue to have a positive trade balance with Pakistan, at least for the conceivable future. However, what isimportant to note and negotiate is the fact that Pakistan continues to face high tariffs, despite being a Free Trade partner, especially when compared toChina’s other trade partners. It is hoped that better terms or at least parity with China’s offerings to other trade partners would enable Pakistan to takemuch greater advantage of the FTA, lessening the trade deficit while simultaneously bolstering local industries, and the economy overall. Pakistan’sexports to China have an Indicative Potential value of $20.1 billion, showing that China actually has the ability to absorb nearly all of Pakistan’s exports.Furthermore, Pakistan has an extremely high Revealed Comparative Advantage in Cotton exports to China, indicating advantages in exporting ascompared to other countries.
For Phase II of this FTA, it is strongly recommended that Pakistan’s top-performing exports to China should be added to the tariff concession/eliminationlists, while Pakistan should also aim to divert more high-potential exports towards China, to make full use of existing and future tariff concessions/eliminations.Those imports which are harming local industries and manufacturers should be monitored carefully, and added to Pakistan’s protected list. Lastly, datacollection and reporting needs to be standardized and transparent, as currently there are great discrepancies between Pakistan’s and China’s reporteddata (particularly for Pakistan’s imports from China, where the discrepancy is $5.5 billion), due to possible under-invoicing, which would mean thatsevere revenue losses and tax evasion are taking place.
Third Review of the Pakistan-China FTA and Recommendations for Phase 2 Negotiations XI

Third Review of the Pakistan-China FTA and Recommendations for Phase 2 NegotiationsXII
Introduction
In November 2006, the Governments of Pakistan and China signed a Free Trade Agreement (FTA) which came into effect in 2007. Pakistan offeredtariff concessions/elimination on 6711 products, while China did the same on 6418 products, over a 5 year period. Phase I of this FTA ended inDecember 2012. Phase II negotiations started in July 2013, aiming to eliminate tariffs on at least 90% of all products. The target for bilateral tradeof $15 billion (by the end of Phase II) was agreed as part of the original FTA along with the objective of improving economic relations betweenthe two countries through trade. As of the end of 2015, bilateral trade equaled over $12,953 million, as compared to $3,421.96 million in 2006 priorto the FTA being implemented.
Pakistan and China have shared a close diplomatic and strategic relationship for many decades, with significant contribution from China towardsthe development of Pakistan’s industrialization, infrastructure, defense and technology. Regional trade is a huge opportunity for Pakistan’seconomic growth; the Pak-China FTA is part of this opportunity, steering Pakistan towards improving its overall trade performance.
As part of its advocacy efforts, as well as to support the Ministry of Commerce (which is responsible for negotiating Phase II of the China PakistanFree Trade Agreement), the PBC’s efforts include the following:
• Preliminary Study on Pakistan and China Trade Partnership Post FTA (published 2013)• Second Review of Phase I of the Pakistan-China FTA and Recommendations for Phase II (published 2015)• Facilitating the Ministry of Commerce to hold consultative sessions with industry prior to finalizing Phase II of the Pakistan China FTA.
Some of the main areas of focus of the 2013 and 2015 published studies were:• Key export products to China, for which there was high demand in China and adequate production in Pakistan, but without any/lesser
tariff concessions under the FTA;• Products with a high demand in China, but were not being produced/exported to their full capacity in Pakistan at that time, indicating
future potential exports;• Products where Pakistan had the potential to increase exports but was unable to do so because of competitors having better trading
terms;• Items with tariff concessions, but for which Pakistan did not have any export potential – it was recommended that these items should
be removed from the Chinese concessions list in Phase II;• Imports from China post-FTA with very low prices, causing local markets/producers to lose their advantage domestically – it was
recommended that these items should be placed on the protection list, to boost the local economy.
Third Review of the Pakistan-China FTA and Recommendations for Phase 2 Negotiations XIII
Some of the major findings from 2015's Second Review included1:• There were severe discrepancies in the reported data, with a gap of $544 million (exports) and $4,393 million (imports) between Pakistan
and China's reported data.• The trade balance between the two countries was $3,974 million in 2013, in China's favor (as per Pakistan's reported data).• Tariff concessions/eliminations on Pakistan's top performing commodities (including those where Pakistan has a comparative advantage)
were found to be lower or at the most equal as compared to China's other trade partners.• Imports increased sharply following the implementation of the FTA (going up from $2,914 million in 2006 to $6,626 million in 2013). The
United States and the United Arab Emirates however remained Pakistan's top trade partners in 2013, for exports and imports respectively.• Pakistan's top export remained Cotton, and the most imported product was Mineral Fuel/Oil.• Pakistan appeared to have failed to benefit fully from the FTA. This was identified as possibly because either Pakistani businesses were
largely not part of the negotiations or the Pakistani negotiators were not provided the requisite information;• Pakistan needed to increase exports and expand production facilities where there was potential for trade, while imports that may harm
local producers (especially in the form of finished goods) needed to be discouraged.
Since Phase II of the FTA is still under negotiation, this study builds on the work and conclusions drawn in the Second Review, while determiningif there have been any significant changes in trade flows and patterns in 2015.
Focused areas covered in this study include:• Export trends and opportunities for local producers, especially high-potential export items.• Tariff comparison and analysis, particularly in relation to export patterns in 2015.• Import trends and markets, especially for those items where domestic manufacturers could be losing market share.• Brief analysis and trade patterns of Pakistan's major trade commodities.• Measures that can be taken to further improve bilateral trade.• Sectorial perspectives regarding the effects of the FTA, from various local industries and manufacturers.
1The PBC’s ‘Second Review of the Phase I of the Pakistan-China FTA and Recommendations for Phase II Negotiations’ was based on trade data up till 2013,as 2014-2015 data was unavailable at the time of printing.

Recommendations
Building on the analysis and research presented in this report, and the two previous studies, recommendations for Phase II negotiations of theFTA are as follow:
Top-performing Pakistan exports to China (those which are either not given any tariff concessions, or are given less favorable concessionsas compared to China’s other trade agreement partners) should most definitely be given favorable tariff concessions or have tariffseliminated completely in Phase II.
Pakistan’s top export to China, Cotton (HS 2 level), has increased by 252% over the last 10 years – tariff eliminations on just this productcould significantly boost Pakistan’s exports to China. However, there are other high-potential export products which are still facingtariffs of 20% or higher (including Jewelry, Sugar and Rice, amongst others). It is strongly recommended that such items should be givenbetter tariff concessions or put in the tariff elimination category.
There are also certain sectors where exports to China could be increased, as excess Chinese demand already exists, and Pakistan couldwell benefit from beneficial tariff terms. The indicative potential value has been analyzed to highlight such products. However, it mustbe noted that to increase total trade volumes, Pakistan’s industries must increase their respective production capacities. In addition,industry must have access to reliable and cost competitive energy.
An analysis of top imports from China has also been conducted, showing those imports which have increased significantly post-FTA.The negative impact of these imports should be considered during Phase II negotiations, especially where local production is decliningor local manufacturers are affected.
Finally, this report found discrepancies in data and statistics; it is recommended that data collection should be standardized and monitoredto ensure transparent, accurate and reliable results.
Third Review of the Pakistan-China FTA and Recommendations for Phase 2 NegotiationsXIV

Section I: Overview:

Third Review of the Pakistan-China FTA and Recommendations for Phase 2 Negotiations 03
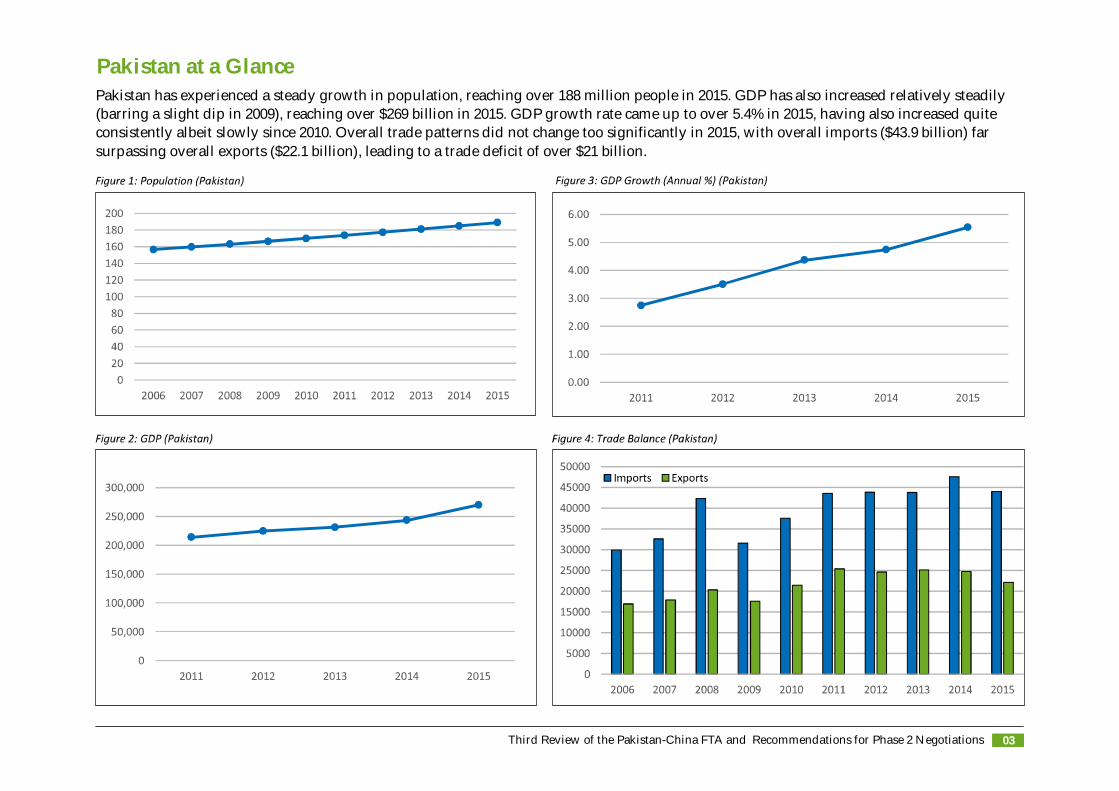
Pakistan at a GlancePakistan has experienced a steady growth in population, reaching over 188 million people in 2015. GDP has also increased relatively steadily(barring a slight dip in 2009), reaching over $269 billion in 2015. GDP growth rate came up to over 5.4% in 2015, having also increased quiteconsistently albeit slowly since 2010. Overall trade patterns did not change too significantly in 2015, with overall imports ($43.9 billion) farsurpassing overall exports ($22.1 billion), leading to a trade deficit of over $21 billion.
Third Review of the Pakistan-China FTA and Recommendations for Phase 2 Negotiations04
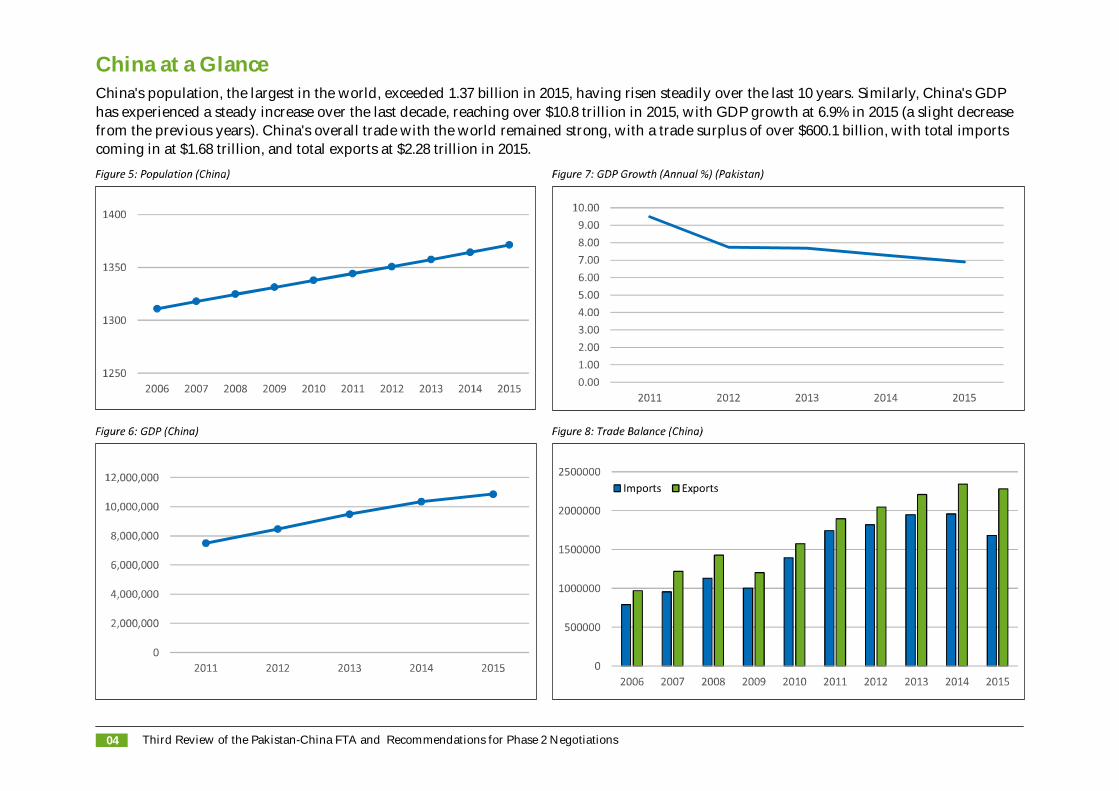
China at a GlanceChina's population, the largest in the world, exceeded 1.37 billion in 2015, having risen steadily over the last 10 years. Similarly, China's GDPhas experienced a steady increase over the last decade, reaching over $10.8 trillion in 2015, with GDP growth at 6.9% in 2015 (a slight decreasefrom the previous years). China's overall trade with the world remained strong, with a trade surplus of over $600.1 billion, with total importscoming in at $1.68 trillion, and total exports at $2.28 trillion in 2015.
Third Review of the Pakistan-China FTA and Recommendations for Phase 2 Negotiations 05
Pakistan-China Bilateral Trade & Discrepancies in Reported Data
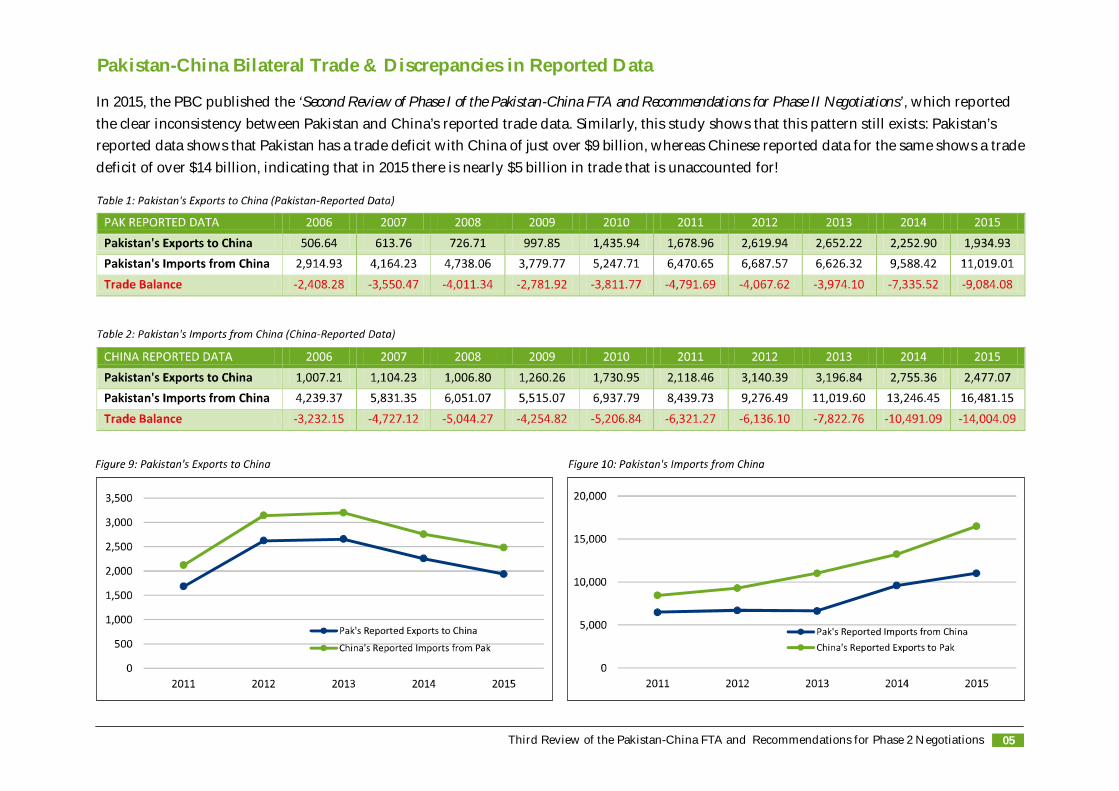
In 2015, the PBC published the ‘Second Review of Phase I of the Pakistan-China FTA and Recommendations for Phase II Negotiations’, which reportedthe clear inconsistency between Pakistan and China’s reported trade data. Similarly, this study shows that this pattern still exists: Pakistan’sreported data shows that Pakistan has a trade deficit with China of just over $9 billion, whereas Chinese reported data for the same shows a tradedeficit of over $14 billion, indicating that in 2015 there is nearly $5 billion in trade that is unaccounted for!
Third Review of the Pakistan-China FTA and Recommendations for Phase 2 Negotiations06
The China-Pakistan Economic Corridor
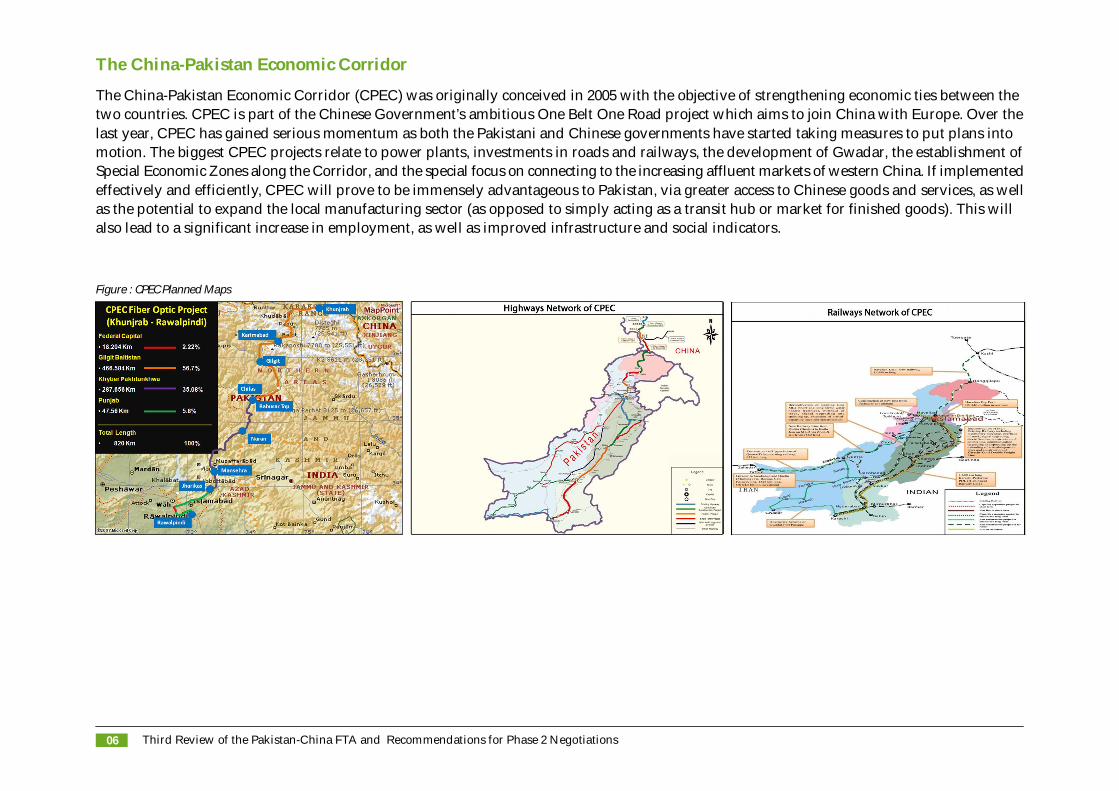
The China-Pakistan Economic Corridor (CPEC) was originally conceived in 2005 with the objective of strengthening economic ties between thetwo countries. CPEC is part of the Chinese Government’s ambitious One Belt One Road project which aims to join China with Europe. Over thelast year, CPEC has gained serious momentum as both the Pakistani and Chinese governments have started taking measures to put plans intomotion. The biggest CPEC projects relate to power plants, investments in roads and railways, the development of Gwadar, the establishment ofSpecial Economic Zones along the Corridor, and the special focus on connecting to the increasing affluent markets of western China. If implementedeffectively and efficiently, CPEC will prove to be immensely advantageous to Pakistan, via greater access to Chinese goods and services, as wellas the potential to expand the local manufacturing sector (as opposed to simply acting as a transit hub or market for finished goods). This willalso lead to a significant increase in employment, as well as improved infrastructure and social indicators.
Figure : CPEC Planned Maps
Section II: Pakistan's Exports to China

Third Review of the Pakistan-China FTA and Recommendations for Phase 2 Negotiations 09
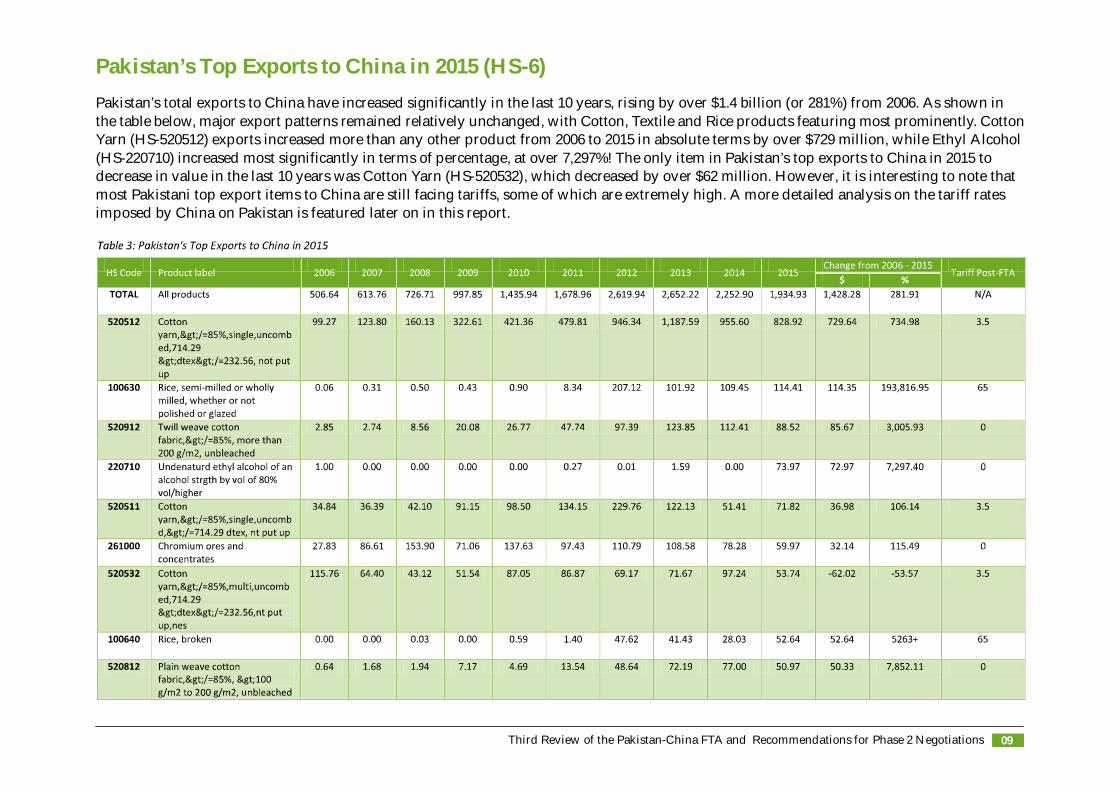
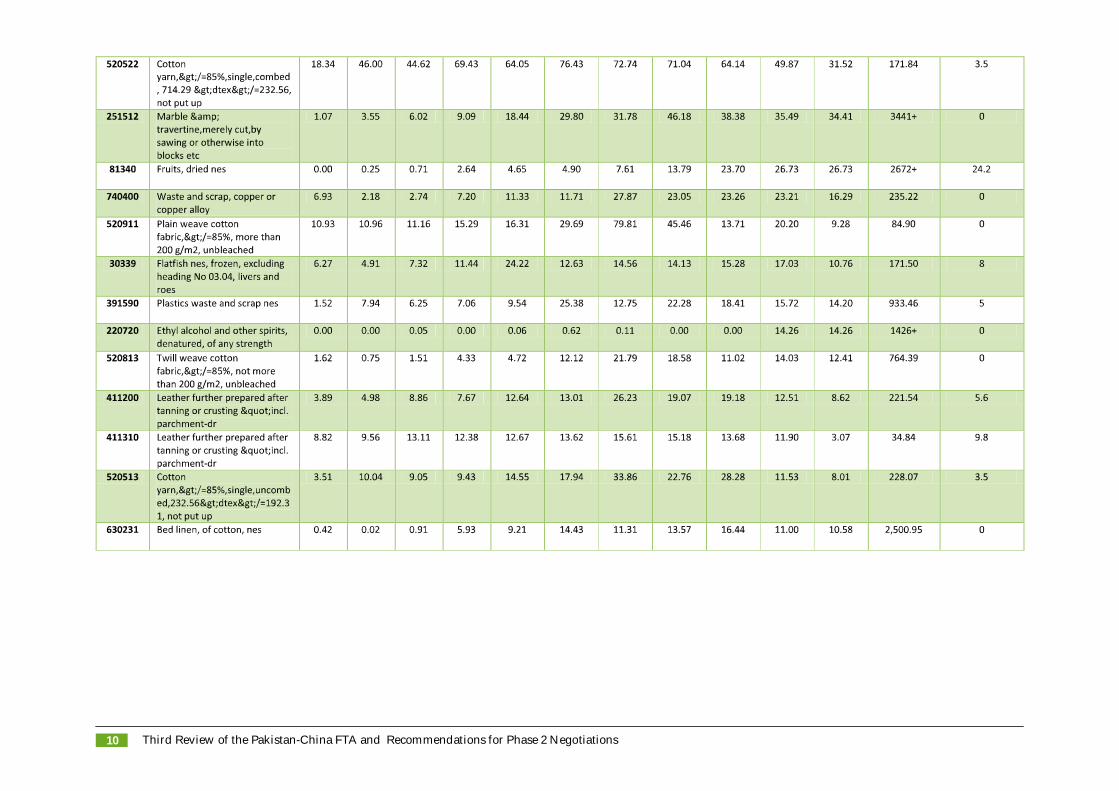
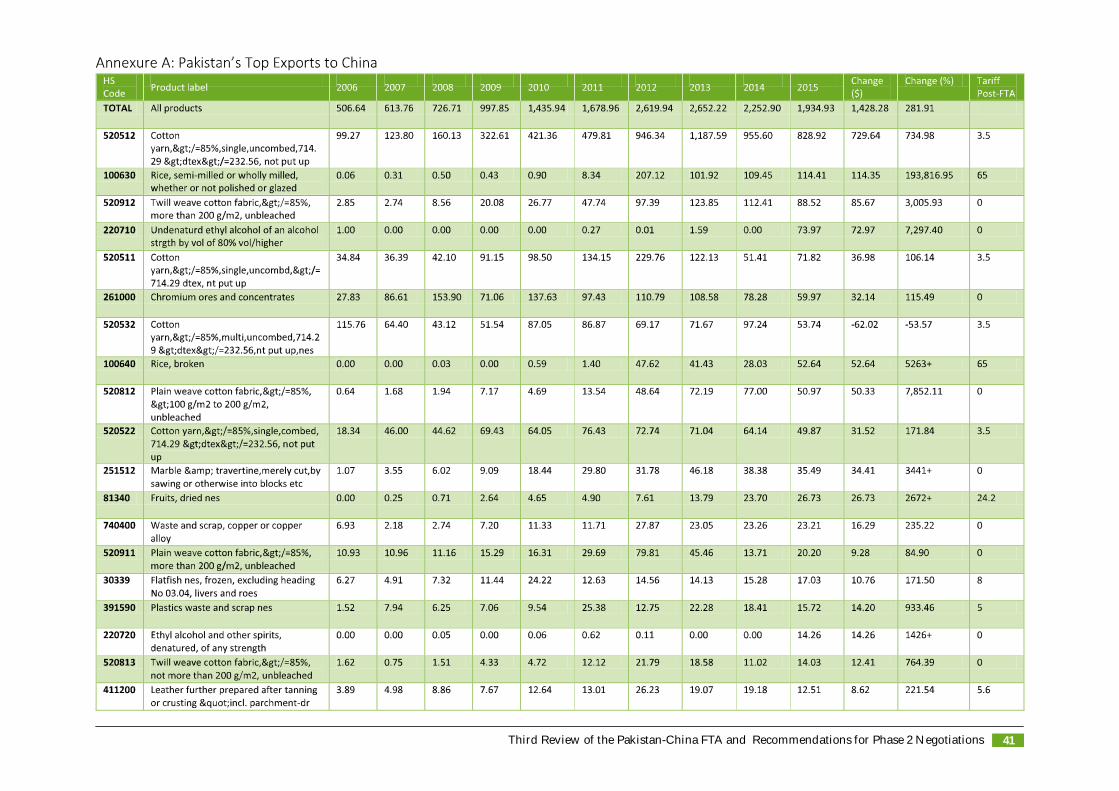
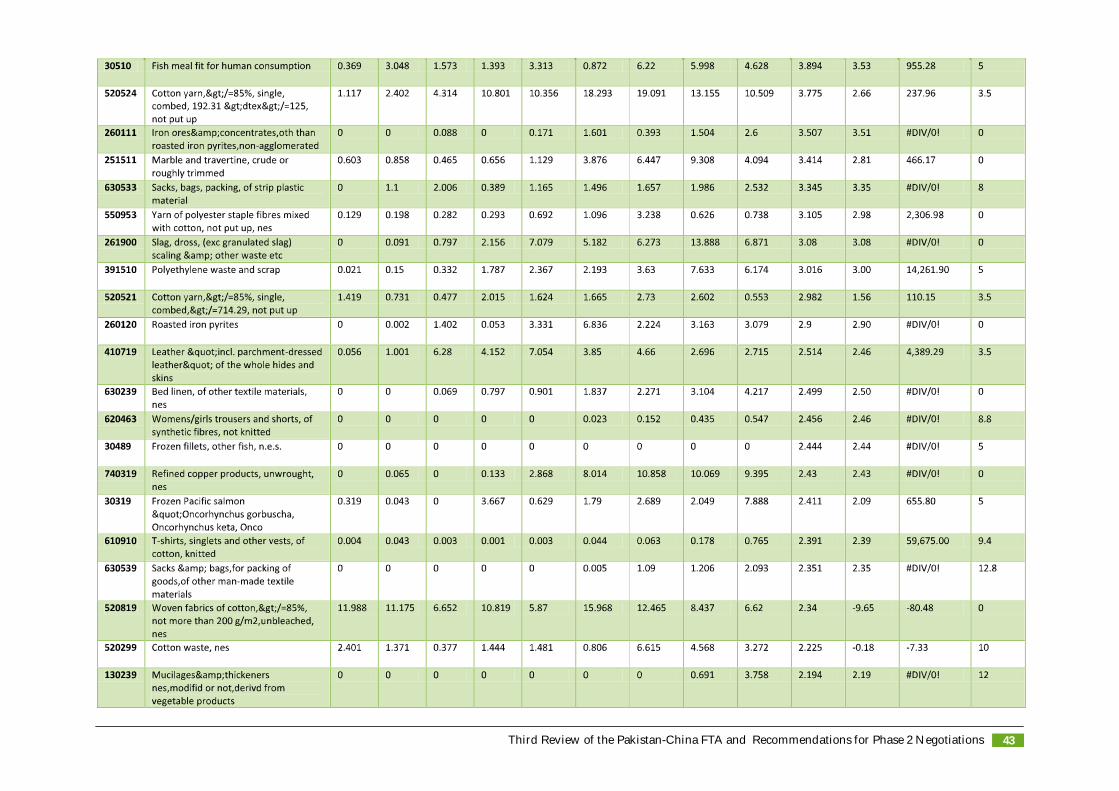
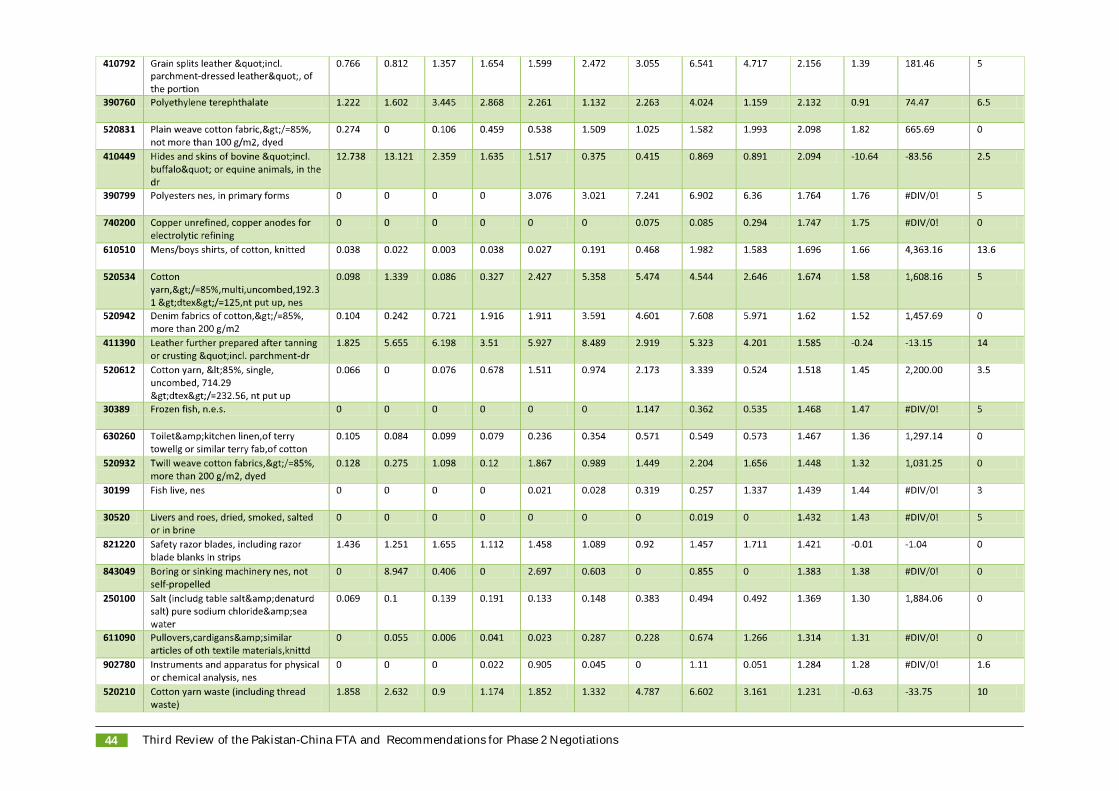
Pakistan’s Top Exports to China in 2015 (HS-6)Pakistan’s total exports to China have increased significantly in the last 10 years, rising by over $1.4 billion (or 281%) from 2006. As shown inthe table below, major export patterns remained relatively unchanged, with Cotton, Textile and Rice products featuring most prominently. CottonYarn (HS-520512) exports increased more than any other product from 2006 to 2015 in absolute terms by over $729 million, while Ethyl Alcohol(HS-220710) increased most significantly in terms of percentage, at over 7,297%! The only item in Pakistan’s top exports to China in 2015 todecrease in value in the last 10 years was Cotton Yarn (HS-520532), which decreased by over $62 million. However, it is interesting to note thatmost Pakistani top export items to China are still facing tariffs, some of which are extremely high. A more detailed analysis on the tariff ratesimposed by China on Pakistan is featured later on in this report.
Third Review of the Pakistan-China FTA and Recommendations for Phase 2 Negotiations10
Third Review of the Pakistan-China FTA and Recommendations for Phase 2 Negotiations 11
Pakistan's Top Exports to China: 2006 - 2015 Comparison
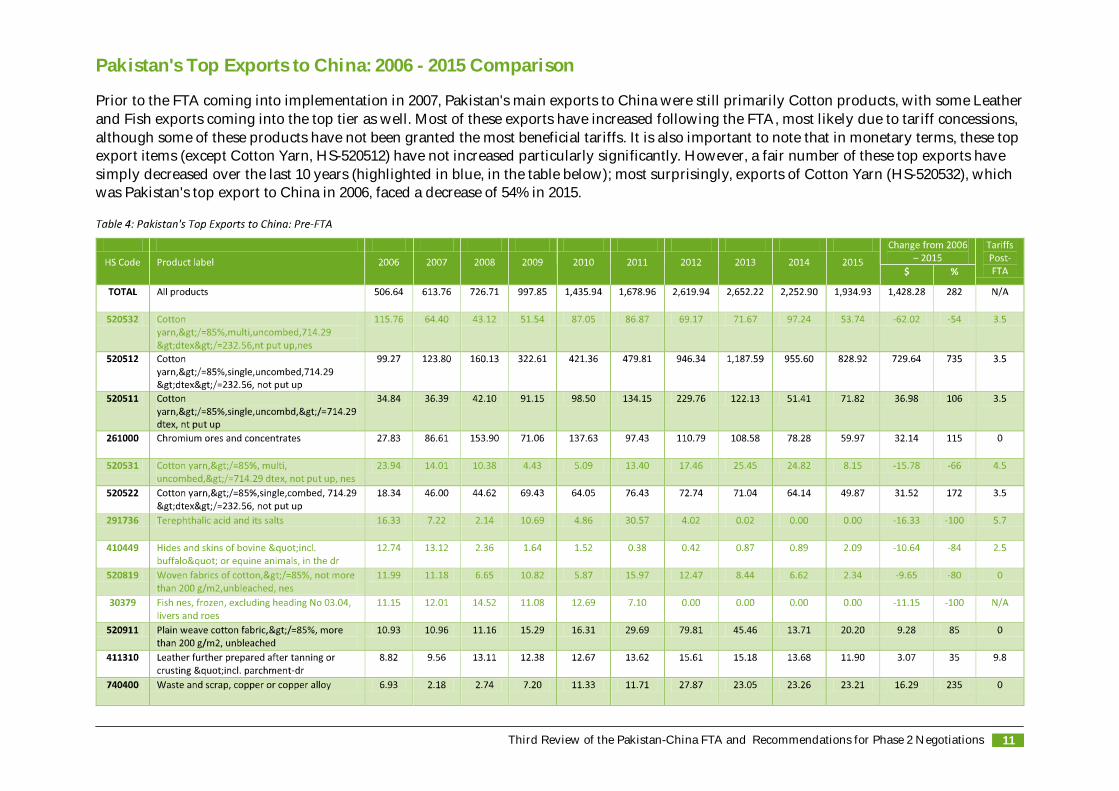
Prior to the FTA coming into implementation in 2007, Pakistan's main exports to China were still primarily Cotton products, with some Leatherand Fish exports coming into the top tier as well. Most of these exports have increased following the FTA, most likely due to tariff concessions,although some of these products have not been granted the most beneficial tariffs. It is also important to note that in monetary terms, these topexport items (except Cotton Yarn, HS-520512) have not increased particularly significantly. However, a fair number of these top exports havesimply decreased over the last 10 years (highlighted in blue, in the table below); most surprisingly, exports of Cotton Yarn (HS-520532), whichwas Pakistan's top export to China in 2006, faced a decrease of 54% in 2015.
Third Review of the Pakistan-China FTA and Recommendations for Phase 2 Negotiations12

Third Review of the Pakistan-China FTA and Recommendations for Phase 2 Negotiations 13
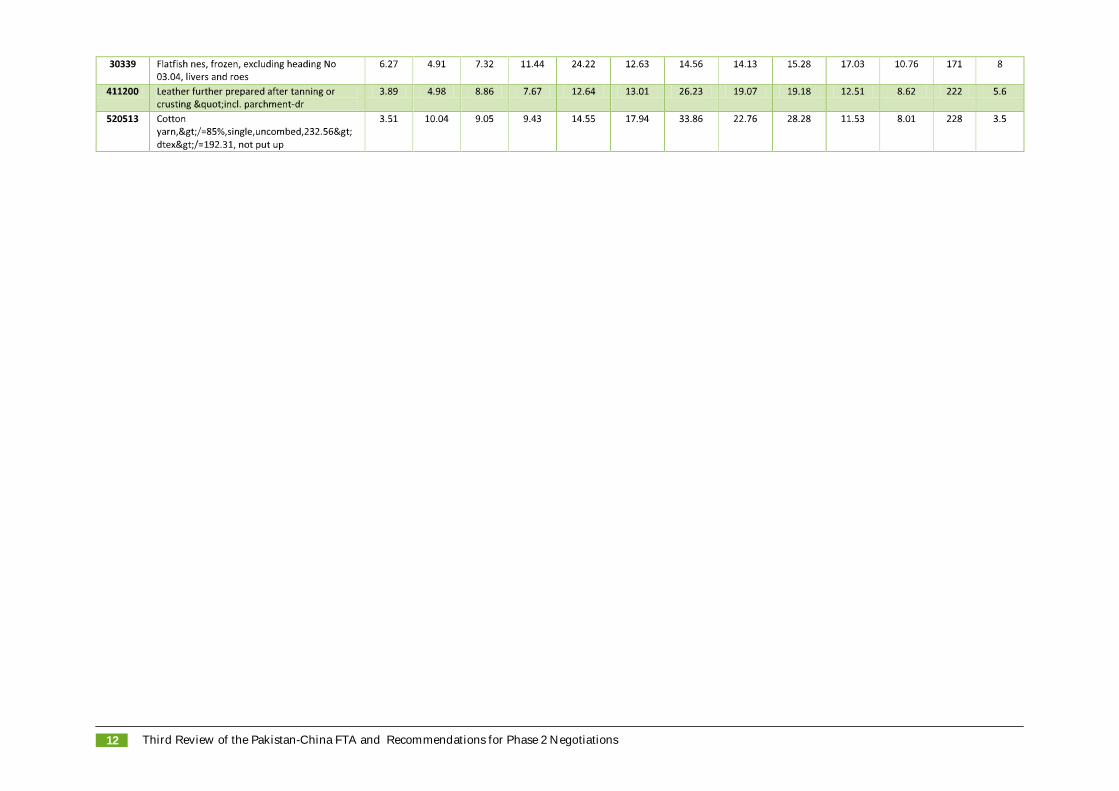
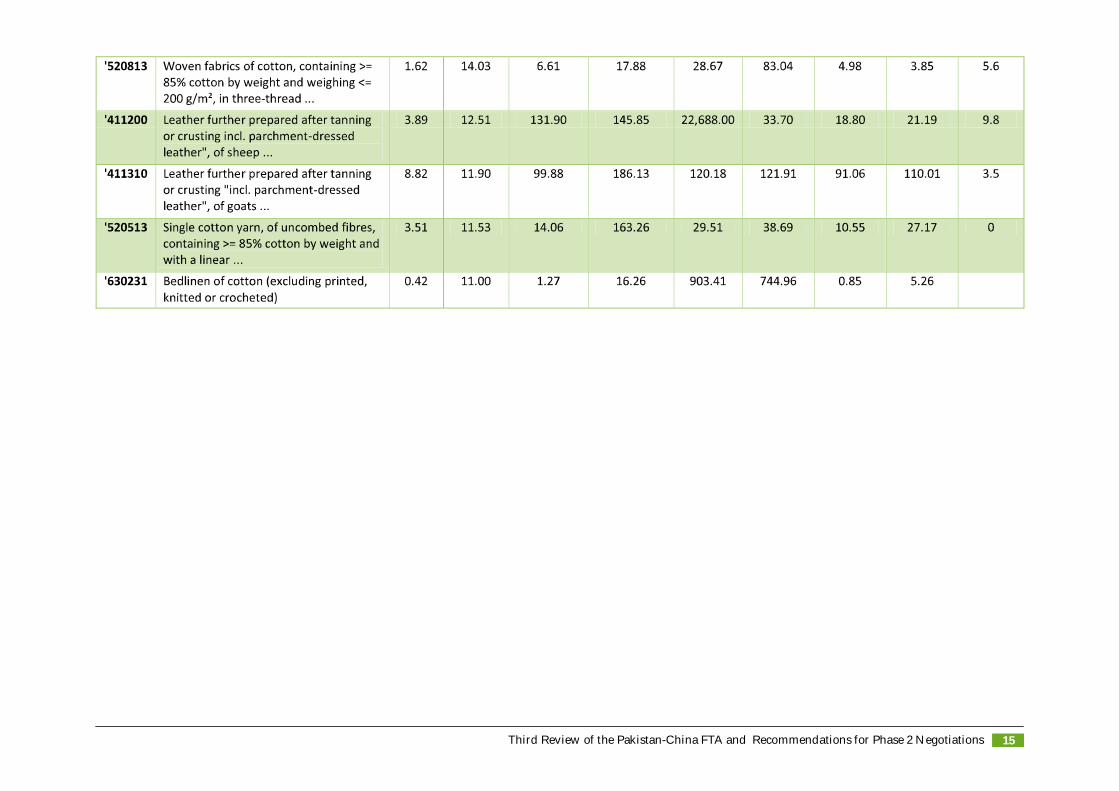
Pakistan’s Exports to China: Indicative Potential 2015 with Tariffs (HS-6)To examine more closely Pakistan’s top exports to China, we look at exports (with current export values of $10 million or higher in 2015) at theHS-6 digit level here, along with Indicative Potential Values. This section focuses on those export commodities which are already performingwell (in terms of trade with China), and if there is potential for further diverting exports of these products towards China, aiming to reduce thetrade deficit while working with Pakistan’s strongest commodities. Indicative Potential refers to the amount by which Pakistan could potentiallyincrease its exports to China, at the current rates of overall production and exports.
Indicative Potential Values are calculated by the following methodology:
For the Indicative Potential Value of Export X from Country A to Country B, you take:A’s total exports of X OR B’s total imports of X (whichever value is lower)And subtract A’s exports of X to B from that amount.
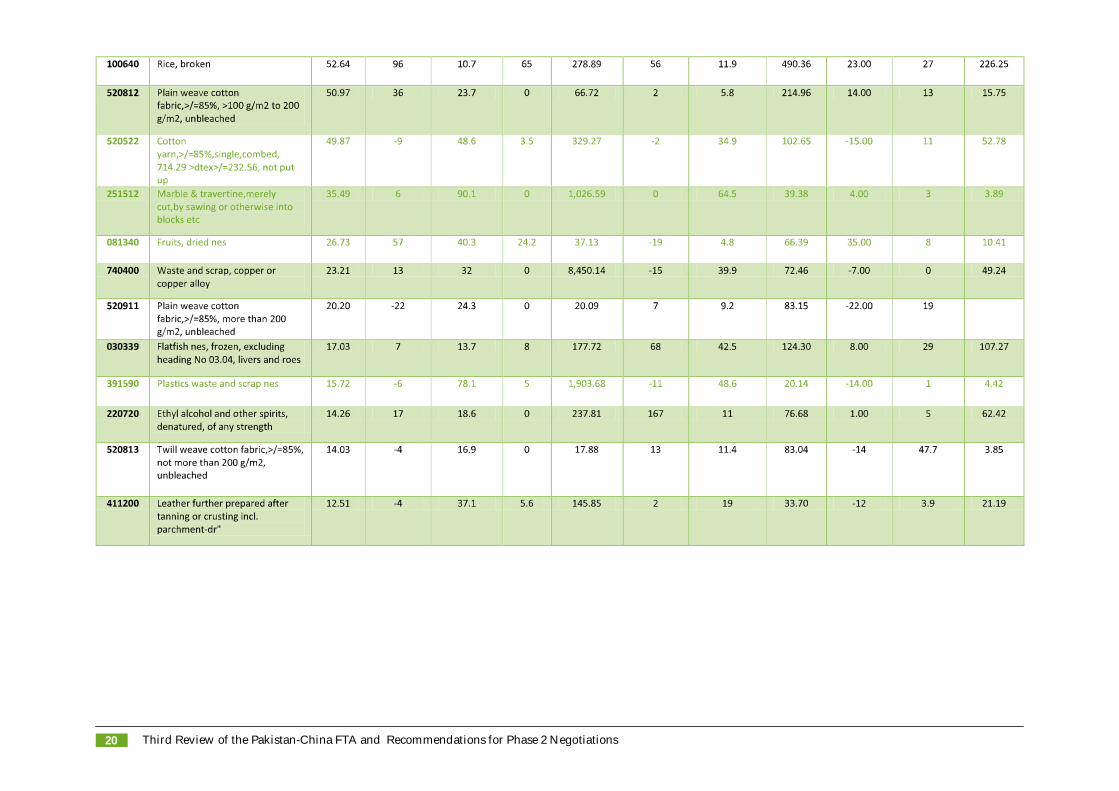
Barring two discrepancies (highlighted below in red), most of the indicative values show that Pakistan has the capacity to increase its exports toChina. Pakistan’s greatest export potential to China in 2015 lies in Rice, Cotton, Leather and Fish products, all of which have an individualindicative potential export value of over $100 million (that is, the amount by which Pakistan can increase its exports to China for that commodity).However, the fact that these ‘top-potential’ exports largely face moderate-to-high tariffs cannot be missed, (particularly Rice at 65%), and this issomething that must be addressed during the Phase II negotiations.

Third Review of the Pakistan-China FTA and Recommendations for Phase 2 Negotiations14
Third Review of the Pakistan-China FTA and Recommendations for Phase 2 Negotiations 15
Third Review of the Pakistan-China FTA and Recommendations for Phase 2 Negotiations16
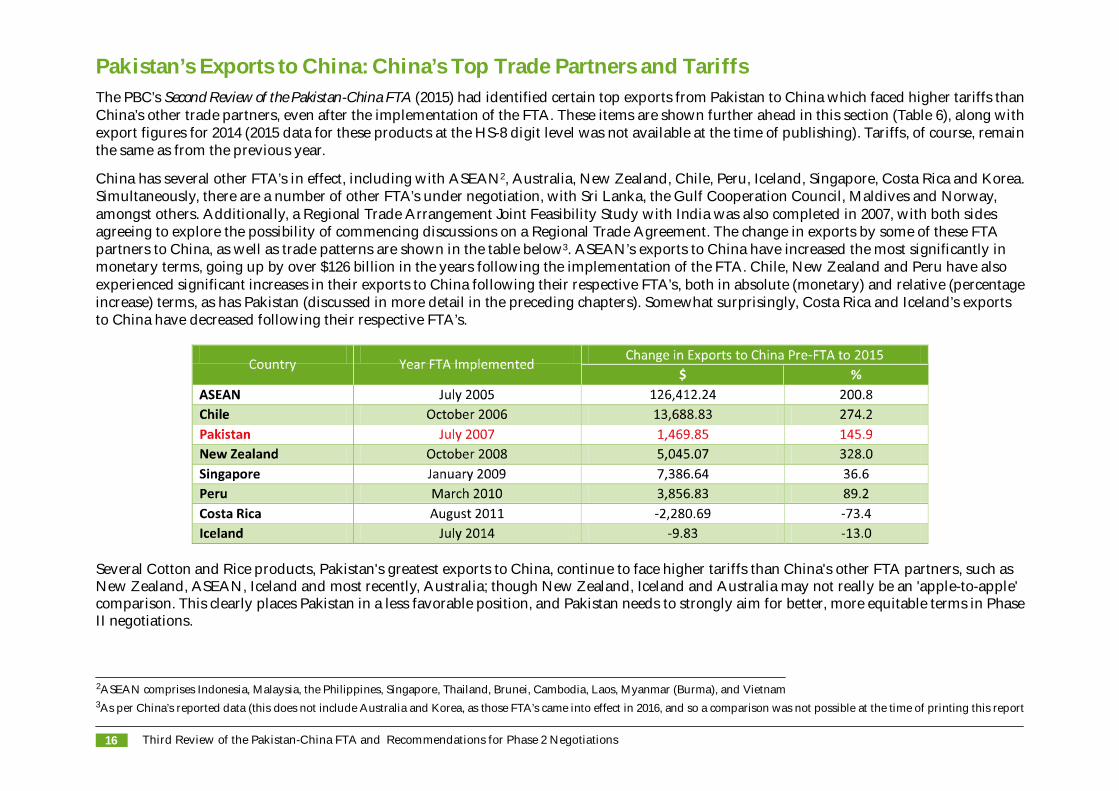
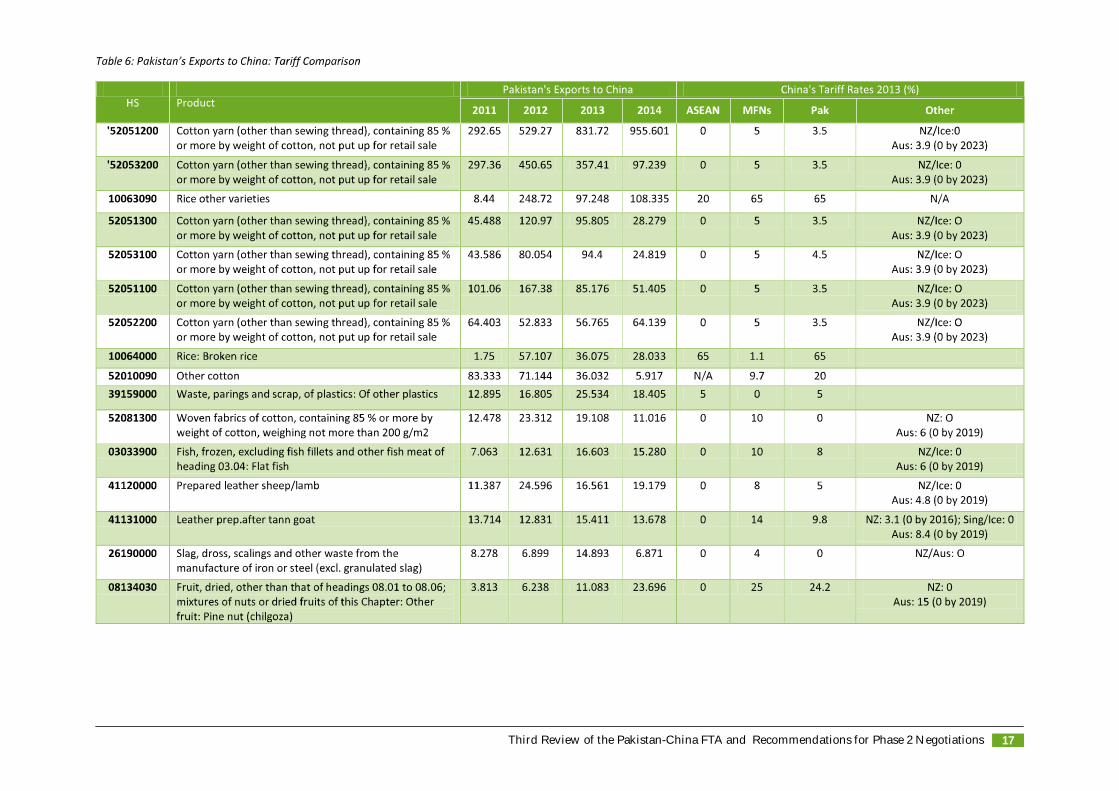
Pakistan’s Exports to China: China’s Top Trade Partners and TariffsThe PBC’s Second Review of the Pakistan-China FTA (2015) had identified certain top exports from Pakistan to China which faced higher tariffs thanChina’s other trade partners, even after the implementation of the FTA. These items are shown further ahead in this section (Table 6), along withexport figures for 2014 (2015 data for these products at the HS-8 digit level was not available at the time of publishing). Tariffs, of course, remainthe same as from the previous year.
China has several other FTA’s in effect, including with ASEAN2, Australia, New Zealand, Chile, Peru, Iceland, Singapore, Costa Rica and Korea.Simultaneously, there are a number of other FTA’s under negotiation, with Sri Lanka, the Gulf Cooperation Council, Maldives and Norway,amongst others. Additionally, a Regional Trade Arrangement Joint Feasibility Study with India was also completed in 2007, with both sidesagreeing to explore the possibility of commencing discussions on a Regional Trade Agreement. The change in exports by some of these FTApartners to China, as well as trade patterns are shown in the table below3. ASEAN’s exports to China have increased the most significantly inmonetary terms, going up by over $126 billion in the years following the implementation of the FTA. Chile, New Zealand and Peru have alsoexperienced significant increases in their exports to China following their respective FTA’s, both in absolute (monetary) and relative (percentageincrease) terms, as has Pakistan (discussed in more detail in the preceding chapters). Somewhat surprisingly, Costa Rica and Iceland’s exportsto China have decreased following their respective FTA’s.
Several Cotton and Rice products, Pakistan's greatest exports to China, continue to face higher tariffs than China's other FTA partners, such asNew Zealand, ASEAN, Iceland and most recently, Australia; though New Zealand, Iceland and Australia may not really be an 'apple-to-apple'comparison. This clearly places Pakistan in a less favorable position, and Pakistan needs to strongly aim for better, more equitable terms in PhaseII negotiations.
2ASEAN comprises Indonesia, Malaysia, the Philippines, Singapore, Thailand, Brunei, Cambodia, Laos, Myanmar (Burma), and Vietnam3As per China’s reported data (this does not include Australia and Korea, as those FTA’s came into effect in 2016, and so a comparison was not possible at the time of printing this report
Third Review of the Pakistan-China FTA and Recommendations for Phase 2 Negotiations 17
Third Review of the Pakistan-China FTA and Recommendations for Phase 2 Negotiations18
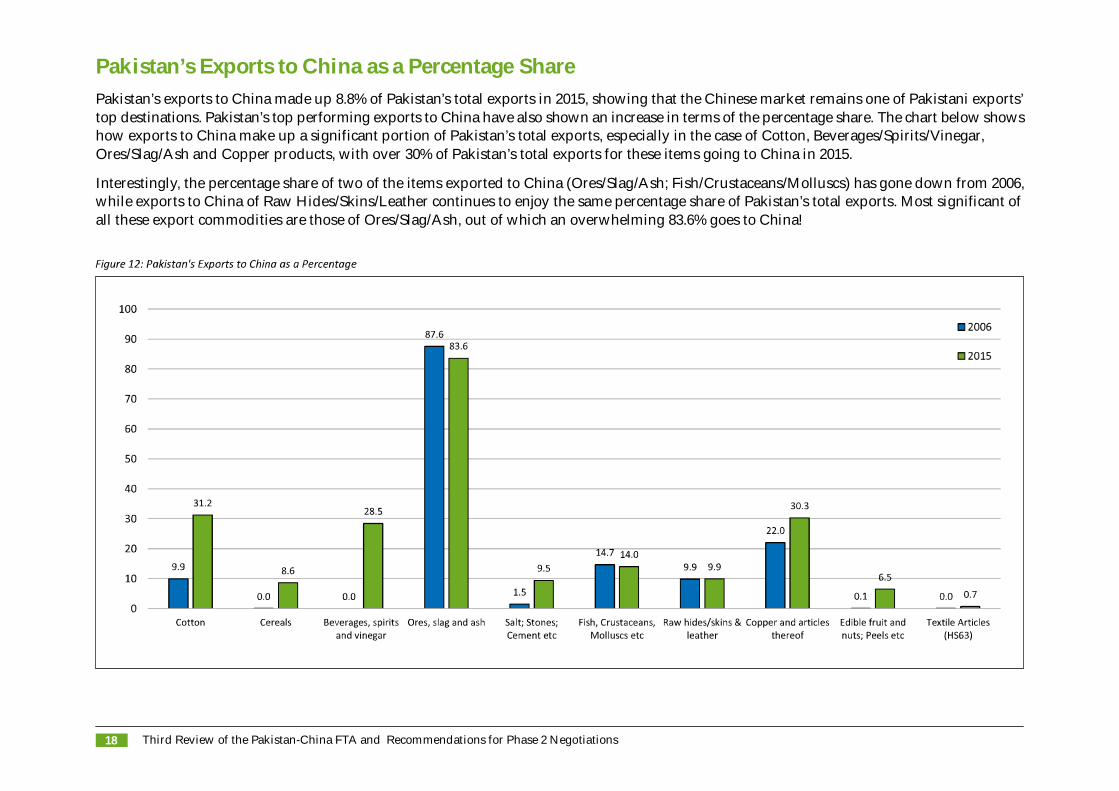
Pakistan’s Exports to China as a Percentage SharePakistan’s exports to China made up 8.8% of Pakistan’s total exports in 2015, showing that the Chinese market remains one of Pakistani exports’top destinations. Pakistan’s top performing exports to China have also shown an increase in terms of the percentage share. The chart below showshow exports to China make up a significant portion of Pakistan’s total exports, especially in the case of Cotton, Beverages/Spirits/Vinegar,Ores/Slag/Ash and Copper products, with over 30% of Pakistan’s total exports for these items going to China in 2015.
Interestingly, the percentage share of two of the items exported to China (Ores/Slag/Ash; Fish/Crustaceans/Molluscs) has gone down from 2006,while exports to China of Raw Hides/Skins/Leather continues to enjoy the same percentage share of Pakistan’s total exports. Most significant ofall these export commodities are those of Ores/Slag/Ash, out of which an overwhelming 83.6% goes to China!

Third Review of the Pakistan-China FTA and Recommendations for Phase 2 Negotiations 19
Pakistan’s Exports to China – Trade Indicators
As shown in the table below, Pakistan’s exports to China (around $1.9 billion in 2015) have been growing at around 1% yearly since 2011, eventhough Pakistan’s overall exports to the world have decreased by around 3% in the last 5 years. However, as shown in the table below, severalof Pakistan’s top exports still face relatively high tariffs, particularly Rice and Fruit exports (which face 65% and 24.2% tariffs respectively).
Further evidence to support the importance of China as a trade partner is also shown below, with Chinese markets receiving 40% or greater sharein Pakistan’s exports for 8 commodities (highlighted below in blue); this lack of diversification in export destinations only emphasizes theconsequences for Pakistan of not receiving optimal tariff concessions/eliminations as well as showing the narrow band of Pakistani exports. Ashas been mentioned in the previous sections, Pakistan must do all it can to ensure that Phase II negotiations bring about better trade terms,especially since such a major chunk of Pakistani exports are headed towards China.
Third Review of the Pakistan-China FTA and Recommendations for Phase 2 Negotiations20
Third Review of the Pakistan-China FTA and Recommendations for Phase 2 Negotiations 21
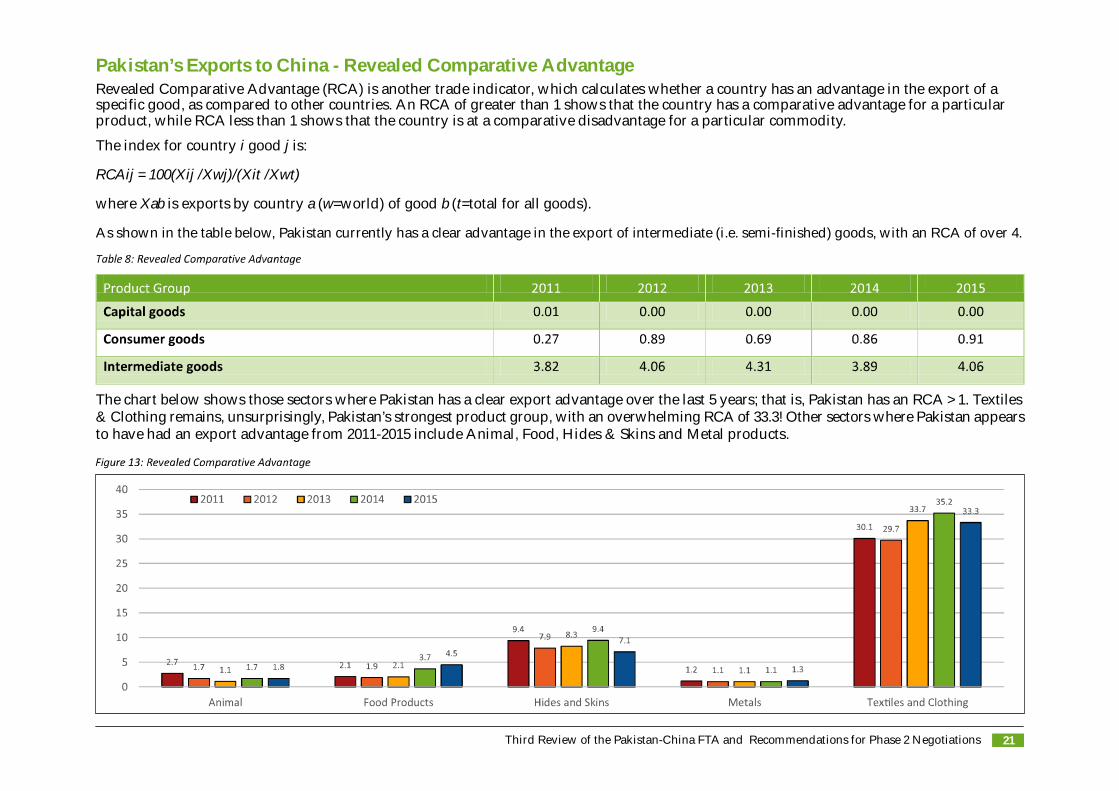
Pakistan’s Exports to China - Revealed Comparative AdvantageRevealed Comparative Advantage (RCA) is another trade indicator, which calculates whether a country has an advantage in the export of aspecific good, as compared to other countries. An RCA of greater than 1 shows that the country has a comparative advantage for a particularproduct, while RCA less than 1 shows that the country is at a comparative disadvantage for a particular commodity.
The index for country i good j is:
RCAij = 100(Xij /Xwj)/(Xit /Xwt)
where Xab is exports by country a (w=world) of good b (t=total for all goods).
As shown in the table below, Pakistan currently has a clear advantage in the export of intermediate (i.e. semi-finished) goods, with an RCA of over 4.
The chart below shows those sectors where Pakistan has a clear export advantage over the last 5 years; that is, Pakistan has an RCA > 1. Textiles& Clothing remains, unsurprisingly, Pakistan’s strongest product group, with an overwhelming RCA of 33.3! Other sectors where Pakistan appearsto have had an export advantage from 2011-2015 include Animal, Food, Hides & Skins and Metal products.

Section III: Pakistan's Imports from China

Third Review of the Pakistan-China FTA and Recommendations for Phase 2 Negotiations 25
Pakistan’s Top Imports from China in 2015
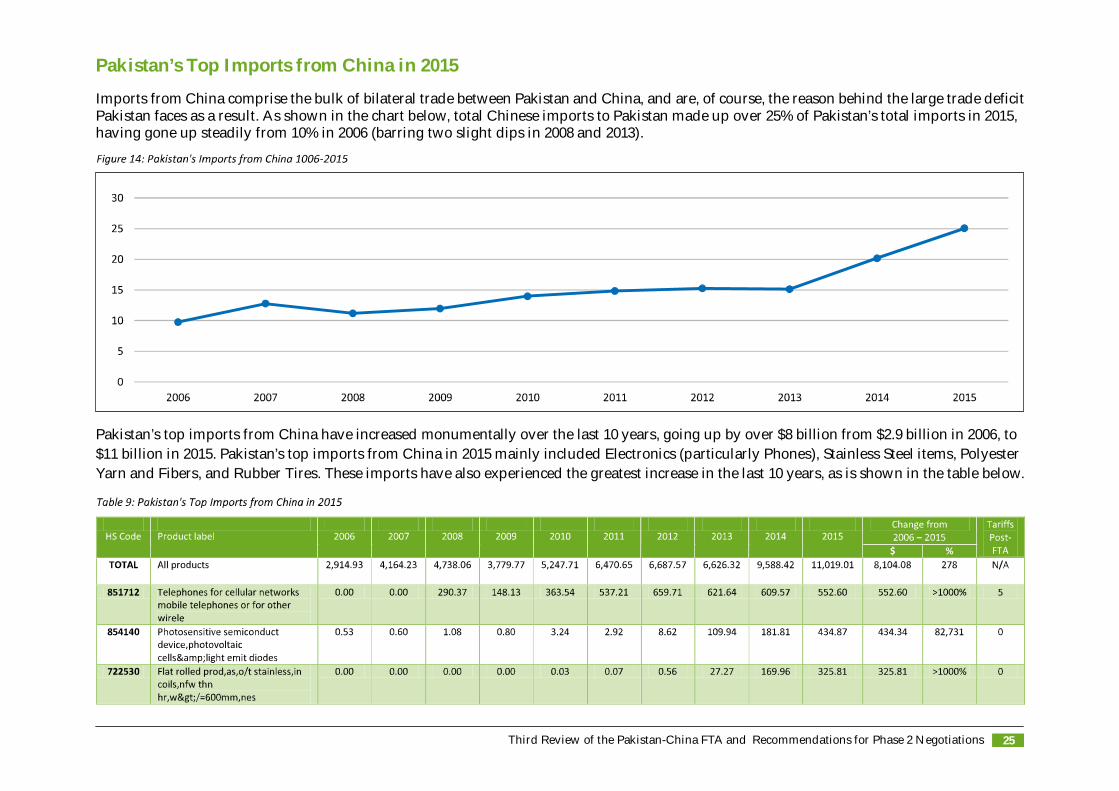
Imports from China comprise the bulk of bilateral trade between Pakistan and China, and are, of course, the reason behind the large trade deficitPakistan faces as a result. As shown in the chart below, total Chinese imports to Pakistan made up over 25% of Pakistan’s total imports in 2015,having gone up steadily from 10% in 2006 (barring two slight dips in 2008 and 2013).
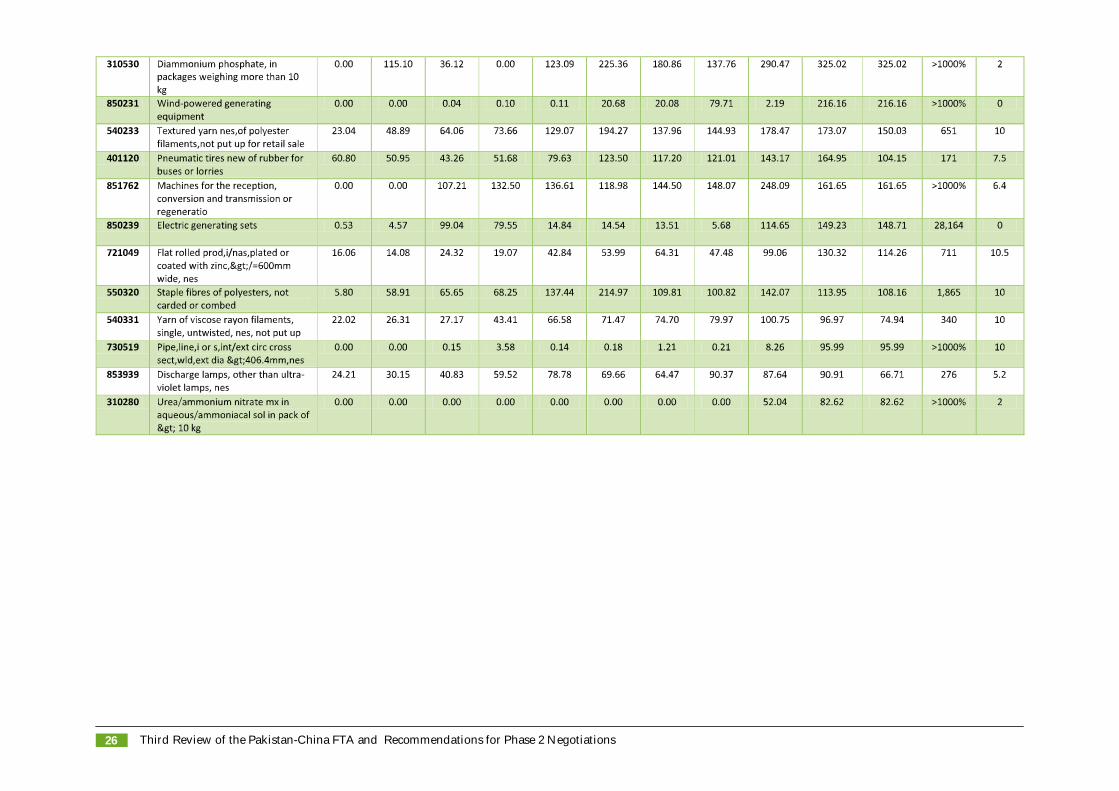
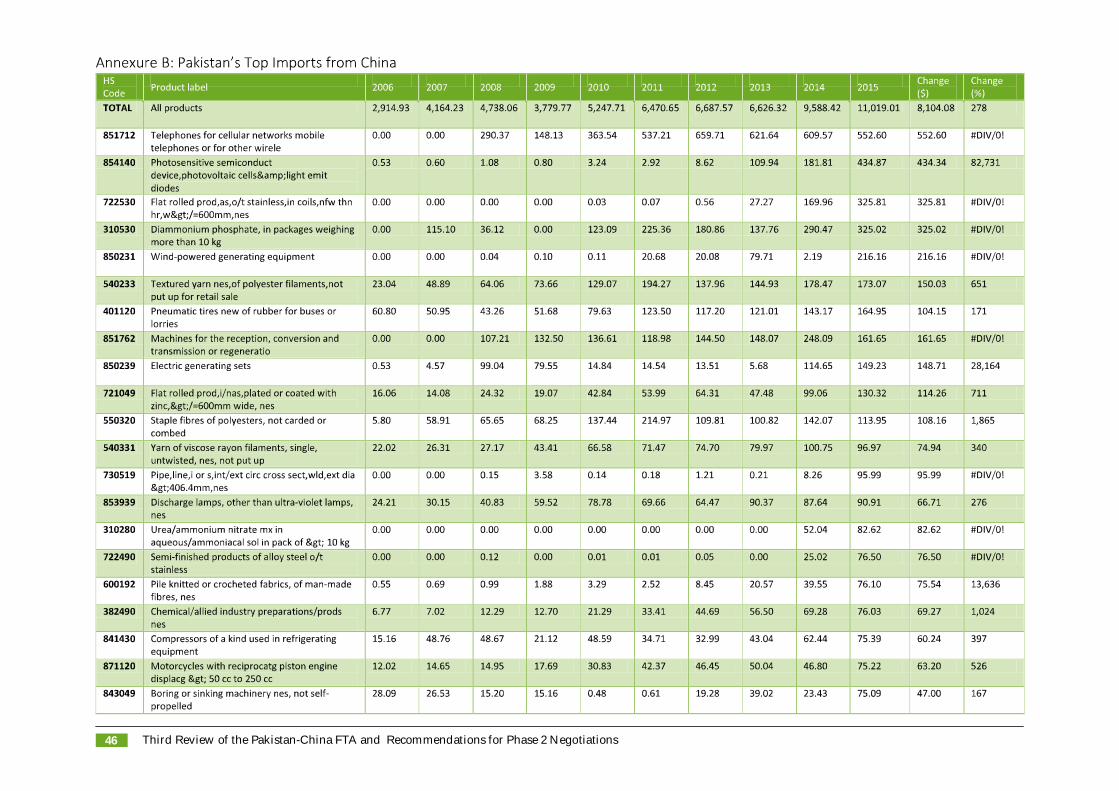
Pakistan’s top imports from China have increased monumentally over the last 10 years, going up by over $8 billion from $2.9 billion in 2006, to$11 billion in 2015. Pakistan’s top imports from China in 2015 mainly included Electronics (particularly Phones), Stainless Steel items, PolyesterYarn and Fibers, and Rubber Tires. These imports have also experienced the greatest increase in the last 10 years, as is shown in the table below.
Third Review of the Pakistan-China FTA and Recommendations for Phase 2 Negotiations26
Third Review of the Pakistan-China FTA and Recommendations for Phase 2 Negotiations 27
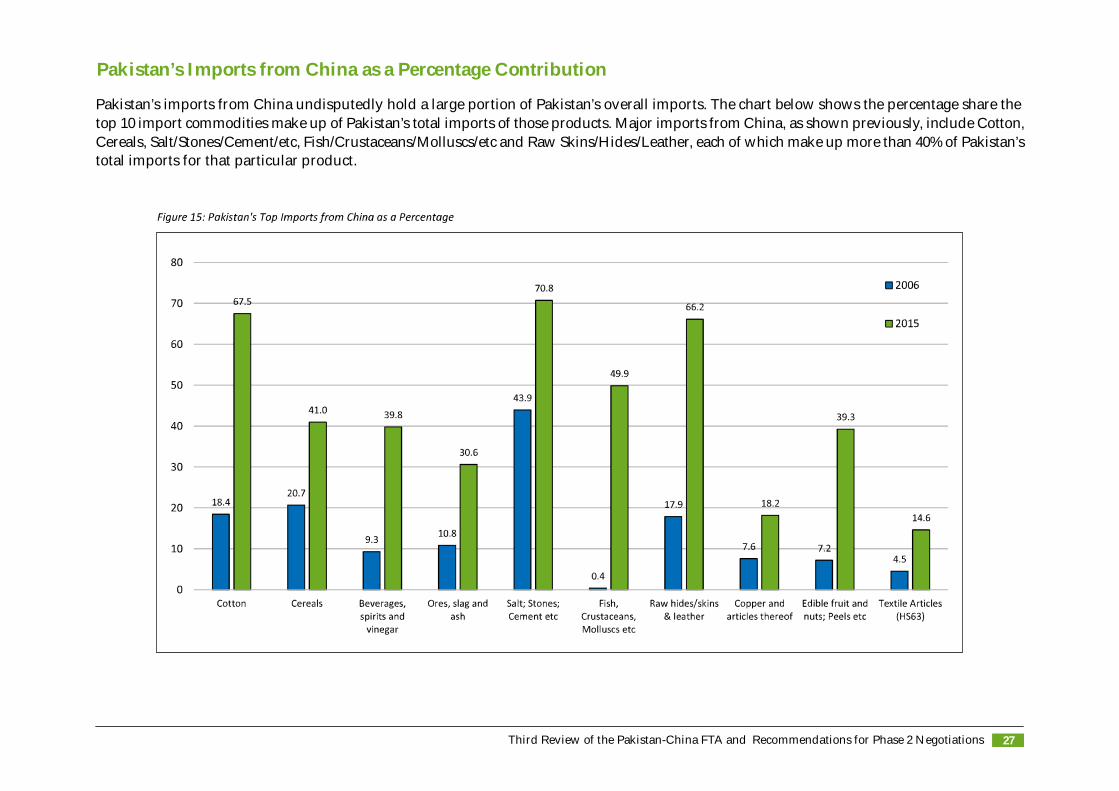
Pakistan’s Imports from China as a Percentage Contribution
Pakistan’s imports from China undisputedly hold a large portion of Pakistan’s overall imports. The chart below shows the percentage share thetop 10 import commodities make up of Pakistan’s total imports of those products. Major imports from China, as shown previously, include Cotton,Cereals, Salt/Stones/Cement/etc, Fish/Crustaceans/Molluscs/etc and Raw Skins/Hides/Leather, each of which make up more than 40% of Pakistan’stotal imports for that particular product.
Third Review of the Pakistan-China FTA and Recommendations for Phase 2 Negotiations28
Pakistan’s Top Imports from China: 2006 – 2015 Comparison
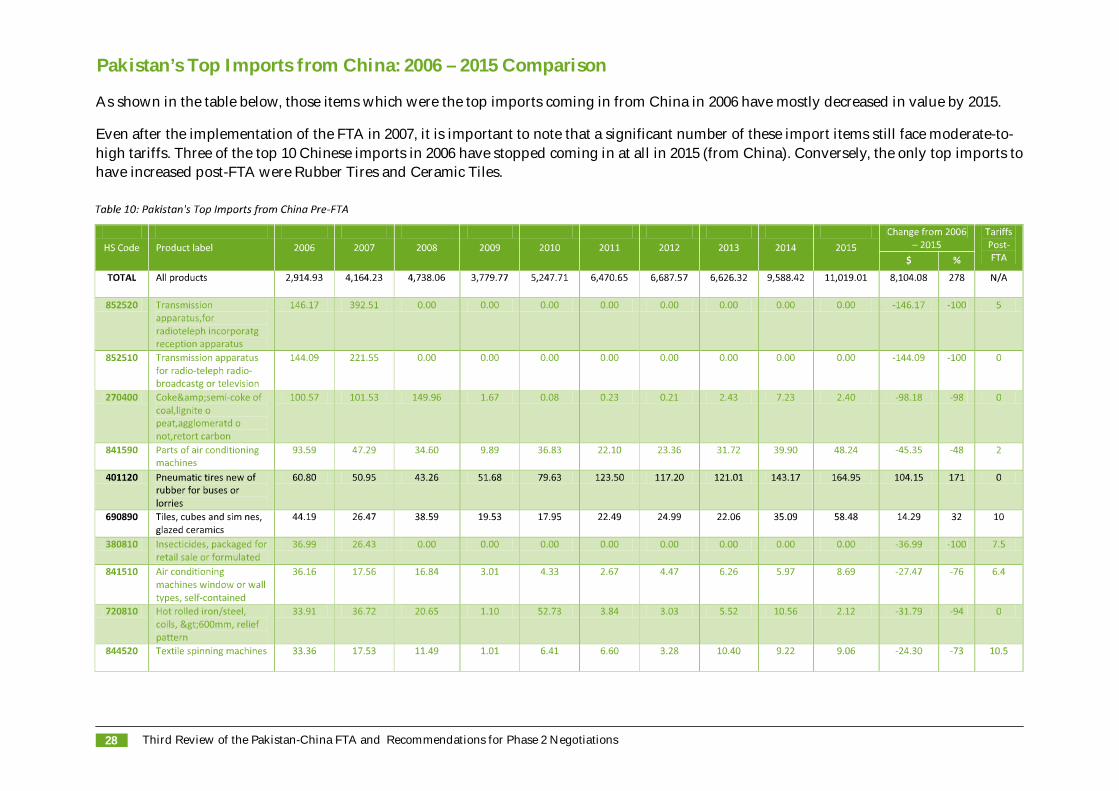
As shown in the table below, those items which were the top imports coming in from China in 2006 have mostly decreased in value by 2015.
Even after the implementation of the FTA in 2007, it is important to note that a significant number of these import items still face moderate-to-high tariffs. Three of the top 10 Chinese imports in 2006 have stopped coming in at all in 2015 (from China). Conversely, the only top imports tohave increased post-FTA were Rubber Tires and Ceramic Tiles.
Section IV: Pakistan’s Top ExportCommodities Overview

Third Review of the Pakistan-China FTA and Recommendations for Phase 2 Negotiations 31
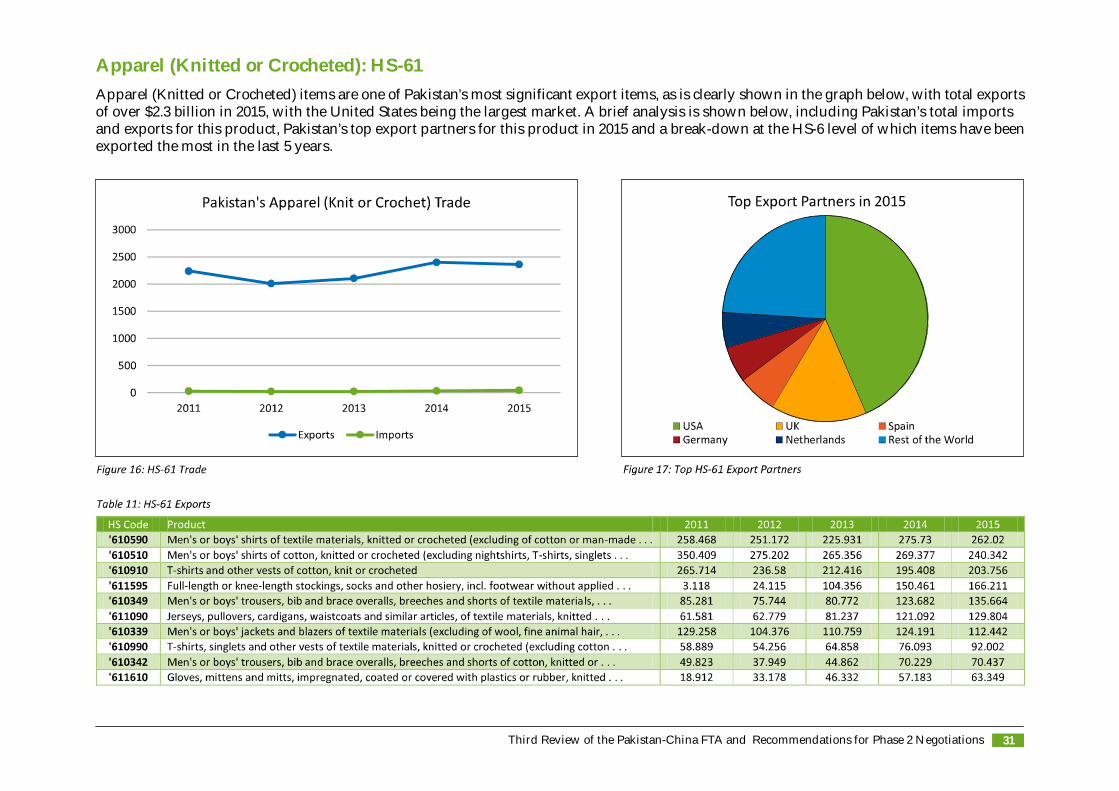
Apparel (Knitted or Crocheted): HS-61Apparel (Knitted or Crocheted) items are one of Pakistan’s most significant export items, as is clearly shown in the graph below, with total exportsof over $2.3 billion in 2015, with the United States being the largest market. A brief analysis is shown below, including Pakistan’s total importsand exports for this product, Pakistan’s top export partners for this product in 2015 and a break-down at the HS-6 level of which items have beenexported the most in the last 5 years.
Third Review of the Pakistan-China FTA and Recommendations for Phase 2 Negotiations32
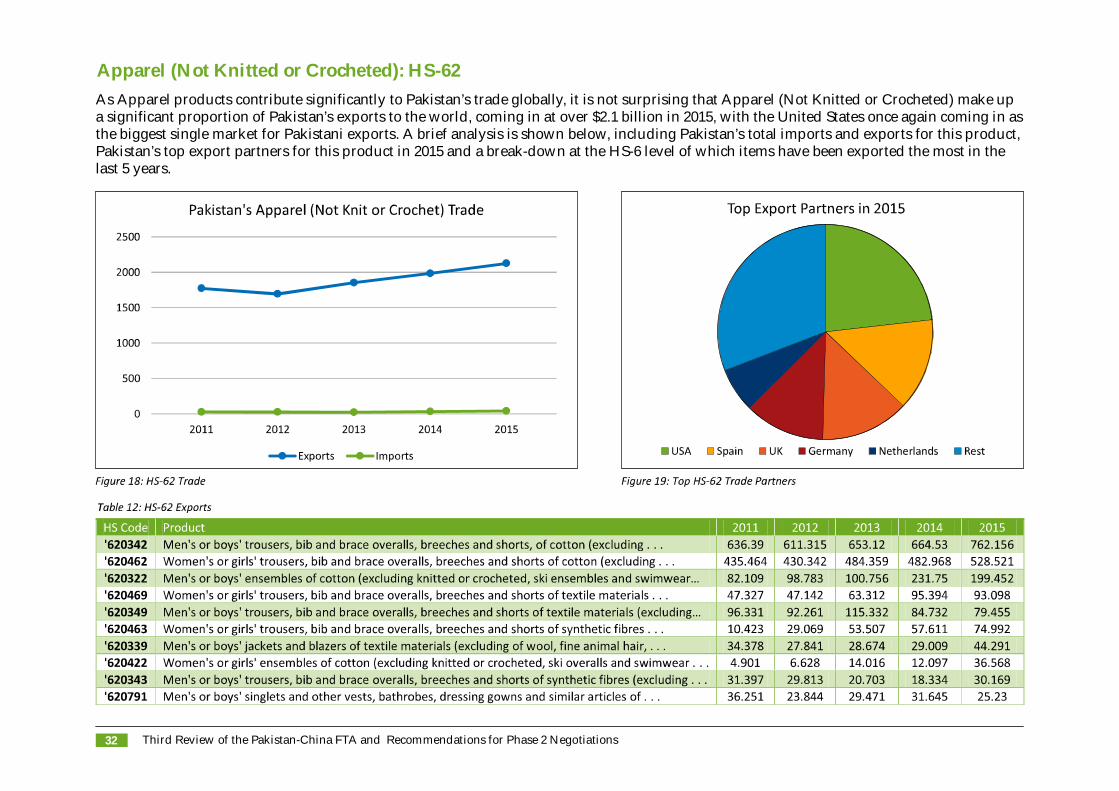
Apparel (Not Knitted or Crocheted): HS-62As Apparel products contribute significantly to Pakistan’s trade globally, it is not surprising that Apparel (Not Knitted or Crocheted) make upa significant proportion of Pakistan’s exports to the world, coming in at over $2.1 billion in 2015, with the United States once again coming in asthe biggest single market for Pakistani exports. A brief analysis is shown below, including Pakistan’s total imports and exports for this product,Pakistan’s top export partners for this product in 2015 and a break-down at the HS-6 level of which items have been exported the most in thelast 5 years.
Third Review of the Pakistan-China FTA and Recommendations for Phase 2 Negotiations 33
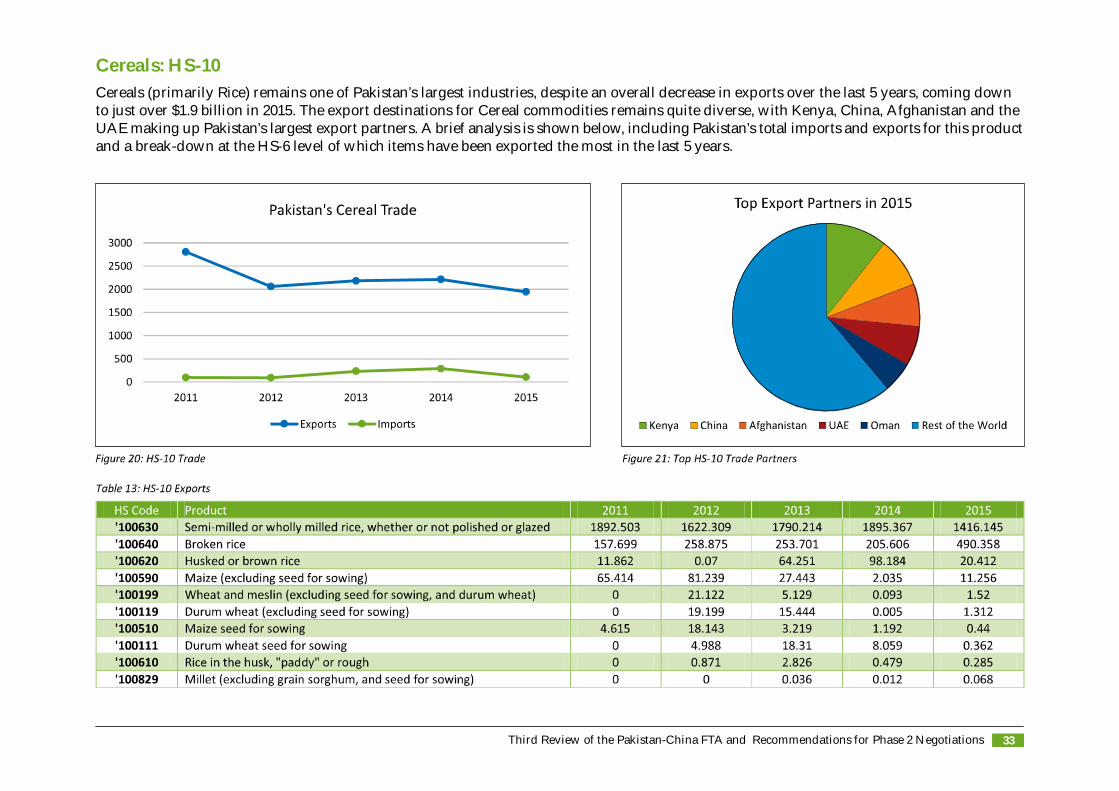
Cereals: HS-10Cereals (primarily Rice) remains one of Pakistan’s largest industries, despite an overall decrease in exports over the last 5 years, coming downto just over $1.9 billion in 2015. The export destinations for Cereal commodities remains quite diverse, with Kenya, China, Afghanistan and theUAE making up Pakistan’s largest export partners. A brief analysis is shown below, including Pakistan’s total imports and exports for this productand a break-down at the HS-6 level of which items have been exported the most in the last 5 years.
Third Review of the Pakistan-China FTA and Recommendations for Phase 2 Negotiations34
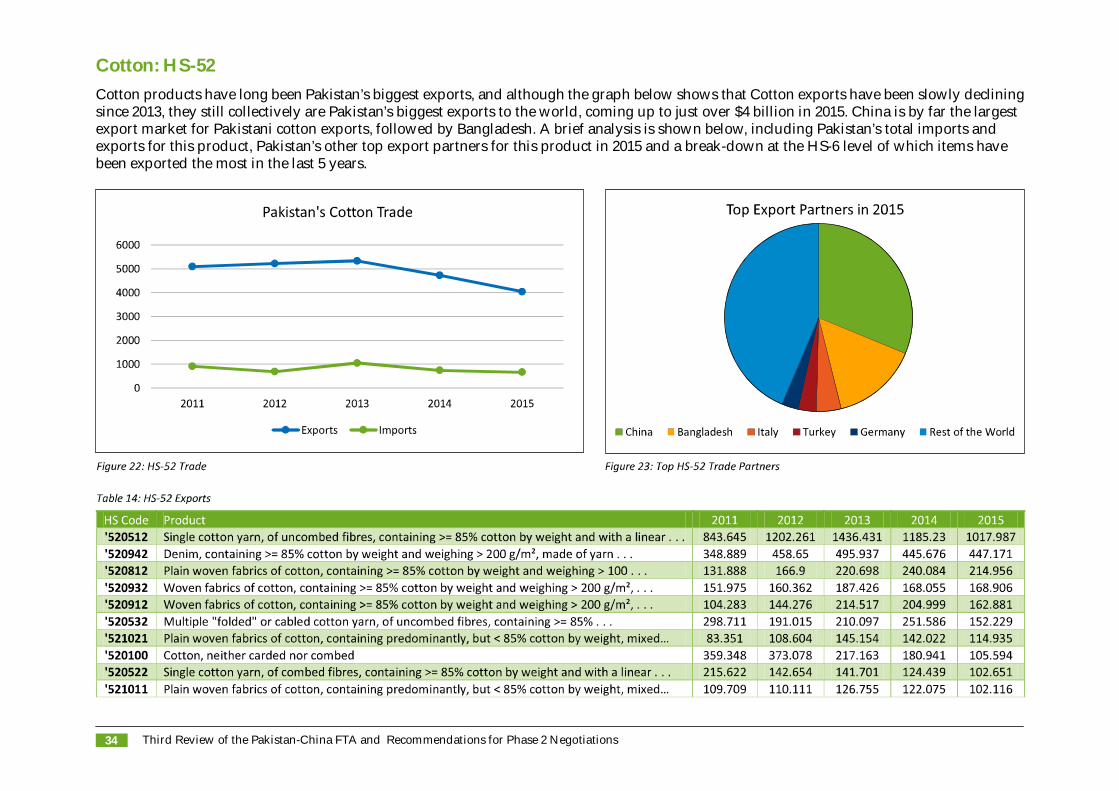
Cotton: HS-52Cotton products have long been Pakistan’s biggest exports, and although the graph below shows that Cotton exports have been slowly decliningsince 2013, they still collectively are Pakistan’s biggest exports to the world, coming up to just over $4 billion in 2015. China is by far the largestexport market for Pakistani cotton exports, followed by Bangladesh. A brief analysis is shown below, including Pakistan’s total imports andexports for this product, Pakistan’s other top export partners for this product in 2015 and a break-down at the HS-6 level of which items havebeen exported the most in the last 5 years.
Third Review of the Pakistan-China FTA and Recommendations for Phase 2 Negotiations 35
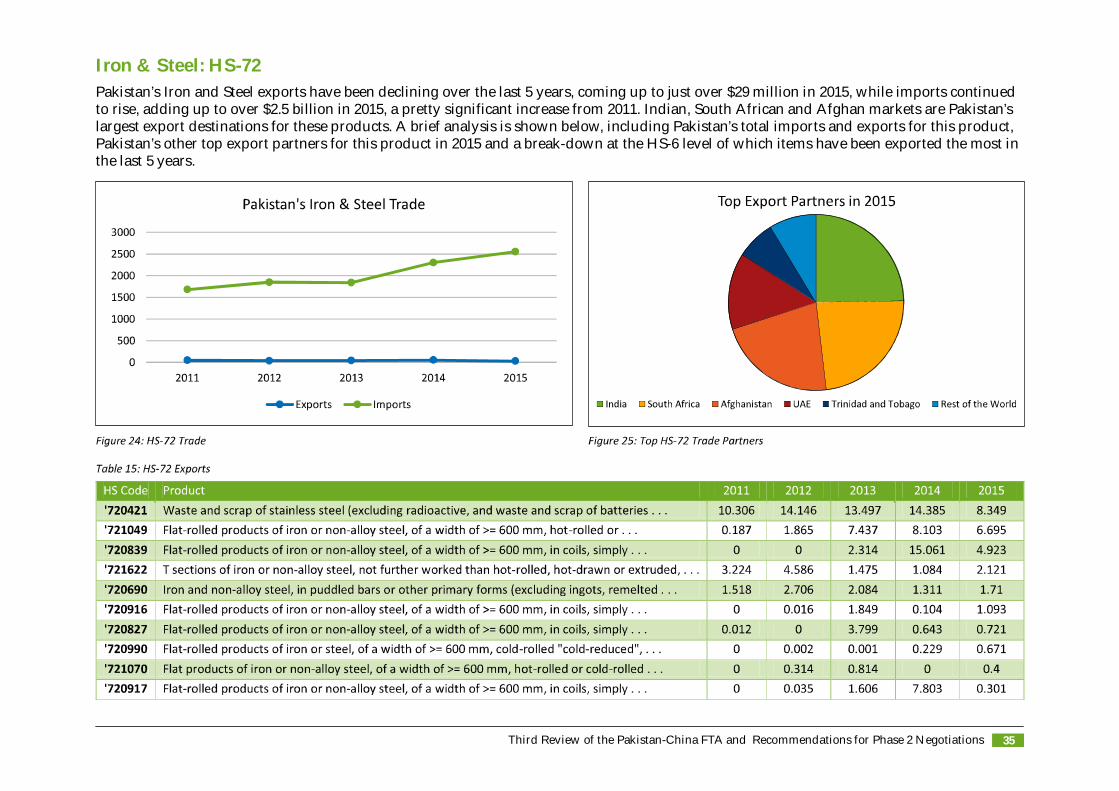
Iron & Steel: HS-72Pakistan’s Iron and Steel exports have been declining over the last 5 years, coming up to just over $29 million in 2015, while imports continuedto rise, adding up to over $2.5 billion in 2015, a pretty significant increase from 2011. Indian, South African and Afghan markets are Pakistan’slargest export destinations for these products. A brief analysis is shown below, including Pakistan’s total imports and exports for this product,Pakistan’s other top export partners for this product in 2015 and a break-down at the HS-6 level of which items have been exported the most inthe last 5 years.
Third Review of the Pakistan-China FTA and Recommendations for Phase 2 Negotiations36
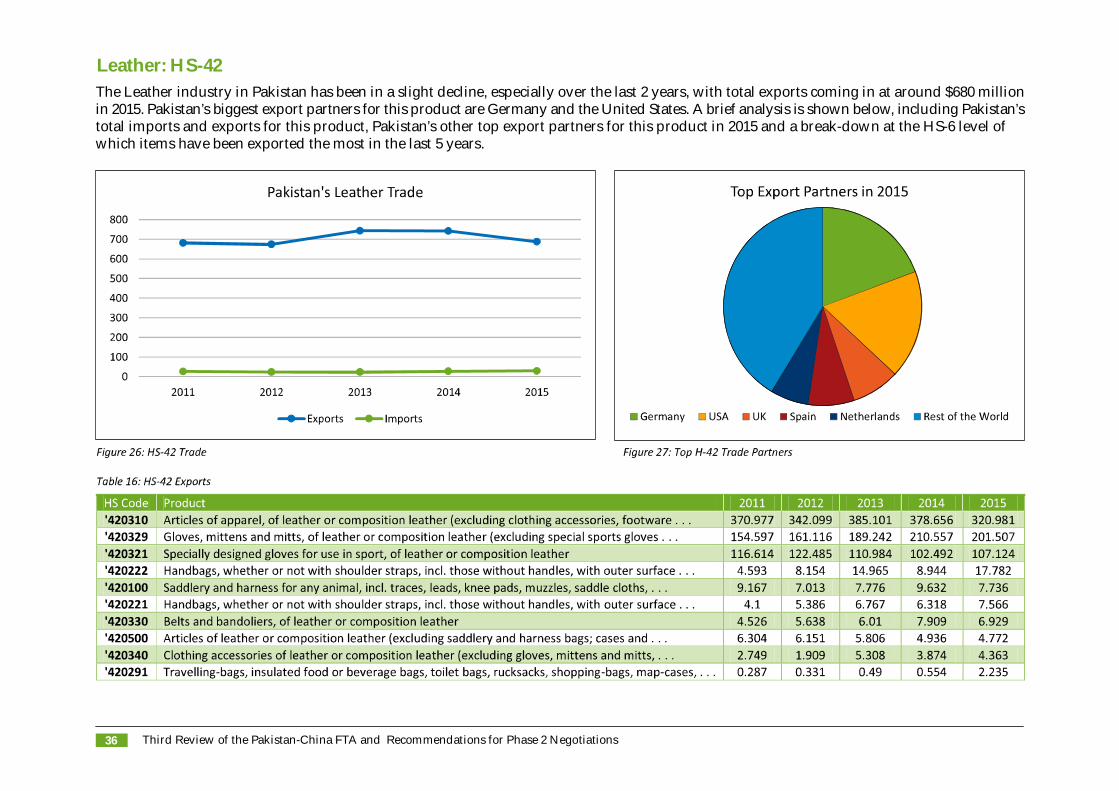
Leather: HS-42The Leather industry in Pakistan has been in a slight decline, especially over the last 2 years, with total exports coming in at around $680 millionin 2015. Pakistan’s biggest export partners for this product are Germany and the United States. A brief analysis is shown below, including Pakistan’stotal imports and exports for this product, Pakistan’s other top export partners for this product in 2015 and a break-down at the HS-6 level ofwhich items have been exported the most in the last 5 years.
Third Review of the Pakistan-China FTA and Recommendations for Phase 2 Negotiations 37
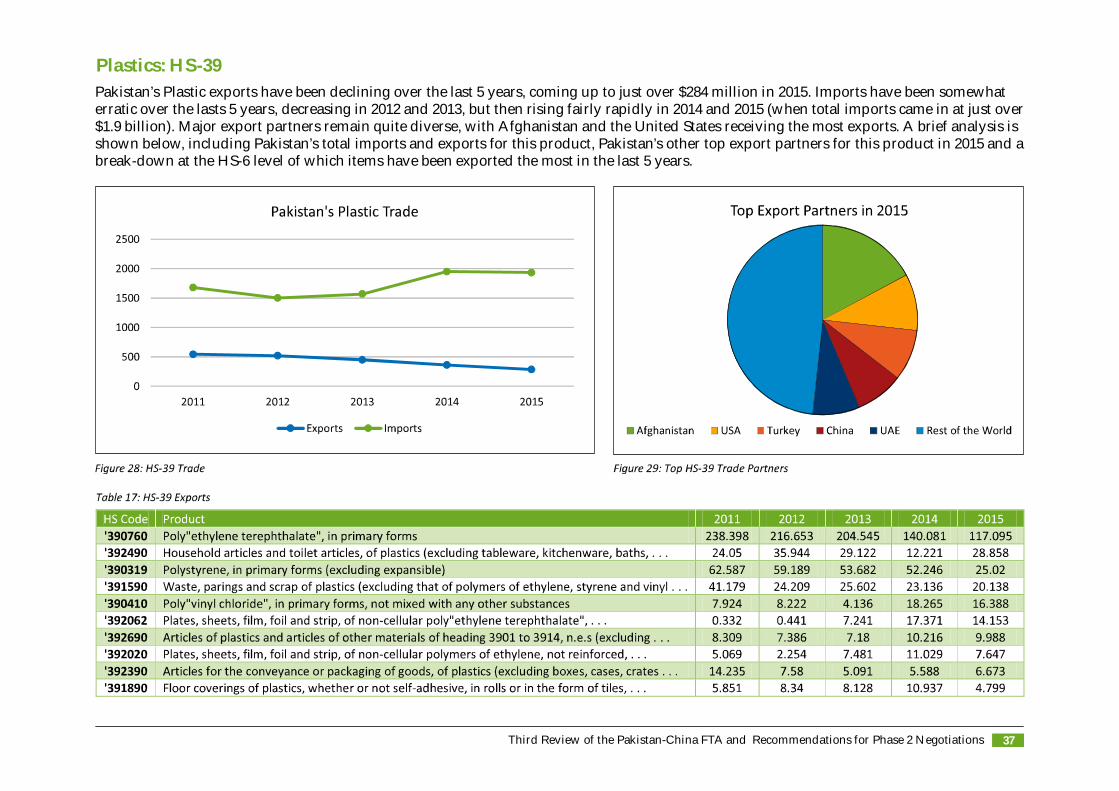
Plastics: HS-39Pakistan’s Plastic exports have been declining over the last 5 years, coming up to just over $284 million in 2015. Imports have been somewhaterratic over the lasts 5 years, decreasing in 2012 and 2013, but then rising fairly rapidly in 2014 and 2015 (when total imports came in at just over$1.9 billion). Major export partners remain quite diverse, with Afghanistan and the United States receiving the most exports. A brief analysis isshown below, including Pakistan’s total imports and exports for this product, Pakistan’s other top export partners for this product in 2015 and abreak-down at the HS-6 level of which items have been exported the most in the last 5 years.


Annexures

Third Review of the Pakistan-China FTA and Recommendations for Phase 2 Negotiations 41

Third Review of the Pakistan-China FTA and Recommendations for Phase 2 Negotiations42
Third Review of the Pakistan-China FTA and Recommendations for Phase 2 Negotiations 43
Third Review of the Pakistan-China FTA and Recommendations for Phase 2 Negotiations44

Third Review of the Pakistan-China FTA and Recommendations for Phase 2 Negotiations 45
Third Review of the Pakistan-China FTA and Recommendations for Phase 2 Negotiations46
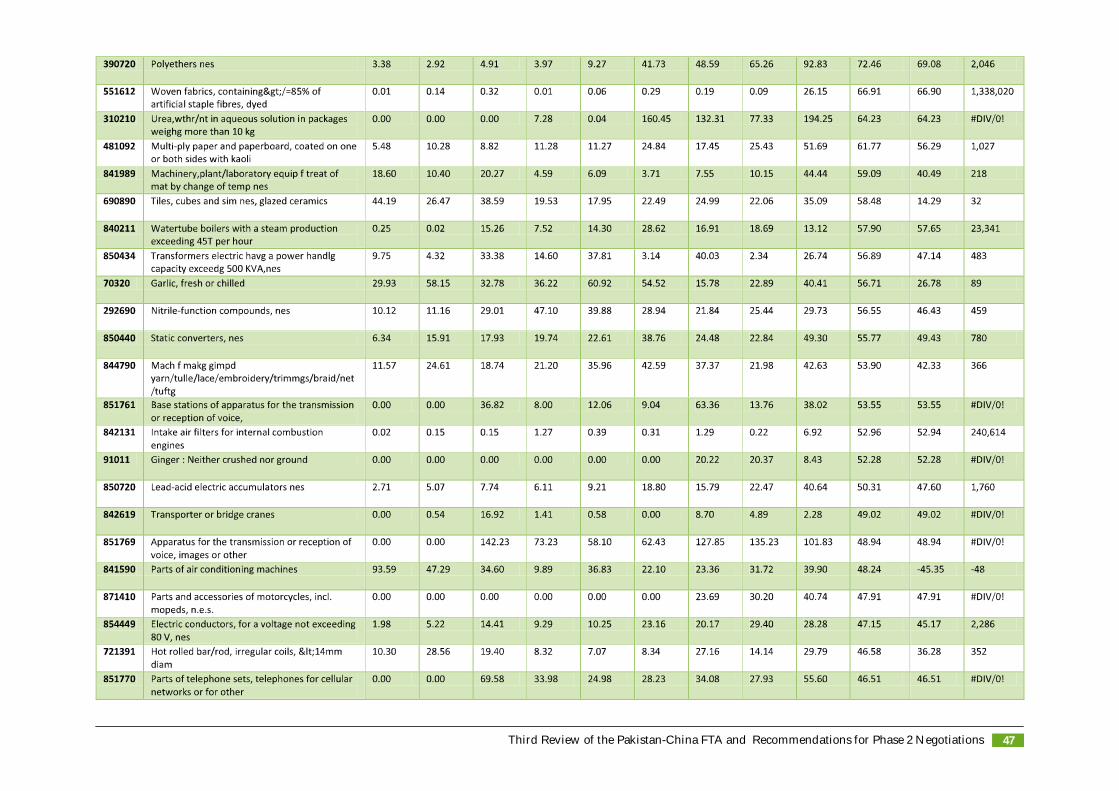
Third Review of the Pakistan-China FTA and Recommendations for Phase 2 Negotiations 47
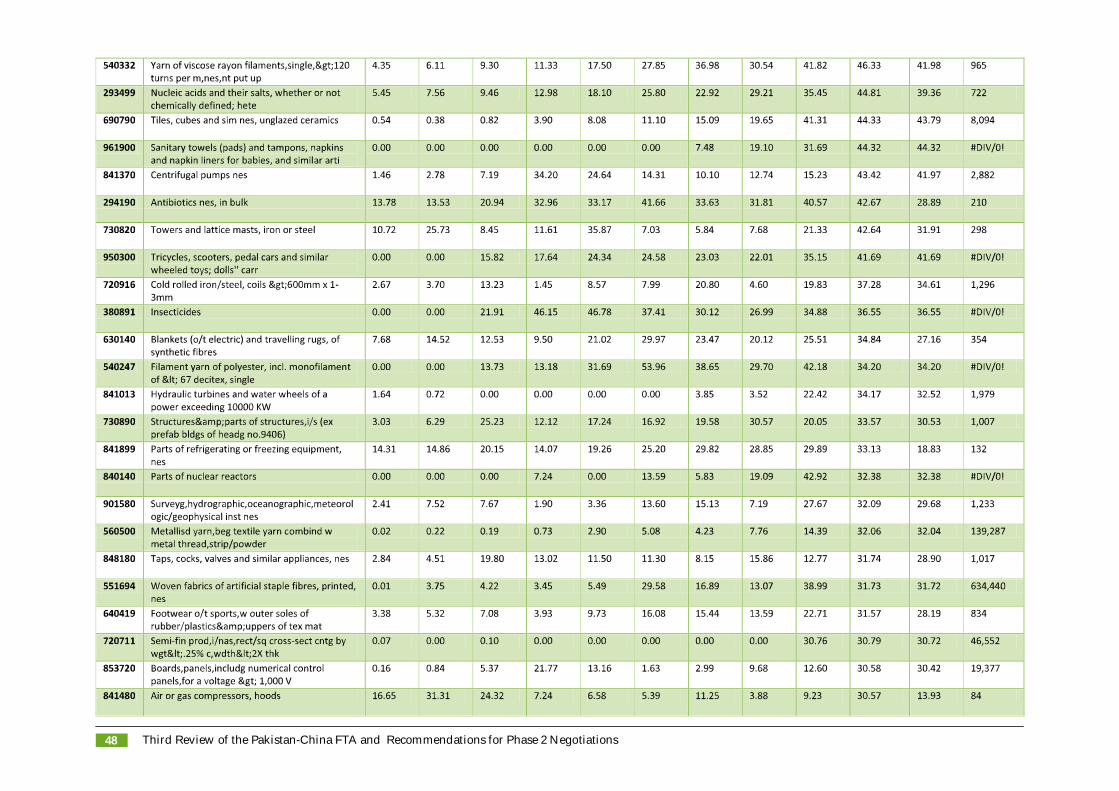
Third Review of the Pakistan-China FTA and Recommendations for Phase 2 Negotiations48
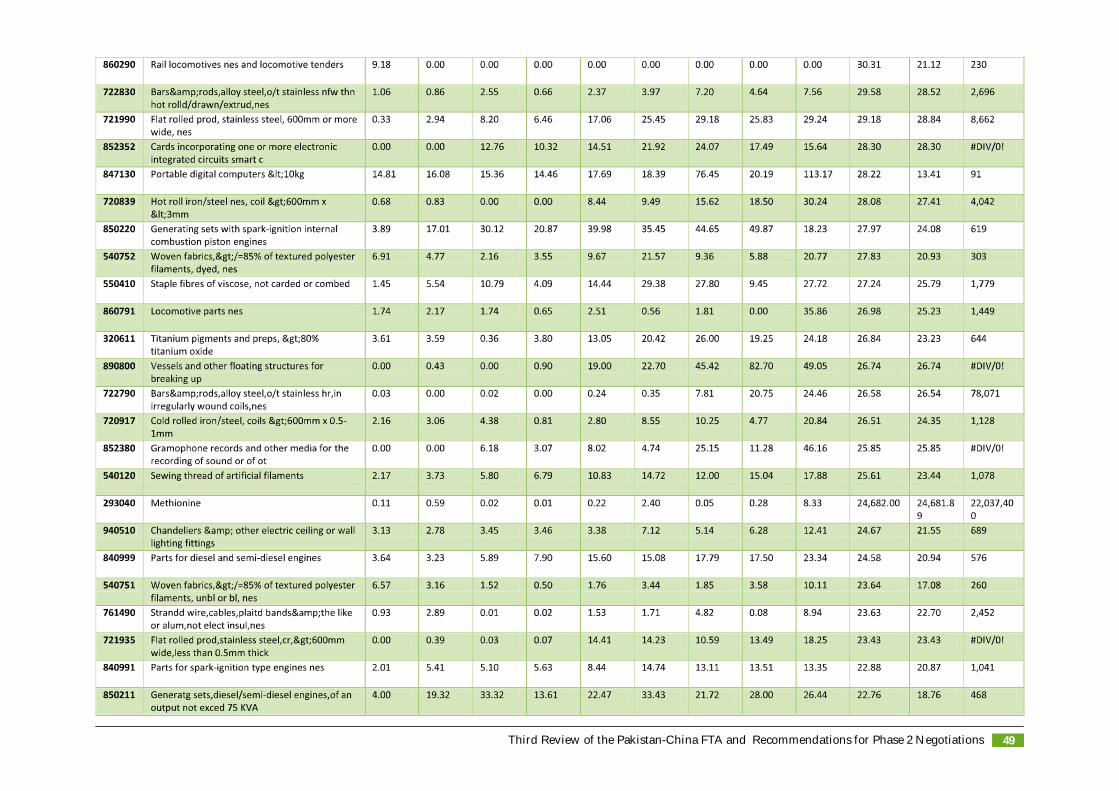
Third Review of the Pakistan-China FTA and Recommendations for Phase 2 Negotiations 49
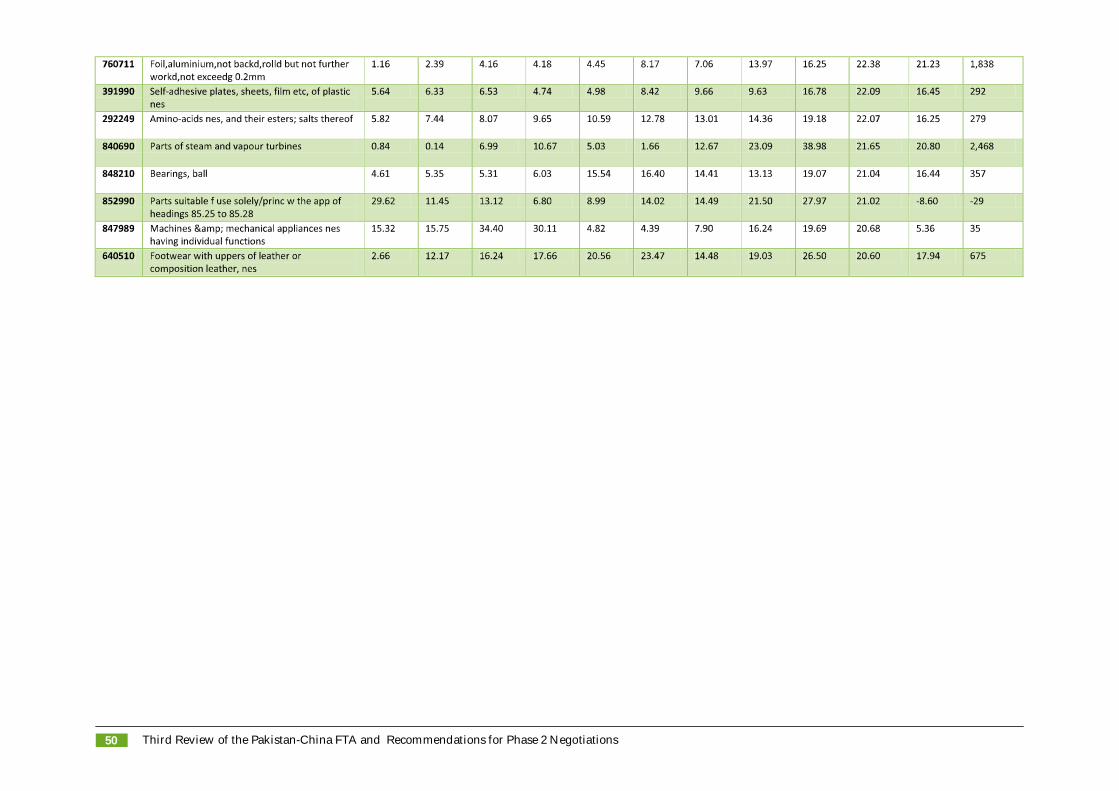
Third Review of the Pakistan-China FTA and Recommendations for Phase 2 Negotiations50
Third Review of the Pakistan-China FTA and Recommendations for Phase 2 Negotiations 51
SourcesChinese Ministry of CommerceMinistry of Planning, Development & Reform (Pakistan)International Trade CentreMalaysian Ministry of International Trade & IndustryPakistani Ministry of CommerceTrade Development Authority PakistanUnited Nations Conference on Trade and DevelopmentUnited Nations Statistical DivisionUNSD Commodity TradeWITS (World Integrated Trade Solutions) – developed by the World BankWorld BankWorld Trade Organisation
MethodologyThis report used data and statistics primarily from the International Trade Centre (ITC), which is the joint agency of the World Trade Organizationand the United Nations. All export and import statistics were taken from ITC. Additional data was taken from the World Bank, the World TradeOrganization and respective Ministries of Commerce (or the regional equivalent). The United Nations (and its affiliated organizations) was usedas the main source of information due to the reliability, transparency and consistency of its data and records.
The official definitions, calculations and formulae used in this report were also taken from the same sources mentioned above, unless specificallymentioned. The calculations for Indicative Potential Trade and Revealed Comparative Advantage were taken from the ITC and World IntegratedTrade Solution (a software developed by the World Bank, in association with other UN agencies) respectively.
Unless otherwise specified:
The data used in this report is as per the most recent statistics available – up to the year-ended 2015; The data used in this report is as per Pakistan’s reported data; The data used in this report is correct as of 1st September 2016, and may be subject to change; All monetary values are in US Dollars (to the million).

Shown ahead are the opinions of various Pakistani industries regarding the Pakistan-China FTA, and the perceived effects it has had on the localmanufacturing industry. These submissions (including, but not limited to, interpretations, conclusions and recommendations) are solely reflectiveof the companies who have submitted the information, and do not reflect the findings of this report or the views of the Pakistan Business Council.The purpose of including these submissions is to allow for a wider range of viewpoints, broadening the reader’s perspective.
Effects of the FTA: Sectorial Perspectives

Third Review of the Pakistan-China FTA and Recommendations for Phase 2 Negotiations 55
Cotton and Textile ProductsSaif Group
Semi-Finished Textile ProductsCotton-based materials, especially coarser counts yarns, heavier constructions in grey fabric and related dyed/printed materials have an establishedmarket in China. This sector will continue to flourish, provided we are able to compete with India and Vietnam, who are emerging as majorsuppliers in China. Favorable trade concessions in this category will actually help Pakistani industries. The government will have to focus onkeeping manufacturers competitive by giving special attention to the local cotton crop, reducing utility costs and balancing exchange rates.Fine count yarns (i.e. NE 40/1 and above) are high in demand for local apparel use and with the removal of duty, Chinese yarns will flood intoPakistani markets, heavily impacting the yarn and fabric manufacturers selling yarn in the local apparel market. The government should carefullyanalyze and check the dumping of subsidized products from China timely.Pakistan is not competitive internationally in MMF Fiber (i.e. Polyester and Viscose based semi-finished products) because the supply chain isnot fully developed. Chinese manufacturers have an edge in these products and this will be a threat for Pakistani textile producers selling theirproducts in the local market. If the Pakistani government can identify and check the dumping of goods in this category, then this risk could bemitigated. The removal of duty on polyester fiber may be a big threat for the local polyester fiber producers.Filament yarns and relevant fabrics are already being imported from China so the consumer will get cheaper products, however the governmentwill lose revenue in terms of Customs Duty.
Finished Textile ProductsCotton-based finished textile products will have a significant advantage if tariff concessions/eliminations are offered in this category. Wages arealready rising in China, and Pakistani textile manufacturers can capture a sizeable market. Pakistan is already exporting cotton-based hosiery,towel, garments, denim and home furnishing etc. at very competitive prices to the US and the EU. China’s rising middle class could be the nexttarget market.In MMF-based products, Pakistan has a large consumer market and tariff concessions/eliminations in these categories will mean that localproducers will face stiff competition from China. The government will have to take necessary measures to protect these producers from subsidizedcompetition that may in come from China.In general, preferential trade concessions with China can help the Pakistani textile industry to find new markets for its textile products. However,the Pakistani government will have to formulate a right strategy to deal with the dumping of subsidized (direct or indirect) Chinese productsinto Pakistani markets.
Third Review of the Pakistan-China FTA and Recommendations for Phase 2 Negotiations56
Paper and Paperboard
Bulleh Shah Packaging (Pvt.) Limited
Due to unfair competition offered by Chinese exporters of paper products, and a difficult business environment on the domestic front, BullehShah Packaging’s (BSPL) economic indicators are moving downward. This is mainly because of low-priced imports (under-invoiced), pushingthe domestic industry to operate below its installed capacity.
One of the reasons for dumped and subsidized imports from China under the FTA is that Chinese government has deliberately, for an export-oriented economy, had taken some innovative steps over the last few decades to make China a ‘Global Economic Giant’. The Chinese governmenthas also taken some initiatives for the long-term sustainability of their domestic paper and pulp industry, which mainly includes strengtheningpolicy support for the domestic industry.
From the very preamble of Phase I of the FTA, it is clearly perceived that the FTA should be more effective and beneficial for Pakistan, as comparedto China, because China is the number one producer of paper and pulp products in the world. If compared to Pakistan, its production is morethan hundred times than Pakistan’s entire consumption.
In view of the above, we suggest that paper and paperboard end products (HS Codes: 4802-5510, 4802-5520, 4802-5530, 4802-5540, 4802-5590,4802-5600, 4802-5700, 4802-6100 and 4802-6200) should be placed in the ‘no concession’ category for the next 10 years in Phase II of the FTA.
We also suggest that the following paper and paperboard raw material goods should be placed in the ‘zero-tariff’ category in Phase II:HS Codes: 1108-1400, 2507-0000, 2509-0000, 2921-2100, 2924-1990, 3505-2090, 3806-2000, 3808-9290, 3903-9000, 3809-9200, 3824-9020, 3903-9000,3906-9090, 4703-2100 and 4707-1010
It may be mentioned that Pakistan’s domestic paper and paperboard industry is already facing dumped imports from the following sources:Paper: China, Indonesia, Brazil, Thailand and JapanPaperboard: China, Indonesia and South Korea
In this kind of situation, where the domestic industry is already facing unfair trade practices from China, any further concessions given to Chinawould be disastrous.
Third Review of the Pakistan-China FTA and Recommendations for Phase 2 Negotiations 57
Century Paper & Board Mills Ltd.
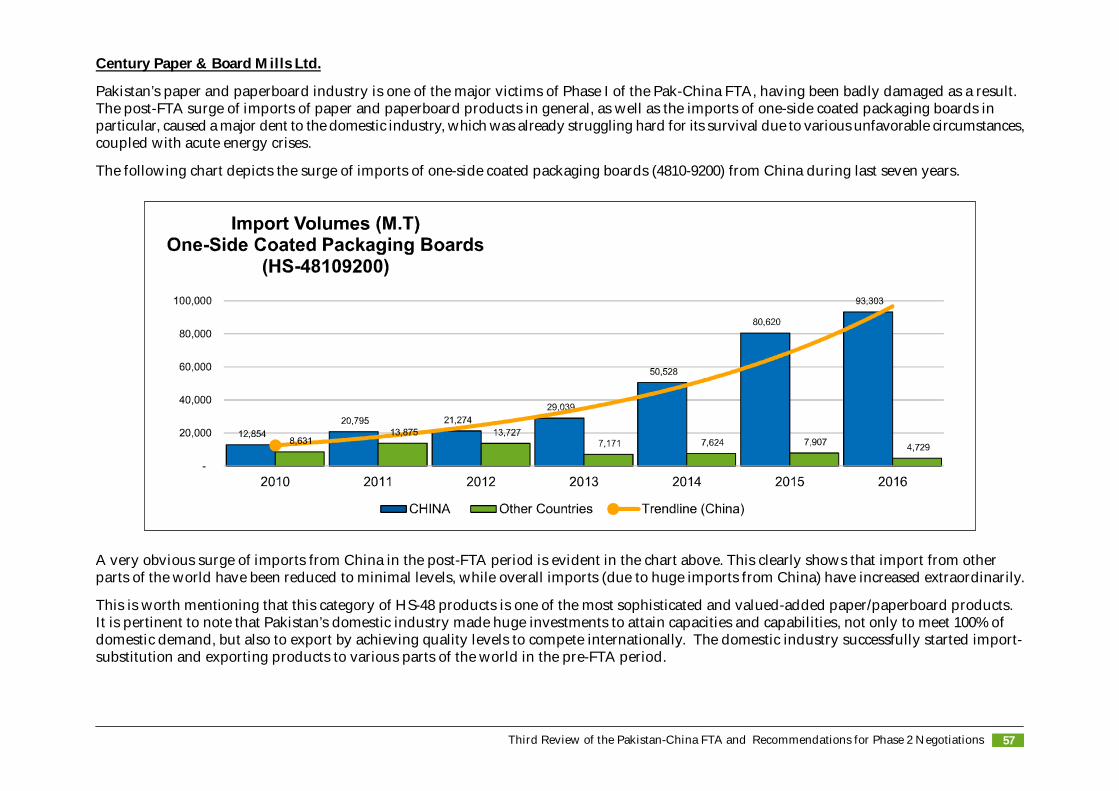
Pakistan’s paper and paperboard industry is one of the major victims of Phase I of the Pak-China FTA, having been badly damaged as a result.The post-FTA surge of imports of paper and paperboard products in general, as well as the imports of one-side coated packaging boards inparticular, caused a major dent to the domestic industry, which was already struggling hard for its survival due to various unfavorable circumstances,coupled with acute energy crises.
The following chart depicts the surge of imports of one-side coated packaging boards (4810-9200) from China during last seven years.
A very obvious surge of imports from China in the post-FTA period is evident in the chart above. This clearly shows that import from otherparts of the world have been reduced to minimal levels, while overall imports (due to huge imports from China) have increased extraordinarily.
This is worth mentioning that this category of HS-48 products is one of the most sophisticated and valued-added paper/paperboard products.It is pertinent to note that Pakistan’s domestic industry made huge investments to attain capacities and capabilities, not only to meet 100% ofdomestic demand, but also to export by achieving quality levels to compete internationally. The domestic industry successfully started import-substitution and exporting products to various parts of the world in the pre-FTA period.
Third Review of the Pakistan-China FTA and Recommendations for Phase 2 Negotiations58
Unfortunately, the post-FTA situation has led to unfavorable circumstances for the domestic industry, and the surge of imports (as shownabove) has also taken over the domestic industry’s share of the market (which it attained in the pre-FTA period). Moreover, Chinese imports donot allow the domestic industry to take a share of the growing market size, leaving its installed capacity unutilized.
In order to improve the balance of trade apart from exports, import-substitution is equally important. The domestic paper and paperboardindustry is capable of saving a gross outflow of over $650 million/annum of precious foreign exchange through import-substitution, while thereis also an additional capacity to save a further $250-300 million/annum with the current available installed capacity of the industry.
Recommendations for Phase-II Pak – China FTA NegotiationsIn view of the position mentioned above, and damage to the domestic paper and paperboard industry in Phase I of the FTA, the following isrecommended to save the domestic paper and paperboard industry, and to come out of crises, enabling it to utilize its already installed capacity.Capacity utilization of the domestic industry will not only save the outflow of foreign exchange, but will also help to increase employmentopportunities and support its upstream and downstream industries.It is strongly recommended to put the relevant HS codes of Chapter-48 in the ‘no concession’ list in Phase II of the FTA.The domestic paper and paperboard industry has been raising its voice at different available forums and has provided detailed information tothe concerned authorities for consideration. The domestic industry is always available to explain its rationale for placing major products in the‘no concession’ list for Phase II of the FTA.
A Brief Profile of the Paper and Paperboard Industry of PakistanPaper and paperboard industry of Pakistan consists of over 150 units, developed over a period of time with an investment of over PKR 70 billion.This is one of Pakistan’s major industries and is highly capital-intensive, needing continuous operations to achieve operational efficiencies. Thisindustry’s turnover is PKR 63 billion/annum, while its downstream industries, printing and packaging, adds a further value of 35-40%, raisingthe overall turnover to around PKR 89 billion/annum.
Apart from contributing to the national economy in the form of taxes, this industry has also been contributing a lot to in terms of import-substitution, use of agricultural residuals (wheat, straw etc.) and consumption of waste-paper for recycling. Moreover, this industry, coupledwith the printing and packaging industry, has emerged to be the second-largest employment provider in the country.
This industry is using over half a million metric tons of wheat straw (agricultural waste), annually generating an additional income to the farmersof over PKR 3 billion/annum. The use of over one million metric tons/annum of waste-paper for recycling is not only helping to keep theenvironment clean, but is also creating an income of over PKR 18 billion/annum for the unskilled labor force, through employment via the waste-paper collection chain.
Over a period of time, this industry has played an important role in human resource development by imparting foreign trainings and exposureto professionals working within this industry. In the absence of any university in the country offering engineering degrees in paper and paperboardtechnology, it was very challenging to operate this highly capital-intensive industry with the local technologists.

Third Review of the Pakistan-China FTA and Recommendations for Phase 2 Negotiations 59
Pakistan’s paper and paperboard industry can be classified into two major categories:
Organized Sector: producing products for import-substitution with state-of-the-art plants Un-Organized Sector: producing low-cost products to meet price conscious market segments.
In view of the energy crises, the domestic market industry was left with no option except to further invest in self power generation. CenturyPaper & Board Mills Limited and Bulleh Shah Packaging Pvt Ltd. (Formally Packages Ltd.) has recently invested around PKR 14 billion for powergeneration projects with bio mass and coal as the main fuel.
In spite of huge investments made since 2009 in capacity and quality enhancement, coupled with the recent investment in power generation,the domestic industry is still unable to utilize its installed capacity due to the surge in imports from China under FTA.
* The import figure for the year 2016 is annualized based on actual data for the period from January to August 2016.
Third Review of the Pakistan-China FTA and Recommendations for Phase 2 Negotiations60
Banking / Financial Sector
Allied Bank and Ibrahim Group
In this era of globalization, international trade is the need of time, and no country can survive and grow in isolation. Trade negotiations have tobe tackled very professionally. Our FTA impact-assessment is primarily based upon:
• Impact on domestic industry• Impact on country’s economy (GDP, trade surplus/deficit etc.)
The FTA with China is poorly negotiated, which has resulted in ruining the domestic industry and dangerously widening the trade deficit ofabout $6 billion, only through Pak-China trade. Pakistan is facing revenue losses of an estimated PKR 22 billion/annum on account of taxexemptions granted on Chinese imports.
The domestic industry should be given tariff protection against the dumping of Chinese export surplus, enabling us to avoid revenue lossesresulting from this dumping.
It is therefore highly suggested to incorporate following factors during trade negotiations.
• Any product which has an export-surplus MUST not be included in FTA (to import with preferential tariff); rather hefty tariff and non-tariff barriers should be imposed to protect the domestic industry.
• Instead of dishing out the number of tariff lines (you give us 100 product lines and we give you free tariff on 100 product lines), it is moreappropriate to negotiate product-to-product, as per need of our country.
• Ideally, the balance of trade in dollar terms should be maintained to ensure ZERO trade deficit.• Schedule of technology-transfer in the form of FDI or JV for the products to be imported under FTA
Automotive Vehicles and Parts
Thal Limited, House of Habib
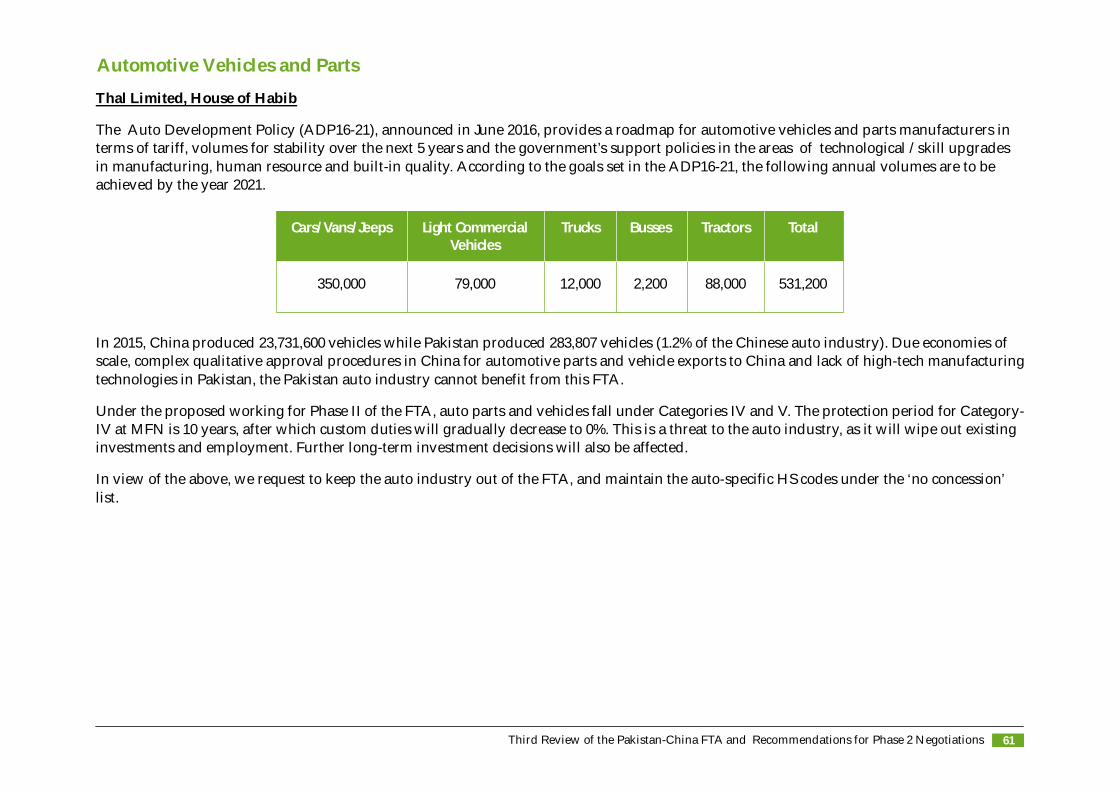
The Auto Development Policy (ADP16-21), announced in June 2016, provides a roadmap for automotive vehicles and parts manufacturers interms of tariff, volumes for stability over the next 5 years and the government’s support policies in the areas of technological / skill upgradesin manufacturing, human resource and built-in quality. According to the goals set in the ADP16-21, the following annual volumes are to beachieved by the year 2021.
In 2015, China produced 23,731,600 vehicles while Pakistan produced 283,807 vehicles (1.2% of the Chinese auto industry). Due economies ofscale, complex qualitative approval procedures in China for automotive parts and vehicle exports to China and lack of high-tech manufacturingtechnologies in Pakistan, the Pakistan auto industry cannot benefit from this FTA.
Under the proposed working for Phase II of the FTA, auto parts and vehicles fall under Categories IV and V. The protection period for Category-IV at MFN is 10 years, after which custom duties will gradually decrease to 0%. This is a threat to the auto industry, as it will wipe out existinginvestments and employment. Further long-term investment decisions will also be affected.
In view of the above, we request to keep the auto industry out of the FTA, and maintain the auto-specific HS codes under the ‘no concession’list.
Third Review of the Pakistan-China FTA and Recommendations for Phase 2 Negotiations 61
350,000 79,000 12,000 2,200 88,000 531,200
Cars/Vans/Jeeps Light CommercialVehicles
TotalTractorsTrucks Busses
Third Review of the Pakistan-China FTA and Recommendations for Phase 2 Negotiations62
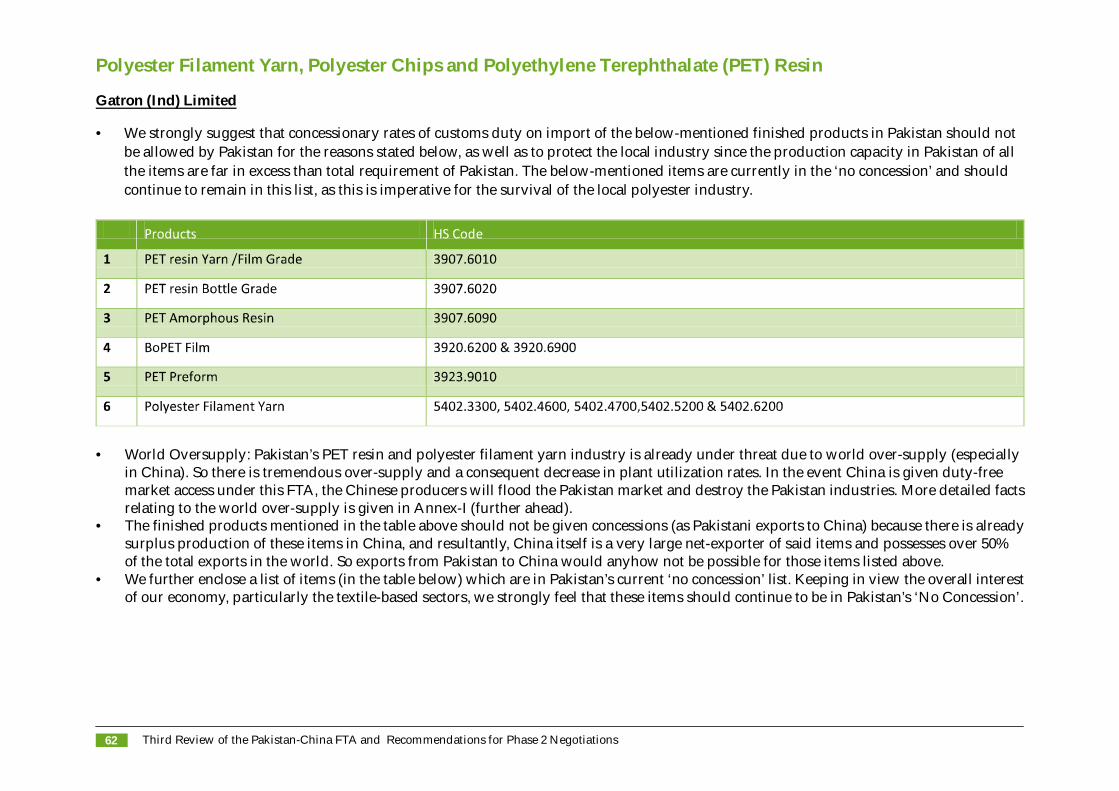
Polyester Filament Yarn, Polyester Chips and Polyethylene Terephthalate (PET) Resin
Gatron (Ind) Limited
• We strongly suggest that concessionary rates of customs duty on import of the below-mentioned finished products in Pakistan should not be allowed by Pakistan for the reasons stated below, as well as to protect the local industry since the production capacity in Pakistan of all the items are far in excess than total requirement of Pakistan. The below-mentioned items are currently in the ‘no concession’ and should continue to remain in this list, as this is imperative for the survival of the local polyester industry.
• World Oversupply: Pakistan’s PET resin and polyester filament yarn industry is already under threat due to world over-supply (especially in China). So there is tremendous over-supply and a consequent decrease in plant utilization rates. In the event China is given duty-free market access under this FTA, the Chinese producers will flood the Pakistan market and destroy the Pakistan industries. More detailed factsrelating to the world over-supply is given in Annex-I (further ahead).
• The finished products mentioned in the table above should not be given concessions (as Pakistani exports to China) because there is alreadysurplus production of these items in China, and resultantly, China itself is a very large net-exporter of said items and possesses over 50% of the total exports in the world. So exports from Pakistan to China would anyhow not be possible for those items listed above.
• We further enclose a list of items (in the table below) which are in Pakistan’s current ‘no concession’ list. Keeping in view the overall interestof our economy, particularly the textile-based sectors, we strongly feel that these items should continue to be in Pakistan’s ‘No Concession’.
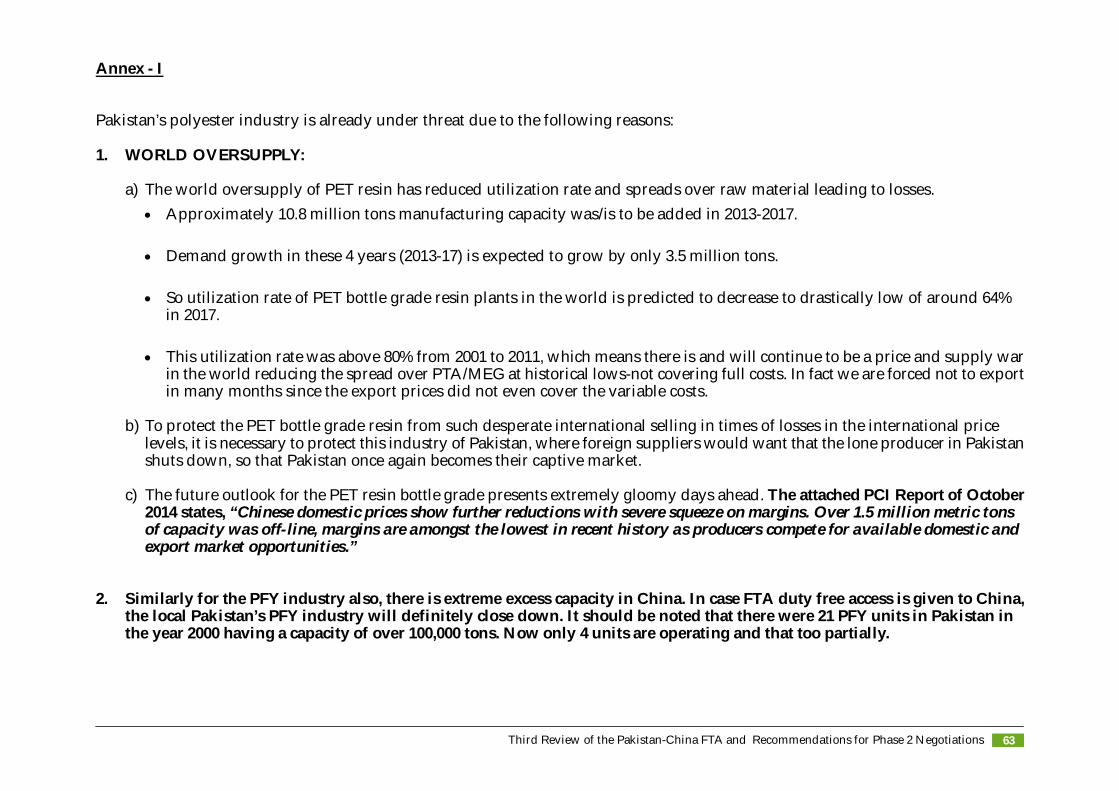
Annex - I
Pakistan’s polyester industry is already under threat due to the following reasons:
1. WORLD OVERSUPPLY:
a) The world oversupply of PET resin has reduced utilization rate and spreads over raw material leading to losses. Approximately 10.8 million tons manufacturing capacity was/is to be added in 2013-2017.
Demand growth in these 4 years (2013-17) is expected to grow by only 3.5 million tons.
So utilization rate of PET bottle grade resin plants in the world is predicted to decrease to drastically low of around 64% in 2017.
This utilization rate was above 80% from 2001 to 2011, which means there is and will continue to be a price and supply warin the world reducing the spread over PTA/MEG at historical lows-not covering full costs. In fact we are forced not to exportin many months since the export prices did not even cover the variable costs.
b) To protect the PET bottle grade resin from such desperate international selling in times of losses in the international price levels, it is necessary to protect this industry of Pakistan, where foreign suppliers would want that the lone producer in Pakistanshuts down, so that Pakistan once again becomes their captive market.
c) The future outlook for the PET resin bottle grade presents extremely gloomy days ahead. The attached PCI Report of October2014 states, “Chinese domestic prices show further reductions with severe squeeze on margins. Over 1.5 million metric tons of capacity was off-line, margins are amongst the lowest in recent history as producers compete for available domestic and export market opportunities.”
2. Similarly for the PFY industry also, there is extreme excess capacity in China. In case FTA duty free access is given to China,the local Pakistan’s PFY industry will definitely close down. It should be noted that there were 21 PFY units in Pakistan in the year 2000 having a capacity of over 100,000 tons. Now only 4 units are operating and that too partially.
Third Review of the Pakistan-China FTA and Recommendations for Phase 2 Negotiations 63
Third Review of the Pakistan-China FTA and Recommendations for Phase 2 Negotiations64
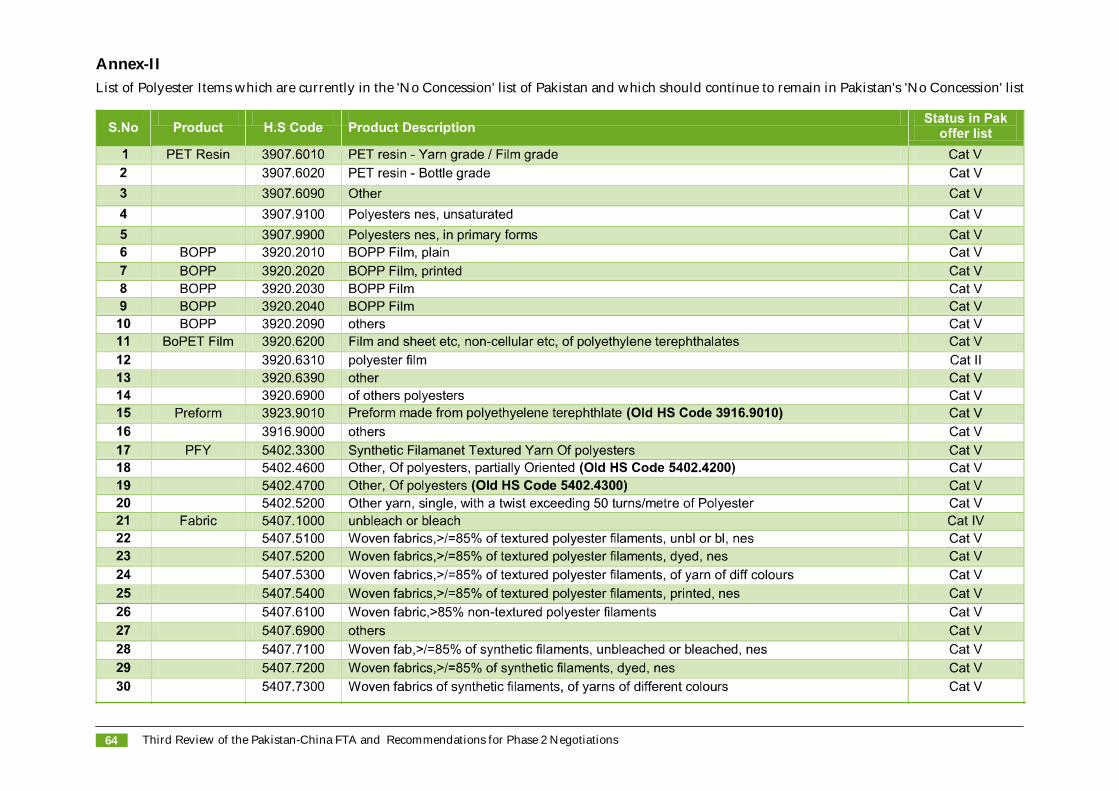
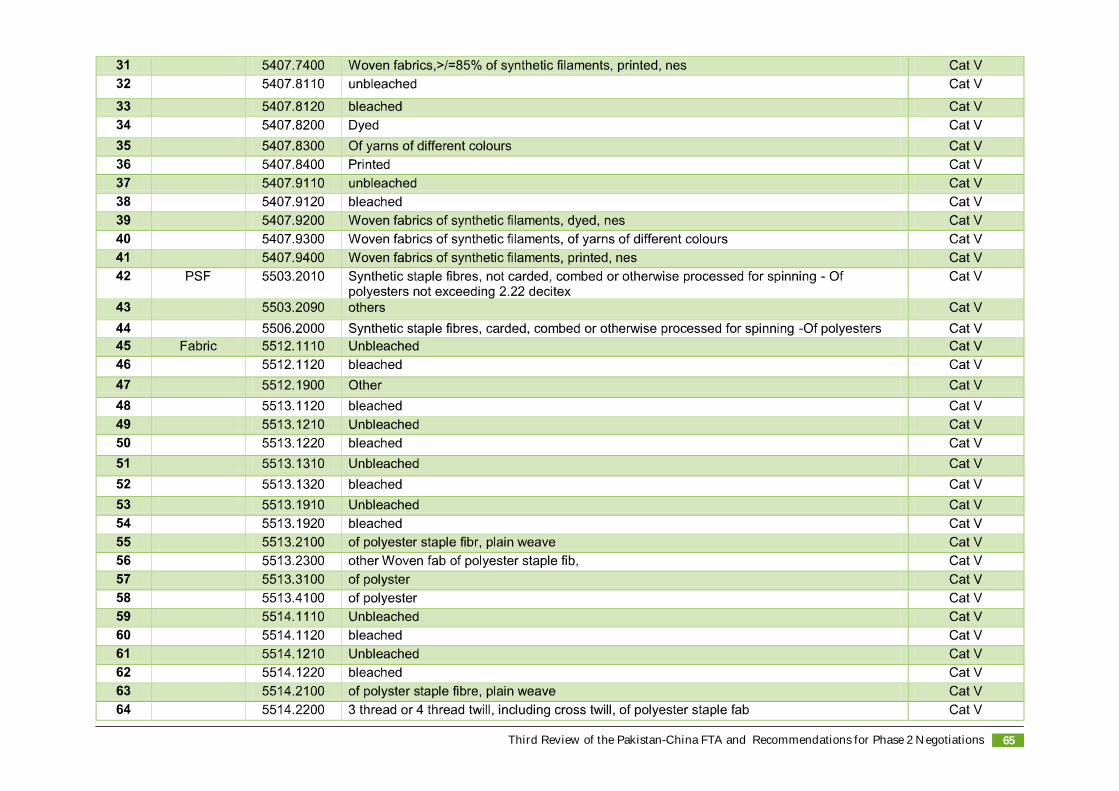
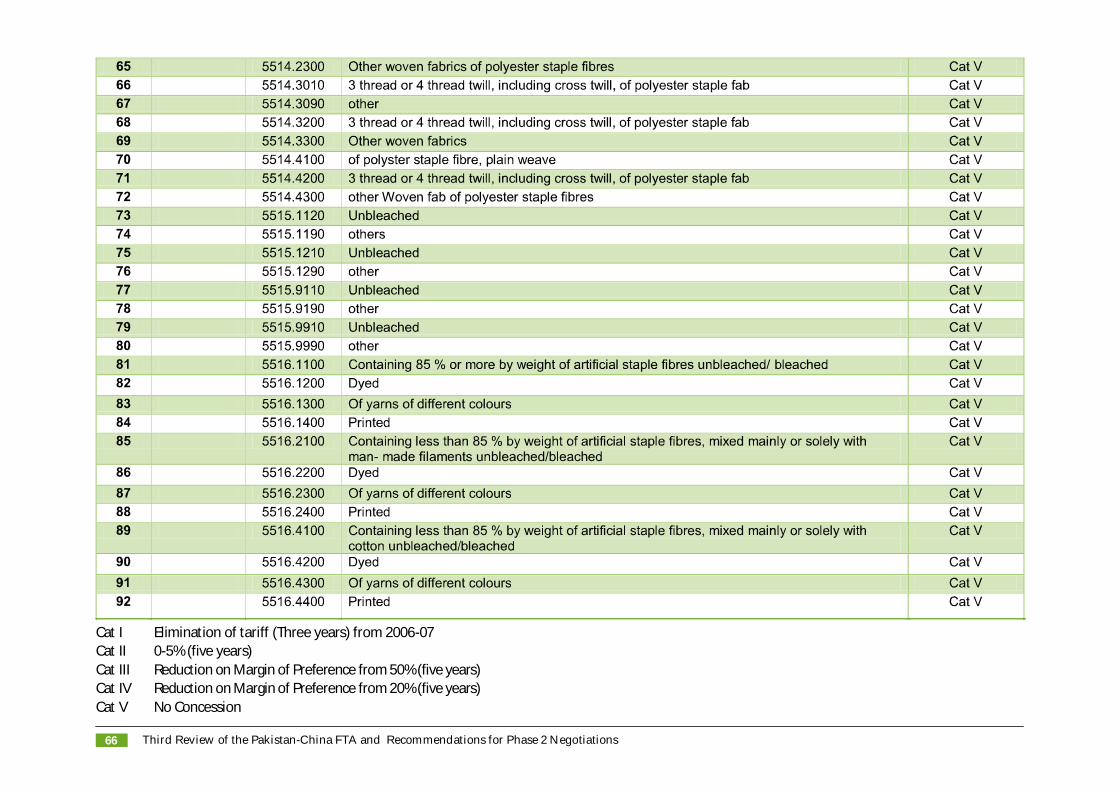
Annex-IIList of Polyester Items which are currently in the 'No Concession' list of Pakistan and which should continue to remain in Pakistan's 'No Concession' list
Third Review of the Pakistan-China FTA and Recommendations for Phase 2 Negotiations 65
Third Review of the Pakistan-China FTA and Recommendations for Phase 2 Negotiations66
Cat I Elimination of tariff (Three years) from 2006-07Cat II 0-5% (five years)Cat III Reduction on Margin of Preference from 50% (five years)Cat IV Reduction on Margin of Preference from 20% (five years)Cat V No Concession
8th Floor, Dawood Centre, M. T. Khan Road, Karachi, Pakistan.Telephone: +92-21 35630528-29 Fax: +92-21 35630530 Website: www.pbc.org.pk