this is an electronic reprint of the original article. this reprint - jyx
TRANSCRIPT

This is an electronic reprint of the original article. This reprint may differ from the original in pagination and typographic detail.
Author(s):
Title:
Year:
Version:
Please cite the original version:
All material supplied via JYX is protected by copyright and other intellectual property rights, and duplication or sale of all or part of any of the repository collections is not permitted, except that material may be duplicated by you for your research use or educational purposes in electronic or print form. You must obtain permission for any other use. Electronic or print copies may not be offered, whether for sale or otherwise to anyone who is not an authorised user.
The effect of polytechnic reform on migration
Böckerman, Petri; Haapanen, Mika
Böckerman, P., & Haapanen, M. (2013). The effect of polytechnic reform onmigration. Journal of Population Economics, 26 (2), 593-617. doi:10.1007/s00148-012-0454-4 Retrieved from http://link.springer.com/article/10.1007%2Fs00148-012-0454-4
2013
Forthcoming in Journal of Population Economics The original publication will be available at www.springerlink.com.
A direct link: http://dx.doi.org/10.1007/s00148-012-0454-4
The effect of polytechnic reform on migration
Petri Böckerman
Labour Institute for Economic Research
E-mail: [email protected]
Mika Haapanen*
University of Jyväskylä, School of Business and Economics
E-mail: [email protected]
29 September 2012
Abstract
This paper examines the effect of the polytechnic reform on geographical mobility. A
polytechnic, higher education reform took place in Finland in the 1990s. It gradually
transformed former vocational colleges into polytechnics and also brought higher
education to regions that did not have a university before. This expansion of higher
education provides exogenous variation in the regional supply of higher education. The
reform raised the mobility of high school graduates across local labour markets in the
years after they had completed their secondary studies, which indicated increased
mobility between high school and post-secondary education. We estimate that the
reform enhanced the annual migration rate of high school graduates by 1.2 percentage
points over a three-year follow-up period. This represents a substantial increase,
because their baseline migration rate is 3.7 per cent. The effect fades several years after
the completion of secondary studies.
Keywords Migration; School reform; High school graduates; Vocational education;
Polytechnic education
JEL classification J10, J61, I20, R23
____
*Corresponding author. University of Jyväskylä, School of Business and Economics
(JSBE). Address: PO Box 35, FI-40014 University of Jyväskylä, Finland. Phone: +358-
40-5767800. Fax: +358-14-2601021. E-mail: [email protected]

1
1 Introduction
A polytechnic education reform took place in Finland in the 1990s. It gradually
transformed former vocational colleges into polytechnics offering a Bachelor’s degree
and expanded the supply of higher education to all regions. In other words, the reform
brought higher education to regions that did not have a university in the pre-reform
system.
The polytechnic reform was the largest single education reform in Finland since the
reform of the comprehensive school system in the early 1970s. The polytechnics
constituted a new non-university sector in higher education. The number of graduates
from polytechnics has risen very rapidly. By 2000 the number of new polytechnic
graduates exceeded the number of new university graduates. This paper exploits the
polytechnic reform to examine internal migration patterns. We argue that the lessons
from the reform have a broader interest, because they help to understand how the
expansion of education, which is experienced by most of the advanced countries, affects
internal mobility patterns.
The fear among the policy-makers has been that the polytechnic reform may have
resulted in increased out-migration of the highly educated graduates from the peripheral
regions (“brain drain”), for example, because job opportunities for the highly educated
are less local. This outcome would be undesirable from the perspective of regional
policy objectives, since the highly educated migrants possess above average skills and
also earn above average incomes. Therefore, the prospects of economic growth in the
peripheral regions are weakened and the tax burden of those who remain rises.

2
Consequently, regional disparities may increase substantially. It is obvious that for
individuals it is desirable to improve human capital and leave a declining area.1
Although prior analyses of the relationship between education and migration behaviour
are extensive, only the recent studies by Hickman (2009), Machin et al. (2012), and
Malamud and Wozniak (2012) have utilized policy reforms to study the relationship
between education and migration. Hickman (2009) considers the extent to which a
merit-based aid programme in Florida has affected the location decisions of the college-
educated. His results show that those eligible for the programme are significantly more
likely to locate in Florida after completing their education than those who were not
eligible.
In Machin et al. (2012) and Malamud and Wozniak (2012) the emphasis is on the effect
of education on internal migration. Using a Norwegian primary school reform, Machin
et al. (2012) find that the length of compulsory education has a positive causal impact
on migration. One additional year of education increases the annual migration rates by
15 per cent from a low base rate of one per cent per year. Malamud and Wozniak (2012)
use variation in college attainment in the U.S. induced by draft-avoidance behaviour
during the Vietnam War. Their results imply that the additional years of higher
education significantly increased the likelihood that the affected men, later in life,
resided outside the states where they had been born.
The aim of this paper is to explore the effects of the polytechnic reform on interregional
migration. The analyses are based on particularly rich longitudinal data on graduated
high school students from 1988 to 1998. The polytechnic reform provides us with the
exogenous variation in the supply of higher education across regions and over time. The
results show that the expansion of higher education increased the migration of high
1 For a further discussion of the brain drain, see Yousefi and Rives (1987) and Gottlieb and Joseph

3
school graduates. The migration propensities increased particularly close to graduation
from high school. But our estimates also suggest a smaller positive effect over a longer
period.
The remainder of the paper is organized as follows. The next section describes the
higher education system in Finland and the polytechnic reform. In Section 3 we discuss
reasons why the polytechnic reform should affect interregional migration. Section 4
introduces the data. Section 5 describes the empirical approach, and the results are
reported in Section 6. The last section concludes.
2 Higher education in Finland and the polytechnic reform
Compulsory comprehensive schooling for children begins at the age of seven.2 It lasts
for nine years. ~50 per cent of the pupils continue to a high school (general upper
secondary school, “lukio” in Finnish), which lasts for three years and ends with a
matriculation examination. At the beginning of the 1990s, vocational schools and
colleges were a diverse group of schools. Some took most of their students directly from
comprehensive schools and provided them with two or three years of vocational
education. In some vocational colleges most students had completed high school
education before entering a vocational college. For example, a business degree from a
vocational college typically required three years of schooling after a comprehensive
school or two years of schooling after a high school.
Since the polytechnic education reform the higher education system has comprised two
parallel sectors: universities3 and polytechnics. In essence, the reform brought higher
education to areas that did not have a university before the reform. The polytechnic
(2006). 2 The description of the higher education system and the polytechnic education reform is based on Böckerman et al. (2009, p. 673–675).

4
degrees are bachelor-level degrees with a vocational emphasis. These degrees take from
three and a half to four years to complete. A major difference between the sectors is that
polytechnic schools are not engaged in academic research like universities. Education is
free at both levels.
The first 22 polytechnics were established under a temporary licence in 1991 (e.g.,
Lampinen 2004). The polytechnics were created by the gradual merging of 215
vocational colleges and vocational schools. The gradual implementation of the reform is
clearly reflected in the fact that students who had started their studies before a particular
vocational college transformed itself into a polytechnic continued their studies along the
old college lines, and they eventually graduated with vocational college degrees.4
Hence, the timing of the reform varied considerably across schools and regions, as
described in Böckerman et al. (2009, p. 674–675); see also Figure 2 below. Seven new
temporary licences were granted during the 1990s. The first graduates from the new
polytechnics entered the labour market in 1994. The experimental phase was judged to
be successful and since 1996 the temporary polytechnics have gradually become
permanent. Currently there are 27 multidisciplinary polytechnics. Unlike the university
sector, the network of polytechnics covers the whole country.
The supply of education is controlled by the Ministry of Education through its decisions
on the number of study places and the funding of schools. In the 1990s the number of
polytechnic study places increased very rapidly and the number of vocational college
study places decreased, respectively (Figure 1). By 1996 the number of new polytechnic
3 The Finnish university sector consists of 20 universities and art academies, all of which carry out research and provide degrees up to doctorates. For further details on the university sector, see e.g., Ministry of Education (2005). 4 The reform changed the curriculum to a different extent in different fields (Böckerman et al. 2009, p. 675). The changes were relatively minor in engineering and nursing education but substantial in business education. The average length of the studies in business education increased from two years to three and a half years.

5
students exceeded the number of new university students, and by the end of the 1990s
hardly any new vocational college places were made available.5
--- Insert Figure 1 here ---
Figure 2 reveals the significant regional differences in the availability of polytechnic
(higher) education and the changes in it during the 1990s. Since the availability has
been relatively constant thereafter, the following analysis of the reform focuses on the
1990s and early 2000s.
--- Insert Figure 2 here ---
The main aim of the reform was to respond to new demands for vocational skills that
were seen to arise in the local labour markets. Furthermore, the geographically broad
network of higher education was regarded as a mean to equalize regional development,
for example, by reducing the brain drain from the less developed regions to the
metropolitan areas and therefore to lessen the concentration of the workforce to the
central regions. However, the regional disparities in economic growth and
unemployment rates have increased considerably in Finland since the depression of the
early 1990s; see e.g., Kangasharju and Pekkala (2004) and Tervo (2005). Today, there
are pressures to concentrate higher education and research into fewer units, which
probably implies that there will be a decline in the number of universities and
polytechnics in the future, particularly in the peripheral regions.
The polytechnic reform has previously been evaluated by comparing the employment
and earnings of graduates from the polytechnics with those who had obtained vocational
college degrees in the pre-reform system. Hämäläinen and Uusitalo (2008) find that the
relative earnings of vocational college graduates decrease in the field of business and
5 The number of applications to universities and to the most popular polytechnics exceeds the number of

6
administration after polytechnic graduates start to enter the labour market, which is
inconsistent with the pure human capital model and can be interpreted as evidence that
supports the signalling model of education.6 Böckerman et al. (2009) conclude that the
reform had considerable positive effects on the earnings and employment levels for
graduates in business and administration but no significant effects in other fields. To the
best of our knowledge, no study has, however, examined the regional aspects of the
reform. Hence, it is not known how the polytechnic education reform affected
interregional migration streams even though these concerns have frequently been raised
in policy debates.
3 Why should the polytechnic reform affect migration?
We are interested in the ways in which the polytechnic reform affected the migration of
recent high school graduates. In the following theoretical discussion, we will consider
the possibility that this school reform affected migration not only directly but also
indirectly through the changes in the level of education.
To begin with, the reform may have increased the propensity to move directly because
fewer high school graduates were able to access education in their home municipality
after vocational schools were gradually converted into bigger polytechnic units. That is,
it is possible that people who would have otherwise attended a local vocational school
will now have to move to another town in order to attend a polytechnic. In addition, the
incentives for school-to-school moving may have increased because (free) higher
education has become more widely available.
available starting places by a factor of four. 6 Their preferred estimates show that 29 per cent of the increase in the earnings of polytechnic graduates is due to an increase in human capital and the remaining 71 per cent because of the signalling value (Hämäläinen and Uusitalo 2008, p. 773).

7
Yet it is known that the reform expanded higher education, especially to regions that did
not have a university, which may have reduced the need of some high school graduates
to move in order to obtain higher education. However, regardless of the reform, the
poorer educational opportunities in the peripheral regions may have induced migration
to the central areas, where most institutions of higher education are located. Hence, in
the empirical analysis, it is important to control for the regional differences in the
educational and economic opportunities.
If the reform affected the school-to-school migration, it is likely that it also had an
impact on the school-to-work migration, because those who have moved in the past are
more likely to move again (see, e.g., DaVanzo 1983; Haapanen and Tervo 2012). This
pattern would be consistent with the “hobo syndrome” reported by Munasinghe and
Sigman (2004).
In the long run, the polytechnic reform may also operate indirectly through the changes
in the level of education. If the reform generally increased young adults’ level of
education, this increase may in turn make them more likely to move. Note that if all the
vocational colleges were simply relabelled as polytechnics, then this indirect,
educational effect should be zero but the overall effect of the reform on migration could
still be non-zero. Extensive prior analyses suggest that the propensity to move increases
with the level of education (e.g., Jaeger et al. 2010; Faggian et al. 2007; Tunali 2000).7
However, only recently have policy reforms provided evidence in support of the
positive causal relationship; see Hickman (2009), Machin et al. (2012), and Malamud
and Wozniak (2012).
7 See also the reviews by Greenwood (1975, 1997). Finnish migration has been studied recently by Ritsilä and Ovaskainen (2001), Pekkala and Tervo (2002), Ritsilä and Haapanen (2003), Hämäläinen and Böckerman (2004), Nivalainen (2004), Haapanen and Ritsilä (2007), Jauhiainen (2008) and Haapanen and Tervo (2012). However, none of these studies has used education reforms to examine migration patterns.
8
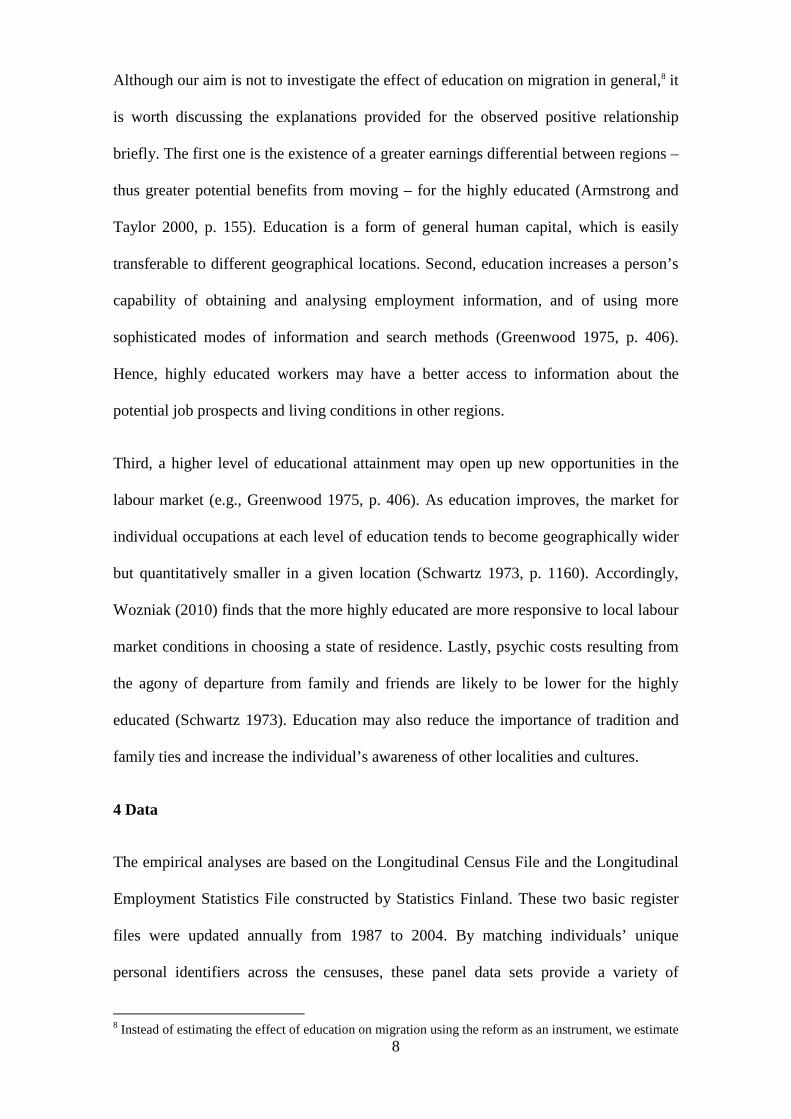
Although our aim is not to investigate the effect of education on migration in general,8 it
is worth discussing the explanations provided for the observed positive relationship
briefly. The first one is the existence of a greater earnings differential between regions –
thus greater potential benefits from moving – for the highly educated (Armstrong and
Taylor 2000, p. 155). Education is a form of general human capital, which is easily
transferable to different geographical locations. Second, education increases a person’s
capability of obtaining and analysing employment information, and of using more
sophisticated modes of information and search methods (Greenwood 1975, p. 406).
Hence, highly educated workers may have a better access to information about the
potential job prospects and living conditions in other regions.
Third, a higher level of educational attainment may open up new opportunities in the
labour market (e.g., Greenwood 1975, p. 406). As education improves, the market for
individual occupations at each level of education tends to become geographically wider
but quantitatively smaller in a given location (Schwartz 1973, p. 1160). Accordingly,
Wozniak (2010) finds that the more highly educated are more responsive to local labour
market conditions in choosing a state of residence. Lastly, psychic costs resulting from
the agony of departure from family and friends are likely to be lower for the highly
educated (Schwartz 1973). Education may also reduce the importance of tradition and
family ties and increase the individual’s awareness of other localities and cultures.
4 Data
The empirical analyses are based on the Longitudinal Census File and the Longitudinal
Employment Statistics File constructed by Statistics Finland. These two basic register
files were updated annually from 1987 to 2004. By matching individuals’ unique
personal identifiers across the censuses, these panel data sets provide a variety of
8 Instead of estimating the effect of education on migration using the reform as an instrument, we estimate

9
reliable register-based information on the residents of Finland. In other words, contrary
to surveys, for example, the comprehensive register-based data contain very little
measurement error; cf. also Malamud and Wozniak (2012). Furthermore, register data
on spouses and the region of residence are merged with the individual records.
The working sample comprises a seven per cent random sample of the individuals who
resided permanently in Finland in 2001.9 The sample was further restricted to the
individuals who had completed schooling at high school (general upper secondary
school).10 With few exceptions high school education is required for tertiary-level
studies. In the following analysis we focus on 18- to 21-year-old graduates11 from 1988
to 1998. During this period, the availability of higher education made its dramatic rise;
see Figures 1–2 above.
Throughout the analyses, the migration event is defined as long-distance migration
between the 18 Finnish NUTS3 regions, following, for example, Nivalainen (2004). See
the Appendix, Figure A1, for a map illustration of migration patterns using the NUTS3
regional classification.12 These migration flows allow us to examine the changes in the
geographical distribution of human capital. Focusing on migration between the NUTS3
regions is also practical, because the location of the educational institution where an
individual graduates is known at this regional level in the data. Furthermore, migration
of shorter distances between municipalities or sub-regions most likely reflects housing
market conditions rather than labour market prospects. However, we will also check the
the reduced-form specifications of the polytechnic reform on migration. 9 Those individuals living in the Åland Islands are not included in the sample. Åland is a small isolated region with approximately 26,000 inhabitants. It differs from the other Finnish regions in numerous ways (e.g., most of the inhabitants speak Swedish as their native language). 10 As in Hickman (2009) and Malamud and Wozniak (2012), but contrary to Machin et al. (2012), we focus on individuals at the upper part of the education distribution. 11 For example, in 2001, approximately 99 (83) per cent of the high school graduates were 18–21-year-olds (19-year-olds) at the end of their matriculation year. 12 The small region of Itä-Uusimaa is combined with Uusimaa in the analyses, because of their close proximity and similarity. It is also the only region that does not currently have its own polytechnic.

10
robustness of the results below to the use of NUTS3 classification instead of NUTS2 or
NUTS4.
The average propensities to move during the year of matriculation or the following two
years are illustrated in Figure 3. It shows a marked increase in the interregional
migration rates over time as the polytechnic reform was executed. The regional
differences in the migration rates are also substantial. Comparison of time trends in
Figures 2 and 3 suggests that there is a positive relationship between the regional
expansion of higher education and the interregional migration. However, to investigate
whether this relationship still holds after the potential confounding factors have been
fully controlled for, the specification of an econometric model is required.
--- Insert Figure 3 here ---
5 Empirical approach
A significant proportion of high school graduates migrate in order to receive further
education. To understand the implications of the polytechnic reform of the 1990s for
interregional migration, we model the migration propensities during the year of
matriculation and the following years using probit models. Therefore, we assume that
migration propensity is determined according to a latent variable ∗ijytM :
,0 if ,0 and ;0 if ,1
),0N(~, 2
≤=>=
+++++=∗∗
∗
ijytijytijytijyt
ijytijyttyjijyjyijyt
MMMM
XZM σεετλγβα (1)
where ijytM is a dummy variable indicating whether an individual i matriculated in
region j in year y migrates ( ∗M > 0) or not ( ≤∗M 0) t years after matriculation. ijytM
refers to long-distance migration across NUTS3 regions between two consecutive years

11
(t and t–1).13 First we estimate school-to-school migration propensities for the year of
matriculation and the following two years (t = 0, 1, 2), and then we extend the follow-up
period, which also allows us to investigate the changes in school-to-work migration. To
understand the effects of the reform on the regional distribution of labour more
completely, we will later redefine ijytM as residence outside the matriculation region j
in year t.
The explanatory variable of interest, jyZ , measures the supply of polytechnic education
for an individual i when graduating from high school. The supply is measured as the
number of new polytechnic study places in the region of residence in the year of
matriculation. Note that the reform may have also attracted persons other than the
recently matriculated individuals to enter higher education (i.e. polytechnics). To
control for this, we have later defined the supply of polytechnic education not only
during the year of matriculation but also over a longer three-year period; see the
robustness checks below.
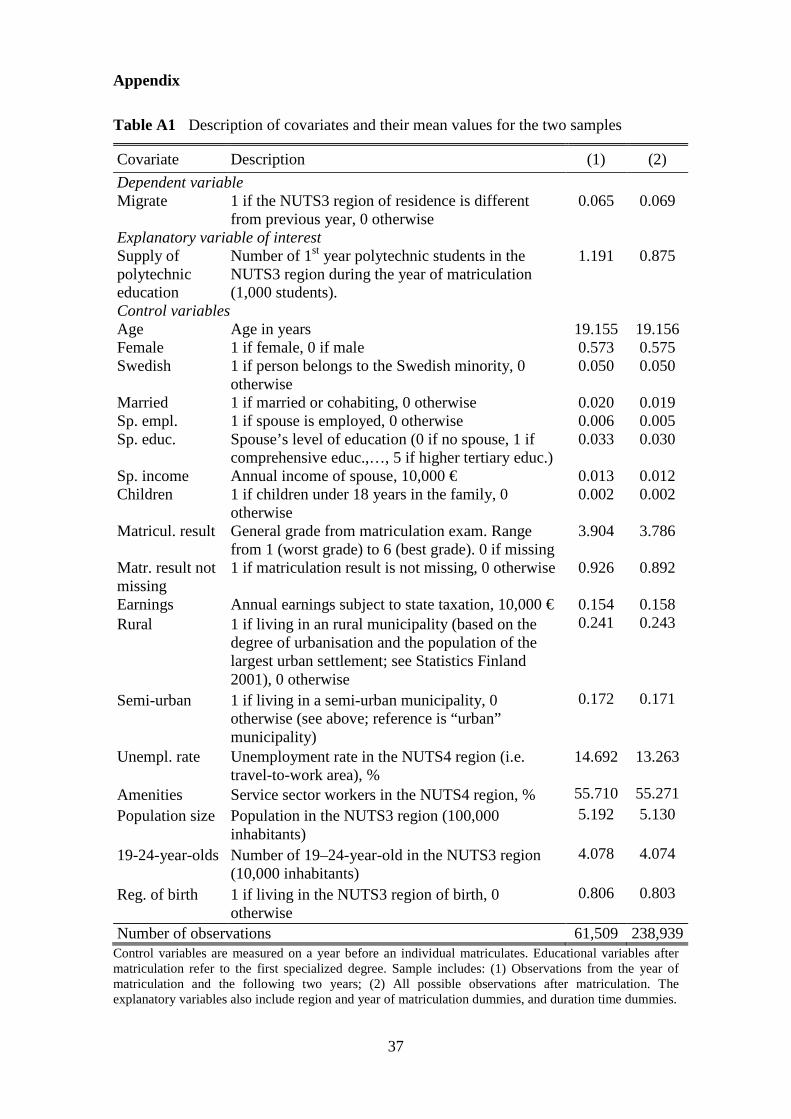
All the control variables, ijyX , are measured in the year before an individual
matriculates from high school, so that the consequences of migration are not confused
with the causes of migration. This decision also ensures that the supply of polytechnic
education does not affect the (future) values of the control variables and hence bias the
results.
Following, for example, Nivalainen (2004) and Haapanen and Tervo (2012), we use the
standard set of covariates. Concerning personal characteristics, we control for gender,
age and annual earnings subject to state taxation. Household characteristics14 comprise
marital status, having children, and a spouse’s labour income, employment status and
13 We observe an individual’s location at the end of each year. 14 See Tenn (2010) and Rabe (2011) for recent evidence on the migration decisions of families.
12
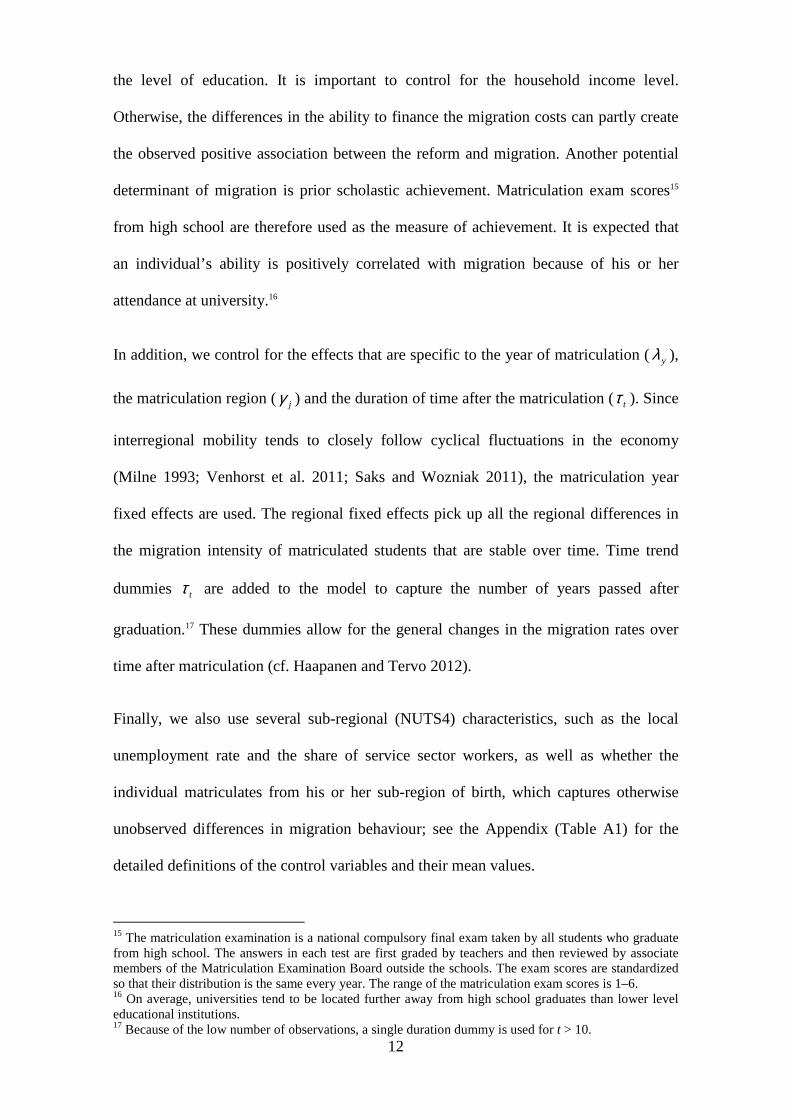
the level of education. It is important to control for the household income level.
Otherwise, the differences in the ability to finance the migration costs can partly create
the observed positive association between the reform and migration. Another potential
determinant of migration is prior scholastic achievement. Matriculation exam scores15
from high school are therefore used as the measure of achievement. It is expected that
an individual’s ability is positively correlated with migration because of his or her
attendance at university.16
In addition, we control for the effects that are specific to the year of matriculation (yλ ),
the matriculation region (jγ ) and the duration of time after the matriculation ( tτ ). Since
interregional mobility tends to closely follow cyclical fluctuations in the economy
(Milne 1993; Venhorst et al. 2011; Saks and Wozniak 2011), the matriculation year
fixed effects are used. The regional fixed effects pick up all the regional differences in
the migration intensity of matriculated students that are stable over time. Time trend
dummies tτ are added to the model to capture the number of years passed after
graduation.17 These dummies allow for the general changes in the migration rates over
time after matriculation (cf. Haapanen and Tervo 2012).
Finally, we also use several sub-regional (NUTS4) characteristics, such as the local
unemployment rate and the share of service sector workers, as well as whether the
individual matriculates from his or her sub-region of birth, which captures otherwise
unobserved differences in migration behaviour; see the Appendix (Table A1) for the
detailed definitions of the control variables and their mean values.
15 The matriculation examination is a national compulsory final exam taken by all students who graduate from high school. The answers in each test are first graded by teachers and then reviewed by associate members of the Matriculation Examination Board outside the schools. The exam scores are standardized so that their distribution is the same every year. The range of the matriculation exam scores is 1–6. 16 On average, universities tend to be located further away from high school graduates than lower level educational institutions. 17 Because of the low number of observations, a single duration dummy is used for t > 10.

13
The identification strategy is based on the assumption about the exogeneity of the
polytechnic reform. Consequently, we assume that the supply of polytechnic starting
places is exogenously determined after controlling for other factors potentially
influencing migration decisions. For the correct identification of the effect of the reform
it is, however, not necessary for the supply to be independent of the fixed regional
characteristics or those related to the year of matriculation, since we control for such
factors with two sets of fixed dummies. Still, some time-varying regional characteristics
could be related to the changes in the regional expansion of polytechnics over time. If
such characteristics also influence migration decisions, their exclusion could violate the
exogeneity assumption. Thus, following, for example, Black et al. (2005) and Machin et
al. (2012), we assess what factors, if any, predict the expansion of polytechnics across
regions and over time.
Table 1 reports the results from linear panel regressions of the supply of polytechnic
starting places on other regional characteristics. In the first column we regress the
polytechnic starting places on regional value added, its growth rate, unemployment rate,
total population, population aged 19–24-years, and a dummy variable indicating
whether the region has a university. In the second column we add the year dummies to
the model and in the third column we also add the full set of fixed effects for the
NUTS3 regions (but exclude the university dummy because it does not change over
time within regions).18
--- Insert Table 1 here ---
The results show that after controlling for the fixed time and regional effects, only
population size is a statistically significant determinant (Column 3 of Table 1). Other
factors play little role. Thus, the number of polytechnic starting places positively

14
correlates only with the size of the region after controlling for other regional factors. To
rule out the possibility that the omission of the population size would bias the estimates,
we have added it to the set of regional controls together with the number of 19 to 24-
year-olds in the NUTS3 region that captures the differences in the regional demand for
polytechnic education.
6 Results
6.1 Baseline estimates
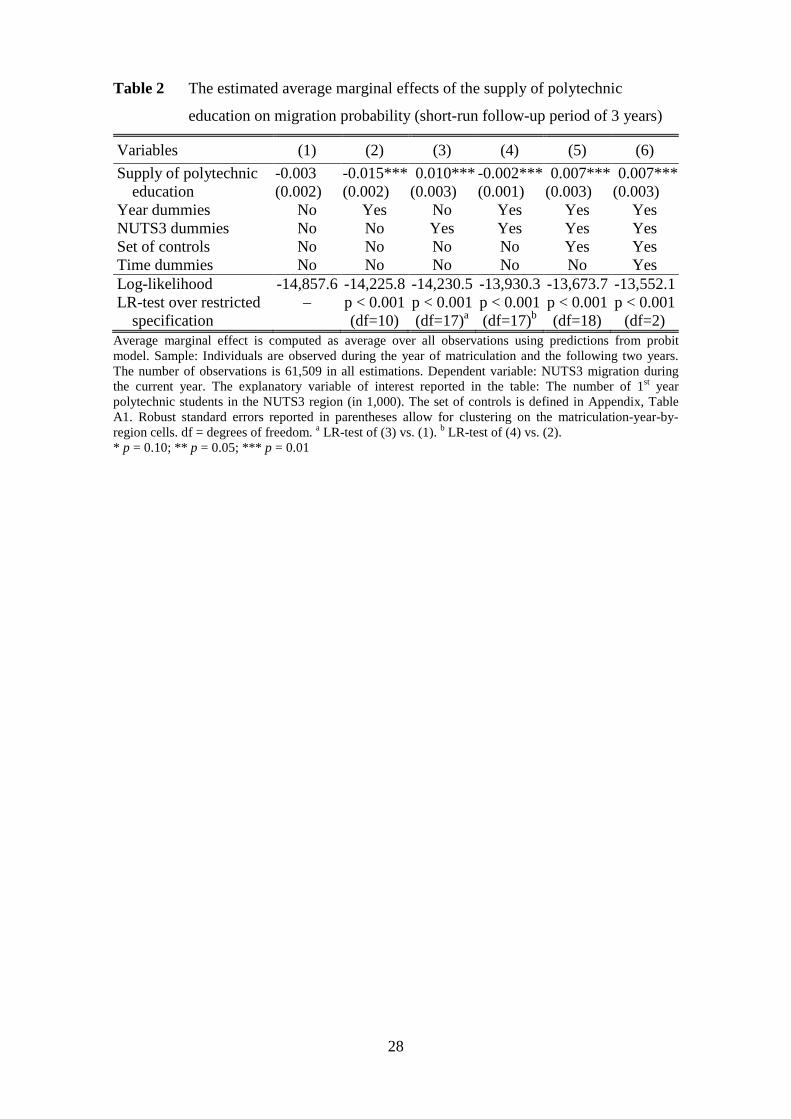
To begin with the short-run effects, Table 2 reports the estimated average marginal
effects19 of the supply of polytechnic education on the migration probability during the
year of matriculation and the following two years. The first column gives the estimation
results of a simple bivariate model that do not control for any covariates. The
insignificant, small negative estimate reported from the probit model is unlikely to
provide a reliable causal estimate. A reliable estimate is obtained after other relevant
covariates are controlled for. The addition of year, regional and time dummies as well as
the extended set of controls is supported by the likelihood ratio tests. As suggested by
Figure 3 above, the marginal effect from the preferred specification reported in Column
6 shows that the migration probability is, on average, influenced by the regional supply
of polytechnic education during matriculation. The average marginal effect is positive
and significant: 0.7 percentage points per 1,000 study places in the region.
--- Insert Table 2 here ---
To explore the long-run effects of the polytechnic reform on the migration probability
of the matriculated students, we then proceed to study the effect over a longer
18 The university sector remained unchanged during the polytechnic education reform. Therefore, new universities were not created during the period of analysis.

15
observation period. Since the last year in the data is 2004, we are able to follow those
individuals who matriculated, for example, in 1998 and 1988 for 7 and 17 years
respectively (on average 11.7 years). Again, the supply of polytechnic education is
measured during the year of matriculation. The results from the six specifications (1–6)
reported in Table 3 correspond to those in Table 2. The preferred specification (6)
points out that the effect of the polytechnic reform on migration is smaller, and
insignificant, in the long run after controlling for the relevant covariates.
--- Insert Table 3 here ---
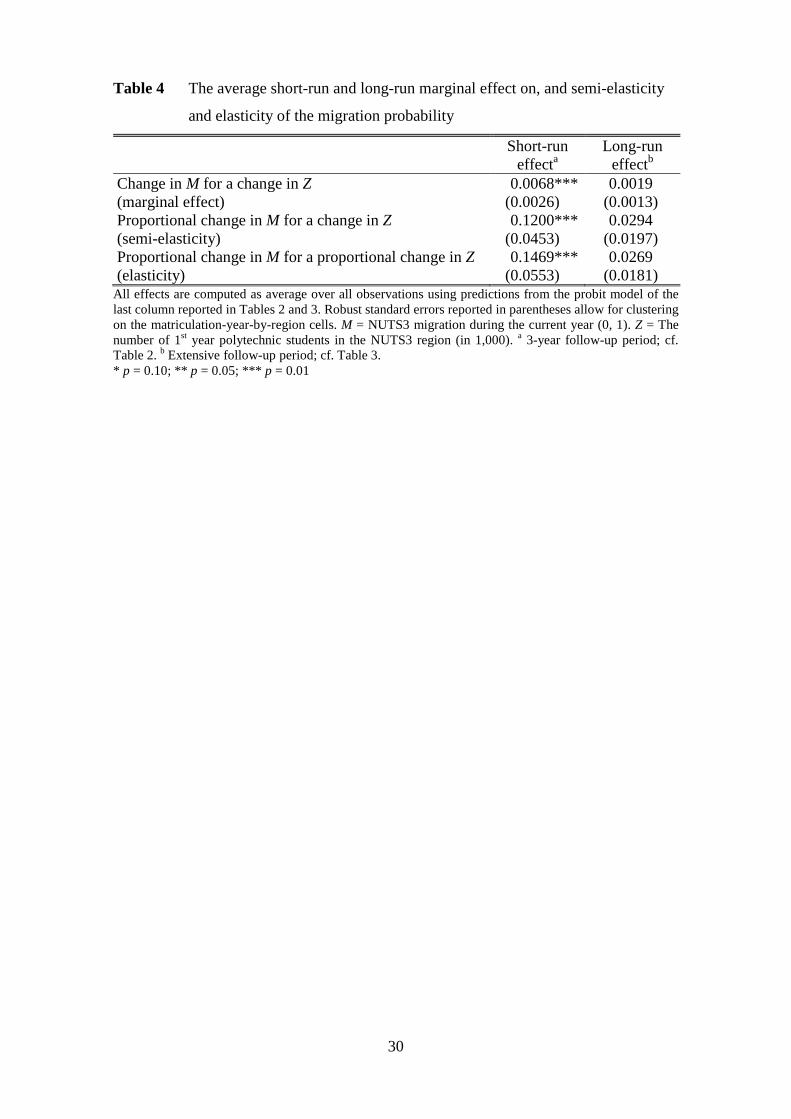
To better illustrate the quantitative magnitude of increase in the supply of polytechnic
education, we have also computed the short-run and long-run elasticities (Table 4).
First, it is useful to note that the regional average of the polytechnic study places has
grown from zero to roughly 1,800 between 1990 and the early 2000s. Hence, the short-
run marginal effect (0.0068) implies that an increase of 1,800 on polytechnic places has
enhanced the annual migration rate in the Finnish regions by 1.2 percentage points. This
represents a substantial increase, because the baseline migration rate is 3.7 per cent for
those who matriculated in 1988. Second, the estimated semi-elasticity implies that a
1,000 unit increase on new polytechnic places in the region has resulted in a 12 per cent
increase in the migration rate. Finally, the short-run elasticity of migration with respect
to the increase in new polytechnic places is estimated at 0.147. These short-run effects
are significantly different from zero, whereas the long-run elasticities are all
insignificant.
--- Insert Table 4 here ---
19 The average marginal effects were computed as averages over all observations, as discussed in Cameron and Trivedi (2005, p. 467).

16
6.2 Sensitivity of the baseline results
To study the robustness of the baseline results reported in Column 6 of Tables 2–3, we
have estimated several additional model specifications (Table 5). In Panels A–B we
have experimented with changes to the calculation of standard errors. In Panel A robust
standard errors are used instead of clustering on the matriculation-year-by-region cells
as in the baseline. In Panel B two-way cluster-robust standard errors (Cameron et al.
2011) are applied that uses clustering both on the year of matriculation and NUTS3
region.20 The statistical significance of the short-run effect drops slightly from 5 to 10
per cent when two-way clustering is used instead of the baseline specification or robust
standard errors. The long-run estimates remain insignificant in all three cases.
--- Insert Table 5 here ---
There is some concern that the decision to close a vocational college rather than
merge/expand it into a polytechnic is not random. In Table 1 we found support for the
exogeneity of the reform. To further alleviate this concern, we take additional steps. We
have first estimated Equation 1 including only those regions in which the physical
location of polytechnic/vocational education did not change (Panel C). The idea of this
specification is to isolate the effect of pure expansion of post-secondary higher
education on migration flows. To accomplish this, we selected only those five NUTS3
regions in which none of its municipalities lost an educational institution during the
reform. By losing we mean that a municipality had a vocational college before the
reform but it did not have a (unit of) polytechnic after the reform. (These municipalities
had a small number of study places.) Now both the short- and long-run effects are
insignificant. But restricting estimation only to these regions does not necessarily imply

17
that starting places were not redistributed between NUTS3 regions, even though the
physical locations of the schools remained unchanged. For this reason, in Panel D we
only select those nine NUTS3 regions in which the percentage change in the number of
study places was smaller than the median change in 1991–2000. That is to say, we
compared the vocational starting places before the reform and the polytechnic starting
places after the reform. Now both the short- and long-term effects are significant and
larger than in the baseline.
Next, the robustness check in Panel E investigates whether the results are dependent on
the inclusion of region-specific time trends. Thus, we have estimated Equation 1
including a full set of region-specific time trends in addition to the fixed effects for the
year of matriculation and region. Reassuringly, the addition of the NUTS3-specific time
trends does not alter the results for the effects of the reform on migration flows in either
case, and thus gives additional support for the exogeneity of the reform and further
lessens the concern about potential omitted variable bias affecting the baseline
estimates.
To allow for spatial correlation in Z, we have constructed an additional control that
measures the number of new polytechnic places in the neighbouring regions (Panel F);
cf. Oakes (2004, p. 1935). The findings remain intact. In both the short-run and long-run
cases the neighbouring effect is estimated to be insignificant.
In Panels G–H the regional supply of polytechnic education is measured as a three-year
average rather than during the year of matriculation. The motivation for this
specification is that not all individuals make their schooling and migration decisions
immediately after matriculation, because of the limited number of study places, a
20 But the two-way clustering of standard errors is best suited for settings in which both clustering variables have a large number of clusters (Cameron et al. 2011). In our application, there are only 11 annual observations (and 18 NUTS3 regions). For this reason, the baseline estimates are reported with

18
voluntary decision to take a year off from school or enrolment in military service. In
Panel G, the supply is measured in the current region of residence and in Panel H in the
region of matriculation. In both of these cases the long-run effect is insignificant, which
suggests that the effect does not depend on whether the supply is measured only during
the year of matriculation or also two years after. However, in Panel G the short-run
effect roughly doubles and is significant, indicating that the effect of the reform could
be higher than the one reported in Table 2. This having been said, this measure can also
reflect reverse causality: the matriculated students move to the regions with a high
number of starting places. The small, insignificant short-run effect reported in Panel H
supports this conclusion.
Furthermore, we have made several changes to the estimation sample. In Panel I the
sample also covers the matriculated students from 1999–2001. This extension increases
the number of observations. As a result, the estimated standard errors are slightly
smaller, but the quantitative magnitude of the effects does not change. In Panel J the
sample is limited to the matriculated students from 1991–1998 only. This is the time
period during which the transformation of the system and the rapid increase in the
number of polytechnic graduates took place (see Figure 2). Thus, the time period is
crucial for the identification of the effects of the reform. The short-run effect remains
unchanged in this specification, but now the long-run effect (0.003) is estimated with
much greater precision and is also significant at the five per cent level.21 In Panel K the
long-run analysis is restricted to observations with the number of observations for each
individual (that is, t < 7). The results correspond to those in Panel J: the long-run
marginal effect (0.0031) is significant at the 10 per cent level. This marginal effect
implies that the reform enhanced the annual migration rate of high school graduates by
one-way robust standard errors clustered on matriculation-year-by-region cells. 21 Note that the larger estimate also reflects the fact that in Panel J (and K) the matriculated are, on average, followed over a shorter period of time than in the baseline estimate above.

19
0.6 percentage points over the seven-year follow-up period. In sum, the polytechnic
reform has a positive, but smaller, effect on migration in the long run than in the short
run.
Finally, we have altered the definition of migration to allow for better international
comparison. When we consider shorter-distance migration between 79 NUTS4 sub-
regions, instead of NUTS3 regions, the effect of the polytechnic reform is estimated to
be at almost the same size as previously, but now the estimate is less precise (Panel L).
When we consider longer-distance migration between the four NUTS2 regions,22 the
short-run effect of the polytechnic reform is again estimated larger than the long-run
effect, but it is insignificant (Panel M). This finding is consistent with the fact that the
reform was carried out largely locally.
6.3 Heterogeneity of the effects
Next we examine whether the effect of new polytechnic places is heterogenous with
respect to the duration of time and the region of matriculation. For brevity, the results of
the specification tests are reported in Table 6, but the detailed estimation results are only
available upon request. In Panel A we check to see whether the effect of the reform is
constant over duration of time after matriculation. Consistent with the short-run and
long-run results above (Tables 3–5), the estimates do point to significant heterogeneity
in this respect. The marginal effect of the reform on migration is largest close to
matriculation and becomes smaller as time passes.
As regards the spatial differences, Panel B implies that there are no significant
differences in the size of the effect between the university and non-university regions. In
22 In terms of land area, the Finnish NUTS2 regions are larger compared to the EU average and smaller compared to the US states: the Finnish average is 60,895 km2, the EU average is 15,869 km2, and the US state average is 183,637 km2. In 2010, population density was 18 inhabitants per km2 in Finland, 117 in the EU and 35 in the US. Sources: Eurostat (2007, 2011), US Census Bureau (2012).

20
Panel C the effect of the reform is allowed to vary across regions more freely. We find
that the estimates do not, overall, show significant regional differences in the effect.
However, a closer look at the estimated regional parameters reveals that in the short run
(school-to-school) migration has increased particularly for the matriculated individuals
from the regions of Oulu and Kainuu. The estimates for Turku and Helsinki are also
significant and positive. The long-run estimates show that migration rates have
increased for those who have matriculated from the Helsinki metropolitan area and
decreased particularly for those who have matriculated from the regions of Etelä-
Pohjanmaa and Joensuu (i.e. Pohjois-Karjala); see Appendix, Figure A2 for a map
illustration.
--- Insert Table 6 here ---
6.4 Effect on residing in the region of matriculation
So far we have considered the effect of the polytechnic reform on the migration
propensity in the short run and long run. Thus, the emphasis has been particularly on the
intensity of migration. To understand the effects of the reform on the regional
distribution of labour better, it is important to acknowledge that a significant proportion
of the school-to-school migrants may return to their region of origin after graduation
from specialized education. Therefore, we will next consider the extent to which the
reform affected the propensity of residing in the region of matriculation. The analysis is
parallel to the baseline probit models used earlier (see e.g., Columns 6 in Tables 2 and
3), but now the dependent variable is redefined as a dummy indicating whether an
individual resides in the region of matriculation. That is, the estimation samples and the
control variables also remain unchanged.
Table 7 reports the short-run and long-run average marginal effect of the reform on the
propensity to reside in the region of matriculation (Model 1). Both marginal effects are

21
now significant at the 5 percent level and they are larger than the estimated effects on
migration intensity. Namely, an increase in polytechnic starting places by 1,000 in the
region has, on average, decreased the propensity to reside in the region of matriculation
by 1.0 and 1.4 percentage points in the short run and in the long run, respectively. The
significant negative marginal effects suggest that the reform has resulted in a spatial
redistribution of labour.
--- Insert Table 7 here ---
One goal of the reform was to improve the supply of highly educated labour in the non-
university regions. To investigate whether this goal was reached, in Model 2 we have
interacted the supply of polytechnic education with information on whether or not the
matriculation has occurred in a university or non-university region. Although the
differences are not significant, the results suggest that the reform may have increased
the out-migration of individuals from the non-university regions. Figure A3 in the
Appendix shows that the out-migration has been particularly intense in the regions of
Kainuu and Keski-Pohjanmaa that do not have a university.
7 Conclusions
In this paper, we explored the effect of the polytechnic education reform on the
migration of graduated high school students in the Finnish context. The reform
gradually transformed former vocational colleges into polytechnics offering a
Bachelor’s degree and expanded the supply of higher education to all regions. Our
analyses confirm that the reform provides relevant exogenous variation in the regional
supply of education. The reform raises mobility across local labour markets in the years
after completion of secondary studies, indicating increased mobility between high
school and post-secondary education. We estimate that the reform enhanced the annual
migration rate of high school graduates by 1.2 percentage points over a three-year

22
follow-up period. This represents a substantial increase, because their baseline
migration rate is 3.7 per cent. The effect fades several years after the completion of
secondary studies. For example, the corresponding effect for the seven-year follow-up
period is 0.6 percentage points. The study made no attempt to distinguish whether the
effects of the reform on migration were due to extension in the length or improvement
in the quality of education.
One important reason for the creation of the polytechnic schools was to decrease the
brain drain from the less developed regions to the metropolitan areas. The results
suggest that this policy aim has not been fulfilled. However, the increased migration
rates caused by the reform may have improved the allocation of labour across regions.
Thus, the positive effects of the reform on employment and earnings, reported in
Böckerman et al. (2009), may have resulted partly from an increase in migration
intensity. In this paper, we estimated reduced-form specifications for the effect of the
policy reform. In future research the polytechnic reform could be used to estimate the
effect of education on migration using the reform as an instrument.
Acknowledgements
We would like to thank an anonymous referee, Thomas Crossley, Tomi Kyyrä, Olli
Ropponen and seminar participants at the EALE 2011 Congress in Cyprus, the ERSA
2010 Congress in Jönköping, the Annual Meeting of the Finnish Economic Association
in Oulu (2011) and the Economics of Education Workshop in Helsinki (2012) for very
useful comments. Haapanen also gratefully acknowledges financial support from the
Yrjö Jahnsson Foundation for a visit to the University of Cambridge, the Faculty of
Economics, in the academic year 2009–2010 (project No. 6039). This study also forms
part of a project supported by the Academy of Finland (project No. 127049). Paul A.
Dillingham has kindly checked the English language.

23
References
Armstrong HW, Taylor J (2000) Regional Economics and Policy, 3rd edition.
Blackwell, Oxford
Black S, Devereux P, Salvanes KG (2005) Why the apple doesn’t fall far:
Understanding intergenerational transmission of human capital. Am Econ Rev
95(1):437–449
Böckerman P, Hämäläinen U, Uusitalo R (2009) Labour market effects of the
polytechnic education reform: the Finnish experience. Econ Educ Rev 28(6):672–
681
Cameron AC, Trivedi PK (2005) Microeconometrics: Methods and Applications.
Cambridge University Press, Cambridge
Cameron AC, Gelbach JB, Miller DL (2011) Robust inference with multiway
clustering. J Bus Econ Stat 29(2):238–249
DaVanzo J (1983) Repeat migration in the United States: who moves back and who
moves on? Rev Econ Stat 65(4):552–559
Eurostat (2007) Regions in the European Union. Nomenclature of territorial units for
statistics, NUTS 2006 / EU-27, 2007 edition. European Union, Luxembourg
Eurostat (2011) Europe in figures. Eurostat yearbook 2011. Eurostat statistical books.
European Union, Luxembourg
Faggian A, McCann P, Sheppard S (2007) Human capital, higher education and
graduate migration: an analysis of Scottish and Welsh students. Urban Stud
44(13):2511–2528
Gottlieb PD, Joseph G (2006) College-to-work migration of technology graduates and
holders of doctorates within the United States. J Reg Sci 46(4):627–659
Greenwood MJ (1975) Research on internal migration in the United States: a survey. J
Econ Lit 13(2):397–433

24
Greenwood MJ (1997) Internal migration in developed countries. In: Rosenzweig MR,
Stark O (eds) Handbook of Population and Family Economics, Volume 1. Elsevier,
Amsterdam, pp 647–720
Haapanen M, Ritsilä J (2007) Can migration decisions be affected by income policy
interventions? Evidence from Finland. Reg Stud 41(3):339–348
Haapanen M, Tervo H (2012) Migration of the highly educated: Evidence from
residence spells of university graduates. J Reg Sci 52(4):587–605
Hickman DC (2009) The effects of higher education policy on the location decision of
individuals: evidence from Florida’s Bright Futures Scholarship Program. Reg Sci
Urban Econ 39(5):553–562
Hämäläinen K, Böckerman P (2004) Regional labor market dynamics, housing, and
migration. J Reg Sci 44(3):543–568
Hämäläinen U, Uusitalo R (2008) Signalling or human capital: evidence from the
Finnish polytechnic school reform. Scand J Econ 110(4):755–775
Jaeger DA, Dohmen T, Falk A, Huffman D, Sunde U, Bonin H (2010) Direct evidence
on risk attitudes and migration. Rev Econ Stat 92(3):684–689
Jauhiainen S (2008) Regional concentration of highly educated couples. In: Poot J, van
Wissen L, Waldorf B (eds) Migration and Human Capital. Edward Elgar,
Cheltenham, pp 97–110
Kangasharju A, Pekkala S (2004) Increasing regional disparities in the 1990s: the
Finnish experience. Reg Stud 38(3):255–267
Lampinen O (2004) The use of experimentation in educational reform: the case of the
Finnish polytechnic experiment 1992–1999. Tert Educ Manag 7(4):311–321
Machin S, Pelkonen P, Salvanes KG (2012) Education and mobility. J Eur Econ Assoc
10(2):417–450
25
Malamud O, Wozniak AK (2012) The impact of college education on geographic
mobility. Forthcoming in J Hum Resour.
Milne WJ (1993) Macroeconomic influences on migration. Reg Stud 27(4):365–373
Ministry of Education (2005) OECD thematic review of tertiary education: country
background report for Finland. Publications of the Ministry of Education, Finland,
2005:38
Munasinghe L, Sigman K (2004) A hobo syndrome? Mobility, wages, and job turnover.
Labour Econ 11(2):191–218
Nivalainen S (2004) Determinants of family migration: short moves vs. long moves. J
Popul Econ 17(1):157–175
Oakes JM (2004) The (mis)estimation of neighborhood effects: causal inference for a
practicable social epidemiology. Soc Sci Med 58(10):1929–1952
Pekkala S, Tervo H (2002) Unemployment and migration: does moving help? Scand J
Econ 104(4):621–639
Rabe B (2011) Dual-earner migration. Earnings gains, employment and self-selection. J
Popul Econ 24(2):477–497
Ritsilä J, Haapanen M (2003) Where do the highly educated migrate? Micro-level
evidence from Finland, Int Rev Appl Econ 17(4):437–448
Ritsilä J, Ovaskainen M (2001) Migration and regional centralization of human capital.
Appl Econ 33(3):317–325
Saks RE, Wozniak A (2011) Labor reallocation over the business cycle: new evidence
from internal migration. J Labor Econ 29(4):697–739
Schwartz A (1973) Interpreting the effect of distance on migration. J Polit Econ
81(5):1153–1569
Statistics Finland (2001) Population Census 2000 Handbook. Helsinki

26
Tenn S (2010) The relative importance of the husband’s and wife’s characteristics in
family migration, 1960–2000. J Popul Econ 23(4):1319–1337
Tervo H (2005) Regional policy lessons from Finland. In: Felsenstein D, Portnov BA
(eds) Regional Disparities in Small Countries. Springer, Heidelberg, pp 267–282
Tunali I (2000) Rationality of migration. Int Econ Rev 41(4):893–920
US Census Bureau (2012) United States’ 2010 Census,
http://2010.census.gov/2010census. Accessed 30 August 2012
Yousefi M, Rives J (1987) Migration behavior of college graduates: an empirical
analysis. J Behav Econ 16(3):35–49
Venhorst V, van Dijk J, van Wissen L (2011) An analysis of trends in spatial mobility
of Dutch graduates. Spat Econ Anal 6(1):57–82
Wozniak A (2010) Are college graduates more responsive to distant labor market
opportunities? J Hum Resour 45(4):944–970

27
TABLES
Table 1 Exogeneity of the polytechnic reform
Variables (1) (2) (3)
Value added (million euros) 0.475*** 0.428*** 0.119 (0.055) (0.045) (0.096) Growth rate of value added (%) 0.804 -10.006 -7.015 (8.888) (10.391) (6.075) Unemployment rate (%) -23.443* 22.802* -6.075 (12.849) (12.979) (33.202) Population (1,000) -12.053*** -12.265*** 43.654** (3.275) (2.864) (17.514) Population aged 19–24-years (1,000) 56.958 76.437** 78.968 (40.129) (34.365) (68.332) University region dummy 50.867 17.877 – (89.796) (78.418) Year dummies No Yes Yes NUTS3 dummies No No Yes Adjusted R-squared 0.868 0.903 0.958 LR-test over restricted specification – p < 0.001
(df = 8) p < 0.001 (df = 16)
The results from three linear regression models are reported. The number of observations is 162 in all estimations. Dependent variable: The number of 1st year polytechnic students in the NUTS3 region. All explanatory variables are from Statistics Finland, ALTIKA database on the Finnish regions. Sample consists of 18 NUTS3 regions from 1992 to 2000. Robust standard errors reported in parentheses. df = degrees of freedom. * p = 0.10; ** p = 0.05; *** p = 0.01
28
Table 2 The estimated average marginal effects of the supply of polytechnic
education on migration probability (short-run follow-up period of 3 years)
Variables (1) (2) (3) (4) (5) (6)
Supply of polytechnic education
-0.003 -0.015*** 0.010*** -0.002*** 0.007*** 0.007*** (0.002) (0.002) (0.003) (0.001) (0.003) (0.003)
Year dummies No Yes No Yes Yes Yes NUTS3 dummies No No Yes Yes Yes Yes Set of controls No No No No Yes Yes Time dummies No No No No No Yes Log-likelihood -14,857.6 -14,225.8 -14,230.5 -13,930.3 -13,673.7 -13,552.1 LR-test over restricted
specification – p < 0.001
(df=10) p < 0.001 (df=17)a
p < 0.001 (df=17)b
p < 0.001 (df=18)
p < 0.001 (df=2)
Average marginal effect is computed as average over all observations using predictions from probit model. Sample: Individuals are observed during the year of matriculation and the following two years. The number of observations is 61,509 in all estimations. Dependent variable: NUTS3 migration during the current year. The explanatory variable of interest reported in the table: The number of 1st year polytechnic students in the NUTS3 region (in 1,000). The set of controls is defined in Appendix, Table A1. Robust standard errors reported in parentheses allow for clustering on the matriculation-year-by-region cells. df = degrees of freedom. a LR-test of (3) vs. (1). b LR-test of (4) vs. (2). * p = 0.10; ** p = 0.05; *** p = 0.01

29
Table 3 The estimated average marginal effects of the supply of polytechnic
education on migration probability (long-run follow-up period)
Variables (1) (2) (3) (4) (5) (6)
Supply of polytechnic education
-0.004** -0.016*** 0.006*** -0.002*** 0.002 0.002 (0.002) (0.002) (0.002) (0.001) (0.001) (0.001)
Year dummies No Yes No Yes Yes Yes NUTS3 dummies No No Yes Yes Yes Yes Set of controls No No No No Yes Yes Time dummies No No No No No Yes Log-likelihood -60,175.7 -59,123.3 -58,246.4 -57,908.5 -57,593.9 -57,108.1 LR-test over restricted
specification – p < 0.001
(df=10) p < 0.001 (df=17)a
p < 0.001 (df=17)b
p < 0.001 (df=18)
p < 0.001 (df=11)
Average marginal effect is computed as average over all observations using predictions from probit model. Sample: Individuals are observed during the year of matriculation and all the following available years. The number of observations is 238,939 in all estimations. Dependent variable: NUTS3 migration during the current year. Average duration of follow-up period is 11.6 years. The explanatory variable of interest reported in the table: The number of 1st year polytechnic students in the NUTS3 region (in 1,000). The set of controls is defined in Appendix, Table A1. Robust standard errors reported in parentheses allow for clustering on the matriculation-year-by-region cells. df = degrees of freedom. a LR-test of (3) vs. (1). b LR-test of (4) vs. (2). * p = 0.10; ** p = 0.05; *** p = 0.01
30
Table 4 The average short-run and long-run marginal effect on, and semi-elasticity
and elasticity of the migration probability
Short-run
effecta Long-run
effectb Change in M for a change in Z 0.0068*** 0.0019 (marginal effect) (0.0026) (0.0013) Proportional change in M for a change in Z 0.1200*** 0.0294 (semi-elasticity) (0.0453) (0.0197) Proportional change in M for a proportional change in Z 0.1469*** 0.0269 (elasticity) (0.0553) (0.0181)
All effects are computed as average over all observations using predictions from the probit model of the last column reported in Tables 2 and 3. Robust standard errors reported in parentheses allow for clustering on the matriculation-year-by-region cells. M = NUTS3 migration during the current year (0, 1). Z = The number of 1st year polytechnic students in the NUTS3 region (in 1,000). a 3-year follow-up period; cf. Table 2. b Extensive follow-up period; cf. Table 3. * p = 0.10; ** p = 0.05; *** p = 0.01

31
Table 5 Robustness checks on the average marginal effect of polytechnic reform on
migration probability
Short-run
effecta Long-run
effectb Panel A: Robust standard errors 0.0068** 0.0019 (0.0029) (0.0016) Panel B: Two-way cluster-robust standard errors 0.0068* 0.0019
(0.0039) (0.0012) Panel C: Limiting sample to regions with no change in
physical location of educationc -0.0075 -0.0081 (0.0103) (0.0060)
Panel D: Limiting sample to regions with small percentage change in study placesd
0.0102*** 0.0037*** (0.0025) (0.0015)
Panel E: Using NUTS3 time trends as additional controlse 0.0066*** 0.0017 (0.0026) (0.0013)
Panel F: Using supply of polytechnic education in the neighbouring regions as an additional controlf
0.0062** 0.0018 (0.0026) (0.0013)
Panel G: Three-year supply of polytechnic education in the region of residenceg
0.0159*** 0.0024 (0.0059) (0.0036)
Panel H: Three-year supply of polytechnic education in the region of matriculationg
0.0024 0.0004 (0.0034) (0.0019)
Panel I: Extending the sample to the matriculated from 1988–2001
0.0068*** 0.0019 (0.0026) (0.0013)
Panel J: Limiting the sample to the matriculated from 1991–1998 only
0.0075** 0.0029** (0.0030) (0.0013)
Panel K: Seven-year follow-up period only (same for all observations)
– 0.0031* (0.0017)
Panel L: Using NUTS4 (shorter-distance) migration as the dependent variableh
0.0064* 0.0018 (0.0034) (0.0016)
Panel M: Using NUTS2 (longer-distance) migration as the dependent variableh
0.0044 0.0021* (0.0028) (0.0011)
Average marginal effect of the polytechnic reform on migration from probit model is reported. Same controls are used as in the last specification of Tables 2 and 3. In Panels A–F and I–M, the absolute number of polytechnic study places in the region where individual matriculates (in 1,000, measured during the year of matriculation) are used. Robust standard errors reported in parentheses allow for clustering on the matriculation-year-by-region cells are reported in Panels C–M. a 3-year follow-up period; cf. Table 2. b Extensive follow-up period; cf. Table 3. c Limiting to only NUTS3 regions, in which none of its municipalities lost an education institution during the reform. d Limiting to those regions in which the change in the vocational and polytechnic starting places over the period 1991–2000 was smaller than the median change (8%). e Interacting the region and time dummies. f LR-test indicates insignificance of the neighbouring effect in both cases. g The regional supply of polytechnic education is measured as a three-year average rather than during the year of matriculation. h There are 4 NUTS2 and 79 NUTS4 regions in the mainland Finland. * p = 0.10; ** p = 0.05; *** p = 0.01

32
Table 6 Testing the heterogeneity of the effects of polytechnic reform on migration
LR-test of no heterogeneity in Short-run estimates
Long-run estimates
Panel A: Time trend p = 0.030 p < 0.001 (df = 2) (df = 10) Panel B: University region p = 0.461 p = 0.556
(df = 1) (df = 1) Panel C: NUTS3 regions p = 0.408 p = 0.193
(df = 17) (df = 17) LR-tests of the joint significance of the interaction terms are reported (p-values). Same controls are used as in the last specification of Tables 2 and 3. See also notes to Table 5.

33
Table 7 The average marginal effect of polytechnic reform on the probability to
reside in the region of matriculation
Short-run
effect Long-run
effect Model 1: Supply of polytechnic educationa -0.0099** -0.0142** (0.0039) (0.0056) Model 2: Supply of polytechnic education × matriculated from a
university regionb -0.0092** -0.0126** (0.0038) (0.0063)
Supply of polytechnic education × matriculated from a non-university regionb
-0.0130* -0.0196** (0.0079) (0.0086)
Average propensity to reside in the region of matriculation
0.8969 0.7326
Average marginal effects from two probit models are reported. Dependent variable: Resides in the region of matriculation. Same controls are used as in the last specification of Tables 2 and 3. a The explanatory variable of interest: the number of 1st year polytechnic students in the NUTS3 region (in 1,000). In Model 2, this variable has been interacted with dummies indicating whether or not an individual matriculated from a university region. b The difference is neither statistically significant in the short run nor in the long run. See also notes to Table 5. * p = 0.10; ** p = 0.05; *** p = 0.01

34
FIGURES
010
000
2000
03
0000
4000
0N
umbe
r of
1st
-yea
r st
ude
nts
1990 1992 1994 1996 1998 2000 2002 2004 2006 2008
Vocational colleges Polytechnics Universities
Fig. 1 New vocational college, polytechnic and university students in Finland 1990–
2008
Source: AMKOTA and KOTA databases, and Statistics Finland, Education Statistics

35
05
1015
20S
tude
nts
per
hund
reds
of 1
9-24
-yea
r-ol
ds
1992 1994 1996 1998 2000 2002 2004 2006 2008
Fig. 2 First-year polytechnic students per 19–24-year-olds in 1992–2008 (lines
represent NUTS3 regions)
Source: AMKOTA database and Statistics Finland, Population Statistics

36
0.0
5.1
.15
.2A
vera
ge m
igra
tion
rate
1988 1990 1992 1994 1996 1998
Fig. 3 Average annual rate of migration during the year of matriculation and the
following two years (lines denote NUTS3 regions); matriculated in 1988–1998; cf.
Appendix, Figure A1
Source: Own sample data
37
Appendix
Table A1 Description of covariates and their mean values for the two samples
Covariate Description (1) (2)
Dependent variable Migrate 1 if the NUTS3 region of residence is different
from previous year, 0 otherwise 0.065 0.069
Explanatory variable of interest Supply of polytechnic education
Number of 1st year polytechnic students in the NUTS3 region during the year of matriculation (1,000 students).
1.191
0.875
Control variables Age Age in years 19.155 19.156 Female 1 if female, 0 if male 0.573 0.575 Swedish 1 if person belongs to the Swedish minority, 0
otherwise 0.050 0.050
Married 1 if married or cohabiting, 0 otherwise 0.020 0.019 Sp. empl. 1 if spouse is employed, 0 otherwise 0.006 0.005 Sp. educ. Spouse’s level of education (0 if no spouse, 1 if
comprehensive educ.,…, 5 if higher tertiary educ.) 0.033 0.030
Sp. income Annual income of spouse, 10,000 € 0.013 0.012 Children 1 if children under 18 years in the family, 0
otherwise 0.002 0.002
Matricul. result General grade from matriculation exam. Range from 1 (worst grade) to 6 (best grade). 0 if missing
3.904 3.786
Matr. result not missing
1 if matriculation result is not missing, 0 otherwise 0.926 0.892
Earnings Annual earnings subject to state taxation, 10,000 € 0.154 0.158 Rural 1 if living in an rural municipality (based on the
degree of urbanisation and the population of the largest urban settlement; see Statistics Finland 2001), 0 otherwise
0.241 0.243
Semi-urban 1 if living in a semi-urban municipality, 0 otherwise (see above; reference is “urban” municipality)
0.172 0.171
Unempl. rate Unemployment rate in the NUTS4 region (i.e. travel-to-work area), %
14.692 13.263
Amenities Service sector workers in the NUTS4 region, % 55.710 55.271
Population size Population in the NUTS3 region (100,000 inhabitants)
5.192 5.130
19-24-year-olds Number of 19–24-year-old in the NUTS3 region (10,000 inhabitants)
4.078 4.074
Reg. of birth 1 if living in the NUTS3 region of birth, 0 otherwise
0.806 0.803
Number of observations 61,509 238,939 Control variables are measured on a year before an individual matriculates. Educational variables after matriculation refer to the first specialized degree. Sample includes: (1) Observations from the year of matriculation and the following two years; (2) All possible observations after matriculation. The explanatory variables also include region and year of matriculation dummies, and duration time dummies.

38
Vaasa
.
.
Rovaniemi.
Helsinki
Turku
Oulu.
Jyväskylä.Kuopio. Joensuu.
Tampere. .Lappeenranta
Kainuu
Etelä-Savo
Kanta-Häme
Itä-Uusimaa
Päijät-
Häme
.
Etelä-
Pohjanmaa
Sata-kunta
Keski-
Pohjanmaa
Kymenlaakso
Migration rate
0.41 to 0.50.32 to 0.410.24 to 0.320.07 to 0.24
Vaasa
.
.
Rovaniemi.
Helsinki
Turku
Oulu.
Jyväskylä.Kuopio. Joensuu.
Tampere. .Lappeenranta
Kainuu
Etelä-Savo
Kanta-
Häme
Itä-Uusimaa
Päijät-Häme
.
Etelä-
Pohjanmaa
Sata-kunta
Keski-
Pohjanmaa
Kymenlaakso
Migration rate
0.19 to 0.230.12 to 0.190.07 to 0.120.02 to 0.07
a) In 1988–89 matriculated only b) In 1997–98 matriculated only
Fig. A1 Regional differences in the propensity to move over three-year period (i.e.
migrated during the year of matriculation or the following two years)
Note: Itä-Uusimaa is merged with Uusimaa in the analysis. NUTS3 regions with a
university have been renamed after the largest municipality
Source: own sample data

39
Short-run effect
0.0660 to 0.06610.0073 to 0.0660
-0.0095 to 0.0073-0.0238 to -0.0095
Long-run effect
0.0035 to 0.0142-0.0047 to 0.0035-0.0088 to -0.0047-0.0186 to -0.0088
Vaasa
.
.
Rovaniemi.
Helsinki
Turku
Oulu.
Jyväskylä.Kuopio. Joensuu.
Tampere. .Lappeenranta
Kainuu
Etelä-Savo
Kanta-
Häme
Itä-Uusimaa
Päijät-
Häme
.
Etelä-Pohjanmaa
Sata-
kunta
Keski-
Pohjanmaa
Kymenlaakso
Vaasa
.
.
Rovaniemi.
Helsinki
Turku
Oulu.
Jyväskylä.Kuopio. Joensuu.
Tampere. .Lappeenranta
Kainuu
Etelä-Savo
Kanta-
Häme
Itä-Uusimaa
Päijät-
Häme
.
Etelä-Pohjanmaa
Sata-
kunta
Keski-Pohjanmaa
Kymenlaakso
a) Short-run follow-up period b) Long-run follow-up period
Fig. A2 The estimated short-run and long-run average marginal effect of the
polytechnic reform on the probability to move by NUTS3 matriculation region
Note: Average marginal effects are based on the interaction of supply of polytechnic
education with the matriculation region dummies. The same controls are used as in the
last specification of Tables 2 and 3. See also Table 6 and notes to Table 5. Underlining of
the name of the region indicates significance at the 10 % level.

40
Short-run effect
-0.0091 to 0.0051-0.0197 to -0.0091-0.0635 to -0.0197-0.1447 to -0.0635
Long-run effect
0.0175 to 0.0309-0.0029 to 0.0175-0.0290 to -0.0029-0.1032 to -0.0290
Vaasa
.
.
Rovaniemi.
Helsinki
Turku
Oulu.
Jyväskylä.Kuopio. Joensuu.
Tampere. .Lappeenranta
Kainuu
Etelä-Savo
Kanta-Häme
Itä-Uusimaa
Päijät-Häme
.
Etelä-Pohjanmaa
Sata-kunta
Keski-Pohjanmaa
Kymenlaakso
Vaasa
.
.
Rovaniemi.
Helsinki
Turku
Oulu.
Jyväskylä.Kuopio. Joensuu.
Tampere. .Lappeenranta
Kainuu
Etelä-Savo
Kanta-Häme
Itä-Uusimaa
Päijät-Häme
.
Etelä-Pohjanmaa
Sata-kunta
Keski-Pohjanmaa
Kymenlaakso
a) Short-run follow-up period b) Long-run follow-up period
Fig. A3 The estimated short-run and long-run average marginal effect of the
polytechnic reform on the probability to reside in the region of matriculation by NUTS3
matriculation region
Note: Average marginal effects are based on the interaction of supply of polytechnic
education with the matriculation region dummies. The same controls are used as in the
last specification of Tables 2 and 3. See also Table 7 and notes to Table 5. Underlining of
the name of the region indicates significance at the 10 % level.