this page ntentionally eft lank · appendix c. 112th congress rare earths and critical materials...
TRANSCRIPT


THIS PAGE INTENTIONALLY LEFT BLANK
i
U.S. DEPARTMENT OF ENERGY
CRITICAL MATERIALS STRATEGY DECEMBER 2011

ii
THIS PAGE INTENTIONALLY LEFT BLANK

iii
TABLE OF CONTENTS
FOREWORD ........................................................................................................................................................... 1
ACKNOWLEDGEMENTS .......................................................................................................................................... 2
EXECUTIVE SUMMARY ........................................................................................................................................... 3
CHAPTER 1. INTRODUCTION .................................................................................................................................. 8
CHAPTER 2. USE OF KEY MATERIALS IN CLEAN ENERGY TECHNOLOGIES .............................................................. 14
CHAPTER 3. MARKET DYNAMICS AND CHARACTERIZATION ................................................................................ 37
CHAPTER 4. SUPPLY AND DEMAND PROJECTIONS ............................................................................................... 77
CHAPTER 5. CRITICALITY ASSESSMENT ............................................................................................................... 113
CHAPTER 6. PROGRAM DIRECTIONS .................................................................................................................. 120
APPENDIX A. CRITICALITY ASSESSMENTS BY ELEMENT ...................................................................................... 134
APPENDIX B. MARKET SHARE ASSUMPTIONS AND MATERIAL CONTENT CALCULATION .................................... 151
APPENDIX C. 112TH CONGRESS RARE EARTHS AND CRITICAL MATERIALS LEGISLATION .................................... 160
APPENDIX D. EU-JAPAN-US TRILATERAL CRITICAL MATERIALS CONFERENCE AGENDA ...................................... 175
APPENDIX E. U.S. DEPARTMENT OF ENERGY RESEARCH FUNDING OPPORTUNITY ANNOUNCEMENTS RELEVANT TO CRITICAL MATERIALS .................................................................................................................................... 182
APPENDIX F. DETAIL ON REFINERY ECONOMICS OF LOWER RARE EARTH USE ................................................... 188
1
Foreword The transition to a clean energy economy is underway -- a transition that will create jobs, enhance our security and cut pollution.
As part of the U.S. Department of Energy (DOE)’s work to position the United States to lead in the production of clean energy technologies, we are releasing our 2011 Critical Materials Strategy. The report builds on DOE’s previous work in this area and provides updated analyses on a range of topics. The report finds that many clean energy technologies depend on raw materials with potential supply risks. The report identifies strategies for addressing these risks and provides background that may be helpful for stakeholders working in this area.
DOE’s 2011 Critical Materials Strategy is the product of extensive data collection and analysis. It reflects DOE’s role as an integrator, bringing together experts in multidisciplinary teams to help find solutions to complex and pressing challenges. We are grateful to all who have contributed their time and efforts, including interagency colleagues, leading experts and other stakeholders.
We don’t know for certain what the world’s energy future will look like. Changes in technologies will reshape markets and alter assumptions. As this process unfolds, DOE will continue to examine implications for our nation and help the United States to lead in the clean energy future.
Steven Chu Secretary of Energy December 2011

2
Acknowledgements This report was drafted by the U.S. Department of Energy Office of Policy and International Affairs (PI) under the direction of Assistant Secretary David Sandalow. Principal authors were Diana Bauer, David Diamond, Jennifer Li, Michael McKittrick (on detail from the Environmental Protection Agency), David Sandalow and Paul Telleen. Joanne Shore led the drafting on fluid catalytic cracking, with analysis contributed by Refining Process Services, Inc., John Hackworth, Charles Lieder and Jacobs Consultancy. Fletcher Fields, Alex Campbell, Diwakar Vashishat and Brent Wanner provided substantial analytical input. Additional contributions were made by a team of experts throughout the Department, including Chetna Khosla of the Office of Energy Efficiency and Renewable Energy; Mark Johnson of the Advanced Research Projects Agency-Energy; Colin McCormick of the Office of the Undersecretary; Andy Schwartz of the Office of Science and Al Cobb, Ray Prince, Jeff Skeer, Tom White and Pete Whitman of PI. The National Renewable Energy Laboratory provided input into the photovoltaic calculations. The report benefitted from extensive interagency input and feedback from agencies including the U.S. Geological Survey; U.S. Department of Defense, Office of the United States Trade Representative; and White House Office of Science and Technology Policy. External reviewers included David Abraham of the Research Institute on Economy, Trade and Industry; Timothy Gutowski of Massachusetts Institute of Technology; Murray Hitzman of the Colorado School of Mines and David Humphreys of the Centre for Energy, Petroleum and Mineral Law and Policy. The 30 respondents to a Request for Information (RFI) contributed substantial industrial insight. Navigant Consulting analyzed the RFI submissions. Energetics Incorporated provided editing services. The technology analyses presented were improved through consultation with Resources for the Future and the Mitre Corporation. Many thanks to all who contributed.

3
Executive Summary This report examines the role of rare earth metals and other materials in the clean energy economy. It is an update of the 2010 Critical Materials Strategy, which highlighted the importance of certain materials to wind turbines, electric vehicles (EVs), photovoltaic (PV) thin films and energy-efficient lighting. The 2011 Critical Materials Strategy includes updated criticality assessments, market analyses and technology analyses to address critical materials challenges. It was prepared by the U.S. Department of Energy (DOE) based on data collected and research performed during 2011.
The report’s highlights include:
• Several clean energy technologies—including wind turbines, EVs, PV thin films and fluorescent lighting—use materials at risk of supply disruptions in the short term. Those risks will generally decrease in the medium and long terms.
• Supply challenges for five rare earth metals (dysprosium, neodymium, terbium, europium and yttrium) may affect clean energy technology deployment in the years ahead.
• In the past year, DOE and other stakeholders have scaled up work to address these challenges. This includes new funding for priority research, development of DOE’s first critical materials research plan, international workshops bringing together leading experts and substantial new coordination among federal agencies working on these topics.
• Building workforce capabilities through education and training will help address vulnerabilities and realize opportunities related to critical materials.
• Much more work is required in the years ahead.
This report focuses on several clean energy technologies expected to experience high growth in coming years. The scenarios presented are not predictions of the future. Future supply and demand for materials may differ from these scenarios due to breakthrough technologies, market response to material scarcity and other factors. This analysis is intended to help inform policymakers and the public.
Criticality Assessment Sixteen elements were assessed for criticality in wind turbines, EVs, PV cells and fluorescent lighting. The methodology used was adapted from one developed by the National Academy of Sciences. The criticality assessment was framed in two dimensions: importance to clean energy and supply risk. Five rare earth elements (REEs)—dysprosium, terbium, europium, neodymium and yttrium—were found to be critical in the short term (present–2015). These five REEs are used in magnets for wind turbines and electric vehicles or phosphors in energy-efficient lighting. Other elements—cerium, indium, lanthanum and tellurium—were found to be near-critical. Between the short term and the medium term (2015–2025), the importance to clean energy and supply risk shift for some materials (Figures ES-1 and ES-2).

4
Figure ES-1. Short-Term (Present–2015) Criticality Matrix
Figure ES-2. Medium-Term (2015–2025) Criticality Matrix
Market Dynamics In the past year, the prices of many of the elements assessed in this report have been highly volatile, in some cases increasing tenfold. This Strategy includes a chapter exploring market dynamics related to rare earth metals and other materials. Among the points in this chapter are the following:
• In recent years, demand for almost all of the materials examined has grown more rapidly than demand for commodity metals such as steel. The growing demand for the materials studied comes from clean energy technologies as well as consumer products such as cell phones, computers and flat panel televisions.
5
• In general, global material supply has been slow to respond to the rise in demand over the past decade due to a lack of available capital, long lead times, trade policies and other factors. For many key materials, market response is further complicated by the complexities of coproduction and byproduction. In addition, for some key materials, the market’s lack of transparency and small size can affect its ability to function efficiently.
• Some universities and other institutions are preparing the future science and engineering workforce through courses, research opportunities and internships. Important topics for research include material characterization, instrumentation, green chemistry, manufacturing engineering, materials recycling technology, modeling, market assessment and product design.
• Businesses at various stages of the supply chain are adapting to market dynamics. Some are taking defensive measures to protect themselves from price volatility and material scarcity while others are proactively responding to market opportunities by offering additional sources of supply or potential substitutes.
• Many governments recognize the growing importance of raw materials to economic competitiveness and are taking an active role in mitigating supply risks.
Technology Analyses Building on the 2010 Critical Materials Strategy, this report features three in-depth technology analyses, with the following conclusions:
Rare earth elements play an important role in petroleum refining, but the sector’s vulnerability to rare earth supply disruptions is limited. Lanthanum is used in fluid catalytic cracking (FCC), an important part of petroleum refining. However lanthanum supplies are less critical than some other rare earths and refineries have some ability to adjust input amounts. Recent lanthanum price increases have likely added less than a penny to the price of gasoline.
Manufacturers of wind power and electric vehicle technologies are pursuing strategies to respond to possible rare earth shortages. Permanent magnets (PMs) containing neodymium and dysprosium are used in wind turbine generators and electric vehicle (EV) motors. These REEs have highly valued magnetic and thermal properties. Manufacturers of both technologies are currently making decisions on future system design, trading off the performance benefits of neodymium and dysprosium against vulnerability to potential supply shortages. For example, wind turbine manufacturers are deciding among gear-driven, hybrid and direct-drive systems, with varying levels of rare earth content. Some EV manufacturers are pursuing rare-earth-free induction motors or switched reluctance motors as alternatives to PM motors.
As lighting energy efficiency standards are implemented globally, heavy rare earths used in lighting phosphors may be in short supply. In the United States, two sets of lighting energy efficiency standards that come into effect in 2012 will likely increase demand for fluorescent lamps containing phosphors made with europium, terbium and yttrium. The first set of standards applies to general service bulbs. The second set of standards applies to linear fluorescent lamps (LFLs). The projected increase in U.S. demand for CFLs and efficient LFLs corresponds to a projected increase in global CFL demand, suggesting

6
upward price pressures for rare earth phosphors in the 2012–2014 timeframe, when europium, terbium and yttrium will be in short supply. In the future, light-emitting diodes (which are highly efficient and have much lower rare earth content) are expected to play a growing role in the market, reducing the pressure on rare earth supplies.
The DOE Strategy DOE’s strategy for addressing critical materials challenges rests on three pillars. First, diversified global supply chains are essential. To manage supply risk, multiple sources of materials are required. This means taking steps to facilitate extraction, processing and manufacturing here in the United States, as well as encouraging other nations to expedite alternative supplies. In all cases, extraction, separation and processing should be done in an environmentally sound manner. Second, substitutes must be developed. Research leading to material and technology substitutes will improve flexibility and help meet the material needs of the clean energy economy. Third, recycling, reuse and more efficient use could significantly lower world demand for newly extracted materials. Research into recycling processes coupled with well-designed policies will help make recycling economically viable over time.
DOE’s critical materials research and development (R&D) plan is aligned with the three pillars of the DOE strategy: diversifying supply, developing substitutes and improving recycling. The plan draws on five technical workshops convened by DOE between November 2010 and October 2011. While R&D is not the primary mechanism for encouraging supply diversification, research into more efficient and environmentally friendly separation and processing technologies have the potential to boost supply from new and existing sources throughout the world, lowering costs while reducing the environmental impact of mining and processing.
R&D plays a more central role in developing substitutes, which represents a large share of the current DOE critical materials R&D portfolio. DOE has historically focused significant R&D efforts on diverse battery chemistries and PV materials. In the past year, DOE increased its investment in magnet, motor and generator substitutes. Recycling R&D presents another opportunity to improve the robustness of supply. Across the three pillars, there is also the need for fundamental research to develop the modeling, measurement and characterization capability that is the basis for future innovations. Systems-level engineering approaches, which can help inform R&D priorities, apply throughout the supply chain. In the coming year, DOE’s R&D plan will inform the development of a larger interagency R&D roadmap.
Issues surrounding critical materials touch on the missions of many federal agencies. DOE consults and collaborates with other agencies in charting the direction of its own activities. DOE is also working with other departments to develop a coordinated, cross-government critical materials agenda. Since March 2010, an interagency working group on critical materials and their supply chains convened by the White House Office of Science and Technology Policy has been examining issues including market risk, critical materials in emerging high-growth industries and opportunities for long-term benefit through innovation.
International cooperation on critical materials can help all countries achieve their clean energy goals. Since November 2010, DOE has organized several workshops with the European Union, Japan, Australia and Canada to identify possible R&D collaboration topics. Topics of interest include separation,

7
processing, substitutes recycling and resource mapping. DOE is also pursuing international information sharing to help improve transparency in critical materials markets. DOE will continue to engage international partners through dialogues and collaborative institutions.
DOE welcomes comments on this report and supplemental information that will enable it to refine its strategy over time. Comments and additional information can be sent to [email protected].

8
Chapter 1. Introduction This report examines the role of rare earth metals and other key materials in the clean energy economy. The report focuses in particular on the role of key materials in renewable energy and energy-efficient technologies. Deployment of these technologies is expected to grow substantially in the years ahead. Many of these technologies—including wind turbines, electric vehicles (EVs), solar cells and energy-efficient lighting—depend on components often manufactured with rare earth metals and other key materials.
This is the second U.S. Department of Energy (DOE) Critical Materials Strategy. The 2010 Critical Materials Strategy found that five rare earth metals (dysprosium, neodymium, terbium, europium and yttrium) and indium are most critical in the short term for clean energy technologies. The fundamental factors described in the 2010 Critical Materials Strategy still shape the role of rare earth metals and other materials in the energy economy, although there have been changes in materials markets, technologies, research and development (R&D) investments and the geopolitical climate.
This report was developed for the following purposes:
• Analyze risks and opportunities • Continue the public dialogue • Identify programmatic directions
1.1 Scope This report addresses the short- and medium-term1
The scope of this report is limited. It does not address the material needs of the entire economy, the entire energy sector or even all clean energy technologies. Additional technologies of interest, including fluid catalytic cracking (FCC) catalysts, are discussed in Chapter 2. This report focuses on a small number of illustrative scenarios; time and resource limitations precluded a more comprehensive set. The scenarios presented are not predictions of the future. They likely underestimate both the role of breakthrough technologies and the ability of the market to respond to material scarcity and high prices. The analysis is most useful to illuminate market risks and opportunities.
deployment of wind turbines, EVs, solar cells and energy-efficient lighting. These technologies were selected for two reasons. First, they are expected to be deployed substantially over the next 15 years. Second, they use materials that are less common and could, through their deployment, substantially increase global demand for those materials. Reference- and policy-based scenarios are used to develop low and high plausible estimates for materials consumption over the short and medium terms. International scenarios are used, with some attention to the U.S. dimension. The sources for these scenarios are the International Energy Agency World Energy Outlook 2010 and Energy Technology Perspectives 2010. This framing is the same as used for the 2010 Critical Materials Strategy.
Sixteen elements and related materials were selected for this year’s criticality assessment (Figure 1-1). These include elements and materials cited in the 2010 Critical Materials Strategy as well as two elements used in batteries (nickel and manganese). Eight of the elements are rare earth metals, which
1 In this report, the short term covers the present through 2015; the medium term, 2015–2025.

9
are valued for their unique magnetic, optical and catalyst properties. The materials are used in clean energy technologies as follows:
• EV batteries: lanthanum, cerium, praseodymium, neodymium, nickel, manganese, cobalt and lithium
• Magnets for EVs and wind turbines: neodymium, praseodymium and dysprosium, with samarium and cobalt as potential substitutes
• Phosphors for energy-efficient lighting: lanthanum, cerium, europium, terbium and yttrium • Thin films for solar cells: Indium, gallium and tellurium
The materials were selected for study based on factors contributing to the risk of supply disruption, including a small global market, lack of supply diversity, market complexities caused by coproduction and geopolitical risks.
Figure 1-1. Key Materials within the Periodic Table of the Elements
While these materials are generally used in low volumes relative to other resources, the anticipated deployment of clean energy technologies could substantially increase worldwide demand. In some cases, clean energy technology demand could compete with a rising demand for these materials from other technology sectors. In some cases, these key materials have production that is currently concentrated in one country. Some key materials have production that is currently concentrated in one country. For example, more than 95% of rare earth elements are currently produced in China.
These key materials and their use in the above clean energy technologies are featured in the supply and demand projections in Chapter 4, as well as the criticality assessment in Chapter 5. Not all of the materials examined in the report are critical. Until the criticality assessment is presented, the materials of interest examined in the report will be referred to as “key materials.”

10
Maintaining the availability of materials for clean energy is not simply a mining issue. Manufacturing processes across the full supply chain must also be considered. The industrial supply chain in Figure 1-2 illustrates the steps by which materials are extracted from mines, processed and transformed into useful components or utilized in end-use applications. The supply chain provides a useful context in which to explore the technical, geopolitical, economic, environmental and intellectual property factors that impact the supply of these materials and the technologies that use them. In addition, a supply chain framework can inform where to target potential policy tools.
Figure 1-2. The Basic Materials Supply Chain
Elemental materials are extracted from the earth via mining. Next, they are processed via separation and refining to obtain the desired composition or purity. Materials may be extracted either as major products, where key materials are directly extracted from the ore, or they may be coproducts or byproducts of other mining operations. Coproduction and byproduction processes complicate the calculation of extraction costs. Thus, supply curves and market prices for coproducts and byproducts may vary in ways not captured by simple supply-and-demand relationships.
Processed materials are used to manufacture component parts that are ultimately assembled into end-use technologies. The generic supply chain also shows the potential for recycling and reusing materials from finished applications, although materials can be reclaimed at any stage of the supply chain.
1.2 In-Depth Technology Focus Chapter 2 features an in-depth look at three technologies of particular interest. FCC units, used in petroleum refining, are the largest domestic use of rare earth elements. Although several catalyst manufacturers introduced a rare earth surcharge in the past year due to the high price of lanthanum, constraints on lanthanum supply are anticipated to be short lived. Thus, the FCC analysis was not folded in to the rest of the supply-demand analysis presented in Chapter 4.
Magnets, used in wind turbine generators and EV motors, are also covered in Chapter 2. In this case, there is an opportunity to develop a competitive U.S. manufacturing capability in next-generation magnets. To this end, in the past year DOE has invested in R&D on new magnet formulations, motor designs and generator technologies that would reduce the need for neodymium and dysprosium. These were identified as critical materials in the 2010 Critical Materials Strategy.
Fluorescent lighting phosphors contain terbium, yttrium and europium, which were also identified as critical in the 2010 Critical Materials Strategy. These REEs have also experienced recent elevated prices. In addition, an anticipated immediate increase in demand is expected, precipitated by domestic lighting

11
efficiency standards for compact fluorescent lamps and linear fluorescent lamps coming into effect in 2012. In coming years, there will likely be additional lighting technology transitions, such as the transition to light-emitting diodes, which reduce the need for rare earth elements.
1.3 Other Reports A selection of reports on critical materials in energy technologies released in 2011 is discussed below. While focusing on different aspects of the topic, these reports offer similar recommendations.
In January 2011, the American Physical Society (APS) and the Materials Research Society (MRS) issued a report entitled Energy Critical Elements. The APS/MRS report highlights possible “energy-critical elements” that face potential short-term supply disruptions caused by increases in demand combined with the inability of the relatively small global market to respond to these increases. The constraints on the availability of the materials featured in this report include crustal concentration, geopolitical risk, joint production (byproduction or coproduction) with other materials, environmental concerns and production response times. The APS/MRS report states that, with respect to these materials, “delays in both production and utilization undermine the ability to plan for deployment of new energy technologies.” The APS/MRS report’s recommendations for governments include coordination, dissemination of information, establishment of an R&D effort and increased recycling.
In May 2011, The Center for a New American Security offered a different focus in its Elements of Security: Mitigating the Risks of U.S. Dependence on Critical Minerals. This report emphasizes geopolitical aspects of critical materials. The report argues that “countries that consider assured access to minerals as far more strategically important are increasingly setting the rules for trade” globally, and that some market disruptions are caused by political leaders in resource-producing countries who are leveraging their positions of strength. As governments and industries across the world simultaneously invest in new technologies for a common purpose (such as clean energy or defense), the deployment of these technologies can amplify global demand for particular materials. In addition, dominant producers can exploit vulnerabilities in today’s highly efficient, just-in-time supply chains. The report recommends that administration officials and Congress identify the minerals most important to energy innovation and build tailored strategies to mitigate potential supply disruptions. It emphasizes that Congress should protect the government’s role in analyzing critical mineral vulnerabilities and producing its own data (Parthemore 2011).
In August 2011, the Resnick Institute for Sustainable Energy Science at the California Institute of Technology issued Critical Materials for Sustainable Energy Applications. This report finds that clean energy technologies will demand increasing quantities of specialty metals and even commodity metals, such as copper. The report highlights research needed to address both reductions in demand and enhancements of supply. Demand-side R&D includes research on substitutes for materials, components and systems. Supply-side R&D includes research on fundamental properties and processing innovations. The report argues that an energy R&D agenda needs to be developed based on a holistic evaluation of materials use. It presents an “option space” to reduce material criticality from both supply and demand perspectives that looks at risk reduction versus technical effort. The report’s recommendations for the government include international collaborations, data collection, stockpiling, financial measures to offset capital risks and R&D funding.

12
In October 2011, the European Commission Joint Research Centre Institute for Energy and Transport issued Critical Metals in Strategic Energy Technologies. This study examines the use of metals in nuclear, solar, wind, bioenergy, carbon capture and storage, and electricity grids. The report focuses on five metals—neodymium, dysprosium, indium, tellurium and gallium—that are anticipated to have both a significant share of their demand coming from these technologies and also a significant risk of supply chain bottlenecks in the next two decades. The report also stresses the importance of market dynamics as they relate to supply chain bottlenecks. It offers recommendations relating to the public sharing of data and information, development of supply, international collaboration, R&D investment, recycling and byproduct production (Moss 2011).
Reflecting both the market and geopolitical perspectives highlighted in these reports, this Strategy explores market dynamics across the supply chain as well as various government policies that affect the market. This discussion appears in Chapter 3, which also features a discussion of human capital, business and government strategies to anticipate and respond to market conditions.
1.4 DOE’s 2011 Critical Materials Work The approach to proactively address material supply risks and prevent supply chain disruptions while building a robust clean energy economy has three pillars:
• Achieve globally diverse supplies • Identify appropriate substitutes • Improve capacity for recycling, reuse and more efficient use of critical materials
In the past year, DOE has gathered information and made research investments to address critical materials challenges within each of these pillars. In March, DOE issued its second Request for Information, addressing technology material content, supply chain structure, financing, research, education, technology transitions, recycling and permitting. DOE pursued research, education and policy opportunities in collaboration with partners, including other federal agencies and other nations. Chapter 6 highlights an R&D plan that integrates recent critical materials R&D investments across DOE, new work by the interagency working group on critical material supply chains and international critical materials collaborations in 2011.
Strengthening the U.S. position across the supply chain requires a capable workforce. Education and training are fundamental to building workforce capabilities to address vulnerabilities and pursue opportunities. Expertise across the physical sciences and engineering, as well as in other disciplines such as geosciences, will be important to holistically address critical materials issues. Chapter 3 addresses opportunities to strengthen workforce capabilities.

13
References APS (American Physical Society) and MRS (The Materials Research Society). 2011. Energy Critical Elements: Securing Materials for Emerging Technologies. Washington, DC: APS. http://www.aps.org/policy/reports/popa-reports/upload/elementsreport.pdf.
Moss, R., E. Tzimas, H. Kara, P. Willis, and J. Kooroshy. 2011. Critical Metals in Strategic Energy Technologies. Luxemburg: European Commission Joint Research Centre-Institute for Energy and Transport.
Parthemore, C. 2011. Elements of Security: Mitigating the Risks of U.S. Dependences on Critical Minerals. Washington, DC: Center for a New American Security.
Resnick Institute. 2011. Critical Materials for Sustainable Energy Applications. Pasadena, CA: Resnick Institute for Sustainable Energy Science, August. http://www.resnick.caltech.edu/news/Features/ri_criticalmaterials_report.pdf.
Bibliography International Energy Agency. Energy Technology Perspectives 2010. Paris: International Energy Agency, 2010.
International Energy Agency. World Energy Outlook 2010. Paris: International Energy Agency, 2010.

14
Chapter 2. Use of Key Materials in Clean Energy Technologies
2.1 Introduction This chapter focuses on three special topics:
• Fluid Cracking Catalysts in Oil Refining
• Technology Transitions in High-Efficiency Lighting
• Permanent Magnets in Wind Turbines and Electric Vehicles
These topics were selected because of interest expressed by stakeholders following the release of the U.S. Department of Energy’s (DOE’s) 2010 Critical Materials Strategy.
In addition, this chapter briefly explores the use of rare earths and other materials in nine technologies: photovoltaic (PV) films, vehicle batteries, electric bicycles, grid storage batteries, magnetic refrigeration, automatic catalytic converters, gas turbine blades, fuel cells and vehicle lightweighting. Table 2-1 provides an overview of the key materials used in leading clean energy technologies. 2
Table 2-1. Materials in Clean Energy Technologies and Components
2.2 Fluid Catalytic Cracking Catalysts Rare earth elements (REEs) play an important role in petroleum refining. Lanthanum and cerium are used in catalysts and additives for fluid catalytic cracking (FCC), a key process in gasoline production. These REEs increase gasoline yield and reduce air emissions from the oil refining process. A modest 2 Table 2-1 includes only materials incorporated in analyses in Chapter 4.
15
reduction of rare earth supply would not likely have a large impact on gasoline supplies or prices. The unprecedented increases in rare earth oxide (REO) costs during the past year have likely added less than a penny to the price of gasoline. However, current high REO prices are providing incentives for catalyst manufacturers to develop catalysts with low or near-zero rare earth content. Under more extreme conditions, with a sudden loss of significant rare earth supply, gasoline production per barrel of oil would decline, but with weak gasoline demand in the Atlantic Basin expected for several years, overall refinery capacity should still be adequate to meet demand.
Background The main use of rare earths in petroleum refining is in the FCC unit. This unit produces gasoline and feedstock for the alkylation unit, which in turn produces a gasoline component called alkylate. Together, these two units account for about 45%–50% of refinery gasoline production. Some distillate fuel oil is also produced from the FCC unit.
In a refinery, crude oil is distilled into different streams. Lighter molecular weight streams include gasoline, kerosene and diesel. Heavier molecular weight streams are processed further, and can be broken down into lighter products by several conversion processes. The FCC process breaks apart or cracks heavy input streams into primarily gasoline and diesel fuel, but also light hydrocarbon gases, heavy oil and coke. The heavy crude oil material entering the FCC unit, sometimes called heavy gas oil or vacuum gas oil, is heated to about 1,000°F, at which it becomes a gas and flows up a specially designed pipe (called a riser) along with a catalyst that helps to break apart the heavy molecules. The term “fluid” refers to the fact that the hot gas flowing up the pipe suspends the catalyst, which looks like powder floating in the upward flowing gas.
FCC catalysts are manufactured to have structural shapes and compositions to increase the speed of the cracking process and to produce a mix of products that are most valuable—in this case, light olefins (propylene and butylenes), gasoline and diesel. One of the materials used in FCC catalysts is the REO lanthanum oxide. The addition of REOs helps the FCC catalysts to produce desired products and to remain effective longer. (See “Rare Earth Benefits in Fluid Catalytic Cracking Catalysts” sidebar.) Reducing the amount of REO in catalysts could reduce the amount of gasoline and distillate produced in the FCC units.
The use of REOs in FCC catalysts increased from an average of 1.2% (by weight) REO in the FCC catalyst in 1994 to about 2.9% in 2010. Higher REO content results in higher gasoline yield, but it also lowers octane content in the FCC gasoline. In recent years, octane loss has been less of a concern because the need for higher-octane FCC gasoline fell with increased blending of high-octane ethanol into gasoline.
Rare earths, mainly cerium, are also used in some FCC additives to reduce sulfur oxide (SOx) emissions. These additives contain between 4% and 15% cerium oxide by weight. However, because the majority of FCC units do not use SOx reduction additives, this rare earth application is less significant than rare earth use in FCC catalysts. In addition, with increasing cerium prices, some catalyst manufacturers’ literature indicates that zero or low rare earth content SOx additives will be available soon (Albemarle Catalyst Courier 2011a).

16
Market for Rare Earth Oxides Used in Petroleum Refining The petroleum refining industry uses the lighter rare earths, mainly lanthanum and cerium. As discussed in Section 3.2, China supplies 95% of the world’s REEs. While Chinese quotas cover the full range of rare earths, the supply-demand balance for the lighter rare earths has not been as tight as for other REEs, due in part to some limited production outside of China. Production external to China is projected to increase in the next several years mainly as a result of the anticipated expansion at Molycorp’s Mountain Pass, California mine and the development of the Lynas Mount Weld Australian mine and processing plant in Malaysia. Catalyst producers indicated that they have been able to obtain sufficient supplies of lanthanum and cerium for catalyst and additive production, despite the Chinese quotas. Still, prices have risen sharply. For example, the price of lanthanum oxide rose from $5 per kilogram (kg) in early 2010 to $35/kg by mid-year, $60/kg by the beginning of 2011 and about $140/kg in June 2011. This price rise approximately doubled the cost of FCC catalysts. While prices fell in August with a summer slowdown in demand, some analysts expect a rebound in the fourth quarter due to continued declines in quotas and to some processing plant shutdowns in China (Watts 2011).
Refinery Economics of Lower Rare Earth Use Refiners have several choices when faced with higher FCC catalyst costs, and different refineries will likely choose different options. Refineries have different operating constraints and vary in the types and quality of feedstocks for their FCC units. Consequently, catalyst producers and FCC consultants work with individual refiners to evaluate possible changes that will optimize operations given increasing catalyst costs.
In all cases, the economics derive from changes in revenue that occur when different REO catalysts produce different product slates from the FCC unit, as well as changes in catalyst costs. FCC unit revenue
Rare Earth Benefits in Fluid Catalytic Cracking Catalysts
Rare earths have been used for decades in fluid catalytic cracking catalysts because of their effectiveness as measured by activity, selectivity and stability. Activity is a measure of the ability of the catalysts to promote reactions. More reactions result in higher efficiency.
Selectivity is the degree to which a catalyst increases yields of desired products. Increases in the weight percent of rare earth oxides in fluid catalytic cracking catalysts increases yields of gasoline and decreases yields of less valuable products such as slurry oil. Higher rare earth oxide content catalysts also create more heavy gas oil and coke, which are lower-valued products, but the total value of the products produced from a barrel of crude oil increases.
Stability refers to the ability of the catalyst to maintain activity over time. REOs retard catalyst deactivation. Fluid catalytic cracking catalysts are deactivated in the high-temperature and steam environment of the fluid catalytic cracking regenerator by a process called dealumination. Rare earth oxide content slows that process, which reduces the amount of fresh makeup that the refinery needs to add to the FCC unit, thereby reducing operating cost.

17
derives from prices and volumes of the products produced. The primary product target is gasoline, but other higher-valued products include a distillate stream called light cycle oil (LCO), a valuable petrochemical called propylene and butylenes, the feedstock for the alkylation unit, which produces another gasoline stream called alkylate. However, the unit also produces a low-valued product called slurry oil. The yields of these products shift with REO content in the catalyst. If the same amount of catalyst is used, and the REO content declines, gasoline yield declines. At the same time, yields of some of the other high-valued products increase; however, low-valued slurry oil yield also increases, which counters some of the revenue improvements from the increases in products such as LCO.
Increasing REO prices push up FCC catalyst costs. The price of lanthanum oxide used in FCC catalysts has risen from $5 per kilogram in early 2010 to $140 per kilogram in June 2011. That translates to catalyst costs doubling per barrel of feedstock into the FCC unit.
A detailed example in Appendix F illustrates the revenue and cost changes for a refinery using a good quality FCC feedstock and paying for a catalyst containing REO that costs $140 per kilogram. In one scenario, the refiner cuts the expensive REO content of the catalyst in half, but uses the same amount of catalyst. In this case, revenues drop much more than cost savings from the catalyst. The net loss of revenue is mainly due to the shift from high-valued gasoline to lower-valued slurry oil. A second scenario is shown in which the refiner uses more catalyst containing the lower REO content in order to boost the gasoline yield and reduce LCO and slurry oil yields. In this second scenario, revenues are returned to their original levels, but the costs increase slightly compared to using the high-REO-content catalyst, illustrating why a refiner in this high REO cost situation would have little incentive to make a catalyst change.
The example in Appendix F is for refiners with high-quality FCC feedstock, but somewhere between one-third and one-half of refiners use low-quality FCC feedstock containing residual fuel. These refiners may use three times as much FCC catalyst as those with high-quality FCC feedstocks. The increased use of catalysts means increased cost savings when moving to a low-REO catalyst. As a result, low-quality FCC feedstock refiners might find it economic to move to low-REO catalysts before a high-quality feedstock refiner.
While these examples provide an overview of some of the major revenue and cost tradeoffs involved in the economics of changing catalysts, individual refiners have different market and refinery constraints that also influence the decision. The final economics in all cases will be influenced by how successful the catalyst manufacturers are at improving low-REO catalyst performance, such as shifting more of the lost gasoline yield to LCO rather than low-value slurry oil.
Catalyst Producers See Investment Incentive to Reduce REO Use In contrast to refineries, catalyst makers have a competitive incentive to reduce costs, and are working on next-generation catalysts to improve performance of reduced REO formulations. Manufacturers are developing both catalysts with lower-percentage REOs and with zero or near-zero REOs. Two major catalyst producers have announced new catalysts with very low REO content. Grace Davison is offering a 0.2 weight percent REO catalyst (REMEDY catalyst) (Schiller n.d.), and Albemarle is offering a 0.5 weight percent REO catalyst (AMBER LRT and UPGRADER LRT) (Albemarle Catalyst Courier 2011b). These new

18
catalysts need to gain commercial acceptance, and producers need to expand production capability. Consequently, these new catalyst options are likely to have limited impact on REO use in FCC catalysts in 2011 or even 2012. Furthermore, new catalysts still will likely result in slightly different yield slates to achieve the greatest cost savings.
At the same time, catalyst producers are looking for new sources of REOs. REOs are likely to be used in FCC catalysts at some level for a number of years due to catalyst technology, refinery economics and increasing supply projections for the light REOs needed for refining catalysts. For example, Molycorp noted in its Fourth Quarter 2010 Report of Results that it had entered into a contract to supply W.R. Grace and Co. with a significant amount of REOs, primarily lanthanum concentrate, through mid-2012, and had also contracted to supply Grace with approximately 75% of its lanthanum production per year for a 3-year period. BASF, another major catalyst manufacturer, has also signed a contract with Lynas.
Vulnerability to Rare Earth Supply Disruption In the short term, inventories provide a cushion from disruptions. Interviews with catalyst manufacturers indicated that current inventories of rare earths for FCC catalysts may range from 3 to 9 months, assuming current rare earth catalyst content, and in some cases, FCC catalyst inventories may be high enough to provide further cushion. If a disruption occurs, catalyst manufacturers could move to provide lower-rare-earth-content catalysts quickly, stretching inventories out even further to help fill the gap before new sources of rare earth supply already in the pipeline can begin production. With new sources of light rare earths evolving outside of China and with catalyst manufacturers already testing low and near-zero rare earth catalysts, the petroleum refining industry has less exposure to disruptions in rare earth supply than many other industries.
If a sudden disruption in REO supply were severe enough, both catalyst vendors and refiners could experience constraints that would affect the gasoline market. If only low-REO catalysts were available, refiners would generally want to use more catalyst volume to help make up for the loss of gasoline yield. However, catalyst suppliers may not be able to provide enough added production for refiners to compensate. For example, if most refiners wanted to double their catalyst usage, their demand would require catalyst manufacturers to double production, which would require more capacity. Some refiners would also face operational constraints. Low-REO catalysts result in more production of gases, such as propylene and butylenes, the feedstock for the alkylation unit. In both cases, the refinery needs additional capacity to process the gases and the extra alkylation feedstock. That extra capacity may not be available immediately. In these cases, refiners would have to reduce FCC input to accommodate the shift to higher yields of these gases and alkylation feedstock. The result would be lower gasoline production and lower margins for some refiners. In such a worst case scenario, total gasoline production from U.S. refiners might be reduced by about 3%, or about 240,000 barrels per day. However, even in this low-probability extreme case, the lost gasoline volume is small enough to counterbalance in a number of ways such as through decreased exports. For example, 240,000 barrels per day represents about half of the gasoline being exported in 2011, and with weak demand in the Atlantic Basin expected to continue for several years, global refinery capacity should be adequate to compensate. However, as in the case of most significant supply disruptions, gasoline prices typically would rise for a short time in response to the loss of supply until the market rebalanced.
19
Conclusion The petroleum refining industry, like many other manufacturing and processing industries, uses rare earths. Refining rare earth applications use the lighter REEs such as lanthanum and cerium, which are the most widely available rare earths and are expected to experience less pressure in the marketplace than heavier rare earths. New supply sources outside of China are under development, with production expected to begin in 2012 in the United States and Australia. Catalyst manufacturers are also establishing supply contracts with the producers of new rare earth supplies outside of China.
The refining industry is not critically exposed to disruptions in rare earth supply. Inventories of FCC catalysts and rare earth materials for FCC catalyst manufacture provide many months of coverage, which will be stretched out as catalyst manufacturers move to catalysts with lower or near-zero rare earth content. This exposure will be even less as new sources of supply outside of China are projected to come online in the next few years.
2.3 Permanent Magnets
Neodymium iron boron rare earth permanent magnets (PMs) are used in wind turbines and traction (i.e., propulsion) motors for electric vehicles (EVs). While the use of rare earth PMs in these applications is growing due to the significant performance benefits PMs provide, a number of technical, economic and policy factors may influence future trends. In fact, manufacturers have a great deal of flexibility in addressing potential material criticality through component-level design changes. This subsection describes specific issues associated with rare earth magnets in wind turbines and PMs. It also focuses specifically on dysprosium, which was identified as the most critical element in the 2010 Critical Materials Strategy. While dysprosium will likely remain a concern, a great deal of effort has already gone into reducing its use in future generations of wind turbines and motors.
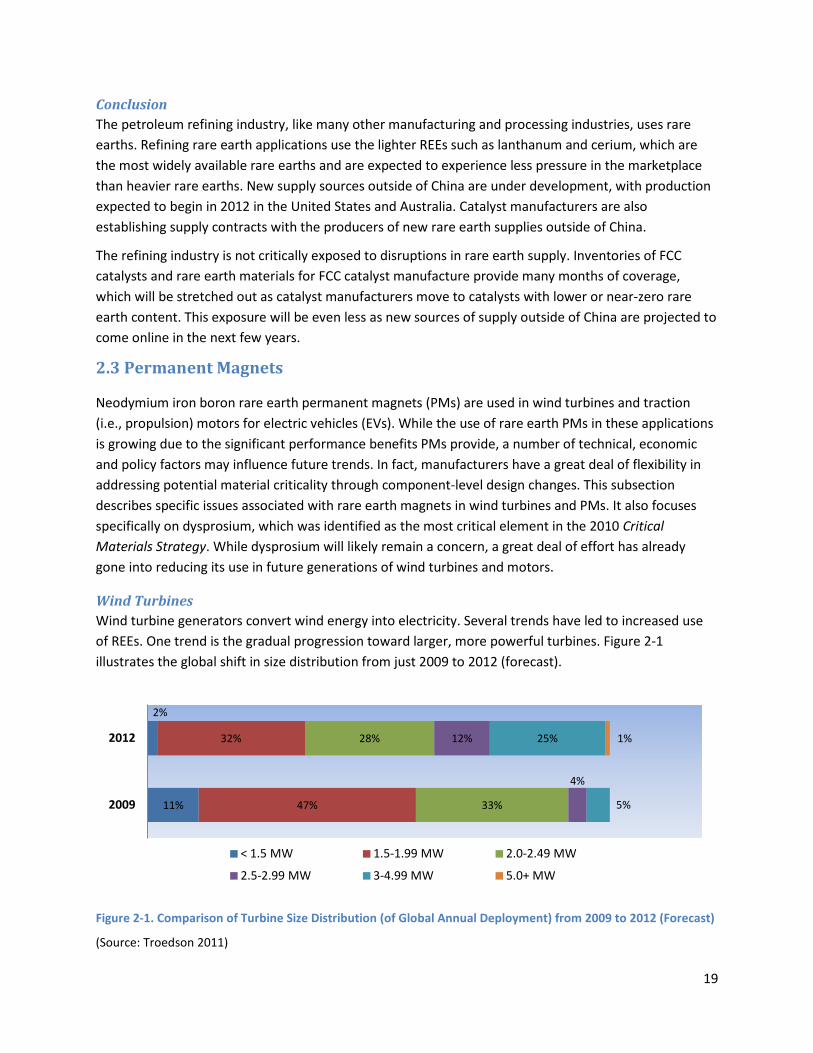
Wind Turbines Wind turbine generators convert wind energy into electricity. Several trends have led to increased use of REEs. One trend is the gradual progression toward larger, more powerful turbines. Figure 2-1 illustrates the global shift in size distribution from just 2009 to 2012 (forecast).
Figure 2-1. Comparison of Turbine Size Distribution (of Global Annual Deployment) from 2009 to 2012 (Forecast)
(Source: Troedson 2011)
11%
2%
47%
32%
33%
28%
4%
12%
5%
25% 1%
2009
2012
< 1.5 MW 1.5-1.99 MW 2.0-2.49 MW
2.5-2.99 MW 3-4.99 MW 5.0+ MW

20
In 2009, turbines smaller than 2.5 megawatts (MW) made up more than 90% of the market. In 2012, this share is projected to drop to 62% (Troedson 2011). Larger turbines are more likely to use rare earth PMs, which can dramatically reduce the size and weight of the generator compared to non-PM designs such as induction or synchronous generators.
A second trend is toward turbines equipped with electricity generators that run at slower speeds, allowing better coupling with the turbine rotor. This means more electricity generation at lower wind speeds than traditional high-speed turbines. The slowest electricity generator speeds are achieved through a direct-drive arrangement. Higher-speed turbines, on the other hand, use one or more gearing stages between the rotating blades and the generator. In addition to being highly efficient, the lack of gearing in direct-drive turbines reduces maintenance requirements, providing a life cycle cost advantage in remote or offshore locations. Despite their advantages, slow-speed turbines require larger PMs for a given power rating, translating into greater rare earth content. Arnold Magnetics (Constantinides 2011) estimates that direct-drive turbines require 600 kg of PM material per megawatt, which translates to several hundred kilograms of rare earth content per megawatt (GE 2011).
As manufacturers seek to reduce rare earth content in wind turbines, they have turned to a range of design options. “Hybrid drive” PM turbines, which use a PM generator in conjunction with a geared drive, have received increasing interest. These turbines operate at higher speeds than direct-drive turbines and require a more complicated gearing system, but require PMs one-third the weight of direct-drive turbines, with correspondingly less rare earth content (Constantinides 2011). Hybrid drive turbines currently represent a small fraction of the wind turbine market, but could represent more than half of wind power generation over the next decade (Constantinides 2011). Concerns over critical materials scarcity could also accelerate the development of superconducting generator turbines, which do not use permanent magnets and show promise for turbines in the 10 MW+ range. American Superconductor has been developing a 10 MW Sea Titan turbine prototype that uses a direct-drive high-temperature superconducting generator (AMSC 2011).
There is also evidence that rare earth export quotas and price premiums have led to a disparity between the use of PM designs inside and outside of China. While PM wind turbines only account for about 5% of the market outside of China (Constantinides 2011), their market share inside of China is estimated at 25% or higher (Hu 2010).
This discussion illustrates the extent to which the wind turbine design space remains in flux. Individual manufacturers’ design decisions regarding a single turbine model could dramatically impact medium-term demand for REEs in wind turbines. Under the high wind turbine deployment scenario described in Chapter 4, the use of hybrid drive instead of direct drive for all PM turbines would reduce annual neodymium demand by 7,000 tonnes3
Electric and Hybrid Vehicles
in 2025, which would be about one-sixth of all clean energy demand for neodymium that year.
While rare earth PM designs still make up a small percentage of the market for wind turbines, they are the dominant technology in EVs. Almost all mass-produced hybrid electric vehicles (HEVs) and EVs
3 1 tonne = 1 metric ton (Mt).

21
[which include plug-in hybrid electric vehicles (PHEVs) and all-electric vehicles (AEVs)] use rare earth PMs in the motors that propel them during electric drive operation. As one component in a complex system, the motors are also constrained in size and weight to fit within existing design parameters, making substitution difficult. This is particularly true for PHEVs and HEVs, which have to fit both a gasoline engine (or generator) and an electric motor in a tight engine compartment. AEVs have no gasoline engine, which alleviates some of the space constraints and makes it easier to cool the motor. These factors allow more flexibility to change the motor size and operating characteristics.
Manufacturers have explored several options to replace rare earth PM motors in vehicle designs (N.V. 2011). Some manufacturers have reconsidered induction motors, which are larger (for a given power rating) than PM motors but are easier to cool and potentially more efficient. Several niche EVs, including the Tesla Roadster and Mini-E, already use induction motors. Toyota announced in early 2011 that it was also developing an induction motor design that could be used in a range of vehicles with electric drives.
Switched reluctance motors (SRMs), which operate by electronically switching an electromagnetic stator field to drive an iron stator, have emerged as another potential substitute for PM motors. SRMs have traditionally suffered from noise and vibration problems, but advances in electronic control and precision machining of motor parts have made them more viable. The Advanced Research Projects Agency-Energy recently awarded General Atomics and the University of Texas at Dallas a $2.8 million grant under its Rare Earth Alternatives in Critical Technologies (REACT) program to develop a “double stator” SRM for electric drive vehicle use.
Dysprosium Another area of increased attention is the use of dysprosium in rare earth PM magnets. Dysprosium is added to increase the value of intrinsic coercivity, or resistance to demagnetization. This also helps to improve resistance to magnetization at higher temperatures, which is generally required for all PMs used in motors or generators.4
Even within these applications, there is a range of dysprosium content. Therefore, dysprosium demand calculations in Chapter 4 of this Strategy assume low and high dysprosium ranges for both average dysprosium content in wind turbine and vehicle PMs. There may also be a range of operating temperatures and corresponding dysprosium requirements for different types of vehicles.
The required dysprosium content varies by application based on the operating temperature. Table 2-2 shows estimated average dysprosium content by magnet weight percentage for various applications.
Efforts to reduce dysprosium content have focused both on system-level innovations that reduce the need for dysprosium by lowering operating temperatures of applications and on material science research to reduce the amount of dysprosium required for a given operating temperature. Boulder Wind, with support from DOE’s U.S. Wind Power Next Generation Drivetrain Development Program, is developing a unique wind turbine with an “air core” stator that is capable of operating at temperatures low enough that dysprosium is not required. The elimination of dysprosium will reduce material costs
4 Cobalt can also be added to PM magnets to improve performance at higher temperatures, but was not included in the analysis in Chapter 4.

22
and is part of a suite of innovations that the company expects to dramatically lower production, installation and operating costs compared to current wind turbines (Boulder Wind 2011). On the material science front, researchers have initiated a number of projects to reduce dysprosium requirements. Japanese researchers and initiated a number of research projects on reducing dysprosium use, in support of national research and development (R&D) policy goals for rare earths. Their efforts have included experiments on reducing the grain size of magnetic powders, modifying the way in which dysprosium is introduced into the magnetic structure and diffusing a neodymium-copper (instead of dysprosium) alloy along the magnet grain boundaries (NIMS 2010). Molycorp, a domestic rare earth mining company, recently announced a partnership with Daido Steel and the Mitsubishi Corporation to develop and sell sintered rare earth PMs that deliver greater performance with less reliance on dysprosium (Molycorp 2011). These two parallel approaches to reducing dysprosium requirements illustrate the potential to substantially reduce future demand for dysprosium in PMs.
Table 2-2. Comparative Dysprosium Content Estimates by Magnet Application5
Application Typical Dysprosium Content
(share of magnet weight) Hybrid and Electric Traction Drive 8.7% Generators (excluding wind turbines) Wave Guides 6.4%
Wind Power Generators Motors (industrial, general automotive) Electric Bicycles Torque-Coupled Drives Energy Storage Systems Magnetic Braking Relays and Switches Pipe Inspection Systems Magnetically Levitated Transportation Preprographics
4.1%
Gauges Magnetic Separation Hysteresis Clutch
2.8%
Magnetic Refrigeration MRIs Sensors
1.4%
(Source: Constantinides 2011)
2.3 Technology Transitions in High-Efficiency Lighting Lighting accounts for approximately 18% of electricity use in U.S. buildings—second only to space heating (DOE 2009). Modern technologies provide opportunities to significantly reduce energy demand from lighting. In particular, the traditional incandescent light bulbs in widespread use in the United States today (employing a technology similar to the one developed by Thomas Edison in 1879) use considerably more energy than 21st century alternatives including fluorescent lighting, light-emitting diodes (LEDs), organic light-emitting diodes (OLEDs) and halogen incandescents. 5 The percentage ranges used for demand calculations in Chapter 4 are slightly lower than those presented in table 2-2. The lower range estimates reflect inputs from a number of additional sources and reflect the potential for reduced dysprosium use over time.
23
The transition to new lighting technologies is underway in the United States and around the world. Many countries now limit or prohibit the use of traditional incandescent light bulbs. In the United States, lighting efficiency standards have been a feature of energy legislation over the past two decades, including the Energy Policy Act of 1992 and the Energy Independence and Security Act of 2007 (EISA 2007). Standards under these statutes are accelerating the transition from traditional incandescents. The first substitutes will likely be fluorescent light bulbs (both compact and linear). Demand for fluorescent lighting is expected to grow sharply in the next few years in the United States and around the world. Within several years, demand for LEDs and halogen incandescents is expected to grow, in many cases replacing demand for fluorescent lighting. Fluorescent light bulbs depend on phosphors made from terbium, europium and yttrium. Shortages of those elements in the next several years may affect the availability of fluorescent lighting. LEDs use much less rare earth content than fluorescent light bulbs6
Upcoming U.S. Standards, Technology Deployment and Rare Earth Phosphor Demand
, while OLEDs and halogen incandescents use no rare earths. As markets shift to these alternatives, lighting-related demand for terbium, europium and yttrium will likely decline. In the medium- to long-term, rare earth phosphor demand may also be offset by phosphor recycling. Recycling issues are discussed in Chapter 3.
In the United States, two sets of lighting energy efficiency standards could lead to an increase in production and sales of fluorescent lamps containing rare earth phosphors.
First, EISA 2007 prescribes maximum wattage requirements for general service light bulbs. As required by the statute, these standards will be phased-in starting in 2012 and continuing through 2014. Compact fluorescent lamps (CFLs) meet these standards, whereas the most common incandescent lamps do not (DOE 2011a). DOE is also required under EISA 2007 to initiate a rulemaking in 2020 to determine whether the standards in effect for general service incandescent lighting at that time should be amended.
Second, under the Energy Policy and Conservation Act of 1975, as amended, DOE published proposed standards for incandescent reflector lamps and fluorescent lamps, including linear fluorescent lamps (LFLs), in July 2009. Final standards take effect in July 2012 (DOE 2011b). In most cases, the energy efficiency requirements under these standards necessitate a move from traditional halophosphors to triband phosphors, which contain rare earths.
Two DOE models were used to estimate the impact of the standards on U.S. CFL and LFL demand and, in turn, demand for REEs used in phosphors. For CFL demand, an Energy Information Administration model from the Annual Energy Outlook 2011 Residential Database was used.7
6 Total rare earth content in LEDs is estimated at one to two orders of magnitude lower than fluorescent lights of equivalent light output (GE 2010).
This model assumes CFLs will meet the bulk of mandated energy-efficient residential lighting demand. Thus, according to the model, CFL demand will peak in 2014, after the final stage of the first phase of the EISA 2007 standards take
7 The National Energy Modeling System residential sector model used in the Annual Energy Outlook 2011 is calibrated to 2005 lighting demand and assumptions about relative price and performance of different lighting options (i.e., CFL, incandescent and LED) going forward (EIA 2010). Price and performance assumptions were updated in 2008 (EIA 2010). Actual CFL shipments have dropped slightly since 2007, but are expected to increase again ahead of the implementation of EISA 2007 standards in 2012–2014 (DOE 2010).

24
effect. After that point, demand for CFLs will decline somewhat as these efficient bulbs last longer than the incandescent bulbs they are replacing. According to the model, the demand for CFLs will decline further in the next 5 to 10 years, when a larger number of halogen-type incandescent bulbs will be able to meet the standard. Projected CFL demand under this model is shown in Figure 2-2. (The total rare earth phosphor for each bulb is about 1.5 grams, of which 60% is REO.)
Figure 2-2. Projected Domestic CFL Shipments under EISA 2007 Standards Note that Figure 2-2 is illustrating one possible transition scenario under the standard. The transition could also slow or be partially reversed by higher efficiency halogen incandescent bulbs capable of meeting the standards. A 2010 DOE assessment of the CFL market postulates several alternate demand trajectories for CFLs from 2010 to 2020 depending on consumers’ behavioral response to the standards and price and availability trends in high-efficiency incandescent bulbs (DOE 2010). Manufacturers have already introduced halogen incandescent bulbs that meet the 2012-2014 general service lighting standards at a price point between standard incandescents and CFLs. However, CFLs are still about three times more efficient than the new halogen incandescent and designed to last much longer (DOE 2010).
In addition to the transition from incandescent to fluorescent or halogen incandescent lighting, there may also be a subsequent transition to other promising technologies, including LEDs and OLEDs. The magnitude and pace of these transitions will be dictated by a number of factors, including the availability, price and performance of each technology compared to other lighting options and the ability to retrofit bulbs into existing sockets and fixtures. LED bulbs for residential use are already available on the consumer market, but at very high unit prices compared to incandescent or CFL bulbs (although the longevity and efficiency of LEDs makes them more competitive on a total life cycle cost basis). LEDs are expected to become increasingly competitive as unit prices drop.
Halogen incandescents, LED and OLEDs each use little or no rare earths, and have the potential to be manufactured in the United States. For example, Sylvania is producing halogen incandescent lighting at a converted incandescent bulb manufacturing facility in Pennsylvania (Whoriskey 2010). Philips was recently awarded DOE’s “L” prize for developing the best LED replacement for a standard 60 watt incandescent bulb. The company has stated its intentions to begin domestic manufacturing of bulbs based on the winning design by 2012 (LEDs Magazine 2011).
0
200
400
600
800
1,000
2007 2010 2013 2016 2019 2022 2025
Mill
ion
units
25
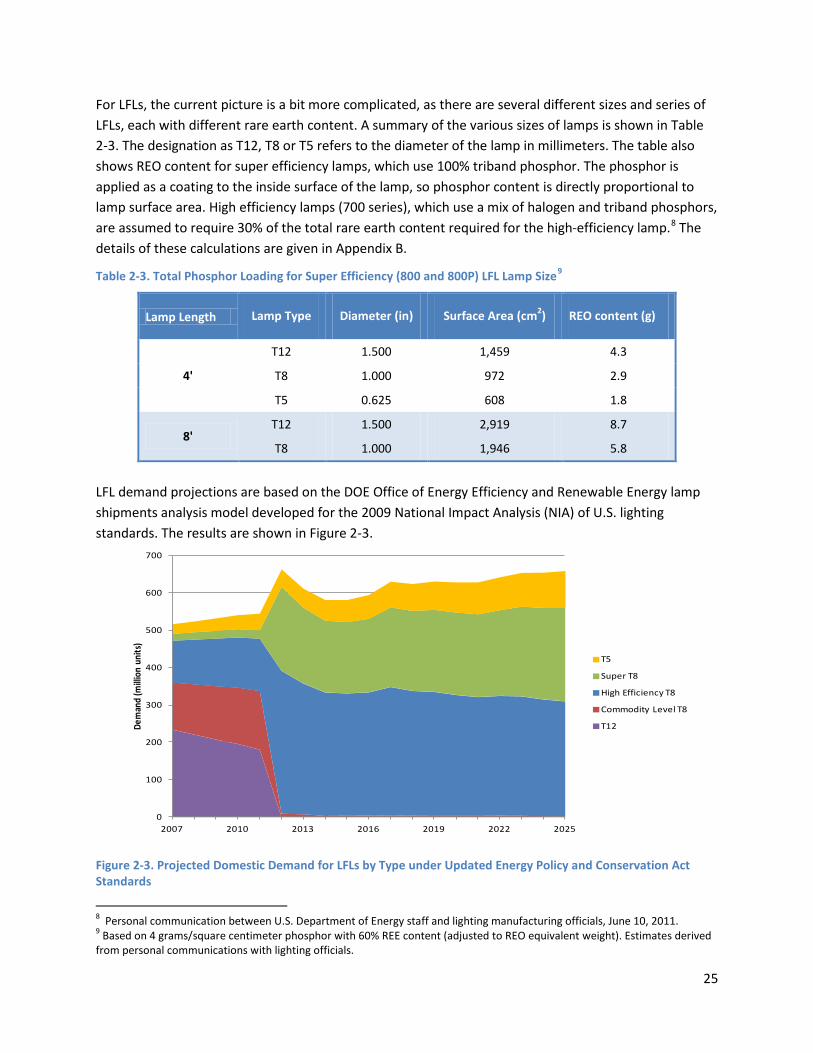
For LFLs, the current picture is a bit more complicated, as there are several different sizes and series of LFLs, each with different rare earth content. A summary of the various sizes of lamps is shown in Table 2-3. The designation as T12, T8 or T5 refers to the diameter of the lamp in millimeters. The table also shows REO content for super efficiency lamps, which use 100% triband phosphor. The phosphor is applied as a coating to the inside surface of the lamp, so phosphor content is directly proportional to lamp surface area. High efficiency lamps (700 series), which use a mix of halogen and triband phosphors, are assumed to require 30% of the total rare earth content required for the high-efficiency lamp.8
Table 2-3. Total Phosphor Loading for Super Efficiency (800 and 800P) LFL Lamp Size
The details of these calculations are given in Appendix B.
9
Lamp Length
Lamp Type Diameter (in) Surface Area (cm2) REO content (g)
4'
T12 1.500 1,459 4.3
T8 1.000 972 2.9
T5 0.625 608 1.8
8' T12 1.500 2,919 8.7
T8 1.000 1,946 5.8
LFL demand projections are based on the DOE Office of Energy Efficiency and Renewable Energy lamp shipments analysis model developed for the 2009 National Impact Analysis (NIA) of U.S. lighting standards. The results are shown in Figure 2-3.
Figure 2-3. Projected Domestic Demand for LFLs by Type under Updated Energy Policy and Conservation Act Standards
8 Personal communication between U.S. Department of Energy staff and lighting manufacturing officials, June 10, 2011. 9 Based on 4 grams/square centimeter phosphor with 60% REE content (adjusted to REO equivalent weight). Estimates derived from personal communications with lighting officials.
0
100
200
300
400
500
600
700
2007 2010 2013 2016 2019 2022 2025
Dem
and
(milli
on u
nits
)
T5
Super T8
High Efficiency T8
Commodity Level T8
T12

26
Initially, T12s have the largest market share with commodity-level, and high-efficiency T8s have an almost equal share of the rest of the market. However, after the onset of the DOE-promulgated lighting standards in 2012, high-efficiency and super T8s gain market share while the demand for T12s and commodity-level T8s are completely phased out. By 2030, high-efficiency and super T8s have most of the market for LFLs and T5s have gained a notable share as well.
The results combining the projected phosphor rare earth content demand for CFLs and LFLs are shown in Figure 2-4. According to the models, the combined domestic demand for rare earths in CFLs nearly doubles in the immediate term and peaks before 2015. The domestic LFL rare earth demand more than doubles in this timeframe. This corresponds to a short- to medium-term tight supply situation for the heavy rare earths used in these phosphors—europium, terbium and yttrium. U.S. lighting demand accounts for a significant share of the global market, so this U.S. demand peak would cause a noticeable peak in global phosphor demand.10
Furthermore, the projected peak in U.S. CFL demand corresponds to a projected rapid increase in global CFL demand (as other countries phase in energy efficient lighting standards)(IEA 2010b), suggesting a rapidly tightening global market for rare earth phosphors. There has already been some indication of tightening demand leading to higher prices. Several lighting manufacturers have introduced rare earth surcharges this year (GE 2011; Sylvania, 2011). Note that the corresponding element-by-element demand will depend on the proprietary phosphor formulations, which vary, to some extent, among manufacturers. Further element-by-element phosphors discussion is in Chapter 4.
Figure 2-4. Projected Rare Earth Oxide Content in Domestic Shipments of CFLs and LFLs11
While consumer LED bulbs are being designed to fit directly into existing light sockets, retrofits into LFL lighting fixtures are complicated by differences in bulb dimensions, fixture design and lighting characteristics. It is likely that LEDs will be used for new commercial construction at a much higher rate than in retrofitting existing buildings unless LED technologies are developed that can be easily retrofit
10 Lighting industry representatives have indicated that the U.S. share of lighting demand is historically about 20%. The extent to which this relationship holds for rare earths in phosphors depends on the efficiency levels of CFLs and LFLs sold in other countries, and is discussed further in Chapter 4 and Appendix B. 11 Based on assumptions described in Chapter 4 and Appendix B.
0
500
1000
1500
2000
2500
3000
2007 2010 2013 2016 2019 2022 2025
Tonn
es CFL plus LFL
CFL
LFL

27
into existing LFL fixtures. New buildings could be designed with the unique characteristics of LED lighting in mind.
Despite the barriers to transitioning from LFLs to LEDs, even a limited transition could still have an impact on rare earth demand. This potential is illustrated by the emerging technology scenario within the lamp shipments analysis model used for the 2009 NIA of U.S. lighting standards. The model can be run with and without accelerated adoption and deployment of emerging technologies (such as LEDs), which use much lower levels of rare earth phosphors.12 Under the emerging technologies scenario, some of the demand for LFLs is offset by LEDs, which results in lower rare earth phosphor demand. A comparison of domestic demand for rare earths in LFL phosphors under the two scenarios is shown in Figure 2-5. The demand under the two scenarios is almost identical in the short term, but by 2025 the rare earth demand under the emerging technologies scenarios is about 13.5% less than the original projection. 13
This difference highlights the impact of technology transitions on material demand over time.
Figure 2-5. Comparison of Domestic Rare Earth Oxide Demand from LFL Phosphors under Different Assumptions for Emerging Technology Market Penetration
Material Supply Chain and Implications Figure 2-6 shows the supply chain for phosphors in CFLs and LFLs. China currently consumes 80% of the world’s lighting phosphor supply to produce components for major lighting manufacturers, although it subsequently exports the majority of these components for sale worldwide. The location of the lamp manufacturing process (which includes the production of glass tubes, coating with phosphors and assembly of bulb components) is driven by the labor and transportation costs of different types of bulbs, as well as by local government manufacturing incentives.
12 For a detailed description of the model, see http://www1.eere.energy.gov/buildings/appliance_standards/residential/incandescent_lamps_standards_final_rule_tsd.html. 13 LED bulbs may still use varying amounts of critical materials, though in much smaller quantities than fluorescent bulbs.
0
500
1000
1500
2000
2500
Tonn
es NIA model without emerging
technologies
NIA model with emerging technologies

28
Figure 2-6. Phosphor Supply Chain
At present, CFLs are manufactured almost exclusively in China and distributed by major lighting manufacturers for sale worldwide. LFLs are primarily assembled in plants in North America and Europe that are closer to the ultimate points of sale. This arrangement exists because it is much cheaper to ship the raw materials than the LFL bulbs, whose volume consists mostly of air inside the fragile lighting tubes. This means that in a tight supply situation with increasing demand for the heavy rare earths contained in phosphors, domestic LFL manufacturers may have difficulty obtaining rare earth phosphors.
Regardless of manufacturing and assembly location, major U.S. lighting manufacturers continue to hold the intellectual property rights to formulas for the fluorescent lighting phosphors and invest significantly in R&D related to lighting manufacturing. This allows U.S. firms to retain control of the value chain, despite the large role of Chinese firms in the manufacturing process.
While phosphors and component REEs are not currently recovered from fluorescent bulbs, the current relatively tight supply of terbium, europium and yttrium provides particular incentive to scale-up recycling capabilities. For example, Rhodia has announced an intention to begin recycling phosphors using hydrometallurgic and pyrometallurgic processes (Walter 2011).
2.4 Other Technologies Analyzed The following sections briefly describe the use of key materials in three other technologies likely to see wide-scale commercialization and deployment in the short to medium term—photovoltaic cells, vehicle batteries and electric bicycles. Key material usage considerations in these technologies are incorporated into the global supply projections in Chapter 4.
Photovoltaic Cells Thin-film PV cells use the key materials gallium, indium and tellurium. While conventional crystalline silicon-based cells remain the dominant PV technology, accounting for nearly 90% of the total global PV

29
market in 2011 (NREL 2011), thin-film market share has grown due to several advantages relative to traditional crystalline silicon “thick films.” Thin films require less functional material, they can be manufactured in continuous rolls or sheets and they can be deposited on flexible substrates. The two thin-film technologies considered in this Strategy are cadmium telluride (CdTe) and copper-indium gallium diselenide (CIGS). As of 2011, CdTe accounted for roughly 10% of the total solar PV market, while CIGS market share was still closer to 1% of the market.14
Increased material efficiency in thin films is likely to be achieved through reductions in film thickness, cutting down on manufacturing processing loss and increasing cell efficiency in generating power. Additionally, future CIGS configurations may use a significantly lower weight percentage of indium (the most expensive of the three key PV materials considered), although this reduction may come at the expense of higher gallium content.
While CdTe is currently the more established technology, CIGS technologies show promise of high conversion efficiency and flexibility in application on different surfaces. A German research initiative achieved a record 20.3% efficiency for its CIGS thin-film solar cell (Stuart 2010).
15
While PV designs and manufacturing processes continue to improve, rapidly falling prices for silicon in the past year have also lowered manufacturing costs for traditional silicon PV systems, making them more competitive with CIGS and CdTe thin films. Silicon spot prices fell from $75/kg in early 2011 to $45/kg by mid-October, with projections of prices falling even lower in 2012 (Stuart 2011). Price drops have been due in part to lower global demand for PV installations, so prices may recover in the future if demand improves. The impact of cheaper silicon systems on the longer-term prospects for CIGS and CdTe remains to be seen. To account for this uncertainty, demand projections for thin-film PVs in Chapter 4 allow for a wide variance over time in the potential for thin-films’ share of the total PV market.
Material content assumptions for PV have been updated to reflect recent advances in material efficiency and more optimistic assumptions for future improvements.
Vehicle Batteries Batteries are a key component in vehicle applications—HEVs, PHEVs and AEVs16
14 Personal communication between the U.S. Department of Energy and National Renewable Energy Laboratory staff, August 2011.
all require batteries to store energy for vehicle propulsion. Current-generation HEVs primarily use nickel metal hydride (NiMH) batteries while lithium-ion (Li-ion) batteries are generally used for PHEVs and AEVs to meet requirements for greater storage capacity and higher power ratings (National Research Council 2010). The demand for lithium, cobalt, nickel and other materials associated with Li-ion battery chemistries will likely grow substantially with the wide-scale deployment of AEVs and PHEVs. HEV manufacturers are also expected to transition to Li-ion batteries as the technology becomes cheaper and more mature. For example, Hyundai has already incorporated lithium polymer batteries into its Hyundai Sonata Hybrid.
15 Ibid. 16 HEVs rely on an internal combustion engine as the primary power source, but use a battery to help collect energy captured during vehicle braking and deceleration. PHEVs generally incorporate a higher-capacity battery than HEVs, which can be recharged externally and used as the primary power source for longer durations and at higher speeds than is required for an HEV. AEVs use the battery as the sole power source.

30
The most common NiMH chemistries use a cathode material designated as AB5. “A” is typically rare earth mischmetal containing lanthanum, cerium, neodymium and praseodymium; while “B” is a combination of nickel, cobalt, manganese and/or aluminum (Kopera 2004). A current-generation hybrid vehicle battery is estimated to contain several kilograms of REE material.
Li-ion batteries do not use rare earths, but they may use key materials such cobalt, nickel or manganese in addition to lithium. Li-ion batteries that show promise for electric drive vehicle applications typically use graphite as the anode and some form of lithium salt in both the cathode and electrolyte solution. Key material content per vehicle battery varies widely depending on manufacturer design choices. Researchers from Argonne National Laboratory have estimated that a battery capable of providing 100 miles of range for an AEV would contain between 3.4 and 12.7 kg of lithium, depending on the battery formulation and storage capacity required (Gaines and Nelson 2010). Detailed calculations on material content are given in Appendix B.
Electric Two-Wheeled Vehicles Electric bicycles and other electric two-wheeled vehicles use PM motors and batteries in a manner similar to AEVs and PHEVs. While not a clean energy technology, per se, these vehicles have emerged as an important part of the transportation picture, particularly in developing countries such as China. The motor size, battery size and key material content per bicycle are very small compared to electric drive automobiles, but electric bicycle sales are sold in much greater numbers. The motor size in a typical electric bicycle is less than 1 kilowatt (kW), compared to a 55 kW traction motor in a Toyota Prius. The International Energy Agency (IEA) projects a global electric two-wheeled vehicle stock of 44 million in 2010, growing to 76 million by 2015 and 101 million by 2020 (IEA 2010a). IEA’s numbers also include larger electric two-wheeled vehicles that serve as alternatives to scooters and motorcycles, but these vehicles represent a tiny fraction of the marketplace. Although high-end designs are rapidly incorporating Li-ion batteries, the vast majority of electric bicycles still use lead-acid batteries. Demand for neodymium-iron-boron magnet electric bicycle motors is included in the demand projections for neodymium and dysprosium (electric bicycles were not included in the clean energy demand projections in the 2010 Critical Materials Strategy).
2.5 Emerging and Notable Technologies Several other clean energy technologies may contribute significantly to key material demand in the longer term. These technologies are described below and may be considered for further analysis in future revisions to this report.
Grid Storage Batteries Grid storage batteries may play an essential role in clean energy generation and distribution by storing energy that is generated in excess of current demand for later use. This grid storage capability is particularly important for wind and solar power electricity generation, where generation capacity fluctuates with the available resource. These applications could employ battery technologies that are more easily scaled-up in size for large capacity storage requirements than Li-ion or NiMH. The DOE Office of Electricity Delivery and Energy Reliability is investing in large-scale, battery-based grid storage demonstrations, including Li-ion, sodium-sulfur, lead-carbon and iron-chromium technologies.

31
Vanadium redox batteries, which operate via the flow of vanadium electrolyte through a battery stack, have also been cited as a promising grid storage technology. Although limited in temperature range, these batteries are highly efficient, have low self-discharge and can have their storage capacity scaled-up indefinitely by increasing the amount of vanadium in external storage tanks (Science Daily 2011).
Fuel Cells Fuel cells are a promising clean energy technology for vehicle propulsion, auxiliary power and distributed power generation. REEs are used in several different fuel cell chemistries. In particular, solid oxide fuel cells (SOFCs) for distributed power generation commonly use yttrium in their electrolyte, and may also use lanthanum, cerium nickel and cobalt in other components. The National Energy Technology Laboratory (NETL) estimates that commonly used SOFC designs may require 21 grams of yttria (i.e., yttrium oxide) per kilowatt of fuel call capacity, translating into less than 0.5% of current yttrium production at 4 gigawatts per year of new capacity (J. Thijssen, LLC 2011). Other stationary distributed power fuel cell systems, such as molten carbonate and phosphoric acid, are commercially established but do not require REEs in their designs. Fuel cell vehicles typically use polymer electrolyte membrane fuel cells, which rely on non-REE materials such as platinum.
Nuclear Power Nuclear power technologies use some of the key materials analyzed. Gadolinium, an REE, is used in nuclear fuel bundles. Reactor control rods incorporate cobalt, indium and several heavy rare earths. However, the nuclear industry’s share of total rare earth demand is currently small, and is not projected to grow significantly in the short- to medium-term, in part because of uncertain demand for nuclear power in some countries. Germany, for example, has announced a complete phaseout of nuclear power. Japan has significantly scaled back plans for nuclear power in the wake of the Fukushima tragedy. Nevertheless, many other countries—including, in particular, China—have continued plans for increased use of nuclear power. The United States is strongly committed to nuclear power, which currently provides roughly 20% of domestic electricity (Elliot 2011).
Magnetic Refrigeration Magnetic refrigeration shows great promise for improving the energy efficiency of the refrigeration process using rare earth PMs. Some experts believe this technology could capture a significant share of the refrigeration market in the medium term if commercialized. However, magnetic refrigeration was not included in the clean energy material demand projections (see Chapter 4) due to uncertainties about the timeline for commercialization, projected demand and material intensity of the commercial products.
Catalytic Converters Automotive catalytic converters use cerium to facilitate the oxidation of carbon monoxide (CO), helping to significantly reduce vehicle CO emissions. While the amount of cerium required per vehicle is very small, catalytic converters are used in practically every passenger vehicle and accounted for approximately 9% of total U.S. rare earth use in 2008. The demand for cerium in catalytic converters will continue to grow with increasing global automobile deployment and the continuing need for replacement vehicles. IEA projects that vehicle stock increases will level off in the medium term, with
32
average stock addition rates falling from more than 5% per year from 2000–2010 to less than 2% per year by 2025 (IEA 2010a), although demand for replacement vehicles will remain strong.17
Gas Turbines
Fortunately, cerium is the most abundant rare earth, with significantly increased supplies anticipated in both the short and medium terms (see Chapter 4).
Gas turbines for stationary power generation use yttrium for thermal barrier coatings of turbine blades. Yttrium is also used in lesser amounts in bond coatings, high-temperature overlay coatings, substrates and structural supports. These coatings are applied during initial manufacture then reapplied periodically during an average 30-year turbine life. The National Energy Technology Laboratory (NETL) conducted a study to estimate yttrium requirements for the existing U.S. fleet of 4,291 turbines and for an estimated 450 new turbines that will be required from 2012–2035 to meet U.S. Energy Information Administration forecasts for new generation capacity. The study concluded that the existing turbine fleet required approximately 150 tons of yttrium for initial installation and another 3,350 tons for refurbishments over the life of the fleet. The new turbines would require an additional 1.3–1.7 tons for initial installation and 30–40 tons for additional refurbishments, depending on the mix of turbine sizes used to meet forecast generation capacity requirements. Averaged out over a 30-year life, this translates into about 118 tons (107 tonnes) per year—about 1% of 2010 global production. Based on this analysis, the U.S. demand for yttrium in gas turbines is not expected to be a significant driver of global demand. However, expansions in global power generation capacity could have a greater impact on demand in future years.
Vehicle Lightweighting Reducing vehicle weight can provide significant fuel economy gains. For an average vehicle, reducing weight by 22.5 kg is estimated to improve fuel economy by about 1% (Pollock 2010). Manufacturers are expected to increasingly use lighter-weight materials such as magnesium, aluminum or plastic in place of steel in automobile components, provided these materials do not sacrifice vehicle safety. This may lead to increased demand for magnesium, which is the lightest of all engineering metals (Kulekci 2008). It is already used by various manufacturers in a variety of automotive applications, including engine blocks, cylinders, steering systems, wheel rims, clutches and transmission cases. However, additional research will be required to overcome challenges associated with magnesium’s relatively low melting point and high reactivity with air and water (Kulekci 2008).
Table 2-4 illustrates the use of some key materials and other potentially new critical materials described in the emerging technologies sections above. These potentially new critical materials are referred to as “materials to watch,” and are discussed briefly in Chapter 4.
17 Underlying data from the International Energy Agency (IEA) (2010a) provided via personal communication between U.S. Department of Energy staff and IEA staff on August 31, 2011.

33
Table 2-4. Additional Technologies and Materials to Watch

34
References Albemarle Catalyst Courier. 2011b. 79. http://www.albemarle.com/_filelib/FileCabinet/Literature_Library/Catalysts_Literature/Catalysts/Courier/Catalysts_Courier_79.pdf.
Albemarle Catalyst Courier. 2011. “Driving Down SOx Mitigation Costs.” 79: 14. http://www.albemarle.com/_filelib/FileCabinet/Literature_Library/Catalysts_Literature/Catalysts/Courier/Catalysts_Courier_79.pdf.
AMSC (American Superconductor). 2011. “SeaTitan 10MW Wind Turbine Data Sheet.” Devens, MA: AMSC. http://www.amsc.com/documents/displaypdf.php?id=7516.
Boulder Wind. 2011. “Boulder Wind Power Awarded Next Generation Drivetrain Grant by U.S. Department of Energy.” Boulder, CO: July 1. http://www.boulderwindpower.com/news-press/Press-Release-DOE.
Constanides, Steven. 2011. “Rare Earth Materials Update.” Presentation at the Spring 2011 Management Conference, submitted as part of Arnold Magnetics response to DOE Request for Information, May 10.
DOE (U.S. Department of Energy). 2009. Buildings Energy Data Book. Washington, DC: DOE. http://buildingsdatabook.eren.doe.gov/Default.aspx.
DOE (U.S. Department of Energy). 2010. Energy Star CFL Market Profile: Data Trends and Market Insights. Silver Spring, MD: D&R International.
DOE (U.S. Department of Energy). 2011a. “General Service Incandescent Lamp Provisions Contained in EISA 2007.” Washington, DC: DOE.
DOE (U.S. Department of Energy). 2011b. “General Service Fluorescent Lamps.” Washington, DC: DOE.
EIA (U.S. Energy Information Administration). 2010. Model Documentation Report: Residential Sector Demand Module of the National Energy Modeling System. Washington, DC: EIA. http://www.eia.gov/FTPROOT/modeldoc/m067(2010).pdf.
Elliot, Dave. 2011. “Nuclear Power After Fukushima: Facts and Figures.” SciDev.net, September 28. http://www.scidev.net/en/climate-change-and-energy/nuclear-power-after-fukushima/features/nuclear-power-after-fukushima-facts-and-figures-1.html.
Gaines, L., and P. Nelson. 2010. Lithium-Ion Batteries: Examining Material Demand and Recycling Issues. Argonne, IL: Argonne National Laboratory.
GE (General Electric). 2010. “Response to DOE Request for Information.”
GE (General Electric). 2011. “Response to DOE Request for Information.”
35
Hu, Bo-Ping. 2010. “China’s Rare-Earth Permanent Magnet Industry.” Presentation at ICRE 2010.
IEA (International Energy Agency). 2010a. Energy Technology Perspectives 2010. Paris: IEA.
IEA (International Energy Agency). 2010b. Phase Out of Incandescent Lamps. Paris: IEA.
J. Thijssen, LLC. 2011. Solid Oxide Fuel Cells and Critical Materials: A Review of Implications, NETL Report #R102 06 04D1. Prepared by J. Thijssen, LLC, Redmond, WA. Bannock, OH: Leonard Technologies, May 11. http://www.netl.doe.gov/technologies/coalpower/fuelcells/publications/Rare%20Earth%20Update%20for%20RFI%20110523final.pdf.
Kopera, J. 2004. “Inside the Nickel Metal Hydride Battery.” Orion, MI: Cobasys. http://www.cobasys.com/pdf/tutorial/InsideNimhBattery/inside_nimh_battery_technology.html.
Kulekci, M. K. 2008. “Magnesium and Its Alloys Applications in Automotive Industry.” International Journal of Advanced Manufacturing Technology, 39: 851–865.
LEDs Magazine. 2011. “Philips Wins L Prize for 60W-Replacement LED Lamps.” September. http://ledsmagazine.com/features/8/9/14.
Molycorp. 2011. “Molycorp, Daido Steel, and Mitsubishi Corporation Announce Joint Venture To Manufacture Sintered NdFeB Rare Earth Magnets.” Molycorp, November 28.
National Research Council. 2010. “Transitions to Alternative Transportation Technologies – Plug-in Hybrid Electric Vehicles.” http://www.nap.edu/catalog.php?record_id=12826.
NIMS (Japanese National Institute for Material Science). 2010. High Coercivity Neodymium Magnet Without Using Heavy Rare Earth Element Dysprosium. NIMS, August 30. http://www.nims.go.jp/eng/news/press/2010/08/p201008301.html.
NREL (National Renewable Energy Laboratory). 2011. “Silicon Materials and Devices R&D.” Accessed December 14. http://www.nrel.gov/pv/silicon_materials_devices.html.
N.V. “The Difference Engine: Nikola's Revenge.” 2011. The Economist. April 1. http://www.economist.com/blogs/babbage/2011/04/induction_motors.
Pollock, Teresa. 2010. “Weight Loss with Magnesium Alloys.” Science. 328(2010): 986–987.
Schiller, Rosann. n.d. “Optimizing Operations in a High Rare-Earth Cost World.” Grace. http://www.catcracking.com/SeminarUSA/PresentationPDFs2011/Grace_RosannSchiller_OperationsInHighRareEarthCostWorld_CatCrackingCom_May2011.pdf.
Science Daily. 2011. “Electric Grid Reliability: Increasing Energy Storage in Vanadium Redox Batteries by 70 Percent.” March 17. http://www.sciencedaily.com/releases/2011/03/110317141418.htm.

36
Stuart, Becky. 2010. “Researchers Announce New 20.3 Percent World Record CIGS Solar Cell Efficiency.” PV Magazine, August 23. http://www.pv-magazine.com/news/details/beitrag/researchers-announce-new-203-percent-world-record-cigs-solar-cell-efficiency_100000748/.
Stuart, Becky. 2011. “Solar Demand Remains Weak; Silicon Market Set for a Fall.” PV Magazine, October 14. http://www.pv-magazine.com/news/details/beitrag/solar-demand-remains-weak-silicon-market-set-for-a-fall_100004641/.
Sylvania. 2011. “Rare Earth Phosphor Crisis.” Sylvania. Accessed October 17. http://www.sylvania.com/Phosphors/.
Troedson, Anders. 2011. “Permanent Magnet Generators for Wind Turbines.” Presentation given at Metals for Energy and Environment Conference, Las Vegas, NV, June 1–3.
Walter, P. 2011. “Rhodia Recovers Rare Earths.” Society of the Chemical Industry, 3.
Watts, Mark. 2011. “Rare Earth Prices Likely to Rebound in Fourth Quarter – Dacha.” Industrial Minerals, September 14. http://www.indmin.com/Article/2900185/Rare-earth-prices-likely-to-rebound-in-fourth-quarterDacha.html.
Whoriskey, P. 2010. “Light Bulb Factory Closes; End of Era for U.S. Means More Jobs Overseas.” The Washington Post, September 8.

37
Chapter 3. Market Dynamics and Characterization This chapter describes dynamics that affect the markets for key materials. Global demand and supply shifts are altering the dynamics within these markets while presenting both challenges and opportunities to stakeholders. A number of institutions are preparing a future materials workforce to respond to growing demand. Businesses at various stages of the supply chain are adapting to market complexities: some are taking defensive measures to protect themselves from price volatility and material scarcity, while others are proactively responding to market opportunities. Many governments are also recognizing the growing importance of raw materials to economic competitiveness and taking an active role in mitigating supply risks.
3.1 Global Drivers
Demand The demand for minerals is shaped by population trends, economic growth, consumer choices and government policies. Major and base metals (including nickel, aluminum and steel) make up most of the global minerals market in terms of volume and value. In the past few decades, however, demand for many minor or specialty metals (including those analyzed in this report) has grown more rapidly than that for major or base metals (see Box 3-1 for a discussion on major vs. minor metals). In part, this is due to increasing demand for consumer products, such as cellular phones, computers and flat-panel televisions. It is also partly due to increasing demand for clean energy technologies including electric vehicles, photovoltaic (PV) cells, wind turbines and energy-efficient lighting. Global demand for both consumer products and clean energy technologies will likely continue to grow, driving competition for materials.
Population Trends In general, an increasing population demands more materials to meet basic housing and transportation needs. The global population increased by more than 50% between 1980 and 2010, averaging 2% annual growth from 1980 to 1992 and 1% annual growth from 1993 to 2010 (United Nations 2010).18 The global middle class drives global demand and is projected to triple by 2030, reaching 2 billion people (World Economic Forum 2009).19
18 Medium scenario of the United Nations, Department of Economic and Social Affairs, Population Division. 19 The middle class is projected to grow the most in the Asia-Pacific region, totaling 54% of the global middle class by 2020. For more information on the development of the global middle class, see Kharas (2010).

38
Box 3-1. Major vs. Minor Metals
Major metals are those that have the highest consumption by value and volume. Minor metals are small in terms of market size, although the unit value of the metal may be high.
From 1980 to 2009, global demand for most of the key materials in this report grew at higher rates than demand for major metals such as steel. Indium consumption rose by 1,000% (Figure 3-1) in this period. Demand for rare earths and gallium quadrupled. Demand for lithium tripled. The demand for these minor metals grew at or above the rate of global GDP growth. During this same period, cobalt and nickel had growth rates comparable to the growth rate of steel. (Historical data for tellurium and manganese dioxide were unavailable.)
Economic growth is a driver of demand for minor metals. However, a minor metal may have a particular application in a fast-growing industry that has momentum quite separate from the mainstream economy (World Finances 2011). Specialty or minor metals used in mobile phones in the late 1990s and in phosphors (lighting) in recent years are two examples.
Figure 3-1. Comparison of Global Demand for Select Materials 1980–2009 (1980=100)*
(Source: USGS 2010). * Production data are used to proxy for global demand numbers, which are not available.
0
200
400
600
800
1000
1200
1400
1980 1982 1984 1986 1988 1990 1992 1994 1996 1998 2000 2002 2004 2006 2008
Glob
al p
rodu
ctio
n re
lativ
e to
198
0
Indium LithiumCobalt REENickel Iron & steelGallium

39
Economic Growth Global gross domestic product (GDP) in purchasing power parity (PPP) terms grew by 271% between 1980 and 2010, at an average annual rate of 3.4% (IMF 2011).20
Per capita GDP in PPP increased by more than 175% from 1980 to 2010, at an average annual rate of 1.9% (IMF 2011) (see Figure 3-2). A set of emerging economies that have witnessed the fastest economic growth in recent decades has driven global demand (see Table 3-1), particularly China and India (IOL 2011; CME Group 2011; The Hindu 2011).
Figure 3-2. Global Gross Domestic Product (GDP) and GDP Per Capita in Purchasing-power Parity Terms (1980–2010)
(Source: IMF 2011)
Table 3-1. Real Historical and Projected GDP Growth by Region (compound average annual growth rates)
1980–1990 1990–2008 2008–2020 2020–2035 OECD 3.0% 2.5% 1.8% 1.9%
United States 3.2% 2.8% 2.0% 2.1% Europe 2.4% 2.2% 1.5% 1.8% Japan 3.9% 1.2% 1.0% 1.0%
Non-OECD 3.3% 4.7% 6.7% 3.8% Brazil 1.5% 3.0% 3.6% 3.1% Russia N/A 0.6% 2.9% 3.1% India 5.6% 6.4% 7.4% 5.6% China 9.0% 10.0% 7.9% 3.9%
(Sources: IEA 2010; IMF 2011) 20 The PPP exchange rate allows currency conversion at the rate which the currency of one country would have to be converted into that of another country to buy the same amount of goods and services in each country. This is the approach used by the International Monetary Fund, whose GDP projections are used by the International Energy Agency.
0
2000
4000
6000
8000
10000
12000
0
10
20
30
40
50
60
70
80
Trill
ion
inte
rnat
iona
l dol
lars
(20
10)
GDP GDP per capita
Inte
rnat
iona
ldol
lars
per
capi
ta (
2010
)
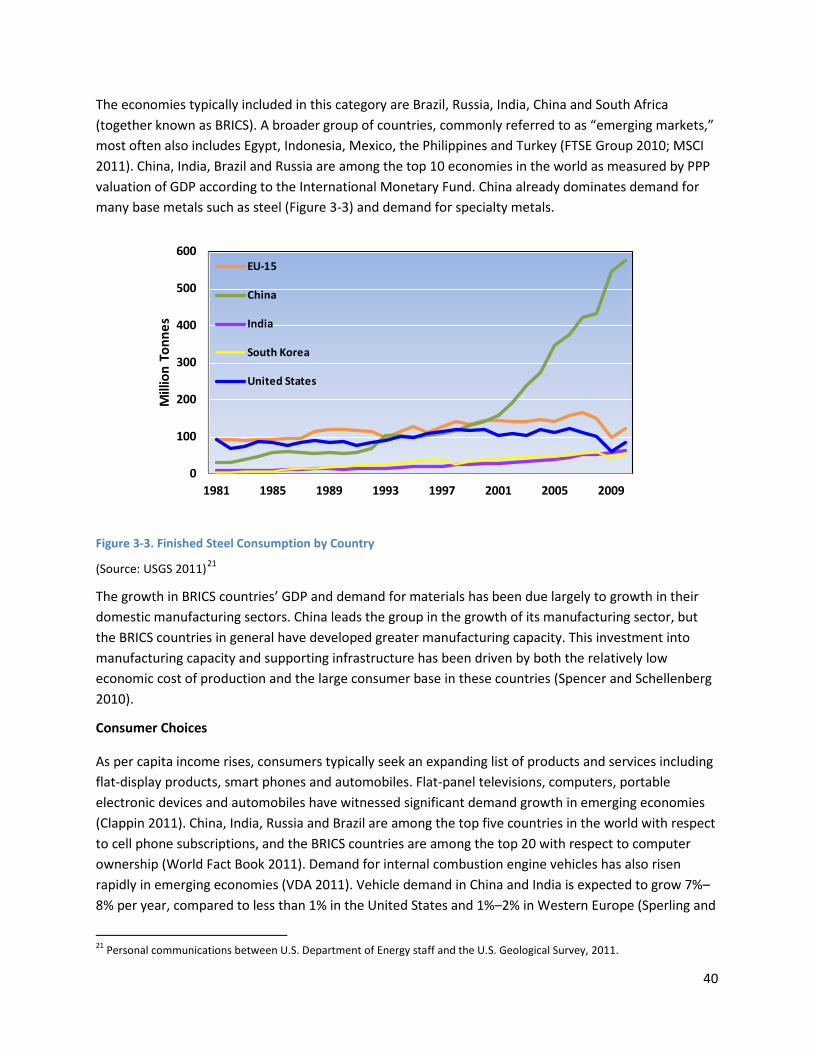
40
The economies typically included in this category are Brazil, Russia, India, China and South Africa (together known as BRICS). A broader group of countries, commonly referred to as “emerging markets,” most often also includes Egypt, Indonesia, Mexico, the Philippines and Turkey (FTSE Group 2010; MSCI 2011). China, India, Brazil and Russia are among the top 10 economies in the world as measured by PPP valuation of GDP according to the International Monetary Fund. China already dominates demand for many base metals such as steel (Figure 3-3) and demand for specialty metals.
Figure 3-3. Finished Steel Consumption by Country
(Source: USGS 2011)21
The growth in BRICS countries’ GDP and demand for materials has been due largely to growth in their domestic manufacturing sectors. China leads the group in the growth of its manufacturing sector, but the BRICS countries in general have developed greater manufacturing capacity. This investment into manufacturing capacity and supporting infrastructure has been driven by both the relatively low economic cost of production and the large consumer base in these countries (Spencer and Schellenberg 2010).
Consumer Choices
As per capita income rises, consumers typically seek an expanding list of products and services including flat-display products, smart phones and automobiles. Flat-panel televisions, computers, portable electronic devices and automobiles have witnessed significant demand growth in emerging economies (Clappin 2011). China, India, Russia and Brazil are among the top five countries in the world with respect to cell phone subscriptions, and the BRICS countries are among the top 20 with respect to computer ownership (World Fact Book 2011). Demand for internal combustion engine vehicles has also risen rapidly in emerging economies (VDA 2011). Vehicle demand in China and India is expected to grow 7%–8% per year, compared to less than 1% in the United States and 1%–2% in Western Europe (Sperling and
21 Personal communications between U.S. Department of Energy staff and the U.S. Geological Survey, 2011.
0
100
200
300
400
500
600
1981 1985 1989 1993 1997 2001 2005 2009
Mill
ion
Tonn
es
EU-15
China
India
South Korea
United States

41
Gordon 2009). The recent recession led to a temporary decline in demand across many commodities, including commodities that enter consumer products. However, for some commodities, demand rebounded as early as 2009 (Arnott 2009; Zacks Equity Research 2011).
The rise in demand for flat-panel display or liquid crystal display (LCD) products such as TVs, computer monitors and video players has led to tremendous demand growth in indium since the late 1980s. Consumer preference for greater miniaturization has resulted in increased demand for the rare earth magnets needed to make micromotors in computer disk drives and smart phones (Arnold Magnetic Technologies 2011). Demand for clean energy technologies (e.g., electric vehicles, solar energy and energy-efficient lighting), which rely heavily on certain materials, is also rising in emerging markets.
Government Policies The demand for key materials has also been largely driven by government regulation and policy. The market for the clean energy technologies that are the focus of this report is shaped by the policies of governments around the world. However, the influence of government policy extends beyond wind power, solar cells, efficient lighting and electric vehicles. For example, the automobile industry has trended toward lighter materials and lower emissions profiles to comply with government fuel efficiency and emissions regulations.22 Magnesium demand in the form of alloys has been rising, given magnesium’s favorable properties for lightweighting vehicles.23
Supply
Cerium-containing catalytic converters have been used by car manufacturers to lower vehicle emissions.
The major global supply drivers of raw materials include resource endowments, market concentration, availability of capital, government intervention and expertise. In the past decade, a combination of these factors has contributed to the slow response of supply to the rise in demand for some key materials. At the same time, high material prices have made secondary supply (e.g., recycling) more relevant to total supply. Box 3-2 discusses recycling processes and opportunities.
Resource Endowment The world is not running out of minerals. Continuous technological development and new discoveries are likely to generate additional supplies for the foreseeable future. In the event of a demand-supply mismatch or temporary scarcity, sustained high material prices or economic incentives will likely open up new reserves (Hill 2011). However, the costs of resource extraction generally have risen.24
22 Automakers have also opted for lighter materials in response to consumer demand. For the estimated material content by key material and automotive application, please refer to chapter 4.
For specialty, minor and rare metals, supply is further complicated by their production as byproducts and/or coproducts whereby material availability is influenced by the commercial attractiveness of the
23 Personal Communication between U.S. Department of Energy staff and the U.S. Geological Survey, October 2011. Since the mid-1990s, magnesium alloy for lightweighting in automobiles manufactured in North America rose from 3 to 5 lbs per automobile to 10 lbs, making automotive manufacturing a major magnesium demand driver in the United States. U.S. magnesium demand forms a significant portion of global demand. 24 For many materials, particularly major and base metals, the “low hanging fruit” has likely been picked. Mining projects are increasingly tapping deeper, more remote and lower-grade ores, which requires processing more rock to produce the same quantity of raw material. Some mining companies are also developing smaller deposits that have less potential for economies of scale. Rising energy prices are another contributor to the rising cost of mineral development worldwide (Humphreys 2011).

42
Box 3-2. Recycling Process and Opportunities
Recycling is one method of boosting supply and reducing the criticality of key materials. The historical end-of-life recycling rate for the majority of materials discussed in this report is less than 1% (manganese and nickel are the exceptions)(UNEP 2011). This presents a significant opportunity to advance recycling efforts and achieve a secondary supply of key materials. Other benefits of recycling include reducing the environmental impacts of increased mining and minimizing the impacts of waste and toxins entering landfills. Factors that influence the viability of recycling are: availability of material; technology, infrastructure, logistics; and economics.
Availability of Material. Materials must be available in sufficient quantity and at optimum times to be recycled effectively. Consumer electronics are currently retiring in large numbers, but have low concentrations of key materials. Wind turbines can contain several hundred kilograms of rare earth materials, yet will have a lifetime of 20–30 years before recovery can occur.
Technology, Infrastructure, Logistics. Processing technology and infrastructure is necessary for wide-spread recycling of products containing critical materials. Significant R&D investment and capital may be required to develop processing technologies and collection infrastructure.
Economics. The economics of recycling are often transient – potential material price swings, government mandates and changes in technology demands can all influence the long-term economic viability of recycling. Collection, transportation, characterization, sorting, separation, purification and other processing all contribute to the cost of recycling. In many instances, costs can be reduced by combining with existing recycling logistics or processes.
There are two major categories of recycling that need to be considered: reducing manufacturing loss through reusing scrap materials and end-of-life recycling for consumer and commercial products.
In reducing manufacturing losses, an opportunity is present in magnet manufacturing, where an estimated 30% of magnetic material is lost during the machining process. While some companies are recycling the swarf and sludge from machining loss, there are opportunities to further increase this recovery rate.
Phosphors are an attractive target for end-of-life recycling for consumer and commercial products. Up to 30% of spent fluorescent bulbs are currently recycled to remove mercury. However, most rare earth-containing phosphors from spent bulbs end up in landfills. While processing technology to refine recovered phosphors from spent lighting needs to be developed, the collection and recycling infrastructure already in place represents a significant advantage.

43
associated major product. Indium, tellurium and gallium, for example, are byproducts whose supply can be limited by their concentrations found in the primary product ore, limitations in refining capacity for the byproduct among primary product refiners, and the dynamics of the primary product market. Rare earth elements, on the other hand, can be both coproducts and byproducts. REEs are often mined together (that is, coproduced) because they are usually found together in mineral deposits. REE production may also be a byproduct of mining another ore, such as iron.
Market Concentration The concentration of supply in a small number of mines, companies or countries adds to supply risks. Relative to base or major metals, specialty metals and rare earths tend to be produced by a small number of producers and therefore have higher supply risks. In a highly concentrated market, disasters (natural or manmade) or labor strikes impacting a major supplier can lead to a global supply shock. A resource-rich country that is politically unstable also adds significant uncertainty to global supply.
Greater market concentration also implies that a large producer or group of producers can more readily exercise market power. For example, a large producer might lower its asking price relative to that of its competitors to gain market share. The impact of this on consumers could be positive in the short term. However, the resulting reduction in competition could enable a large producer or group of producers to later engage in production quotas and/or export quotas to drive up the price in order to capture higher revenues at the expense of the consumer.
Availability of Capital Additional mining and processing capacities in some cases also require the development of accompanying infrastructure (e.g., transportation, energy and water), which requires additional capital investment.25 This adds to the capital requirements of mining and processing projects, which are already inherently capital intensive.26
Greater price volatility and lower market transparency associated with minor and specialty metals raise the financial risks of mining for multiple key materials. Higher price volatility relative to major or base metals is due to a smaller market which, along with contract-based transactions (as opposed to voluminous trades in the open market), contributes to price volatility and less transparent pricing. These financial risks can make it harder to secure capital.
As capital requirements per unit of production have increased, the availability of capital has decreased. The 2001 and 2008 recessions reduced access to financing, contributing to further delays in mining and processing capacity expansions. Cobalt, nickel, manganese and rare earths (outside China) all experienced such delays due to the 2001 and 2008 recessions.
25 The inadequacy or lack of infrastructure for mining can be due to the geographical remoteness or shortages of power and water; examples include the power shortage concerns in southern Africa and Chile and growing water scarcity impacting mining in various countries (Humphreys 2011). 26 For the specialty and rare metals, access to financing is important because large and well-capitalized miners are seldom investors in specialty and rare metals given their relatively small market sizes, among other reasons (see Section 3.2 for a more in-depth discussion).

44
Government Intervention Government intervention can affect supply through taxes, subsidies, quotas, trade measures, regulations and R&D support. Taxation policies can be applied to resource extraction to ensure that resources are not depleted too rapidly. They can also help to shape industrial development according to a government’s priorities. Trade measures provide another means for the government to shape the development of its industries.
Governments also regulate resource extraction to ensure environmentally sound, sustainable and socially acceptable practices. In many countries, much of mining-related permitting is for regulating the risk of toxic wastes coming into contact with surrounding communities. Hence, environmentally friendlier mining and processing projects may go through a more straightforward permitting process because they lower the environmental and ecological risk to the surrounding communities and ecologies.
Expertise For rare earths and some specialty metals, the multiple processing steps can be technically challenging and require material-specific expertise. In general, mining and metal processing expertise has gradually declined in countries of the Organisation for Economic Co-operation and Development, although the need to develop and retain such expertise has received increasing attention in recent years (Gschneidner 2011).
Investments in technological innovations through R&D support can lead to new expertise that can enhance supply in the following ways: by lowering costs, by increasing efficiency and/or by enhancing environmental performance. An example is Simbol Materials' process of extracting lithium from the brine water of the Salton Sea in the Imperial Valley of California (PRNewswire 2011). Here the lithium is extracted from the same water pumped by an existing geothermal power plant for power generation, and the lithium is extracted through a technology that is 93% efficient or leaves little lithium behind (Wald 2011). Another example is the development of recycling and treatment technologies at Molycorp Inc.’s Mountain Pass mine, which as a result consumes less than 30 gallons of water per minute (gpm) per ton of material processed as opposed to the initial 850 gpm.27
Price
Section 3.3 in this chapter elaborates further on the human capital needed in the United States to rebuild a rare earth supply chain.
There are a variety of factors driving commodity prices and users’ responses to price changes (price increases in particular). The historical price trends for rare earths, lithium, gallium, indium and tellurium illustrate the factors that drive price movements.
Drivers of Prices and Responses The price of minerals in the short to medium term is mainly driven by the supply-demand balance and certain financial factors.
27 “Rare Earth Minerals and 21st Century Industry,” Before the House Science and Technology Committee Subcommittee on Investigations and Oversight (March 16, 2011) (written testimony of Mark A. Smith Chief Executive Officer, Molycorp Minerals, LLC), http://gop.science.house.gov/Media/hearings/oversight10/mar16/Smith.pdf.

45
Generally, when demand outstrips supply, miners and processors typically seek capacity expansion (for mining and/or refining) to increase supply. However, during the recent recession, lower demand led to a buildup of inventory. The release of supply from the inventory may have contributed to keeping prices low, additionally delaying capacity expansion.
Financial factors most relevant in the short to medium term are exchange rates and commodity speculation. The decline in the U.S. dollar in recent years has contributed to higher metal prices because most mineral markets are priced in dollars. Some analysts have suggested that speculation and hoarding have contributed to price volatility and excessively high and low price levels for some key materials discussed (Hook 2011a; Barry 2011).
Rising material prices can lead to reductions in demand for the material in certain products. The impact of a material price increase on demand depends on the sensitivity of the demand to price changes (price elasticity of demand). The price elasticity of demand depends on the chief factors of material substitutability, the sensitivity of the product’s cost to the cost of the material and the competitiveness of the product market.
In the face of continuously rising rare earth prices, some manufacturers have more recently begun to pass the price increase on to downstream purchasers. For example, in the case of lighting manufacturers, rare earth phosphors are becoming an increasingly larger portion of the finished lamp’s variable cost. Some manufacturers have raised the prices of their fluorescent lamps (Osram Sylvania 2011; GE 2011a). In the case of fluid catalytic cracking (FCC) catalyst makers, increasing rare earth oxide (REO) prices pushed up FCC catalyst costs due to inelastic demand of FCC catalysts by oil refiners. Catalyst makers such as W.R. Grace have been able to pass on the rising costs of catalyst production (W.R. Grace & Co. 2010; Cronin 2011; Metal-Pages 2011). The catalyst makers are also engaging in more efficient use of materials to reduce costs (see section 2.4).
In addition to more efficient use of virgin materials, sustained high prices for some of the materials have also led to enhanced recovery from secondary sources (scrap, recycled materials and tailings), the switch to lower-performing alternatives and a more intensive search for long-term substitutes. Sustained high prices have therefore caused some permanent decline in demand. Some manufacturers have engaged in R&D efforts and overall systems design to improve resource utilization. For example, General Electric (GE) has a five-point strategy for materials management (GE 2011b). Other companies have also expanded utilization of resources across the periodic table to enhance their ability to deliver supply and produce products.28
Historical Price Trends
Figures 3-4 and 3-5 show the average prices of individual rare earth metals between April 2001 and early November 2011.29
28 Section 3.4 provides a discussion of business strategies adopted by various companies in response to the supply dynamics of rare earth elements, while section 3.5 highlights relevant international government strategies to ensure a stable supply.
A clear distinction between the heavy rare earths (dysprosium, terbium, europium and yttrium) and the lighter rare earths (lanthanum, cerium, neodymium, praseodymium and samarium) is that the heavy rare earths are consistently priced higher due to scarcer global supply. In general,
29 Rare earth metal and rare earth oxide prices track closely, with the prices for metals always higher (though relatively more so for some rare earth elements than others) (British Geological Survey 2010).

46
prices rose modestly from 2003–2008, followed by steep increases from 2009–2011. Price increases during the earlier period were mostly due to increasing global demand. The price jumps during 2009–2010 were due to falling Chinese exports, although the heavy rare earths experienced less of a price impact.30
Figure 3-4. Light Rare Earth Metal Prices 99% Minimum Free on Board China, January 2001 to December 2010
(Source: Metal-Pages.com, accessed November 2011)
Figure 3-5. Heavy Rare Earth Metal Prices 99% Minimum Free on Board China, January 2001 to December 2010
(Source: Metal-Pages.com 2011)
30 The price jumps in this period can be attributed to a reduction in China’s rare earth export quota which was for total rare earth exports. For a more details, see section 3.2 on China.
0
20
40
60
80
100
120
U.S
. dol
lars
per
Kg
(nom
inal
)
La
Ce
Nd
Pr
Sm
0
200
400
600
800
1000
1200
U.S
. dol
lars
per
Kg
(nom
inal
)
Dy
Tb
Eu
Y

47
Rare earth prices generally peaked in mid-2011. Some analysts have suggested that speculation and hoarding of REOs and metals contributed to both the initial price increases and subsequent decreases in 2011 due to sell-offs by the speculators (Figures 3-6 and 3-7) (Hook 2011a; Barry 2011).
Figure 3-6. 2011 Monthly Light Rare Earths Prices 99% Minimum Free on Board China
(Source: Metal-Pages 2011)
Figure 3-7. 2011 Monthly Heavy Rare Earths Prices 99% Minimum Free on Board China
(Source: Metal-Pages 2011)
0
50
100
150
200
250
300
350
400
450
500
U.S
. dol
lars
per
Kg
(nom
inal
)
La
Ce
Nd
Pr
Sm
0
1000
2000
3000
4000
5000
6000
7000
8000
U.S
. dol
lars
per
Kg
(nom
inal
)
Dy
Tb
Eu
Y

48
Comparing the 2001 level to the peak in 2011, the prices of rare earth elements experienced between four-fold and forty-nine-fold increases in current dollars, depending on the element.31
Figure 3-8 provides historical price information for lithium carbonates. In the early 1990s, the United States was the largest producer and consumer of lithium minerals and compounds worldwide.
The prices for dysprosium, samarium, terbium and yttrium seem to have reached a plateau, while the prices for other rare earth elements continue to fall.
32 Between 1995 and 2004, production shifted from the United States to South America, where production was cheaper.33
SQM of Chile gained substantial market share as a result; the price increase during 2005–2006 came in a market dominated by a small number of producers. The mid-2000s also saw severe weather affecting Argentina’s lithium production. After that, prices rose through 2009, as production was insufficient to meet rapidly growing demand. Prices started to level off and then decrease slightly by early 2008, when surplus Chinese lithium began to balance demand and supply. Lithium prices remained strong when the economic downturn hit in late 2008 and began to decrease in 2009 and early 2010, as SQM lowered its prices and other producers followed suit to some degree (USGS 1994–2010).
Figure 3-8. Price of Lithium Carbonate 1995–2010
(Source: Industrial Minerals 2011)
31 Between 2001 and July 19, 2011, the price increases of certain rare earth elements are as follows: lanthanum 3,200%, cerium 2,600%, neodymium 2,900%, praseodymium 3,100%, samarium 900%, dysprosium 4,900%, terbium 1,600%, europium 600% and yttrium 400% (Metal-Pages 2011). The prices are prices outside of China and in current, rather than constant, dollars. 32 This includes a sale by the U.S. Department of Energy of about 37,200 tonnes of excess lithium material from the thermonuclear weapons programs of the 1950s and 1960s, representing roughly 25% of global production. 33 As a result of cheaper production of lithium carbonate from lithium brine as opposed to hardrock spodumene deposits.
3000
3500
4000
4500
5000
5500
6000
6500
U.S
. dol
lars
per
Kg
(nom
inal
)
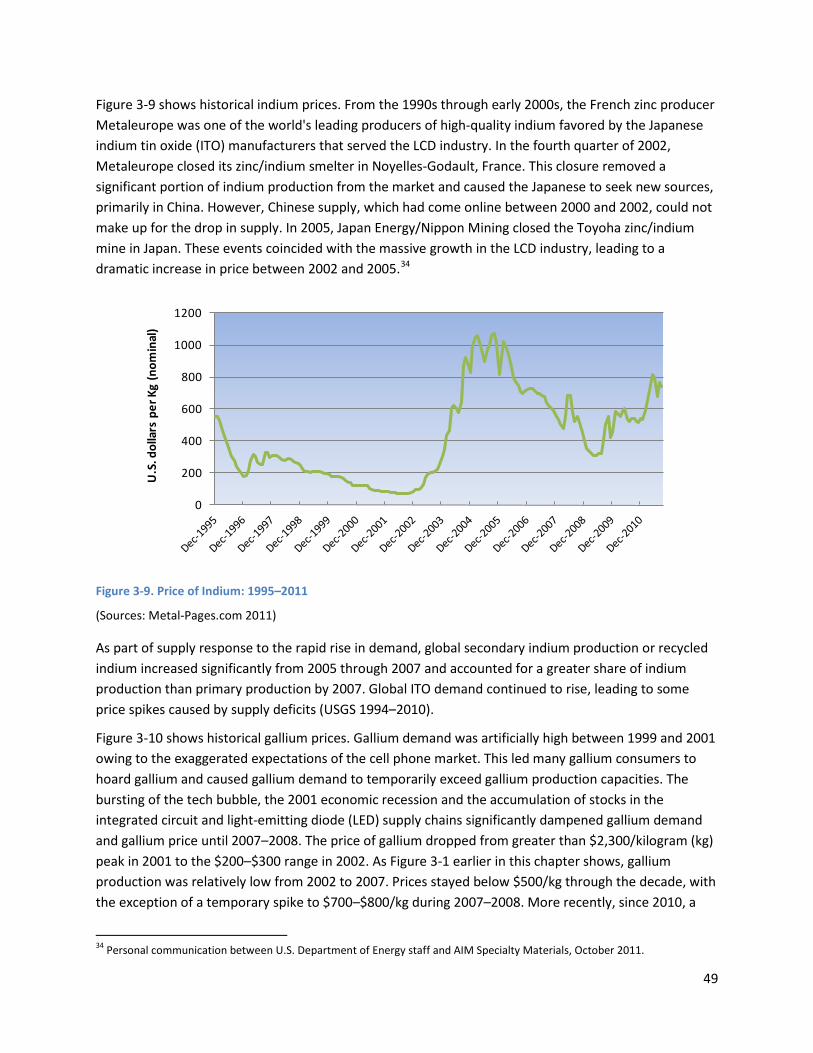
49
Figure 3-9 shows historical indium prices. From the 1990s through early 2000s, the French zinc producer Metaleurope was one of the world's leading producers of high-quality indium favored by the Japanese indium tin oxide (ITO) manufacturers that served the LCD industry. In the fourth quarter of 2002, Metaleurope closed its zinc/indium smelter in Noyelles-Godault, France. This closure removed a significant portion of indium production from the market and caused the Japanese to seek new sources, primarily in China. However, Chinese supply, which had come online between 2000 and 2002, could not make up for the drop in supply. In 2005, Japan Energy/Nippon Mining closed the Toyoha zinc/indium mine in Japan. These events coincided with the massive growth in the LCD industry, leading to a dramatic increase in price between 2002 and 2005.34
Figure 3-9. Price of Indium: 1995–2011
(Sources: Metal-Pages.com 2011)
As part of supply response to the rapid rise in demand, global secondary indium production or recycled indium increased significantly from 2005 through 2007 and accounted for a greater share of indium production than primary production by 2007. Global ITO demand continued to rise, leading to some price spikes caused by supply deficits (USGS 1994–2010).
Figure 3-10 shows historical gallium prices. Gallium demand was artificially high between 1999 and 2001 owing to the exaggerated expectations of the cell phone market. This led many gallium consumers to hoard gallium and caused gallium demand to temporarily exceed gallium production capacities. The bursting of the tech bubble, the 2001 economic recession and the accumulation of stocks in the integrated circuit and light-emitting diode (LED) supply chains significantly dampened gallium demand and gallium price until 2007–2008. The price of gallium dropped from greater than $2,300/kilogram (kg) peak in 2001 to the $200–$300 range in 2002. As Figure 3-1 earlier in this chapter shows, gallium production was relatively low from 2002 to 2007. Prices stayed below $500/kg through the decade, with the exception of a temporary spike to $700–$800/kg during 2007–2008. More recently, since 2010, a
34 Personal communication between U.S. Department of Energy staff and AIM Specialty Materials, October 2011.
0
200
400
600
800
1000
1200
U.S
. dol
lars
per
Kg
(nom
inal
)

50
number of factors are driving up demand for gallium, including the economic recovery, growing demand for “smart phones” that consume more gallium than standard cell phones, the rapidly growing high-brightness LED industry, demand from copper indium gallium selenide (CIGS) solar cell technology and the depletion of gallium stocks.
Figure 3-10. Price of Gallium 99.00% Main Airport (EU) 2000–2011
(Source: Metal-Pages.com 2011)
Figure 3-11 shows historical tellurium prices according to USGS. In the early 1990s, the tellurium price rose slightly until 1993 due to an increasing demand from free-machining steels coupled with a depletion of inventories. A steady decline in prices began in 1994 and lasted through 1998 due to a fall in consumption that was greater than the decline in supply (Brown 1998).35 In 2004 and 2005, increases in consumption by electronic manufacturers resulted in an increase in the price of tellurium. The price dropped in 2006, but in 2007 resumed its upward trend owing to increased production of cadmium telluride (CdTe) solar cells. Some of the price increase was also attributed by some analysts to speculative buying based on the belief that supplies would be insufficient to meet the growing demand for tellurium in solar cells.36
35 For information on why production fell in this period, please refer to Brown (1998).
36 Personal communication between U.S. Department of Energy staff and the U.S. Geological Survey, October 2011.

51
Figure 3-11. Price of Tellurium: 1990–201037
(Source: Metal-Pages.com 2011)
3.2 Market Dynamics for Key Materials In the context of global supply and demand drivers, the markets for certain materials operate under an additional set of dynamics. The microeconomic supply side in particular is characterized by a number of factors, such as market concentration and transparency, barriers to entry and the capital, knowledge, time and regulatory requirements for operation. Each factor affects the ability of the market to function efficiently and the viability of market participants. This section examines these factors for rare earths and other key materials across the full supply chain.
Rare Earth Elements While rare earth elements are used in a variety of applications, this discussion will focus primarily on permanent magnets due to their prominence in clean energy technologies and large share of rare earth demand. The rare earth magnet supply chain can be divided into five principal stages: (1) mining; milling and concentration of ore; (2) separation into individual rare earth oxides (REOs); (3) rare earth metal production; (4) alloying or powder production and (5) magnet manufacturing. A sixth stage occurs when rare earth magnets are then ultimately incorporated into clean energy components such as motors for electric vehicles and generators for wind turbines. Each stage represents different value, requires particular expertise and equipment and is influenced by a variety of market conditions. The upstream activities of the first two stages have relatively low added value, while the downstream stages tend to command higher value and thus are coveted by both businesses and governments in many countries. The following subsection will discuss the market dynamics across these stages of the supply chain. Table 3-2 provides a summary.
Market concentration. Global production of REOs is highly concentrated geographically, with the majority of producers located in China. Moreover, large-scale industry consolidation is currently underway in China, which will further increase market concentration in the country. Outside of China, several upstream rare earth companies are beginning to emerge at varying phases of development; however, the number of firms that have reached actual production in extraction and processing is at
37 Personal communication between U.S. Department of Energy staff and the U.S. Geological Survey, 2011.
0
50
100
150
200
250
U.S
. dol
lars
per
Kg
(nom
inal
)
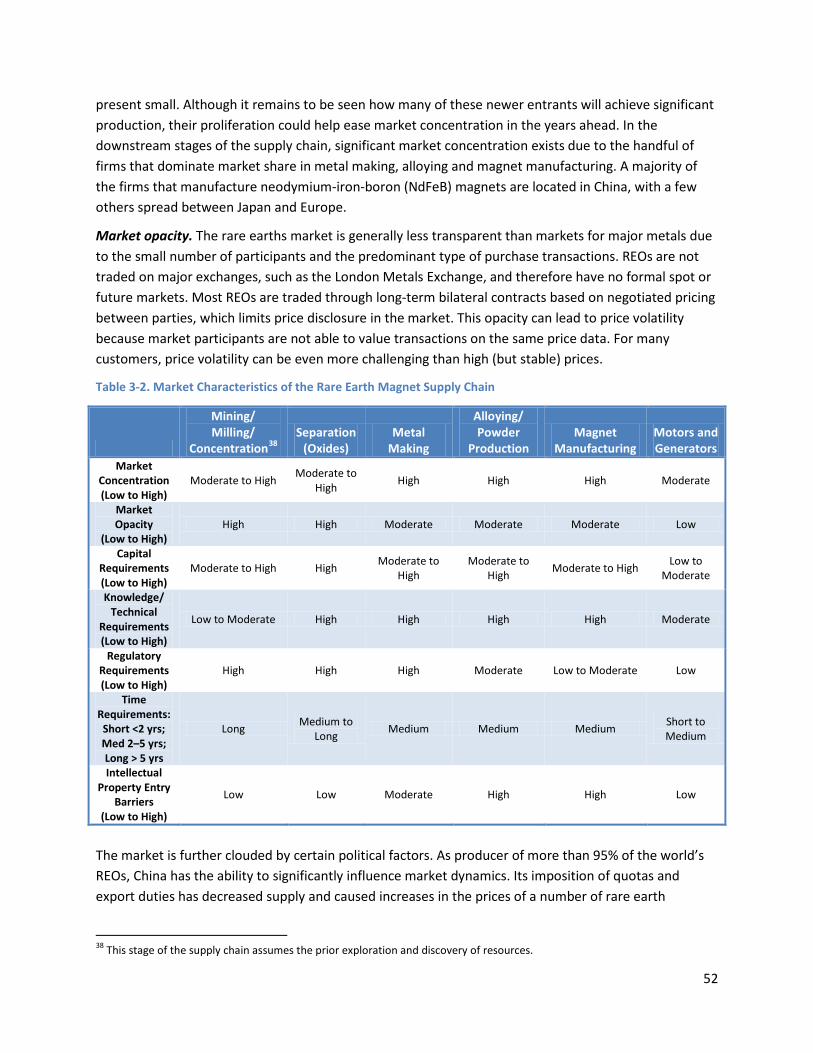
52
present small. Although it remains to be seen how many of these newer entrants will achieve significant production, their proliferation could help ease market concentration in the years ahead. In the downstream stages of the supply chain, significant market concentration exists due to the handful of firms that dominate market share in metal making, alloying and magnet manufacturing. A majority of the firms that manufacture neodymium-iron-boron (NdFeB) magnets are located in China, with a few others spread between Japan and Europe.
Market opacity. The rare earths market is generally less transparent than markets for major metals due to the small number of participants and the predominant type of purchase transactions. REOs are not traded on major exchanges, such as the London Metals Exchange, and therefore have no formal spot or future markets. Most REOs are traded through long-term bilateral contracts based on negotiated pricing between parties, which limits price disclosure in the market. This opacity can lead to price volatility because market participants are not able to value transactions on the same price data. For many customers, price volatility can be even more challenging than high (but stable) prices.
Table 3-2. Market Characteristics of the Rare Earth Magnet Supply Chain
The market is further clouded by certain political factors. As producer of more than 95% of the world’s REOs, China has the ability to significantly influence market dynamics. Its imposition of quotas and export duties has decreased supply and caused increases in the prices of a number of rare earth
38 This stage of the supply chain assumes the prior exploration and discovery of resources.
Mining/ Milling/
Concentration38Separation
(Oxides) Metal
Making
Alloying/ Powder
Production Magnet
Manufacturing Motors and Generators
Market Concentration (Low to High)
Moderate to High Moderate to High High High High Moderate
Market Opacity
(Low to High) High High Moderate Moderate Moderate Low
Capital Requirements (Low to High)
Moderate to High High Moderate to High
Moderate to High Moderate to High Low to
Moderate
Knowledge/ Technical
Requirements (Low to High)
Low to Moderate High High High High Moderate
Regulatory Requirements (Low to High)
High High High Moderate Low to Moderate Low
Time Requirements:
Short <2 yrs; Med 2–5 yrs; Long > 5 yrs
Long Medium to Long Medium Medium Medium Short to
Medium
Intellectual Property Entry
Barriers (Low to High)
Low Low Moderate High High Low

53
elements. At present there is little clarity or predictability about China’s rare earth production and export policies, which sends uncertain supply signals to the market and can disrupt future investment decisions by downstream consumers. Additionally, there are significant data gaps or uncertainties with respect to Chinese reserves and resources, production and consumption. Some of this information is collected by China’s government ministries, but it is not disseminated.
Some recent market trends have added a degree of transparency to the upstream rare earth trade. Increased prices and continuing price volatility for most rare earth elements have reduced the length of some contracts from a previous range of 1–5 years to 3 months or less. The result has been de facto spot transactions, particularly for those of smaller quantities, with the requirement that most or all payment occur in advance of delivery (USMMA 2011; Less Common Materials 2011). Some spot prices can be gathered from online subscription services; however, these sources rely on voluntary disclosures from parties to transactions that are typically small in volume and number, and thus only provide an indication of spot prices (Molycorp 2011a; REITA 2011).
Market transparency increases somewhat as one moves along the supply chain, but is still clouded by the high concentration of metal, alloy and magnet producers. Since these downstream products are also highly specialized for each customer, and these specifications are not often shared, it is difficult to compare prices across applications.
Capital requirements. One of the most significant requirements in the rare earth supply chain is the amount of capital needed to commence mining and refining operations, which are often established together by upstream companies. The extraction and, in particular, the processing of rare earth ore is extremely capital-intensive, ranging from $100 million to $1 billion of capital expenditure depending on the location and production capacity. An important determinant in the amount of capital required is whether the project is a greenfield development. Bringing a greenfield mine to production likely costs in excess of $1 billion (Molycorp 2011a; USMMA 2011). (By contrast, an existing, or brownfield, development can decrease the magnitude of capital expenditure required and considerably mitigate project risks.)
The estimated financial investment needed just to prove the resource (e.g., exploration and drilling) can be up to $50 million. Other costs for mining include reconnaissance work (e.g., exploration, surveys, mapping and initial drilling), mining and mineral process development (e.g., mineralogical and metallurgical testing and prefeasibility and final feasibility studies), pilot plant construction, permitting and other regulatory requirements and building any necessary infrastructure (e.g., roads, rail, ports, communications, power and water). The up-front cost of production capacity can range from $15,000 to $40,000 per tonne of annual capacity (Less Common Materials 2011; Oeko-Institut 2011). Moving along the supply chain, separation, metal-making and alloying require additional major capital outlays. REO separation is perhaps the most capital-intensive step, accounting for approximately 60% of the production cost per unit of processed rare earth (Oeko-Institut 2011).
Unlike other commodities, rare earth mining generally does not appeal to the major global mining firms because it is a relatively small market (about $3 billion in 2010) and is often less predictable and less transparent than other commodity markets. Additionally, the processing of rare earth elements into high-purity REOs is fundamentally a chemical process that is often highly specialized to meet the needs
54
of particular customers. It requires unique mineral processing know-how that is not transferrable to other mining operations. These factors reduce the appeal of rare earth production to the major mining companies, leaving the field mostly to junior miners.39
Smaller mining companies face a number of challenges when raising funds to meet start-up costs. They tend to be less well-capitalized than the majors and may find it difficult to raise money from traditional financial markets. Certain macroeconomic conditions, particularly tight credit and volatile equity markets, can contribute to these difficulties. Early equity financing can come from venture capital or private equity offerings, but typically not on the scale needed to fully fund operations, especially if firms try to vertically integrate across the supply chain. Most currently active rare earth ventures are publicly traded, usually on U.S., Canadian, Australian or Chinese exchanges. Successful public flotations require fairly advanced operations with proven resources, a bankable feasibility study and often customer contracts or off-take agreements in place that ensure some level of revenue.
40
Debt financing may also prove challenging, and expensive, when junior miners are relatively unknown startups with potentially unattractive risk profiles. Some of these concerns may be alleviated through joint ventures with other partners, such as other miners or end users, which share costs and help spread risk. Government-backed financing may also be available in some countries. In Japan, for instance, the Japan Oil Gas and Metals National Corporation (JOGMEC) provides funding for overseas field surveys and loan guarantees and other financial assistance to high-risk mine development projects. In South Africa, the Industrial Development Corporation, a state-owned development finance institution, provides equity and loan financing to support investment in select sectors, including mining.
Table 3-3 lists the market capitalization of select publicly traded rare earth companies in the upstream industry outside of China. Market capitalization provides an indication of the size of the firm and in this case illustrates how the industry mainly comprises small- and mid-cap companies. Molycorp Inc. and Lynas Corporation have the largest capitalizations, reflecting in part their expansion of large established mines. These companies also have large capital expenditures due to their advanced stages of development.
39 One potential exception to this trend may be the Brazilian mining company Vale, which is the world’s largest miner of iron ore. Vale recently discovered deposits of rare earth elements at its copper mine in Carajas, Brazil, and is actively prospecting for more deposits in the Amazon region (Kinch 2011). 40 A bankable feasibility study is the final study prior to commencing operations. It involves the finalization of every element of the project, including all of the aspects listed in the pre-feasibility study (Taylor 2005). The study is referred to as “bankable” because it is often able to attract external financing for the project.
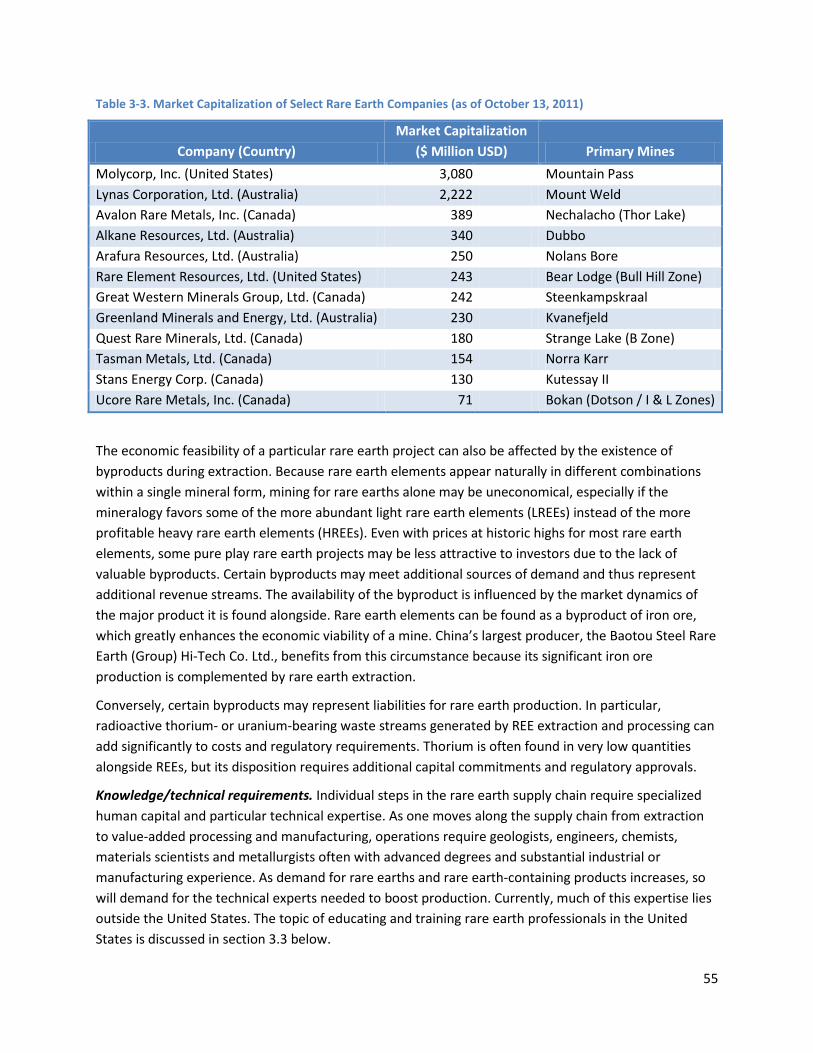
55
Table 3-3. Market Capitalization of Select Rare Earth Companies (as of October 13, 2011)
Company (Country) Market Capitalization
($ Million USD) Primary Mines Molycorp, Inc. (United States) 3,080 Mountain Pass Lynas Corporation, Ltd. (Australia) 2,222 Mount Weld Avalon Rare Metals, Inc. (Canada) 389 Nechalacho (Thor Lake) Alkane Resources, Ltd. (Australia) 340 Dubbo Arafura Resources, Ltd. (Australia) 250 Nolans Bore Rare Element Resources, Ltd. (United States) 243 Bear Lodge (Bull Hill Zone) Great Western Minerals Group, Ltd. (Canada) 242 Steenkampskraal Greenland Minerals and Energy, Ltd. (Australia) 230 Kvanefjeld Quest Rare Minerals, Ltd. (Canada) 180 Strange Lake (B Zone) Tasman Metals, Ltd. (Canada) 154 Norra Karr Stans Energy Corp. (Canada) 130 Kutessay II Ucore Rare Metals, Inc. (Canada) 71 Bokan (Dotson / I & L Zones)
The economic feasibility of a particular rare earth project can also be affected by the existence of byproducts during extraction. Because rare earth elements appear naturally in different combinations within a single mineral form, mining for rare earths alone may be uneconomical, especially if the mineralogy favors some of the more abundant light rare earth elements (LREEs) instead of the more profitable heavy rare earth elements (HREEs). Even with prices at historic highs for most rare earth elements, some pure play rare earth projects may be less attractive to investors due to the lack of valuable byproducts. Certain byproducts may meet additional sources of demand and thus represent additional revenue streams. The availability of the byproduct is influenced by the market dynamics of the major product it is found alongside. Rare earth elements can be found as a byproduct of iron ore, which greatly enhances the economic viability of a mine. China’s largest producer, the Baotou Steel Rare Earth (Group) Hi-Tech Co. Ltd., benefits from this circumstance because its significant iron ore production is complemented by rare earth extraction.
Conversely, certain byproducts may represent liabilities for rare earth production. In particular, radioactive thorium- or uranium-bearing waste streams generated by REE extraction and processing can add significantly to costs and regulatory requirements. Thorium is often found in very low quantities alongside REEs, but its disposition requires additional capital commitments and regulatory approvals.
Knowledge/technical requirements. Individual steps in the rare earth supply chain require specialized human capital and particular technical expertise. As one moves along the supply chain from extraction to value-added processing and manufacturing, operations require geologists, engineers, chemists, materials scientists and metallurgists often with advanced degrees and substantial industrial or manufacturing experience. As demand for rare earths and rare earth-containing products increases, so will demand for the technical experts needed to boost production. Currently, much of this expertise lies outside the United States. The topic of educating and training rare earth professionals in the United States is discussed in section 3.3 below.

56
Regulatory requirements. A number of regulatory procedures impact the rare earth supply chain, particularly at the upstream stages of extraction and separation. In the United States, mineral extraction on federal lands is primarily regulated through the preparation, review and final approval of a mine’s plan of operations and an environmental impact statement. Many states also have their own mining, reclamation and environmental laws in addition to public health and safety standards that must be satisfied before operations can commence. Depending on the location of the claim—federal, state, or private—different regulatory agencies can affect the length of the permitting process. Rare earth separation facilities often require additional permitting intended to regulate associated waste streams, including radioactive waste handling and disposal and wastewater disposition.
The development costs, and to some extent financing, of rare earth projects may be affected by these regulatory requirements. The often-lengthy permitting process, which adds uncertainty and complexity to mine development, may deter investors or delay additional financing. Other compliance requirements, such as monitoring and reclamation, could render production no longer economically feasible.
Time requirements. The upstream stages of the rare earth supply chain are the most time-consuming and can delay bringing products to market. This is particularly true for a greenfield mining and concentration site, which may take more than 10 years to begin production (Molycorp 2011a). While development timelines depend on a variety of site-specific variables, including political and regulatory environments in different countries, the initiation of most upstream activities is inherently time-consuming due to the various technical and capital requirements that need to be addressed. This greatly affects the ability of supply to meet short-term increases in demand. Unlike other product markets supply responsiveness is muted, due in part to the amount of time required to develop new sources—even when the market is operating efficiently. When market inefficiencies occur, such as those caused by trade or production quotas, the inherent stickiness of supply is exacerbated, which can lead to price spikes and potential shortages.
Intellectual property entry barriers. While intellectual property barriers to entry are relatively low for mining ore, they increase significantly when descending the supply chain. The most significant is the intellectual property required for permanent magnet manufacturing. Production of the highest-quality NdFeB magnets, for instance, is covered by more than 600 patents held by the Hitachi Corporation. Hitachi often limits licensing of its intellectual property, and without such a license many would-be manufacturers of these magnets are not able to produce them competitively. There currently are no licensed NdFeB magnet producers in the United States; there are five licensees in China, three in Japan, and two in Germany. Although some of the Hitachi patents begin expiring in 2014, a number of additional key patents related to processing and finishing technologies continue well past 2014 (Arnold Magnetic Technologies 2011).
Indium, Gallium and Tellurium Indium, gallium and tellurium are used in thin-film or high-performance PV solar cells (CIGS and CdTe). Table 3-4 shows select characteristics of indium, gallium and tellurium beginning with their associated primary materials.

57
Table 3-4. Select Characteristics of Indium, Gallium and Tellurium
Byproduct
Primary Product and Typical
Byproduct Content
Top Reserve-Holding Countries
of Byproduct Top Refining Countries of
Byproduct Principal Applications
of Byproduct
Indium (In)
Zinc ~2.8 tonnes of In per 100 tonnes of zinc metal41
China, others
China, Japan, South Korea, the Commonwealth of Independent States, Canada and South America
Alloys Liquid crystal displays (LCDs) Light-emitting diodes (LEDs) Solar cells Solders
Gallium (Ga)
Bauxite and zinc ~5 kgs per 100 tonne of bauxite
Not available China, Japan, United States, Slovakia and United Kingdom
Alloys Integrated circuits 42
LEDs
Solar cells
Tellurium (Te)
Copper ~2.5 kgs of Te per 500 tons of copper ore processed
United States, Peru, others
Japan, Peru, Canada, United States and China43
Alloys
Rubber processing Solar cells Synthetic fiber
(Source: Iasnikov 2011) The most important drivers of the markets for these metals across their supply chains are the complexities of byproduct production, the availability of secondary supply, and the economic competitiveness of thin-film solar cells relative to conventional silicon-based solar cells.44
Indium
Byproducts are not mined as such but are found in the ore of a primary material. The availability of byproducts in general depends on the market for the primary product. Clean energy technologies also compete with high-tech consumer products and alloys for these materials. The limited supply in relation to rising demand has led to greater material use efficiency, recovery and recycling for these materials.
Indium-bearing ores and deposits are present worldwide. 45 However, China is currently a major holder of global indium reserves. The global distribution of the refining capacity of indium is as follows: 43% in China, 30% in Japan and South Korea, 12% in the Commonwealth of Independent States CIS, 9% in Canada and approximately 5% in South America. The market for indium is small (millions of U.S. dollars) compared to the market for its primary product, zinc (billions of U.S. dollars). As a result, even under the current high price (see Figure 3-7), few zinc refiners have the incentive to develop indium refining capacity (called the “indium circuit”). In addition, indium extraction from the waste stream (or “slag”) generated during zinc refining is a capital-intensive process. The amount of indium production can be increased by increasing the extraction efficiency of indium.46
41 Personal communication between U.S. Department of Energy staff and AIM Specialty Materials, October 2011.
Japan and South Korea could increase their
42 Integrated circuits were used in defense applications, high-performance computers and telecommunications (Kelly 2011). 43 Although data on tellurium refining in China are unavailable, such refining is believed to be significant in China. 44 For information on this last factor, please see Photovoltaic Cells section under 2.5 Other Technologies in Chapter 2 and the criticality assessment of the three elements (In, Ga and Te) in Appendix A. 45 Personal communication between U.S. Department of Energy staff and AIM Specialty Materials, October 2011. 46 According to Indium Corporation, in the Western hemisphere only one-third of indium mined every year is refined, with the rest going into tailings or non-indium-capable refineries and considered ‘lost’ (Indium Corporation 2010).

58
indium output by importing more zinc concentrates (most likely from Australia); however, they are likely to do so only if there is market demand for the additional zinc. Japan could also reopen a zinc mine that has low-quality indium if the indium price rises significantly.
Secondary sources of indium through recovery (from tailings) and reclamation (from converting spent ITO scraps back into metal) are significant. In recent years, these have exceeded primary indium production due to a large historic stockpile of scraps in Japan. The size of this stockpile is unclear, however, and when it runs out, supply from other sources will be required. If indium prices increase, byproduct refining at existing refineries can increase. At a somewhat higher indium price, additional refining capacity can be installed, as long as the additional primary zinc is marketable. The direct mining of indium is possible, although the price will need to be even higher to incentivize such additional supplies.
The pricing of indium is relatively opaque due to the nature of minor metal trading in general and the lack of transparency in the Chinese market, which accounts for 43% indium refining capacity. Most indium trading is through bilateral contracts and is based on the published price by the Metal Bulletin news service, which in turn gets its weekly price quotes from major buyers and sellers. Because this is not done daily, the published price tends to lag market conditions by a few days. There is a spot market for indium, and there the price offered by a seller can be lower or higher than the published Metal Bulletin price, depending on whether the market price is trending up or down.
Current extraction and refining processes are based on traditional metallurgy, suggesting there are opportunities for technical improvement. The specific supply chain steps beyond refining depend on the end-use application in question. For thin-film production that enters LCDs and CIGS, refined or purified indium enters into fabrication and application. Indium entering nuclear control rods, solders and multiple other applications is usually of lower purity. Regulatory requirements are high at the purification or refining stage due to the use of toxic substances. Intellectual property entry barriers enter at the fabrication or application stage of thin-film solar cells, which are advanced solar technologies with different constructs based on intensive R&D.
Gallium Gallium occurs in very small concentrations in the ores of other metals. Most gallium is produced as a byproduct of processing bauxite to produce aluminum, while the remainder is produced from zinc-processing residues. Only part of the gallium present in bauxite and zinc ores is recoverable, and the factors driving its recovery are proprietary. Thus, intellectual property is more of an issue for gallium than for indium (and tellurium), and an estimate of current reserves comparable to the definition of reserves of other minerals cannot be made. Currently only about 10% of alumina producers extract gallium. The distribution of global gallium refining capacity is estimated as follows: China 35%, Japan 40%, United States 10%, Slovakia 10%, and the United Kingdom 5%.47
47 Information provided by U.S. Geological Survey staff, November 2011.

59
As in the case of indium, reclamation and recovery loops could be significant sources of gallium; however, the amount of recycled gallium is difficult to ascertain.48
Tellurium
Were the gallium price to rise further and remain at a sufficiently high level, additional supply could come from recycled sources and increased capacity utilization at existing refineries. The addition of new refining capacity would depend on the viability of associated bauxite or zinc production. Gallium refining appears to be less capital-intensive than indium refining. Unlike indium (and tellurium), there appears little interest so far in mining gallium directly.
Tellurium typically occurs at very low grade in the ores of other primary products, mainly copper. Relative to indium, for instance, the average yield of tellurium from copper ore is much lower—a few kilograms per 500 tonnes of copper ore. Australia, Belgium, China, Germany, Kazakhstan, the Philippines, Russia and the United Kingdom hold around 73% of global tellurium reserves in copper ore. The United States is estimated to hold an additional 14% of global tellurium reserves in copper ore, while Peru holds another 10%. Global tellurium refining from copper in volumetric terms is well-distributed among Japan, Peru, Canada, the United States and China.
Globally, about 50%–55% of tellurium recoverable from copper anode slimes is extracted. Of this, more than 90% is collected through the electrolytic copper refining process. Increasing use of the leaching solvent and extraction-electrowinning processes for copper extraction, which do not capture tellurium, may reduce the future supply of tellurium from certain copper deposit types. Companies are investigating other potential resources, such as gold telluride and lead-zinc ores with higher concentrations of tellurium, as well as direct tellurium mining. Tellurium refining is less capital-intensive than indium refining.
The secondary supply of tellurium in the form of old scrap is limited because the traditional uses of tellurium are nearly all dissipative, although secondary tellurium supply from new scrap is growing. The major use of tellurium remains as an alloying additive in steel to improve machining characteristics. Tellurium is increasingly used in the production of CdTe-based solar cells. This has driven increases in world tellurium consumption and prices since 2009.49
Table 3-5 summarizes the market characteristics of the thin-film PV supply chain, of which indium, gallium and tellurium are key inputs. The characteristics of tellurium in this supply chain are similar to those of indium with respect to market transparency and the price discovery process, technical know-how, government requirements and intellectual property entry barriers. The characteristics of gallium in this supply chain are similar to those of indium with respect to market transparency and price discovery process, technical know-how and government requirements.
The cost of tellurium is a critical issue for CdTe solar cell makers, and the industry is working to lower material use and increasing recovery of new scrap to reduce reliance on primary tellurium.
48 For more information on the secondary sources of gallium and the difficulty in estimation, please refer to p. 15 of Kramer (1988, 25). 49 Personal communication between U.S. Department of Energy staff and the U.S. Geological Survey, October 2011.

60
Table 3-5. Market Characteristics in Thin-film Photovoltaic Supply Chain (Applicable to Indium, Gallium and Tellurium)
3.3 Education and Training Strategies Intellectual capital is an important feature of critical materials markets. It is particularly vital to ensuring a robust rare earth supply chain that is responsive to market changes. As discussed in the previous section, rare earth supply chains depend in part on a highly trained workforce with specialized technical expertise. As the United States was once the world’s leading producer of rare earth materials, the United States was also once a leader in rare earth technical knowledge.
It is estimated that prior to 1980 rare earth mining and related industries employed approximately 25,000 people in the United States, with 3,000-6,000 holding college degrees in science or engineering.51 Current estimates are that 1,500 people are employed throughout the U.S. rare earth industry including 200-400 persons holding college degrees in science or engineering (Gschneidner 2011). U.S. member organizations of the Rare Earth Industry and Technology Association (REITA) report employing approximately 200 rare earth professionals. This figure does not include rare earth professionals in the United States whose employers are not current members of REITA. 52,53
50 Moderate for gallium.
For example, the figure does not account for researchers in national laboratories and universities other than Ames Laboratory, Iowa State University, Colorado School of Mines, Worcester Polytechnic Institute and the University of Delaware.
51 The estimates for ratio of total employees to persons with college degrees in the sciences or engineering varies from about 8 to 1 to about 4 to 1, depending on the particular area of the industry. 52 While different organizations have varying definitions of “professional,” for purposes of this discussion, a rare earth professional is defined as one who is engaged in technical rare earth related work, from extraction, material processing and component manufacturing, to R&D at universities, research entities and industry. 53 Personal communication between U.S. Department of Energy staff and REITA member organizations, including: Molycorp, GTP, Santoku America Inc., Arnold Magnetics, General Electric, Colorado School of Mines, Worcester Polytechnic Institute, Ames Laboratory/Iowa State, University of Delaware, February 2011.
Extraction of Byproduct
Purification/ Refining
Fabrication/ Application
Market Concentration (Low to High) Low Low High
Market Opacity (Low to High) High Low Low
Capital Requirements (Low to High) High Low High
Knowledge/Technical Requirements (Low to High) Low Low High
Regulatory Requirements (Low to High) High High Moderate
Time Requirements: Short <2 yrs; Medium 2–5 yrs; Long > 5yrs High Low Med
Intellectual Property Entry Barriers (Low to High) Low50 Low High

61
As production of REO has shifted mainly to China, much of the technical expertise across the supply chain now resides outside the United States as well, notably in China and Japan. For comparison, the Chinese Society of Rare Earths reports a membership of 100,000 on its website. It is estimated that 65,000 members are professionals from industry, universities and research institutes, with the remaining 35% of these members serving in administrative functions.54
The steps of the rare earth magnet supply chain have a high technical knowledge requirement. As demand for rare earths and rare earth-containing products increases, so will demand for the technical experts needed to boost production. Developing expertise throughout the supply chain depends, in part, on private- and public-sector research support. Research activities provide training opportunities for postdoctoral scientists and graduate students, and also incentivizing others, such as mid-career scientists and engineers in related disciplines, to pursue research in this area.
Education and Training Opportunities Several U.S. institutions have established programs that contribute to the education and training of the next generation of rare earth professionals. There are many routes an institution can take to provide these needed opportunities; for example, offering graduate and undergraduate courses, making available funded research opportunities, developing partnerships with industries through research consortia and providing students opportunities for practical experience within the rare earth industry through internships and cooperative education experiences. While there are a wide range of organizations with active research programs (and related educational programs) relevant to rare earths, discussed below are three examples of ways that universities have developed educational programs related to the rare earth supply chain.
Iowa State University (ISU) has developed collaborations with Ames Laboratory, one of the nation’s leaders in rare earth research, which is supported by the DOE Office of Science. ISU offers several related graduate courses in chemistry, material science and engineering and physics. A course on the chemical and physical metallurgy of rare earths is available to upper-level undergraduate and graduate students and as a distance education class. The collaboration with Ames Laboratory provides ISU the ability to use research opportunities as routes toward the education and training of its students.
The University of Delaware is also very active in the area, especially in relation to rare earth magnets. Through this active research program, many graduate students and postdoctoral researchers work on innovations towards the next generation of permanent magnets, while receiving valuable education and training opportunities. The university has been a recipient of several funding awards from DOE for research on rare earth permanent magnets, most recently through the Advanced Research Projects Agency-Energy program.
The Center for Resource Recovery and Recycling (CR3) is an Industry/University Cooperative Research Center funded by the National Science Foundation. The center’s research focuses on developing new technologies for maximizing the recovery and recycling of metals used in manufactured products and structures, including separation, processing and recycling of rare earth materials. CR3 is headquartered at Worchester Polytechnic Institute, and other partner universities include the Colorado School of Mines
54 Figures based on information received from the Chinese Society of Rare Earths in February 2011.
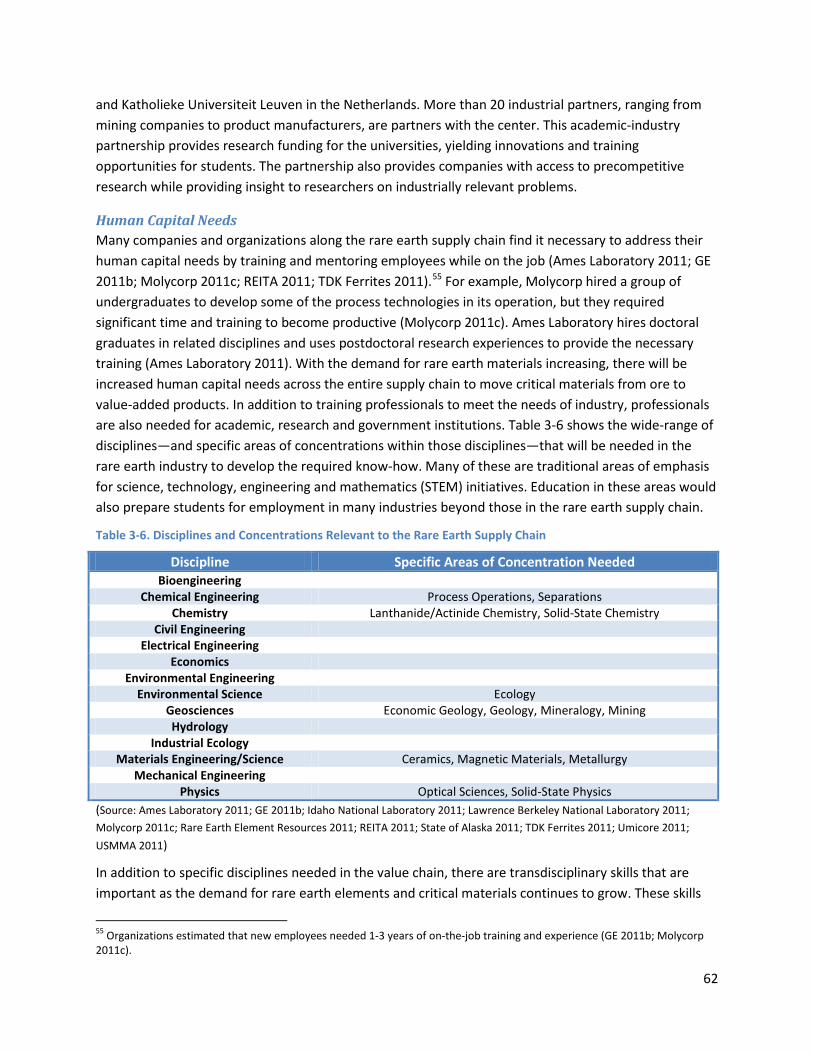
62
and Katholieke Universiteit Leuven in the Netherlands. More than 20 industrial partners, ranging from mining companies to product manufacturers, are partners with the center. This academic-industry partnership provides research funding for the universities, yielding innovations and training opportunities for students. The partnership also provides companies with access to precompetitive research while providing insight to researchers on industrially relevant problems.
Human Capital Needs Many companies and organizations along the rare earth supply chain find it necessary to address their human capital needs by training and mentoring employees while on the job (Ames Laboratory 2011; GE 2011b; Molycorp 2011c; REITA 2011; TDK Ferrites 2011).55
Table 3-6. Disciplines and Concentrations Relevant to the Rare Earth Supply Chain
For example, Molycorp hired a group of undergraduates to develop some of the process technologies in its operation, but they required significant time and training to become productive (Molycorp 2011c). Ames Laboratory hires doctoral graduates in related disciplines and uses postdoctoral research experiences to provide the necessary training (Ames Laboratory 2011). With the demand for rare earth materials increasing, there will be increased human capital needs across the entire supply chain to move critical materials from ore to value-added products. In addition to training professionals to meet the needs of industry, professionals are also needed for academic, research and government institutions. Table 3-6 shows the wide-range of disciplines—and specific areas of concentrations within those disciplines—that will be needed in the rare earth industry to develop the required know-how. Many of these are traditional areas of emphasis for science, technology, engineering and mathematics (STEM) initiatives. Education in these areas would also prepare students for employment in many industries beyond those in the rare earth supply chain.
Discipline Specific Areas of Concentration Needed Bioengineering
Chemical Engineering Process Operations, Separations Chemistry Lanthanide/Actinide Chemistry, Solid-State Chemistry
Civil Engineering Electrical Engineering
Economics Environmental Engineering
Environmental Science Ecology Geosciences Economic Geology, Geology, Mineralogy, Mining Hydrology
Industrial Ecology Materials Engineering/Science Ceramics, Magnetic Materials, Metallurgy
Mechanical Engineering Physics Optical Sciences, Solid-State Physics
(Source: Ames Laboratory 2011; GE 2011b; Idaho National Laboratory 2011; Lawrence Berkeley National Laboratory 2011; Molycorp 2011c; Rare Earth Element Resources 2011; REITA 2011; State of Alaska 2011; TDK Ferrites 2011; Umicore 2011; USMMA 2011)
In addition to specific disciplines needed in the value chain, there are transdisciplinary skills that are important as the demand for rare earth elements and critical materials continues to grow. These skills
55 Organizations estimated that new employees needed 1-3 years of on-the-job training and experience (GE 2011b; Molycorp 2011c).

63
are listed in Table 3-7, along with their relevance to the rare earth supply chain. Professionals with these skills would be valuable throughout the value-added chain, as well as in numerous other industries.
Table 3-7. Transdisciplinary Skills Relevant to the Rare Earth Supply Chain
Skill Relevance to Rare Earth Industry Characterization/Instrumentation
Addressing challenging characterization issues in materials that are very chemically similar and that require very high purity
Green Chemistry/Engineering Waste prevention, atom economy, safer solvents and sustainable processing
Manufacturing Engineering Reducing manufacturing losses at each stage of the supply chain to improve supply
Materials Recycling Technology Developing technologies to better recycle materials Modeling Modeling potential substitutions at the component and system level
Product Design Developing end products that are easier to recycle
Rational Design Developing structure-property relationships to allow for rational design rather than empirical design
(Source: Ames Laboratory 2011; GE 2011b; Idaho National Laboratory 2011; Lawrence Berkeley National Laboratory 2011; Molycorp 2011c; State of Alaska 2011)
The lack of an adequately trained workforce is a major impediment in the development of a more stable rare earth supply chain in the United States (GE 2011b; Molycorp 2011c). While institutions are providing education and training opportunities, many companies along the supply chain resort to on-the-job training. As the need for specialized technical knowledge increases, the availability of R&D opportunities (in both the private and public sector) is an important tool to improving expertise in this area. A broad range of disciplines and skills are needed as the next-generation workforce is being considered. Developing professionals with these skills and abilities will also provide value to many other industries, as more trained professionals will be available.
3.4 Business Strategies
Businesses at various stages of the supply chain are confronted with global supply and demand shifts and industry-specific market dynamics to which they must adapt. In this environment some firms react by taking defensive measures, while others proactively seek to take advantage of market circumstances. In the rare earth supply chain, in particular, firms face markets characterized by price volatility, high prices and potential supply shortages of certain elements. Volatility in prices can raise the cost of capital, hinder investment decisions and increase the returns sought by investors, while high material input costs can erode the margins of downstream manufacturers. Perhaps most important, the basic availability of some elements may be difficult to secure, creating uncertainty and potential product shortages throughout the supply chain. Companies respond to these dynamics in different ways. Many companies in the rare earth supply chain are developing strategies to protect themselves from price volatility and scarcity, while others are seeking to capitalize on tight markets by offering additional sources of supply or potential substitutes.
Two common strategies to manage risk due to price volatility and scarcity are diversification and hedging. Companies can diversify commercially by seeking to capture more of the rare earth supply chain. For instance, upstream companies not only develop mines, but may also seek the expertise to process rare earths into metals and alloys or into commercial products. This allows them to capture

64
more value as profits shift along the supply chain. Downstream companies can reduce their exposure to price volatility and even scarcity by investing in alternative sources of supply in addition to hedging by identifying and exploiting alternatives to rare earth inputs. Some companies are also reducing the impact of price volatility by establishing relationships across the supply chain through contracts or joint ventures.
Companies seeking to capitalize on current market opportunities are developing additional sources of supply to meet growing demand, establishing supply agreements with downstream manufacturers and/or pursuing vertical integration strategies to capture more profits. Some are also creating new markets for already abundant materials in an attempt to balance supply and demand. The following discussion examines select companies across the rare earth supply chain that are reacting to current market dynamics in different ways. Some are pursuing integration across stages of the supply chain while others maintain a specialized focus.
Molycorp, Inc. Molycorp, headquartered in the United States, is an example of a company pursuing a vertically integrated mining and manufacturing strategy, which it refers to as “mines to magnets,” covering the entire rare earth permanent magnet supply chain. Molycorp plans to make sales at each point of the supply chain: oxides, metals and alloys and magnets (Molycorp 2011b). This strategy would provide diversification and the potential for capturing added value across the supply chain.
The company focuses primarily on reestablishing a mine in Mountain Pass, California, which will have integrated on-site mining and processing facilities. Molycorp has reduced the time to scale-up because Mountain Pass is an existing brownfield site with production capabilities that date to 1952. The company has an agreement with Hitachi to supply lanthanum oxide and didymium metals and alloys, which are a mixture of praseodymium and neodymium and will be used in Hitachi’s magnet manufacturing process (Molycorp 2011c). In addition, Molycorp produces REOs and metals at facilities in Estonia as well as NdFeB alloys in Arizona. It has also announced the formation of a joint venture with Daido Steel Co. Ltd. and Mitsubishi Corp. to manufacture and sell NdFeB permanent rare earth magnets primarily for the automotive and home appliance markets (The Denver Post 2011).
In another form of diversification, Molycorp is developing new products for various markets. For instance, it is currently marketing a rare-earth-based water treatment technology that removes pollutants and other constituents from water. By developing new products and markets, Molycorp seeks to spur demand for more abundant light rare earth elements such as cerium.
Great Western Minerals Group. The Canadian firm Great Western Minerals Group (GWMG) has also adopted a fully integrated business model that it calls “mines to markets.” The company's primary focus is the refurbishment and reopening of the Steenkampskraal mine in the Western Cape Province of South Africa. GWMG intends to mine and process REOs at the Steenkampskraal site, which is a brownfield site that was active from 1951 to 1963. Other exploration properties in North America and South Africa are also being investigated. In addition, GWMG has ownership of Less Common Metals Limited of Birkenhead, England, and Great Western Technologies, Inc., of Troy, Michigan. These subsidiaries process REO into specialty alloys and metals for the production of batteries, magnets and specialized aerospace components (Great Western Minerals Group 2011).

65
Lynas Corporation. Lynas currently specializes in upstream rare earth extraction and processing, but seeks to be a fully integrated supply source of rare earths by developing upstream and downstream capabilities through the value chain. The company has an operational mine and concentration plant at Mt. Weld in Western Australia. The company has also announced its intention to explore the development of a second mine in Malawi. A separate processing facility (the Lynas Advanced Materials Plant, or LAMP) is being constructed in Malaysia for 11,000 tonnes per year of rare earth carbonates and oxides. The company is currently expanding the LAMP facility, with a planned ultimate capacity of 22,000 tonnes of REO per year by early 2013. Lynas has announced seven formal agreements and three letters of intent for supplying processed rare earth carbonates and oxides to customers. Lynas is a minority partner in a proposed joint venture for permanent magnet production with Siemens (Siemens 2011).
Neo Material Technologies. Headquartered in Canada, Neo Material Technologies (Neo) specializes in the midstream stages of the rare earth supply chain through its Magnequench and Performance Materials divisions. It has two REO separation facilities in China that process heavy and light rare earth elements. The company holds a license on one of Hitachi’s neodymium-iron-boron patents and is one of the few producers of NdFeB magnetic powders, which are used to produce bonded magnets for micro and precision motors and sensors (Neo Material Technologies 2011). The location of its separation facilities in China allows Neo to maintain a stable supply of REOs for its specialized powder and metal production. In addition, Neo’s 2010 letter of intent with Molycorp contemplates potential supply agreements pursuant to which Neo would purchase mixed rare earth carbonates, as well as neodymium and praseodymium oxides or metals from Molycorp. Neo also produces high purity gallium metal and derivatives from primary and recycled sources, as well as recycling indium from indium-containing waste streams.
Toyota Motor Corporation. Toyota is a downstream user of rare earths and employs a mixture of strategies to mitigate supply and price risks. It has a strong interest in rare earth elements because they are an integral component of the permanent magnets used in electric motors and generators and thus increasingly important to the growth of hybrid and all-electric vehicles (The Economist 2011).
In 2010 Toyota established a rare earth task force to monitor its supply chain and is simultaneously pursuing two initiatives (Kitamura and Scott 2011). In order to reduce demand for rare earths, Toyota is continuing research on induction motors that will not use rare earth elements. Such induction motors are already present in other electric vehicles, and according to Toyota, they are lighter and more efficient than the magnet-type motors presently used in the Toyota Prius (Hur and Suzuki 2011).
Toyota also seeks to establish a stable supply chain for rare earth materials. Through its affiliate Toyota Tsusho and Sojitz, another Japanese trading company, Toyota has established a joint venture with the state-run Vietnamese Coal and Mineral Industries Group (Vinacomin) to develop the Dong Pao rare earth mine. Production from this deposit is predicted to be approximately 3,000 tonnes annually by 2015. Toyota Tsusho has also purchased the Wako Bussan Trading Co., which owns Indian Rare Earths Ltd., an Indian company that exports roughly 4,000 tons of REOs per year directly to Toyota. Finally, Toyota Aichi Steel has made a long-term supply deal with the Great Western Minerals Group subsidiary Less Common Metals to provide alloys for battery and magnet production (Gordon 2011).

66
3.5 Government Strategies The growing importance of raw materials to economic growth and competitiveness, and the particular attributes of markets for critical materials such as rare earths, has led many governments to take active roles in ensuring a secure supply. The 2010 Critical Materials Strategy examined the raw materials policies of Japan, the European Union (EU), the Netherlands, China, South Korea, Australia and Canada. These countries represent a broad range of national interests, resource characteristics and policy goals. Many of these countries’ objectives remain the same, but notable developments have occurred over the last year, particularly in China, Japan and the EU. The major developments in these countries will be discussed in detail below. Table 3-8 summarizes each country’s policy goals, business policy, research policy and materials of interest.
China China’s stated goals with respect to materials policy include maintaining stable supplies for the Chinese economy, reducing the environmental impacts of resource extraction and stopping illegal mining, overproduction and smuggling. These goals apply to rare earth elements, of which China is the world’s leading producer, as well as to indium and other metals.
China continues to implement a comprehensive industrial policy of consolidating production, limiting exports, enacting environmental regulations and restricting certain foreign investment in the rare earth sector. Industry consolidation has accelerated over the past year with the closure of hundreds of mines and the acquisition of many smaller producers by the country’s major mining companies. This consolidation is being supplemented by production quotas, higher taxes on domestic producers and a ban on new separation projects over the next five years (Zhou 2011). In July 2011 a new industry body called the Chinese Association of Rare Earths was created to help oversee the administration of China’s rare earth industry, including the implementation of production and export quotas (Global Times 2011).
China imposes export quotas on rare earth products. Between 2004 and 2009, the overall export quota was reduced by more than 20% from 65,609 tonnes of REOs to about 50,000 tonnes of REOs (Table 3-9). In July 2010 China further reduced its export quota to 30,258 tonnes of REOs, a 40% decrease from 2009. For 2011 the nominal quota was set at 30,246 tonnes, which for the first time included rare-earth-containing ferroalloys, which effectively reduced allowed REO exports.
China prohibits outright foreign investment in rare earth extraction and requires foreign investors to form joint ventures with domestic firms in the processing of REOs. At the same time, the government encourages foreign direct investment in the more value-added manufacturing of rare earth metals, alloys, powders and magnets. Many downstream manufacturers of rare earth products have shifted production to China to increase access to inputs at a lower price, which has resulted in the capture of significant global market share for some products. In the manufacture of rare earth magnets, for example, China now produces 76% of the world’s total.56
56 Subcommittee on Asia and the Pacific, Committee on Foreign Affairs, U.S. House of Representatives (September 21, 2011) (testimony of J. Gaylen).

67
Table 3-8. Policy Goals, Business Policies, Research and Development Policies and Materials of Interest for Select Countries
Country Goal Business Policy R&D Policy Materials of
Interest
China
Maintain a stable supply of raw materials for domestic use through industry consolidation, mitigating overproduction and reducing illegal trade
• Establish taxes and quotas on rare earth element (REE) exports
• Prohibit foreign companies in REE mining
• Consolidation industry • Create unified pricing
mechanisms* • Establish production quotas
• Explore new rare earth separation techniques and new rare earth functional materials
• Establish three additional labs and two institutions focused on REE mining and applications
Sb, Sn, W, Fe, Hg, Al, Zn, V, Mo and rare earth elements
European Union
Limit the impact of potential material supply shortages on the European economy
• Build a mineral trade policy for open international markets*
• Gather information* • Streamline land permitting* • Increase recycling regulations*
• Increased material efficiency in applications
• Identification of material substitutes
• Improve end-of-life product collection and recycling processes
Sb, Be, Co, Ga, Ge, In, Mg, Nb, REEs, Ta, W, Fluorspar and Graphite
Japan Secure a stable supply of raw materials for Japanese industries
• Fund international mineral exploration
• Guarantee loans for high-risk mineral projects
• Stockpile materials • Gathering information
• Explore substitution research funded through Ministry of Economy, Trade and Industry and the Ministry of Education, Culture, Sports, Science and Technology
• Complete exploration, excavation, refining, and safety research funded through the Japan Oil Gas and Metals National Corporation
Ni, Mn, Co, W, Mo and V**
Australia
Maintain investment in the mining industry while fairly taxing the depletion of national resources
• Establish a low tax on the value of extracted resources
• Create a high tax on mine profits • Allow tax rebates for mineral
exploration • Ensure fast turnaround for land
permit applications
• Promote sustainable development practices in mining and processing
• Map resources
Ta, Nb, V, Li and rare earth elements
Canada
Promote sustainable development and use of mineral and metal resources, protect the environment and public health and ensure an attractive investment climate
• Require accountability in environmental performance and mineral stewardship
• Use a life cycle-based approach to mineral management and use
• Promote a recycling industry and incorporate recycling as part of product design
• Provide comprehensive geosciences information infrastructure
• Promote technological innovation in mining processes
• Develop value-added mineral and metal products
Al, Ag, Au, Fe, Ni, Cu, Pb and Mo
*Proposed policy **Current reserves

68
Chinese officials are reportedly planning to create sizable stockpiles as well. In February 2010, the regional government of Inner Mongolia authorized a “strategic reserve” of REEs to be established in the autonomous region (Yan and Yijun 2010). In October 2010, it was reported that Bautou Steel‘s plan to acquire and set aside up to 300,000 tonnes of rare earths within 5 years was approved by the Chinese government (Business China 2010).
China continues to support rare earth R&D efforts through two key national research programs and four state laboratories. Researchers focus on separation techniques, the exploration of new REE functional materials and optical, electrical and magnetic properties. Other programs focus on basic chemical sciences including solid state chemistry, bioinorganic chemistry, chemical biology and separation chemistry. The Baotou Research Institute, established in 1963, focuses specifically on rare earth metallurgy, environmental protection, new materials and applications in traditional industries. The Chinese Society of Rare Earths publishes two academic journals dedicated to rare earths: the Journal of Rare Earth and the China Rare Earth Information Journal.
China also imposes export quotas on indium and a number of other materials, such as tungsten and molybdenum. Like rare earths, China’s indium trade experiences significant smuggling, with approximately 100 tonnes being illegally exported from the country each year. The smuggling has caused indium producers with export licenses to meet only half the allotted quota in 2011 (Platts 2011).
European Union European Union member states rely heavily on imported rare metals and products containing rare metals. In response to increases in demand caused by emerging technologies, the European Commission established the Raw Materials Initiative in 2008 to limit the impact that material supply shortages may have on the European economy.
The Raw Materials Initiative contains three policy pillars:
• Maintain access to raw materials in world markets on the same conditions as international competitors: enforce World Trade Organization trade policy and the provision of development aid in resource-rich nations to support good governance, a sound investment environment and environmentally safe practices.
• Establish European Union framework conditions that foster a sustainable domestic supply of raw materials: maintain congruent data on mineral availability and mining regulations among member states, streamline the land permitting process for mining, support research on extraction and processing and initiate university education programs for mining science.
Table 3-9. China's Rare Earth Element Export Quotas
Export Quotas (Tonnes Rare Earth Oxides)
Annual Change
2005 65,609 - 2006 61,821 –6% 2007 59,643 –4% 2008 56,939 –5% 2009 50,145 –12% 2010 30,258 –40% 2011 30,184 –0.24%
(Source: Kingsnorth 2010 and Scott 2011)

69
• Increase resource efficiency and recycling to reduce consumption of raw materials: fund research in reduced-material product designs, recycling and material substitutes, improve end-of-life product collection in all member states and enforce export restrictions for recyclable waste (Commission of the European Communities 2008).
The European Commission released a study in 2010 assessing materials for criticality, as defined by the value each material adds to the European economy and the material’s potential for an international supply shortage. Fourteen of the 41 materials studied were identified as exhibiting a high supply risk and high economic importance: antimony, beryllium, cobalt, fluorspar, gallium, germanium, graphite, indium, magnesium, niobium, platinum group metals, rare earth metals, tantalum and tungsten (European Commission, Enterprise, and Industry 2010).
In February 2011 the European Commission produced a new strategy document that provides an overview of the actions taken to date and planned next steps to better regulate commodity markets, financial markets and raw materials markets (European Commission 2011). The Raw Materials Initiative will continue to reinforce and expand the efforts under each pillar through the following:
• The European Commission will reinforce the raw materials trade strategy through dialogues with relevant partners and utilizing policy instruments to respond to anticompetitive actions.
• The European Commission will promote investment in the European extractive industries through a set of measures that enhances coordination among member states and adheres to sustainable development principles.
• The European Commission and the African Union Commission will establish bilateral cooperation on raw materials in the areas of governance, investment and geological knowledge.
• The European Commission will further address barriers to material recycling in the European Union.
• The European Commission will also assess whether to launch a European Innovation Partnership on raw materials within the European 2020 Flagship on Innovation Union.
In October 2011 the Institute for Energy and Transport of the Joint Research Centre of the European Commission released a study assessing the potential obstacles to the deployment of clean energy technologies in the European Union due to the shortage of certain metals. The study examined the use of metals in the six low-carbon energy technologies of the European Union’s Strategic Energy Technology Plan: nuclear, solar, wind, bioenergy, carbon capture and storage and the electricity grid. The study concluded that five metals—namely tellurium, indium, gallium, neodymium and dysprosium—are at a particularly high risk, with special relevance to the wind and photovoltaic energy generation technologies. The report also explores potential mitigation strategies, including expanding European output of these materials, increasing recycling and reuse, reducing waste and finding substitutes for these metals in their principal applications.
The European Union is also exploring opportunities to better coordinate the materials strategies of individual member states. Germany, Finland, France and the Netherlands, among others, have already announced national plans to address the raw materials issue (Euractiv 2011).
70
Japan Japan’s materials policy reflects the nation’s limited domestic resources and the importance of many rare metals to its manufacturing sector, particularly consumer electronics and automobiles. The policy’s goals, as outlined in the 2009 “Strategy for Ensuring Stable Supplies of Rare Metals,” include (1) maintaining a stable supply of metals for Japanese industries by securing overseas sources of critical materials; (2) recycling rare scrap metals; (3) developing alternative materials and (4) stockpiling some rare metals (METI 2009). Japan’s raw materials policy is guided by the Ministry of Economy, Trade and Industry (METI) and implemented by JOGMEC and the Japan Bank of International Cooperation, with support from other ministries and government institutions.
JOGMEC is an independent administrative institution owned by the Japanese government that promotes a stable supply of metal resources through five activity areas:
• Providing partial funding for overseas field surveys through the Joint Basic Exploration Scheme
• Providing loan guarantees and other financial assistance to high-risk mine development projects
• Maintaining stockpiles of seven metals—nickel, chromium, manganese, cobalt, tungsten, molybdenum and vanadium—while closely monitoring the availability of indium, rare earth elements, platinum, gallium, niobium, tantalum and strontium
• Gathering and disseminating information on mineral availability and policies in various nations
• Funding and engaging in scientific research on new types of exploration, mining and recycling (JOGMEC 2007)
For the fiscal year 2011, Japan committed approximately $650 million to help mitigate supply risks for rare earth metals and other important resources. This commitment includes funding for overseas development of rare earth supplies, recycling and alternatives (Maeda 2011). Overall, the Japanese government and private industry seek to spend approximately $1.3 billion on measures to reduce supply risks associated with rare earth metals (Suga 2011).
METI and its affiliate, the New Energy and Industrial Technology Development Organization (NEDO), along with the Ministry of Education, Culture, Sports, Science and Technology and the National Institute for Materials Science directly fund research projects on substitutes for and efficient use of rare metals. Recent research projects have focused on reducing the material used in rare metals technologies and substituting rare metals with more abundant ones. In October 2010, NEDO and Hokkaido University announced the development of a motor for hybrid and electric vehicles that does not use rare earth elements, instead utilizing magnets from less expensive and more common ferrite materials (Tabuchi 2010).
Efforts to decrease the consumption of certain critical materials may already be gaining traction. Japan’s demand for cerium in 2011 is expected to be half of its 2010 levels due to increased recycling, conservation and substitution (Presentation 2011). The government also plans on establishing a hub in the Tohoku region to collect consumer electronics for the recycling of rare earths and other metals. The eventual goal is to create a national system for recycling rare metals by 2014 (Smart 2011).

71
Australia Mining accounts for 7% of Australia’s national economy (USGS 2008). Australia’s national mining policy is managed by the Department of Resources, Energy, and Tourism (RET). Policy goals involve balancing a stable investment environment that promotes mining industries, fair regulation and taxation of national resources with sustainable extraction and use of finite earth materials. A number of government entities are involved in promoting new knowledge and technologies in the mineral sector. Geosciences Australia, an agency within RET, is actively assessing Australia’s rare earth deposits and publishes reports on new discoveries throughout the country. In June 2011 the agency produced a report that reviewed the distribution, geological characteristics, resources and potential of Australia’s major rare earth deposits (Hoatson 2011). Additionally, the Minerals Down Under National Research Flagship was established as a collaborative program between the Commonwealth Scientific and Industrial Research Organization, the minerals industry and various government organizations.
In order to promote exploration and stabilize investments, Australia allows mining companies to deduct expenses or claim rebates for exploration costs and to roll over losses or profits between years. Australia is consistently ranked as the country with the fastest permitting time by the international mining consulting firm Behre Dolbear (Behre Dolbear 2010).
Canada Canada is the world’s largest exporter of minerals and metals, with natural resource mining accounting for 4% of its gross domestic product. National mining policy is managed by Natural Resources Canada, but primary responsibility for mining oversight falls under provincial jurisdiction. At the federal level, the government uses a mix of policies in finance and taxation, regulatory efficiency and investment and export promotion to maintain a globally competitive industry (Natural Resources Canada 1996). Canada also maintains a relatively flexible and favorable regulatory regime that seeks to avoid duplication, minimize uncertainty and delays and harmonize federal and provincial rules. While Canada has extensive mining and environmental regulations, it still ranks ninth out of 25 nations in terms of permitting time (Behre Dolbear 2010). Canada stores copper, gold, lead, molybdenum, nickel, silver and zinc in quantities from 0.5%–4% of national annual production levels.

72
References Ames Laboratory. 2011. “Response to U.S. Department of Energy Request for Information.” May 22.
Arnold Magnetic Technologies. 2011. “Response to U.S. Department of Energy Request for Information.” June 10.
Arnott, Sarah. 2009. “Global Commodity Demand Bounces Back.” Bloomberg Businessweek. July 23. http://www.businessweek.com/globalbiz/content/jul2009/gb20090723_961619.htm.
Barry, Sean. 2011. “Rare Earth Prices Face Downside Pressure for Remainder of the Year – US Market Sources.” Metal-Pages.com, November 2.
Behre Dolbear. 2010. 2010 Ranking Of Countries for Mining Investment. s.l.: Behre Dolbear.
British Geological Survey. 2010. Rare Earth Elements. Nottingham, UK: Natural Environment Research Council. http://www.bgs.ac.uk/downloads/start.cfm?id=1638.
Brown, R.D. Jr., 1998. Tellurium. Reston, VA: U.S. Geological Survey. http://minerals.usgs.gov/minerals/pubs/commodity/selenium/831798.pdf.
Business China. 2010. “China May Launch Rare Earth Strategic Reserve Mechanism Next Year – Source.” October 27.
CME Group. 2011. “The Global Commodities Surge: No Expiration Date?” CME Group Magazine 7(2). Chinese Society of Rare Earths website. 2011. Accessed October 12. http://www.csre.cn/en/.
Clappin, James P. 2011. “Corning Inc. Investor Relations.” Presented at the 2011 Investor Meeting, February 14.
Commission of the European Communities. 2008. “The Raw Materials Initiative—Meeting our Critical Needs for Growth and Jobs in Europe.” Brussels, Germany. http://www.euromines.org/who_is_downloads/raw_materials_initiative.pdf.
Cronin, Ben. 2011. “Rare Earth Shortages Cause Havells to Raise Fluorescent Prices.” Lighting Magazine, August 23. http://www.lighting.co.uk/news/havells-fluorescent-price-increases-due-to-rare-earth-shortages/8618899.article.
Deccan Chronicle. 2011. “Indian, Chinese Middle Class Could Boost Global Consumption: ADB.” August 23. http://www.deccanchronicle.com/channels/business/news/indian-chinese-middle-class-could-boost-global-consumption-adb-817.
The Denver Post. 2011. “Molycorp Joins Rare-Earth Magnet Venture.” November 29.
The Economist. 2011. “The Difference Engine: Nikola's Revenge.” June 2.
Euractiv. 2011. “Parliament Calls for Greater EU Clout Over Raw Materials.” September 14. http://www.euractiv.com/sustainability/parliament-calls-greater-eu-clout-raw-materials-news-507583.
European Commission, Enterprise and Industry. 2010. “Critical Raw Materials for the EU.” s.l.: Fraunhofer ISI.
73
European Commission. 2011. “Tackling the Challenges in Commodity Markets and on Raw Materials.” Brussels, Germany: European Commission, February 2. http://ec.europa.eu/enterprise/policies/raw-materials/files/docs/communication_en.pdf.
FTSE Group (Financial Times and London Stock Exchange Group). 2010. “FTSE Emerging Markets.” http://www.ftse.com/Indices/FTSE_Emerging_Markets/index.jsp.
GE (General Electric). 2011a. “Price Increase Notification – Effective August 1, 2011.” http://www.fsgi.com/images/ltgtoolbox/fluorescent_lamp_volatility/GE_Price_Increase.pdf.
GE (General Electric). 2011b. “Response to U.S. Department of Energy Request for Information.” May 24.
Global Times. 2011. “Oct. Launch for Rare Earth Association.” July 11.
Gordon, J. 2011. “Great Western Signs Rare Earth Alloy Deal.” Reuters, April 27.
Great Western Minerals Group. 2011. Presentation at TREM, March 21. http://www.tremcenter.org/index.php?option=com_attachments&task=download&id=31.
Gschneidner, K. 2011. “Replacing the Rare Earth Intellectual Capital.” Magnetics Business & Technology, Spring.
Hill, Michael D. 2011. Raw Material Scarcity and Its Impact on U.S. Ceramic Technological Development (An Industrial Perspective). Skyworks Solutions, Inc. September 9.
The Hindu. 2011. “Rise of BRIC Helped Create Global Commodity Boom: IMF.” March 5. http://www.thehindu.com/business/Economy/article1511917.ece.
Hoatson, D.M., S. Jaireth, and Y. Miezitis. 2011. “The Major Rare-Earth-Element Deposits of Australia: Geological Setting, Exploration, and Resources.” Geoscience Australia: 204.
Hook, Leslie. 2011a. “Rare Earth Prices Soar as China Stocks.” Financial Times, June 19.
Hook, L. 2011b. “Shortage of Rare Earths Looms as China Cracks Down on Mines.” Financial Times, August 23.
Humphreys, David. 2011. “Chapter 2.2 Pricing and Trading in Metals and Minerals” in SME Mining Engineering Handbook, third edition. Edited by Peter Darling.
Hur, J. and I. Suzuki. 2011. “High Rare-Earth Prices Force Hitachi, Toyota to Find Alternative.” Bloomberg News, August 28.
Idaho National Laboratory. 2011. “Response to U.S. Department of Energy Request for Information.” May 24.
IEA (International Energy Agency). 2010. World Energy Outlook 2010. Paris: IEA.
IMF (International Monetary Fund). 2011. “World Economic Outlook (WEO) Database.” Washington, DC: IMF, April. http://www.imf.org/external/pubs/ft/weo/2011/01/weodata/download.aspx.
IOL (Independent Online). 2011. “Rio Tinto: Commodity Demand to Double.” September 21. http://www.iol.co.za/business/international/rio-tinto-commodity-demand-to-double-1.1141860.

74
Iasnikov, Alex. 2011. “The Outlook for Gallium and Indium in the Electronics Sector.” Presented at The International Minor Metals Conference (MMTA), Philadelphia, May 4–6.
JOGMEC (Japan Oil, Gas and Metals National Corporation). 2007. “JOGMEC's Activities.” http://www.jogmec.go.jp/english/activities/index.html.
Kelly, Thomas et al. 2010. “Historical Statistics for Mineral and Material Commodities in the United States.” Reston, VA: U.S. Geological Survey. http://minerals.usgs.gov/ds/2005/140/.
Kingsnorth, D. 2010. “Rare Earths: Facing New Challenges in the New Decade.” Presented at the annual meeting for the Society for Mining, Metallurgy, and Exploration, Phoenix, February 27–March 4.
Kharas, Homi. 2010. The Emerging Middle Class in Developing Countries, Working Paper No. 285. Paris: OECD Development Centre. http://www.oecd.org/dataoecd/12/52/44457738.pdf.
Kinch, D. 2011. “Brazil's Vale Discovers Rare Earths in Amazon.” The Wall Street Journal, October 3.
Kitamura, M. and J. Scott, 2010. “Toyota Forms Task Force on Rare Earth Metals Amid China Export Ban Reports.” Bloomberg News, September 28.
Kramer, D.A. 1988. Gallium and Gallium Arsenide—Supply, Technology, and Uses, U.S. Bureau of Mines Information Circular 9208. Washington, DC: U.S. Department of the Interior, 25. http://babel.hathitrust.org/cgi/pt?view=image;size=100;id=mdp.39015078457820;page=root;seq=1.
Lawrence Berkley National Laboratory. 2011. “Response to U.S. Department of Energy Request for Information.” May 24.
Less Common Materials. 2011. “Response to U.S. Department of Energy Request for Information.” May 24.
Maeda, R. 2011. “Japan Budgets $650 Million for Rare Earths, Resources.” Reuters, January 5.
Metal-Pages. 2011. “Rare Earth Price Surge Hits Brazil Ferro-Alloys Producer.” October 6. https://www.metal-pages.com/news/story/57438/rare-earth-price-surge-hits-brazil-ferro-alloys-producer/.
METI (Ministry of Economy, Trade, and Industry). 2009. “Announcement of ‘Strategy for Ensuring Stable Supplies of Rare Metals’.” Accessed July 10, 2010. http://www.meti.go.jp/english/press/data/20090728_01.html.
Molycorp. 2011a. 2010 Annual Report. March 9.
Molycorp. 2011b. “Molycorp Announces Major Rare Earth Supply Agreement with Hitachi Metals,” August 11. http://phx.corporate-ir.net/phoenix.zhtml?c=236277&p=irol-newsArticle&ID=1596135&highlight=.
Molycorp. 2011c. “Response to U.S. Department of Energy Request for Information.” May 24.
MSCI (Morgan Stanley Capital International). 2011. “MSCI Emerging Markets Indices.” http://www.msci.com/products/indices/country_and_regional/em/.

75
Natural Resources Canada. 1996. The Minerals and Metals Policy of the Government of Canada: Partnerships for Sustainable Development. Ottawa, Canada: Government of Canada.
Neo Material Technologies. 2011. Presentation at Metals for Energy and the Environment 2011, June 1.
Oeko-Institut. 2011. “Response to U.S. Department of Energy Request for Information.” May 26.
Osram Sylvania. 2011. “Rare Earth Phosphor Crisis.” Letter from Rick Leaman, president and CEO. http://www.sylvania.com/Phosphors/.
Platts. 2011. “China Indium Exporters to Meet Only Half Quota as Smuggling Rises.” August 12. http://www.platts.com/RSSFeedDetailedNews/RSSFeed/Metals/8229154.
PRNewswire. 2011. “Simbol Materials Advances US EV Battery Material Production, Introduces World's Highest Purity Lithium.” September 28. http://www.prnewswire.com/news-releases/simbol-materials-advances-us-ev-battery-material-production-introduces-worlds-highest-purity-lithium-130682848.html.
Presentation at the Seminar on the Strategic Implications of Global Shortages in Critical Materials. 2011. Washington, DC. October 4.
Rare Earth Element Resources. 2011. “Response to U.S. Department of Energy Request for Information.” May 11.
REITA (Rare Earth Industry and Technology Association). 2011. “Response to U.S. Department of Energy Request for Information.” May 23.
Scott, Jason and Jennifer M. Freedman. 2011. "EU Says China Is Tightening Rare-Earth Access Even as Sale Quotas Increase." Bloomberg News. July 15. http://www.bloomberg.com/news/2011-07-14/china-almost-doubles-rare-earth-export-quota-in-second-half-after-wto-move.html
Siemens. 2011. “Siemens and Lynas to Form a Joint Venture for Magnet Production.” July 7. http://www.siemens.com/press/en/pressrelease/?press=/en/pressrelease/2011/industry/i20110742.htm.
Smart, R. 2011. “Tohoku to Become Rare Metal Recycling Hub.” Metal-Pages, October 6.
Spencer C. D. and S. Schellenberg. 2010. Trends in Global Manufacturing, Goods Movement and Consumption, and Their Effect on the Growth of United States Ports and Distribution. Herndon, VA: NAIOP Research Foundation. http://www.naiop.org/foundation/2010reports/trends_globalmanufacture.pdf
Sperling, Daniel and Deborah Gordon. 2009. Two Billion Cars: Driving Toward Sustainability. Oxford University Press: New York.
State of Alaska. 2011. “Response to U.S. Department of Energy Request for Information.” May 24.
Suga, M. 2011. “Japan to Spend 110 Billion Yen to Cut Rare Earth Usage.” Bloomberg, February 25.
Tabuchi, H. 2010. “Japan Recycles Minerals from Used Electronics.” The New York Times, October 4.
76
Taylor, A. 2005. “Feasibility Studies – Foundation or Fanstasy?” ALTA Metallurgical Services. http://www.altamet.com.au/Technical%20Papers%20and%20Articles/ Minerals%20Gazette/Feasibility%20Studies%20-%20Foundation%20or%20Fantasy.pdf.
TDK Ferrites. 2011. “Response to U.S. Department of Energy Request for Information.” April 25.
UCore Rare Metals. 2011. “Response to U.S. Department of Energy Request for Information.” May 11.
Umicore. 2011. “Response to U.S. Department of Energy Request for Information.” May 24.
United Nations, Department of Economic and Social Affairs. 2010. “World Population Prospects: The 2010 Revision.” http://esa.un.org/unpd/wpp/.
United Nations Environment Programme (UNEP) 2011. Recycling Rates of Metals: A Status Report. http://www.unep.org/resourcepanel/Portals/24102/PDFs/Metals_Recycling_Rates_110412-1.pdf.
USGS (U.S. Geological Society). 1994–2010. Mineral Commodity Summaries: Lithium. Reston, VA: USGS.
USGS (U. S. Geological Survey). 2008. 2008 Minerals Yearbook: Australia. Reston, VA: USGS.
USMMA (U.S. Magnetic Materials Association). 2011. “Response to U.S. Department of Energy Request for Information.” May 24.
VDA (Verband der Automobilindustrie). 2011. Automotive Demand Driven by BRIC Countries and the USA. January 14. http://www.vda.de/en/meldungen/news/20110125-2.html.
W. R. Grace & Co. 2010. “Grace Announces Rare Earth Surcharge for FCC Catalysts and Additives.” August 25. http://www.grace.com/Media/NewsItem.aspx?id=1463179.
Wald, L. Mathew. 2011. “Start-Up in California Plans to Capture Lithium, and Market Share.” The New York Times, September 28.
World Economic Forum. 2009. Issues: Sustainable Consumption. http://www.weforum.org/issues/sustainable-consumption.
World Fact Book. 2011. Country Comparison: Phones, Mobile Cellular and Number of Internet Hosts Available within a Country. Central Intelligence Agency. Accessed on October 4. https://www.cia.gov/index.html.
World Finances. 2011. Major and Minor Industrial Metals. April 10. http://world-finances.com/metal-industries/major-and-minor-industrial-metals.
Yan, Z. and Y. Yijun. 2010. “Rare Earth Reserve Approved.” China Daily, February 11.
Zacks Equity Research. 2011. Metals & Mining Industry Outlook - March 2011. March 25. http://www.zacks.com/stock/news/49939/Metals+%26amp%3B+Mining+Industry+Outlook.
Zhou, Y. 2011. “Limited Rare Earths the New Norm.” China Daily, September 16.

77
Chapter 4. Supply and Demand Projections This chapter explores the extent to which more widespread deployment of clean energy technologies could lead to imbalances of supply and demand for rare earth elements (REEs) and other key materials. To assess these risks, the projected levels of demand for each key material are compared with projected levels of supply.57
The basic methodology used to estimate future demand and supply is the same as was used in the 2010 Critical Materials Strategy. The supply and demand projections still use 2010 as a base year, which allows for a clear comparison with the 2010 Critical Materials Strategy. This Strategy includes an added “Elements to Watch” section, which features a qualitative discussion of magnesium, gadolinium and vanadium.
Demand projections for each element are developed based on different scenarios for market penetration of technologies using key materials, coupled with high and low estimates for key material content in each technology. Supply projections include estimates of existing production and additional capacity expected by 2015.
The rapid deployment of clean energy technologies could create the potential for a supply-demand mismatch for a number of key materials. For most materials, the overall supply-demand picture is very similar to the one presented in the 2010 Critical Materials Strategy.
The main differences in bottom-line conclusions for individual materials are the following:
• Lanthanum, cerium and europium experienced the most significant supply shortfalls in 2010. However, this supply-demand mismatch for lanthanum and cerium is temporary. The supply-demand picture for these two elements is likely to improve due to recent demand destruction due to price spikes and increased supply from new mines coming online in the next few years.
• The supply-demand picture for indium, gallium and tellurium used in PV technologies is slightly better than depicted in the 2010 Critical Materials Strategy, driven by lower material content estimates. However, lower material content of indium may come at the expense of higher gallium content.
• The demand for europium, terbium and yttrium used in lighting phosphors is projected to spike between 2012 and 2014, which coincides with the implementation of new U.S. lighting efficiency standards. There is significant potential for supply-demand mismatches for these elements throughout the short and medium terms.
The main changes in baseline parameters and assumptions from the 2010 Critical Materials Strategy include the following:
• Updated estimates for rare earth production and consumption in 2010 • Expectations for a decrease in overall rare earth demand from 2010 to 2011 • A 7% (approximate) increase in expected overall rare earth production in 2015, stemming
largely from increased estimates for production at Mountain Pass • Adjustments to non-clean energy demand, to account for decreases in global rare earth oxide
(REO) demand during 2011, followed by annual increases starting in 2012
57 In this chapter, the terms supply and demand are used synonymously with the terms production and consumption, respectively.

78
• The addition of electric bicycles as a demand for permanent magnet (PM) motors • Update of wind and photovoltaic (PV) deployment, based on the International Energy Agency
(IEA) World Energy Outlook 2010 • Updated phosphor analysis incorporating projections for lamp demand and estimated material
content for individual types of lamps • The addition of nickel and manganese to the analysis for batteries
Other differences from the 2010 Critical Materials Strategy are highlighted in the text.
Though there is an analysis of fluid catalytic cracking (FCC) catalysts in Chapter 2, FCC catalysts are not included in the projections because they are not anticipated to contribute to an increase in demand for lanthanum over time. Any constraint on lanthanum availability for FCC catalysts is expected to be a short-term issue.
4.1 General Methodology for Estimating Future Demand for Key Materials Future demand for key materials will come from both clean energy and non-clean energy sources. This section discusses the general methodology for estimating future demand for key materials in both categories.
The first step in projecting demand for key materials is to estimate expected demand in non-clean energy technologies. These include mobile communication devices, polishing powders and flat screen televisions. Time and resource constraints precluded projections for each of the many non-clean energy technologies that use REEs and other key materials. Instead, this analysis assumes that demand for key materials in non-clean energy technologies increases at the rate of growth for the global economy projected in the IEA’s World Energy Outlook 2010.58
Global demand for REOs in 2011 is projected to fall about 4% from 2010 levels (125,000 tonnes in 2010 to 120,000 tonnes in 2011) (IMCOA 2011). To account for this trend, non-clean energy demand for each REE in 2011 is assumed to be 4% less than its 2010 value. Non-clean energy demand estimates for 2012 and onward are calculated based on a compound annual growth rate from the adjusted 2011 demand estimates.
Accordingly, that demand is projected to increase from its current levels at a compound annual growth rate of 3.6% from 2010–2020, and at a compound annual growth rate of 2.9% from 2021–2025. To estimate non-clean energy demand in 2010 for materials other than rare earths, an estimate of 2010 clean energy demand (Trajectory B as described below) is subtracted from total material demand in 2010.
59
The next step in projecting demand for key materials is to estimate expected annual demand in clean energy technologies. This analysis focuses on four main components of REEs and other key materials among clean energy technologies:
58 Some historical data and basic growth projections exist for non-clean energy applications; however, future demand will be governed by complex market dynamics, including the extent to which increased clean energy demand prompts innovations that reduce material requirements for all applications. 59 The 4% adjustment is based on the expected decrease in total REO demand from 2010–2011. It does not take into account changes in demand for individual elements, which were not available as of the publication of this Strategy.
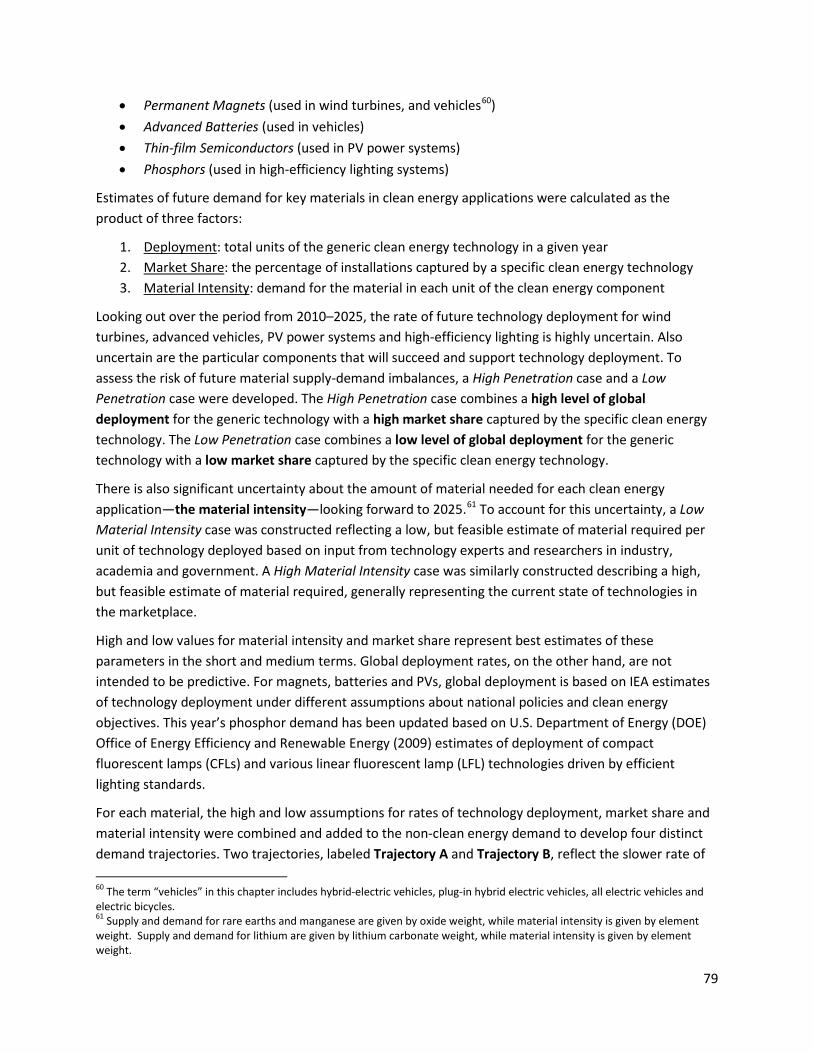
79
• Permanent Magnets (used in wind turbines, and vehicles60
• Advanced Batteries (used in vehicles) )
• Thin-film Semiconductors (used in PV power systems) • Phosphors (used in high-efficiency lighting systems)
Estimates of future demand for key materials in clean energy applications were calculated as the product of three factors:
1. Deployment: total units of the generic clean energy technology in a given year 2. Market Share: the percentage of installations captured by a specific clean energy technology 3. Material Intensity: demand for the material in each unit of the clean energy component
Looking out over the period from 2010–2025, the rate of future technology deployment for wind turbines, advanced vehicles, PV power systems and high-efficiency lighting is highly uncertain. Also uncertain are the particular components that will succeed and support technology deployment. To assess the risk of future material supply-demand imbalances, a High Penetration case and a Low Penetration case were developed. The High Penetration case combines a high level of global deployment for the generic technology with a high market share captured by the specific clean energy technology. The Low Penetration case combines a low level of global deployment for the generic technology with a low market share captured by the specific clean energy technology.
There is also significant uncertainty about the amount of material needed for each clean energy application—the material intensity—looking forward to 2025.61
High and low values for material intensity and market share represent best estimates of these parameters in the short and medium terms. Global deployment rates, on the other hand, are not intended to be predictive. For magnets, batteries and PVs, global deployment is based on IEA estimates of technology deployment under different assumptions about national policies and clean energy objectives. This year’s phosphor demand has been updated based on U.S. Department of Energy (DOE) Office of Energy Efficiency and Renewable Energy (2009) estimates of deployment of compact fluorescent lamps (CFLs) and various linear fluorescent lamp (LFL) technologies driven by efficient lighting standards.
To account for this uncertainty, a Low Material Intensity case was constructed reflecting a low, but feasible estimate of material required per unit of technology deployed based on input from technology experts and researchers in industry, academia and government. A High Material Intensity case was similarly constructed describing a high, but feasible estimate of material required, generally representing the current state of technologies in the marketplace.
For each material, the high and low assumptions for rates of technology deployment, market share and material intensity were combined and added to the non-clean energy demand to develop four distinct demand trajectories. Two trajectories, labeled Trajectory A and Trajectory B, reflect the slower rate of 60 The term “vehicles” in this chapter includes hybrid-electric vehicles, plug-in hybrid electric vehicles, all electric vehicles and electric bicycles. 61 Supply and demand for rare earths and manganese are given by oxide weight, while material intensity is given by element weight. Supply and demand for lithium are given by lithium carbonate weight, while material intensity is given by element weight.

80
penetration for each application and represent combinations of the Low Penetration case with the high and low assumptions, respectively, for material intensity. Similarly, two trajectories, called Trajectory C and Trajectory D, represent combinations of the High Penetration case with the respective low and high material intensity assumptions. In the figures comparing future supply and demand for each material that appear later in this chapter, Trajectories A and B are shown in blue and Trajectories C and D are shown in green. Also in those figures, high material intensity cases (Trajectories B and D) are shown as solid lines and low material intensity cases (Trajectories A and C) are shown as dashed lines. The characteristics describing Trajectories A, B, C and D are listed in Table 4-1.
Table 4-1. Assumptions to Estimate Future Trajectories of Material Demand
Trajectory of Demand
Market Penetration Material Intensity of the Clean Energy Component Global Deployment Level of the
Generic Technology Market Share of Specific Clean
Energy Technology Trajectory A Low Low Low
Trajectory B Low Low High
Trajectory C High High Low
Trajectory D High High High
None of the four trajectories analyzed in this Strategy is intended to imply a prediction of future demand for clean energy technologies or key materials used in making them. That demand will depend on a number of factors, including technological progress, policy consistency and macroeconomic conditions. Instead, the trajectories are intended to illustrate a range of future possibilities and explore the impact of different assumptions concerning technology deployment rates, market shares and material intensity on future requirements for REEs and other key materials. Trajectories A and D will represent the lower and upper extremes, respectively, for probable material demand.
In the following sections, these four trajectories are calculated for each key material in clean energy technologies. For key materials that are used in several clean energy technologies, the trajectories of future demand are presented as an aggregate for all relevant technologies. The contribution of each application is noted in the discussion of the figure. For example, Trajectory A demand for neodymium represents the sum of non-clean energy demand, the Trajectory A requirements for magnets used in wind turbines and vehicles (including bicycles) and the Trajectory A requirement for batteries used in hybrid electric vehicles (HEVs).
4.2 Short- and Medium-Term Supplies of Key Materials The Earth’s crust contains sufficient REEs and other key materials to meet projected demand in the decades ahead. However, short- to medium-term growth in demand for these materials in clean energy technology and other applications may strain the ability of supply chains to provide global markets with a smooth flow of materials at stable prices. The first step in the supply chain—mines—often requires a number of years to be brought online. This section describes potential production increases of REEs and other elements by 2015. Estimates of potential additional rare earth supplies are based on projected capacity addition(s) and estimated average element distribution by deposit. For all key materials, additional capacity includes projects that are currently in later stages of development. An important

81
caveat is that actual startup dates may be postponed due to economic or other factors. The figures in sections 4.3–4.6 show 2010 production with a solid red line and total production by 2015 with a dashed red line.
Short- and Medium-Term Supplies of Rare Earth Elements Global REO production was estimated at 118,500 tonnes in 2010, with the vast majority of supply originating in China. Around the world, there are many promising mineral deposits that could be developed to meet future growth in demand for rare earths. These deposits are found on at least six continents, including significant resources in Asia, Australia, North America and Africa. Whether a deposit can be mined economically will depend on a number of factors, including rare earth prices, regulatory requirements and improvements in extraction and separation technologies.
To estimate the element-specific supplies for 2015, the expansion in production capacity is multiplied by the average percentage distribution of individual elements by deposit. This estimate may deviate from actual production because (1) the actual element distribution can vary within the ore or deposit, and (2) the actual production does not necessarily correspond with the average distribution of elements within the ore or deposit, depending on market economics and production capability. With these caveats, potential production from new mines coming online before 2015 is shown in Table 4.2. For supply within China, uncertainties abound in terms of overall production and the composition of light rare earths vs. heavy rare earths.62
62 The light rare earths (atomic numbers 57–61), such as lanthanum and neodymium, and medium rare earths (atomic numbers 62–64), such as europium, are found mainly in bastnäsite and monazite. Heavy rare earths (atomic numbers 65–71), such as terbium and dysprosium, along with yttrium (atomic number 39), are somewhat more scarce and often concentrated in ionic adsorption clay and xenotime, commonly found in southeastern China.
Supply consolidations and greater environmental conservation could potentially lead to lower production within China. However, market forces within and outside of China will likely encourage additional production. Balancing these factors, DOE has conservatively assumed that the overall amount and individual rare earth distribution of China’s supply moving forward will stay fixed at the 2010 level and composition. Outside of China, Molycorp’s Mountain Pass mine (California) is projected to begin processing and separating newly mined ore in early 2012, with anticipated 2012 production of 8,000–10,000 tonnes of REO (Gordon 2011). Mountain Pass already produces rare earths by processing its existing tailings stockpile, with anticipated production of approximately 4,500–5,000 tonnes in 2011 (Elmquist 2011). Molycorp is building new refining and manufacturing facilities at the site in a two-phase construction program called “Project Phoenix.” Under the first phase, Molycorp expects to produce approximately 20,000 tonnes per year by 2013. Under the second phase (expected to be mechanically complete in 2013), the company will expand capacity an additional 20,000 tonnes (Gordon 2011). Mount Weld mine (Australia) is slated to come online in 2012, slightly later than its previous projected opening in late 2011. Lynas Corporation, the owner of the mine, has commenced mining and ore concentration at Mount Weld. Construction and permitting is in progress for a facility in Malaysia that will further process and separate the concentrate. Permitting issues at the Malaysia processing facility have contributed to the delay in Mount Weld production. Projected annual production from the Mountain Pass (phase I) and Mount Weld mines is also shown in the figures in sections 4.3–4.6.
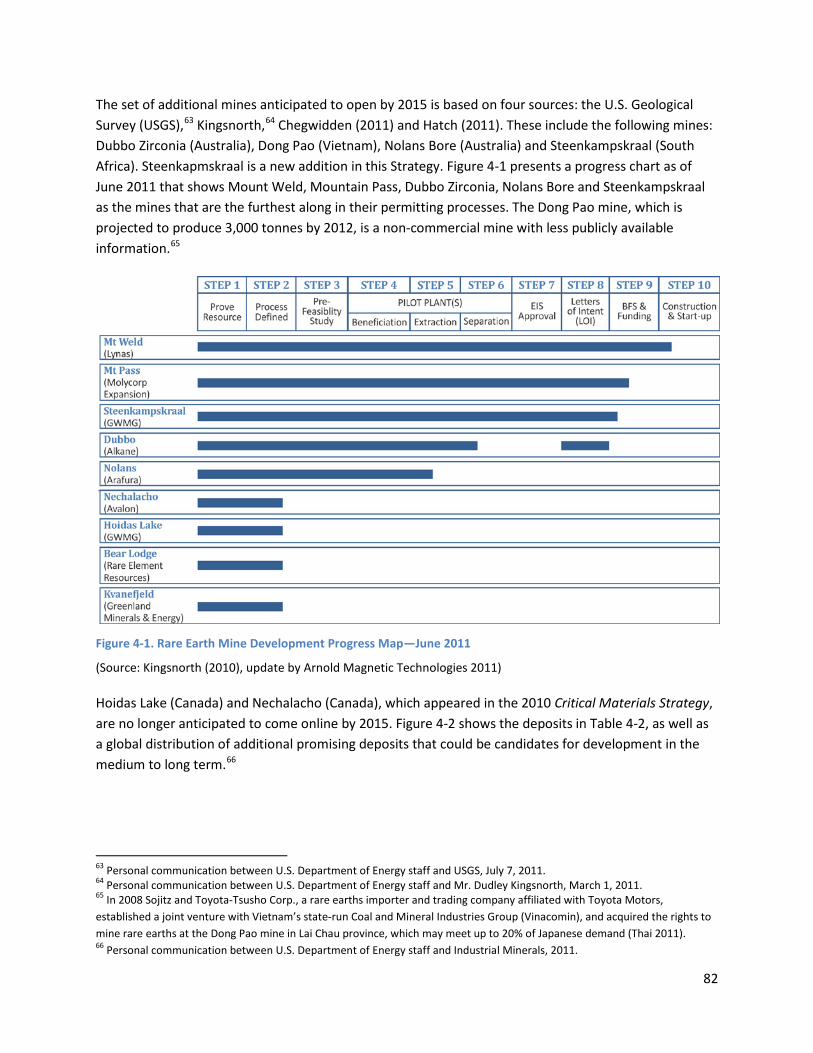
82
The set of additional mines anticipated to open by 2015 is based on four sources: the U.S. Geological Survey (USGS),63 Kingsnorth,64 Chegwidden (2011) and Hatch (2011). These include the following mines: Dubbo Zirconia (Australia), Dong Pao (Vietnam), Nolans Bore (Australia) and Steenkampskraal (South Africa). Steenkapmskraal is a new addition in this Strategy. Figure 4-1 presents a progress chart as of June 2011 that shows Mount Weld, Mountain Pass, Dubbo Zirconia, Nolans Bore and Steenkampskraal as the mines that are the furthest along in their permitting processes. The Dong Pao mine, which is projected to produce 3,000 tonnes by 2012, is a non-commercial mine with less publicly available information.65
Figure 4-1. Rare Earth Mine Development Progress Map—June 2011
(Source: Kingsnorth (2010), update by Arnold Magnetic Technologies 2011)
Hoidas Lake (Canada) and Nechalacho (Canada), which appeared in the 2010 Critical Materials Strategy, are no longer anticipated to come online by 2015. Figure 4-2 shows the deposits in Table 4-2, as well as a global distribution of additional promising deposits that could be candidates for development in the medium to long term.66
63 Personal communication between U.S. Department of Energy staff and USGS, July 7, 2011.
64 Personal communication between U.S. Department of Energy staff and Mr. Dudley Kingsnorth, March 1, 2011. 65 In 2008 Sojitz and Toyota-Tsusho Corp., a rare earths importer and trading company affiliated with Toyota Motors, established a joint venture with Vietnam’s state-run Coal and Mineral Industries Group (Vinacomin), and acquired the rights to mine rare earths at the Dong Pao mine in Lai Chau province, which may meet up to 20% of Japanese demand (Thai 2011). 66 Personal communication between U.S. Department of Energy staff and Industrial Minerals, 2011.

83
Figure 4-2. Current and Projected Rare Earth Projects Outside China67
67 Ibid.
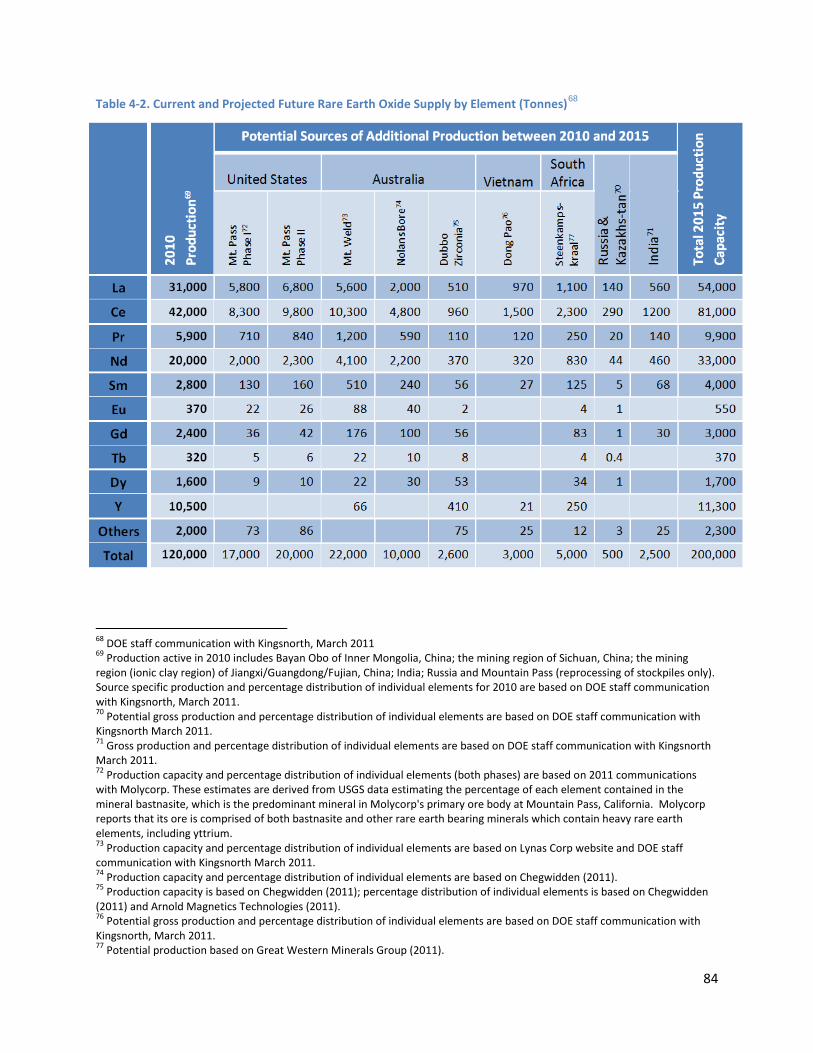
84
Table 4-2. Current and Projected Future Rare Earth Oxide Supply by Element (Tonnes)68
2010
Pr
oduc
tion69
Potential Sources of Additional Production between 2010 and 2015
Tota
l 201
5 Pr
oduc
tion
Ca
paci
ty
United States Australia Vietnam South Africa
Russ
ia &
Ka
zakh
s-ta
n70
Indi
a
71
Mt.
Pass
Phas
e I
72
Mt.
Pass
Phas
e II
Mt.
Wel
d73
Nol
ans B
ore 74
Dubb
o Zi
rcon
ia
75
Dong
Pao
76
Stee
nkam
ps-
kraa
l
77
La
31,000 5,800 6,800 5,600 2,000 510 970 1,100 140 560 54,000
Ce 42,000 8,300 9,800 10,300 4,800 960 1,500 2,300 290 1200 81,000
Pr 5,900 710 840 1,200 590 110 120 250 20 140 9,900
Nd 20,000 2,000 2,300 4,100 2,200 370 320 830 44 460 33,000
Sm 2,800 130 160 510 240 56 27 125 5 68 4,000
Eu 370 22 26 88 40 2 4 1 550
Gd 2,400 36 42 176 100 56 83 1 30 3,000
Tb 320 5 6 22 10 8 4 0.4 370
Dy 1,600 9 10 22 30 53 34 1 1,700
Y 10,500 66 410 21 250 11,300
Others 2,000 73 86 75 25 12 3 25 2,300
Total 120,000 17,000 20,000 22,000 10,000 2,600 3,000 5,000 500 2,500 200,000
68 DOE staff communication with Kingsnorth, March 2011 69 Production active in 2010 includes Bayan Obo of Inner Mongolia, China; the mining region of Sichuan, China; the mining region (ionic clay region) of Jiangxi/Guangdong/Fujian, China; India; Russia and Mountain Pass (reprocessing of stockpiles only). Source specific production and percentage distribution of individual elements for 2010 are based on DOE staff communication with Kingsnorth, March 2011. 70 Potential gross production and percentage distribution of individual elements are based on DOE staff communication with Kingsnorth March 2011. 71 Gross production and percentage distribution of individual elements are based on DOE staff communication with Kingsnorth March 2011. 72 Production capacity and percentage distribution of individual elements (both phases) are based on 2011 communications with Molycorp. These estimates are derived from USGS data estimating the percentage of each element contained in the mineral bastnasite, which is the predominant mineral in Molycorp's primary ore body at Mountain Pass, California. Molycorp reports that its ore is comprised of both bastnasite and other rare earth bearing minerals which contain heavy rare earth elements, including yttrium. 73 Production capacity and percentage distribution of individual elements are based on Lynas Corp website and DOE staff communication with Kingsnorth March 2011. 74 Production capacity and percentage distribution of individual elements are based on Chegwidden (2011). 75 Production capacity is based on Chegwidden (2011); percentage distribution of individual elements is based on Chegwidden (2011) and Arnold Magnetics Technologies (2011). 76 Potential gross production and percentage distribution of individual elements are based on DOE staff communication with Kingsnorth, March 2011. 77 Potential production based on Great Western Minerals Group (2011).
85
Emerging Supplies of Other Key Materials Additional elements playing key roles in the development of clean energy applications include indium, gallium, tellurium, cobalt, lithium, nickel and manganese. Table 4-3 includes current production and potential supply by 2015 for each of these elements (based on current production capacity and estimated additional production capacity).
Major differences in current and projected available supply relative to the 2010 Critical Materials Strategy include the following:
• Inclusion of manganese dioxide and nickel • Estimated 2010 production data for gallium, tellurium, cobalt and lithium are higher, ranging
from 8% higher for lithium to 29% higher for gallium • For additional supply by 2015, a downward revision of around 65% for tellurium and cobalt; and
an upward revision of 10% for gallium
According to the Indium Corporation, one of the world’s largest producers of indium, the 2010 global primary production of virgin indium (mainly a byproduct of zinc production) was around 480 tonnes, while reclaimed indium contributed another 865 tonnes (Indium Corp. 2010). The estimated additional supply of indium coming online by 2015 is based on a combination of assuming maximum capacity utilization of primary production (600 tonnes), an 80% scrap recovery from indium tin oxide processing (960 tonnes) and 47 tonnes from several new supplies of virgin indium brought online by 2015.78
The updated estimate of gallium production for 2010 is slightly higher than what appeared in the 2010 Critical Materials Strategy. Gallium is primarily a byproduct of alumina production. In 2010, only about 10% of alumina producers extracted gallium as a byproduct of alumina processed from bauxite ore. The remainder of producers found it too expensive to extract the gallium, and thus treated it as an impurity in the aluminum refining process. USGS estimated that in terms of global supply of gallium in 2010, about 182 tonnes of global primary production of gallium was supplemented by an additional 86 tonnes of stockpiled primary gallium and refined gallium.
79 The additional gallium production assumed to come online between 2010 and 2015 includes additional production from maximum utilization of current production capacity for mining and refining as well as from new capacity for gallium production in China projected by 2015. 80
78 The mines and assumed respective supplies are (i) North Queensland Metals Baal Gamm mine in Australia (15 tonnes/year), (ii) South American Silver’s Malku Khota mine in Bolivia (15–20 tonnes/year), (iii) Votorantim Metais’ Juiz de For a mine in Brazil (15 tonnes/year) and (iv) UMMC’s Electrozinc facility in Russia (2 tonnes/year). 79 Written correspondence with USGS, November 2011. 80 Ibid.

86
Table 4-3. Current and Future Supply of Additional Elements Assessed (Tonnes)
Potential Sources of Additional Production between 2010 and 2015 2010
Production Additional
Amount Sources 2015 Production
Capacity
Indium 1,30081 270
Recovery as byproduct from maximum utilization of current production and refining capacity plus additional zinc production, as well as recycling
1,600
Gallium 27082 90
Recovery as byproduct from maximum utilization of current production and refining capacity plus additional alumina and bauxite production
360
Tellurium 630 210 Recovery as byproduct from copper anode slimes
840
Cobalt 90,000 91,000 Mines83 180,000 Lithium Carbonate Equivalent
150,000 100,000 Brines and mines 250,000
Nickel 1,600,000 840,000 Mines 2,400,000 Manganese Dioxide
790,00084 47,000 Synthetic (electrolytic and chemical) manganese dioxide
840,000
(Sources: USGS85
The estimated 2010 global tellurium production figure is from USGS, and is an increase from the estimate in last year’s report. Additional tellurium supply is based on the assumption that annual copper production will grow at 3%, and that approximately 60% of the 1,200 tonnes per year of the tellurium supply from copper anode slimes will come online by 2015, as indicated by USGS in the 2008 USGS Minerals Yearbook. Global tellurium production could grow by about a factor of four from increased levels of extraction from copper anode slimes by 2020, but may grow more slowly if copper refiners move away from the electrolytic process as the quality of copper ore declines. Additional supplies of tellurium also may be produced from direct tellurium mining projects and from efforts to recover tellurium from gold concentrates. However, no specific assumptions were made about these potential additional supplies due to insufficient information.
; Indium Corp. 2010)
The 2010 global cobalt mine production estimate is 89,500 tonnes. This is based on reports from individual companies or countries to USGS or USGS estimates. The current estimate for 2015 global
81 Data source of Indium Corporation includes in this estimate both primary/virgin and reclaimed sources of indium. 82 Data source of USGS includes in this estimate primary/virgin and refined gallium, but not secondary supply because secondary supply of gallium is difficult to ascertain. 83 Written communication with USGS, October 27, 2011. Including active mining and processing of stockpiled intermediate materials. 84 Based on USGS estimates of synthetic manganese dioxide (assuming 57% average manganese content) and natural manganese dioxide (assuming 49% average manganese content). 85 Written communication with USGS, September –November, 2011.
87
cobalt mine production capacity is 180,000 tonnes. This is based on USGS analysis of existing capacity plus announced additional capacity of cobalt mines.86
For lithium, the estimated 2010 production of lithium carbonate equivalent was updated according to the 2011 USGS Mineral Commodity Summary, and is an increase from the 2010 Critical Materials Strategy. In the near- to mid-term future, additional low-cost evaporative lithium resources may be developed from the high desert brines in Argentina and Chile, as well as from the geothermal brines in the western United States.
87
Nickel is considered for the first time in this Strategy. Current and projected supply numbers for nickel represent only primary production from mines. Projected supply includes estimated 2010 production (USGS 2011) plus production estimates for new mines anticipated to open between 2011 and 2014 (USGS 2011). A significant amount of nickel is also recovered in the form of stainless steel scrap. This scrap metal cannot be used directly for battery production, although it offsets demand for freshly mined nickel in stainless steel making.
Due to the uncertain nature of the lithium claims by emerging companies, this Strategy takes into account only the expansion plans of the current lithium producers for the additional estimated supply by 2015.
Manganese is also considered for the first time in this Strategy. Manganese dioxide supply numbers shown in Table 4-3 only include battery-grade manganese dioxide that is suitable for use in vehicle batteries. Manganese dioxide represents less than 5% of global manganese production, estimated at approximately 13 million tonnes in 2010 (USGS 2011). Manganese dioxide supply includes both naturally occurring manganese dioxide, produced from mines, and synthetic manganese dioxide. The latter includes both electrolytic manganese dioxide (EMD) and chemical manganese dioxide (CMD). The relatively small increase in production forecast by 2015 reflects two competing trends—a decrease in natural manganese dioxide production capacity offset by a larger increase in EMD and CMD production. The 2015 forecast also takes into account general expectations of an only modest increase in demand, and could potentially increase if future demand increase is greater than expected. Some additional EMD and CMD production capacity already exists.88
4.3 Trajectories of Future Demand for Rare Earth Elements in Magnet Technologies
Rare earth PMs are used in vehicles (including electric bicycles) and wind turbines. These magnets incorporate several key materials, most notably neodymium and dysprosium.89
The assumptions for deployment, market share and material intensity used to create trajectories of future demand for key materials in magnet technologies are presented in Table 4-4.
86 Written communication with the U.S. Geological Survey, October 27, 2011. 87 Written communication with the U.S. Geological Survey, October 27, 2011. Bolivia’s lithium is currently not considered a reserve (economic), but a sub-economic identified resource that has potential to become economic in the future. 88 Personal communication between U.S. Department of Energy staff and the U.S. Geological Survey, October 26 2011. 89 Personal communication between U.S. Department of Energy staff and Arnold Magnetic Technologies, 2011. Praseodymium can be partially substituted for neodymium in magnets. However, the extent of this substitution is thought to be small (less than 5%) for high-performance magnets used in vehicles and wind turbines. (Arnold Magnetic Technologies 2011).
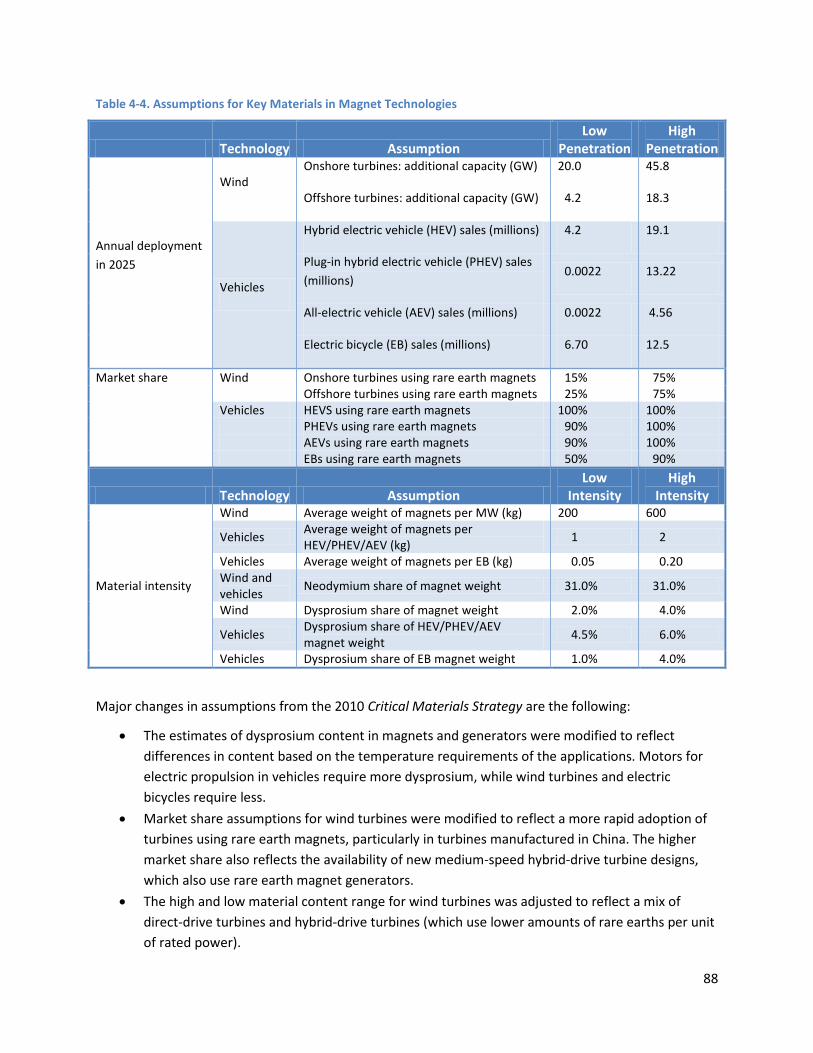
88
Table 4-4. Assumptions for Key Materials in Magnet Technologies
Technology Assumption Low
Penetration High
Penetration
Annual deployment in 2025
Wind Onshore turbines: additional capacity (GW) 20.0 45.8
Offshore turbines: additional capacity (GW) 04.2 18.3
Vehicles
Hybrid electric vehicle (HEV) sales (millions) 04.2 19.1
Plug-in hybrid electric vehicle (PHEV) sales (millions)
00.0022 13.22
All-electric vehicle (AEV) sales (millions) 00.0022 4.56
Electric bicycle (EB) sales (millions) 06.70 12.5
Market share Wind Onshore turbines using rare earth magnets 015% 075% Offshore turbines using rare earth magnets 025% 075% Vehicles HEVS using rare earth magnets 100% 100% PHEVs using rare earth magnets 090% 100% AEVs using rare earth magnets 090% 100% EBs using rare earth magnets 050% 090%
Technology Assumption Low
Intensity High
Intensity
Material intensity
Wind Average weight of magnets per MW (kg) 200 600
Vehicles Average weight of magnets per HEV/PHEV/AEV (kg) 001 002
Vehicles Average weight of magnets per EB (kg) 000.05 000.20 Wind and vehicles Neodymium share of magnet weight 031.0% 031.0%
Wind Dysprosium share of magnet weight 002.0% 004.0%
Vehicles Dysprosium share of HEV/PHEV/AEV magnet weight 004.5% 006.0%
Vehicles Dysprosium share of EB magnet weight 001.0% 004.0%
Major changes in assumptions from the 2010 Critical Materials Strategy are the following:
• The estimates of dysprosium content in magnets and generators were modified to reflect differences in content based on the temperature requirements of the applications. Motors for electric propulsion in vehicles require more dysprosium, while wind turbines and electric bicycles require less.
• Market share assumptions for wind turbines were modified to reflect a more rapid adoption of turbines using rare earth magnets, particularly in turbines manufactured in China. The higher market share also reflects the availability of new medium-speed hybrid-drive turbine designs, which also use rare earth magnet generators.
• The high and low material content range for wind turbines was adjusted to reflect a mix of direct-drive turbines and hybrid-drive turbines (which use lower amounts of rare earths per unit of rated power).
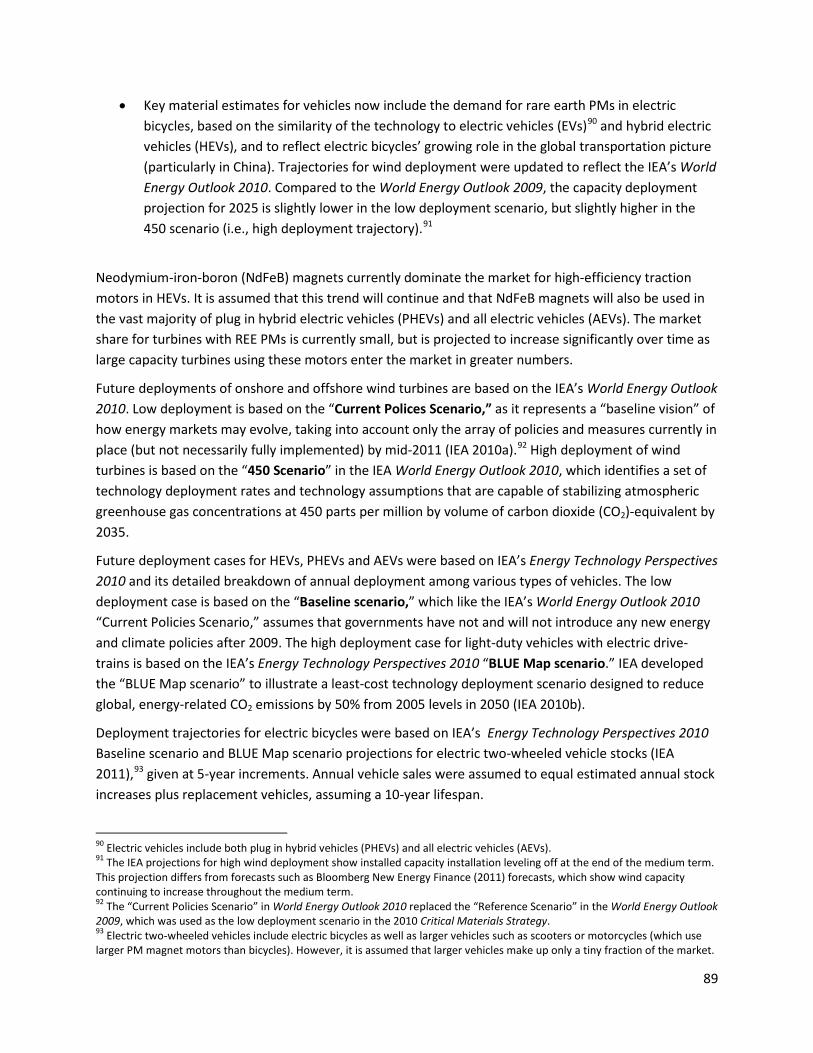
89
• Key material estimates for vehicles now include the demand for rare earth PMs in electric bicycles, based on the similarity of the technology to electric vehicles (EVs)90 and hybrid electric vehicles (HEVs), and to reflect electric bicycles’ growing role in the global transportation picture (particularly in China). Trajectories for wind deployment were updated to reflect the IEA’s World Energy Outlook 2010. Compared to the World Energy Outlook 2009, the capacity deployment projection for 2025 is slightly lower in the low deployment scenario, but slightly higher in the 450 scenario (i.e., high deployment trajectory).91
Neodymium-iron-boron (NdFeB) magnets currently dominate the market for high-efficiency traction motors in HEVs. It is assumed that this trend will continue and that NdFeB magnets will also be used in the vast majority of plug in hybrid electric vehicles (PHEVs) and all electric vehicles (AEVs). The market share for turbines with REE PMs is currently small, but is projected to increase significantly over time as large capacity turbines using these motors enter the market in greater numbers.
Future deployments of onshore and offshore wind turbines are based on the IEA’s World Energy Outlook 2010. Low deployment is based on the “Current Polices Scenario,” as it represents a “baseline vision” of how energy markets may evolve, taking into account only the array of policies and measures currently in place (but not necessarily fully implemented) by mid-2011 (IEA 2010a).92
Future deployment cases for HEVs, PHEVs and AEVs were based on IEA’s Energy Technology Perspectives 2010 and its detailed breakdown of annual deployment among various types of vehicles. The low deployment case is based on the “Baseline scenario,” which like the IEA’s World Energy Outlook 2010 “Current Policies Scenario,” assumes that governments have not and will not introduce any new energy and climate policies after 2009. The high deployment case for light-duty vehicles with electric drive-trains is based on the IEA’s Energy Technology Perspectives 2010 “BLUE Map scenario.” IEA developed the “BLUE Map scenario” to illustrate a least-cost technology deployment scenario designed to reduce global, energy-related CO2 emissions by 50% from 2005 levels in 2050 (IEA 2010b).
High deployment of wind turbines is based on the “450 Scenario” in the IEA World Energy Outlook 2010, which identifies a set of technology deployment rates and technology assumptions that are capable of stabilizing atmospheric greenhouse gas concentrations at 450 parts per million by volume of carbon dioxide (CO2)-equivalent by 2035.
Deployment trajectories for electric bicycles were based on IEA’s Energy Technology Perspectives 2010 Baseline scenario and BLUE Map scenario projections for electric two-wheeled vehicle stocks (IEA 2011),93
90 Electric vehicles include both plug in hybrid vehicles (PHEVs) and all electric vehicles (AEVs).
given at 5-year increments. Annual vehicle sales were assumed to equal estimated annual stock increases plus replacement vehicles, assuming a 10-year lifespan.
91 The IEA projections for high wind deployment show installed capacity installation leveling off at the end of the medium term. This projection differs from forecasts such as Bloomberg New Energy Finance (2011) forecasts, which show wind capacity continuing to increase throughout the medium term. 92 The “Current Policies Scenario” in World Energy Outlook 2010 replaced the “Reference Scenario” in the World Energy Outlook 2009, which was used as the low deployment scenario in the 2010 Critical Materials Strategy. 93 Electric two-wheeled vehicles include electric bicycles as well as larger vehicles such as scooters or motorcycles (which use larger PM magnet motors than bicycles). However, it is assumed that larger vehicles make up only a tiny fraction of the market.
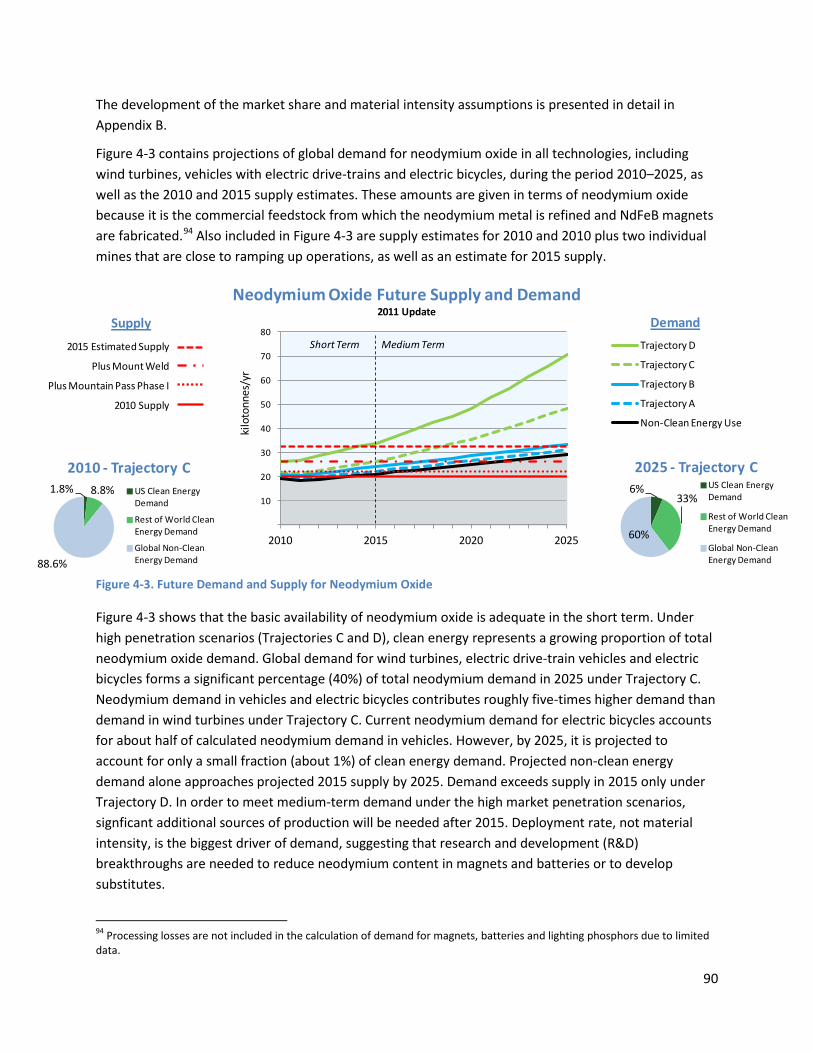
90
The development of the market share and material intensity assumptions is presented in detail in Appendix B.
Figure 4-3 contains projections of global demand for neodymium oxide in all technologies, including wind turbines, vehicles with electric drive-trains and electric bicycles, during the period 2010–2025, as well as the 2010 and 2015 supply estimates. These amounts are given in terms of neodymium oxide because it is the commercial feedstock from which the neodymium metal is refined and NdFeB magnets are fabricated.94
Figure 4-3. Future Demand and Supply for Neodymium Oxide
Also included in Figure 4-3 are supply estimates for 2010 and 2010 plus two individual mines that are close to ramping up operations, as well as an estimate for 2015 supply.
Figure 4-3 shows that the basic availability of neodymium oxide is adequate in the short term. Under high penetration scenarios (Trajectories C and D), clean energy represents a growing proportion of total neodymium oxide demand. Global demand for wind turbines, electric drive-train vehicles and electric bicycles forms a significant percentage (40%) of total neodymium demand in 2025 under Trajectory C. Neodymium demand in vehicles and electric bicycles contributes roughly five-times higher demand than demand in wind turbines under Trajectory C. Current neodymium demand for electric bicycles accounts for about half of calculated neodymium demand in vehicles. However, by 2025, it is projected to account for only a small fraction (about 1%) of clean energy demand. Projected non-clean energy demand alone approaches projected 2015 supply by 2025. Demand exceeds supply in 2015 only under Trajectory D. In order to meet medium-term demand under the high market penetration scenarios, signficant additional sources of production will be needed after 2015. Deployment rate, not material intensity, is the biggest driver of demand, suggesting that research and development (R&D) breakthroughs are needed to reduce neodymium content in magnets and batteries or to develop substitutes.
94 Processing losses are not included in the calculation of demand for magnets, batteries and lighting phosphors due to limited data.
10
20
30
40
50
60
70
80
2010 2015 2020 2025
kilo
tonn
es/y
r
Neodymium Oxide Future Supply and Demand2011 Update
Trajectory D
Trajectory C
Trajectory B
Trajectory A
Non-Clean Energy Use
DemandSupply2015 Estimated Supply
Plus Mount Weld
Plus Mountain Pass Phase I
2010 Supply
Short Term Medium Term
6%33%
60%
2025 - Trajectory CUS Clean Energy Demand
Rest of World Clean Energy Demand
Global Non-Clean Energy Demand
1.8% 8.8%
88.6%
2010 - Trajectory CUS Clean Energy Demand
Rest of World Clean Energy Demand
Global Non-Clean Energy Demand
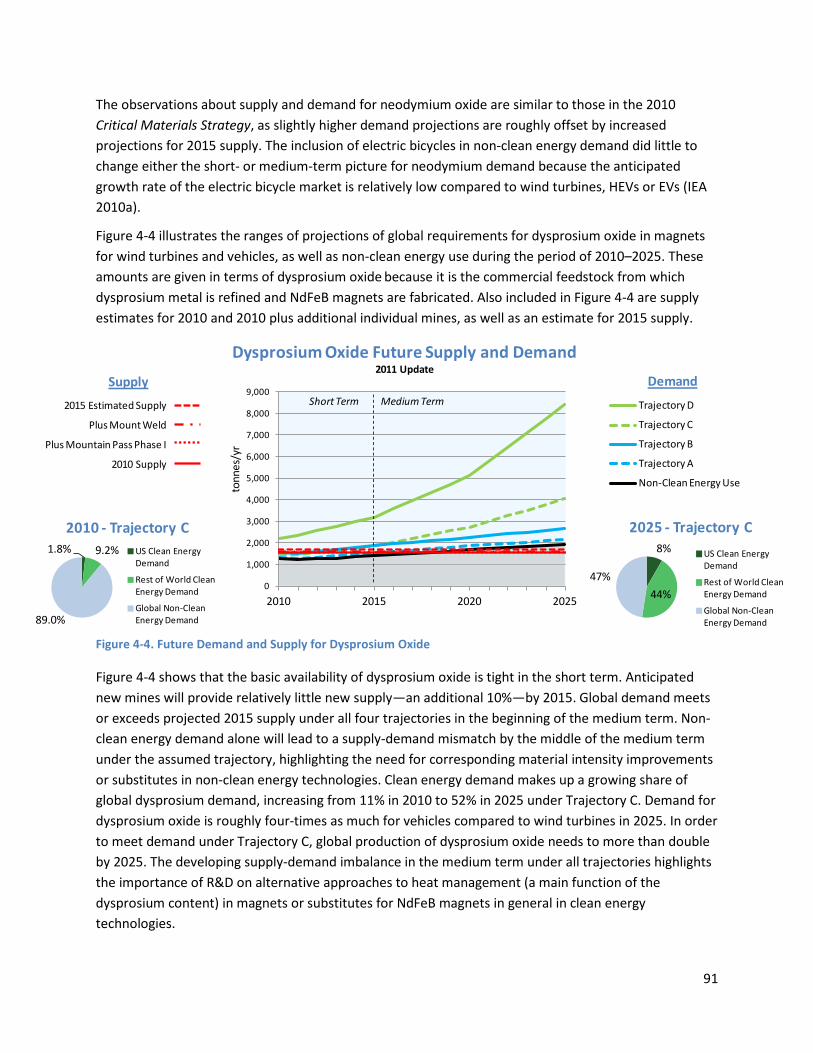
91
The observations about supply and demand for neodymium oxide are similar to those in the 2010 Critical Materials Strategy, as slightly higher demand projections are roughly offset by increased projections for 2015 supply. The inclusion of electric bicycles in non-clean energy demand did little to change either the short- or medium-term picture for neodymium demand because the anticipated growth rate of the electric bicycle market is relatively low compared to wind turbines, HEVs or EVs (IEA 2010a).
Figure 4-4 illustrates the ranges of projections of global requirements for dysprosium oxide in magnets for wind turbines and vehicles, as well as non-clean energy use during the period of 2010–2025. These amounts are given in terms of dysprosium oxide because it is the commercial feedstock from which dysprosium metal is refined and NdFeB magnets are fabricated. Also included in Figure 4-4 are supply estimates for 2010 and 2010 plus additional individual mines, as well as an estimate for 2015 supply.
Figure 4-4. Future Demand and Supply for Dysprosium Oxide
Figure 4-4 shows that the basic availability of dysprosium oxide is tight in the short term. Anticipated new mines will provide relatively little new supply—an additional 10%—by 2015. Global demand meets or exceeds projected 2015 supply under all four trajectories in the beginning of the medium term. Non-clean energy demand alone will lead to a supply-demand mismatch by the middle of the medium term under the assumed trajectory, highlighting the need for corresponding material intensity improvements or substitutes in non-clean energy technologies. Clean energy demand makes up a growing share of global dysprosium demand, increasing from 11% in 2010 to 52% in 2025 under Trajectory C. Demand for dysprosium oxide is roughly four-times as much for vehicles compared to wind turbines in 2025. In order to meet demand under Trajectory C, global production of dysprosium oxide needs to more than double by 2025. The developing supply-demand imbalance in the medium term under all trajectories highlights the importance of R&D on alternative approaches to heat management (a main function of the dysprosium content) in magnets or substitutes for NdFeB magnets in general in clean energy technologies.
0
1,000
2,000
3,000
4,000
5,000
6,000
7,000
8,000
9,000
2010 2015 2020 2025
tonn
es/y
r
Dysprosium Oxide Future Supply and Demand2011 Update
Trajectory D
Trajectory C
Trajectory B
Trajectory A
Non-Clean Energy Use
DemandSupply
2015 Estimated Supply
Plus Mount Weld
Plus Mountain Pass Phase I
2010 Supply
Short Term Medium Term
8%
44%47%
2025 - Trajectory CUS Clean Energy Demand
Rest of World Clean Energy Demand
Global Non-Clean Energy Demand
1.8% 9.2%
89.0%
2010 - Trajectory CUS Clean Energy Demand
Rest of World Clean Energy Demand
Global Non-Clean Energy Demand

92
Compared to the 2010 Critical Materials Strategy, demand projections are slightly higher under the high material content trajectories (Trajectories B and D) and slightly lower under the low material content trajectories (Trajectories A and C). This change is driven largely by refinements to dysprosium content estimations.
4.4 Trajectories of Future Demand for Key Materials Elements in Battery Technologies Nickel metal hydride (NiMH) and lithium-ion (Li-ion) batteries are used in HEVs and EVs, as discussed in Chapter 2. These batteries incorporate a variety of key materials (e.g., lanthanum, cerium, neodymium, praseodymium, cobalt and lithium). The assumptions for vehicle deployment, market share of the battery types and material intensity of the batteries used to create trajectories of future demand for key materials in battery technologies are presented in Table 4-5.
Following are the major changes in assumptions from the 2010 Critical Materials Strategy:
• Market share assumptions for HEVs were adjusted to allow for a likely transition from NiMH to Li-ion batteries. Several manufacturers have already designed hybrids with Li-ion batteries, with widespread use likely by the medium term.
• Two additional materials were included in battery demand calculations: manganese dioxide and nickel. These elements are used in both NiMH and Li-ion batteries.
• Although electric bicycles were included in calculations for key materials used in magnets, the demand for key materials in electric bicycle batteries is not calculated. As of 2006, approximately 87% of electric bicycles produced still used lead-acid batteries (Weinert 2008). It is likely that the market share for advanced batteries such as Li-ion or NiMH batteries in electric bicycles will increase significantly in the medium term, but estimates of how quickly this penetration will occur were not available.
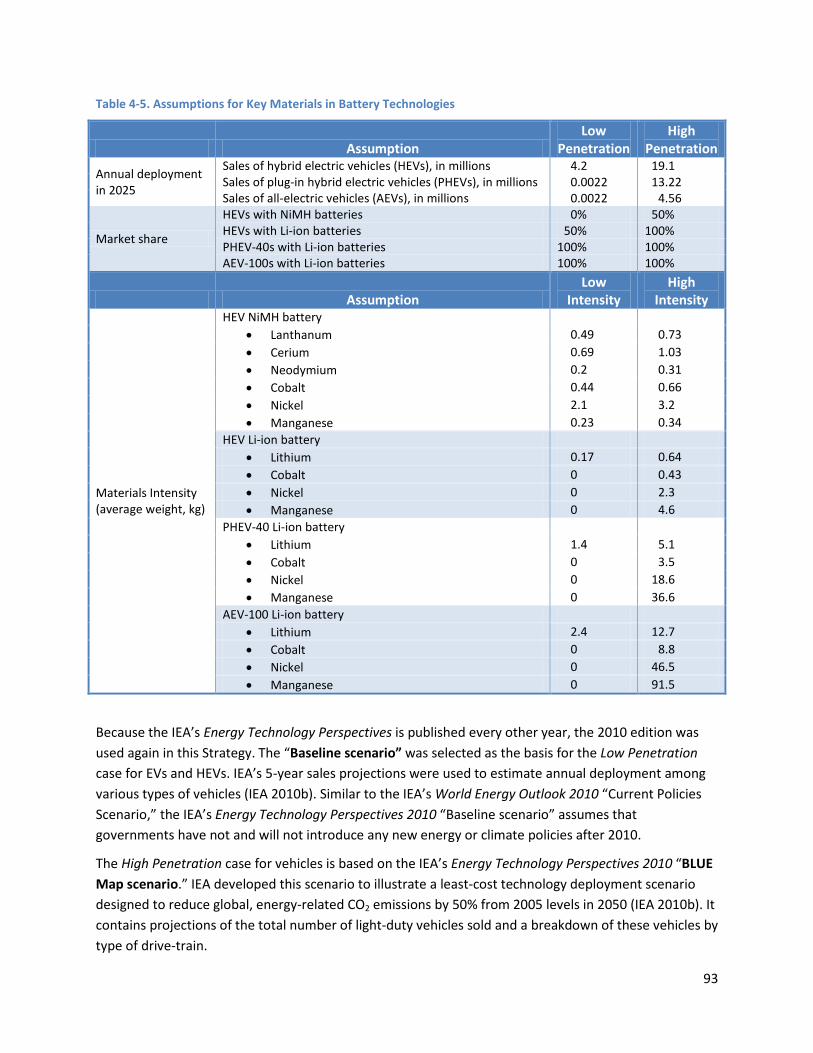
93
Table 4-5. Assumptions for Key Materials in Battery Technologies
Assumption Low
Penetration High
Penetration
Annual deployment in 2025
Sales of hybrid electric vehicles (HEVs), in millions 004.2 019.1 Sales of plug-in hybrid electric vehicles (PHEVs), in millions 000.0022 013.22 Sales of all-electric vehicles (AEVs), in millions 000.0022 004.56
Market share
HEVs with NiMH batteries 000% 050% HEVs with Li-ion batteries 050% 100% PHEV-40s with Li-ion batteries 100% 100% AEV-100s with Li-ion batteries 100% 100%
Assumption Low
Intensity High
Intensity
Materials Intensity (average weight, kg)
HEV NiMH battery • Lanthanum 000.49 000.73 • Cerium 000.69 001.03 • Neodymium 000.20 000.31 • Cobalt 000.44 000.66 • Nickel 002.10 003.20 • Manganese 000.23 000.34
HEV Li-ion battery • Lithium 000.17 000.64 • Cobalt 000.00 000.43 • Nickel 000.00 002.30 • Manganese 000.00 004.60
PHEV-40 Li-ion battery • Lithium 001.40 005.10 • Cobalt 000.00 003.50 • Nickel 000.00 018.60 • Manganese 000.00 036.60
AEV-100 Li-ion battery • Lithium 002.40 012.70 • Cobalt 000.00 008.80 • Nickel 000.00 046.50 • Manganese 000.00 091.50
Because the IEA’s Energy Technology Perspectives is published every other year, the 2010 edition was used again in this Strategy. The “Baseline scenario” was selected as the basis for the Low Penetration case for EVs and HEVs. IEA’s 5-year sales projections were used to estimate annual deployment among various types of vehicles (IEA 2010b). Similar to the IEA’s World Energy Outlook 2010 “Current Policies Scenario,” the IEA’s Energy Technology Perspectives 2010 “Baseline scenario” assumes that governments have not and will not introduce any new energy or climate policies after 2010.
The High Penetration case for vehicles is based on the IEA’s Energy Technology Perspectives 2010 “BLUE Map scenario.” IEA developed this scenario to illustrate a least-cost technology deployment scenario designed to reduce global, energy-related CO2 emissions by 50% from 2005 levels in 2050 (IEA 2010b). It contains projections of the total number of light-duty vehicles sold and a breakdown of these vehicles by type of drive-train.
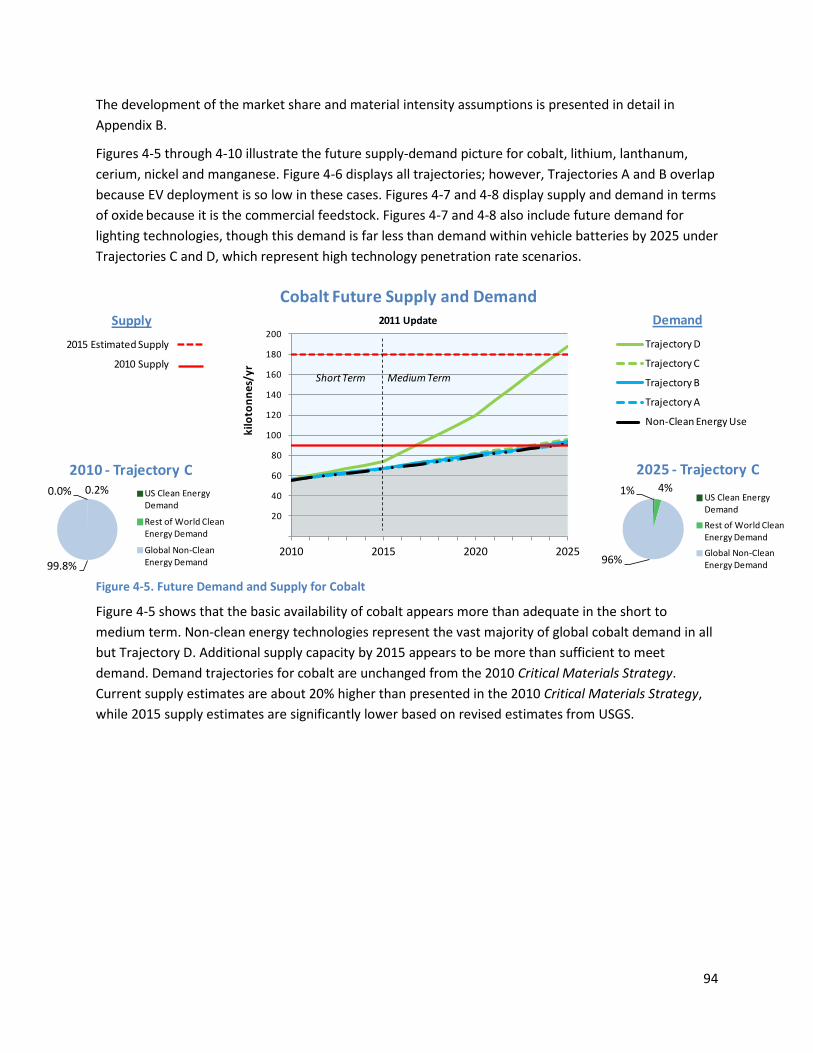
94
The development of the market share and material intensity assumptions is presented in detail in Appendix B.
Figures 4-5 through 4-10 illustrate the future supply-demand picture for cobalt, lithium, lanthanum, cerium, nickel and manganese. Figure 4-6 displays all trajectories; however, Trajectories A and B overlap because EV deployment is so low in these cases. Figures 4-7 and 4-8 display supply and demand in terms of oxide because it is the commercial feedstock. Figures 4-7 and 4-8 also include future demand for lighting technologies, though this demand is far less than demand within vehicle batteries by 2025 under Trajectories C and D, which represent high technology penetration rate scenarios.
Figure 4-5. Future Demand and Supply for Cobalt
Figure 4-5 shows that the basic availability of cobalt appears more than adequate in the short to medium term. Non-clean energy technologies represent the vast majority of global cobalt demand in all but Trajectory D. Additional supply capacity by 2015 appears to be more than sufficient to meet demand. Demand trajectories for cobalt are unchanged from the 2010 Critical Materials Strategy. Current supply estimates are about 20% higher than presented in the 2010 Critical Materials Strategy, while 2015 supply estimates are significantly lower based on revised estimates from USGS.
20
40
60
80
100
120
140
160
180
200
2010 2015 2020 2025
kilo
tonn
es/y
r
Cobalt Future Supply and Demand2011 Update
Trajectory D
Trajectory C
Trajectory B
Trajectory A
Non-Clean Energy Use
DemandSupply
2015 Estimated Supply
2010 SupplyShort Term Medium Term
1% 4%
96%
2025 - Trajectory C
US Clean Energy Demand
Rest of World Clean Energy Demand
Global Non-Clean Energy Demand
0.0% 0.2%
99.8%
2010 - Trajectory CUS Clean Energy Demand
Rest of World Clean Energy Demand
Global Non-Clean Energy Demand
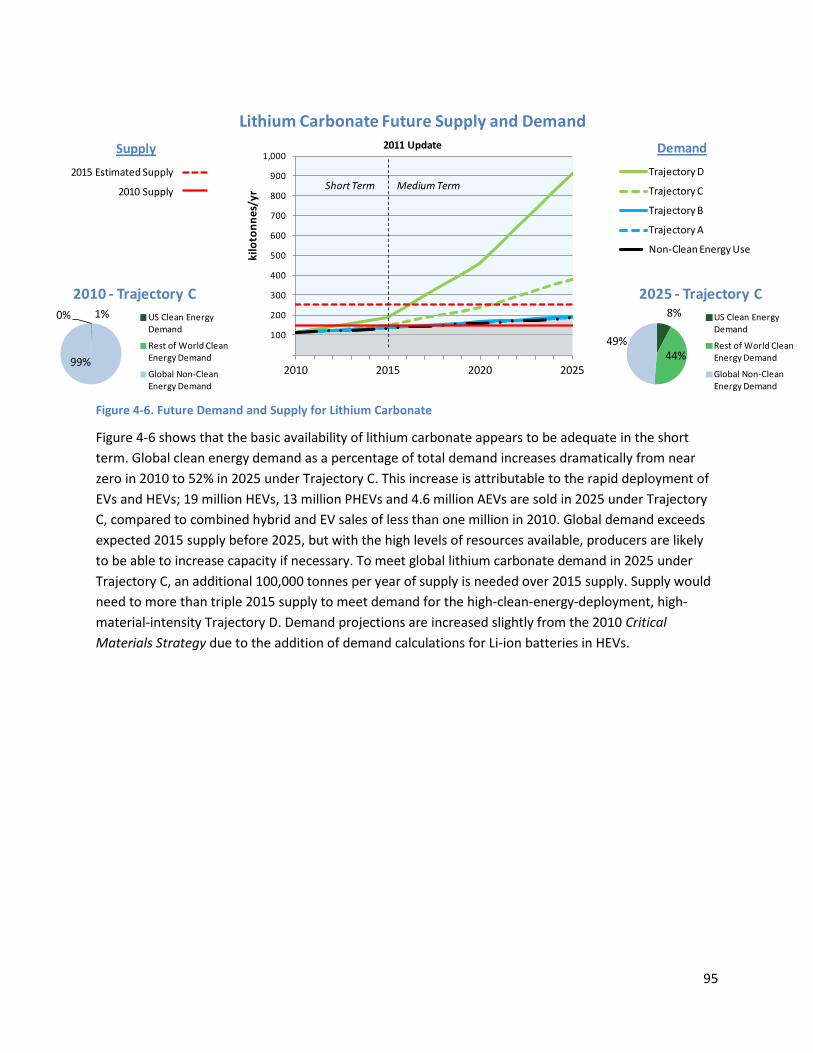
95
Figure 4-6. Future Demand and Supply for Lithium Carbonate
Figure 4-6 shows that the basic availability of lithium carbonate appears to be adequate in the short term. Global clean energy demand as a percentage of total demand increases dramatically from near zero in 2010 to 52% in 2025 under Trajectory C. This increase is attributable to the rapid deployment of EVs and HEVs; 19 million HEVs, 13 million PHEVs and 4.6 million AEVs are sold in 2025 under Trajectory C, compared to combined hybrid and EV sales of less than one million in 2010. Global demand exceeds expected 2015 supply before 2025, but with the high levels of resources available, producers are likely to be able to increase capacity if necessary. To meet global lithium carbonate demand in 2025 under Trajectory C, an additional 100,000 tonnes per year of supply is needed over 2015 supply. Supply would need to more than triple 2015 supply to meet demand for the high-clean-energy-deployment, high-material-intensity Trajectory D. Demand projections are increased slightly from the 2010 Critical Materials Strategy due to the addition of demand calculations for Li-ion batteries in HEVs.
100
200
300
400
500
600
700
800
900
1,000
2010 2015 2020 2025
kilo
tonn
es/y
r
Lithium Carbonate Future Supply and Demand2011 Update
Trajectory D
Trajectory C
Trajectory B
Trajectory A
Non-Clean Energy Use
DemandSupply
2015 Estimated Supply
2010 Supply Short Term Medium Term
8%
44%49%
2025 - Trajectory CUS Clean Energy Demand
Rest of World Clean Energy Demand
Global Non-Clean Energy Demand
0% 1%
99%
2010 - Trajectory CUS Clean Energy Demand
Rest of World Clean Energy Demand
Global Non-Clean Energy Demand

96
Figure 4-7. Future Demand and Supply for Lanthanum Oxide
Figure 4-7 shows that the basic availability of lanthanum oxide appears to be more than adequate in the short term. The 2015 supply is able to meet demand under all trajectories until the middle of the medium term, with sizeable contributions from Mountain Pass Phase I and Mount Weld. Demand projections exceed forecasted 2015 supply by 2025 only in Trajectories C and D. Global demand for lanthanum in electric drive-train vehicle batteries as a percentage of total demand increases from 3% in 2010 to 12% in 2025 under Trajectory C. The clean energy demand trajectories also include the demand for lanthanum in lighting phosphors (the assumptions behind lighting trajectories are described in more detail later in this chapter). Under the high HEV deployment scenarios (in which NiMH batteries retain 50% market share) lighting accounts for less than half of non-clean energy demand. The supply-demand picture for lanthanum in the medium term is improved from the 2010 Critical Materials Strategy due to an expected increase in 2015 supply and the adjustments to lanthanum demand in HEVs that account for a transition from NiMH to Li-ion batteries.
20
25
30
35
40
45
50
55
60
65
2010 2015 2020 2025
kilo
tonn
es/y
r
Lanthanum Oxide Future Supply and Demand2011 Update
Trajectory D
Trajectory C
Trajectory B
Trajectory A
Non-Clean Energy Use
DemandSupply
2015 Estimated Supply
Plus Mount Weld
Plus Mountain Pass Phase I
2010 Supply
Short Term Medium Term
2% 12%
86%
2025 - Trajectory CUS Clean Energy Demand
Rest of World Clean Energy Demand
Global Non-Clean Energy Demand
0.5% 4.4%
95.1%
2010 - Trajectory CUS Clean Energy Demand
Rest of World Clean Energy Demand
Global Non-Clean Energy Demand
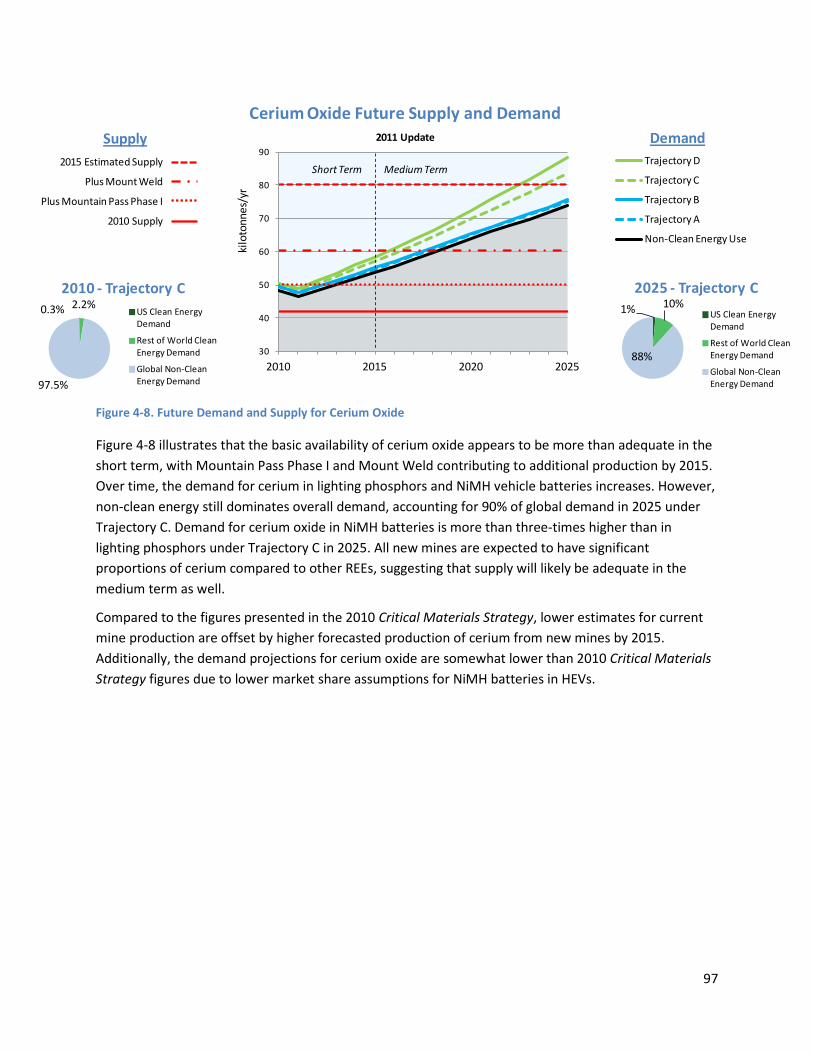
97
30
40
50
60
70
80
90
2010 2015 2020 2025
kilo
tonn
es/y
r
Cerium Oxide Future Supply and Demand2011 Update
Trajectory D
Trajectory C
Trajectory B
Trajectory A
Non-Clean Energy Use
DemandSupply2015 Estimated Supply
Plus Mount Weld
Plus Mountain Pass Phase I
2010 Supply
Short Term Medium Term
0.3% 2.2%
97.5%
2010 - Trajectory CUS Clean Energy Demand
Rest of World Clean Energy Demand
Global Non-Clean Energy Demand
1% 10%
88%
2025 - Trajectory CUS Clean Energy Demand
Rest of World Clean Energy Demand
Global Non-Clean Energy Demand
Figure 4-8. Future Demand and Supply for Cerium Oxide
Figure 4-8 illustrates that the basic availability of cerium oxide appears to be more than adequate in the short term, with Mountain Pass Phase I and Mount Weld contributing to additional production by 2015. Over time, the demand for cerium in lighting phosphors and NiMH vehicle batteries increases. However, non-clean energy still dominates overall demand, accounting for 90% of global demand in 2025 under Trajectory C. Demand for cerium oxide in NiMH batteries is more than three-times higher than in lighting phosphors under Trajectory C in 2025. All new mines are expected to have significant proportions of cerium compared to other REEs, suggesting that supply will likely be adequate in the medium term as well.
Compared to the figures presented in the 2010 Critical Materials Strategy, lower estimates for current mine production are offset by higher forecasted production of cerium from new mines by 2015. Additionally, the demand projections for cerium oxide are somewhat lower than 2010 Critical Materials Strategy figures due to lower market share assumptions for NiMH batteries in HEVs.
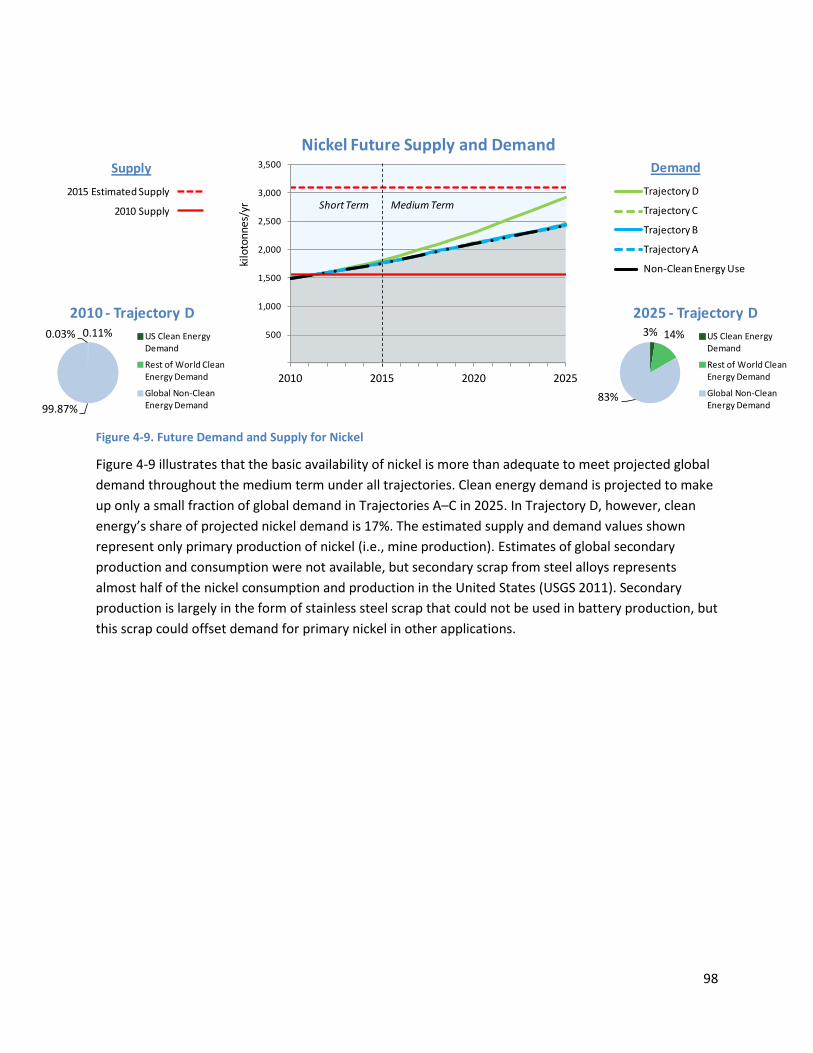
98
Figure 4-9. Future Demand and Supply for Nickel
Figure 4-9 illustrates that the basic availability of nickel is more than adequate to meet projected global demand throughout the medium term under all trajectories. Clean energy demand is projected to make up only a small fraction of global demand in Trajectories A–C in 2025. In Trajectory D, however, clean energy’s share of projected nickel demand is 17%. The estimated supply and demand values shown represent only primary production of nickel (i.e., mine production). Estimates of global secondary production and consumption were not available, but secondary scrap from steel alloys represents almost half of the nickel consumption and production in the United States (USGS 2011). Secondary production is largely in the form of stainless steel scrap that could not be used in battery production, but this scrap could offset demand for primary nickel in other applications.
500
1,000
1,500
2,000
2,500
3,000
3,500
2010 2015 2020 2025
kilo
tonn
es/y
r
Nickel Future Supply and Demand
Trajectory D
Trajectory C
Trajectory B
Trajectory A
Non-Clean Energy Use
DemandSupply2015 Estimated Supply
2010 Supply Short Term Medium Term
3% 14%
83%
2025 - Trajectory DUS Clean Energy Demand
Rest of World Clean Energy Demand
Global Non-Clean Energy Demand
0.03% 0.11%
99.87%
2010 - Trajectory DUS Clean Energy Demand
Rest of World Clean Energy Demand
Global Non-Clean Energy Demand
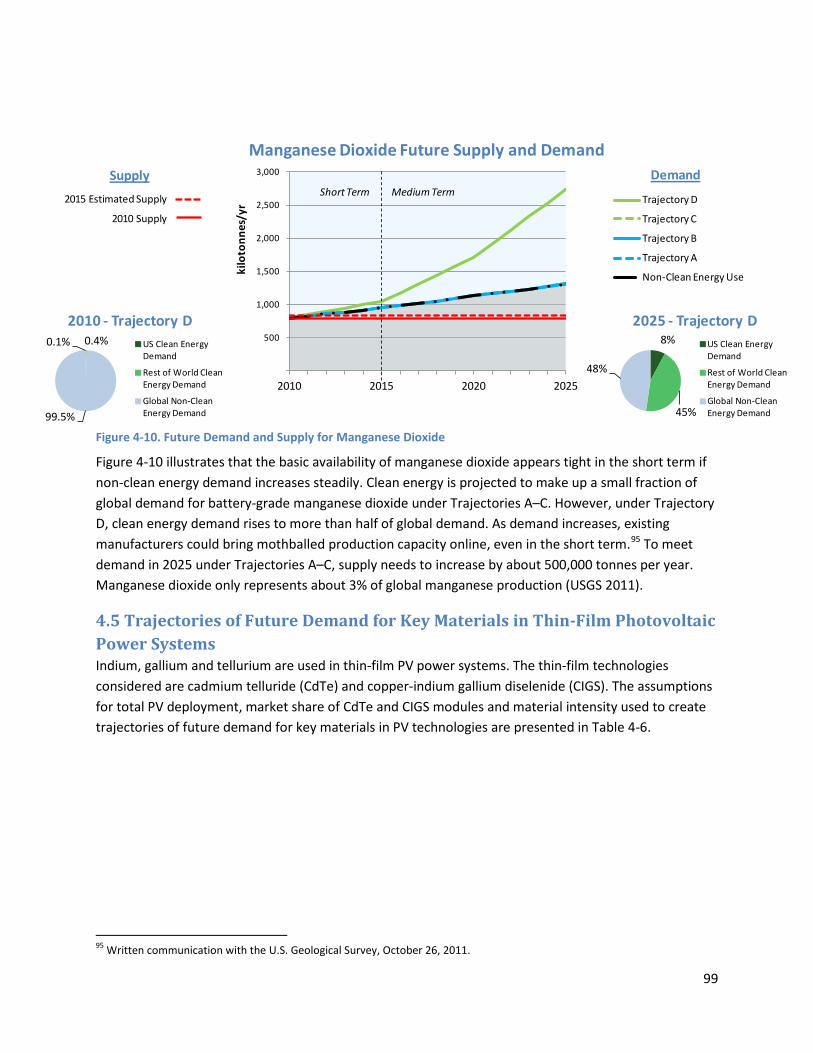
99
Figure 4-10. Future Demand and Supply for Manganese Dioxide
Figure 4-10 illustrates that the basic availability of manganese dioxide appears tight in the short term if non-clean energy demand increases steadily. Clean energy is projected to make up a small fraction of global demand for battery-grade manganese dioxide under Trajectories A–C. However, under Trajectory D, clean energy demand rises to more than half of global demand. As demand increases, existing manufacturers could bring mothballed production capacity online, even in the short term.95
4.5 Trajectories of Future Demand for Key Materials in Thin-Film Photovoltaic Power Systems
To meet demand in 2025 under Trajectories A–C, supply needs to increase by about 500,000 tonnes per year. Manganese dioxide only represents about 3% of global manganese production (USGS 2011).
Indium, gallium and tellurium are used in thin-film PV power systems. The thin-film technologies considered are cadmium telluride (CdTe) and copper-indium gallium diselenide (CIGS). The assumptions for total PV deployment, market share of CdTe and CIGS modules and material intensity used to create trajectories of future demand for key materials in PV technologies are presented in Table 4-6.
95 Written communication with the U.S. Geological Survey, October 26, 2011.
500
1,000
1,500
2,000
2,500
3,000
2010 2015 2020 2025
kilo
tonn
es/y
r
Manganese Dioxide Future Supply and Demand
Trajectory D
Trajectory C
Trajectory B
Trajectory A
Non-Clean Energy Use
DemandSupply
2015 Estimated Supply
2010 Supply
Short Term Medium Term
8%
45%
48%
2025 - Trajectory DUS Clean Energy Demand
Rest of World Clean Energy Demand
Global Non-Clean Energy Demand
0.1% 0.4%
99.5%
2010 - Trajectory DUS Clean Energy Demand
Rest of World Clean Energy Demand
Global Non-Clean Energy Demand

100
Table 4-6. Assumptions for Key Materials in PV Technologies
Assumption Low
Penetration High
Penetration
Annual deployment in 2025 Added PV capacity (GW) 12.4 32.9
Market share CIGS share of added PV capacity 05% 50%
Cdte share of added PV capacity 10% 50%
Assumption Low
Intensity High
Intensity
Materials intensity (average content, tonnes)
Indium per CIGS GW 15 23
Gallium per CIGS GW 12 29
Tellurium per CIGS GW 17 74
Compared to the 2010 Critical Materials Strategy, the overall supply-demand picture for key materials in PVs has improved slightly. There are several factors that have driven this change:
• The demand projections for key materials are generally lower, driven largely by lower estimates for material content per unit of PV capacity. These changes in content offset slightly higher IEA projections for PV deployment.
• One method of reducing material intensity for indium in CIGS is by using film compositions that are lower in indium but higher in gallium. This tradeoff is reflected in an increase in the low material content assumption for gallium compared to the 2010 Critical Materials Strategy, and results in a partial tradeoff in the potential for supply risk between the two elements.
• The low market share assumption for CIGS was reduced from 10% to 5%, reflecting the fact that CIGS currently has a much smaller share of the PV market than CdTe.96
The supply projections are similar to those in the 2010 Critical Materials Strategy.The IEA’s World Energy Outlook 2010 “Current Policies Scenario” was selected as the basis for the Low Penetration case for PV power systems. Recall that this case assumes that no new policies will be implemented to accelerate adoption of these technologies after 2010. The IEA’s World Energy Outlook 2010 “450 Scenario,” meant to stabilize greenhouse gas concentrations at 450 parts per million by volume, was used as the basis for the High Penetration case for PVs. Compared to the World Energy Outlook 2009, the World Energy Outlook 2010 yields slightly higher deployment projections by 2025 for both the high and low penetration cases.
97
The development of the market share and material intensity assumptions is presented in detail in Appendix B.
96 Since the release of the 2010 Critical Materials Strategy, silicon prices have dropped sharply, making traditional crystalline silicon PV cells much more cost competitive with thin-film cells. The impact of this situation on market share prospects for CIGS and CdTe is unclear, but it is likely that the market share for each technology will still fall within the high and low estimates given in Table 4-6 through the short and medium terms. 97 While the IEA’s World Energy Outlook presents the 450 Scenario as the most aggressive deployment projection, some forecasts, such as Bloomberg New Energy Finance (2011) forecasts, have predicted more rapid growth in global installed PV capacity.

101
0
500
1,000
1,500
2,000
2,500
2010 2015 2020 2025
tonn
es/y
r
Tellurium Future Supply and Demand2011 Update
Trajectory D
Trajectory C
Trajectory B
Trajectory A
Non-Clean Energy Use
DemandSupply
2015 Estimated Supply
2010 SupplyShort Term Medium Term
3% 19%
78%
2025 - Trajectory CUS Clean Energy Demand
Rest of World Clean Energy Demand
Global Non-Clean Energy Demand
1% 6%
94%
2010 - Trajectory CUS Clean Energy Demand
Rest of World Clean Energy Demand
Global Non-Clean Energy Demand
Figure 4-11. Future Demand and Supply for Tellurium
Figure 4-11 illustrates the range of projections for tellurium demand from 2010–2025, considering both non-clean energy demands and demand for CdTe PV modules. Figure 4-12 and Figure 4-13 illustrate the ranges of demand for indium and gallium, respectively, through non-clean energy demand and for CIGS PV modules.
Figure 4-11 shows that the basic availability of tellurium appears to be adequate in the short term, with increased recovery from copper anode slime increasing supply. Reducing material intensity provides significant payoff for reducing overall material demand. However, supply would have to increase an additional 50% more than projected 2015 capacity to meet projected demand in 2025 under Trajectory C. Non-clean energy demand as a percentage of total demand shrinks significantly over time under Trajectory C, but will still account for a large share of global demand in 2025. U.S. clean energy demand for tellurium is about one-sixth of global clean energy demand in 2025 under Trajectory C. The high and low material content estimates are roughly one-half of those used in the 2010 Critical Materials Strategy, reflecting a more optimistic assessment of manufacturing processing efficiency by industry experts.

102
Figure 4-12. Future Demand and Supply for Indium
Figure 4-12 shows that the basic availability of indium appears somewhat tight by 2015. Without market adjustment, supply would need to increase by about 25% more than the 2015 estimate simply to meet projected non-clean energy demand in 2025. Clean energy demand is projected to make up 10% of total demand in 2025 under Trajectory C. Without expanded production after 2015, reductions in non-clean energy demand will also be important to prevent shortages and price spikes.
Compared with the 2010 Critical Materials Strategy, the assumption for high material content per gigawatt is reduced by approximately 75%. This change reflects a more optimistic assessment of manufacturing efficiency and expectations that manufacturers will develop CIGS films with a lower proportion of indium and a higher proportion of gallium.98
This change would produce much lower projections for clean energy demand, but overall demand remains largely driven by non-clean energy demand.
98 Personal communication between U.S. Department of Energy staff and the National Renewable Energy Laboratory (NREL), October 2011. NREL reports that this change is driven primarily by better anticipated performance from lower-indium PV configurations.

103
Figure 4-13. Future Demand and Supply for Gallium
Figure 4-13 shows that the basic availability of gallium appears adequate in the short term, as significant additional production is expected to come online prior to 2015. Where clean energy technologies are deployed rapidly, additional production capacity will be needed early in the medium term to keep pace with demand. Clean energy demand makes up 38% of total gallium demand in 2025 in Trajectory C, requiring supply to nearly double from 2010 levels. Compared to 2010 Critical Materials Strategy figures, higher estimates for low material content result in a greater risk of supply-demand mismatch for Trajectory C. These higher estimates are driven largely by the assumption that gallium will increasingly be substituted for indium in CIGS composition. This change points to the benefits of reducing material intensity in other aspects of PV manufacturing, such as reducing cell thickness and improving processing efficiency.
4.6 Trajectories of Future Demand for Rare Earth Elements in Phosphors for High-Efficiency Lighting Systems The use of different REEs (including europium, terbium, gadolinium, cerium, lanthanum and yttrium) in phosphors is discussed in Chapter 2. High-efficiency fluorescent lighting represents approximately 85% of global demand for rare earth phosphors. Phosphor demand will continue to grow with the increased use of CFLs and higher efficiency LFLs. Assumptions used to create trajectories of future demand for key materials in lighting technologies are presented in Table 4-7.
The methodology for calculating demand for key materials in phosphors is updated significantly from the 2010 Critical Materials Strategy, which projected historical rare earth phosphor demand forward based on assumed growth rates for CFL demand. In this Strategy, the scenarios for deployment are based on projections of demand over time for individual CFL and LFL units. For CFLs, global demand projections for bulbs were available from IEA’s 2010 information paper Phase Out of Incandescent Lamps (IEA 2010c). The report included a number of demand scenarios based on assumptions about the
0
100
200
300
400
500
600
700
2010 2015 2020 2025
tonn
es/y
r
Gallium Future Supply and Demand2011 Update
Trajectory D
Trajectory C
Trajectory B
Trajectory A
Non-Clean Energy Use
DemandSupply
2015 Estimated Supply
2010 Supply
Short Term Medium Term
5%
33%
62%
2025 - Trajectory CUS Clean Energy Demand
Rest of World Clean Energy Demand
Global Non-Clean Energy Demand
1% 11%
88%
2010 - Trajectory CUS Clean Energy Demand
Rest of World Clean Energy Demand
Global Non-Clean Energy Demand

104
phase-in of lighting efficiency standards in a number of different countries. Both the low and high global demand projections selected incorporate the U.S. standards scheduled to take effect in 2012. They differ in assumptions about efficiency standard increases in other countries, including China and Europe.99
Table 4-7. Assumptions for Key Materials in Lighting Technologies
The low deployment projection assumes that all countries follow previously announced policies for lighting efficiency standards, but that no new efficiency initiatives are adopted. The high deployment scenario assumes that countries adopt the most aggressive policies under current consideration. This includes the assumption that China and the EU both conduct rapid phase-outs in the 2012–2014 timeframe.
Technology Assumption Low
Penetration High
Penetration
Annual deployment in 2025
Compact fluorescent (CFL) Demand (millions) 6400 7700
Linear fluorescent (LFL)
Medium efficiency lamps (700 series): demand (millions) 2600 0010*
High efficiency (800/800P series) lamps: demand (millions) 0660 3300
Market share Included in deployment
Technology Assumption Low
Intensity High
Intensity
Materials intensity
CFL Phosphor content per bulb (g) 001.1 001.5 CFL Triband share of CFL phosphor 100% 100% CFL Rare earth share of triband phosphor 060% 060% LFL Total phosphor content per cm2 coating (mg) 003 004
LFL Medium efficiency lamps: triband share of phosphor weight 030% 030%
LFL High efficiency lamps: triband share of phosphor weight 100% 100%
LFL Rare earth share of triband phosphor weight 060% 060% CFL Lanthanum share of phosphors weight 008.5% 008.5% CFL Cerium share of phosphors weight 020.0% 020.0% CFL Europium share of phosphors weight 004.5% 004.5% CFL Terbium share of phosphors weight 005.0% 005.0% CFL Yttrium share of phosphors weight 062% 062% LFL Lanthanum share of phosphors weight 022.0% 022.0% LFL Cerium share of phosphors weight 006.5% 006.5% LFL Europium share of phosphors weight 004.5% 004.5% LFL Terbium share of phosphors weight 005.0% 005.0% LFL Yttrium share of phosphors weight 062.0% 062.0%
*Note: In the high penetration case, the number of medium efficiency LFL lamps is lower in the high penetration case as the share of total LFLs shifts towards high efficiency lamps.
99 See Figures 6.1 (chosen for the low deployment scenario) and 6.4 (chosen for the high deployment scenario) in IEA 2010b.

105
For LFLs, global demand projections for specific lamp sizes and efficiency levels were not available. Therefore, global demand projections are based on projected domestic demand, scaled up using an industry rule-of-thumb that global demand for lighting is approximately five-times U.S. demand.100 The projection for domestic LFL demand is derived from the National Impact Analysis (NIA) prepared by DOE to forecast demand for different types of bulbs under lighting standards scheduled to take effect in 2014 (EERE 2009). The NIA provides forecast demand for fluorescent bulbs of various lengths (4 and 8 feet), diameters (T-5, T8 and T12) and efficiency levels. For the high global deployment case, demand for lamps at each efficiency level was assumed to be projected domestic demand plus four-times the fitted (i.e., smoothed) values of projected domestic demand. The fitted curve was used to smooth out the U.S.-specific spike in domestic demand due to new U.S. efficiency standards in 2012. For the low global deployment projection, it was assumed that much of the demand outside the U.S. would continue to be met by lower-efficiency bulbs with lower rare earth content. Therefore, the total number of lamps remains the same, but it is assumed that all lamps outside the U.S. are medium efficiency (700 series).101
Estimates for the weight of rare earth contained in each type of type bulb are based on estimates of phosphor content by weight and composition. Florescent lights can contain a mixture of phosphor types, but only tri-band phosphors contain REEs. The demand calculations assume that CFLs use 100% tri-band phosphor. The demand calculations for LFLs assume that medium-efficiency lamps (700 series) contain 30% tri-band phosphor, while high-efficiency lamps (800 or 800P series) contain 100% tri-band phosphor. The calculations further assume that rare earth content in tri-band phosphor is 60% by weight. The high material content calculations are based on current industry estimates for phosphor content in CFL and LFL bulbs. The low material content calculations assume a 25% reduction in content from current phosphor requirements.
The total demand for REE content in CFLs and LFLs was disaggregated into estimated demand for each REO, based on manufacturer estimates for average weight percentages of each element in typical phosphor chemistries. Further details on demand calculations are included in Appendix B.
Figures 4-14 to 4-16 illustrate estimated supply and the range of demands projected in this Strategy for REEs used as phosphors in high-efficiency lighting technologies (except lanthanum and cerium, which were discussed earlier).
General observations about phosphor supply and demand projections include the following:
• Demand calculations for rare earth use in phosphors using the new methodology yield a wider range between high and low projections than in the 2010 Critical Materials Strategy. The calculations are extremely sensitive to a number of factors:
o The assumptions about the relationship between U.S. and global demand for LFLs. There are expected to be two competing trends in U.S. versus global demand going forward. On one hand, the U.S. share of global lighting demand is expected to decrease over time. On the other hand, some of this global demand is likely to be met by lower-
100 Based on personal communication between U.S. Department of Energy DOE staff and lighting industry representatives. 101 The NIA model includes domestic demand for lower efficiency (600 series) lamps through 2012, before they are phased out by the new standards. These lamps contain no REEs. Starting in 2013, these lamps no longer meet U.S. efficiency standards and do not appear in domestic deployment projections.
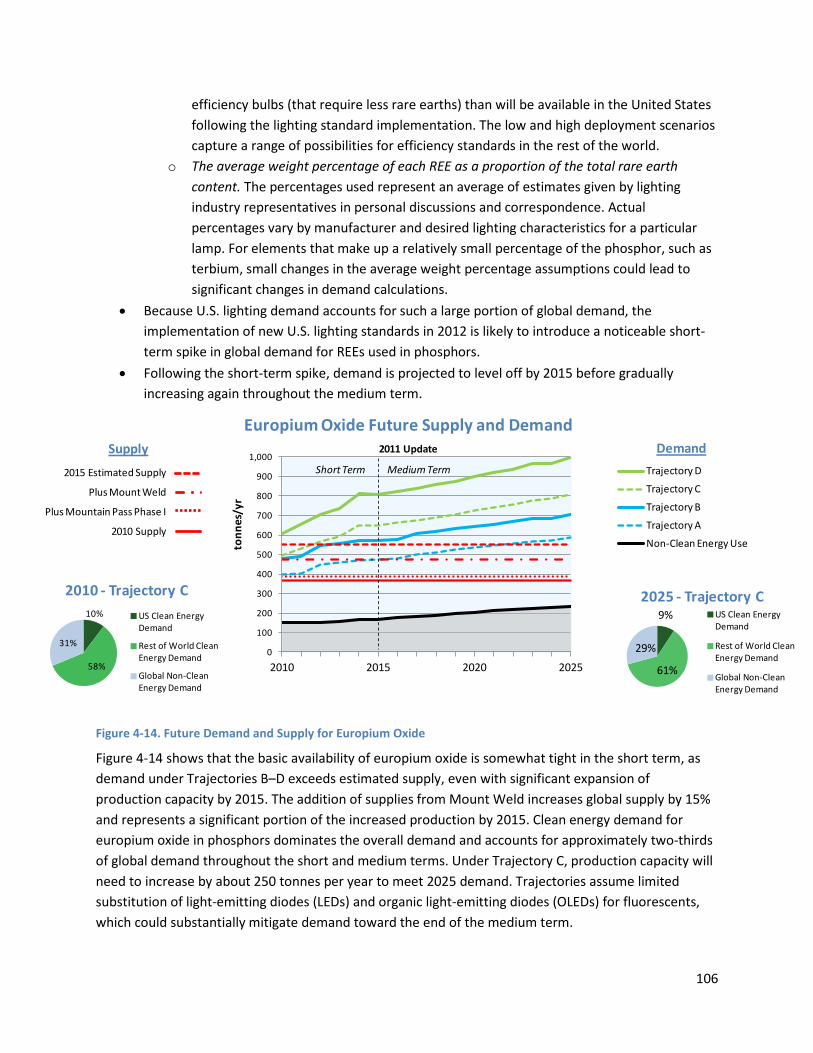
106
0
100
200
300
400
500
600
700
800
900
1,000
2010 2015 2020 2025
tonn
es/y
r
Europium Oxide Future Supply and Demand2011 Update
Trajectory D
Trajectory C
Trajectory B
Trajectory A
Non-Clean Energy Use
DemandSupply
2015 Estimated Supply
Plus Mount Weld
Plus Mountain Pass Phase I
2010 Supply
Short Term Medium Term
10%
58%
31%
2010 - Trajectory CUS Clean Energy Demand
Rest of World Clean Energy Demand
Global Non-Clean Energy Demand
9%
61%
29%
2025 - Trajectory CUS Clean Energy Demand
Rest of World Clean Energy Demand
Global Non-Clean Energy Demand
efficiency bulbs (that require less rare earths) than will be available in the United States following the lighting standard implementation. The low and high deployment scenarios capture a range of possibilities for efficiency standards in the rest of the world.
o The average weight percentage of each REE as a proportion of the total rare earth content. The percentages used represent an average of estimates given by lighting industry representatives in personal discussions and correspondence. Actual percentages vary by manufacturer and desired lighting characteristics for a particular lamp. For elements that make up a relatively small percentage of the phosphor, such as terbium, small changes in the average weight percentage assumptions could lead to significant changes in demand calculations.
• Because U.S. lighting demand accounts for such a large portion of global demand, the implementation of new U.S. lighting standards in 2012 is likely to introduce a noticeable short-term spike in global demand for REEs used in phosphors.
• Following the short-term spike, demand is projected to level off by 2015 before gradually increasing again throughout the medium term.
Figure 4-14. Future Demand and Supply for Europium Oxide
Figure 4-14 shows that the basic availability of europium oxide is somewhat tight in the short term, as demand under Trajectories B–D exceeds estimated supply, even with significant expansion of production capacity by 2015. The addition of supplies from Mount Weld increases global supply by 15% and represents a significant portion of the increased production by 2015. Clean energy demand for europium oxide in phosphors dominates the overall demand and accounts for approximately two-thirds of global demand throughout the short and medium terms. Under Trajectory C, production capacity will need to increase by about 250 tonnes per year to meet 2025 demand. Trajectories assume limited substitution of light-emitting diodes (LEDs) and organic light-emitting diodes (OLEDs) for fluorescents, which could substantially mitigate demand toward the end of the medium term.
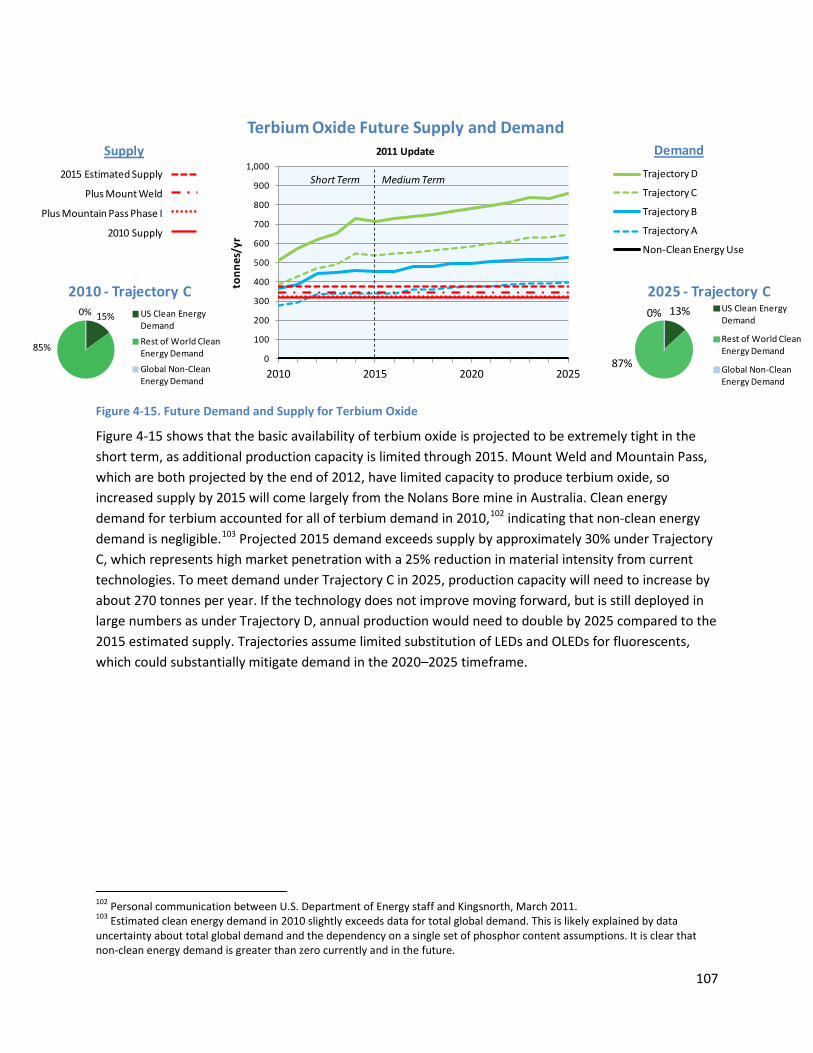
107
Figure 4-15. Future Demand and Supply for Terbium Oxide
Figure 4-15 shows that the basic availability of terbium oxide is projected to be extremely tight in the short term, as additional production capacity is limited through 2015. Mount Weld and Mountain Pass, which are both projected by the end of 2012, have limited capacity to produce terbium oxide, so increased supply by 2015 will come largely from the Nolans Bore mine in Australia. Clean energy demand for terbium accounted for all of terbium demand in 2010,102 indicating that non-clean energy demand is negligible.103
Projected 2015 demand exceeds supply by approximately 30% under Trajectory C, which represents high market penetration with a 25% reduction in material intensity from current technologies. To meet demand under Trajectory C in 2025, production capacity will need to increase by about 270 tonnes per year. If the technology does not improve moving forward, but is still deployed in large numbers as under Trajectory D, annual production would need to double by 2025 compared to the 2015 estimated supply. Trajectories assume limited substitution of LEDs and OLEDs for fluorescents, which could substantially mitigate demand in the 2020–2025 timeframe.
102 Personal communication between U.S. Department of Energy staff and Kingsnorth, March 2011. 103 Estimated clean energy demand in 2010 slightly exceeds data for total global demand. This is likely explained by data uncertainty about total global demand and the dependency on a single set of phosphor content assumptions. It is clear that non-clean energy demand is greater than zero currently and in the future.
0
100
200
300
400
500
600
700
800
900
1,000
2010 2015 2020 2025
tonn
es/y
r
Terbium Oxide Future Supply and Demand2011 Update
Trajectory D
Trajectory C
Trajectory B
Trajectory A
Non-Clean Energy Use
DemandSupply2015 Estimated Supply
Plus Mount Weld
Plus Mountain Pass Phase I
2010 Supply
Short Term Medium Term
15%
85%
0%
2010 - Trajectory CUS Clean Energy Demand
Rest of World Clean Energy Demand
Global Non-Clean Energy Demand
13%
87%
0%
2025 - Trajectory CUS Clean Energy Demand
Rest of World Clean Energy Demand
Global Non-Clean Energy Demand
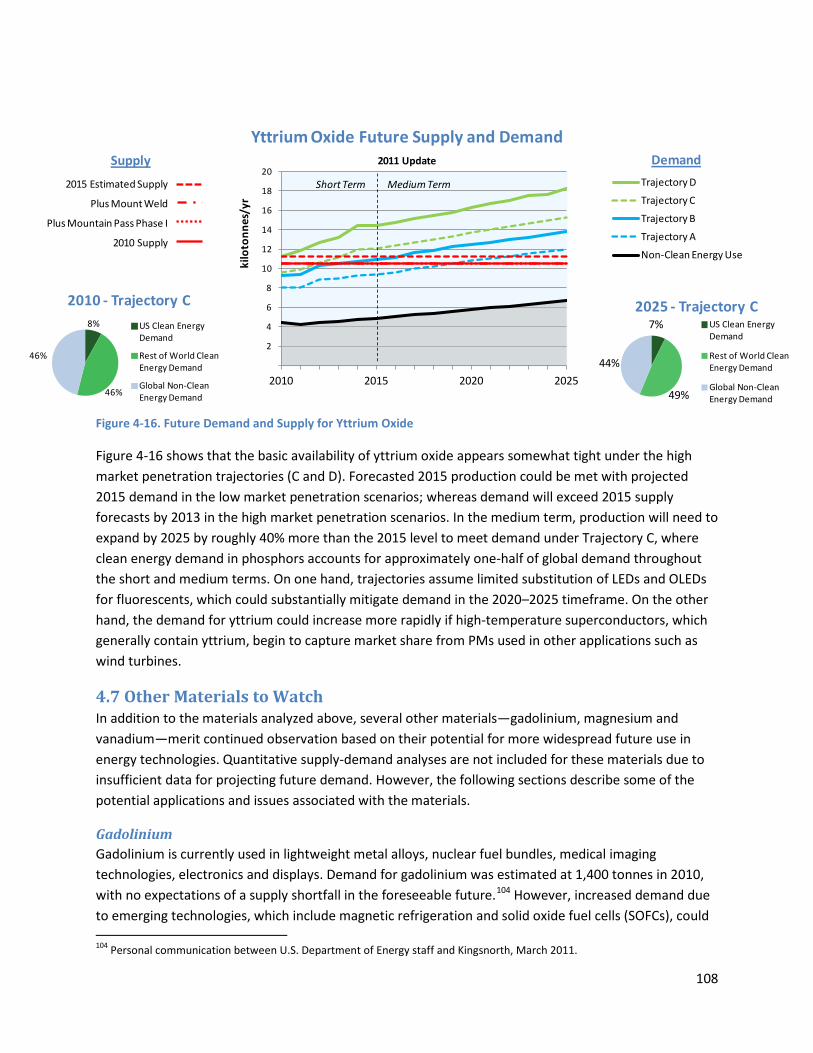
108
Figure 4-16. Future Demand and Supply for Yttrium Oxide
Figure 4-16 shows that the basic availability of yttrium oxide appears somewhat tight under the high market penetration trajectories (C and D). Forecasted 2015 production could be met with projected 2015 demand in the low market penetration scenarios; whereas demand will exceed 2015 supply forecasts by 2013 in the high market penetration scenarios. In the medium term, production will need to expand by 2025 by roughly 40% more than the 2015 level to meet demand under Trajectory C, where clean energy demand in phosphors accounts for approximately one-half of global demand throughout the short and medium terms. On one hand, trajectories assume limited substitution of LEDs and OLEDs for fluorescents, which could substantially mitigate demand in the 2020–2025 timeframe. On the other hand, the demand for yttrium could increase more rapidly if high-temperature superconductors, which generally contain yttrium, begin to capture market share from PMs used in other applications such as wind turbines.
4.7 Other Materials to Watch In addition to the materials analyzed above, several other materials—gadolinium, magnesium and vanadium—merit continued observation based on their potential for more widespread future use in energy technologies. Quantitative supply-demand analyses are not included for these materials due to insufficient data for projecting future demand. However, the following sections describe some of the potential applications and issues associated with the materials.
Gadolinium Gadolinium is currently used in lightweight metal alloys, nuclear fuel bundles, medical imaging technologies, electronics and displays. Demand for gadolinium was estimated at 1,400 tonnes in 2010, with no expectations of a supply shortfall in the foreseeable future.104
104 Personal communication between U.S. Department of Energy staff and Kingsnorth, March 2011.
However, increased demand due to emerging technologies, which include magnetic refrigeration and solid oxide fuel cells (SOFCs), could
2
4
6
8
10
12
14
16
18
20
2010 2015 2020 2025
kilo
tonn
es/y
r
Yttrium Oxide Future Supply and Demand2011 Update
Trajectory D
Trajectory C
Trajectory B
Trajectory A
Non-Clean Energy Use
DemandSupply
2015 Estimated Supply
Plus Mount Weld
Plus Mountain Pass Phase I
2010 Supply
Short Term Medium Term
8%
46%
46%
2010 - Trajectory CUS Clean Energy Demand
Rest of World Clean Energy Demand
Global Non-Clean Energy Demand
7%
49%
44%
2025 - Trajectory CUS Clean Energy Demand
Rest of World Clean Energy Demand
Global Non-Clean Energy Demand

109
upset the current supply-demand balance. Gadolinium is an important component of metal alloys used in magnetic refrigeration, which has the potential for widespread use in the medium term. Gadolinium is also used in SOFCs as a doping agent to ceria. Current demand is estimated at only 2–8 tonnes per year, but could increase dramatically with the widespread deployment of SOFC technologies (Thijssen 2011). Rapid expansion of nuclear power generation capacity could also put pressure on supply. Additionally, gadolinium is used in small amounts (0.3% by weight) in lighting phosphors, but could possibly be used in greater proportions in the future as a substitute for other materials (Schüler 2011).
Magnesium Magnesium is one of several metals that could be used increasingly in vehicle lightweighting. Global demand of magnesium was 608,000 tonnes in 2009 (USGS 2009), which is only about 50% of global production capacity. Aluminum alloying is the principal use of primary magnesium, followed by diecasting and desulfurization of iron and steel. Together, these three uses account for about 90% of U.S. magnesium consumption (USGS 2009). A large portion of these uses is in the automotive sector, where magnesium components and alloys can be used for lightweighting to improve fuel efficiency. As of 2007, the average U.S. vehicle used about 3.8 kilograms (kg) of magnesium. With continued tightening of fuel economy standards, additional automotive lightweighting is expected. Some manufacturers have announced goals of using up to 160 kg per vehicle, which could put pressure on global supply (Pollock 2010). However, automotive manufacturers may be less likely to choose magnesium than other lightweight materials, such as plastic, because of limited availability from multiple producers. In addition, there are currently antidumping duties assessed on magnesium imported from China and Russia (USGS 2009).
Vanadium Vanadium’s principal use is as an alloying agent in high-strength steels and as a catalyst in sulfuric acid production, but it is also used in the electrolyte for vanadium redox batteries. Vanadium redox batteries are still an emerging technology, but they have shown significant promise for grid storage applications. Clean energy’s share of vanadium use is likely to remain low even under high market penetration scenarios for these grid storage batteries, but the element bears watching for several reasons. First, vanadium used in battery electrolytes is a higher purity form of vanadium than the ferrovanadium that is required for steelmaking or vanadium pentoxide used in sulfuric acid production. Additionally, vanadium represents the majority of the cost of the battery, making production costs extremely sensitive to fluctuations in vanadium prices. There are prospective mines that can produce higher-grade vanadium, but these two factors could hinder development without a clear demand signal for this higher-value form of the material. Conversely, limited new supplies of battery-grade vanadium could dissuade investments in battery technology and production given the high sensitivity to vanadium prices. Vanadium can be obtained from a variety of natural deposits, including phosphate rock, titaniferous magnetite and uraniferous sandstone and siltstone. Significant amounts are also present in bauxite and carboniferous materials, such as coal, crude oil, oil shale and tar sands. However, it is normally produced as a byproduct or coproduct of other recovery operations.
110
4.8 Conclusion Four clean energy technology components have been the principal focus of this analysis:
• PMs made from alloys of REEs used in wind turbines as well as advanced vehicles and bicycles with electric drive-trains
• Advanced batteries that incorporate REEs in their electrodes or are based on Li-ion chemistries used in bicycles and advanced vehicles with electric drive-trains
• PV power systems using thin-film semiconductors • Rare earth phosphors used in high-efficiency fluorescent lighting systems
Efforts to accelerate the commercialization and deployment of these four clean energy technologies face considerable risks of supply-demand imbalances that could lead to increased price volatility and supply chain disruption. The character and severity of these risks vary among the REEs and other key materials evaluated in this Strategy. The projected supply and demand calculations have changed from the 2010 Critical Materials Strategy, but they continue to highlight the potential for supply-demand mismatches for some elements.

111
References Arnold Magnetic Technologies. 2011. “Response to U.S. Department of Energy Request for Information.” June 10.
Bloomberg New Energy Finance. 2011. Global Renewable Energy Market Outlook. November 10.
Chegwidden, Judith. 2011. “Rare Earths: An Evaluation of Current and Future Supply.” Presentation to the 2011 Annual Meeting of the Technology and Rare Earth Metals (TREM) Center, Washington, DC, March 22–23.
EERE (Office of Energy Efficiency and Renewable Energy). 2009. National Impact Analysis. Washington, DC: U.S. Department of Energy. July.
Elmquist, Sonja. 2011. “Molycorp Falls after Cutting Rare-Earth Production Forecast.” Bloomberg Businessweek, November 14. http://www.businessweek.com/news/2011-11-14/molycorp-falls-after-cutting-rare-earth-production-forecast.html.
Gordon, Julie. 2011. “Update 4 – Molycorp Speeds up Plans to Boost Rare Earth Supply.” Reuters, October 20. http://www.reuters.com/article/2011/10/20/molycorp-idUSN1E79I1RB20111020?type=companyNews.
Great Western Minerals Group. 2011. Corporate Presentation. November. http://www.gwmg.ca/html/news/presentations/index.cfm.
Hatch, Gareth. 2011. Critical Rare Earths: Global Supply & Demand Projections and the Leading Contenders for New Sources of Supply. Carpentersville, IL: Technology Metals Research, LLC.
IEA (International Energy Agency). 2010a. World Energy Outlook 2010. Paris: IEA.
IEA (International Energy Agency). 2010b. Energy Technology Perspectives 2010. Paris: IEA.
IEA (International Energy Agency). 2010c. Phasing Out Incandescent Lamps. Paris: IEA,IEA (International Energy Agency). 2011. Electric Two Wheeled Vehicle Stock Forecasts. Paris: IEA.
IMCOA. 2010. “Submission to U.S. Department of Energy in Response to Request for Information on Rare Earth Elements and Other Technology Metals.”
Indium Corporation. 2010. "Indium, Gallium & Germanium Supply & Price Outlook." Presented by Gregory Evans to the TREM 2010 Conference, Washington, DC, April.
Industrial Minerals. 2011. Industrial Minerals Data. London, UK. http://www.indmin.com/
Kingsnorth, D. 2010. “Rare Earths: Facing New Challenges in the New Decade.” Presented at the annual meeting for the Society for Mining, Metallurgy, and Exploration, Phoenix, February 27–March 4.
Pollock, Tresa. 2010. “Weight Loss with Magnesium Alloys.” Science. 328(2010): 986–987.
Schüler, Doris et al. Study on Rare Earths and their Recycling: Final Report for the Greens/EFA Group in the European Parliament. Freidburg, Germany: January 2011.
Thai, Tran. 2011. “Rare, Not Scarce.” VNEconomy News. January 7. http://news.vneconomy.vn/20110107042319251P0C4/rare-not-scarce.htm#.
Thijssen, J. LLC. 2011. Solid Oxide Fuel Cells and Critical Materials: A Review of Implications. Redmond, WA: J. Thijssen LLC, May 10.
USGS (U.S. Geological Survey). 2008. USGS Minerals Yearbook 2008: Tellurium. Reston, VA: USGS.
112
USGS (U.S. Geological Survey). 2009. USGS Minerals Yearbook 2009: Magnesium. Reston, VA: USGS.
USGS (U.S. Geological Survey). 2011. USGS Mineral Commodity Summaries. Reston, VA: USGS.
Weinert, J. et al. “The Future of Electric Two-Wheelers and Electric Vehicles in China,” Energy Policy 36 (2008): 2544–2555.
Bibliography U.S. Geological Survey. “Table of Rare Earth Elemental Breakdown by Select Sites.” Reston, VA: U.S. Geological Survey, September 2010.

113
Chapter 5. Criticality Assessment Previous chapters discuss key materials, sources of supply and the materials’ importance to clean energy technologies relative to other demands. This chapter summarizes short- and medium-term criticality assessments of the various key materials identified in Chapter 4. The assessments address two dimensions—importance to clean energy and supply risk. The basic premise is that rapidly increasing demand for key materials could hamper the clean energy agenda by outpacing new mining projects and causing supply-demand mismatches. Detailed element-by-element assessments are presented in Appendix A.
5.1 Assessment Methodology The basic methodology used to assess the criticality of materials in the 2011 Critical Materials Strategy is the same as was used in the 2010 Critical Materials Strategy. Supply and demand projections still use 2010 as a base year, which allows for a clear comparison with the 2010 Strategy.
The National Academy of Sciences (NAS) Minerals, Critical Minerals and the U.S. Economy Study (NAS 2008) developed a conceptual methodology to assess the criticality of individual minerals along two dimensions: “Impact of Supply Disruption” and “Supply Risk.” These two dimensions are rated on a scale from one to four and presented on a matrix to illustrate the relative criticality of individual minerals. According to this scheme, the upper right-hand corner of the matrix represents the highest criticality.
The NAS methodology has been adopted, with several adaptations, to address particular concerns. First, to address materials in clean energy, “Impact of Supply Disruption” was reoriented to become the “Importance to Clean Energy.” Second, attributes used to characterize “Supply Risk” were adjusted. Third, assessments have been completed for both short- and medium-term criticality, as these two time horizons have different supply and demand profiles and different policy options. Analogous to the NAS methodology, the two-dimensional criticality ratings are plotted on a matrix to enable comparison across materials for both the short and medium terms. The matrices inform a comparison among materials that can feed into prioritized research and development (R&D) investment and policy attention. Each matrix has three regions: critical (red), near-critical (yellow), and not critical (green).
It is important to keep in mind that these are qualitative assessments, informed by some quantitative analyses. There is much uncertainty in the attributes examined, particularly in the medium term. While the collection of assessments is valuable to inform policy priorities and R&D investment, it will be important to revisit the analyses moving forward as more data become available and as material supply and demand change.
Short- and medium-term scores for “Impact of Supply Disruption” and “Supply Risk” are based on a weighted average of two attributes. For each attribute, key materials are assigned qualitative factor scores of one (least critical) to four (most critical). The attributes are described in more detail below.

114
Importance to Clean Energy Importance to clean energy encompasses two attributes for each material over the short and medium terms. The weighting factor for each attribute is shown in parentheses.
• Clean Energy Demand (75%): Captures the importance of the material in magnets, batteries, photovoltaic (PV) films and phosphors used in clean energy technologies.
• Substitutability Limitations (25%): Addresses constraints on practically substituting for the material and technology within clean energy technologies. Substitution could occur at any level of the supply chain. This may include using different raw materials, components or even end-use technologies. This includes substitution by element, such as mischmetal for lanthanum in batteries, and also component technology-based substitutions, such as induction motors for permanent magnet motors.
Supply Risk The overall supply risk for each material is based on five categories of risk for the short and medium terms. For each category, key materials were assigned qualitative factor scores of one (least critical) to four (most critical). The categories are described in more detail below.
• Basic Availability (40%): The extent to which global supply will be able to meet demand. Short-term basic availability examines mine and other production relative to demand. Medium-term basic availability examines the potential for other mines to begin producing the material relative to anticipated increases in demand. The qualitative score is informed by the projections in Chapter 4, but may also take into account other factors such as global reserves, mines projected to start up after 2015 and additional supplies from recycling.
• Competing Technology Demand (10%): Whether non-energy-sector demand is expected to grow rapidly, thus constraining the supply of the material available for the energy sector.
• Political, Regulatory and Social Factors (20%): Risk associated with political, social and regulatory factors within major producer countries. This includes the risk that political instability in a country will threaten mining and processing projects; that countries will impose export quotas or other restrictions; or that social pressures, permitting or regulatory processes will delay the start up of new mines.
• Codependence on Other Markets (10%): Instances where a mineral is a coproduct or byproduct of other minerals found in the same ore deposit. Codependence can be an advantage or a disadvantage, depending on which mineral is driving production levels. In general, coproducts with lower revenue streams (i.e., production rate multiplied by price) will have higher scores because they are less likely to drive production than coproducts with higher revenue.
• Producer Diversity (20%): Market risks due to the lack of diversity in producing countries or companies (e.g., monopoly or oligopoly).

115
5.2 Identification of Critical Materials Criticality ratings for the key materials are plotted in the short and medium terms in Figures 5-1 and 5-2. More detailed assessments are found in Appendix A. Note that, in general, the criticality of some materials changes over time due to anticipated market response and the emergence of viable substitutes or a dramatic ramp up in demand for the material.
Figures 5-1 and 5-2 suggest three broad categories of criticality. Materials in the upper quadrant of the chart (with scores of three or higher on both axes) are characterized as critical. Materials with a score of three or higher on one axis but a two on the other axis are characterized as near-critical. While they are not currently judged to be critical, small changes in one or more risk category could put them at criticality. All other materials are judged not to be critical. However, all of the assessments are based on the best available information, so even materials judged not critical could be at risk due to significant unforeseen circumstances.
Figure 5-1. Short-Term (0–5 years) Criticality Matrix
Figure 5-2. Medium-Term (5–15 years) Criticality Matrix

116
Table 5-1 illustrates the distribution of materials by criticality categories in the short and medium terms.
Table 5-1. Distribution of Materials by Criticality Category
Short Term Medium term
Critical Critical
• Dysprosium • Europium • Neodymium • Terbium • Yttrium
• Dysprosium • Europium • Neodymium • Terbium • Yttrium
Near-Critical Near-Critical
• Cerium • Indium • Lanthanum • Tellurium
• Lithium • Tellurium
Not Critical Not Critical • Cobalt • Gallium • Lithium • Manganese • Nickel • Praseodymium • Samarium
• Cerium • Cobalt • Gallium • Indium • Lanthanum • Manganese • Nickel • Praseodymium • Samarium
According to the analysis, rare earth elements (REEs) dysprosium, terbium, europium, neodymium and yttrium are critical in the short term. The uses for the critical REEs are spread across magnets and phosphors. Cerium, indium, lanthanum and tellurium are near-critical. Lithium, cobalt, gallium, manganese, nickel, praseodymium and samarium are not critical. Between the short term and the medium term, the importance to clean energy and supply risk shift for some materials. For example, neodymium’s importance to clean energy increases. The importance to clean energy decreases for europium, terbium and yttrium, and the supply risk for europium also decreases. Despite these changes, neodymium, europium, terbium and yttrium all remain critical in the medium term. The supply risk for indium also decreases, making indium not critical in the medium term. On the other hand, both the importance to clean energy and the supply risk for lithium increase, making lithium near-critical in the medium term.
All other key materials either remain in the same category or become less critical from the short term to medium term. For the materials that shift to a lower category, this change generally reflects a combination of expanded supply and increased alternatives for substitution at different levels of the supply chain. Market dynamics, as described in Chapters 2, 3 and 4, will play a large role in these positive criticality changes. However, that same discussion also highlights the market complexities and

117
distortions that remain for many key materials, suggesting a role for government. The next chapter lays out the U.S. Department of Energy’s strategy for using targeted R&D to address material criticality.
Figures 5-3 and 5-4 illustrate the shift of criticality ratings from the 2010 Critical Materials Strategy to this Strategy. Solid circles represent the criticality ratings in this Strategy. Dotted circles represent the criticality rating in the 2010 Strategy for those elements that shifted; arrows are used to show the movement of the element assessments. In the short term, the supply risk and importance to clean energy for europium has increased. The importance to clean energy also increased for terbium and yttrium as a result of the increased usage of phosphors, although all of those elements were deemed critical in the 2010 Strategy. The supply risk for neodymium and yttrium has decreased, although they are still considered critical. For indium, the importance to clean energy decreased, moving it to the near-critical category. In the medium-term comparison, the clean energy demand for indium decreased compared to the 2010 Critical Materials Strategy assessment, moving indium from near-critical to not critical. The supply risk for gallium increased while the importance to clean energy decreased, keeping gallium in the not critical category.
Figure 5-3. Comparison of Short-Term Criticality Assessment between this Strategy and the 2010 Critical Materials Strategy

118
Figure 5-4. Comparison of Medium-Term Criticality Assessment between this Strategy and the 2010 Critical Materials Strategy

119
References NAS (National Academy of Science). 2008. Minerals, Critical Minerals and the U.S. Economy. Washington, DC: The National Academies Press.

120
Chapter 6. Program Directions Recently, critical materials have been prominent within the U.S. government. The White House Office of Science and Technology Policy (OSTP) convenes a working group that focuses on critical material prioritization, R&D and information. The U.S. Department of Energy (DOE) has made significant R&D investments, particularly in substitute technologies for batteries, photovoltaic cells, magnets, motors and generators. There is also recognition of the importance of education and training to support the national knowledge base across the critical materials supply chain. Data and information continue to be important to inform understanding and support decision-making. DOE has pursued multilateral international collaboration on R&D and information sharing. This chapter summarizes current activities.
6.1 Interagency Agenda Issues related to critical materials touch on the missions of many federal agencies. DOE consults and collaborates with other departments in charting the direction of its own activities. DOE also works with other departments to develop a coordinated, cross-government critical materials agenda.
Since March 2010, OSTP, in close coordination with the National Economic Council, the Office of the U.S. Trade Representative and the National Security Council, has been convening an interagency working group that addresses critical materials issues through the full supply chain. The group has been examining issues such as market risk (short- and long-term), the importance of critical materials for emerging high-growth industries and opportunities for long-term impact through innovation. The group has developed several objectives for its work:
• Promote supply diversification • Mitigate the long-term risks associated with a dependence on critical materials with careful
consideration of the full domestic manufacturing supply chain • Establish federal R&D priorities • Inform government and industry decision making • Promote environmentally sustainable practices in mineral extraction and use • Prepare a next-generation workforce
In support of these objectives, members of the interagency working group are pursuing the following activities:
Critical Material Criteria and Prioritization This subgroup aims to develop a robust and ongoing analytical capability to allow the federal government to identify risks of material shortfalls in multiple civilian and defense-related sectors long before they happen in the market. A representative from DOE co-chairs this group with a representative from the U.S. Department of Defense (DOD). The foundation of the group’s work includes the criticality assessments in the Critical Materials Strategy, DOD work assessing rare earth demand for defense applications and U.S. Geological Survey (USGS) work on supply risk.
Federal R&D Prioritization This subgroup aims to identify research investment priorities and establish linkages among research programs across agencies through an interagency R&D road mapping exercise. A representative from

121
DOE chairs this group. R&D areas of focus may include new methods of material extraction, separation and processing; development of substitute technology systems or materials; and full system design for recovery and recycling of critical materials. This group is also looking at priorities in training the next-generation workforce in material science and other relevant fields, such as chemical engineering, chemistry, physics and geosciences.
Globalization of Supply Chains Agencies are engaged in bilateral dialogues and working through international organizations such as the World Trade Organization, the G-20 and the Organization for Economic Cooperation and Development to increase transparency of export policies and reduce barriers to global trade relating to critical materials. Agencies are also working with partners to identify opportunities to build and share knowledge on environmentally sustainable mineral extraction and use.
Depth and Transparency of Information The OSTP-convened interagency process can support the collection, dissemination and quality assurance of global information that builds on existing government data-collection processes to inform understanding of material flows, location of resources and material demand. More accurate and timely market information will help industry and governments make better strategic decisions.
6.2 R&D Plan Critical materials are essential to the clean energy economy. DOE can play a vital role in assuring the availability and effective use of these materials through the identification, prioritization and support of R&D aimed at reducing the criticality of these materials.
DOE’s R&D plan is aligned with the three pillars of the overall DOE critical materials strategy: diversifying supply, developing substitutes and improving recycling. R&D is a secondary mechanism for encouraging supply diversification. Facilitating separation and processing innovations, which can help enhance the efficient use of available supply, will require R&D efforts. R&D plays a more central role in developing substitutes, which represents a large share of DOE’s current R&D portfolio on critical materials. R&D advances can also improve recycling and reuse. Across the three pillars, there is also the need for fundamental research—developing the modeling, measurement and characterization capability that is the basis for future innovations. Systems level engineering approaches that consider the supply chain should help inform R&D priorities. Critical materials R&D can be integrated with other research objectives of DOE that are focused on the overall energy or clean-energy application.
R&D is also an excellent route toward developing the next generation of human capital and technical knowledge required for a sustainable rare earth supply chain. Developing expertise in these areas depends on access to research opportunities – in academic, industrial and national laboratories. The critical material research activities by DOE and other organizations not only support innovation in clean energy technology, they provide valuable opportunities for post-doctoral researchers and graduate students. Access to these research activities can also incentivize mid-career scientists in related disciplines to develop relevant research programs.

122
In 2011, DOE increased its R&D investment in magnet, motor and generator substitutes, and focused on reducing the rare earth usage in these applications. In batteries and photovoltaic materials, DOE has historically supported broad technology portfolios including those that incorporate abundant materials. This diversity of materials makes over-reliance on particular materials less likely. Investments in these core competency areas have continued. R&D opportunities are present in separations and processing, substitution for critical materials in phosphors, and recycling. Planned R&D funding could support innovations toward improving separation and processing technologies.
DOE R&D Organizations DOE supports several different types of R&D programs, from fundamental basic research to high-risk, high-payoff early-stage projects to technology-roadmap-driven projects. These programs span the entire energy innovation pipeline with coordination between offices to ensure effective technology hand-off with minimal overlap. Since the release of the 2010 Critical Materials Strategy, there has been significant increased cooperation among DOE offices related to critical materials, leading to a more cohesive DOE R&D effort in the area.
The Office of Basic Energy Sciences supports broad-based, fundamental materials research through its Materials Sciences and Engineering Division and chemical separations science through its Chemical Sciences, Geosciences, and Biosciences Division. The Advanced Research Projects Agency – Energy (ARPA-E) supports early-stage transformational energy research that industry by itself cannot or will not support due to its high risk. If successful, this research would provide dramatic benefits for the nation. The Office of Energy Efficiency and Renewable Energy (EERE) invests in clean energy technologies that strengthen the economy, protect the environment and reduce dependence on oil. Within EERE, investment in research related to critical materials occurs within the Vehicle Technologies Program, the Wind Program, Solar Energy Technologies Program and the Advanced Manufacturing Office (formerly the Industrial Technologies Program).
Of note, the DOE national laboratory system includes the nation’s historic leader in rare earth materials research—the Ames Laboratory in Ames, Iowa. While Ames Laboratory has a core-competency in rare earth materials, many other national laboratories also contribute significantly to R&D aimed at reducing the criticality of critical materials. For example, Argonne National Laboratory (ANL), Brookhaven National Laboratory (BNL), Pacific Northwest National Laboratory (PNNL), Sandia National Laboratories (SNL) and Lawrence Berkeley National Laboratory (LBNL) all have efforts spanning from basic to applied research focused on advanced battery technologies that could reduce or eliminate the demand for rare-earth materials and/or lithium (in batteries). The national laboratories serve the nation by providing scientific infrastructure, convening leading researchers and educating future generation of scientists on issues relevant to energy, including critical materials. Related to critical materials, many projects at national laboratories are supported by DOE Program Offices (e.g., Office of Science, ARPA-E, EERE). Other research efforts at the national laboratories are Laboratory Directed Research and Development (LDRD) projects, which are seed projects supported by internal laboratory funding.
R&D Progress Regarding the first pillar—separation and processing—some of the key research challenges in these areas have been addressed at a small scale within the research portfolios of the Office of Basic Energy
123
Sciences, LDRD, Small Business Innovation Research (SBIR) and Small Business Technology Transfer (STTR). Over the past year, DOE has made significant investments in developing substitutes, specifically towards rare earth permanent magnets (PMs) for motors and generators. Research funding has also continued across diverse chemistries in photovoltaic (PV) cells and batteries. DOE’s core competencies align very closely with the R&D priorities in these areas. Related research funding from ARPA-E, the Solar Energy Technologies Program, the Vehicle Technologies Program and the Wind Program was awarded in 2011 – supporting projects on developing substitutes for critical materials in clean energy applications. In other areas of substitutions, such as phosphors, more fundamental studies are taking place at a smaller scale. Recycling of critical materials has not historically been a very active area for DOE R&D. Following the 2010 Critical Materials Strategy, the area is now under additional consideration. In developing these new and planned research activities across the three pillars, coordination between program offices (to avoid overlap, duplication and fragmentation) is ongoing.
The following sections highlight selected DOE research: separation and processing, substitutes and recycling—which align with the three pillars of the overall DOE critical materials strategy. Example programs and projects—most funded within the last year—are presented to give a glimpse into recent progress towards addressing the challenges related to critical materials. More detailed descriptions of recent Funding Opportunity Announcements (FOAs) and the awards made in those programs are available in Appendix E.
Overall, DOE is well positioned to continue providing leadership in R&D to support diversification of the global supply chain, develop substitutes and improve recycling of critical materials. The R&D investments made over the past year provide an exciting step toward ensuring the availability and effective use of the critical materials in clean energy applications. While examples of the progress presented here highlights the breadth of the challenges being undertaken by DOE researchers— significant R&D challenges remain across all three pillars.
Separation and Processing Improving separation and processing of critical materials will support the diversification of the global supply chains. There are a number of R&D challenges that exist in the area –traditional separation technologies are generally considered inefficient, environmentally unfriendly and unsustainable. These processes require the use of harsh solvents and reagents, long processing times and are very capital intensive. During the extraction, processing and separation of rare earth elements (REEs), the proper handling of thorium—which may be present in rare earth deposits depending on the geology and mineralogy—must also be considered. Improving these processes or developing new, more efficient methods would cut costs and improve environmental performance across the full supply chain. Thus far, DOE has not made a large investment in improved separation and processing. However, there are number of applicable projects underway. The Office of Science supports some research in the area, mostly at the national laboratories. At Ames Laboratory, several research themes pursue novel materials preparation and processing methodologies. These projects have the potential to serve as incubators for broader activities.

124
Improving Separation Processes Many technological challenges need to be addressed to improve current processes. Solvent extraction is currently the major method for separating REEs from the ores. The difference in solubility among the various REEs drives the separation and allows for the enrichment of the desired species. The REEs have similar chemical properties. Relevant to this process, the difference in solubility of the REEs in most solvents is very small (Ryberg 2004). In order to overcome this small solubility difference, harsh solvents and many separation stages are required. Small improvements in separation factors would significantly decrease the cost of solvent extraction processes.
DOE has historically supported research in the actinide series (elements 90–103 on the periodic table)—containing elements such as uranium and plutonium—for nuclear applications. The Office of Basic Energy Sciences has major, longstanding programs for actinide chemistry and separations at Oak Ridge National Laboratory (ORNL), LBNL and ANL. In addition, DOE’s Office of Nuclear Energy supports both university and laboratory efforts in separations for waste nuclear fuel reprocessing, and the Office of Environmental Management supports more applied work at Savannah River National Laboratory on separations. As part of nuclear fuel cycle separations, lanthanides must be separated from actinides. The actinides share many attributes with the REEs (lanthanides), mainly through f-element chemistry. Ligands and separation processes that have been developed for the actinide series may be very useful when considering rare-earth-containing materials.
New Separation and Processing Approaches A wide range of alternative separation techniques—other than solvent extraction—are being explored. Potential techniques include supercritical fluid extraction, biologically inspired approaches, ion-exchange techniques, redox manipulation, crystallization and volatility. New processing approaches to convert the separated rare earth materials to high purity, such as electrochemistry, are also being considered. The topics presented below are selected examples taken from discussions at DOE technical workshops.
• Supercritical fluid extraction: Several national laboratories are exploring supercritical carbon dioxide (SC CO2) extraction. A supercritical fluid is a substance at a temperature and pressure above its critical point. In this methodology, the rare earth material (such as an ore) is dissolved in an acid. The dissolved rare earth is contacted with SC CO2 that contains an extractant. This creates two phases: the acid phase and the SC CO2 phase. The rare earth metal binds with the extractant and remains in the SC CO2. The two phases can be separated and the rare earth metal can be isolated by removing the CO2 (by reducing the pressure or temperature) (Shimizu 2005; Peterson 2011).
• Biologically Inspired Approaches: Biologically inspired processes are being examined by several organizations. Several academic studies have demonstrated the use of bacteria to concentrate rare earth metals from dilute solutions. One study examined the adsorption of REEs onto bacterial cell walls (Takahashi 2005). In acidic solutions, from an initial concentration of 100 micrograms of an REE mixture per liter, the bacteria preferentially adsorbed REEs onto its cell surface, with europium and samarium seeing the highest enrichment.
125
• Electrochemistry: Materials and Electrochemical Research Corporation (MER) received a Small Business Innovation Research (SBIR) 2010 Phase I award to develop an electrochemical route to convert rare earth ore into high-purity metals. Specifically, the work focused on producing refined neodymium oxide. The processing innovation developed in the work yields a magnetic material with a higher energy density. For the work, MER recently won an R&D 100 award. MER has also recently been awarded an SBIR Phase II award to further the R&D effort for the innovative technology.
Improved separation and processing technologies will not only enhance moving fresh ore up the value-added chain, new processes that are developed could also improve or enable the processing of mine tailings, manufacturing scrap and recycled materials. More efficient and more environmentally friendly separation and processing technologies have the potential to encourage supply diversification and lower costs while reducing the impact of mining and processing.
Substitutes Over the past year, DOE has made significant new investments in developing substitutes for rare earth metals, including rare earth PMs for motors and wind generators. Research on incorporating earth-abundant materials into energy or clean-energy applications is also integrated into solar and battery research programs. New research investments were made from ARPA-E, the Vehicle Technologies Program and the Wind Program in 2011.
Magnets Magnet research has not achieved a commercially significant breakthrough innovation in high-energy permanent magnets since the advent of neodymium-iron-boron PMs in the early 1980s. A major effort toward developing the next breakthrough is ARPA-E’s Rare Earth Alternatives in Critical Technologies for Energy (REACT) program. Through REACT, ARPA-E is seeking to fund early-stage technology alternatives that reduce or eliminate dependence on rare earth materials by developing substitutes for rare earth PMs in two key areas: electric vehicle motors and wind generators. The technical scope of critical materials alternatives research includes primarily two approaches: the development of materials-level alternatives through research into alternative magnetic materials that exhibit equivalent or superior magnetic properties as compared to the existing rare earth materials, or component or system level alternatives that eliminate the need for rare-earth PMs while achieving equivalent or superior cost and functionality (e.g., superconducting or advanced electric machine topologies). Both approaches are being pursued in the development of rare-earth alternatives in the REACT program.
Many magnet R&D efforts for the last 30 years have focused on improving current rare earth magnets. To develop replacements for these materials, multidisciplinary approaches are needed. For example, some research approaches to developing substitutes for NdFeB PMs build off of breakthroughs developed through the National Nanotechnology Initiative (NNI). Combining materials on a nanoscale has to potential to achieve superior magnetic properties compared to the material’s respective bulk properties. A complete understanding the related scientific issues and principles is needed to harness these phenomena in a commercially viable material. In addition to nano-structured PMs, there are various research approaches—enhanced magnetic coercivity for non-rare earth magnets, molecular

126
design, high-flux soft magnets and new anisotropic mechanisms—that promise rare-earth-free magnets with superior properties. A few examples from various research programs are presented below.
• Nanoscale Composite Materials: Developing composites of hard and soft magnetic materials is one approach to developing novel PMs that can replace rare earth magnets. Hard magnets have a high coercivity, meaning they have a high resistance to being demagnetized. Soft magnets have a low coercivity, but also can be easily magnetized. Controlling the architecture of the composite can enable a magnetic coupling of the different materials, creating enhanced magnetic properties (Asti 2004). However, the phenomenon only occurs over very short-length scales, requiring architectural control at the nanoscale level. An ARPA-E REACT project centered at the University of Alabama will demonstrate advanced magnetic properties through R&D on these magnetic composite materials. Specifically, the project will explore composites using manganese, bismuth and iron. Manganese-bismuth is a soft magnetic alloy and iron will serve as the hard magnetic phase.
• Enhanced Magnetic Coercivity for Non-Rare Earth Magnets: Precise control of the structure of a crystalline magnetic material can significantly enhance magnetic properties (Herzer 1997). For example, an ARPA-E REACT project led by Northeastern University seeks to create an ordered magnetic crystal structure of iron and nickel. This structure is found naturally in meteorites and forms under cooling conditions experienced in space—as slow as 0.2 Kelvin per millennium. The team will develop methodologies to synthesize the magnetic material, achieving the properties that developed over millions of years as these materials were formed in space. If successful, the novel magnets (with no rare earth content) could have properties equivalent to those of rare earth magnets.
• Molecular Design: Combining theoretical and experimental studies can be a powerful tool towards developing new materials to replace rare earth PMs. With funding from the Vehicle Technologies Program, Ames Laboratory is leading a project to explore new compositions of materials that may replace rare earth magnets in motors. The researchers are developing routes to create iron-cobalt-tungsten materials. Tungsten is paramagnetic, yet theoretical results suggest a significant enhancement of magnetic properties (compared to ferrite) of the resulting material when it is added to iron and cobalt. Large anisotropy systems were formed by body centered cubic iron and 5d elements. Structure optimization is being explored experimentally.
Motors Researchers are exploring major system-level substitutions to replace permanent rare earth magnets in vehicles and related PM based electric machines. Some of these technologies were discussed in Chapter 2. Induction motors, which are larger (for a given power rating) than PM motors but are easier to cool and potentially more efficient at a given rotation speed, are being reconsidered as possible alternatives. Switched reluctance motors (SRMs), which operate by electronically switching an electromagnetic stator field to drive a non-PM rotor, have the advantage of producing high torque with low power requirements. With funding from the Vehicle Technologies Program, research at ORNL, for example, seeks to address the technological challenges with these designs, particularly testing the feasibility and properties of novel motor architectures to reduce torque ripple and acoustic noise in SRMs.

127
Generators EERE’s Wind Program is supporting several next-generation drive-train technology projects. For example, research is being led by Advanced Magnet Lab (company based in Florida) to develop an innovative superconducting direct-drive generator for large wind turbines. The project will employ a new technology for the drive-train coil configuration to address technical challenges of large torque electric machines. A key measure of the projects within the Wind Program is reducing the cost of wind energy. While some of the technologies funded through the program reduce or eliminate the need for rare earth PMs, this is not a stated requirement. Other innovative geared- and direct-drive designs for wind turbines are also being investigated.
Photovoltaics (PV) The Solar Energy Technologies Program funds new devices, prototype designs, and systems development and manufacturing that can help PV solar electricity become more efficient, more cost competitive or have more reliable performance than existing commercial and near-commercial PV. Projects are currently funded that seek to advance all major PV module technologies. These include wafer silicon, amorphous and single-crystal thin-film Si, cadmium telluride (CdTe) and copper indium gallium diselenide thin-films, high-efficiency (III-V semiconductor) multi-junction PV cells and concentrating solar power, advanced organic and dye-sensitized PV cells, and emerging next-generation PV technologies. Solar Energy Technologies Program seeks to develop new technologies that focus on earth-abundant materials. For example, a major initiative supports advancements in copper zinc tin, sulfide/selenide thin films—reducing the need for indium, gallium and tellurium.
The Transformational PV Science and Technology: Next Generation Photovoltaics II program– through the Sunshot initiative – funded 23 projects, many of which are related to incorporating earth-abundant materials into PV technologies. An example is a project at Purdue to develop inks based on copper, zinc, tin, and sulfur to deploy low-cost PV cells. Another project being led by the National Renewable Energy Laboratory seeks to develop new copper-nitride PV cell layers. These materials are widely available and low in cost, which also provides excellent potential to reduce the cost of PV systems. Several projects also seek to use iron pyrite—also known as fool’s gold—to develop prototype solar cells. Pyrite is non-toxic, inexpensive, and is the most abundant sulfide mineral in the Earth's crust.
Batteries R&D on next-generation battery chemistries is ongoing within several DOE offices In 2011,the Vehicle Technologies Program funded several projects to develop and demonstrate new materials and cells that offer improved performance in either energy or power density compared to state-of-the-art lithium-ion cell technologies, while not sacrificing cycle life and cost. One example is a project led by Pennsylvania State University that will develop a lithium-sulfur cell technology that utilizes more earth-abundant materials while improving performance. In 2010, ARPA-E funded 10 projects through its Batteries for Electrical Energy Storage in Transportation (BEEST) program. This program aims to look at early-stage technologies beyond nickel-metal-hydride and lithium-ion batteries for plug-in hybrids and electric vehicles. Some of the research through the BEEST program includes: developing cathodes for lithium-air batteries, lithium-sulfur batteries, zinc-air batteries and rechargeable magnesium-ion batteries.

128
Phosphors DOE research related to materials substitution has generally focused on rare earth PMs, PVs and batteries. Phosphors have received less attention. Most work in REEs phosphor substitutions are more fundamental studies based in the national laboratories – supported to some extent by the Office of Science and also the laboratories themselves. In phosphors, REEs serve as activators that are typically added (doped) into a host crystal. Given the criticality of the elements involved in phosphors (e.g., europium, terbium and yttrium), fundamental research into potential substitutes could have significant impacts. Several examples of these projects are presented below.
Two opportunities are currently being explored for replacing rare earths in phosphors at LBNL (supported by the DOE Office of Science): one involves using manganese (in various oxidation states) as a replacement for REE activators and the other explores self-activated phosphors created by engineering the host materials such that rare earth dopants are not needed to produce light.
ANL has initiated two LDRD projects related to reducing the use of critical materials in phosphors. One project is developing a new series of cerium based photoluminescence phosphors without europium, terbium and yttrium for luminescent lamps and solid-state lighting devices. Another LDRD project seeks new synthesis routes that will increase doping efficiency and reduce the use of REE by enabling precise control of the placement of REE dopants in the host material.105
Recycling
The third pillar of the 2010 Critical Materials Strategy is improving recycling. Less than 1% of REEs contained in end-of-life products are recycled (United Nations Environment Programme 2011), suggesting a “low-hanging fruit” to improve the supply. Increased recycling would reduce the environmental impact of increased mining and prevent these materials from ending up in landfills.
Ongoing R&D and other investments seek to improve recycling capability and capacity throughout the world. As previously mentioned, advances in the area of separation and processing could transfer to innovations in recycling processes. While DOE has not historically supported a large amount of research on the recycling of critical materials, R&D opportunities exist that could have a large impact on creating a more robust supply chain. As reported in the 2010 Critical Materials Strategy, the Vehicle Technologies Program awarded $9.5 million to Toxco to expand an existing battery recycling facility in Ohio and become the first U.S. facility to recycle lithium-ion vehicle batteries. The Critical Materials Hub (through the Advanced Manufacturing Office, discussed below) may also include strategies for improving recycling and reuse.
Major challenges limiting the ability to recycle rare-earth-containing products were discussed in Chapter 3, which include the following: availability of material; technology, infrastructure, logistics; and economics. Several applications would be suitable as first targets for R&D to improve the recycling and reuse of rare earth materials—particularly phosphors and large-scale magnets.
There is also interest in recycling magnets closer to the consumer scale. Automated process technologies must be developed that can safely recover magnets quickly, cheaply and in compliance
105 Written communication with J. Hryn, Argonne National Laboratory, November 2011.

129
with environmental regulations— the breakdown of used electronics can release persistent pollutants into the environment, eventually accumulating in humans (Zhang 2010). Product design that promotes easier removal of REE components would also facilitate or improve the recycling of end-of-life products.
Current and Planned DOE Research Initiatives In the past year, most of the new research investment has focused on developing substitutes for rare earth PMs—specifically for motors and generators. There are now several new R&D programs that could begin to provide research funding to address improved separation and processing in support of the first pillar of the 2010 Critical Materials Strategy—diversification of supply.
Innovative Manufacturing Initiative The Advanced Manufacturing Office recently launched the Innovative Manufacturing Initiative (IMI) to aid in the development of transformational manufacturing process and materials technologies to advance the clean energy economy. IMI supports the Advanced Manufacturing Office’s mission to invest in manufacturing engineering and development to enable rapid, low-cost, energy-efficient manufacturing. Through IMI, up to $120 million will be available over three years to develop transformational manufacturing technologies and innovative materials to reduce time, cost and energy requirements associated with manufacturing.
The two topic areas laid out by IMI are Innovative Manufacturing Processes and Innovative Materials. Subtopics in the Innovative Manufacturing Processes topic relevant to critical materials are reactions and separations, high-temperature processing and sustainable manufacturing. The Innovative Materials topic seeks to identify materials and associated production technologies that can reduce costs, reduce energy use, improve product quality and enhance productivity for American manufacturing. Awards under the IMI are expected in early 2012.
Critical Materials Energy Innovation Hub On December 23, 2011, President Obama signed the Consolidated Appropriations Act, 2012. That bill provided “$20,000,000 for the Energy Innovation Hub for Critical Materials.” The DOE Energy Innovation Hubs aim to develop innovation through a unique approach, where scientists and engineers from many disciplines work together to overcome the scientific barriers of development. In this environment, they can accomplish greater feats more quickly than they would separately. The Critical Materials Hub is proposed to focus on R&D to facilitate effective, flexible processing of critical materials to help meet the material needs of the clean energy economy. Additional R&D goals will include strategies for substitutes, recycling, reuse and more efficient use that could significantly lower world demand for newly extracted materials.
Small Business Innovation Research The FY 2012 DOE SBIR FOA has several topics relevant to REEs, specifically to improve separation and processing. One such topic is seeking technologies and processes that would increase the domestic supply of REEs. Innovations that decrease the costs of processing rare earth ores to high-purity metals are also of interest. Specific areas of research include: increasing separation factors in solvent extraction techniques while utilizing green chemistry techniques, reducing physical separation steps required in mineral processing and new processes to avoid intermediates in the production of high-purity metals. A

130
second relevant topic is seeking technologies that would enable more efficient separations methods to (a) isolate lanthanides from other metals (e.g., actinides and transition metals) in solution and/or (b) improve intra-group separations (i.e., isolating one lanthanide element from others) in solutions that contain multiple species. Also of interest is developing technologies that will allow for incorporation of highly selective ligands for lanthanide separation into a column for use in extraction chromatography. Extraction chromatography could provide more efficient, more environmentally friendly separation compared to solvent extraction.
R&D Conclusions DOE supports R&D nationwide—at national laboratories, universities and companies—that seeks to develop clean energy technologies and reduce the nation’s reliance on critical materials. Toward improving separation and processing, DOE has made investments through LDRD and SBIR. Potential new investments, such as IMI. SBIR and the Critical Materials Hub, could increase activity in this area. The research recently initiated toward developing substitutes in magnets is substantial—DOE has quickly developed significant activities in that area, although the majority of that research is in the early stages. Critical materials research applicable to other technologies, such as phosphors, are also being supported, although at a much lower level. There are significant R&D challenges facing phosphors as they relate to critical materials and additional research could provide a large impact. With the potential overlap between new separation processes and recycling, new research initiatives (e.g., IMI, SBIR and the Critical Materials Hub) could also positively impact recycling.
6.3 Data and Information The government gathers, analyzes, synthesizes and disseminates public statistics on critical materials across the supply chain. Topics potentially include discovered and potential resources, production, consumption, prices, trade, disposal and recycling. In addition, the government queries producers across the supply chain for more qualitative information on anticipated production, material intensity and potential for substitutes, with the aim of identifying critical materials and technologies.
Using government data to understand critical materials supply chains can be challenging. The available data sets are collected with varying time intervals and granularity. Generally, the data resolution is too low to support economic analysis of the rapidly changing rare earth sector. In addition, differences in the data resolution can make it difficult to integrate across data sets.
For many years, USGS has provided the most comprehensive ongoing synthesis of critical materials data and information. Through its two major publications, the agency provides domestic and international production data on rare earth materials as well as current and future uses of rare earths. Issues and industry trends of rare earth materials use are described. The latest editions of the Mineral Commodity Summaries and Commodities Yearbook provide production, consumption and market data on rare earth minerals. Tariff information, world mining, production and reserves of rare earth materials are also included.
The U.S. Department of Commerce (DOC) also provides data and information that is potentially useful for analyzing the life cycle supply chain from material flow, economic and trade perspectives. DOC’s Bureau of Economic Analysis Annual Industry Economic Accounts portray the economic relationships

131
between major industrial sectors and subsectors representing important goods or services provided by the sector. Within DOC, the Census Bureau compiles an economic census that provides sector information such as number of paid employees, purchased electricity and annual payroll. The International Trade Administration produces national trade data for individual countries, trade/economic groups and geographic regions. This system provides the capability to analyze imports and exports on a product-by-product basis. One difficulty of using DOC sources to analyze the economic impact of critical material mining and use as a raw material is the aggregate nature of the data, which is based on North American Industry Classification System codes. Thus, for example, rare earth mining does not have its own figures and is instead a subset of “all other metal ore mining.”
The International Trade Commission (ITC) provides international trade statistics, U.S. import and export statistics, information on current and future U.S. tariffs and U.S. tariff preference information. The most comprehensive source of tariff information is the ITC’s Harmonized Tariff Schedule of the United States. With the exception of cerium oxide, this database does not provide trade information specific to individual REEs and compounds.
There is potential for additional collection of statistics. For example, the U.S. Energy Information Administration (EIA) conducts an annual survey of existing and planned electric generating units in the United States, including renewable technologies. This survey is periodically revised, normally when the survey is scheduled for re-clearance by the Office of Management and Budget under the Paperwork Reduction Act. For the next revision and clearance of the capacity survey, scheduled to be effective in 2014 to collect retrospective data for calendar year 2013, EIA is considering proposing the addition of new questions aimed at identifying which generating units being deployed or proposed utilize rare earths and critical materials.
In addition to the regular collection of data, the government also collects information on an as-needed basis. For example, DOE’s second Request for Information (RFI) on critical materials addressed technology material content, supply chain structure, financing, research, education, technology transitions, recycling and permitting. The information gathered through the RFI has strongly informed this report.
6.4 International Engagement Like the United States, other countries are moving toward a clean energy economy, recognizing the benefits of a rapidly growing market for clean energy technologies. As a result of this global movement toward clean energy solutions, other nations are grappling with similar resource challenges as the United States. As discussed in Chapter 3, a number of countries have developed policies designed to address raw material requirements. International cooperation on critical materials can help all countries achieve their clean energy goals.
The potential benefits of cooperation are wide-ranging. Cooperation can help improve transparency in markets for critical materials, optimize resources for research and accelerate R&D on key topics. Working closely with the U.S. Department of State and other federal agencies, DOE will continue to engage other countries through bilateral and multilateral dialogues and collaborative institutions. A

132
primary objective will be to maintain frequent and open communication with important stakeholders while building on ongoing discussions with international partners.
DOE and other federal agencies have already begun cooperation with the European Union on critical materials through the U.S.-EU Energy Council and the Transatlantic Economic Council. The joint work focuses on R&D collaboration related to material innovation, such as substitutes, development and market deployment of recycling technologies and processes and coordination of trade policy and strategies to improve market access. A particularly important area of cooperation will be on raw materials data and analysis, which will help increase transparency on resource availability, trade flows, criticality and other market dynamics.
The U.S.-Japan Clean Energy Policy Dialogue includes cooperation on rare resources and builds on a successful bilateral technical workshop held in November 2010 that identified areas of collaboration in critical materials R&D. DOE is also launching a new initiative with Australia on rare earths and critical minerals that includes cooperation on resource mapping, recycling and environmentally friendly extraction and manufacturing. The ongoing work with these countries is complementary and will be leveraged to enhance multilateral collaboration in this important area.
In October 2011, DOE hosted the Trilateral Conference on Critical Materials for a Clean Energy Future, which brought together Japanese and European Union officials and experts, with participation by Australia and Canada. A number of industry and academic stakeholders also attended. The objectives of the workshop were to discuss the state-of-the-art research, identify knowledge gaps and research needs and explore opportunities for cooperation to enhance the future advancement of this field. Parallel sessions examined ways to reduce rare earth requirements for wind turbines and electric vehicle motors and to enhance the supply of rare earths through sustainable production, reuse, recovery and recycling. The conference built on previous meetings with these stakeholders, which included three technical workshops on rare earth metals and other critical materials in the past year. The agenda for the trilateral workshop is available in Appendix D.
On issues of trade promotion and compliance, DOE supports the U.S. Trade Representative in its effort to uphold the rules-based global trading system and ensure open and fair global markets for producers and consumers of critical materials. As other nations pursue strategies to secure valuable resources, the United States can encourage them to provide a level playing field for all users.
The United States also participates in other multilateral fora, such as the International Energy Agency, the G-20 and the Asia-Pacific Economic Cooperation, to advance its critical materials goals. Working with experts from around the world allows the United States to leverage complementary strengths to help address these challenges.
Countries are already competing for access to the material foundations of next-generation energy technologies. This competition is set to increase along with rising demand for clean energy and other technologies. Recognizing this natural competition while ensuring an open and reliable global marketplace from which to procure critical materials is of vital importance as the world transitions to a clean energy economy.

133
References Asti, G. et al. 2004. “Micromagnetic Analysis of Exchange-Coupled Hard-Soft Planar Nanocomposites.” Physical Review B 69 (174401m).
Herzer, G. 1997. “Nanocrystalline Soft Magnetic Alloys” in Handbook of Magnetic Materials, Vol. 10. Elsevier Science, chapter 3.
Peterson, E. 2011. “Approaches to Rare Earth/Lanthanide Extraction and Separations.” Presentation at the Trilateral EU-Japan-U.S. Conference on Critical Materials for a Clean Energy Future, Washington, DC, October.
Ryberg, J., M. Cox, C. Musikas, and G.R. Choppin. 2004. Solvent Extraction Principles and Practice, 2nd Ed. New York: Marcel Dekker, Inc.
Shimizu, R., K. Sawada, Y. Enokida, and I. Yamamoto. 2005. “Supercritical Fluid Extraction of Rare Earth Elements from Luminescent Material in Waste Fluorescent Lamps.” Journal of Supercritical Fluids 33(3): 235–241.
Takahasi, Y., X. Chatellier, K.H. Hattori, J. Kato, and D. Fortin. 2005. “Adsorption of Rare Earth Elements onto Bacterial Cell Wall and Its Implications for REE Sorption onto Natural Microbial Mats.” Chemical Geology 219: 53–67.
United Nations Environment Programme Recycling Rates of Metals: A Status Report. 2011.
Zhang, J. et al. 2010. “Elevated Body Burdens of PBDEs, Dioxins, and PCBs on Thyroid Hormone Homeostasis at an Electronic Waste Recycling Site in China.” Environmental Science and Technology 44: 3956.

134
Appendix A. Criticality Assessments by Element This appendix provides detailed assessments of criticality for each of the key materials. The methodology used to develop the criticality scores is explained in Section 5.1. For each material, the scores for “importance to clean energy” and “supply risk” are based on weighted averages of a number of individual factor scores. The descriptions of each factor are also presented in Section 5.1. Table A-1 summarizes the assessment scores for each key material in both the short and medium terms.
Table A-1. Short- and Medium-Term Criticality Scores for Key Materials
The sections below provide detailed assessments for each element. They are informed by the information in Chapters 2–3 and analysis in Chapter 4, but also take into account other available information impacting material criticality.
Weight: 0.75 0.25 Weight: 0.4 0.1 0.2 0.1 0.2
Atomic #
Importance to Clean Energy
(Rounded Score)
Clean Energy Demand
Substitutability Limitations
Supply Risk (Rounded
Score)Basic
Availability
Competing Technology
Demand
Political, Regulatory, and Social
Factors
Co-Dependence with Other
MarketsProducer Diversity
Short Termlithium 3 2 2 2 1 1 1 1 1 1
manganese 25 2 2 2 2 2 1 1 1 2cobalt 27 2 2 2 2 1 2 3 2 2nickel 28 2 2 2 1 1 2 1 1 1
gallium 31 2 2 2 2 2 2 1 3 1yttrium 39 4 4 4 3 3 2 4 2 4indium 49 2 2 2 3 4 3 1 3 1
tellurium 52 3 3 2 2 2 2 1 3 1lanthanum 57 3 3 3 2 2 2 3 2 3
cerium 58 3 3 2 2 2 2 3 2 3praseodymium 59 2 2 1 2 2 1 3 3 3
neodymium 60 3 3 3 3 2 3 3 2 4samarium 62 1 1 1 2 2 1 3 3 3europium 63 4 4 4 4 4 2 4 3 4
terbium 65 4 4 4 4 4 2 4 4 4dysprosium 66 4 4 3 4 4 2 4 3 4
Importance to Clean Energy
(Rounded Score)
Clean Energy Demand
Substitutability Limitations
Supply Risk (Rounded
Score)Basic
Availability
Competing Technology
Demand
Political, Regulatory, and Social
Factors
Co-Dependence with Other
MarketsProducer Diversity
Medium Termlithium 3 3 3 2 2 2 2 1 1 1
manganese 25 2 2 2 2 2 1 1 1 2cobalt 27 2 2 2 2 1 2 2 2 2nickel 28 2 2 2 1 1 2 1 1 1
gallium 31 2 2 2 2 2 3 1 3 1yttrium 39 3 3 4 3 3 2 4 2 4indium 49 2 2 2 2 3 3 1 3 1
tellurium 52 3 3 2 2 2 2 1 3 1lanthanum 57 2 2 3 2 1 2 3 2 2
cerium 58 2 2 2 2 1 3 3 2 2praseodymium 59 2 2 1 2 2 2 3 3 2
neodymium 60 4 4 3 3 3 2 3 2 3samarium 62 1 1 1 2 2 2 3 3 2europium 63 3 3 4 3 4 2 3 3 3
terbium 65 3 3 4 4 4 2 4 4 3dysprosium 66 4 4 3 4 4 2 4 3 4

135
Element: Lithium (Li) Atomic Number: 3 Lithium (Li) is a light metallic element with unique electrochemical reactivity properties. Applications include use in ceramics and glass formulations, batteries, lubricating greases, air-treatment facilities, continuous casting of metals and primary aluminum production. Importance to Clean Energy: Short Term: 2; Medium Term: 3 The primary clean energy use of Li is in batteries for electric drive vehicles. Demand for these batteries is expected to increase dramatically in the medium term.
Clean Energy Demand
Short Term: 2 Medium Term: 3
• The Li demand for batteries is expected to increase significantly with the deployment of plug-in hybrid electric and all-electric vehicles.
• Batteries could also be important to the successful integration of renewable electricity technologies in the context of Smart Grid development.
• In the medium term, Li-ion batteries may gain significant market share in hybrid-electric vehicles, which currently use nickel-metal hydride batteries.
Substitutability Limitations
Short Term: 2 Medium Term: 2
• Li-ion technology is seen as the most viable option for electric and plug-in hybrid vehicles; improvements in Li-ion chemistries may significantly enhance the energy density and reduce the specific consumption of Li.
• Zinc-air batteries, sodium-sulfur batteries, fuel cells and super- or ultra-capacitors could substitute for Li-ion batteries in stationary configurations.
• Substitutes for Li are available for most ceramic, glass and lubricant applications. Supply Risk: Short Term: 1; Medium Term: 2 Supply is somewhat constrained by the limits of existing production facilities; a number of options for additional production exist in the medium term. There is no serious indication of long-term physical constraints on supply.
Basic Availability Short Term: 1
Medium Term: 2
• Produced most economically through saline brine evaporitic processes, but could be produced from hard rock and spodumene deposits in many other countries.
• Estimated production in 2010 increased approximately 10% from estimates in the 2010 Critical Materials Strategy.
• Low prices impede increased Li production, but production has responded to increased demand for Li used in battery applications.
• Recycling has been limited due to dispersion in end-use devices and the high cost of collection, separation and re-purification. In 2009, the U.S. Department of Energy awarded Toxco $9.5 million to construct the first U.S. recycling facility for Li-ion batteries.
Competing Technology Demand
Short Term: 1 Medium Term: 2
• Demand in primary aluminum production, ceramics and glass is likely to increase during the next decade, but at a slower rate than Li use for batteries.
• Use of Li-ion batteries for “smart phones,” tablet computers and other handheld devices could grow rapidly if unit cost reductions increase use.
Political, Regulatory and Social Factors
Short Term: 1 Medium Term: 1
• No significant political, regulatory or social factors in the countries producing Li today. • Chile is currently the world’s largest producer.
Codependence on Other Markets Short Term: 1
Medium Term: 1
• No significant codependence issues are likely to affect future Li production.
Producer Diversity Short Term: 1
Medium Term: 1
• Chile, Australia, China, Argentina and the United States are all leading producers. • Six countries have major reserves.
References • USGS (U.S. Geological Survey). 2010. 2008 Minerals Yearbook: Lithium. Reston, VA: USGS. • USGS (U.S. Geological Survey). 2011. Mineral Commodity Summary: Lithium. Reston, VA: USGS.

136
Element: Manganese (Mn) Atomic number: 25 Manganese (Mn) is a hard, brittle metal that resembles iron. Chiefly used in steel production, it improves material properties (strength, hardness, toughness) of the resulting alloy. Incorporated into various lithium-ion (Li-ion) and nickel metal hydride batteries (NiMH) for electric vehicle applications. Importance to Clean Energy: Short Term: 2; Medium Term: 2 The primary clean energy use of Mn is in batteries for electric drive vehicles. Demand for these batteries is expected to increase dramatically in the medium term. The form of Mn of interest for these applications is manganese dioxide (MnO2)—usually synthesized chemically or electrolytically.
Clean Energy Demand
Short Term: 2 Medium Term: 2
• Major clean energy demand comes from use in Li-ion and NiMH batteries. Many chemistries have been developed for these applications that incorporate Mn into the composition.
• Research is exploring Mn as a material for photovoltaic cells. Substitutability
Limitations Short Term: 2
Medium Term: 2
• There are many compositions of Li-ion and NiMH batteries that could serve to replace Mn if necessary.
• In its major application in the steel industry, there are no proven substitutes.
Supply Risk: Short Term: 2; Medium Term: 2 The overall supply of Mn is quite large, however the production of battery-grade ore is much smaller (roughly 3%). A significant fraction of the MnO2 used in batteries is produced synthetically. The dominant form used domestically is electrolytic MnO2 (EMD). Chemical MnO2 is more prevalent in Europe.
Basic Availability Short Term: 2
Medium Term: 2
• The production of natural MnO2 is projected to decrease in the short term due to decreasing demand.
• Active EMD production dropped from 2006 to 2009 because of global oversupply. • Should demand increase dramatically, additional production capacity could likely
come online. Competing
Technology Demand Short Term: 1
Medium Term: 1
• Battery-grade MnO2 is only 3%–5% of global Mn production—most natural Mn is consumed in iron and steel production.
• Other uses for Mn include brick making, chemicals and fertilizers. • Carbon-zinc batteries also use battery grade MnO2, but they are decreasing in use.
Political, Regulatory and Social Factors
Short Term: 1 Medium Term: 1
• Imports of natural battery-grade MnO2 typically come from Mexico or Gabon, but would be included in metallurgical-grade Mn ore. Very little natural MnO2 is imported domestically for battery applications.
Codependence on Other Markets Short Term: 1
Medium Term: 1
• There is no major codependence on other markets.
Producer Diversity Short Term: 2
Medium Term: 2
• China has roughly 60% of the production capacity for synthetic MnO2. • U.S. companies produce roughly 15% of the world’s supply of EMD. Domestic
production has been steady for many years. • Depending on demand, production facilities could be restarted in Australia, India,
Japan and South Africa. References • USGS (U.S. Geological Survey). 2009. 2009 Mineral Yearbook: Manganese, Advanced release. Reston, VA:
USGS. http://minerals.usgs.gov/minerals/pubs/commodity/manganese/myb1-2009-manga.pdf • USGS (U.S. Geological Survey). 2011. Mineral Commodity Summaries 2011. Reston, VA: USGS, 100.
http://minerals.usgs.gov/minerals/pubs/mcs/2011/mcs2011.pdf • Written communication with the U.S. Geological Survey, October 19, 2011.

137
Element: Cobalt (Co) Atomic number: 27 Cobalt (Co) is a hard metal used in a wide variety of applications, including high-strength alloys, cutting tools and batteries. Importance to Clean Energy: Short Term: 2; Medium Term: 2 Co is used in several types of batteries for electric vehicles, including nickel metal hydride (NiMH) and lithium nickel cobalt aluminum graphite (Li-NCA-G) (a type of lithium-ion chemistry).
Clean Energy Demand
Short Term: 2 Medium Term: 2
• Li-NCA-G and NiMH batteries contain Co. • Battery production for electric drive vehicles could dramatically increase Co demand. • Samarium cobalt magnets are not likely to be used extensively in clean energy
applications in the short term or medium term. Substitutability
Limitations Short Term: 2
Medium Term: 2
• Other lithium-ion battery technologies that do not use Co also show promise for use in electric drive vehicles (Gaines and Nelson 2010).
Supply Risk: Short Term: 2; Medium Term: 2 Co supply has grown significantly over the past decade, and new mining projects are scheduled to begin. The dominance of the Democratic Republic of the Congo (DRC) is a concern—DRC produces 40% of global Co supply. Significant new production that is projected to come online is from outside of the DRC.
Basic Availability Short Term: 1
Medium Term: 1
• Production has grown to match demand over the past decade. • Current supply estimates are about 20% than those in the 2010 Critical Materials
Strategy. • There is a downward revision in additional 2015 supply of around 30% compared to
the 2010 Critical Materials Strategy, although supply estimates still exceed projected demand in all trajectories.
• The European Commission reports that 16% of Co use in the European Union is from recycled, post-consumer material.
Competing Technology Demand
Short Term: 2 Medium Term: 2
• Catalysts and other chemical product applications have increased demand for Co. • Alloys—with applications in turbines—demand a significant portion of global supply
of Co. • Lithium-ion and NiMH battery demand has increased dramatically for portable
electronics.
Political, Regulatory and Social Factors
Short Term: 3 Medium Term: 2
• The DRC dominates short-term Co production, but presents high political risk as it ranks below the 10th percentile in all World Governance Indicators rankings, including political stability.
• There are higher short-term political and social risk factors due to political instability in the DRC. This decreases in the medium term as more non-DRC projects come online.
Codependence on Other Markets Short Term: 2
Medium Term: 2
• Co can be produced as a primary product or a coproduct. • Most Co production is a byproduct from nickel or copper mining. • Decreases in nickel or copper demand will negatively affect Co supply, but the effect
may be offset by increased primary Co production in the DRC and Morocco. Producer Diversity
Short Term: 2 Medium Term: 2
• The DRC is the dominant producer, but nine other countries have significant production and reserves.
• Additional supply capacity by 2015 should be sufficient to meet demand, even without mines from the DRC.
References • Gaines, L. and P. Nelson. 2010. Lithium-Ion Batteries: Examining Material Demand and Recycling Issues.
Argonne, IL: Argonne National Laboratory. • USGS (U.S. Geological Survey). 2010. 2008 Minerals Yearbook. Reston, VA: USGS. • USGS (U.S. Geological Survey). 2011. Mineral Commodity Summary: Cobalt. Reston, VA: USGS.

138
Element: Nickel (Ni) Atomic number: 28 Nickel (Ni) is a silvery white metal used in a wide variety of applications, including batteries, stainless steel and catalysis. Importance to Clean Energy: Short Term: 2; Medium Term: 2 Ni is used in batteries for electric vehicles, including nickel metal hydride (NiMH) and lithium nickel cobalt aluminum graphite (a type of lithium-ion chemistry) batteries.
Clean Energy Demand
Short Term:2 Medium Term:2
• Batteries could also be important to the successful integration of renewable electricity technologies in the context of Smart Grid development.
Substitutability Limitations
Short Term: 2 Medium Term: 2
• In the medium term, lithium-ion batteries may gain significant market share in hybrid-electric vehicles, which currently use NiMH batteries.
Supply Risk: Short Term: 1; Medium Term: 1 Supply risk for Ni is low. The combination of mined supply and recovered scrap yields a significant availability to meet projected global demand.
Basic Availability Short Term: 1
Medium Term: 1
• Availability of Ni in 2015 is expected to meet projected global demand well into the medium term.
• Significant quantity of Ni is recovered from purchased scrap, which could not be used for battery applications but could offset demand in other applications.
• There are no active U.S. mines in 2010, and limited production from copper and palladium-platinum mines.
Competing Technology Demand
Short Term: 2 Medium Term: 2
• Clean energy demand for Ni is only a small fraction of global demand. • Production of stainless steel typically accounts for two-thirds of Ni consumption,
mainly for its corrosion resistance. • Ni catalysts are used for many industrial processes.
Political, Regulatory and Social Factors
Short Term: 1 Medium Term: 1
• There are no significant political, regulatory or social factors in the countries producing Ni today.
• Major producing countries include Canada, Russia, Australia and Norway.
Codependence on Other Markets Short Term: 1
Medium Term: 1
• No significant codependence issues are likely to affect future Ni production.
Producer Diversity Short Term: 1
Medium Term: 1
• New mines/production facilities in Brazil, Southeast Asia and the Pacific are expected to meet the rise in global demand.
References • USGS (U.S. Geological Survey). 2010. 2008 Minerals Yearbook. Reston, VA: USGS. • USGS (U.S. Geological Survey). 2011. Mineral Commodity Summary: Nickel. Reston, VA: USGS.

139
Element: Gallium (Ga) Atomic number: 31 Gallium (Ga) is a weak metal that is used in electronic devices, primarily in high-speed semiconductors and light-emitting diodes. Other uses include photovoltaic (PV) components, microwave circuitry and infrared technologies. Importance to Clean Energy: Short Term: 2; Medium Term: 2 Uses of Ga in high-efficiency, multi-junction PV cells could increase significantly in the future.
Clean Energy Demand
Short Term: 2 Medium Term: 2
• Demand for high-efficiency PVs is expected to increase throughout the short and medium terms.
• The growth rate depends on the market success of copper-indium gallium diselenide (CIGS) technology relative to competing PV technologies, as well as on the overall deployment rate of PV systems.
Substitutability Limitations
Short Term: 2 Medium Term: 2
• CIGS is only one of a number of competing PV technologies, including cadmium telluride and crystalline silicon.
• Since the release of the 2010 Critical Materials Strategy, silicon prices have dropped sharply, making traditional crystalline silicon PV cells much more cost competitive with thin-film cells.
• A reduction in cell thickness and improved processing efficiency would reduce material intensity.
Supply Risk: Short Term: 2; Medium Term: 2 Supply risk for Ga is low. Though supply is somewhat constrained by coproduction with aluminum, there are options for additional production in the medium term.
Basic Availability Short Term: 2
Medium Term: 2
• GA appears in trace amounts (<50 parts per million) as a salt in bauxite and zinc ores. Most is extracted from the crude aluminum hydroxide solution generated while refining bauxite into aluminum and alumina, the feedstock for aluminum smelters.
• Worldwide Ga resources are distributed extensively; there is no shortage of raw ore. • Primary short-term drivers: rate of global economic recovery, demand for aluminum. • Alumina refining extracts only 10% of Ga in the ore, and only 15% of refiners can
recover Ga. Increases in Ga prices could lead to process improvements to increase extraction rates and the installation of Ga recovery circuits.
• There is no primary Ga recovery in the United States. • Two U.S. firms produce commercial-grade Ga from scrap and impure metal. • There is no recycling of Ga from old scrap. • Production of gallium arsenide (GaAs)-based semiconductor devices produces
considerable scrap with high-purity GaAs. Much of this “new scrap” is recycled.
Competing Technology Demand
Short Term: 2 Medium Term: 3
• Semiconductor applications requiring high-purity Ga are expected to increase substantially. Short-term demand is driven by multifeatured cell and “smart” phones.
• Blu-ray video disk players use gallium nitride material. • Other applications: high-concentration PV collectors, large-scale neutrino collectors,
biomedical applications, fuel cells and ultra-violet activated phosphor powders. Political, Regulatory and Social Factors
Short Term: 1 Medium Term: 1
• Due to high producer diversity, there are no significant political, regulatory or social factors likely to affect future Ga production.
Codependence on Other Markets Short Term: 3
Medium Term: 3
• Ga is currently coproduced with aluminum and zinc, but recovery rates could be increased through improved extraction technology.
• Ga does not occur in sufficient concentrations to justify mining solely for its content.
Producer Diversity Short Term: 1
Medium Term: 1
• Primary production is in China, Germany, Kazakhstan, Ukraine, Hungary, Japan, Russia and Slovakia.
• Significant bauxite deposits in Arkansas, but are not currently economical to produce. References • USGS (U.S. Geological Survey). 2009. 2008 Minerals Yearbook: Gallium. Reston, VA: USGS. • USGS (U.S. Geological Survey). 2011. Mineral Commodity Summary: Gallium. Reston, VA: USGS.

140
Element: Yttrium (Y) Atomic number: 39 Yttrium (Y) has chemical properties similar to the lanthanide group. It is a key material in phosphors for both linear fluorescent lamps (LFLs) and compact fluorescent lamps (CFLs). Y is also used as a red phosphor in televisions and liquid crystal display (LCD) screens and to increase the strength of aluminum and magnesium structural alloys. Importance to Clean Energy: Short Term: 4; Medium Term: 3 Demand will increase during the switch from current high-volume, halophosphor fluorescent lamps to T8 and T5 linear and CFLs as a result of U.S. Department of Energy (DOE) rulemaking and worldwide trends. Demand should continue into the medium term until light-emitting diode (LED) bulbs achieve significant market penetration.
Clean Energy Demand
Short Term: 4 Medium Term: 3
• Demand for lighting phosphors, which use Y with terbium to produce “white” light, is projected to spike between 2012 and 2014, which coincides with the implementation of new U.S. lighting efficiency standards.
• U.S. consumer demand for CFLs is growing and the new U.S. federal minimum efficiency standards for general service lighting should dramatically raise CFL demand.
• European Union and other regions will implement similar standards to largely eliminate traditional incandescent lamps from the market.
• Clean energy demand in phosphors accounts for roughly one-half of global demand. • Demand for Y could increase more rapidly if high-temperature superconductors begin
to capture market share from permanent magnets used in other applications such as wind turbines.
Substitutability Limitations
Short Term: 4 Medium Term: 4
• No effective substitute for Y as a phosphor in fluorescent lamps has been identified. • Advanced LED technology using greatly reduced or no rare earth elements (REEs) may
begin to replace fluorescent bulbs, but not until well into the medium term. • There are no known substitutes for Y as a red phosphor in television or LCD screens.
Supply Risk: Short Term: 3; Medium Term: 3 Y is not currently mined or refined in the United States; all supplies are imported, predominately from China. Chinese customs tariffs and export quotas could significantly constrain supply-demand balances in the short term. Several possible sources could mitigate this in the medium term.
Basic Availability Short Term: 3
Medium Term: 3
• Short-term supply will be tight as demand increases faster than supply. • Significant resources are available worldwide in monazite, xenotime ores and ion-
absorbing clays. Other producers are likely to emerge in the medium term, although supplies will rise only modestly.
Competing Technology Demand
Short Term: 2 Medium Term: 2
• Y is incorporated into ceramics, electrodes, electrolytes, electronic filters, lasers, lightweight alloys, superconductors and advanced medical applications.
• The non-phosphor applications are not expected to ramp up drastically.
Political, Regulatory and Social Factors
Short Term: 4 Medium Term: 4
• China has instituted significant export quotas and tariffs on all REEs, based chiefly on resource conservation and environmental regulatory reasons.
• New mines in Australia and South Africa will provide supply in the medium term.
Codependence on Other Markets Short Term: 2
Medium Term: 2
• Y is found in varying abundance with other REEs, most predominantly in monazite, xenotime ores and ion-absorbing clays.
• Y is the most abundant of the heavy REEs, with a relatively high revenue stream.
Producer Diversity Short Term: 4
Medium Term: 4
• China currently produces almost all Y, primarily at Bayan Obo in Inner Mongolia. • China will continue to be the dominant producer in the short and medium terms.
References • USGS (U.S. Geological Survey). 2011. Mineral Commodity Summary: Yttrium. Reston, VA: USGS.
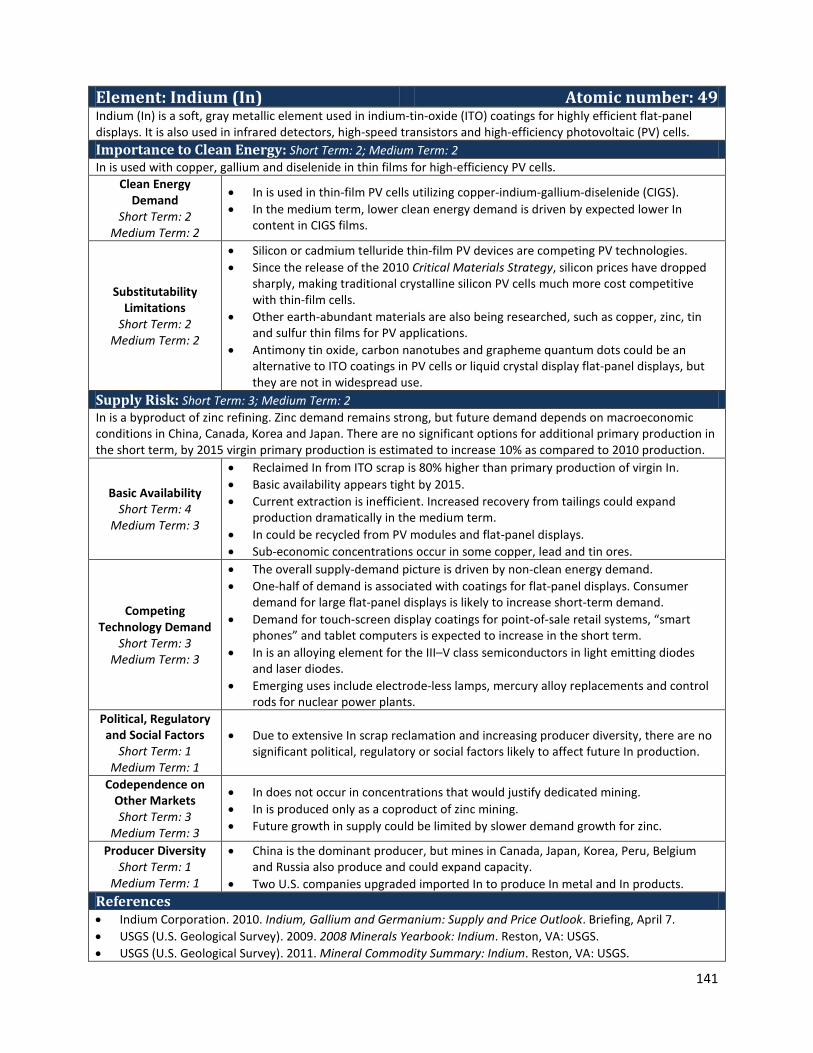
141
Element: Indium (In) Atomic number: 49 Indium (In) is a soft, gray metallic element used in indium-tin-oxide (ITO) coatings for highly efficient flat-panel displays. It is also used in infrared detectors, high-speed transistors and high-efficiency photovoltaic (PV) cells. Importance to Clean Energy: Short Term: 2; Medium Term: 2 In is used with copper, gallium and diselenide in thin films for high-efficiency PV cells.
Clean Energy Demand
Short Term: 2 Medium Term: 2
• In is used in thin-film PV cells utilizing copper-indium-gallium-diselenide (CIGS). • In the medium term, lower clean energy demand is driven by expected lower In
content in CIGS films.
Substitutability Limitations
Short Term: 2 Medium Term: 2
• Silicon or cadmium telluride thin-film PV devices are competing PV technologies. • Since the release of the 2010 Critical Materials Strategy, silicon prices have dropped
sharply, making traditional crystalline silicon PV cells much more cost competitive with thin-film cells.
• Other earth-abundant materials are also being researched, such as copper, zinc, tin and sulfur thin films for PV applications.
• Antimony tin oxide, carbon nanotubes and grapheme quantum dots could be an alternative to ITO coatings in PV cells or liquid crystal display flat-panel displays, but they are not in widespread use.
Supply Risk: Short Term: 3; Medium Term: 2 In is a byproduct of zinc refining. Zinc demand remains strong, but future demand depends on macroeconomic conditions in China, Canada, Korea and Japan. There are no significant options for additional primary production in the short term, by 2015 virgin primary production is estimated to increase 10% as compared to 2010 production.
Basic Availability Short Term: 4
Medium Term: 3
• Reclaimed In from ITO scrap is 80% higher than primary production of virgin In. • Basic availability appears tight by 2015. • Current extraction is inefficient. Increased recovery from tailings could expand
production dramatically in the medium term. • In could be recycled from PV modules and flat-panel displays. • Sub-economic concentrations occur in some copper, lead and tin ores.
Competing Technology Demand
Short Term: 3 Medium Term: 3
• The overall supply-demand picture is driven by non-clean energy demand. • One-half of demand is associated with coatings for flat-panel displays. Consumer
demand for large flat-panel displays is likely to increase short-term demand. • Demand for touch-screen display coatings for point-of-sale retail systems, “smart
phones” and tablet computers is expected to increase in the short term. • In is an alloying element for the III–V class semiconductors in light emitting diodes
and laser diodes. • Emerging uses include electrode-less lamps, mercury alloy replacements and control
rods for nuclear power plants. Political, Regulatory and Social Factors
Short Term: 1 Medium Term: 1
• Due to extensive In scrap reclamation and increasing producer diversity, there are no significant political, regulatory or social factors likely to affect future In production.
Codependence on Other Markets Short Term: 3
Medium Term: 3
• In does not occur in concentrations that would justify dedicated mining. • In is produced only as a coproduct of zinc mining. • Future growth in supply could be limited by slower demand growth for zinc.
Producer Diversity Short Term: 1
Medium Term: 1
• China is the dominant producer, but mines in Canada, Japan, Korea, Peru, Belgium and Russia also produce and could expand capacity.
• Two U.S. companies upgraded imported In to produce In metal and In products. References • Indium Corporation. 2010. Indium, Gallium and Germanium: Supply and Price Outlook. Briefing, April 7. • USGS (U.S. Geological Survey). 2009. 2008 Minerals Yearbook: Indium. Reston, VA: USGS. • USGS (U.S. Geological Survey). 2011. Mineral Commodity Summary: Indium. Reston, VA: USGS.

142
Element: Tellurium (Te) Atomic number: 52 Tellurium (Te) is a brittle, silvery-white metallic element used in photovoltaic (PV) film, steel alloys, rubber processing, synthetic fibers and electronics. Importance to Clean Energy: Short Term: 3; Medium Term: 3 PV films are currently a significant part of global Te demand, mainly due to the rapid expansion of a single company, First Solar. Other PV technologies are available.
Clean Energy Demand
Short Term: 3 Medium Term: 3
• TE is used in cadmium telluride (CdTe) PV thin films. CdTe was about 10%–15% of the global PV market and expanding.
• Improvements in thin-film processing efficiency are expected to reduce demand. • As the PV market expands, CdTe will likely compete with other PV technologies. • The PV industry is trending toward reducing material intensity for thin-film active
layers.
Substitutability Limitations
Short Term: 2 Medium Term: 2
• CdTe is one of a number of PV thin-film technologies, including copper-indium-gallium-diselenide, silicon and copper zinc tin sulfide.
• Future demand depends on market success of CdTe versus competing PV technologies, as well as the overall deployment rate of PV.
• Since the release of the 2010 Critical Materials Strategy, silicon prices have dropped sharply, making traditional crystalline silicon PV cells much more cost competitive with thin-film cells.
Supply Risk: Short Term: 2; Medium Term: 2 Te is only produced as a secondary product of copper and, to a lesser extent, other nonferrous metals. Though there is only one firm in the United States producing commercial-grade Te, production is well distributed globally.
Basic Availability Short Term: 2
Medium Term: 2
• Te is currently dependent on the production of copper. • Expected increases in recovery from copper anode slime increases supply in the short
term. • There is a downward revision in additional 2015 supply of approximately 30%
compared to the 2010 Critical Materials Strategy. Competing
Technology Demand Short Term: 2
Medium Term: 2
• There is some flexibility in the overall demand picture, with the bulk of current Te use currently coming in relatively low-value steel alloys that have alternate formulations.
• Recent reductions in use in steel alloys have not quite counterbalanced increases in demand for PV, thermal imaging, thermoelectric applications and other electronics.
Political, Regulatory and Social Factors
Short Term: 1 Medium Term: 1
• There are no significant political, regulatory or social factors.
Codependence on Other Markets Short Term: 3
Medium Term: 3
• Te is coproduced from the anode slimes from electrolytic refining of copper, and does not occur in concentrations high enough to justify mining solely for its content.
• The price of Te is not high enough to drive increases in copper production, though primary copper production continues to increase globally.
• Additional production and recovery methods could mitigate coproduction risk. Producer Diversity
Short Term: 1 Medium Term: 1
• Te has a high level of producer diversity—it is available from the United States, Canada, Japan, Peru, Australia, Belgium, China, Germany, Kazakhstan, the Philippines and Russia.
References • DOE (U.S. Department of Energy). 2010. 2008 Solar Technologies Market Report. Washington, DC: DOE. • Personal communication with the National Renewable Energy Laboratory, August 18, 2011 and October 13,
2011. • USGS (U.S. Geological Survey). 2009. 2008 Minerals Yearbook: Selenium and Tellurium. Reston, VA: USGS. • USGS (U.S. Geological Survey). 2010. 2008 Minerals Yearbook: Copper. Reston, VA: USGS. • USGS (U.S. Geological Survey). 2011. Mineral Commodity Summary. Reston, VA: USGS.

143
Element: Lanthanum (La) Atomic number: 57 Lanthanum (La) is the lightest rare earth element (REE) in the lanthanide series. It is a soft, silvery-white mineral found chiefly in monazite and bastnasite ores. Importance to Clean Energy: Short Term: 3; Medium Term: 2 La’s importance to clean energy is mainly through battery alloys and phosphors.
Clean Energy Demand
Short Term: 3 Medium Term: 2
• La is used in nickel metal hydride (NiMH) batteries either as high-purity material or part of mischmetal (a combination of cerium, La, neodymium and praseodymium). The transition from NiMH to lithium-ion (Li-ion) will reduce La demand.
• Less than 10% of La supplies are used for lighting phosphors. Demand for phosphors is expected to increase in the short term as fluorescent bulbs gain market share.
Substitutability Limitations
Short Term: 3 Medium Term: 3
• NiMH batteries already substitute mischmetal compound for pure La. • Li-ion batteries are projected to gain market share, and could make up the majority of
the hybrid electric-vehicle battery market by 2020. • There are no substitutes for La as a lighting phosphor in fluorescent light bulbs. • Light-emitting diode technologies that contain less (or even no) REEs will grow in
market share relative to fluorescent light bulbs in the medium term. Supply Risk: Short Term: 2; Medium Term: 2 La is relatively abundant, though increased clean energy demand and coproduction issues may compromise supplies in the short and medium terms. There is an increase in expected 2015 supply from the 2010 Critical Materials Strategy.
Basic Availability Short Term: 2
Medium Term: 1
• La experienced a supply shortfall in 2010, but this supply-demand mismatch is temporary.
• La is the second most abundant REE, after cerium. • La has a relatively low price compared to other light and medium REEs.
Competing Technology Demand
Short Term: 2 Medium Term: 2
• Other major applications for La include its use in alloys and fluid cracking catalysts for petroleum refining. Demand growth in these technologies is not expected to be as significant as the demand growth for clean energy applications.
• La is also used in hydrogen technology applications for hydrogen gas storage and energy conservation. These technologies are not expected to be commercialized and deployed in large numbers until well into the future.
Political, Regulatory and Social Factors
Short Term: 3 Medium Term: 3
• La is produced predominantly in China, which instituted significant export quotas and tariffs on all REEs for resource conservation and environmental regulatory reasons.
• New mines in Australia and the United States will provide additional supply, but are subject to strict permitting processes and environmental regulations, which have the potential to delay production.
Codependence on Other Markets Short Term: 2
Medium Term: 2
• La is the second most abundant of all REEs, with a moderately high revenue stream. • Production of La does not typically drive mining of REEs; all REE ores contain
significant quantities of La.
Producer Diversity Short Term: 3
Medium Term: 2
• Current La production is centered in China. • The United States has one domestic source (Molycorp) and other potential future
domestic sources. • Large amounts of La exist in monazite ores found in India, Brazil, Australia and Africa. • By 2015, non-Chinese mines are expected to provide significant additional
production. References • Molycorp, Inc. 2009. “Lanthanum.” Molycorp, Inc.
http://www.molycorp.com/GreenElements/TheRareEarthElements/Lanthanum.aspx • Oakdene Hollins. 2010. Lanthanide Resources and Alternatives. Aylesbury, UK: Department for Transport and
Department for Business, Innovation and Skills.
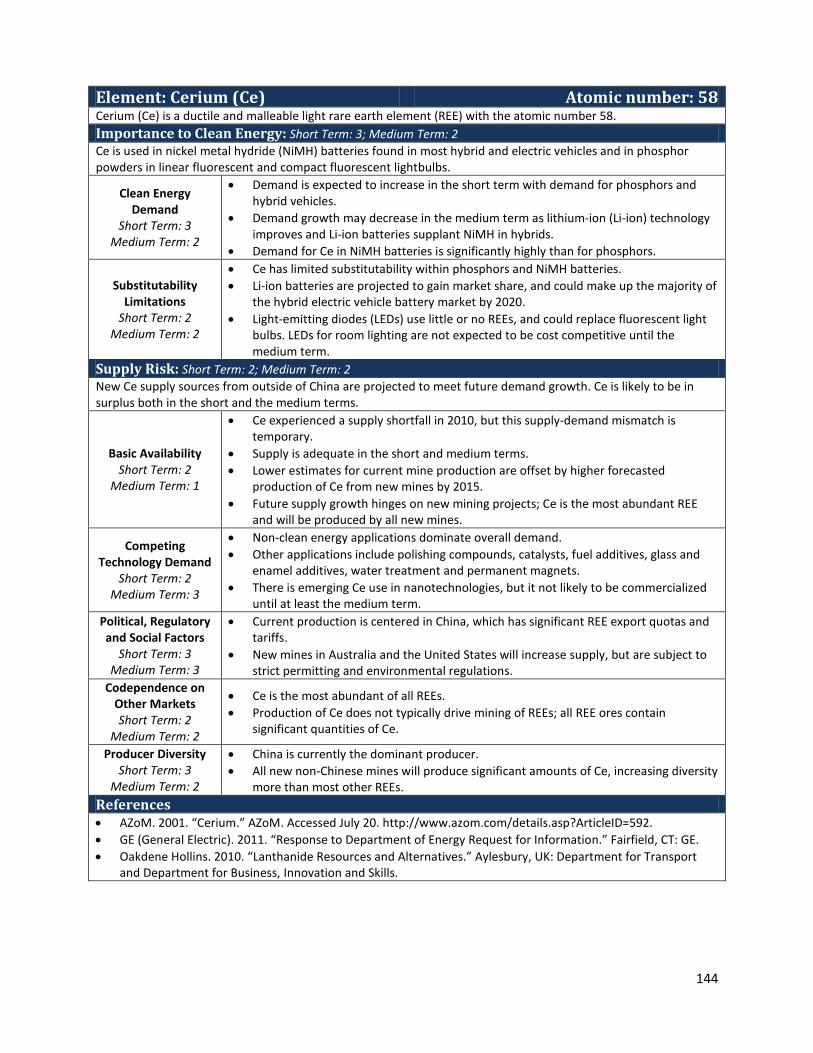
144
Element: Cerium (Ce) Atomic number: 58 Cerium (Ce) is a ductile and malleable light rare earth element (REE) with the atomic number 58. Importance to Clean Energy: Short Term: 3; Medium Term: 2 Ce is used in nickel metal hydride (NiMH) batteries found in most hybrid and electric vehicles and in phosphor powders in linear fluorescent and compact fluorescent lightbulbs.
Clean Energy Demand
Short Term: 3 Medium Term: 2
• Demand is expected to increase in the short term with demand for phosphors and hybrid vehicles.
• Demand growth may decrease in the medium term as lithium-ion (Li-ion) technology improves and Li-ion batteries supplant NiMH in hybrids.
• Demand for Ce in NiMH batteries is significantly highly than for phosphors.
Substitutability Limitations
Short Term: 2 Medium Term: 2
• Ce has limited substitutability within phosphors and NiMH batteries. • Li-ion batteries are projected to gain market share, and could make up the majority of
the hybrid electric vehicle battery market by 2020. • Light-emitting diodes (LEDs) use little or no REEs, and could replace fluorescent light
bulbs. LEDs for room lighting are not expected to be cost competitive until the medium term.
Supply Risk: Short Term: 2; Medium Term: 2 New Ce supply sources from outside of China are projected to meet future demand growth. Ce is likely to be in surplus both in the short and the medium terms.
Basic Availability Short Term: 2
Medium Term: 1
• Ce experienced a supply shortfall in 2010, but this supply-demand mismatch is temporary.
• Supply is adequate in the short and medium terms. • Lower estimates for current mine production are offset by higher forecasted
production of Ce from new mines by 2015. • Future supply growth hinges on new mining projects; Ce is the most abundant REE
and will be produced by all new mines.
Competing Technology Demand
Short Term: 2 Medium Term: 3
• Non-clean energy applications dominate overall demand. • Other applications include polishing compounds, catalysts, fuel additives, glass and
enamel additives, water treatment and permanent magnets. • There is emerging Ce use in nanotechnologies, but it not likely to be commercialized
until at least the medium term. Political, Regulatory and Social Factors
Short Term: 3 Medium Term: 3
• Current production is centered in China, which has significant REE export quotas and tariffs.
• New mines in Australia and the United States will increase supply, but are subject to strict permitting and environmental regulations.
Codependence on Other Markets Short Term: 2
Medium Term: 2
• Ce is the most abundant of all REEs. • Production of Ce does not typically drive mining of REEs; all REE ores contain
significant quantities of Ce.
Producer Diversity Short Term: 3
Medium Term: 2
• China is currently the dominant producer. • All new non-Chinese mines will produce significant amounts of Ce, increasing diversity
more than most other REEs. References • AZoM. 2001. “Cerium.” AZoM. Accessed July 20. http://www.azom.com/details.asp?ArticleID=592. • GE (General Electric). 2011. “Response to Department of Energy Request for Information.” Fairfield, CT: GE. • Oakdene Hollins. 2010. “Lanthanide Resources and Alternatives.” Aylesbury, UK: Department for Transport
and Department for Business, Innovation and Skills.

145
Element: Praseodymium (Pr) Atomic number: 59 Praseodymium (Pr) is a light rare earth element (REE) used in a variety of technologies, including clean energy. It is a soft, silvery, malleable and ductile metal. Pr is paramagnetic at any temperature above 1 K. Importance to Clean Energy: Short Term: 2; Medium Term: 2 Pr can partially substitute for neodymium in neodymium-iron-boron magnets for electric vehicle motors and wind turbine generators. Pr and several other light REEs are also used in mischmetal for nickel metal hydride (NiMH) batteries.
Clean Energy Demand
Short Term: 2 Medium Term: 2
• Pr is used as a minor constituent of neodymium magnets and mischmetal in NiMH batteries.
• Substitution of Pr for neodymium is thought to be less than 5% for high-performance magnets.
Substitutability Limitations
Short Term: 1 Medium Term: 1
• Pr is generally used as a substitute for other REEs in clean energy applications, not as a primary material.
Supply Risk: Short Term: 2; Medium Term: 2 Although it is the least abundant of the light REEs, Pr supply should meet demand in the short and medium terms.
Basic Availability Short Term: 2
Medium Term: 2
• Pr is the least abundant light REE in bastnasite and monazite, but supply is projected to meet demand in the short and medium terms.
• New mines will significantly increase supply by 2015. Competing
Technology Demand Short Term: 1
Medium Term: 2
• Pr is used in lighter flints, glass polishing, lasers, magnets and batteries. • Emerging applications include magnetic refrigeration, high-temperature
superconductivity and hydrogen storage.
Political, Regulatory and Social Factors
Short Term: 3 Medium Term: 3
• Pr is produced predominantly in China, which instituted significant export quotas and tariffs on REEs for resource conservation and environmental regulatory reasons.
• New mines in Australia and the United States will provide additional supply, but are subject to strict permitting processes and environmental regulations.
Codependence on Other Markets Short Term: 3
Medium Term: 3
• Pr is less abundant than other light REEs in bastnasite or monazite. • Limited demand means that other REEs are more likely to drive production decisions.
Producer Diversity Short Term: 3
Medium Term: 2
• Additional short-term sources may include Mt. Pass, Mount Weld and Nolans Bore. • New mines are projected to increase supply by almost 50% in the short term. • Additional medium-term production capacities and producer diversity are expected.
References • Ames Laboratory. 2010. “The Ames Laboratory Response to U.S. Department of Energy’s Request for
Information.” Ames, IA: Ames Laboratory. • Arnold Magnetics. 2011. “Response to U.S. Department of Energy’s Request for Information.” Camarillo, CA:
Arnold Magnetics.

146
Element: Neodymium (Nd) Atomic number: 60 Neodymium (Nd) is a light rare earth element (REE) used in high-strength permanent magnets (PMs). Other applications include use as a component of didymium (mixture of Nd and praseodymium) for coloring glass and ceramics, astronomical instruments and glass lasers. Importance to Clean Energy: Short Term: 3; Medium Term: 4 The major use of Nd in clean energy technologies is high-strength magnets formed from an alloy with iron (Fe) and boron (B). NdFeB magnets are used extensively in high-efficiency, brushless motors in electric vehicles and in direct-drive generators. Applications include wind turbines; hybrid, plug-in hybrid and all-electric vehicles; and energy-efficient appliances.
Clean Energy Demand
Short Term: 3 Medium Term: 4
• Demand for Nd in magnets depends on the global economic recovery and the success of “green economy” efforts in the United States, European Union, Japan and China.
• Nd is also a component of mischmetal used in nickel metal hydride batteries. • Nd use in clean energy is expected to grow with increasing market penetration of
electric drive vehicles and PM wind turbines. Substitutability
Limitations Short Term: 3
Medium Term: 3
• There are limited substitutes for NdFeB magnets, although research is ongoing to reduce Nd content in PMs and develop non-rare-earth PMs.
• At the component level, there are substitute motor and generator technologies under development that do not use REEs.
Supply Risk: Short Term: 3; Medium Term: 3 Increased demand for Nd will lead to tight supplies in the short term. Additional mines outside of China may be brought into commercial production, reducing the potential for supply shortages in the medium term.
Basic Availability Short Term: 2
Medium Term: 3
• Nd had limited near-term flexibility for increasing global supply, despite stockpiled supplies.
• Demand for NdFeB magnets is likely to exceed producers’ ability in the short term. • Recycling magnets is of great interest; investments in research and development
toward overcoming technological challenges are needed.
Competing Technology Demand
Short Term: 3 Medium Term: 2
• The majority of global consumption of neodymium oxide in 2010 was for high-strength magnet applications; only a small portion was for wind generators and hybrid vehicles.
• Magnetic refrigeration and PM motors for home appliances could increase demand for NdFeB magnets beyond the medium term.
Political, Regulatory and Social Factors
Short Term: 3 Medium Term: 3
• Nd is predominantly produced in China, which has instituted significant export quotas and tariffs on REEs for resource conservation and environmental regulatory reasons.
• New mines in Australia and the United States will provide additional supply, but are subject to strict permitting processes and environmental regulations.
Codependence on Other Markets Short Term: 2
Medium Term: 2
• Nd’s moderate abundance and prices compared to other REEs leads to high revenue streams.
• Nd usually drives production of other REEs.
Producer Diversity Short Term: 4
Medium Term:3
• Nd is mainly produced from mines in China. • New non-Chinese mines will increase diversity significantly by 2015, even though
global supply is projected to remain tight. References • GE (General Electric). 2010. “Response to Department of Energy Request for Information.” Fairfield, CT: GE. • USGS (U.S. Geological Survey). 2009. 2008 Minerals Yearbook: Rare Earths. Reston, VA: USGS.
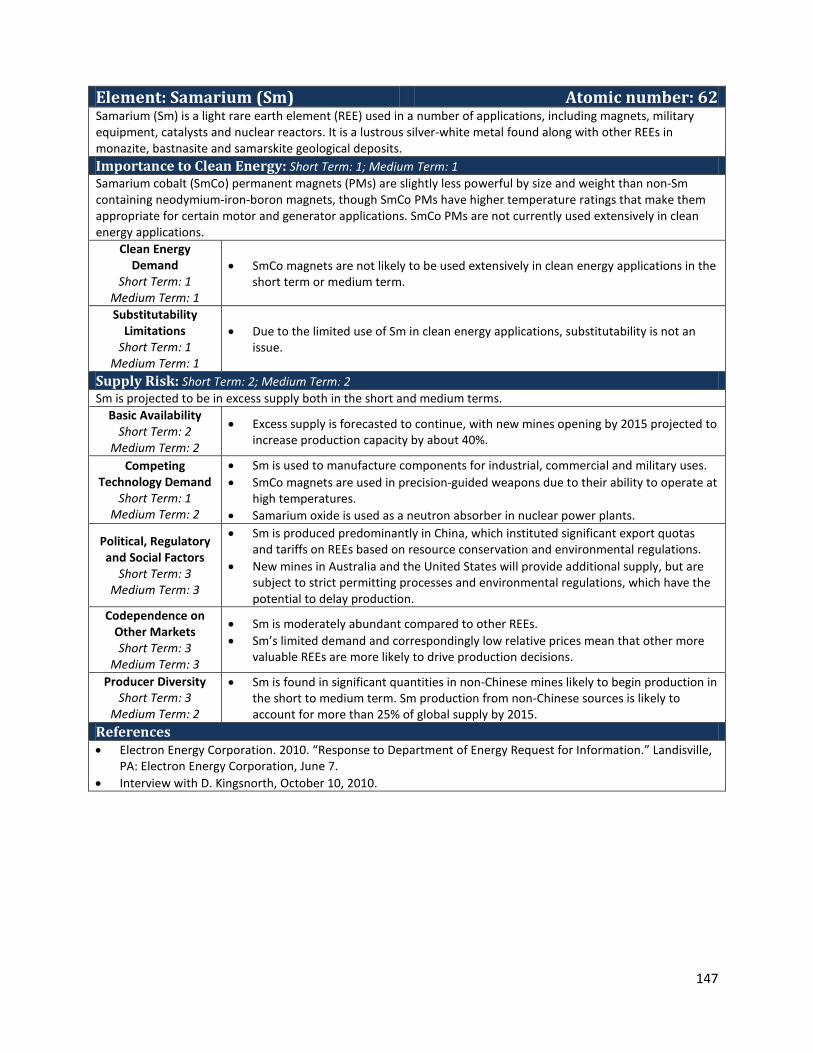
147
Element: Samarium (Sm) Atomic number: 62 Samarium (Sm) is a light rare earth element (REE) used in a number of applications, including magnets, military equipment, catalysts and nuclear reactors. It is a lustrous silver-white metal found along with other REEs in monazite, bastnasite and samarskite geological deposits. Importance to Clean Energy: Short Term: 1; Medium Term: 1 Samarium cobalt (SmCo) permanent magnets (PMs) are slightly less powerful by size and weight than non-Sm containing neodymium-iron-boron magnets, though SmCo PMs have higher temperature ratings that make them appropriate for certain motor and generator applications. SmCo PMs are not currently used extensively in clean energy applications.
Clean Energy Demand
Short Term: 1 Medium Term: 1
• SmCo magnets are not likely to be used extensively in clean energy applications in the short term or medium term.
Substitutability Limitations
Short Term: 1 Medium Term: 1
• Due to the limited use of Sm in clean energy applications, substitutability is not an issue.
Supply Risk: Short Term: 2; Medium Term: 2 Sm is projected to be in excess supply both in the short and medium terms.
Basic Availability Short Term: 2
Medium Term: 2
• Excess supply is forecasted to continue, with new mines opening by 2015 projected to increase production capacity by about 40%.
Competing Technology Demand
Short Term: 1 Medium Term: 2
• Sm is used to manufacture components for industrial, commercial and military uses. • SmCo magnets are used in precision-guided weapons due to their ability to operate at
high temperatures. • Samarium oxide is used as a neutron absorber in nuclear power plants.
Political, Regulatory and Social Factors
Short Term: 3 Medium Term: 3
• Sm is produced predominantly in China, which instituted significant export quotas and tariffs on REEs based on resource conservation and environmental regulations.
• New mines in Australia and the United States will provide additional supply, but are subject to strict permitting processes and environmental regulations, which have the potential to delay production.
Codependence on Other Markets Short Term: 3
Medium Term: 3
• Sm is moderately abundant compared to other REEs. • Sm’s limited demand and correspondingly low relative prices mean that other more
valuable REEs are more likely to drive production decisions.
Producer Diversity Short Term: 3
Medium Term: 2
• Sm is found in significant quantities in non-Chinese mines likely to begin production in the short to medium term. Sm production from non-Chinese sources is likely to account for more than 25% of global supply by 2015.
References • Electron Energy Corporation. 2010. “Response to Department of Energy Request for Information.” Landisville,
PA: Electron Energy Corporation, June 7. • Interview with D. Kingsnorth, October 10, 2010.
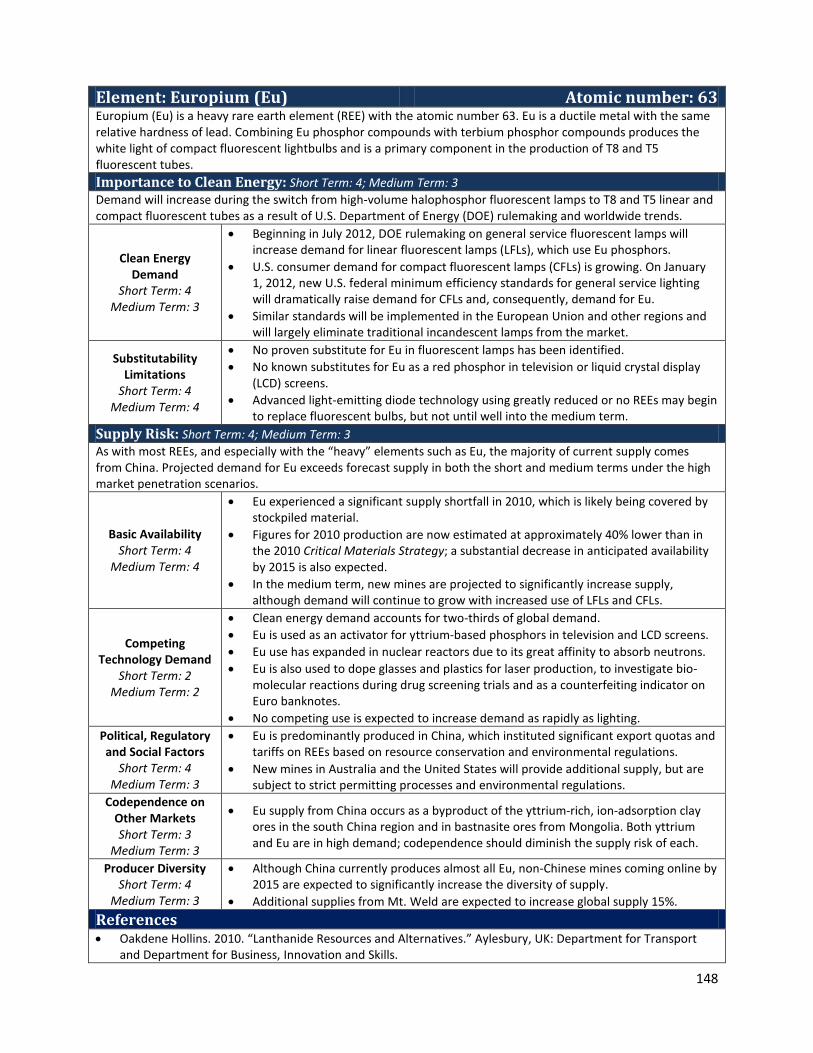
148
Element: Europium (Eu) Atomic number: 63 Europium (Eu) is a heavy rare earth element (REE) with the atomic number 63. Eu is a ductile metal with the same relative hardness of lead. Combining Eu phosphor compounds with terbium phosphor compounds produces the white light of compact fluorescent lightbulbs and is a primary component in the production of T8 and T5 fluorescent tubes. Importance to Clean Energy: Short Term: 4; Medium Term: 3 Demand will increase during the switch from high-volume halophosphor fluorescent lamps to T8 and T5 linear and compact fluorescent tubes as a result of U.S. Department of Energy (DOE) rulemaking and worldwide trends.
Clean Energy Demand
Short Term: 4 Medium Term: 3
• Beginning in July 2012, DOE rulemaking on general service fluorescent lamps will increase demand for linear fluorescent lamps (LFLs), which use Eu phosphors.
• U.S. consumer demand for compact fluorescent lamps (CFLs) is growing. On January 1, 2012, new U.S. federal minimum efficiency standards for general service lighting will dramatically raise demand for CFLs and, consequently, demand for Eu.
• Similar standards will be implemented in the European Union and other regions and will largely eliminate traditional incandescent lamps from the market.
Substitutability Limitations
Short Term: 4 Medium Term: 4
• No proven substitute for Eu in fluorescent lamps has been identified. • No known substitutes for Eu as a red phosphor in television or liquid crystal display
(LCD) screens. • Advanced light-emitting diode technology using greatly reduced or no REEs may begin
to replace fluorescent bulbs, but not until well into the medium term. Supply Risk: Short Term: 4; Medium Term: 3 As with most REEs, and especially with the “heavy” elements such as Eu, the majority of current supply comes from China. Projected demand for Eu exceeds forecast supply in both the short and medium terms under the high market penetration scenarios.
Basic Availability Short Term: 4
Medium Term: 4
• Eu experienced a significant supply shortfall in 2010, which is likely being covered by stockpiled material.
• Figures for 2010 production are now estimated at approximately 40% lower than in the 2010 Critical Materials Strategy; a substantial decrease in anticipated availability by 2015 is also expected.
• In the medium term, new mines are projected to significantly increase supply, although demand will continue to grow with increased use of LFLs and CFLs.
Competing Technology Demand
Short Term: 2 Medium Term: 2
• Clean energy demand accounts for two-thirds of global demand. • Eu is used as an activator for yttrium-based phosphors in television and LCD screens. • Eu use has expanded in nuclear reactors due to its great affinity to absorb neutrons. • Eu is also used to dope glasses and plastics for laser production, to investigate bio-
molecular reactions during drug screening trials and as a counterfeiting indicator on Euro banknotes.
• No competing use is expected to increase demand as rapidly as lighting. Political, Regulatory and Social Factors
Short Term: 4 Medium Term: 3
• Eu is predominantly produced in China, which instituted significant export quotas and tariffs on REEs based on resource conservation and environmental regulations.
• New mines in Australia and the United States will provide additional supply, but are subject to strict permitting processes and environmental regulations.
Codependence on Other Markets Short Term: 3
Medium Term: 3
• Eu supply from China occurs as a byproduct of the yttrium-rich, ion-adsorption clay ores in the south China region and in bastnasite ores from Mongolia. Both yttrium and Eu are in high demand; codependence should diminish the supply risk of each.
Producer Diversity Short Term: 4
Medium Term: 3
• Although China currently produces almost all Eu, non-Chinese mines coming online by 2015 are expected to significantly increase the diversity of supply.
• Additional supplies from Mt. Weld are expected to increase global supply 15%. References • Oakdene Hollins. 2010. “Lanthanide Resources and Alternatives.” Aylesbury, UK: Department for Transport
and Department for Business, Innovation and Skills.

149
Element: Terbium (Tb) Atomic number: 65 Terbium (Tb) is a heavy rare earth element (REE) used in fluorescent lighting phosphors and magnets for electric motors. Importance to Clean Energy: Short Term: 4; Medium Term: 3 Tb is used in several clean energy applications, most notably as a phosphor in fluorescent light bulbs. It can also be used instead of dysprosium as an additive in neodymium-iron-boron (NdFeB) permanent magnets.
Clean Energy Demand
Short Term: 4 Medium Term: 3
• Demand for europium, Tb and yttrium used in lighting phosphors is projected to spike between 2012 and 2014, which coincides with the implementation of new U.S. lighting efficiency standards.
• Estimated Tb demand in phosphors in 2010 was approximately equal to total Tb demand.
Substitutability Limitations
Short Term: 4 Medium Term: 4
• No current substitutes exist for Tb as a lighting phosphor in fluorescent bulbs. Ongoing research, particularly in Japan, seeks to reduce the Tb required in phosphors.
• Advanced light-emitting diode bulbs that do not use Tb may replace fluorescent lighting, but not until at least the medium term.
• Tb and dysprosium can both be used as additives in NdFeB magnets. Tb is historically more expensive than dysprosium, so its use in magnets is already limited.
Supply Risk: Short Term: 4; Medium Term: 4 In the short and medium terms, Tb supply will be very tight relative to demand. In the medium term, additional non-Chinese producers will increase supply, but may not compensate for reduced Chinese supply and increased world demand.
Basic Availability Short Term: 4
Medium Term: 4
• Estimated 2010 production of Tb is 25% higher than presented in the 2010 Critical Materials Strategy.
• Western mines will increase supply in the short term, but supply will remain tight throughout the medium term due to increased demand and decreased Chinese production.
Competing Technology Demand
Short Term: 2 Medium Term: 2
• Non-clean energy demand is virtually zero. • Tb also has properties that make it suitable for use in magnetic refrigeration or as a
stabilizer in fuel cells.
Political, Regulatory and Social Factors
Short Term: 4 Medium Term: 4
• Tb is predominantly produced in China, which instituted significant export quotas and tariffs on REEs based on resource conservation and environmental regulations.
• New mines in Australia and the United States will provide limited additional supply and are subject to strict permitting processes and environmental regulations.
Codependence on Other Markets Short Term: 4
Medium Term: 4
• Tb is coproduced from REE ores along with other lanthanides. • Tb is scarce even compared to other REEs—most deposits contain Tb concentrations
of less than 1% by weight of total rare earth oxide.
Producer Diversity Short Term: 4
Medium Term: 3
• Increased supply by 2015 will come chiefly from the Nolans Bore mine in Australia. • China will remain the dominant producer in the medium term.
References • GE (General Electric). 2010. “Response to U.S. Department of Energy’s Request for Information.” June 7.
Fairfield, CT: GE. • Personal communication with Kingsnorth, March 2011.

150
Element: Dysprosium (Dy) Atomic number: 66 Dysprosium (Dy) is a heavy rare earth element (REE). It is a soft metal with a silver luster and extremely high magnetic strength. Its primary uses included in ceramics, in high-intensity lighting and as an additive to rare earth permanent magnets (PMs). Importance to Clean Energy: Short Term: 4; Medium Term: 4 Dy’s primary clean energy use is as an additive to neodymium-iron-boron magnets. The addition of either Dy or terbium (up to 6% of the magnet’s weight) helps increase the value of intrinsic coercivity, or resistance to demagnetization. This also helps to improve resistance to magnetization at higher temperatures.
Clean Energy Demand
Short Term: 4 Medium Term: 4
• Although used in relatively small quantities in magnets, it is crucial for magnets capable of high-temperature operations (particularly in vehicle drives).
• Demand for Dy will increase significantly with the growing market for electric drive vehicles in both the short and medium terms.
Substitutability Limitations
Short Term: 3 Medium Term: 3
• The only known substitute in PMs is terbium, which is even rarer and historically more expensive.
• At the component level, there are substitute motor and generator technologies being developed that do not use REEs.
Supply Risk: Short Term: 4; Medium Term: 4 More than 90% of the global supply of Dy comes from China. Dependence on Chinese exports is expected to lead to a critical shortage of the element between 2012 and 2014. New mines are scheduled to come online in the medium term that could mitigate this constriction.
Basic Availability Short Term: 4
Medium Term: 4
• Demand is projected to increase significantly with minimal increased supply. • By 2015, anticipated new mines are expected to provide little new supply—an
increase of approximately 10%.
Competing Technology Demand
Short Term: 2 Medium Term: 2
• Emerging technologies exist but are unlikely to significantly increase demand pressure compared to current applications.
• Expanded uses could include magneto-mechanical sensors, actuators and acoustic and ultrasonic transducers, e.g., flat-panel speakers. Dy has been considered for use in diesel engine fuel injectors.
• Lightweight alloys can include a small percentage of Dy.
Political, Regulatory and Social Factors
Short Term: 4 Medium Term: 4
• China has instituted significant export quotas and tariffs on all REEs based on resource conservation and environmental regulatory reasons.
• New mines in Australia and the United States will provide little additional supply and are subject to strict permitting processes and environmental regulations, which have the potential to delay production.
Codependence on Other Markets Short Term: 3
Medium Term: 3
• Dy is coproduced from REE ores along with other lanthanides. • Dy is the most abundant heavy REE in many Chinese ores, and is in low
concentrations elsewhere.
Producer Diversity Short Term: 4
Medium Term: 4
• Dy found in relatively small amounts in new Western mines that are scheduled to begin production in the short and medium terms. Mountain Pass will produce minimal amounts of Dy, and other new mines scheduled to begin production by 2015 will increase production by less than 15% as compared to current levels.
References • GE (General Electric). 2010. “Response to U.S. Department of Energy’s Request for Information.” June 7.
Fairfield, CT: GE. • Kingsnorth, D. 2010. “Rare Earths: Facing New Challenges in the New Decade.” Presented at the Society for
Mining Metallurgy and Exploration Annual Meeting, Phoenix. • Oakdene Hollins. 2010. “Lanthanide Resources and Alternatives.” Aylesbury, UK: Department for Transport
and Department for Business, Innovation and Skills. • Ames Laboratory. 2011. “Response to U.S. Department of Energy’s Request for Information.” May 24. Ames,
IA: Ames Laboratory.
151
Appendix B. Market Share Assumptions and Material Content Calculation
Batteries in Vehicles Projections for key material use in batteries consider two different battery types, nickel metal hydride (NiMH) and lithium-ion (Li-ion). Three different types of vehicles were considered: hybrid electric vehicles (HEVs), plug-in hybrid electric vehicles (PHEVs) and all electric vehicles (AEVs).
Market Share Market share assumptions for batteries used in each type of vehicle are the following:
• Hybrid electric: In the low market share case (for NiMH batteries), Li-ion batteries capture 100% of the market share for hybrids. In the high deployment case, NiMH batteries retain a 50% market share, with Li-ion batteries capturing the remaining 50% of the market. Rationale: This assumption is a change from the 2010 Critical Materials Strategy, which used a 100% market share assumption for NiMH batteries in HEVs. NiMH battery technology is relatively safe, mature and cost effective for the storage requirements of hybrids. While NiMH batteries are currently used in most HEV models, many experts predict that Li-ion battery technology will capture an increasing share of the HEV market in the medium term. Hyundai recently released an HEV model with a Li-ion battery. However, the pace at which the shift will occur is uncertain, and it will require Li-ion batteries to become significantly more cost competitive (Oakdene Hollins 2010). It is reasonable that experience in developing Li-ion batteries for PHEVs and EVs will also lead to improved Li-ion batteries for HEVs. Therefore, the high and low market share assumptions should be viewed as reasonable bounds for the medium term.
• Plug-in hybrid and all electric: All PHEVs and AEVs are assumed to use Li-ion batteries. Rationale: Although there are still significant price, safety and reliability issues with Li-ion batteries, they are considered the only batteries likely to meet the weight and performance requirements of PHEVs and EVs in the short and medium terms (National Research Council 2010). The first mass-market PHEVs and EVs, including the Chevy Volt and Nissan Leaf, all use Li-ion batteries.
Material Intensity: NiMH Batteries The material intensity of elements used in NiMH batteries was calculated based on several assumptions about capacity and chemistry (i.e., anode and cathode composition) for a battery with a power rating and cell voltage equivalent to the battery used in a third-generation Toyota Prius.
• Positive electrode capacity: A total power rating of 1.3 kilowatt-hours (kWh) and 1.2 volts per cell (V/cell) was assumed. This yields a total positive electrode capacity of 1,083 ampere-hours (Ah) (= 1.3 kWh/1.2 V * 1,000).
• Negative electrode capacity: This is calculated as negative electrode capacity = (positive electrode capacity) * n/p, where n/p is the assumed ratio of negative to positive electrode capacity. For the high material content case, an n/p ratio of 1.8 is assumed, which represents a likely value for current-generation technology. For low material content, an n/p ratio of 1.2 is assumed, which represents a lower value that is technically feasible by the medium term. These

152
assumptions yield negative electrode capacity values of 1,950 Ah (high material content) and 1,300 Ah (low material content).
• Weight of negative electrode alloy: This is calculated based on an assumption of 300 Ah per kilogram (kg) of alloy. This yields a high negative electrode alloy weight of 6.5 kg of alloy and a low negative electrode alloy weight of 4.3 kg.
• Negative electrode alloy composition: The battery alloy is assumed to be AB5 employing a widely used composition of mischmetal: La5.7Ce8.0Pr0.8Nd2.3Ni59.2Co12.2Mn6.8Al5.2 with a total molar weight of 70.6 grams (g). Based on this formula, the high and low weight contents of individual elements are given in Table B-1. NiMH material intensity for batteries used by other manufacturers would likely vary with battery performance specifications and the composition of the battery alloy.
Table B-1. Material Intensity Calculations for NiMH Batteries106
Element
Molar % in AB5 Weight % in AB5 Kilograms per Battery (high)
Kilograms per Battery (low)
La 5.7% 11.2% 0.73 0.49
Ce 8.0% 15.9% 1.03 0.69
Pr 0.8% 1.6% 0.10 0.07
Nd 2.3% 4.7% 0.31 0.20
Ni 59.2% 49.2% 3.20 2.13
Co 12.2% 10.2% 0.66 0.44
Mn 6.8% 5.3% 0.34 0.23
Al 5.2% 2.0% 0.13 0.09
Total: 6.5 4.33
Material Content: Lithium-Ion Batteries Material content assumptions for Li-ion batteries in AEVs and PHEVs are taken from calculations by Gaines and Nelson (2009). The authors identified four Li-ion battery chemistries with potential for automotive applications. For each of the four chemistries, they estimated total lithium content for vehicles with ranges of 4, 20, 40 and 100 miles. The cobalt content for each combination of battery chemistry and vehicle range was calculated using the authors’ results for lithium content and the molecular formula of the battery cathode material.
Battery sizes for HEVs, PHEVs and AEVs are based on ranges suggested by Gaines and Nelson (2009). HEVs are assumed to have a 4-mile range, PHEVs are assumed to have a 40-mile range and EVs are assumed to have a 100-mile range. To determine high and low material content, the highest and lowest values of lithium and cobalt were selected from among the four different battery chemistries.
The battery chemistries and material content values selected are shown in Table B-2.
106 Estimates for calculating positive electrode capacity were from Toyota (2009) and EERE (2009). Estimates for the n/p ratio and weight ratio of negative electrode alloy were provided by EERE (2010). Alloy composition is based on Linden’s Handbook of Batteries (Reddy 2011).

153
Table B-2. Material Content Calculations for Lithium-Ion Batteries
Application Material High/ Low
Material Content
(kg)
Battery Chemistry
Designation Cathode Anode
HEV 4
Lithium Low 0.17 LMO-G LiMn2O4 Graphite
High 0.64 LMO-TiO LiMn2O4 Li4Ti5O12
Cobalt Low 0 LMO (both) LiMn2O4 Either
High 0.43 NCA-G LiNi0.8Co0.15Al0.05O2 Graphite
Manganese Low 0 NCA-G LiNi0.8Co0.15Al0.05O2 Graphite
High 4.59 LMO-TiO LiMn2O4 Li4Ti5O12
Nickel Low 0 LMO (both) LiMn2O4 Either
High 2.30 NCA-G LiNi0.8Co0.15Al0.05O2 Graphite
PHEV 40
Lithium Low 1.35 LMO-G LiMn2O4 Graphite
High 5.07 LMO-TiO LiMn2O4 Li4Ti5O12
Cobalt Low 0 LMO (both) LiMn2O4 Either
High 3.77 NCA-G LiNi0.8Co0.15Al0.05O2 Graphite
Manganese Low 0 NCA-G LiNi0.8Co0.15Al0.05O2 Graphite
High 36.57 LMO-TiO LiMn2O4 Li4Ti5O12
Nickel Low 0 LMO (both) LiMn2O4 Either
High 18.60 NCA-G LiNi0.8Co0.15Al0.05O2 Graphite
EV 100
Lithium Low 3.38 LMO-G LiMn2O4 Graphite
High 12.68 LMO-TiO LiMn2O4 Li4Ti5O12
Cobalt Low 0 LMO (both) LiMn2O4 Either
High 9.41 NCA-G LiNi0.8Co0.15Al0.05O2 Graphite
Manganese Low 0 NCA-G LiNi0.8Co0.15Al0.05O2 Graphite
High 91.50 LMO-TiO LiMn2O4 Li4Ti5O12
Nickel Low 0 LMO (both) LiMn2O4 Either
High 46.54 NCA-G LiNi0.8Co0.15Al0.05O2 Graphite
Permanent Magnets in Wind Turbines and Vehicles
Market Share The following are the market share assumptions for wind turbines and electric drive vehicles employing neodymium-iron-boron (NdFeB) permanent magnet (PM) motors:
• Wind turbines: The low market share assumption is that 15% of onshore wind turbines and 25% of offshore wind turbines will use NdFeB PM generators. The high market share assumption is

154
that 75% of onshore wind turbines and 75% of offshore wind turbines will use NdFeB PM generators. Rationale: The high and low market share assumptions are higher than those used in the 2010 Critical Materials Strategy. There is little publicly available data on current market share, but anecdotal discussions with industry experts indicate that current market share may already be close to the low market share assumption. Therefore, the low market share represents a continuation of current market share trends. The high market share assumption is based on the preference for NdFeB PM generators in larger wind turbines (in the 2–3+ megawatt [MW] range) and the trend toward the use of larger turbines in new wind projects, particularly for offshore applications. One trend that has been driving increased use of rare earth PMs in wind turbines is the introduction of “hybrid drive” turbines employing a geared PM motor. These designs are more complicated than direct-drive turbines, but require much smaller PMs that use fewer rare earth materials. Therefore, the increased assumptions for market share have been coupled with a wider range of possible material intensity.
• Vehicles: In the low market share case, all HEVs, 90% of PHEVs and AEVs and 50% of electric bicycles107
Rationale: Due to their superior power-to-weight ratio, NdFeB PM motors are used in current model HEVs, as well as the Chevy Volt PHEV and Nissan Leaf AEV. These PM motors are expected to dominate the electric drive vehicle market well into the medium term, although new motors without rare earth materials are being developed (Aston 2010). The current market share for PM motors in electric bicycles is less certain, but these motors offer better performance than the older non-rare-earth motors that are incorporated into most new electric bicycle designs.
are assumed to use rare earth PM motors. In the high market share case, all HEVs, PHEVs and EVs are assumed to use rare earth PM motors, as are 90% of electric bicycles.
Material Intensity Material intensity for NdFeB PM motors and generators is calculated as follows:
• Wind turbines: Material intensity for neodymium and dysprosium is calculated from the estimated weight of total NdFeB magnet material per megawatt of turbine output. High and low estimates for total magnet weight are 600 kg/MW and 200 kg/MW, respectively, based on the Arnold Magnetics RFI submission (2011). The low range represents average content for a hybrid drive turbine, while the high range represents an average weight for a direct-drive turbine. Neodymium content is estimated to be 31% of magnet weight (Electron Energy Corporation 2010). Dysprosium content is estimated to be between 2% (low content) and 4% (high content) of magnet weight. This assumption has been updated from the 2010 Critical Materials Strategy, which assumed 5.5% average content for both wind turbines and electric drive vehicle motors. However, wind turbines operate at a lower operating temperature than electric drive vehicle motors and would be expected to use less dysprosium (Arnold Magnetics 2011). Over time, it is expected that manufacturers will continue efforts to reduce dysprosium content.
• Vehicles (AEVs, PHEVs and HEVs): Material intensity for neodymium and dysprosium is calculated from the estimated weight of total NdFeB magnet material per vehicle motor. The
107 The term electric bicycle is used to represent all two-wheeled electric vehicles.

155
high weight estimate for magnets in HEVs, PHEVs and AEVs is 2 kg per vehicle, based on General Electric (2010). The low estimate is 1 kg/vehicle, based on Lifton (2009). Neodymium content is estimated to be 31% of magnet weight, while dysprosium content is estimated to be between 4.5% (low content) and 6% (high content)108
• Electric bicycles: Material intensity for neodymium and dysprosium is calculated from the estimated weight of total NdFeB magnet material per vehicle motor. The high and low weight estimates for magnets are 0.2 kg and 0.05 kg per bicycle, respectively.
. The dysprosium assumption has been updated from the 2010 Critical Materials Strategy, which assumed 5.5% average content for both wind turbines and electric drive vehicles.
109
The wide range reflects the great variability of estimates for different bicycle performance levels. Neodymium content is estimated to be 31% of magnet weight, while dysprosium content is estimated to be between 1% and 4% by weight, based on Arnold Magnetics (2011), which is reflective of the lower operating temperatures of bicycles compared to larger EVs. It is expected that higher-performance electric bicycles, which are often characterized as scooters or electric motorcycles, would operate at higher temperatures and require greater dysprosium content in the magnets.
The difference between the high and low material content estimates for magnets accounts for incremental improvements that are likely to occur in the short to medium term, as well as wide variations in manufacturers’ specifications for magnets. Material content estimates also assume that magnets do not contain praseodymium, which can reportedly be substituted for neodymium to reduce cost and increase corrosion resistance (Oakdene Hollins 2010). However, there are indications that praseodymium use in high-performance magnets for wind turbines and vehicles is relatively low.110
The material content estimates for wind turbines and vehicles are consistent with the material content estimates used in the Advanced Research Projects Agency-Energy’s (ARPA-E’s) Rare Earth Alternatives in Critical Technologies for Energy (REACT) funding opportunity announcement (ARPA-E 2011).
Photovoltaic Cells
Market Share Market share assumptions for cadmium telluride (CdTe) and copper-indium-gallium-diselenide (CIGS) photovoltaic (PV) cells are similar. For each technology, the high market share assumption is 50% of total added PV capacity. The low market share assumptions are 5% for CIGS and 10% for CdTe.
Rationale: This assumption reflects the likelihood that both of these thin-film PV technologies will continue to mature and capture greater shares of the total PV market, which is currently dominated by conventional silicon-based cells. Both are viable, and neither currently has a clear advantage over the other (Grana 2010). It is unlikely that market share for both technologies will be near the high end of the market share estimate (50% each for both CIGS and CdTe) at the same time. The low market share assumptions reflect the fact that CdTe’s current market share is higher than CIGS.
108 This range was developed drawing on Arnold Magnetics (2011), Electron Energy (2011) and internal U.S. Department of Energy staff discussions. 109 This range was developed drawing on Arnold Magnetics (2011) and internal U.S. Department of Energy staff discussions. 110 Personal communication between U.S. Department of Energy staff and Arnold Magnetics, 2011.

156
Material Intensity The following are the material intensity calculations for tellurium, gallium and indium used in CdTe and CIGS PV cells:
• Tellurium intensity in CdTe: In the high material intensity case, tellurium represents 53% of the 5.85 g per cubic centimeter (cm3) of thin film included in a 2.5 micron absorber layer with a cell efficiency of 11.7%, leading to a material requirement of 74 tonnes of tellurium per gigawatt. In the low material intensity case, the absorber layer is reduced to 1.0 micron, and cell efficiency is increased to 18%, leading to a material requirement of 17 tonnes of tellurium per gigawatt.
• Gallium intensity in CIGS: In the high material intensity case, gallium represents 10% of the 1.24 g/cm3 of thin film included in a 1.5 micron absorber layer with a cell efficiency of 12%, leading to a materials requirement of 18.5 tonnes of gallium per gigawatt. In the low material intensity case, the gallium represents about 35.7% of the 4.41 g/cm3 included in a 1.0 micron absorber layer with a cell efficiency of 20.8%, leading to a material requirement of 12.4 tonnes of gallium per gigawatt.
• Indium intensity in CIGS: In the high material intensity case, indium represents 21% of the 3.35 g/cm³ of thin film included in a 1.5 micron absorber layer with a cell efficiency of 12%. This leads to a material requirement of 23.1 tonnes of indium per gigawatt. In the low material intensity case, the indium represents 6.1% of the 0.94 g/cm3 of thin film included in the 1.0 micron absorber layer with a cell efficiency of 20.8%. This leads to a materials requirement of 15.4 tonnes of indium per gigawatt.
All assumptions used in the calculations were provided by the National Renewable Energy Laboratory (2011).111
Lighting Phosphors
Compared to the 2010 Critical Materials Strategy, the assumptions show a decrease in the material content for indium and tellurium, but an increase in the gallium content. For CIGS, the change is due largely to the assumption that future CIGS film compositions will use a higher percentage of gallium and a lower percentage of indium. The reduction in material content for tellurium in CdTe is largely due to revised assumptions about manufacturing process efficiency.
Market Share Market share assumptions for phosphors are captured in the deployment trajectories, which specify demand for specific types of lighting units. These include compact fluorescent lamps (CFLs) and linear fluorescent lamps (LFLs) of different efficiencies.
Material Content Rare earth content by element is based on calculations of the amount of total rare earth content in each CFL or LFL. Total rare earth content is calculated as follows:
• CFLs: All CFLs are assumed to use 1.5 g/bulb of phosphor in the high material content case,112
111 Personal communication between U.S. Department of Energy staff and the National Renewable Energy Laboratory, August 18 and October 13, 2011.
and 1.125 g/bulb in the low content case. All of the phosphor is assumed to be tri-band
112 Average value for all CFLs based on DOE staff communications with lighting manufacturers and the TCP Corporation via “TCP Product & Pricing Bulletin” in July 2011.

157
phosphor, which contains approximately 60% rare earth content by weight. The high material content case represents current technology, while the low material content case represents a potential 25% reduction in the thickness of the phosphor coating inside the bulb by the medium term.
• LFLs: Phosphor composition for LFLs varies by efficiency level. Commodity level (600 series) LFLs are assumed to use no tri-band phosphor and therefore contain no rare earth materials. These lamps will be phased out of the U.S. market with the implementation of new lighting efficiency standards in 2012. For medium-efficiency lamps (700 series), 30% (by weight) of the phosphor is assumed to be tri-band phosphor, which in turn contains 60% rare earth content by weight. High-efficiency lamps (800 and 800P series) are assumed to use 100% tri-band phosphor, which contains 60% rare earth content by weight.
The phosphor coating is applied to the inside of the LFL, so the content is proportional to the surface area of the lamp. LFLs are assumed to contain 4 milligrams (mg) of phosphor per square centimeter (cm2) of bulb surface area in the high material content case (PhosphorTech 2011), and 3 mg/cm2 in the low content case. As for CFLs, low material content represents a potential 25% reduction in the thickness of the phosphor coating inside the bulb by the medium term. Standard size LFLs come in 4-foot or 8-foot lengths, with diameters of 5, 8 or 12 inches (designated as T5, T8 or T12). Phosphor content calculations for each lamp size are given in Table B-3.
Table B-3. Rare Earth Content per LFL Size
Lamp Length
Lamp Type
Efficiency Level
Diameter (in)
Surface Area (cm2)
Total Phosphor
(g)
Tri-Band Phosphor
(g)
Rare Earth Content
(g)
4’
T12 Medium 1.500 1,459 5.84 1.752 1.0512
T8 Medium 1.000 972 3.89 1.167 0.7002
T5 Medium 0.625 608 2.43 0.729 0.4374
T12 High 1.500 1,459 5.84 5.840 3.5040
T8 High 1.000 972 3.89 3.890 2.3340
T5 High 0.625 608 2.43 2.430 1.4580
8’
T12 Medium 1.500 2,919 11.70 3.510 2.1060
T8 Medium 1.000 1,946 7.78 2.334 1.4004
T12 High 1.500 2,919 11.70 11.700 7.0200
T8 High 1.000 1,946 7.78 7.780 4.6680
Individual rare earth element (REE) content is calculated based on average weight percentage of each element in a typical CFL or LFL phosphor. CFLs and LFLs differ in the type of green phosphor used in the tri-band combination. CFLs typically use a Calcium Tungstate (CAT) green phosphor that is higher in cerium, while LFLs use a Lanthanum Phosphate (LAP) green phosphor that is higher in lanthanum. Average REE weight percentages are shown in Table B-4.

158
Table B-4. Average REE Weight Percentages for CFLs and LFLs
Phosphor Type Element Total Rare Earth Content
CFL (CAT phosphor)
Lanthanum 8.5%
Cerium 20.0%
Europium 4.5%
Terbium 5.0%
Yttrium 62.0%
LFL (LAP phosphor)
Lanthanum 22.0%
Cerium 6.5%
Europium 4.5%
Terbium 5.0%
Yttrium 62.0%
Note: Weight percentage estimates represent an average of values given by lighting manufacturers in communications with DOE staff.

159
References Aston, A. 2010. “China's Rare-Earth Monopoly: The Rest of the World is Trying to Find Alternatives to These Crucial Materials.” Technology Review, October 15. http://www.technologyreview.com/ energy/26538/?ref=rss.
Arnold Magnetics. 2011. “Response to DOE Request for Information.” June 10.
ARPA-E (Advanced Research Projects Agency-Energy). 2011. DE-FOA-0000472: Rare Earth Alternatives in Critical Technologies for Energy (REACT). April 20, modified June 27. https://arpa-e-foa.energy.gov/FileContent.aspx?FileID=b4cbdbdf-902c-408e-8bee-b8d2d0d943c3.
EERE (Office of Energy Efficiency and Renewable Energy). 2009. “2010 Toyota Prius-6063 Hybrid BOT Battery Test Results.” Washington, DC: U.S. Department of Energy. July 15. http://avt.inel.gov/pdf/hev/batterygenIIIprius6063.pdf.
EERE (Office of Energy Efficiency and Renewable Energy). 2010. “Expert Judgment by Vehicle Battery Specialist.” Washington, DC: U.S. Department of Energy.
Electron Energy Corporation. 2010. “Response to U.S. Department of Energy Request for Information.” June 5.
Gaines, L. and P. Nelson. 2009. “Lithium-Ion Batteries: Possible Material Demand Issues.” Argonne IL: Argonne National Laboratory. http://www.transportation.anl.gov/pdfs/B/584.PDF.
GE (General Electric). 2010. “Response to U.S. Department of Energy Request for Information.” June 7.
Grana, P. 2010. “The Efficiency Race: How do CdTe and CIGS Stack Up?” Renewableenergyworld.com. http://www.renewableenergyworld.com/rea/blog/post/2010/11/the-efficiency-race-how-to-cdte-and-cigs-stack-up.
Lifton, J. 2009. “The Rare Earth Crisis of 2009.” The Jack Lifton Report, October 15.
National Research Council. 2010. “Transitions to Alternative Transportation Technologies – Plug-in Hybrid Electric Vehicles.” http://www.nap.edu/catalog.php?record_id=12826.
Oakdene Hollins. 2010. “Response to U.S. Department of Energy Request for Information.” May 26.
PhosporTech. 2011. “Strategies for RE Reduction and Higher Performance FL Phosphors.” Presentation provided through personal communication, July 21.
Reddy, Thomas R. ed. 2011. Linden’s Handbook of Batteries. New York: McGraw Hill.
Toyota. 2009. “Toyota Prius Emergency Response Manual, Hybrid 2010 Model 3rd Generation.” https://techinfo.toyota.com/techInfoPortal/staticcontent/en/techinfo/html/prelogin/docs/3rdprius.pdf.

160
Appendix C. 112th Congress Rare Earths and Critical Materials Legislation
U.S. House of Representatives Table C-1. H.R. 618, Rare Earths and Critical Materials Revitalization Act of 2011
Status:
• Introduced on February 10, 2011, by Rep. Leonard Boswell (D-IA) • 13 pages • Referred to: Science, Space and Technology Committee, Subcommittee on
Energy and Environment • 8 cosponsors • No further legislative action as of 11/28/11
Goal To develop a rare earth materials program; to amend the National Materials and Minerals Policy, Research and Development Act of 1980; and other purposes.
Resource assessment N/A
R&D
Section 101 directs DOE to establish a Rare Earth Materials Program of RD&D and commercial application to ensure a long-term, secure and sustainable supply of rare earth materials. The Program will support activities to characterize virgin stocks; explore and recover REEs; improve methods for extraction, processing, recovery and recycling of REEs; improve performance and adaptability in engineering designs of REEs; identify alternatives; collect, catalog and disseminate information on REEs and facilitate information sharing and collaboration among stakeholders.
Domestic and international collaboration
Section 101 directs DOE to encourage multidisciplinary collaborations among Program participants and extensive opportunities for students at institutions of higher education, including institutions listed under section 371(a) of the Higher Education Act of 1965. The Secretary of Energy may collaborate on activities of mutual interest with the relevant agencies of foreign countries with interests relating to REEs.
Loan guarantee program
Section 102 amends Title XVII of the Energy Policy Act of 2005 by adding at the end the following new section “SEC. 1706. Temporary Program for REMs Revitalization.” Under this title, the Secretary of Energy is authorized to make guarantees for the commercial application of new or significantly improved technologies for the following categories of projects: separation and recovery of REMs from ores or other sources; preparation of REMs in different forms needed for national security, economic well-being or industrial production purposes; the application of REMs in producing improved magnets, batteries, refrigeration, optical systems, electronics and catalysts and the application of REMs in other uses, as determined by the Secretary. Through the loan guarantee program, the Secretary will cooperate with the private sector to achieve a complete REMs production capability in 5 years after this Act’s enactment. The authority to enter into guarantees under this temporary title expires on September 30, 2019.
Cross-agency N/A
Implementation and assessment of DOE Program
DOE will submit a plan to Congress for carrying out the Program within 180 days of this Act’s enactment. The plan needs to describe R&D activities to be carried out in the subsequent 2 years; expected contributions to the creation of innovative methods and technologies for efficient and suitable RE materials supply to the domestic economy; criteria to be used to evaluate appropriations for loan guarantees; the status of projects receiving loan guarantees under such a section; how the Program promotes participation by all contributors and actions taken or proposed that reflect recommendations from an assessment conducted by the National Academy of Sciences after the Program has been in operation for 4 years.
Appropriations None authorized

161
Table C-2. H.R. 952, Energy Critical Elements Renewal Act of 2011
Status
• Introduced on March 8, 2011, by Rep. Brad Miller (D-NC) • 16 pages • Referred to: Science, Space and Technology Committee, Subcommittee on
Energy and Environment • 5 cosponsors • No further legislative action as of 11/28/11
Goal To develop a rare earth materials program, to amend the National Materials and Minerals Policy, Research and Development Act of 1980, and other purposes.
Resource assessment N/A
R&D
Section 101 directs DOE to establish an Energy Critical Elements Program of RD&D and commercial application to ensure a long-term, secure and sustainable supply of rare earth materials. The Program will support activities to characterize virgin stocks; explore and recover REEs; improve methods for extraction, processing, recovery and recycling of REEs; improve performance and adaptability in engineering designs of REEs; identify alternatives; collect, catalog and disseminate information on REEs and facilitate information sharing and collaboration among stakeholders. Under Section 101, DOE shall establish, through a competitive process, an R&D Information Center. The Center will serve as the repository for scientific and technical data, assist scientists and engineers to make full use of the Center's data, seek and incorporate other information on energy critical elements, provide advice to the Secretary on R&D and host conferences to promote information sharing and collaboration.
Domestic and international collaboration
Section 101 directs DOE to encourage multidisciplinary collaborations among Program participants and extensive opportunities for students at institutions of higher education, or both. The Secretary of Energy may collaborate on activities of mutual interest with the relevant agencies of foreign countries with interests relating to REEs.
Loan guarantee program
Section 102 amends Title XVII of the Energy Policy Act of 2005 by adding at the end the following new section “SEC. 1706. Temporary Program for REMs Revitalization.” Under this title, DOE is authorized to make guarantees for the commercial application of new or significantly improved technologies for the following categories of projects: separation and recovery of REMs from ores or other sources; preparation of REMs in different forms needed for national security, economic well-being or industrial production purposes; the application of REMs in producing improved magnets, batteries, refrigeration, optical systems, electronics and catalysts and the application of REMs in other uses, as determined by the Secretary. Through the loan guarantee program, the Secretary will cooperate with the private sector to achieve a complete REMs production capability in 5 years after this Act’s enactment. The authority to enter into guarantees under this temporary title expires on September 30, 2019.
Cross-agency
The President, through the Executive Office, shall coordinate actions of applicable agencies; identify energy critical elements’ needs and establish early warning systems; establish a mechanism to coordinate and evaluate relevant federal programs (including R&D programs) and complement efforts in the private sector as well as by other domestic and international organizations; promote and encourage private enterprise in developing an economically sound and stable domestic energy critical elements supply chain; promote and encourage recycling of energy critical elements, taking into account technical, economic, environmental, logistical and R&D needs; assess and address the need for technical personnel necessary for ensuring an adequate supply of energy critical elements and report to Congress on activities and findings.

162
Table C-2. H.R. 952, Energy Critical Elements Renewal Act of 2011
Implementation and assessment of DOE Program
DOE will submit a plan to Congress for carrying out the Program within 180 days of this Act’s enactment. The plan needs to describe R&D activities to be carried out in the subsequent 2 years; expected contributions to the creation of innovative methods and technologies for efficient and sustainable RE materials supply to the domestic economy; criteria to be used to evaluate appropriations for loan guarantees; the status of projects receiving loan guarantees under such a section; how the Program promotes participation by all contributors and actions taken or proposed that reflect recommendations from an assessment conducted by the National Academy of Sciences after the Program has been in operation for 4 years, including the R&D Information Center.
Appropriations
DOE will be appropriated the following to carry out Section 101: • FY12: $10 million • FY13: $15 million • FY14: $15 million • FY15: $15 million • FY16: $15 million
Of the appropriations, $700,000 is to enter into the 4-year assessment by the NSF. All sums remain available until expended.

163
Table C-3. H.R. 1314, Resource Assessment of Rare Earths Act of 2011 (RARE Act of 2011/H. Johnson Bill)
Status
• Introduced on April 1, 2011, by Rep. Henry Johnson (D-GA) • 3 pages • Referred to: Natural Resources Committee, Subcommittee on Energy and
Mineral Resources • 10 cosponsors • June 3, 2011: Subcommittee on Energy and Mineral Resources legislative hearing
held • No further legislative action as of 11/28/11
Goal To direct the Secretary of the Interior to conduct a global rare earth element assessment, and other purposes.
Resource assessment
No later than 3 years after enactment of this Act, the Secretary of the Interior, acting through the Director of USGS and in coordination with heads of national geological surveys where available, submit to Congress a comprehensive report on global REE resources and potential future supply. The report also needs to include recommendations on areas for future geologic research related to other minerals that are critical based on the impact of potential supply restriction and the likelihood of supply restriction. The report will include analysis, in consultation with appropriate agencies, of the REE supply chain and associated processes and products, including mining, processing, separation, metal production, alloy production and manufacturing of products.
R&D N/A
Domestic and international collaboration
N/A
Loan guarantee program N/A
Cross-agency N/A
Implementation and assessment of DOE Program
N/A
Appropriations Authorized appropriations:
• $10 million FY12 through FY14

164
Table C-4. H.R. 1388, Rare Earths Supply Chain Technology and Resources Transformation Act of 2011 (RESTART Act)
Status
• Introduced on April 6, 2011, by Rep. Mike Coffman (R-CO) • 25 pages • Referred to: Science, Space, and Technology Committee, Subcommittee on Energy
and Environment; Natural Resources Committee; Subcommittee on Energy and Mineral Resources; Armed Services Committee
• 8 cosponsors • No further legislative action as of 11/28/11
Goal
To reestablish a competitive domestic RE minerals production industry; a domestic RE processing, refining, purification and metals production industry; a domestic RE metals alloying industry and a domestic RE-based magnet production industry and supply chain in the Defense Logistics Agency of DOD.
Resource assessment
No later than 3 years after enactment of this Act, the Secretary of the Interior, acting through the Director of USGS and in coordination with heads of national geological surveys where available, shall submit to Congress a comprehensive report on global REE resources and potential future supply. The report also needs to include recommendations on areas for future geologic research related to other minerals that are critical based on the impact of potential supply restriction and the likelihood of supply restriction. The report will include analysis, in consultation with appropriate agencies, of the REE supply chain and associated processes and products, including mining, processing, separation, metal production, alloy production and manufacturing of products. Section 6 of the Act establishes a Rare Earth Materials Program of resource assessment R&D program under USGS.
R&D N/A
Domestic and international collaboration
Under the Rare Earth Materials Program, the U.S. Department of the Interior is to encourage multidisciplinary collaborations among Program participants, extensive opportunities for students at institutions of higher education, or both. Secretary of Energy may collaborate on activities of mutual interest with the relevant agencies of foreign countries with interests relating to REEs.
Loan guarantee program
Section 5 authorizes DOE to make guarantees for the commercial application of new or significantly improved technologies for the following categories of projects: separation and recovery of REMs from ores or other sources; preparation of REMs in different forms needed for national security, economic well-being or industrial production purposes; the application of REMs in producing improved magnets, batteries, refrigeration, optical systems, electronics and catalysts; and the application of REMs in other uses, as determined by the Secretary. Through the loan guarantee program, the Secretary will cooperate with the private sector to achieve a complete REMs production capability in 5 years after this Act’s enactment. The Secretary is only to make a guarantee under this section if the project, due to technical or financial uncertainty, is not currently being undertaken by the private sector, or likely to be undertaken by the private sector. The authority to enter into guarantees under this temporary title expires on September 30, 2019.

165
Table C-4. H.R. 1388, Rare Earths Supply Chain Technology and Resources Transformation Act of 2011 (RESTART Act)
Manufacturing
Section 6 establishes a Rare Earth Alloy and Magnets Program that directs the President, through the Secretary of Defense, to establish a neodymium-iron-boron magnet alloy and dysprosium iron alloy inventory to be managed by the Administrator of the Defense Logistics Agency Strategic Materials. This provision is in accordance with Section 15 of the Strategic and Critical Materials Stockpiling Act and will use funds from the sale of excess materials in the National Defense Stockpile. The Secretary of Defense shall commence creating the aforementioned inventory of domestic or ally nation such alloys, and make such inventory accessible, including by purchase, to domestic producers of neodymium-iron-boron magnets or other entities requiring such materials to support national defense. If the Secretary of Defense cannot determine aggregate demand for such alloys, he/she shall establish an inventory of no less than 200 metric tons of neodymium-iron-boron magnet alloy and 50 metric tons of dysprosium iron alloys. Section 6 also directs the President, acting through DOD, to enter into long-term supply contracts (detailed provisions in the bill) for the delivery of necessary domestic neodymium-iron-boron magnets to meet DOD demand. The authority under Section 6 will terminate no later than Oct. 1, 2018.
Cross-agency
Section 3 establishes a Rare Earth Policy Task Force in the Department of the Interior to monitor and assist federal agencies in expediting the review and approval of permits and in reviewing laws and policies that discourage investment in and development of domestic REs. The Task Force is also to take other actions to increase investment in and development of domestic REs as it considers appropriate. The Task Force will be composed of Secretaries (or designees) from Interior, Energy, Agriculture, Defense, Commerce, State, OMB and CEQ, as well as other members as the Secretary of the Interior sees fit. The Task Force will submit an annual report to the President and Congress, and terminate after 10 years after enactment of this Act. Section 3 also establishes an Interagency Working Group for reestablishing a competitive domestic RE supply chain. The working group will consist of “Executive Agents” who are Assistant Secretary level officials appointed by the Secretaries of Commerce, Defense, Energy, Interior, and State.
Workforce development N/A
Appropriations None authorized
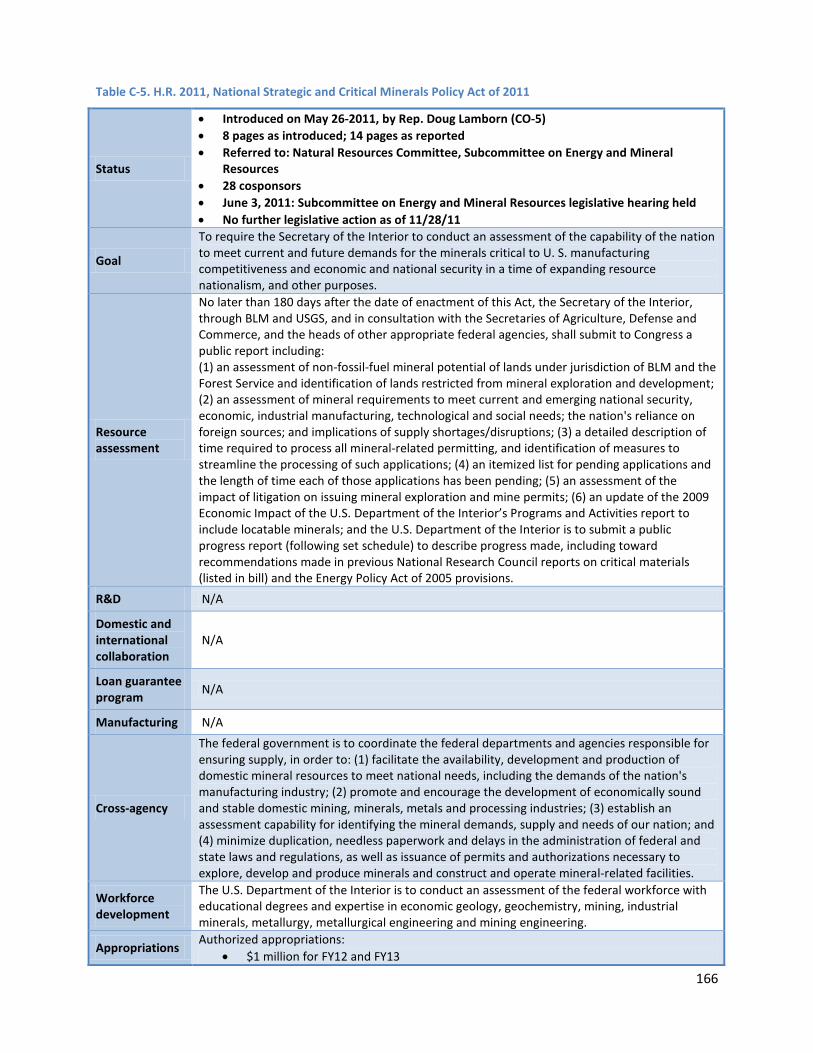
166
Table C-5. H.R. 2011, National Strategic and Critical Minerals Policy Act of 2011
Status
• Introduced on May 26-2011, by Rep. Doug Lamborn (CO-5) • 8 pages as introduced; 14 pages as reported • Referred to: Natural Resources Committee, Subcommittee on Energy and Mineral
Resources • 28 cosponsors • June 3, 2011: Subcommittee on Energy and Mineral Resources legislative hearing held • No further legislative action as of 11/28/11
Goal
To require the Secretary of the Interior to conduct an assessment of the capability of the nation to meet current and future demands for the minerals critical to U. S. manufacturing competitiveness and economic and national security in a time of expanding resource nationalism, and other purposes.
Resource assessment
No later than 180 days after the date of enactment of this Act, the Secretary of the Interior, through BLM and USGS, and in consultation with the Secretaries of Agriculture, Defense and Commerce, and the heads of other appropriate federal agencies, shall submit to Congress a public report including: (1) an assessment of non-fossil-fuel mineral potential of lands under jurisdiction of BLM and the Forest Service and identification of lands restricted from mineral exploration and development; (2) an assessment of mineral requirements to meet current and emerging national security, economic, industrial manufacturing, technological and social needs; the nation's reliance on foreign sources; and implications of supply shortages/disruptions; (3) a detailed description of time required to process all mineral-related permitting, and identification of measures to streamline the processing of such applications; (4) an itemized list for pending applications and the length of time each of those applications has been pending; (5) an assessment of the impact of litigation on issuing mineral exploration and mine permits; (6) an update of the 2009 Economic Impact of the U.S. Department of the Interior’s Programs and Activities report to include locatable minerals; and the U.S. Department of the Interior is to submit a public progress report (following set schedule) to describe progress made, including toward recommendations made in previous National Research Council reports on critical materials (listed in bill) and the Energy Policy Act of 2005 provisions.
R&D N/A
Domestic and international collaboration
N/A
Loan guarantee program N/A
Manufacturing N/A
Cross-agency
The federal government is to coordinate the federal departments and agencies responsible for ensuring supply, in order to: (1) facilitate the availability, development and production of domestic mineral resources to meet national needs, including the demands of the nation's manufacturing industry; (2) promote and encourage the development of economically sound and stable domestic mining, minerals, metals and processing industries; (3) establish an assessment capability for identifying the mineral demands, supply and needs of our nation; and (4) minimize duplication, needless paperwork and delays in the administration of federal and state laws and regulations, as well as issuance of permits and authorizations necessary to explore, develop and produce minerals and construct and operate mineral-related facilities.
Workforce development
The U.S. Department of the Interior is to conduct an assessment of the federal workforce with educational degrees and expertise in economic geology, geochemistry, mining, industrial minerals, metallurgy, metallurgical engineering and mining engineering.
Appropriations Authorized appropriations:
• $1 million for FY12 and FY13

167
Table C-6. H.R. 2090, Energy Critical Elements Advancement Act of 2011
Status • Introduced on June 2, 2011, by Rep. Randy Hultgren (R-IL) • 6 pages • Referred to: Science, Space, and Technology Committee, Subcommittee on Energy and
Environment; Natural Resources Committee, Subcommittee on Energy and Mineral Resources; Energy and Commerce Committee
• 3 cosponsors • Dec. 7, 2011: Science, Energy and Environment Subcommittee hearing held; DOE A/S
Sandalow was witness • No further legislative action as of 12/7/11
Goal To improve assessments of and research about energy critical elements, and other purposes.
Resource assessment
The Secretary of the Interior, acting through the Director of USGS, and the Secretary of Energy, acting through the Administrator of EIA, shall collaborate to improve assessments of energy critical elements on the topics of discovered and potential resources, production, use, trade, disposal and recycling. The entity within USGS (to be named “Principal Statistical Agency” within USGS) gathering the information for the assessments mentioned shall: (1) regularly survey emerging energy technologies and the supply chain for elements throughout the periodic table necessary for those technologies in order to forecast potential supply disruptions; and (2) make available such information in the aggregate, with appropriate protection of proprietary information, to the U.S. scientific community, including industry, institutions of higher education and the DOE national laboratories and Technology Centers.
R&D DOE, in coordination with the U.S. Department of the Interior, shall establish a research program to advance basic knowledge and enable expanded availability of energy critical elements, including research on basic materials science, chemistry, physics and engineering associated with energy critical elements, including materials characterization and substitution, recycling and life cycle analysis. In consultation with the Critical and Strategic Mineral Supply Chain Subcommittee of the National Science and Technology Council, the Secretary of Energy shall develop/update a biennial integrated research plan to guide program activities. Research under this provision shall be limited to areas that industry is not likely to undertake due to technical and financial uncertainty. Within 1 year of this Act's enactment, the Critical and Strategic Mineral Supply Chain Subcommittee of the National Science and Technology Council shall submit to the Committee on Science, Space and Technology of the House and the Committee on Commerce, Science and Transportation of the Senate a report on the recycling of energy critical elements, including (1) logistics, economic viability and research and development needs for completing the recycling process; (2) options for both the federal government and industry, including an assessment of the strengths and weaknesses of such options, for improving rates of collection of post-consumer products containing energy critical elements; and (3) analysis of the methods explored and implemented in various states/countries.
Domestic and international collaboration
N/A
Loan guarantee program N/A
Manufacturing N/A Cross-agency N/A Workforce development N/A
Appropriations N/A
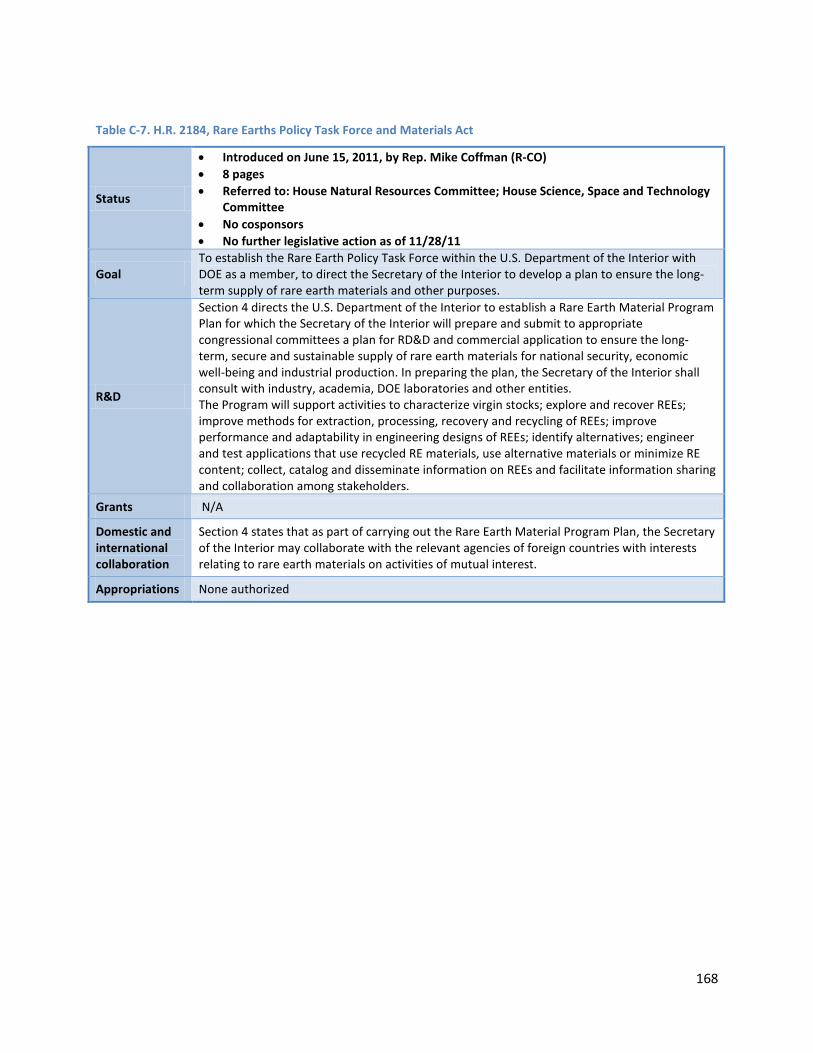
168
Table C-7. H.R. 2184, Rare Earths Policy Task Force and Materials Act
Status
• Introduced on June 15, 2011, by Rep. Mike Coffman (R-CO) • 8 pages • Referred to: House Natural Resources Committee; House Science, Space and Technology
Committee • No cosponsors • No further legislative action as of 11/28/11
Goal To establish the Rare Earth Policy Task Force within the U.S. Department of the Interior with DOE as a member, to direct the Secretary of the Interior to develop a plan to ensure the long-term supply of rare earth materials and other purposes.
R&D
Section 4 directs the U.S. Department of the Interior to establish a Rare Earth Material Program Plan for which the Secretary of the Interior will prepare and submit to appropriate congressional committees a plan for RD&D and commercial application to ensure the long-term, secure and sustainable supply of rare earth materials for national security, economic well-being and industrial production. In preparing the plan, the Secretary of the Interior shall consult with industry, academia, DOE laboratories and other entities. The Program will support activities to characterize virgin stocks; explore and recover REEs; improve methods for extraction, processing, recovery and recycling of REEs; improve performance and adaptability in engineering designs of REEs; identify alternatives; engineer and test applications that use recycled RE materials, use alternative materials or minimize RE content; collect, catalog and disseminate information on REEs and facilitate information sharing and collaboration among stakeholders.
Grants N/A
Domestic and international collaboration
Section 4 states that as part of carrying out the Rare Earth Material Program Plan, the Secretary of the Interior may collaborate with the relevant agencies of foreign countries with interests relating to rare earth materials on activities of mutual interest.
Appropriations None authorized
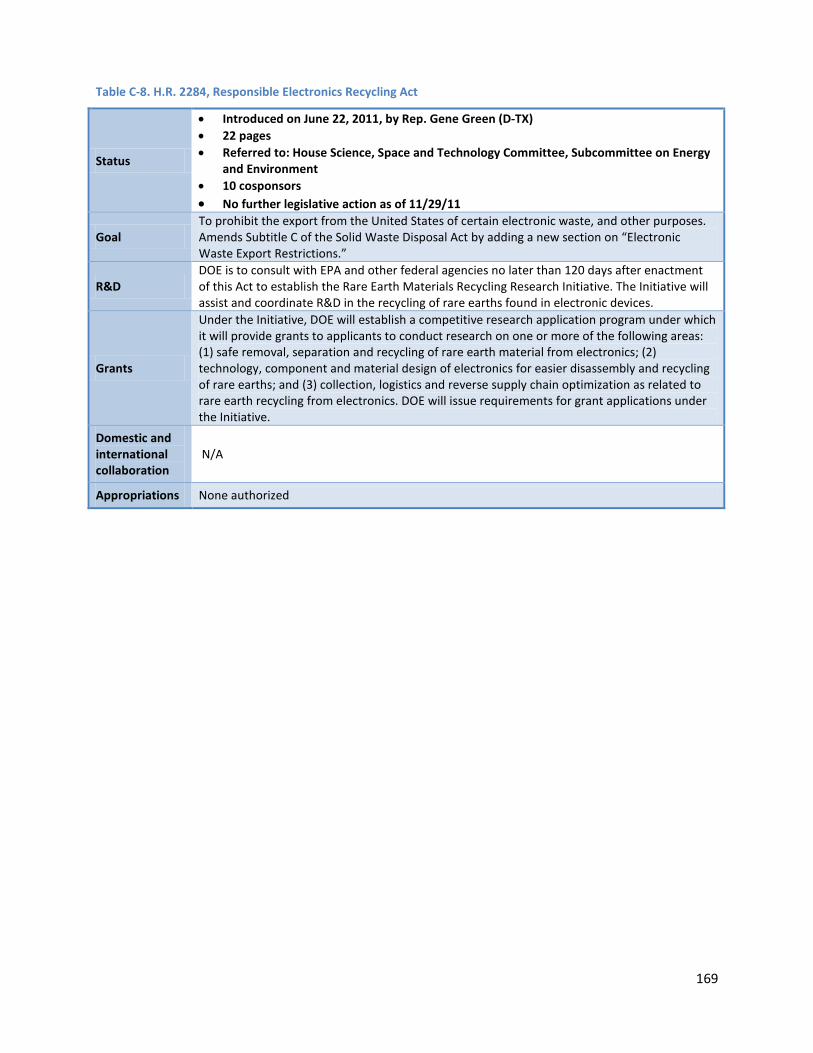
169
Table C-8. H.R. 2284, Responsible Electronics Recycling Act
Status
• Introduced on June 22, 2011, by Rep. Gene Green (D-TX) • 22 pages • Referred to: House Science, Space and Technology Committee, Subcommittee on Energy
and Environment • 10 cosponsors • No further legislative action as of 11/29/11
Goal To prohibit the export from the United States of certain electronic waste, and other purposes. Amends Subtitle C of the Solid Waste Disposal Act by adding a new section on “Electronic Waste Export Restrictions.”
R&D DOE is to consult with EPA and other federal agencies no later than 120 days after enactment of this Act to establish the Rare Earth Materials Recycling Research Initiative. The Initiative will assist and coordinate R&D in the recycling of rare earths found in electronic devices.
Grants
Under the Initiative, DOE will establish a competitive research application program under which it will provide grants to applicants to conduct research on one or more of the following areas: (1) safe removal, separation and recycling of rare earth material from electronics; (2) technology, component and material design of electronics for easier disassembly and recycling of rare earths; and (3) collection, logistics and reverse supply chain optimization as related to rare earth recycling from electronics. DOE will issue requirements for grant applications under the Initiative.
Domestic and international collaboration
N/A
Appropriations None authorized

170
U.S. Senate Table C-9. S. 383, Critical Minerals and Materials Promotion Act of 2011
Status
• Introduced on February 17, 2011, by Sen. Mark Udall (D-CO) • 6 pages • Referred to: Energy and Natural Resource Committee • 2 cosponsors • June 9, 2011: Energy Subcommittee hearing held; DOE A/S Sandalow was
witness • No further legislative action as of 11/28/11
Goal To promote domestic production of critical minerals and materials (CM&M), and other purposes.
Resource Assessment
Section 3 directs the Secretary of the Interior, through USGS, to establish an R&D program to (1) provide data on and analyses of CM&M resources in the United States and abroad; (2) analyze and assess current and future supply chains with advice from EIA on future energy technology market penetration and using Mineral Commodity Summaries prepared by USGS; and (3) cooperate with international partners to do analyses of global supply chains.
R&D
Section 4 directs DOE to conduct an RD&D program to strengthen the domestic CM&M supply chain for clean energy technologies and meet the clean energy production needs of the United States, including production, processing, refining, greater efficiency of use in energy technologies, recycling and substitutes.
Education and training DOE shall promote development of CM&M industry workforce in the United States by way of undergraduate and graduate scholarships and fellowships, industry-academia partnerships and development of courses and curricula on CM&M.
Cross-agency
The President, through the Executive Office, shall coordinate actions of applicable agencies; identify CM&M needs and establish early warning systems; set up a mechanism to evaluate relevant federal programs (including R&D programs) to complement efforts in the private sector as well as by other domestic and international organizations; promote and encourage private enterprise in developing economically sound and stable domestic CM&M supply chains; promote and encourage recycling of CM&M, taking into account technical, economic, environmental, logistical and R&D needs; assess and address the need for the technical personnel necessary for ensuring an adequate supply of CM&M; and report to Congress on activities and findings.
International cooperation
The Secretary of the Interior, through the established R&D program for resource assessment mentioned above, shall cooperate with international partners when appropriate to do analyses of global supply chains.
Loan guarantee program N/A
Grants N/A
Appropriations Appropriations to be authorized for sums necessary to carry out this Act.

171
Table C-10. S. 421, Powering America's Lithium Production Act of 2011
Status
• Introduced on February 28, 2011, by Sen. Kay Hagan (D-NC) • 3 pages • Referred to: Energy and Natural Resources Committee • No cosponsors • June 9, 2011: Energy Subcommittee hearing held; DOE A/S Sandalow was witness • No further legislative action as of 11/28/11
Goal To amend the Energy Independence and Security Act of 2007 to require the Secretary of Energy to provide grants for lithium production R&D.
Resource Assessment N/A
R&D N/A
Permitting N/A
Education and training N/A
Cross-agency N/A
International cooperation N/A
Loan guarantee program N/A
Grants DOE shall provide grants to eligible public and private entities (or consortia of entities) for RD&D and commercial application of domestic industrial processes designed to enhance domestic lithium production for use in advanced battery technologies.
Appropriations Appropriations authorized:
• $10 million for each FY from 2011–2014

172
Table C-11. S. 1113, Critical Materials Policy Act of 2011
Status
• Introduced on May 27, 2011, by Sen. Lisa Murkowski (R-AK) • 43 pages • Referred to Energy and Natural Resources Committee • 19 cosponsors • June 9, 2011: Energy Subcommittee hearing held; DOE A/S Sandalow was witness • No further legislative action as of 11/28/11
Goal To facilitate the reestablishment of domestic critical mineral designation, assessment, production, manufacturing, recycling, analysis, forecasting, workforce, education, research and international capabilities in the United States, and other purposes.
Resource Assessment
Section 101 of Title I directs the U.S. Department of the Interior to publish a draft methodology for determining material criticality, request for public comments, review the public comments, develop a final methodology, publish a list of minerals designated as critical within 180 days of the Act's enactment and update this list at least every 5 years. Section 103 of Title I directs the U.S. Department of the Interior to develop a methodology for determining which minerals qualify as critical minerals. Section 107 directs the U.S. Department of the Interior to produce for each critical material a comprehensive annual Mineral Commodity Summary and an “Annual Critical Minerals Outlook” forecast; and conduct resource assessments on federal, state and Indian tribe lands. Section 211 of Title II directs the U.S. Department of the Interior to update resource assessments on helium, phosphate, potash and rare earth elements within 21 months of the Act’s enactment.
R&D
Section 106 of Title I directs DOE to establish an R&D program for identifying recycling opportunities for and alternatives to critical materials. DOE is to report on activities, findings and progress of the program within 2 years of the Act’s enactment and every 5 years thereafter. Sections 201-210 of Title II direct DOE to support research programs (more specifics on R&D topics in the bill) on:
1. Cobalt: novel uses, including energy technologies and super alloys. 2. Lead: advanced lead manufacturing processes. 3. “Low-BTU Gas” and helium gases: technology research to expand domestic
production; establishment of an Industry Helium Program through the Industry Technologies Program of DOE.
4. Thorium: study on technical, economic and policy issues associated with establishing a licensing pathway for the thorium nuclear fuel cycle, in consultation with NRC. DOE is to submit a report on the cobalt research program and the thorium study within 2 years of the Act’s enactment.
Permitting
Section 104 of Title I directs the U.S. Department of the Interior to lead a multi-agency Critical Materials Working Group to identify ways to streamline the permitting process and further domestic critical materials exploration and development. The working group will submit a report within 300 days of the enactment of the Act. Upon completion of the report, the working group will develop a Performance Metric to evaluate progress made by the executive branch in streamlining permitting and enhancing domestic materials exploration and development. Section 104 of Title I also directs the Small Business Administration to submit a report (within 300 days after the Act’s enactment) assessing the performance of federal agencies in complying with the “Regulatory Flexibility Act” with respect to regulations applicable to the critical minerals industry. Section 105 of Title I directs the President (or designee), at the request of the governor of a state, to consider entering into a cooperative agreement with the state for identifying steps to optimize efficiencies in the permitting process of critical minerals manufacturing facilities.
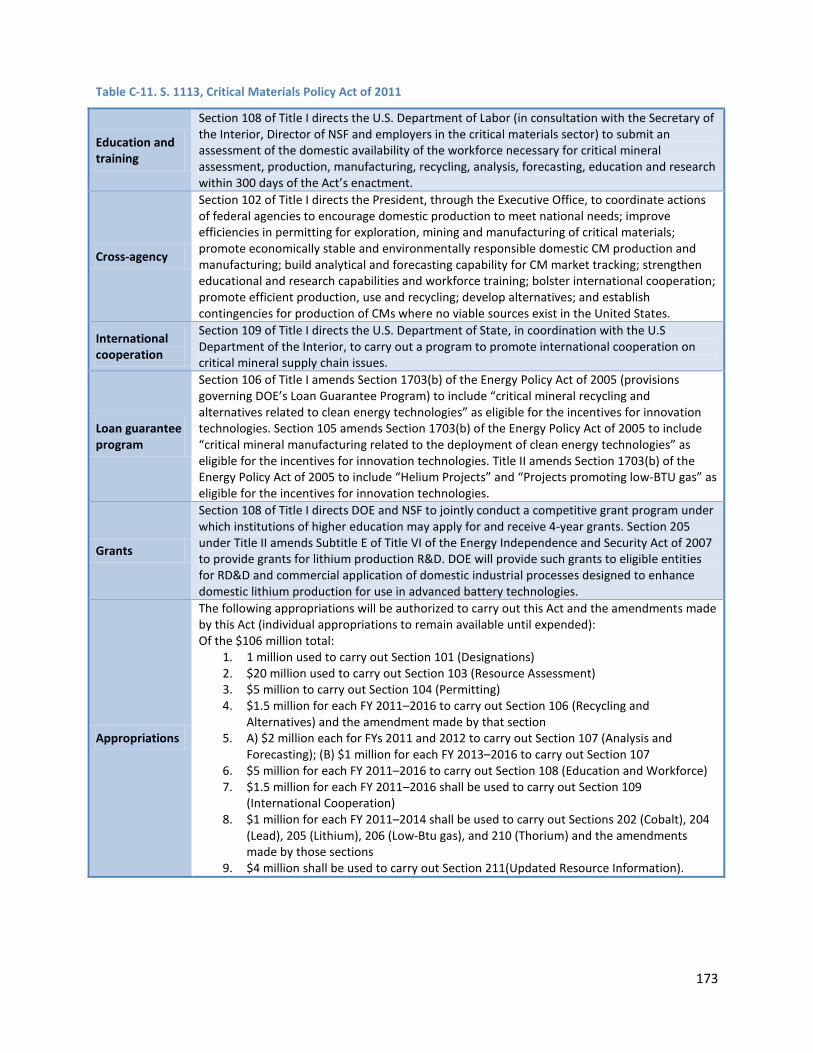
173
Table C-11. S. 1113, Critical Materials Policy Act of 2011
Education and training
Section 108 of Title I directs the U.S. Department of Labor (in consultation with the Secretary of the Interior, Director of NSF and employers in the critical materials sector) to submit an assessment of the domestic availability of the workforce necessary for critical mineral assessment, production, manufacturing, recycling, analysis, forecasting, education and research within 300 days of the Act’s enactment.
Cross-agency
Section 102 of Title I directs the President, through the Executive Office, to coordinate actions of federal agencies to encourage domestic production to meet national needs; improve efficiencies in permitting for exploration, mining and manufacturing of critical materials; promote economically stable and environmentally responsible domestic CM production and manufacturing; build analytical and forecasting capability for CM market tracking; strengthen educational and research capabilities and workforce training; bolster international cooperation; promote efficient production, use and recycling; develop alternatives; and establish contingencies for production of CMs where no viable sources exist in the United States.
International cooperation
Section 109 of Title I directs the U.S. Department of State, in coordination with the U.S Department of the Interior, to carry out a program to promote international cooperation on critical mineral supply chain issues.
Loan guarantee program
Section 106 of Title I amends Section 1703(b) of the Energy Policy Act of 2005 (provisions governing DOE’s Loan Guarantee Program) to include “critical mineral recycling and alternatives related to clean energy technologies” as eligible for the incentives for innovation technologies. Section 105 amends Section 1703(b) of the Energy Policy Act of 2005 to include “critical mineral manufacturing related to the deployment of clean energy technologies” as eligible for the incentives for innovation technologies. Title II amends Section 1703(b) of the Energy Policy Act of 2005 to include “Helium Projects” and “Projects promoting low-BTU gas” as eligible for the incentives for innovation technologies.
Grants
Section 108 of Title I directs DOE and NSF to jointly conduct a competitive grant program under which institutions of higher education may apply for and receive 4-year grants. Section 205 under Title II amends Subtitle E of Title VI of the Energy Independence and Security Act of 2007 to provide grants for lithium production R&D. DOE will provide such grants to eligible entities for RD&D and commercial application of domestic industrial processes designed to enhance domestic lithium production for use in advanced battery technologies.
Appropriations
The following appropriations will be authorized to carry out this Act and the amendments made by this Act (individual appropriations to remain available until expended): Of the $106 million total:
1. 1 million used to carry out Section 101 (Designations) 2. $20 million used to carry out Section 103 (Resource Assessment) 3. $5 million to carry out Section 104 (Permitting) 4. $1.5 million for each FY 2011–2016 to carry out Section 106 (Recycling and
Alternatives) and the amendment made by that section 5. A) $2 million each for FYs 2011 and 2012 to carry out Section 107 (Analysis and
Forecasting); (B) $1 million for each FY 2013–2016 to carry out Section 107 6. $5 million for each FY 2011–2016 to carry out Section 108 (Education and Workforce) 7. $1.5 million for each FY 2011–2016 shall be used to carry out Section 109
(International Cooperation) 8. $1 million for each FY 2011–2014 shall be used to carry out Sections 202 (Cobalt), 204
(Lead), 205 (Lithium), 206 (Low-Btu gas), and 210 (Thorium) and the amendments made by those sections
9. $4 million shall be used to carry out Section 211(Updated Resource Information).

174
Table C-12. S. 1270, Responsible Electronics Recycling Act
Status
• Introduced on June 23, 2011, by Sen. Sheldon Whitehouse (D-RI) • 22 pages • Referred to: Environment and Public Works Committee • 2 cosponsors • No further legislative action as of 11/28/11
Goal To prohibit the export from the United States of certain electronic waste, and other purposes. Amends Subtitle C of the Solid Waste Disposal Act by adding a new section on “Electronic Waste Export Restrictions.”
R&D DOE is to consult with EPA and other federal agencies no later than 120 days after enactment of this Act to establish the Rare Earth Materials Recycling Research Initiative. The Initiative will assist and coordinate R&D in the recycling of rare earths found in electronic devices.
Grants
Under the Initiative, DOE will establish a competitive research application program under which it will provide grants to applicants to conduct research on one or more of the following areas: (1) safe removal, separation and recycling of rare earth material from electronics; (2) technology, component and material design of electronics for easier disassembly and recycling of rare earths; and (3) collection, logistics and reverse supply chain optimization as related to rare earth recycling from electronics. DOE will issue requirements for grant applications under the Initiative.

175
Appendix D. EU-Japan-US Trilateral Critical Materials Conference Agenda
176
Conference on Critical Materials for a Clean Energy Future
Jointly Organized by the European Commission Government of Japan
U.S. Department of Energy
Seminar Hosted by the European Institute at the Cosmos Club 2121 Massachusetts Avenue, NW
Workshops Hosted by the U.S. Department of Energy 1000 Independence Avenue SW
Washington, DC
October 4-5, 2011
177
Conference Background
Every day, researchers, entrepreneurs and many others across the world are working to develop and deploy the clean energy technologies that will enhance our security, reduce pollution and promote prosperity. Many new and emerging clean energy technologies, such as the components of wind turbines and electric vehicles, depend on materials with unique properties, such as rare earth elements. The availability of a number of these materials is at risk due to their location, vulnerability to supply disruptions and lack of suitable substitutes.
One key strategy to cope with this dilemma is to expand available supplies through sustainable and cost-effective technologies for separation, extraction, processing and recycling. Another is to temper material demand by designing wind turbines and motors that require less critical material. Both of these strategies are addressed in the conferences’ R&D workshops.
The European Union, Japan and the United States are leaders in the market introduction of clean energy technologies. Together, they possess a great capacity to expand materials supplies and to reduce material requirements associated with these clean energy technologies. Bilateral workshops were held between the United States and Japan at Lawrence Livermore National Laboratory in November 2010 and between the United States and the European Union in December 2010 to explore the potential for synergies to harness that capacity. Based on the promise of those workshops, a series of trilateral EU-Japan-US workshops is being organized to explore in depth the specific potential for technology collaboration on rare earth materials.
Conference Organization and Objectives
The conference will gather officials and material scientists from the European Union, Japan and the United States to discuss the strategic implications of global shortages in critical materials and to explore means of avoiding such shortages. Parallel sessions will examine ways to reduce rare earth requirements for wind turbines and EV motors and to enhance the supply of rare earths through sustainable production, reuse, recovery and recycling. It is jointly organized by the European Commission’s Directorate General for Research and Innovation, the Japanese Ministry of Economy, Trade and Industry (METI), and the U.S. Department of Energy (DOE).
178
TUESDAY, OCTOBER 4, 2011
Seminar on the Strategic Implications of Global Shortages in Critical Materials (Cosmos Club, 2121 Massachusetts Avenue, NW, Washington DC, 8:45 am - 2:30 pm) Organized in cooperation with The European Institute’s Transatlantic Roundtable on Energy and the Environment, this seminar will focus on the global supply challenges of rare earth materials: the impact of materials shortages on innovation, security and trade; environmentally and economically sustainable means of producing rare earths; and research and development strategies to address material criticality.
Introduction (8:45 am): Joëlle Attinger, President, The European Institute Moderator: Bart Gordon, Partner, K&L Gates LLP Keynote Addresses (8:50-9:20 am) David Sandalow, Assistant Secretary for Policy and International Affairs, U.S. Department of Energy Reinhard Bütikofer, Member, Vice Chair, Group of the Greens/European Free Alliance; Member, Committee on Industry, Research and Energy, European Parliament Ichiro Fujisaki, Ambassador of Japan to the United States
Implications of Material Supply Challenges for Innovation, Security and Trade (9:20-11:20 am) Gwenole Cozigou, Director, Chemicals, Metals, Mechanical, Electrical, Construction Industries and Raw Materials, Directorate General for Enterprise and Industry, European Commission Herbert von Bose, Director, Industrial Technologies, Directorate General for Research and Innovation, European Commission Cyrus Wadia, Senior Policy Analyst, Environment and Energy Division, Office of Science and Technology Policy, United States Charles Cogar, Legislative Director, Congressman Mike Coffman, U.S. House of Representatives Komei Halada, Managing Director, Center for Strategic Natural Resources, National Institute for Materials Science, Japan Keiichi Kawakami, Deputy Director General, Manufacturing Industries Bureau, Ministry of Economy, Trade and Industry of Japan
Environmentally and Economically Sustainable Production of Rare Earths (11:20 am - 1:00 pm) Stephen Collocott, Group Leader, Novel Alloys, Magnetics and Drives, Commonwealth Scientific and Industrial Research Organization (CSIRO), Australia Anil Arora, Assistant Deputy Minister, Minerals and Metals Sector, Natural Resources Canada Alain Rollat, Technology Development Manager, Rhodia Rare Earth Systems Maurits Van Camp, Coach, Recycling and Extraction Technology Platform, Umicore Jim Sims, Vice President, Corporate Communications, Molycorp
Luncheon: R&D and Policy Strategies for Addressing Material Criticality (1:00 - 2:30 pm) Reinhard Bütikofer, Member, Vice Chair, Group of the Greens/European Free Alliance; Member, Committee on Industry, Research and Energy, European Parliament

179
TUESDAY – WEDNESDAY, OCTOBER 4-5, 2011
Workshop A on Substitutes for and Efficient Use of Rare Earth Magnets
(U.S. Department of Energy, 1000 Independence Avenue SW, Washington DC, Room GH-019)
Session A1: Reducing Neodymium and Dysprosium Requirements for Permanent Magnets (Tuesday, October 4, 3:00-6:00 pm) This session is focused on new compositions or structures that have high energy density and low rare earth content, as well as heat management approaches that reduce dysprosium needs. Discussion Lead: Suresh Baskaran, Pacific Northwest National Laboratory William McCallum, Ames Research Laboratory, Approaches for Enhanced Rare-Earth- Free Permanent Magnets Dimitris Niarchos, Demokritos, A Scientific Response to Scarcity of Rare Earths: REFREEPERMAG Migaku Takahashi, Tohoku University, Research and Development of Iron-Nitride-Based New Permanent Magnetic Materials with Less Rare Earth Elements or Free of Rare Earth Elements George Hadjipanayis, University of Delaware, High-Performance Magnets with Reduced Neodymium and Dysprosium Content Viorel Pop, Babes-Bolyai, Exchange Spring Nanocomposite Magnetic Materials: A Path to Strong, Hard Magnetic Materials with Low Rare Earth Content Laura Lewis, Northeastern University, New Directions in Permanent Magnets: Developing Anisotropy without Rare Earths Hirotoshi Fukunaga, Nagasaki University, Numerical Modeling for Magnetic Materials
Session A2: Component and System-Level Substitutions for Rare Earth Materials (Wednesday, October 5, 9:30 am - 12:30 pm) This session is focused on alternative motor and generator designs such as induction or reluctance motors, new approaches to magnetic circuit design, advanced hydraulic transmission for drive train systems, and High-Temperature Super Conductor Generators (HTSCG)
Discussion Lead: Ed Jones, Lawrence Livermore National Laboratory Steve Constantinides, Arnold Magnetics, Magnetic Material and Device Design Options Akira Chiba, Tokyo Institute of Technology, Development of Rare-Earth Free Motors for Electric Vehicles and Hybrid Electric Vehicles John Miller, Oak Ridge National Laboratory, Permanent Magnets and Motors: The Challenge Yuh Shiohara, Superconductivity Research Laboratory, International Superconductivity Technology Center, Japanese Efforts and Current Status of R&D on Superconducting Motors Navin Manjooran, Siemens, High Temperature Materials Needs Venkat Selvamanickam, University of Houston, High Temperature Superconducting Materials for High-Power, Light-Weight Generators for Wind Energy and Other Applications

180
TUESDAY – WEDNESDAY, OCTOBER 4-5, 2011 Workshop B on Critical Material Resource Efficiency: Production, Reuse, Recovery, Recycling
(U.S. Department of Energy, 1000 Independence Avenue SW, Washington DC, Room GH-035)
Session B1: Materials and Processes for Environmentally Sound, Economical Separation of Rare Earths in Diverse Ore Bodies and Recycling Streams (Tuesday, October 4, 3:00-6:00 pm) This session is focused on rare earth separation and reduction technologies using organic solvents, supercritical solvents, membranes, biological processes, and ion exchange. Discussion Lead: John Hryn, Argonne National Laboratory Eric Peterson, Idaho National Laboratory, Approaches to Rare Earths Separation John Burba, Molycorp, How Technology Innovation Is Driving Global Diversity in Rare Earth Manufacturing R. O. Loutfy, MER Corporation, A Low-Cost Continuous Process to Produce Magnet Alloys Mauritz Van Camp, Umicore, Recycling Lithium-Ion and Nickel Metal Hydride Batteries Alain Rollat, Rhodia, Rare Earths Recycling from End of Life Lamps: To Close the Loop Junji Shibata, Kansai University, Recovery of Critical Materials from LIB Using Solvent Extraction Yasuhiro Konishi, Osaka Prefecture University, Wet Recovery of Critical Materials from Urban Mining Using Microorganisms Kenji Kawabe, CMC Technology Development, Recycling of Critical Materials by Hydrothermal Treatment
Session B2: Rare Earth Recycling Technologies and Optimization (Wednesday, October 5, 9:30 am -12:30 pm) This session is focused on design of materials and products for recyclability, processes uniquely suited to rare earth recycling, and logistical optimization of rare earth recycling activities. Discussion Lead: Rod Eggert, Colorado School of Mines Nozomi Sagara, New Energy and Industrial Technology Development Organization (NEDO), NEDO Program for Critical Materials Recycling Technologies and Policy Background René Kleijn, Leiden University, Metals in Energy Technologies and Rare Earth Recycling Tomoko Akai, National Institute of Advanced Industrial Science and Technology (AIST), Reducing Usage of Rare Earth Phosphors by Re-use of Waste Phosphors Daneel Geysen, University of Leuven, RARE, Research Platform for the Advanced Recycling and Reuse of Rare Earths at KU Leuven CN Chinnasamy, Electron Energy Corporation, Rare Earth Element Recycling Allan Walton, University of Birmingham, Use of Hydrogen to Extract and Recycle Rare Earth Magnets Shigehiro Nishijima, Osaka University, Magnetic Force Control Technology for Recycling Rare Earth Elements Joshua Montenegro, RSR Technologies, Recycling of Nickel Metal Hydride and Lithium Batteries

181
WEDNESDAY, OCTOBER 5, 2011
Working Lunch (12:30- 2:00 pm)
(U.S. Department of Energy, 1000 Independence Avenue SW, Washington, DC, cafeteria)
Workshop participants will continue discussing priorities for trilateral cooperation over lunch.
Concluding Session (2:00-3:30 pm)
(U.S. Department of Energy, 1000 Independence Avenue SW, Washington DC, room tbd)
This session will identify synergies between EU, Japanese and U.S. technology efforts to expand critical material supplies and moderate critical materials demand for rare earth materials that are critical to sustained expansion of markets for electric vehicles and wind turbines. From Workshop A, it will identify specific modes of collaboration to design permanent magnets that require less rare earth material and to design wind turbines and electric vehicle motors that do not require permanent magnets. From Workshop B, it will identify specific avenues of cooperation on separation, extraction, processing and recycling of rare earth materials. These synergies will form the core of a Trilateral Strategic Vision for Critical Materials Research. The session will also identify next steps and actions in pursuing a collaborative research agenda.
Chairs/Animateurs:
Pilar Aguar, Directorate General for Research and Innovation, European Commission Toru Nakayama, New Energy and Industrial Technology Development Organization, Japan Jeff Skeer, Office of Policy and International Affairs, U.S. Department of Energy
Summaries of the Workshop Sessions
Session A-1 (reducing requirements): Suresh Baskaran, Pacific Northwest National Laboratory
Session A-2 (substitutions): Ed Jones, Lawrence Livermore National Laboratory
Session B-1 (processes): John Hryn, Argonne National Laboratory
Session B-2 (recycling): Rod Eggert, Colorado School of Mines
Close (3:30 pm)

182
Appendix E. U.S. Department of Energy Research Funding Opportunity Announcements Relevant to Critical Materials This appendix provides information on recent awards under research Funding Opportunity Announcements (FOAs) issued by the U.S. Department of Energy (DOE) related to critical materials. Selected projects from these FOAs and other DOE-supported research were discussed in Chapter 6.
Advanced Research Projects Agency-Energy Through its Rare Earth Alternatives in Critical Technologies for Energy (REACT) program, the Advanced Research Projects Agency-Energy (ARPA-E) is funding early stage technology alternatives that reduce or eliminate the dependence on rare earth materials by developing substitutes for rare earth permanent magnets (PMs) in two key areas: electric vehicle (EV) motors and wind generators. The 14 projects totaling $31.6 million are high-risk projects that could provide technological leaps in the performance of EV motors and wind generators while reducing or eliminating the use of critical rare earth elements. These projects have been selected for negotiation of awards; final award amounts may vary.
A majority of the projects under the REACT program examine new types of PMs with high energy density and high temperature stability. Approaches include novel PM chemical compositions, reexamination of previously researched magnet compositions, and innovative processing procedures such as nanostructuring. Through the REACT program, ARPA-E is aiming to reinvigorate magnet research that has not produced breakthrough research since the advent of neodymium-iron-boron PMs in the early 1980s.
In addition to new magnet technologies, the REACT program is supporting projects that take a systems-level approach to the substitution of rare earth permanent magnets. Two projects are developing superconducting wires for direct-drive wind generators. These superconducting wires can replace permanent magnets in direct-drive turbine designs while decreasing mass and volume, thus making it a practical for larger wind turbines (>5 megawatts).
Three REACT projects are examining systems-level substitutions for PMs in EVs. Approaches include innovative motor designs, new cooling systems to reduce high-temperature performance requirements, the addition of emerging materials and advanced manufacturing techniques.
In addition to REACT, ARPA-E has funded several magnet and battery projects. Two projects totaling $6.6 million served as a precursor to REACT in investigating next-generation PMs with reduced or eliminated rare earth content. The Batteries for Electric Energy Storage in Transportation (BEEST) program invested $35 million in new batteries and storage chemistries, structures and technologies. Approaches include the use of earth-abundant research that will exceed the capabilities of the best state-of-the-art lithium-ion technologies.

183
Table E-1. ARPA-E: Developing Substitutes for Magnets, Motors, Wind Generators and Batteries
Office of Energy Efficiency and Renewable Energy The program offices within the Office of Energy Efficiency and Renewable Energy (EERE) develop the next generation of clean energy technologies while also considering materials sustainability in technology development.
ARPA-E program Institution DOE Funding Objective
University of Delaware $4.4 million New routes to next-generation PMs
General Electric $2.2 million Bulk nanostructured magnetic materials—magnets with reduced REE content
BEEST Several $35 million Demonstration of new batteries and storage chemistries, structures and technologies
REACT Case Western Reserve University
$1 million Micro-alloying added to iron-nitride alloys
REACT Dartmouth College $397,433 Nanocrystalline manganese-aluminum alloys
REACT University of Houston and others
$3,123,750 Superconducting wires and coils
REACT Northeastern University and others
$3,439,877 Stabilized iron-nickel crystal structures for PMs
REACT QM Power and others $2,319,474 New electric motor design with no rare earth PMs
REACT Pacific Northwest National Laboratory and others
$2,344,299 Manganese composite PMs
REACT University of Alabama and others
$1,265,589 Hexagonal symmetry based materials systems manganese-bismuth and M-type hexaferrite
REACT Argonne National Laboratory and Electron Energy Corporation
$2,965,904 Nanocomposite exchange-spring magnets
REACT Brookhaven National Laboratory and American Superconductor Corporation
$1,374,975 Superconducting wires for direct-drive wind generators
REACT Baldor Electric Company and others
$2,942,867 Rare-earth-free traction motor
REACT General Atomics and University of Texas at Dallas
$2,819,393 Double-stator switched reluctance motor
REACT Virginia Commonwealth University and others
$2,911,374 Carbide-based composite magnet
REACT University of Minnesota and Oak Ridge National Laboratory
$2,528,299 Iron-nitrogen anisotropic nanocomposite magnets
REACT Ames Laboratory and others $2,202,545 Cerium-based PMs

184
Vehicle Technologies Program The Vehicle Technologies Program has recognized rare earth supply may not be available to meet the demand needed for rare earth PM motors and plug-in hybrid electric vehicle (PHEV) and EV batteries.113
Table E-2. Vehicle Technologies Program: Reducing or Eliminating REE Use for Electric Vehicle Motors
The Vehicle Technologies Program has funded research on motors with reduced or eliminated use of rare earth PMs for electric traction drives.
Institution DOE Funding Objective
GE Global Research $6 million Develop high-performance motors with non-rare-earth materials by concurrently engineering advanced motor designs, materials, thermal management and motor controls.
UQM Technologies $3 million Develop non-rare-earth PM motor architecture that will enable the use of low-energy magnet technology.
Additionally, the Vehicle Technologies Program has funded numerous projects at the national laboratories to reduce the need for rare earth PMs in motors. To address the significant battery needs of PHEVs, EVs and hybrid electric vehicles, the Vehicle Technologies Program has shifted its focus to lithium-based batteries and away from nickel metal hydride batteries. The recent Vehicle Technologies Program program-wide FOA included topics on developing and demonstrating new materials and cells that offer improved performance in either energy or power density compared to state-of-the-art lithium-ion cell technologies, while not sacrificing cycle life and cost.
Table E-3. Vehicle Technologies Program: Advanced Cells and Design Technology for Electric Drive Batteries
Institution DOE Funding Objective Pennsylvania State
University $5 million
Develop a high energy density lithium-sulfur cell technology that significantly reduces battery size and improves performance and life.
Amprius, Inc. $4,998,336 Develop next-generation, high-energy lithium-ion cells leveraging silicon anodes, doubling the capacity of state-of-the-art vehicle batteries.
Seeo, Inc. $4,874,391 Develop high-energy cells using a lithium metal anode and a proprietary solid polymer electrolyte that significantly reduces battery cost and size, and improves life and safety.
Nanosys, Inc. $4,870,781 Develop next-generation, high-energy lithium-ion cells leveraging high-voltage composite cathode materials and silicon-based anodes, doubling the capacity of state-of-the-art vehicle batteries.
3M Company $4,577,909 Develop a cell with high energy density at low cost for lithium-ion batteries for automotive applications by integrating advanced chemistries and enabling technologies related to electrode preparation.
The Vehicle Technologies Program also conducts research on cost-effective lightweight materials that can contribute to fuel-efficient passenger and commercial vehicles. Currently, lightweight magnesium alloys for vehicle use have very limited energy absorption capability but can be improved through the use of rare earth alloying additions, also improving the formability of magnesium alloy sheets.
113 Vehicle Technologies Program. Multi-Year Program Plan: 2011–2015. Washington, DC: U.S. Department of Energy, December 2010. http://www1.eere.energy.gov/vehiclesandfuels/pdfs/program/vt_mypp_2011-2015.pdf.
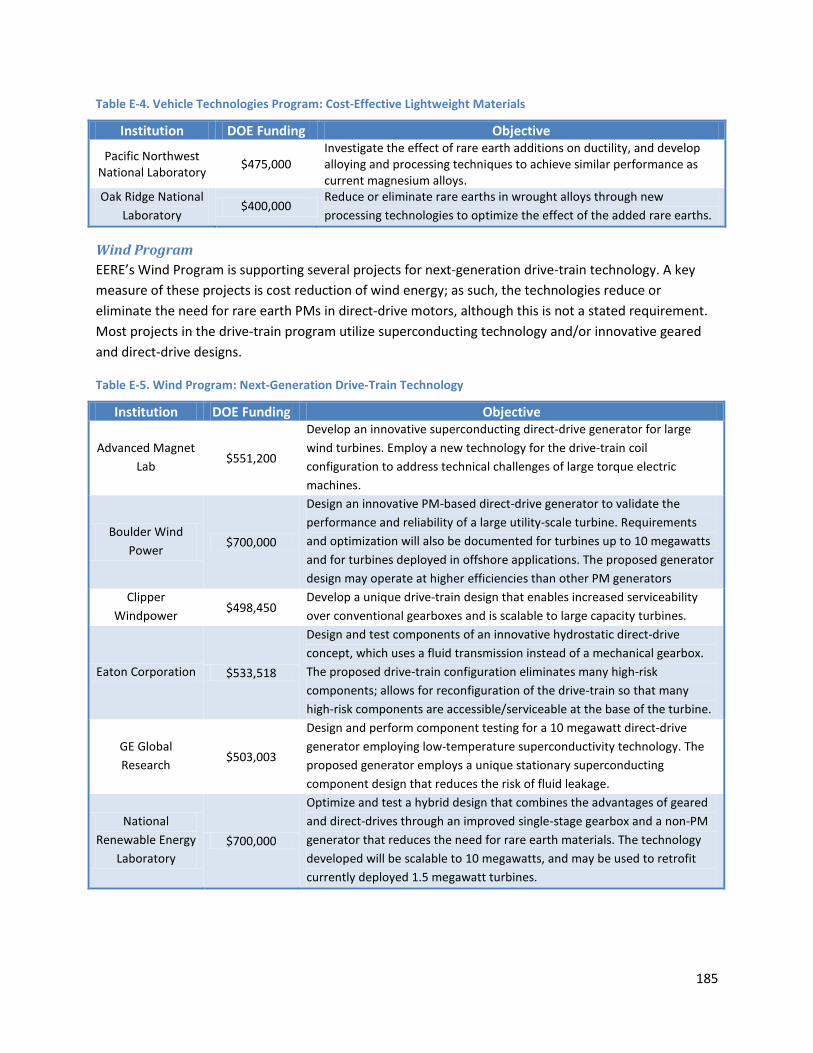
185
Table E-4. Vehicle Technologies Program: Cost-Effective Lightweight Materials
Institution DOE Funding Objective
Pacific Northwest National Laboratory $475,000
Investigate the effect of rare earth additions on ductility, and develop alloying and processing techniques to achieve similar performance as current magnesium alloys.
Oak Ridge National Laboratory
$400,000 Reduce or eliminate rare earths in wrought alloys through new processing technologies to optimize the effect of the added rare earths.
Wind Program EERE’s Wind Program is supporting several projects for next-generation drive-train technology. A key measure of these projects is cost reduction of wind energy; as such, the technologies reduce or eliminate the need for rare earth PMs in direct-drive motors, although this is not a stated requirement. Most projects in the drive-train program utilize superconducting technology and/or innovative geared and direct-drive designs.
Table E-5. Wind Program: Next-Generation Drive-Train Technology
Institution DOE Funding Objective
Advanced Magnet Lab $551,200
Develop an innovative superconducting direct-drive generator for large wind turbines. Employ a new technology for the drive-train coil configuration to address technical challenges of large torque electric machines.
Boulder Wind Power $700,000
Design an innovative PM-based direct-drive generator to validate the performance and reliability of a large utility-scale turbine. Requirements and optimization will also be documented for turbines up to 10 megawatts and for turbines deployed in offshore applications. The proposed generator design may operate at higher efficiencies than other PM generators
Clipper Windpower $498,450
Develop a unique drive-train design that enables increased serviceability over conventional gearboxes and is scalable to large capacity turbines.
Eaton Corporation $533,518
Design and test components of an innovative hydrostatic direct-drive concept, which uses a fluid transmission instead of a mechanical gearbox. The proposed drive-train configuration eliminates many high-risk components; allows for reconfiguration of the drive-train so that many high-risk components are accessible/serviceable at the base of the turbine.
GE Global Research $503,003
Design and perform component testing for a 10 megawatt direct-drive generator employing low-temperature superconductivity technology. The proposed generator employs a unique stationary superconducting component design that reduces the risk of fluid leakage.
National Renewable Energy
Laboratory $700,000
Optimize and test a hybrid design that combines the advantages of geared and direct-drives through an improved single-stage gearbox and a non-PM generator that reduces the need for rare earth materials. The technology developed will be scalable to 10 megawatts, and may be used to retrofit currently deployed 1.5 megawatt turbines.
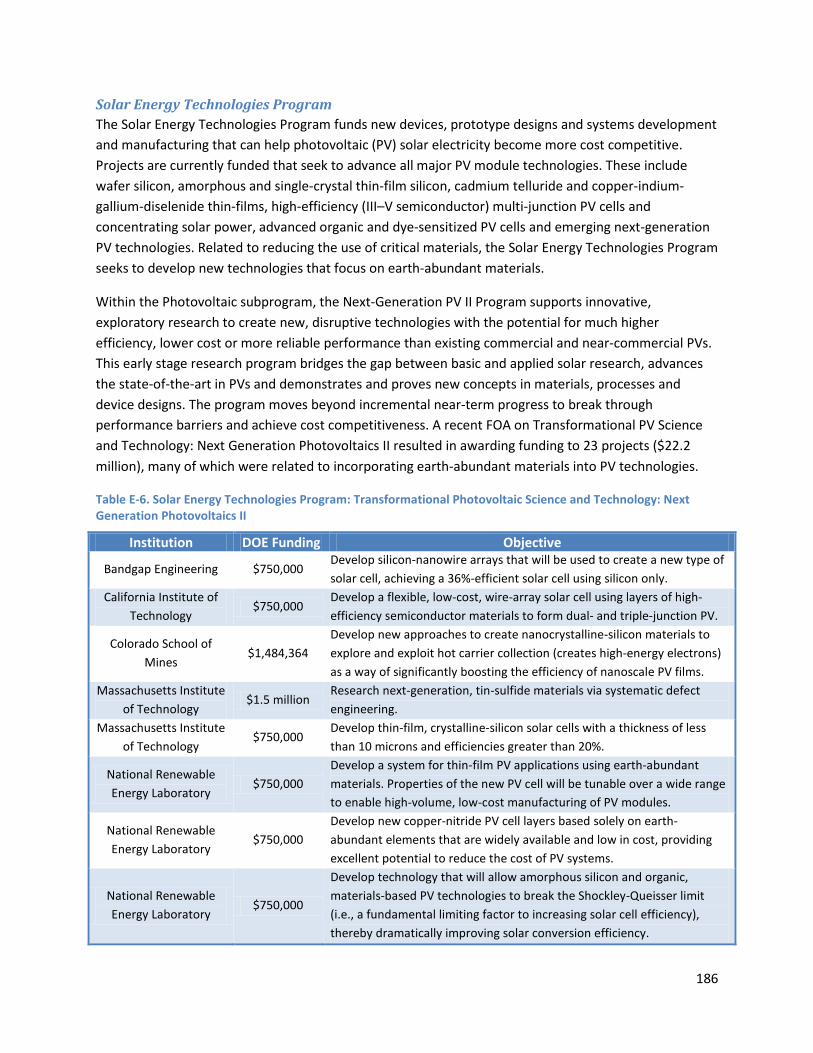
186
Solar Energy Technologies Program The Solar Energy Technologies Program funds new devices, prototype designs and systems development and manufacturing that can help photovoltaic (PV) solar electricity become more cost competitive. Projects are currently funded that seek to advance all major PV module technologies. These include wafer silicon, amorphous and single-crystal thin-film silicon, cadmium telluride and copper-indium-gallium-diselenide thin-films, high-efficiency (III–V semiconductor) multi-junction PV cells and concentrating solar power, advanced organic and dye-sensitized PV cells and emerging next-generation PV technologies. Related to reducing the use of critical materials, the Solar Energy Technologies Program seeks to develop new technologies that focus on earth-abundant materials.
Within the Photovoltaic subprogram, the Next-Generation PV II Program supports innovative, exploratory research to create new, disruptive technologies with the potential for much higher efficiency, lower cost or more reliable performance than existing commercial and near-commercial PVs. This early stage research program bridges the gap between basic and applied solar research, advances the state-of-the-art in PVs and demonstrates and proves new concepts in materials, processes and device designs. The program moves beyond incremental near-term progress to break through performance barriers and achieve cost competitiveness. A recent FOA on Transformational PV Science and Technology: Next Generation Photovoltaics II resulted in awarding funding to 23 projects ($22.2 million), many of which were related to incorporating earth-abundant materials into PV technologies.
Table E-6. Solar Energy Technologies Program: Transformational Photovoltaic Science and Technology: Next Generation Photovoltaics II
Institution DOE Funding Objective
Bandgap Engineering $750,000 Develop silicon-nanowire arrays that will be used to create a new type of solar cell, achieving a 36%-efficient solar cell using silicon only.
California Institute of Technology
$750,000 Develop a flexible, low-cost, wire-array solar cell using layers of high-efficiency semiconductor materials to form dual- and triple-junction PV.
Colorado School of Mines
$1,484,364 Develop new approaches to create nanocrystalline-silicon materials to explore and exploit hot carrier collection (creates high-energy electrons) as a way of significantly boosting the efficiency of nanoscale PV films.
Massachusetts Institute of Technology
$1.5 million Research next-generation, tin-sulfide materials via systematic defect engineering.
Massachusetts Institute of Technology
$750,000 Develop thin-film, crystalline-silicon solar cells with a thickness of less than 10 microns and efficiencies greater than 20%.
National Renewable Energy Laboratory
$750,000 Develop a system for thin-film PV applications using earth-abundant materials. Properties of the new PV cell will be tunable over a wide range to enable high-volume, low-cost manufacturing of PV modules.
National Renewable Energy Laboratory
$750,000 Develop new copper-nitride PV cell layers based solely on earth-abundant elements that are widely available and low in cost, providing excellent potential to reduce the cost of PV systems.
National Renewable Energy Laboratory
$750,000
Develop technology that will allow amorphous silicon and organic, materials-based PV technologies to break the Shockley-Queisser limit (i.e., a fundamental limiting factor to increasing solar cell efficiency), thereby dramatically improving solar conversion efficiency.

187
Institution DOE Funding Objective
National Renewable Energy Laboratory
$750,000
Modify a copper-oxide base material through alloying with materials such as sulfur, zinc and magnesium, thereby tailoring the band-structure properties to match the solar spectrum and leading to the development of a new PV cell layer material.
PLANT PV $750,000 Study the feasibility of using cadmium selenide as the top cell and silicon as the bottom cell in a tandem architecture.
Princeton University $1,476,609
Develop organic molecules and polymers with appropriate parameters, deposit them onto silicon, characterize the fundamental properties of the interface and then incorporate these silicon/organic interfaces into solar cells to create high efficiencies.
Purdue University $750,000 Develop inks based on copper, zinc, tin and sulfur for deployment of low-cost PV cells.
Sandia National Laboratories
$749,853 Develop a new class of PV material, crystalline nanoporous frameworks that will allow detailed control of key interactions at the nanoscale.
Stanford University $1,380,470 Develop an efficient upconverting material (one that can increase the energy of a stream of light) for incorporation into commercial solar cells using computational and experimental techniques.
University of California, Berkeley
$1.5 million Grow high-quality microstructures of high-efficiency semiconductors on low-cost substrates.
University of California, Irvine
$1,422,130 Develop a 10%-efficient prototype solar cell made from nontoxic, inexpensive, and earth-abundant iron pyrite (also known as fool's gold) that offers a clear pathway to 20% PV module efficiency.
University of California, Los Angeles
$1.5 million Identify and develop a new high-efficiency material system for solar cells via experimental analysis supported by modeling.
University of Chicago $1.5 million
Develop new nanocrystal-based materials for next-generation solar cells. The nanocrystals will be fabricated by very inexpensive and scalable wet chemistry, which will allow combining the advantages of conventional inorganic semiconductors with inexpensive fabrication.
University of Delaware $1,278,110 Develop new low-symmetry gratings for next-generation, thin crystalline silicon and copper-indium-gallium-diselenide PV cells.
University of Michigan $1,500,000 Develop the next generation of organic PV technology using small-molecule systems incorporated into a tandem architecture.
University of Minnesota $1,500,000
Develop tandem cells based on copper-indium-gallium-diselenide technology. The project addresses all three of the major barriers to tandem copper-indium-gallium-diselenide through the use of new materials and processes.
University of Washington
$492,865 Develop nanocrystal-based inks based on earth-abundant elements for the production of low-cost PV systems.
University of Wisconsin, Madison
$462,508 Develop nanostructures of a pyrite semiconductor to overcome material bottlenecks and enable its application in high-performance solar PV devices; pyrite is the most abundant sulfide mineral the Earth's crust.

188
Appendix F. Detail on Refinery Economics of Lower Rare Earth Use The following example was devised to provide insight into the strategies that both refiners and catalyst manufacturers are considering when moving towards lower use of rare earths. Table F-1 shows some selected fluid catalytic cracking (FCC) information for a refinery that currently is using a 3.5 weight percent rare earth oxide (REO) catalyst (Base Case).
• This FCC unit uses 60,000 barrels per day of heavy gas oil feedstock, which is representative of a unit that might be used in a medium size refinery using about 200,000 barrels per day of crude oil.
• This FCC unit achieves a conversion rate of 75.2 percent, where the conversion rate represents the share of higher valued lighter products produced, including gasoline.114
• The refiner also makes 19.3 percent light cycle oil, which is used in distillate fuel. Slurry oil output and coke on catalyst are low valued products.
FCC gasoline yield alone is 61.4 percent of the input feedstock.
• The refiner’s total product value from the FCC unit is $129.7 per barrel of feedstock input, or almost $7.8 million per day for the 60,000 barrel-per-day FCC unit being run.
• To achieve the 75.2 percent conversion, this refiner must add 4 tons per day of fresh catalyst to make up for catalyst deactivation and losses while the unit is running.
• The catalyst costs $7,445 per ton, which translates in the Base Case to about $0.50 per barrel of FCC input.
114 The FCC conversion rate is defined as [100 – (light cycle oil plus slurry oil volume percent yields)].

189
Table F-1. Example FCC Refinery Economics for Three Rare Earth Cases
Base Case
Constant Make-Up
Constant Conversion
3.5 Weight Percent REO
1.75 Weight Percent REO
1.75 Weight Percent REO
Input & Output Volumes FCC Feed Rate Bbl/day 60,000.0 60,000.0 60,000.0 Fresh Catalyst Make Up Tons per day 4.0 4.0 6.0 Lanthanum Content Lbs per day 280.0 140.0 21.0 Conversion Volume % 75.2 73.0 75.2
Selected Yields Ethane & Lighter SCFB (1) 194.5 199.4 203.1 Butane/Butylene Volume % 9.1 9.3 9.9 Propane, Propylene Volume % 15.7 15.9 16.8 Gasoline Volume % 61.4 58.4 59.9 Light Cycle Oil Volume % 19.3 20.5 19.3 Slurry Oil Volume % 5.5 6.5 5.5 Coke on Catalyst Weight % 4.4 4.3 4.4
Product Prices and Revenues (dollars per barrel of FCC input unless otherwise noted)
Prices Revenue Revenue Revenue
Ethane & Lighter $4.28/SCFB $0.83 $0.85 $0.87 Propane $65.50 $1.56 $1.58 $1.73 Propylene $88.36 $5.96 $6.11 $6.38 Isobutane $91.09 $4.86 $4.89 $5.10 N-Butane $88.47 $1.15 $1.16 $1.25 Butenes $113.76 $10.29 $10.46 $11.11 Gasoline $123.90 $76.09 $72.47 $74.37 Light Cycle Oil $120.96 $23.35 $24.83 $23.35 Slurry Oil $83.83 $4.60 $5.42 $4.60 Coke on Catalyst (2) $0.00 $0.00 $0.00 $0.00
Total Product Value
$128.69 $127.79 $128.76
Catalyst Cost
- Base $/Ton $3,000.00 $3,000.00 $3,000.00
- REO Surcharge (3) $/Ton $4,445.00 $2,223.00 $2,223.00
- Total $/Ton $7,445.00 $5,223.00 $5,223.00 Cost perBarrel of FCC Input $/Bbl FCC input $0.50 $0.35 $0.52
Notes: (1) SCFB- standard cubic feet per barrel of feedstock. (2) Coke on catalyst: During the FCC process, coke forms on the catalyst and is continuously burned off to regenerate the catalyst. Heat from this process contributes to the FCC molecular cracking. While the amount of coke on catalyst is significant (over 4 percent by weight of the feedstock in this example), it is given no value in the revenue calculation. (3) Rare earth price of $140 per kilogram was translated to the surcharge of $4445 per ton of input feed.

190
THIS PAGE INTENTIONALLY LEFT BLANK

191