this pdf is a selection from an out-of-print volume from ... · 320 randall k. morck, david a....
TRANSCRIPT

This PDF is a selection from an out-of-print volume from the National Bureauof Economic Research
Volume Title: Concentrated Corporate Ownership
Volume Author/Editor: Randall K. Morck, editor
Volume Publisher: University of Chicago Press
Volume ISBN: 0-226-53678-5
Volume URL: http://www.nber.org/books/morc00-1
Conference Date: May 31-June 1, 1998
Publication Date: January 2000
Chapter Title: III. ECONOMIC EFFECTS OF CONCENTRATED CORPORATEOWNERSHIP: 11. Inherited Wealth, Corporate Control, and Economic GrowthThe Canadian Disease?
Chapter Author: Randall Morck, David Stangeland, Bernard Yeung
Chapter URL: http://www.nber.org/chapters/c9014
Chapter pages in book: (p. 319 - 372)

Inherited Wealth, Corporate Control, and Economic Growth The Canadian Disease?
Randall K. Morck, David A. Stangeland, and Bernard Yeung
Economic value is created by the efficient allocation of an economy’s capi- tal. Much of many countries’ capital is proffered to corporations con- trolled by a small number of very wealthy families. This could be desirable if these families provide optimal corporate management. This paper raises the possibility that the currently observed allocation of corporate control may in fact be suboptimal in such countries.
The basic finding of this paper is that countries in which billionaire heirs’ wealth is large relative to GDP grow more slowly than other coun- tries at similar levels of development while countries in which self-made entrepreneur billionaire wealth is large relative to GDP grow more rapidly than other countries at similar levels of development. We consider several explanations for this finding. First, old wealth may entrench poor manage- ment, and control pyramids may distort their incentives. Second, a sharply skewed wealth distribution may create market power in capital markets, causing inefficiency. Third, entrenched billionaires have a vested interest in preserving the value of old capital and thus in slowing creative destruc- tion. Fourth, old money becomes entrenched through control of the politi- cal system and, most especially, by rearing barriers to capital mobility. In contrast, substantial self-made billionaires’ wealth is observed where such forces are ineffectual and creative destruction occurs.
Randall K. Morck is the Stephen A. Jarislowsky Distinguished Professor of Finance at the University of Alberta, Edmonton. David A. Stangeland is associate professor of finance at the University of Manitoba, Winnipeg. Bernard Yeung is the Krasnoff Professor of Inter- national Business and professor of economics at New York University.
The authors are grateful for helpful suggestions from Juan Alcacer, Mark Casson, Daniel Feenberg, E. Han Kim, David Levy, Krishna Palepu, Michael Weisbach, and Luigi Zingales.
319

320 Randall K. Morck, David A. Stangeland, and Bernard Yeung
We use micro-level evidence to support or refute these macro-level ex- planations. Canadian data are useful for this purpose because the large firms in that country exhibit a large range of ownership structures, with billionaire-controlled and widely held firms both abundant enough for sta- tistical analyses. Also, the Canada-US. free trade agreement causes a use- ful regime change that generates testable predictions of our proposed ex- planations.
Our evidence is consistent with corporate control by heirs leading to slow growth because of inefficiency due to entrenched corporate control, capital market power, high barriers against outside investment, and per- haps also low investment in innovation. We hypothesize that this “Ca- nadian disease” may be a generalizable explanation of our basic cross- country finding. Obviously, further investigation into micro-level data for other countries is called for.
11.1 The Ownership Structure of Countries
Table 11.1 displays the 1993 wealth of Forbes 1,000 billionaire residents by country of residence and scaled by 1993 GDP.’ Our sample was con- structed as follows. We began with all countries having 1997 GDP greater than U.S.$1 billion. We drop all postsocialist countries, such as China, the Czech Republic, Hungary, Poland, and Russia; all countries currently subject to economic sanctions, such as Cuba, Iran, and Iraq; the oil sheik- doms Bahrein and Brunei; the tax havens Liechtenstein and Luxembourg; Ethiopia, Kuwait, and Lebanon, which are undergoing postwar recon- struction; Sri Lanka and the Democratic Republic of the Congo, which are currently experiencing civil war; and Bangladesh, Egypt, El Salvador, Ghana, Jordan, Kenya, New Zealand, Nigeria, Saudi Arabia, Syria, Tan- zania, and the United Arab Emirates because of missing data.
The final sample contains Argentina, Australia, Austria, Belgium, Brazil, Canada, Chile, Colombia, Denmark, Ecuador, Finland, France, Germany, Greece, Hong Kong, Iceland, India, Indonesia, Ireland, Israel, Italy, Japan, Korea, Malaysia, Mexico, the Netherlands, Norway, Peru, the Phil- ippines, Portugal, Singapore, South Africa, Spain, Sweden, Switzerland, Taiwan, Thailand, Turkey, the United Kingdom, the United States, and Venezuela.
In subsequent econometric work, we drop the United States and the
1. Unfortunately, most studies of economic inequality focus on income distribution rather than wealth distribution. The typical finding is that economic growth is slower in countries with more uneven income distribution (Fishlow 1996; Birdsall, Ross, and Sabot 1995). Wealth-based Gini coefficients appear to be unavailable. We therefore take a practical ap- proach and construct our own proxy for wealth, or capital ownership, concentration. As an innovation in 1997, Forbes included political dynasties ranging from the Suhartos to the Windsors in its billionaire list. For the few countries in which these families are present, we use 1997 family wealth. Our results are robust to dropping or including these families.

Table 11.1 Billionaires and Billionaire Wealth by Country and by Source of Wealth
Millions in Wealth over Billions of GDP
Probable Political Billionaires Total Entrepreneur Heir Heir Entrepreneur Family per Million Billionaire Billionaire Billionaire Billionaire and Heir Billionaire
Country People Wealth Wealth Wealth Wealth Control Wealth
Argentina Australia Austria Belgium Brazil Canada Chile Colombia Denmark Ecuador Finland France Germany Greece Hong Kong Iceland India Indonesia Ireland Israel (continued)
0.118 0.056 0 0 0.038 0.173 0.218 0.086 0.193 0 0 0.191 0.504 0.48 2.188 0 0.002 0.02 0 0.395
26.378 7.718 0 0
22.852 40.204
102.174 39.286 17.293 0 0
16.799 54.648
133.333 361.307
11.985 160.598
41.429
0
0
0 7.718 0 0
0
0 0 0 0 2.07 6.523 0
193.157 0 0
0
12.431
36.957
35.948
4 1.429
26.378 0 0 0 4.936
24.898 34.783 0 0 0 0
11.863 39.856 66.667
157.802 0 8.24
1 1.765 0 0
0 0 0 0 0
0
0 0 0 2.8662 8.2691
66.6667 10.3477 0 3.7453
17.6471 0 0
15.3061
39.2857
0 0 0 0 5.4845 0
30.4348 0
17.2932 0 0 0 0 0 0 0 0 0 0 0
0 0 0 0 0 0 0 0 0 0 0 0 0 0 0 0 0
0 0
95.238
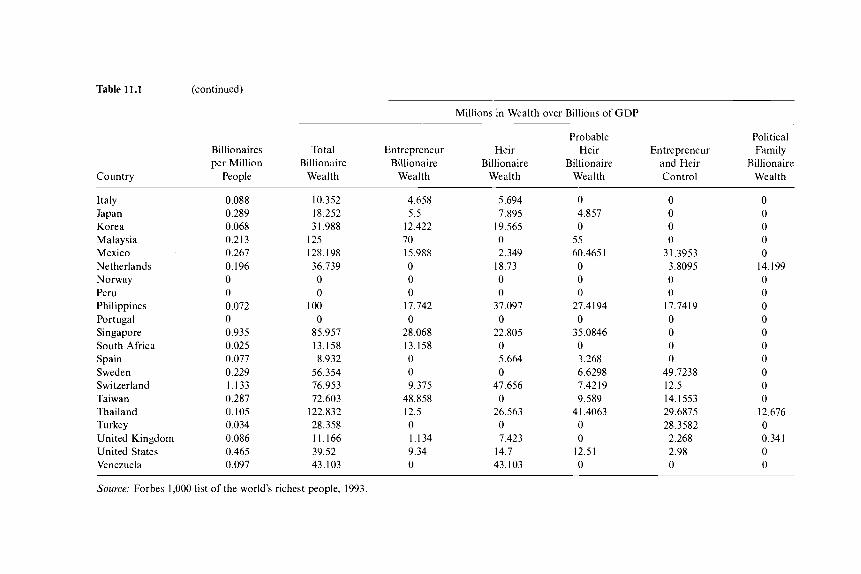
Table 11.1 (continued)
Millions in Wealth over Billions of GDP
Probable Political Billionaires Total Entrepreneur Heir Heir Entrepreneur Family per Million Billionaire Billionaire Billionaire Billionaire and Heir Billionaire
Country People Wealth Wealth Wealth Wealth Control Wealth
Italy Japan Korea Malaysia Mexico Netherlands Norway Peru Philippines Portugal Singapore South Africa Spain Sweden Switzerland Taiwan Thailand Turkey United Kingdom United States Venezuela
0.088 0.289 0.068 0.213 0.267 0.196 0 0 0.072 0 0.935 0.025 0.077 0.229 1.133 0.287 0.105 0.034 0.086 0.465 0.097
10.352 18.252 31.988
125 128.198 36.739 0 0
100 0
85.957 13.158 8.932
56.354 76.953 72.603
122.832 28.358 11.166 39.52 43.103
4.658 5.5
12.422 70 15.988 0 0 0
0 17.742
28.068 13.158 0 0 9.375
48.858 12.5 0 1.134 9.34 0
5.694 7.895
19.565 0 2.349
0 0
37.097 0
22.805 0 5.664 0
47.656 0
26.563 0 7.423
14.7 43.103
18.73
0 4.857 0
55 60.4651 0 0 0
27.4194 0
3 5.0846 0 3.268 6.6298 7.4219 9.589
4 I ,4063 0 0
0 12.51
0 0 0 0
31.3953 3.8095 0 0
0 0 0 0
49.7238 12.5 14.1553 29.6875 28.3582
2.268 2.98 0
1 7.74 1 9
0 0 0 0 0
0 0 0 0 0 0 0 0 0 0
12.676 0 0.341 0 0
14.199
Source: Forbes 1,000 list of the world’s richest people, 1993
Inherited Wealth, Corporate Control, and Economic Growth 323
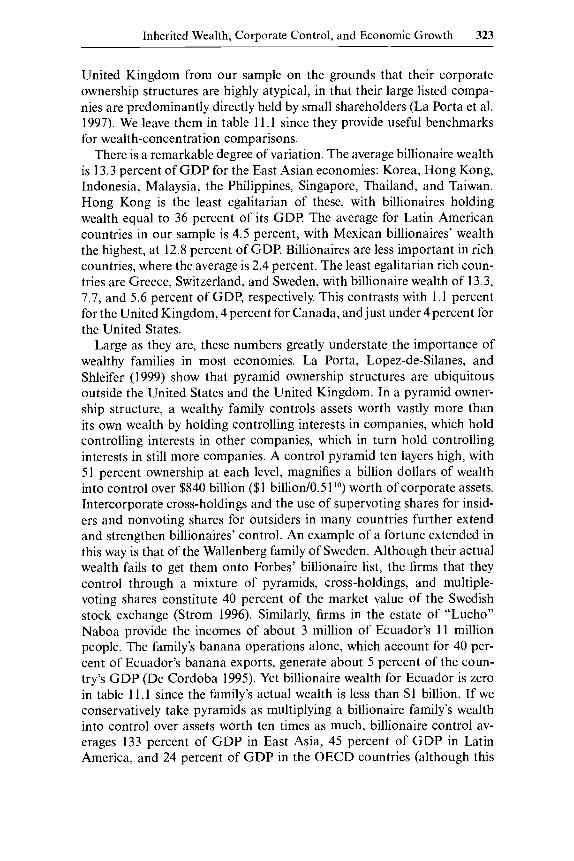
United Kingdom from our sample on the grounds that their corporate ownership structures are highly atypical, in that their large listed compa- nies are predominantly directly held by small shareholders (La Porta et al. 1997). We leave them in table 11.1 since they provide useful benchmarks for wealth-concentration comparisons.
There is a remarkable degree of variation. The average billionaire wealth is 13.3 percent of GDP for the East Asian economies: Korea, Hong Kong, Indonesia, Malaysia, the Philippines, Singapore, Thailand, and Taiwan. Hong Kong is the least egalitarian of these, with billionaires holding wealth equal to 36 percent of its GDP. The average for Latin American countries in our sample is 4.5 percent, with Mexican billionaires’ wealth the highest, at 12.8 percent of GDP. Billionaires are less important in rich countries, where the average is 2.4 percent. The least egalitarian rich coun- tries are Greece, Switzerland, and Sweden, with billionaire wealth of 13.3, 7.7, and 5.6 percent of GDP, respectively. This contrasts with 1.1 percent for the United Kingdom, 4 percent for Canada, and just under 4 percent for the United States.
Large as they are, these numbers greatly understate the importance of wealthy families in most economies. La Porta, Lopez-de-Silanes, and Shleifer (1999) show that pyramid ownership structures are ubiquitous outside the United States and the United Kingdom. In a pyramid owner- ship structure, a wealthy family controls assets worth vastly more than its own wealth by holding controlling interests in companies, which hold controlling interests in other companies, which in turn hold controlling interests in still more companies. A control pyramid ten layers high, with 51 percent ownership at each level, magnifies a billion dollars of wealth into control over $840 billion ($1 billion/0.5 1 lo) worth of corporate assets. Intercorporate cross-holdings and the use of supervoting shares for insid- ers and nonvoting shares for outsiders in many countries further extend and strengthen billionaires’ control. An example of a fortune extended in this way is that of the Wallenberg family of Sweden. Although their actual wealth fails to get them onto Forbes’ billionaire list, the firms that they control through a mixture of pyramids, cross-holdings, and multiple- voting shares constitute 40 percent of the market value of the Swedish stock exchange (Strom 1996). Similarly, firms in the estate of “Lucho” Naboa provide the incomes of about 3 million of Ecuador’s 11 million people. The family’s banana operations alone, which account for 40 per- cent of Ecuador’s banana exports, generate about 5 percent of the coun- try’s GDP (De Cordoba 1995). Yet billionaire wealth for Ecuador is zero in table 11.1 since the family’s actual wealth is less than $1 billion. If we conservatively take pyramids as multiplying a billionaire family’s wealth into control over assets worth ten times as much, billionaire control av- erages 133 percent of GDP in East Asia, 45 percent of GDP in Latin America, and 24 percent of GDP in the OECD countries (although this

324 Randall K. Morck, David A. Stangeland, and Bernard Yeung
calculation is not applicable in the United Kingdom and, especially, the United States, where control pyramids are seldom used).
11.2 Entrepreneurs, Inherited Wealth, and Economic Growth
Should the ownership structure of a nation> capital, in this context, the capital controlled by different types of billionaires, matter? There are nu- merous reasons to think that it might.
Building a fortune and passing it down to one’s descendants might be a powerful motivation for prospective entrepreneurs to build great busi- nesses. Wealthy heirs have the resources and incentives to monitor cor- porate managers carefully and so might improve corporate governance. Powerful families, whose fortunes are tied to their nation’s economies, might lobby politicians to enact economically rational policies and might be more successful at this than small atomistic businessmen. Wealthy fam- ilies might act to safeguard competitive and efficient capital markets and institutions. Wealthy families also have the security and the resources to bankroll innovation. Any or all of these factors could lead to a positive relation between economic growth and billionaire wealth.
However, a negative relation is also plausible a priori. Since intelligence is thought to be, at best, only partly inherited, an entrepreneur’s descen- dants should regress steadily toward average talent with each new genera- tion. If they value the control that pyramids and the like bestow on them, they become entrenched, mediocre managers. Their magnified control of capital may also let wealthy families shape prices in capital markets to further their own welfare at the expense of their countries. Also, with their wealth tied up in existing capital, wealthy families may be loath to finance innovations for fear that the ensuing creative destruction might get out of their control. Finally, their corporate control may give billionaire families economies of scale in political rent seeking and thereby divert public re- sources to their private goals, again to the detriment of their countries.
1 1.2.1 Observation
The actual relation between a country’s capital ownership structure and economic growth is therefore an important but unexplored empirical ques- tion. To address this question, we run standard economic-growth regres- sions of the sort described by Mankiw (1 995), with an extra term at the end:
Our dependent variable is economic growth, defined as the average growth rate in real GDP, r; averaged over 1994, 1995, and 1996. The independent variables in such regressions generally include the logarithm of each coun-

Inherited Wealth, Corporate Control, and Economic Growth 325
try’s 1994 per capita GD8 In( YIL); a physical capital accumulation rate, IIK, where I is capital investment and K is the existing capital stock; and a measure of human capital, the logarithm of the average years of educa- tion, ln(E). Our data on investment rates and education levels are for 1990 and 1985, respectively, and come from the World Bank Growth Data used by, for example, Barro and Lee (1996).
To these we add C, a variable or set of variables describing the capital controlled by different types of billionaires in each country. We use the wealth and the sources of wealth of each country’s billionaires to construct these variables. An alternative approach would be to use wealth Gini co- efficients. However, our research question is more about the type of wealthy people in a country than about the degree of wealth concentration per se. Another alternative approach would be based on the fractional ownership in each country’s largest corporations. But this approach focuses on the billionaire’s equity stakes as a fraction of firm value, rather than on their wealth as a fraction of the country’s wealth, and so is less useful for our purposes.
We consider two basic types of billionaires, based on Forbes magazine’s description of each billionaire and on additional information from Who Z Who. The first is self-made business entrepreneurs. These are people who built huge fortunes from nothing or virtually nothing. We define B to be the total wealth of a country’s self-made business entrepreneurs and scale this by GDP, denoted Z: We thus add BIY to the regression described in (1) as the first component of C.
The second sort of billionaire we call heirs. We define their total wealth in each country to be H and again scale by GDP, thus adding HIY as the second component of C in the regression described in (1). We have several alternative measures of this variable. We divide billionaires who are not self-made into different categories. Some are clearly not billionaires be- cause of their entrepreneurial talents. These include heirs to great business fortunes and political dynasties. These we call heirs. Other billionaires have inherited substantial fortunes but greatly increased them. We call them heir-entrepreneurs. The remaining we classify as probably heirs. This category includes fortunes that appear to be controlled jointly by self- made billionaires and their heirs. This wealth is presumably in the process of being transferred across generations. It also includes some fortunes that we are simply unable to classify clearly because of inadequate documen- tation.
In table 1 1.2, we consider alternative measures of heir fortunes that in- clude different subsets of the categories given above. Our first measure, H,, is the wealth of heirs to business fortunes and political dynasties. The second, H,, is HI plus the wealth of probably heirs. The third measure, H3, is H , plus heir-entrepreneurs. Finally, H, is H I plus probably heirs and heir-entrepreneurs. The measures H,-H, replicate HI-H4, respectively, but
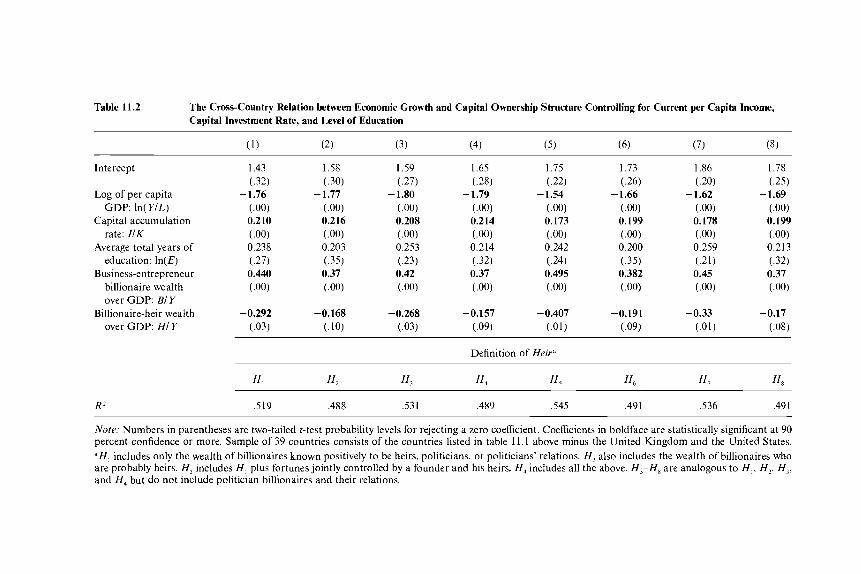
Table 11.2 The Cross-country Relation between Economic Growth and Capital Ownership Structure Controlling for Current per Capita Income, Capital Investment Rate, and Level of Education
lnterccpt
Log of per capita GDP: In( Y I L )
Capital accumulation rate: IIK
Average total years of education: In(E)
Business-entrepreneur billionaire wealth over GDP: BIY
Billionaire-heir wealth over GDP: H I Y
I .43 (.32)
-1.76 (.OO) 0.210 (.OO) 0.238 (.27) 0.440 (.00)
-0.292 ~ 0 3 )
1.58 (.30)
- 1.77 ( .OW 0.216 (.OO) 0.203 (.35) 0.37
-0.268 (.03)
1.65 (.28)
- 1.79 (.OO) 0.214 (.OO) 0.214 (.32) 0.37 (.OO)
-0.157 (.09)
1.75 (.22)
-1.54 (.OO) 0.173 (.OO) 0.242 (.24) 0.495 (.OW
1.73 (.26)
-1.66 (.OO) 0.199 (.OO) 0.200 (.35) 0.382 (.OO)
-0.191 ~ 0 9 )
-0.33
Definition of Heir“
R2 ,519 ,488 ,531 ,489 ,545 .49 1 ,536 .49 1
Note: Numbers in parentheses are two-tailed t-test probability levels for rejecting a zero coeficient. Coefficients in boldface are statistically significant at 90 percent confidence or more. Sample of 39 countries consists of the countries listed in table 1 1.1 above minus the United Kingdom and the United States. “ H , includes only the wealth of billionaires known positively to be heirs, politicians, or politicians’ relations. H 2 also includes the wealth of billionaires who are probably heirs. H , includes HI , plus fortunes jointly controlled by a founder and his heirs. ti, includes all the above. H,-H, are analogous to HI, H z , H I , and H , but d o not include politician billionaires and their relations.

Inherited Wealth, Corporate Control, and Economic Growth 327
exclude political dynasties. All eight measures give remarkably similar re- sults.2 In subsequent tables, we measure heir billionaire wealth by H,, for- tunes clearly due to either inheritances or political dynasties. We use this measure to minimize the likelihood of contaminating our heir wealth vari- able with any fortunes that might be controlled by business entrepreneurs. However, this choice turns out to be unimportant: all the analyses in sub- sequent tables are qualitatively similar if other definitions of heir are used.
Table 11.2 confirms previous findings that countries tend to have higher rates of economic growth if their initial per capita GDP is low, if their capital accumulation rates are high, and (more tenuously) if their general level of education is high. Our added variables reveal a clear pattern. Eco- nomic growth is positively associated with self-made billionaire wealth but negatively associated with billionaire heir wealth. We emphasize that this is after controlling for per capita GDP, the rate of capital accumulation, and education.
The effect is economically, as well as statistically, significant. The aver- age rate of GDP growth in our sample is 4.16 percent per year. Since the coefficient on heir billionaire wealth over GDP in the first regression is - .292, going from zero billionaire heir wealth to the seventy-fifth percen- tile, 3.293 percent of GDP, is associated with a slowdown of 0.962 percent per year, and heir wealth at the ninetieth percentile, 6.667 percent, corre- sponds to a growth slowdown of 1.95 percent per year.
11.2.2 Further Exploration
In the following sections, we consider different possible mechanisms by which heir wealth might affect economic growth and consider whether each, in turn, might be empirically rejected. To explore their empirical validity, we utilize firm-level data for Canada. That country is ideal for our purposes because large Canadian firms exhibit a wide range of ownership structures, with enough firms in each category to allow statistical analyses. Firm-level accounting data in Canada are also readily available and reli- able. Finally, the United States and Canada are, in most aspects, very simi- lar countries. Although natural resources account for a larger share of Canada’s GDP, its resources industries and those of the United States are not dissimilar. The two economies have broadly similar factor endow- ments and employ virtually identical technology and human capital in similar institutional frameworks. Their corporate sectors differ markedly only in that the ownership structures of their largest firms are radically different. Thus, the U.S. economy provides a useful benchmark.
Table 11.3 displays the ownership structure of the 246 publicly traded firms in the list of the top 500 Canadian firms by sales in 1988, as reported
2. Heir-entrepreneur wealth, probably heir wealth, and political dynasty wealth, treated as separate right-hand-side variables, resemble heir wealth.

328 Randall K. Morck, David A. Stangeland, and Bernard Yeung
Table 11.3 Publicly Traded Firms among the Largest 500 Canadian Firms by Sales, by Type of Controlling Shareholder
Type of Controlling Shareholder*
Average Fraction of Firmsh Salesc Total Sales
Heir, direct or via pyramid Business entrepreneur, direct or via
No controlling shareholder Controlled by widely held Canadian
parent, direct or via pyramid Other individual or family, type
unclear Financial institution or investment
fund Foreign parent firm, direct or via
pyramid Government Worker ownership
Total
pyramid
44
27 53
14
29
6
49 23
1
1.15
0.42 1.37
1.03
0.32
0.46
1.34 1.02 0.16
0.20
0.05 0.29
0.06
0.04
0.01
0.26 0.09 0.00
246d 1.02 1 .oo
Note: Sample is firms in the 1988 Financial Post 500 for which accounting and ownership data are available. dA controlling shareholder, under Canadian law, is anyone who controls more than 20 per- cent voting powers. Where there is more than one controlling shareholder, the firm is classi- fied according to the type of the largest shareholder. hCanadian reporting requirements allow consolidated financial reports for corporate groups. Consequently, the number of firms is understated. <The number of firms and average sales are for those firms with reported sales in 1988 and accounting data for the variables used in tables 11.4 and 11.5. (Firms not reporting firm age are included.) Sales are for 1988 and are in billions of U.S. dollars. dOf the 500 largest firms, 254 are privately held, so no details of the ownership structure are available.
in the Financial Post Surveys for that year. (We use 1988 data here because free trade with the United States changed the corporate landscape subse- quent to that. We return to these changes below.) We follow Canadian corporate governance laws and define a controlling shareholder as anyone with a stake that bestows 20 percent voting power or more. This is a re- strictive definition of control by U.S. standards, where much smaller stakes are thought sufficient to allow control.
Only 53 of the largest 246 public Canadian firms are widely held by this definition. This figure rises to 67 if publicly traded subsidiaries, subsidiar- ies of subsidiaries, and so on of widely held firms are added. The average stake of the largest shareholder is about 50 p e r ~ e n t . ~ This contrasts starkly
3. The degree of concentration of Canadian ownership is greatly understated because the other 254 firms in the top 500 list are privately held and so must be dropped from our sample for lack of data.

Inherited Wealth, Corporate Control, and Economic Growth 329
with the United States, where Demsetz and Lehn (1 985) report that the com- bined holdings of the largest five shareholders average less than 25 percent.
We proceed by dissecting Canadian firm-level data to see whether our explanations apply to that country. Obviously, firm-level analyses in other countries are needed before reliable generalizations are warranted. We also recognize that this leaves the issue of causality open, as future researchers may consider other mechanisms than those that we have evaluated.
11.3 Inherited Wealth and Corporate Control
In the United States, firms whose boards are dominated by a controlling family are beginning to attract the attention of corporate-governance crit- ics. Referring to family-dominated public companies, Jon Lukomnik, the deputy controller for pensions of New York City, commented: “When you look at really abusive companies, you tend to find them” (“Boards Cut Out of Family Trees” 1996). U.S. family firms recently targeted by share- holder rights activists include Ethyl Corporation, where chairman and CEO Bruce Gottwald’s 17.7 percent stake brings directorships for his two sons, a brother, and a nephew. Archer Daniel Midlands, Paccar Inc., the New York Times, and the Gap have attracted similar attention (“Boards Cut Out of Family Trees” 1996).
Stulz (1988) and Shleifer and Vishny (1989) develop theoretical frame- works describing how corporate governance might suffer when U.S. firms are unable to throw off substandard but entrenched managers. In this sec- tion, we argue that such problems may be many times worse in other econ- omies.
11.3.1
Outside the United States, moneyed families often leverage their wealth into control over corporate assets worth far more. La Porta, Lopez-de- Silanes, and Shleifer (1999) show that this is achieved primarily through the use of controlpyrumids. An example of a control pyramid is the group of firms controlled by the Canadian billionaires Edward and Peter Bronf- man. They own Broncorp Inc., which controls HIL Corporation with a 19.6 percent equity stake. HIL owns 97 percent of Edper Resources, which owns 60 percent of Brascan Holdings, which owns 5.1 percent of Brascan, which owns 49.9 percent of Braspower Holdings, which owns 49.3 percent of Great Lakes Power Inc., which owns 100 percent of First Toronto In- vestments, which owns 25 percent of Trilon Holdings, which owns 64.5 percent of Trilon Financial, which owns 4 1.4 percent of Gentra, which owns 31.9 percent of Imperial Windsor Group (Directory of Inter- Corporate Ownership, various issues). The Bronfmans’ actual equity stake in Imperial Windsor works out to 0.03 percent, yet they have full control of it and of all the other firms in the pyramid above and beside it. This is
The Divergence of Interests in Control Pyramids
330 Randall K. Morck, David A. Stangeland, and Bernard Yeung
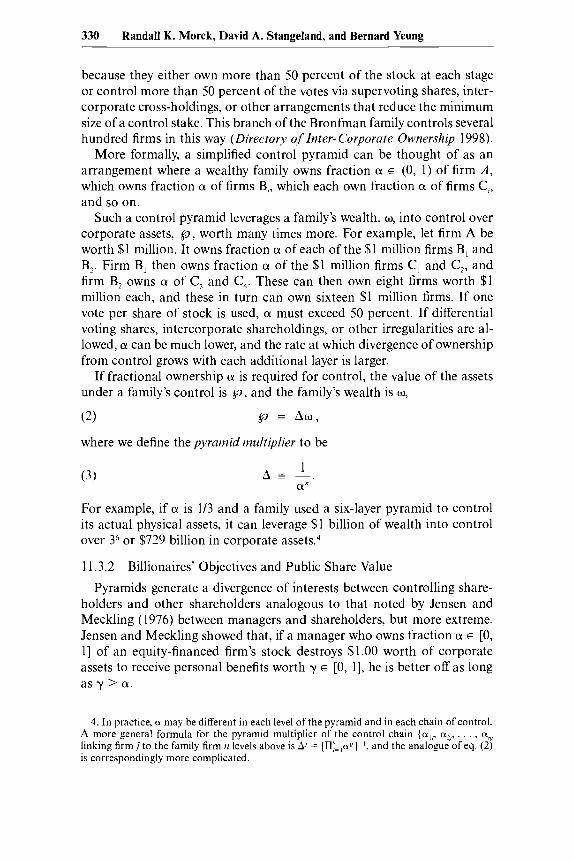
because they either own more than 50 percent of the stock at each stage or control more than 50 percent of the votes via supervoting shares, inter- corporate cross-holdings, or other arrangements that reduce the minimum size of a control stake. This branch of the Bronfman family controls several hundred firms in this way (Directory of Inter-Corporate Ownership 1998).
More formally, a simplified control pyramid can be thought of as an arrangement where a wealthy family owns fraction a E (0, 1) of firm A , which owns fraction a of firms B,, which each own fraction a of firms C,, and so on.
Such a control pyramid leverages a family’s wealth, w, into control over corporate assets, p, worth many times more. For example, let firm A be worth $1 million. It owns fraction a of each of the $1 million firms B, and B2. Firm B, then owns fraction a of the $1 million firms C, and C,, and firm B, owns a of C, and C,. These can then own eight firms worth $1 million each, and these in turn can own sixteen $1 million firms. If one vote per share of stock is used, a must exceed 50 percent. If differential voting shares, intercorporate shareholdings, or other irregularities are al- lowed, a can be much lower, and the rate at which divergence of ownership from control grows with each additional layer is larger.
If fractional ownership a is required for control, the value of the assets under a family’s control is p, and the family’s wealth is w,
(2) 63 = A w ,
where we define the pyramid multiplier to be
(3) 1 a”
A s -.
For example, if a is 1/3 and a family used a six-layer pyramid to control its actual physical assets, it can leverage $1 billion of wealth into control over 36 or $729 billion in corporate asset^.^
11.3.2 Billionaires’ Objectives and Public Share Value
Pyramids generate a divergence of interests between controlling share- holders and other shareholders analogous to that noted by Jensen and Meckling (1 976) between managers and shareholders, but more extreme. Jensen and Meckling showed that, if a manager who owns fraction a E [0, 13 of an equity-financed firm’s stock destroys $1 .OO worth of corporate assets to receive personal benefits worth y E [0, 11, he is better off as long as y > a.
4. In practice, a may be different in each level of the pyramid and in each chain of control. A more general formula for the pyramid multiplier of the control chain {a,,, a2,, . . . , an, linking firm j to the family firm n levels above is A’ = [Il:=,a”]-’, and the analogue of eq. (2) is correspondingly more complicated.

Inherited Wealth, Corporate Control, and Economic Growth 331
In a pyramid, the divergence between control and actual ownership is potentially much worse than in Jensen and Meckling’s example. The diver- gence is essentially compounded once for each pyramid level that sepa- rates the firm in question from the family firm that holds ultimate control. The family’s welfare is advanced when it spends $1 .OO of corporate wealth in a pyramid company it controls to gain y < 1 in personal benefits if y > a”. Again, differential voting shares, golden shares, and other devices allow control to be exercised with a << 50 percent at each level, so the divergence of ownership from control rights can be even more extreme. Since a” approaches zero as n becomes large, value-destroying consump- tion of corporate resources becomes more attractive as the number of lev- els in the control pyramid rises5
Examples of such consumption of corporate resources are abundant. Controlling families may confiscate corporate property for their personal use. They may interfere in corporate decision making to benefit themselves or their friends, to advance pet projects, or to push political goals. They may use transfer pricing to shift income from publicly traded firms they control to private firms they own outright, from firms low in control pyra- mids to firms near their apexes, or from firms they control via supervoting shares to firms in which they actually own a majority of the stock. Such transfer pricing can be accomplished via payments for intermediate goods, the private placement of one firm’s securities with another, royalty pay- ments for patent or brand-name use, captive insurance subsidiaries, or any number of other channels.
In some cases, the family patriarch may use corporate resources to ad- vance a particular political or social view. For example, when the Wallen- berg family’s top professional manager, Percy Barnevik, told a New York Times reporter, “If we can’t get value, we will sell out,” indicating that weak Wallenberg firms might be sold, a surprised Peter Wallenberg clari- fied, “We would go to very great lengths to resuscitate a company, What- ever he might have said is still a matter of interpretation.” In the same article, Anders Scharp, vice-chairman of the Wallenberg flagship, Inves- tor’s AP, quipped, “It’s family values versus shareholder values” (Latour and Steinmetz 1998). Although Peter Wallenberg’s views may reflect popu- lar opinion in Sweden, this need not always be so. If the family patriarch uses corporate resources he controls, but does not fully own, to pursue an agenda with which shareholders do not agree, a misallocation of resources can result. The family patriarch does not bear the full economic costs of his agenda, but the shareholders and the society at large do.
The potential for such prima facie misallocation is a central concern of
5. For more formal and complete models of corporate pyramids, see Bebchuk and Zingales (chap. 2 in this volume), Bebchuk, Kraakman, and Triantis (chap. 10 in this volume), and Wolfenzohn (1998).
332 Randall K. Morck, David A. Stangeland, and Bernard Yeung
corporate-governance law outside the United States (see Daniels and Morck 1995). For example, Canadian corporate-governance law contains strict regulations about the disclosure of “related-party transactions” and about minority shareholders’ rights. Officers and directors are expected to treat all shareholders equally, rather than simply safeguard the sharehold- ers’ presumably identical interests in value maximization, as in the United States. However, a recent study of Canadian corporate governance con- cluded that these protective measures are inadequate (see Daniels and Morck 1995).6
11.3.3 Entrenched Family Control
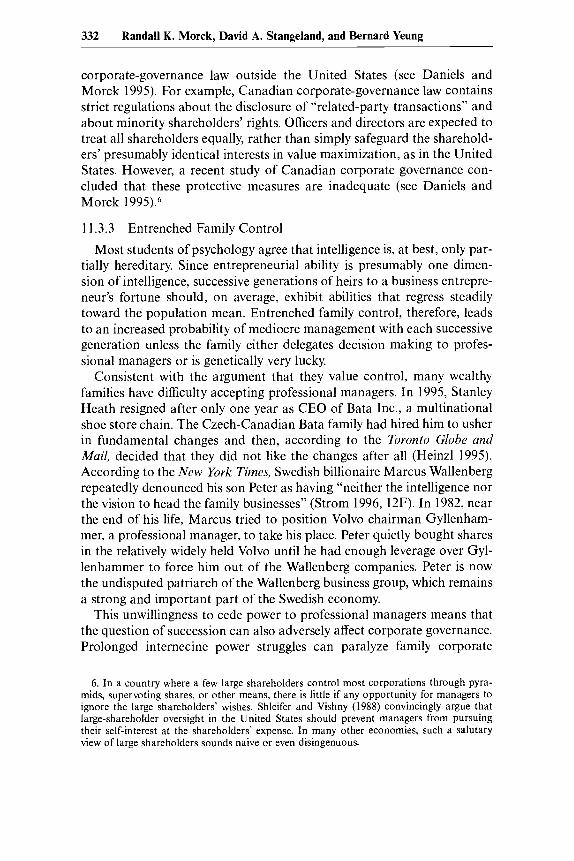
Most students of psychology agree that intelligence is, at best, only par- tially hereditary. Since entrepreneurial ability is presumably one dimen- sion of intelligence, successive generations of heirs to a business entrepre- neur’s fortune should, on average, exhibit abilities that regress steadily toward the population mean. Entrenched family control, therefore, leads to an increased probability of mediocre management with each successive generation unless the family either delegates decision making to profes- sional managers or is genetically very lucky.
Consistent with the argument that they value control, many wealthy families have difficulty accepting professional managers. In 1995, Stanley Heath resigned after only one year as CEO of Bata Inc., a multinational shoe store chain. The Czech-Canadian Bata family had hired him to usher in fundamental changes and then, according to the Toronto Globe and Mail, decided that they did not like the changes after all (Heinzl 1995). According to the New York Times, Swedish billionaire Marcus Wallenberg repeatedly denounced his son Peter as having “neither the intelligence nor the vision to head the family businesses” (Strom 1996, 12F). In 1982, near the end of his life, Marcus tried to position Volvo chairman Gyllenham- mer, a professional manager, to take his place. Peter quietly bought shares in the relatively widely held Volvo until he had enough leverage over Gyl- lenhammer to force him out of the Wallenberg companies. Peter is now the undisputed patriarch of the Wallenberg business group, which remains a strong and important part of the Swedish economy.
This unwillingness to cede power to professional managers means that the question of succession can also adversely affect corporate governance. Prolonged internecine power struggles can paralyze family corporate
6 . In a country where a few large shareholders control most corporations through pyra- mids, supervoting shares, or other means, there is little if any opportunity for managers to ignore the large shareholders’ wishes. Shleifer and Vishny (1988) convincingly argue that large-shareholder oversight in the United States should prevent managers from pursuing their self-interest at the shareholders’ expense. In many other economies, such a salutary view of large shareholders sounds naive or even disingenuous.

Inherited Wealth, Corporate Control, and Economic Growth 333
groups. For example, the Canadian McCain corporate group was maimed by a festering dispute between the ruling brothers, Wallace and Harri- son, over whose son should succeed them (McLaughlin 1995a). In Ecua- dor, deceased banana billionaire “Lucho” Naboa’s second wife, Mercedes, and his second son from his first marriage, Alvaro, fought an unseemly struggle for control of his corporate group. Apparently, someone even hired thugs to steal copies of the will hidden in New York.’ Meanwhile, the family’s firms drifted (De Cordoba 1995). Different families have at- tempted to avoid such problems in different ways. The Eaton family of Canada defused succession problems by bringing increasing numbers of Eatons into managerial positions with each successive generation. The family’s flagship company is currently in bankruptcy. The Bronfman fam- ily has used a more Darwinian approach, letting contending heirs compete to be named dauphin. Having no immediate successor can be as big a problem as is too many possible successors. When patriarch Ted Rogers of Rogers Communications retired in 1994, his children Lisa, then twenty- seven, and Edward, twenty-six, were regarded as heirs apparent who would take control after another ten years or so of training. Interim man- agers were unable to exercise leadership in this situation, and Ted Rogers returned despite triple bypass and eye surgery (McLaughlin 1995b).
Many aging founders have difficulty even contemplating their retire- ment, let alone readying their corporate groups for professional managers or for the next generation of the family. Despite a public declaration of his intention to retire at sixty-five, Paul Desmarais, patriarch of Power Corporation, the key company of one of Canada’s largest control pyra- mids, remains firmly in control. The Financial Post reports an anonymous possible successor as saying, “I don’t know how to get rid of dad’s old boys. They don’t understand present competitive life, customer service, and just-in-time delivery. They’re just sort of performing an activity, like having coffee every morning. But I can’t do anything about it because dad won’t let me fire them” (McLaughlin 1995a, 14-15).
All these examples are qualitatively similar to entrenched management in U.S. firms with insider ownership above a certain threshold, as modeled by Stulz (1988) and Shleifer and Vishny (1989). That is, the family-ap- pointed managers of firms in control pyramids are not vulnerable to re- moval by public shareholders through hostile takeovers, proxy contests, or other mechanisms as only a minority of the stock of any individual firm is in public hands. The difference is that the entrenchment of these family dy- nasties in other countries is hereditary and affects the dozens or hundreds of companies in family-controlled pyramids.
7. Who hired the thugs is unclear, although the Wall Srreet Journal (De Cordoba 1995) reported that the police suspected a family power play.

334 Randall K. Morck, David A. Stangeland, and Bernard Yeung
11.3.4 Family Control and Firm Performance: The Worst of Both Worlds?
In the United States, many studies have found that divergence-of- interests problems, like those described in section 1 1.3.2, reduce share- holder value for very widely held firms while management-entrenchment problems, like those described in section 11.3.3, reduce shareholder value for relatively closely held firms (see, among many others, Stulz 1988; Mc- Connell and Servaes 1990; and Morck et al. 1988). We have shown how pyramids can magnify the divergence of interests between controlling families and the public shareholders of pyramid companies. We have also argued that pyramids entrench hereditary management, regardless of competence, in more complete control over more corporate assets than is possible with the same family wealth in the United States.* Firms in pyra- mids are thus simultaneously potentially subject to the worst of both prob- lems in terms of public-shareholder value.9
Of course, if the family provides superior management in firms it con- trols, this may negate all the problems outlined above. Khanna and Palepu (1999, chap. 9 in this volume) argue that skilled corporate management is scarce in India and that family corporate groups organized as pyramids are, on net, beneficial because they expand the scope to which the families' management skills are applied. This may be true in many cases, includ- ing the Bronfman, Wallenberg, and other corporate groups mentioned above.'" Nonetheless, pyramids and the leverage that they introduce be- tween ownership and control unquestionably create latitude for immense corporate-governance problems.
To investigate these issues, tables 11.4 and 11.5 compare the perfor- mance of Canadian firms according to the type of controlling shareholder they have. The categories of controlling shareholder that we consider are analogous to those covered in the previous section. Firms in pyramids are defined as having the same controlling shareholder as the firm at the pyramid's apex. We divide firms into the following categories: Firms with-
8. Control pyramids are essentially unknown in the United States. We suspect that this is because the United States imposes double taxation on virtually all dividends. In contrast, Canada and other countries with which we are familiar tax dividends paid to people, leaving most intercorporate dividends tax-free for the recipient firm. Clearly, pyramid control be- comes prohibitively expensive when intercorporate dividends are taxed. Public finance and tax economists seem not to have appreciated the corporate-governance implications of dividend-taxation policies.
9. Note that some discussions of managerial entrenchment assume that managers gain pure utility from control. This assumption is not necessary. If rent-seeking power is propor- tional to assets controlled rather than wealth and rent seeking allows those with control to pursue their self-interest, managers and large shareholders should value control as a means for increasing their consumption.
10. Daniels, Morck, and Stangeland (1995) find that Bronfman pyramid firms performed no worse than other similar firms but appear to follow higher-risk strategies.

Table 11.4 Relation of Controlling Shareholder’s Category to Performance of Large Canadian Firms, Based on 1984-89 Annual Reports Controlling for Firm Age and Size (industry benchmarks are 3digit US. industry averages)
Dependent Variable Controlling Shareholders’ Operating Income over Assets Operating Income over Sales Sales Growth Employees Growth Categories Compared 1984-89 Mean 1984-89 Median 1984-89 Mean 1984-89 Median 1984-89 Mean 198489 Median 1984-89 Mean 1984-89 Median
Heir minus business -.0113 -.0156 -.0131 -.0188 -.0299 -.0274 -.OM -.03M -.115 -.0794 -.0661 -.M30 -285 -.0526 -265 -219 entrepreneur (.56) (.32) (S2) (.26) (.OX) (.I31 (.05) (.07) (.lo) (.12) ( .IS) (S4) (.06) ( .85) (.08) (.05)
Heir minus widely held -.00915 -.0192 -.OM98 -.0150 -.OM7 -.0443 -.05820 -3426 -.W% -.0938 -.0663 -.0685 -.0112 ,221 .M78 .0622 1521 (701 1521 ~701 1521 1701 ~521 ~701 ~521 1701 1521 1701 1521 POI 1521 1701
(~6) (.lo) (.76) (.oil (.02) (.ni) (.02) ( . I I ) (.ox) (.09) (.lo) (.88) ~22) ~ 4 3 ) (.17)
1741 [ lol l 1741 [loll 1741 [I011 1741 [loll [74] [I011 [74] [loll (741 [ IOI] [74] [loll Heir minus all other domestic -.00918 -.OM1 -.00223 -.0180 -.Om -.Om -.0342 -.0274 -.0859 -.0666 -.0525 -.0330 -.I28 ,144 -.0334 -.0125
private-sector firms (S3) (.05) ( 3 5 ) (.08) (.05) (.05) (.06) (.07) (.29) (.33) (.13) (.27) (.38) (.24) (.56) (30)
Businessentrepreneur minus -.00960 -.00934 -.OM54 -.Gill88 -.0332 -.OW -.0317 -.0193 -.0101 -.M54 -.0378 -.0600 .184 .180 233 247 widely held ( S 5 ) (.47) (.78) (39) (.16) (.20) (.20) (.41) (.89) (.57) (A) (.31) (.I2) (.09) (.03) (.01)
1681 [831 1681 1831 WI 1831 (681 1831 [681 [831 [681 I831 1681 1831 1681 [831 Businessentrepreneur minus -.00611 -.00805 ,00271 .00161 -.00935 -.00040 - 00128 -.0112 -.0101 -.OIM -.00813 -.00962 ,147 ,141 ,233 2 2 5
all other domestic private- (.71) (.61) (34) (.90) (54) (.98) (.95) (S6) (-91) (.90) (33) (.80) (.37) (.36) (.@I) (.MI)
Pyramids included No Yes No Yes No Yes No Yes No Yes No Yes No Yes No Yes
[2oo] [ZOO] [200] [Zoo] [2oo] [Zoo] [200] [200] [200] [ZOO] [200] [200] [Zoo] [Zoo] 1200) [200]
sector firms [Zoo] [2oo] [2W] [ZOO] [2oo] [2oo] [Zoo] [200] [200] [200] [2oo] [2oo] [200] [2oo] [ZOO] [2W]
Nore: The numbers shown are coefficients on dummy variables 8, (one if the firm is in subsample I , zero if it is in subsample 2) in ordinary least squares regressions of the form p, - 7 = p,, + p, log(sales,) + p, log(age,) + p,S, estimated across the relevant two subsamples. Boldface type indicates significance at the 10 percent level in a one-tailed I-test. Numbers in parentheses are two-tailed I-test probability levels. Numbers in brackets are sample sizes.

Table 11.5 Performance Differences for Large Canadian Firms by Controlling Shareholder Category, Performance Data from 1984-89 Annual Reports (benchmark for each Canadian firm is a U.S. firm matched by size, age, and 3-digit industry)
Controlling Shareholders' Categories Compared
Dependent Variable
Operating Income over Assets Operating Income over Sales Sales Growth Employees Growth
1984-89 Mean 1984-89 Median 1984-89 Mean 1984-89 Median 1984-89 Mean 1984 89 Median 1984-89 Mean 1984-89 Median
Heir minus business entrepreneur
Heir minus widely held
Heir minus all other domestic private-sector firms
Business entrepreneur minus widely held
Business entrepreneur minus all other domestic private- sector firms
Pyramids included
Nore: The numbers shown are coefficients on dummy variables 6 , (one if the firm is in subsample I , zero if it is in suhsample 2) in Ordinary least squares regressions of the form p , - j = @, + p, log(sales,) + p, log(age,) + p,S, estimated across the relevant two subsamples. Boldface type indicates significance at the 10 percent level in a one-tailed r-test. Numbers in parentheses are two-tailed 1-test probability levels. Numbers in brackets are sample sizes.
Inherited Wealth, Corporate Control, and Economic Growth 337
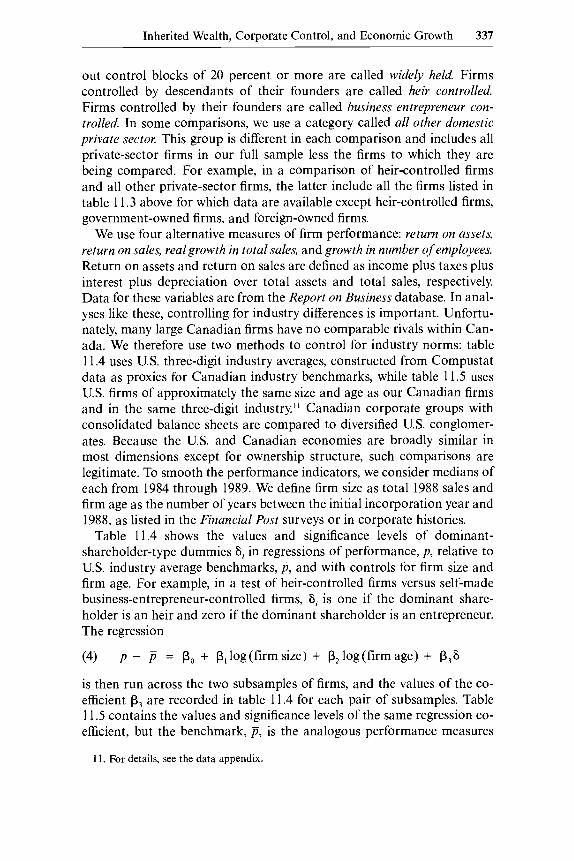
out control blocks of 20 percent or more are called widely held. Firms controlled by descendants of their founders are called heir controlled. Firms controlled by their founders are called business entrepreneur con- trolled. In some comparisons, we use a category called all other domestic private sector. This group is different in each comparison and includes all private-sector firms in our full sample less the firms to which they are being compared. For example, in a comparison of heir-controlled firms and all other private-sector firms, the latter include all the firms listed in table 1 1.3 above for which data are available except heir-controlled firms, government-owned firms, and foreign-owned firms.
We use four alternative measures of firm performance: return on assets, return on sales, real growth in total sales, and growth in number of employees. Return on assets and return on sales are defined as income plus taxes plus interest plus depreciation over total assets and total sales, respectively. Data for these variables are from the Report on Business database. In anal- yses like these, controlling for industry differences is important. Unfortu- nately, many large Canadian firms have no comparable rivals within Can- ada. We therefore use two methods to control for industry norms: table 1 1.4 uses US. three-digit industry averages, constructed from Compustat data as proxies for Canadian industry benchmarks, while table 11.5 uses U.S. firms of approximately the same size and age as our Canadian firms and in the same three-digit industry.ll Canadian corporate groups with consolidated balance sheets are compared to diversified U.S. conglomer- ates. Because the US. and Canadian economies are broadly similar in most dimensions except for ownership structure, such comparisons are legitimate. To smooth the performance indicators, we consider medians of each from 1984 through 1989. We define firm size as total 1988 sales and firm age as the number of years between the initial incorporation year and 1988, as listed in the Financial Post surveys or in corporate histories.
Table 11.4 shows the values and significance levels of dominant- shareholder-type dummies Si in regressions of performance, p, relative to U.S. industry average benchmarks, p, and with controls for firm size and firm age. For example, in a test of heir-controlled firms versus self-made business-entrepreneur-controlled firms, S j is one if the dominant share- holder is an heir and zero if the dominant shareholder is an entrepreneur. The regression
(4) p - p = p, + p, log(firm size) + p, log(firm age) + P, 6
is then run across the two subsamples of firms, and the values of the co- efficient p, are recorded in table 11.4 for each pair of subsamples. Table 11.5 contains the values and significance levels of the same regression co- efficient, but the benchmark, p , is the analogous performance measures
11. For details, see the data appendix

338 Randall K. Morck, David A. Stangeland, and Bernard Yeung
for a U.S. firm in the same three-digit industry and of the same size and age as the Canadian firm in question.I2
We can summarize the pattern findings in tables 1 1.4 and 1 1.5 as fol- lows. Control by heirs is associated with lower returns on sales and assets and with growth that is less than or equal to that observed in other compa- rable firms.I3 In contrast, founder control is associated with earnings lower than those in widely held firms but higher than those in heir-controlled firms and with growth greater than or equal to that of widely held firms and that of other firms in general. The pattern of signs and significance levels is similar regardless of whether we include firms in control pyramids or consider only firms directly owned by the shareholders in question. This evidence is consistent with the hypothesis that widespread corporate control by heirs is, at least partly, responsible for the reduced economic growth of countries with large wealthholdings by heirs shown in table 11.2. It does not, however, substantiate our concern that control pyramids might worsen the damage.
11.4 Inherited Wealth and Capital Market Power
In some countries, control pyramids and other mechanisms give billion- aire families control over substantial fractions of their country’s capital assets. This could conceivably translate into monopoly and monopsony market power in their domestic capital markets.
1 1.4.1
An efficient microeconomic allocation of capital requires that the risk- adjusted cost of capital be the same for all firms. The legal, regulatory, and institutional structures of many countries arguably channel capital to certain firms and limit other firms’ access to capital.
First, many countries’ stock market regulations are such that entrepre- neurs find equity initial public offerings (IPOs) unattractive sources of capital (La Porta et al. 1997). Private equity financing in the form of ven-
Limited Sources of Capital for Entrepreneurs
12. We continue to include age and size controls in table 11.5 because the relation between relative performance and ownership may be different for firms of different sizes and ages. In fact, the logarithm of firm age retains its significance in many of the regressions in table 11.5.
13. We need to be careful about our inference that heir-controlled firms have lower average returns on assets. Research-and-development (R&D) spending is a minus item in the calcula- tion of after-tax operating income since it is part of general, sales, and administrative ex- penses, but it does not enter into the calculation of total assets since it is expensed rather than depreciated. A precise adjustment is difficult since the disclosure of R&D is optional under Canadian generally accepted accounting policy. However, only the numerator of the return-on-sales figures should be affected by this problem. As a rough check of whether R&D is biasing our results, we first estimated the relation of reported R&D to heir owner- ship. R&D is negatively correlated with heir ownership. If actual R&D mirrors reported numbers, this effect strengthens, rather than weakens, our return on sales-and-assets find- ings.

Inherited Wealth, Corporate Control, and Economic Growth 339
ture capital is primarily a U.S. phenomenon. Although other countries are attempting to foster venture capital financing, their scale remains limited (see “Adventures with Capital” 1997; “Finance and Economics” 1998). In Canada, the federal government has been providing generous tax incen- tives to create a venture capital industry controlled by labor ~ n i o n s . ’ ~ In both Europe and Canada, government-run funds play large roles in the venture capital business, but these initiatives tend to confuse venture capi- tal financing with subsidies to depressed regional economies (see Murray 1998; and Best and Mitra 1997).
Second, entrepreneurs’ access to debt financing is often limited. Public- debt issues are unavailable to small, start-up firms. The junk bond industry in the United States changed this, starting in the 1980s, but it has yet to spread outside that country in any significant way (see Hagger 1997). Banks in most countries prefer to lend to large, established borrows. Al- though the large Canadian banks have recently begun to boast of their lending to small businesses, they still require substantial collateralizable assets-a rarity among entrepreneurial firms whose main asset is usually the intangible ideas of the entrepreneur (MacIntosh 1994). If billionaire families either control banks outright or influence them through political rent seeking more effectively than can entrepreneurs or the representatives of widely held firms’ shareholders, a redirection of capital might occur.1s
Third, government industrial policies in many countries direct capital toward large, established businesses. Plausibly, these firms are more able to lobby for subsidies. Their stability is also more likely to be the object of lobbying by organized labor. For example, Beason and Weinstein (1 996) document that the (in)famous Japanese postwar industrial policy, by and large, subsidized unprofitable established industries. Also, until very re- cently, the Korean government had an explicit policy of orchestrating gen- erous low-cost bank loans to large family-controlled chaebol corporate groups. The result was an average debt-to-equity ratio of 4.0 in 1996 and relentless capital expenditure growth by these firms. The same year, chaebol firms averaged a 1 percent return on equity.16 A key part of the IMF’s on- going criticism of Asian “crony capitalism” is that established firms have too ready access to capital while new entrants cannot raise money locally.
Finally, firms in many countries have been prevented from obtaining foreign capital by restrictions on inward investment flows. Explicit policies to deter both foreign direct investment (FDI) and inward foreign portfolio investment were especially common in emerging markets (Kim and Singal
14. Management-expense ratios in these funds can reach 10 percent per year, and their
15. In sec. 11.6 below, we argue that such a differential investment in rent seeking might
16. For a detailed financial analysis of Korean public firms in the 1990s, see Kim, Kim,
voting structures lock in union control (see Austin 1996).
well exist.
and Yi (1998).

340 Randall K. Morck, David A. Stangeland, and Bernard Yeung
1993). Interestingly, many of the countries in our sample with the highest heir-controlled wealth had explicit share classes or industry sectors that were unavailable to foreigners, ceilings on foreign shareholding, or manda- tory long holding periods for foreign investors, at least until quite recently. These include Argentina, Chile, Colombia, Greece, Indonesia, Korea, Ma- laysia, the Philippines, and Thailand. Except for closed-end funds, Taiwan’s stock market was closed until 1991, after which foreigners were allowed to invest up to a 10 percent ceiling. This was only raised to 15 percent in 1995. Even advanced countries have regulations hindering foreign portfolio in- vestment. For example, Japanese firms could not issue bonds to foreigners until quite recently. Even Canada, under Pierre Trudeau, made local firms’ access to FDI contingent on bureaucratic approval.
These distortions might lead to more aggressive use of capital by family pyramid firms than by other firms. The absence of a well-developed ven- ture capital market impedes entrepreneurial firms but not established fam- ily firms. If billionaire families are better at lobbying for subsidies than en- trepreneurs or representatives of the shareholders of widely held firms, a differential access to capital might also ensue. Also, if families are overly optimistic about their management abilities, the greater divergence of in- terests and entrenchment problems in pyramid firms (discussed in sec. 11.3 above) might allow them to overexpand more aggressively than would be prudent for a widely held firm. If the initial complement of large firms are members of family pyramids, barriers to capital inflow arguably lock in control by those firms, preventing entrepreneurial firms and widely held firms from rising to challenge them.
1 1.4.2 Limited Investment Opportunities for Savers
Economic efficiency also requires free competition for savers’ money. Again, the legal, regulatory, and institutional structures of many countries severely restrict savers’ portfolio choices, or did until very recently.
Given the prevalence of billionaire control, savers in many countries have little choice but to hold the stocks of billionaire-controlled compa- nies in their portfolios. These problems afflict investors in most countries other than the United States and the United Kingdom. Even in Canada, only fifty-three of the top 500 firms are widely held (see table 11.3 above). Since these do not span all the industries in the Canadian economy, a di- versified portfolio of large widely held Canadian firms is not possible.
The same lack of choice for savers applies to debt. Until recently, Japa- nese corporate bonds were unavailable to domestic investors in that coun- try because regulations forced firms to use bank debt. Even now, only bonds in highly profitable large firms are available. In Europe, legal access to foreign corporate bonds developed only recently, although the Euro- bond market may have provided informal access for wealthy savers. Bank savings in Europe are generally intermediated investments in larger estab-

Inherited Wealth, Corporate Control, and Economic Growth 341
lished local firms, as banks in the main lend money to these firms or to governments. Many countries’ industrial policies are also essentially schemes to channel bank and postal savings to chosen firms.
Finally, barriers against investing abroad have been ubiquitous through- out the world in recent decades and appear quite resilient to liberalization. To “manage” their exchange rates, “insulate” their macroeconomies from external influences, and prevent the “sterilization” of their monetary poli- cies, many countries have instituted capital control measures that restrict domestic savers’ freedom to invest outside their home markets. Foreign portfolio investment by residents was banned in Argentina from 1983 to 1990, until 1990 in Chile, and until 1994 in Greece. It remains tightly re- stricted in Korea (Kim and Singal 1993) and is illegal in Colombia and India. Other countries use regulatory hurdles or tax disincentives to dis- courage capital outflow. For example, Canada currently limits tax-free re- tirement savings accounts and pension funds to 20 percent foreign content.
These restrictions on savers’ choices might allow large, existing firms to access capital at monopsony prices. Since family pyramid firms are all controlled by the same party (the family), they are better able to realize such market power than are collections of independent widely held firms, even if the individual firms are otherwise similar.
Of course, restrictions on savers’ portfolio choices and on entrepre- neurs’ financing options can, and often do, exist simultaneously. Thus, capital markets can be subject to both monopoly and monopsony distor- tions simultaneously, the favored parties being the established large firms, many of which are controlled by local billionaire families.
11.4.3 Corporate Control and Capital Intensity
To test for differential access to capital, we look again at large Canadian firms. Canada’s restrictions on the inflow and outflow of capital were rela- tively mild compared to those of many other countries. We are therefore using data from a country in which the likelihood of finding statistically significant results is relatively low.
We cannot estimate firm-level costs of capital because of the intricate web of intercorporate financial agreements typical in large family- controlled corporate groups. We can, however, ask whether large heir- controlled firms use labor less intensively relative to capital than do other comparable firms. If they do, this would be consistent with these firms having preferential access to capital. Our sample is again the set of large Canadian firms described in table 11.3 above.
We also examine labor-to-sales ratios, which is an indirect indicator of capital utilization. If a firm has a lower labor-to-sales ratio than other comparable firms, it is less labor intensive and is therefore plausibly more capital intensive than its peers. Of course, an extremely inefficient firm might have both higher labor-to-sales and higher capital-to-sales ratios

342 Randall K. Morck, David A. Stangeland, and Bernard Yeung
than its peers, muddying inferences about labor-to-capital ratios. Despite this, and because accounting asset measures can be highly problematic, the labor-to-sales ratio may still be more informative, even though it is only indirectly related to the cost of capital.
The dependent variables in our regressions are thus labor-to-capital ra- tios and labor-to-sales ratios. As in tables 1 1.4 and 11.5, we use two meth- ods of adjusting for industry, firm size, and firm age. First, we run regres- sions analogous to those in table 11.4, and, second, we use matched pairs analogous to the analysis in table 11.5.
Table 11.6 shows that large Canadian firms controlled by heirs have significantly lower labor intensity than entrepreneur-controlled firms, widely held firms, and other firms in general. These differences are most consistently significant when we include pyramid firms. In contrast, entre- preneur-controlled firms have higher labor intensity than heir-controlled firms, widely held firms, and other firms in general. These findings are consistent with heir-controlled firms having access to lower-cost capital and with pyramid control structures facilitating this access.17 Recall that Canada’s capital market distortions and barriers are relatively benign compared to those of many other countries. The fact that we find signifi- cant results in that country raises the possibility of more severe capital misallocation elsewhere and suggests that relatively low barriers to capital flow can be potent.
11.5 Inherited Wealth and Innovation
Not surprisingly, established firms have been shown not to be support- ive of radical innovations (Betz 1993; see also Gompers and Lerner, chap. 1 in this volume). Indeed, entrenched managers, including heirs, plausibly have a vested interest in blocking innovation (Acs et al. 1995). This should be particularly so for entrenched billionaires as their wealth is due to ex- isting capital, the value of which creative destruction destroys. We therefore conjecture that heir-controlled firms spend less on innovation than do other comparable firms. Moreover, in economies where heir control is extensive, economywide aggregate enterprise spending on R&D should be low.
Table 11.7 contains regressions analogous to those in tables 1 I .4 and 11.5 above but explaining R&D spending. These regressions are more problematic than those in tables 1 1.4-1 1.6 for several reasons. First, R&D has skewed distributions, bounded below at zero. We correct for this by using limited dependent variable regression techniques. Second, Canadian generally accepted accounting policy differs from U.S. accounting rules in
17. It is also consistent with other interpretations, however. For example, Hoshi, Kashyap, and Scharfstein (1990) argue that intercorporate transfers in Japanese corporate groups re- duce firm default risk and therefore reduce group firms’ costs of capital.

Table 11.6 Coefficients on Dummies for Controlling Shareholder Category in Regressions of Labor-to-Capital and Labor-to-Sales Ratios, 1984-89, Relative to Either US. Industry Averages (panels A and B) or Industry-, Age-, and Size-Matched U.S. Firms (panels C and D) (all regressions include the logarithms of firm age and sales as controls)
Dependent Variable
Controlling Shareholders’ Categories Compared
A. Employees/Assets B. Employees/Sales C. Employees/Assets D. Employees/Sales Relative to U.S. Industry Relative to U.S. Industry Relative to U.S. Matched Firms Relative to U.S. Matched Firms
1984-89 Mean 1984-89 Median 1984-89 Mean 1984-89 Median 1984-89 Mean 1984-89 Median 1984-89 Mean 1984-89 Median
Heir minus business entrepreneur
Heir minus widely held
Heir minus all other domestic private-sector firms
Business entrepreneur minus widely held
Entrepreneur minus all other domestic private-sector films
Pyramids included
-2.34
1521 -1.00
(.47) 1741
-1.31 (24)
12001 0.662 (.69)
1681 0.683 (39)
I2001 No
-3.85 -11.3 (.48) (.l4)
[331 1561 -1.35 -11.3
(.59) (.14) 1411 [561
-2.13 -13.7 (.78) (.03)
2.45 2.24 (56) ( S I )
4.58 4.16 (.52) (.53)
11041 11041
1441 1541
11w [I041 No Yes
Note: The numbers are coefficients on dummy variables 8, (one if the firm is in subsample I , zero if it is in subsample 2) in ordinary least squares regressions of the form p , - fi = p, + p, log(sales,) + e, log(age,) + p,S, where the dependent variable is either employees over assets or employees over sales and is adjusted for the US. industry mean in panels A and B and for the analogous ratio of industry-, age-, and size-matched US. firms in panels C and D. Regressions are estimated across the relevant two subsamples. Numbers in parentheses are two-tailed r-test probability levels. Numbers in brackets are sample sizes. Boldface indicates significance at the 10 percent level or better in a one-tailed I-test. The industry benchmark for panels A and B is U.S. industries, for panels C and D US. matched firms.

Table 11.7 Research-and-Development Activity for Large Canadian Firms, by Controlling Shareholder Category
Dependent Vdriabk
Controlling Shareholders’ Categories Compared
Reported R&D > 0 Dummy”
(1)
Reported Relative Relative Reported R&D/Sales Reported R&D/Sales
1984-89Mean R&D Dummyb 1984-89 Mean‘ (2) (3) (4)
Estimation technique Industry benchmarks Controls for
Heirs minus business entrepreneur
Heirs minus widely held
Heirs minus all other domestic private sector
Business entrepreneur minus widely held
Founders minus all other nongovernment
Ordered logit U.S. matches Size and age
0.665 (.34)
~421
[561
-1.34 (.06)
-0.704 (.I71
[lo41 -0.743
(.33) [541
(.75) 0.183
[ 1041
OLS US. matches Size and age
(.78) -.000708
[421
[561
[ 1041
-.00115 (.73)
- .00104 (.71)
,00106 (.79)
1541
(.67) .00126
[ 1041
Nore: Table entries are coefficients on dummy variables 6, (one if the firm is in subsample 1, zero if it is in subsample 2). Regressions in cols. 1 and 2 are of the form y , - p, + p, log(salesJ + p, log (age,) + &6,, while subsequent columns are of the form y, - 7, = p,, + p, log (sales,) + p, log (age,) + p$,, where y, is the value of y for the matching U.S. firm. Numbers in parentheses are two-tailed t-test probability levels, numbers in brackets are sample sizes. “Dummy is one for R&D > 0, zero otherwise. hDummy is two if the Canadian firm reports R&D but its US. match does not, one if both either do or do not report R&D, and zero if the Canadian firm reports no R&D but its U.S. match does. ‘Dependent variable is the Canadian firm’s R&D over sales minus that of its U.S. match.

Inherited Wealth, Corporate Control, and Economic Growth 345
that it lets companies freely choose whether to report their R&D. This makes R&D comparisons with U.S. firms difficult to interpret since Cana- dian firms may strategically report R&D spending. We industry adjust our Canadian firms’ R&D spending by subtracting the R&D spending of an industry-, size-, and age-matched U.S. control firm. These adjustments are problematic because of intrinsic data problems, so we also report regres- sions with no industry adjustments. Unfortunately, adding industry dum- mies is not feasible given the sample sizes.
Column 1 in table 11.7 is a logistic regression of a dummy variable (one if the firm reports R&D and zero otherwise) on ownership type and our firm size and firm age controls. Column 2 displays coefficients from a To- bit regression of unadjusted R&D spending over sales on the same right- hand-side variables. We scale R&D by sales to avoid heteroskedasticity. Regressions 3 and 4 are analogous to regressions 1 and 2 but use matched U.S. firms to benchmark R&D spending. Regression 3 is an ordered logit where the dependent variable is two if the Canadian firm reports R&D but the US. match does not, one if both either do or do not report R&D, and zero if the match reports R&D but the Canadian firm does not. Re- gression 4 uses R&D over sales for the Canadian firm minus R&D over sales for the U.S. match and so can be estimated using OLS.
The results reported in table 11.7 are broadly consistent with the hy- pothesis that heir-controlled firms invest less in innovation than compa- rable entrepreneur-controlled and widely held firms. In contrast, Cana- dian entrepreneur-controlled firms and widely held firms invest roughly comparable amounts in innovation.
Our second conjecture is that economies in which heir control is ex- tensive tend to have less private-sector spending on innovation. To test this, we correlate 1993 private-sector R&D spending, scaled by GDP, with billionaire-entrepreneur and billionaire-heir wealth, as in table 1 1.2 above, across countries. The first column of table 11.8 shows that enterprise R&D spending is negatively correlated with heir wealth (p-value = .13). Since richer countries plausibly have higher R&D spending, we consider a mul- tiple regression of private-enterprise R&D that controls for per capita GDP. Heir wealth draws a negative and highly significant coefficient. Sur- prisingly, we also find that billionaire-entrepreneur wealth is negatively correlated with private-enterprise R&D spending (p-value = .16) and that the corresponding regression coefficient is negative and marginally sig- nificant (p-value = .lo). We are unable to explain this result.
In summary, we find that Canadian heir-controlled firms indeed appear less innovative than other firms. A cross-country regression also shows that countries with extensive heir wealth have less aggregate private-sector spending on innovation. These findings are consistent with our conjecture that heirs favor the status quo.

Table 11.8 The Cross-country Relation between Barriers to Entry, Enterprise R&D Investment, and Capital Ownership Structure
Innovation Spending and Barrier to Entry Measures
Height of Enterprise R&D Height of Regulatory Extent of Height of Height of Spending Scaled FDI Barriers Barriers Government Overall Tax Trade Barriers
by GDP Index Index Intervention Burden Index Index (1) (2) (3) (4) ( 5 ) (6)
Simple correlation coefficients: Business entrepreneur wealth
Inherited billionaire wealth over over GDP, Bl Y
GDP, HIY Multivariate regressions:
Intercept
Log of per capital GDP, In( YIL)
Business-entrepreneur billionaire
Billionaire-heir wealth over
R2
wealth/GDP, Bl Y
GDP, HI Y
-0.228
-0.244 (.13)
0.042 (.04) 2.38 (.OO)
-0.31 (. 10)
-0.18 (.W .49
-0.311 (.W 0.069 (.65)
2.05 (.OO) 0.233 (.03)
-0.112 (.01) 0.021 (.98) .22
-0.179 (.24)
-0.07 1 (.a)
4.05 (.OO)
-0.619 (.W
-0.051 (.25) 0.001 (.95)
S O
Note: The maximal sample consists of the countries listed in table 11.1 above minus the United States and the United Kingdom. Numbers in parentheses are probability levels for two-tailed t-tests.

Inherited Wealth, Corporate Control, and Economic Growth 347
11.6 Inherited Wealth and Market Barriers
We have argued above that heir-controlled firms are relatively unprof- itable but that the heirs who control them are entrenched. Their strong economic position is due to their heritage and their controlled firms’ prominence as capital users and suppliers, not their abilities to manage or innovate. Given this, billionaire heirs are likely to see both innovation and openness as potential threats to the status quo, which favors them. We have shown above that heir control is associated with less innovation. In this section, we explore whether billionaire-heir control is also related to explicit barriers to entry protecting product and capital markets.
Control pyramids potentially create incentives for controlling families to invest in excess political lobbying. Pyramids let controlling families lobby using the resources of firms low in their pyramids, whose profitabil- ity is relatively unimportant to them. This means that the wealthy families can, in essence, use other people’s money to lobby for policies that pre- serve their positions. For example, for the owner of a privately held firm to justify spending $1.00 on lobbying, he (or his firm) must gain y 2 $1.00 in benefits. In contrast, the controlling shareholder in a pyramid n levels high with control stakes of a at each level need gain benefits worth only y 2 a” to him (or the apex firm) if he uses $1.00 of the resources of a firm at the base of the pyramid for lobbying. In general, the controlling share- holder of a such a pyramid would continue spending his controlled firms’ resources on lobbying until his total private marginal rate of return equals I/A, where A = l/an is the pyramidmultiplier defined in equation (3) above.
La Porta et al. (1998) show that countries with weaker political struc- tures have less developed capital markets and speculate that this might be a deliberate policy to entrench the economic control of wealthy families and politicians. Anecdotal evidence consistent with wealthy families hav- ing considerable influence over national governments is also abundant. As reported in the Toronto Globe and Mail, Revenue Canada allowed the Bronfman family to move $2 billion (Canadian) to the United States in 1991 without triggering capital gains taxes. When the auditor general reported that this “may have circumvented the intent of the tax code,” he was attacked by the government finance committee for violating the Bronfmans’ right to privacy (see “Auditor Was Wrong” 1996). Samuel Gordon, the former chairman of Del Monte Fruit, is reported to have said of the late Ecuadorian billionaire Luis “Lucho” Naboa, “If Lucho wanted a law passed, it passed. He could do things in Ecuador that I, as a mul- tinational, couldn’t’’ (see De Cordoba 1995). Most famously, Alfred Krupp (1812-87), heir to the Krupp steel and armaments businesses founded in 181 1 by his father, Friedrich Krupp, is said to have quipped: “As pants the deer for cooling streams, so do I for regulation.”
We can use our cross-country data to explain barriers to entry in local
348 Randall K. Morck, David A. Stangeland, and Bernard Yeung
capital markets, both against foreigners obtaining local savings for invest- ment abroad and against locals wanting to use foreign capital. Table 11.8 investigates whether countries in which inherited family wealth is large relative to GDP show evidence of such barriers, as measured by a set of country-level institutional structure variables.
Following Feldstein (1995), we use an index of the height of FDI barriers to measure the maintenance of capital market segmentation. We also con- sider the height of regulatory barriers, the extent of government intervention, and the overall tax burden index in each economy as general measures of impediments to market entry and capital flow. These variables are ob- tained from Holmes, Johnson, and Kirkpatrick (1997). They all take high values when the country in question is relatively difficult to enter and low values when entry is easy. Capital tends to avoid and flee heavy regulation, widespread government intervention, and high taxes, and the same poli- cies reduce investment inflows. Barriers against capital outflows therefore often accompany such policies. We also include a measure of the height of trade barriers as a proxy for the general openness of the economy, as barriers to capital flow often accompany high trade barriers.
We first estimate simple correlation coefficients of these measures with our country-level ownership structure variables and then run regressions controlling for per capita GDP. We include the regressions because the country's openness to the world economy may depend on the level of its economic development, but we also include the simple correlations be- cause economic growth, and therefore the level of economic development, may be endogenous.
Columns 2-6 of table 11.8 show that billionaire-heir wealth is greater when barriers to FDI are higher, consistent with these economies being subject to barriers to capital inflow. Our other barrier variables are uncor- related with billionaire-heir wealth, except for tax burden, which has a neg- ative sign.
In contrast, billionaire-entrepreneur wealth is strongly negatively corre- lated with FDI barrier height, regulatory barrier height, and extent of government intervention in the economy. Thus, billionaire-entrepreneur wealth is high when barriers to capital flow are low, and neither monop- sony nor monopoly pricing in capital markets is likely.
Note that the height of general trade barriers in product markets is un- correlated with billionaire-heir and billionaire-entrepreneur wealth. This is consistent with barriers around capital markets being more important than general, overall openness in this context.
In summary, heir control appears to be associated with higher invest- ment-flow barriers but not necessarily with more government regulations, greater tax burdens, or trade barriers. In contrast, such barriers are lower in economies with more entrepreneur billionaire wealth.
'

Inherited Wealth, Corporate Control, and Economic Growth 349
11.7 Diagnosing a Canadian Disease?
Our query is about why economic growth is negatively related to a coun- try’s stock of inherited billionaire wealth and positively related to its self- made billionaire wealth. We propose four underlying explanatory factors. First, billionaire heirs are often entrenched, poor managers and have per- verse incentives to engage in costly wealth shifting between firms they con- trol. Poor governance causes heir-controlled firms to do poorly in the aggregate. Second, extensive old wealth distorts capital markets to favor these entrenched heir-controlled firms. Third, billionaire-heir-controlled firms spend less on innovation. Fourth, they also lobby to erect entry bar- riers.
Our four proposed explanations include both direct and indirect effects. The direct explanation is that billionaire heirs are entrenched, poor man- agers with perverse incentives. The indirect explanations are that billion- aire-heir wealth distorts capital markets, lowers R&D, and creates pres- sure for entry barriers and that these distortions, in turn, lower economic growth. We have country-level variables that capture the latter two indirect channels-our enterprise R&D spending and entry-barrier variables from table 1 1 .%-and we find cross-country evidence consistent with these chan- nels.I8 If they are the primary channels operating, adding variables that directly capture these effects to the regressions of table 1 1.2 above should eliminate the heir- and entrepreneur-wealth variables. In contrast, if either the direct effect or the capital market distortion channel predominates, adding these same variables should not affect the coefficients or signifi- cance of the wealth-structure variables.
Table 1 1.9 displays regressions of the form
where Y is GDP, L is population, Z is capital investment, and E is average years of education. The vector P contains entry-barrier variables and spending on innovation. Different specifications in table 1 1.9 use different subsets of the elements of P. As before, the vector C contains our country- level capital ownership structure variables.
18. It is unclear how we may directly proxy for capital market distortions. Broadly, less distortion might lead to larger markets. But market capitalization also reflects economic development, which in turn affects growth. Moreover, market capitalization per se does not adequately capture the counterfactual benchmark required, i.e., what market capitalization would be if capital market distortions were absent. This benchmark is difficult to obtain- first, because of the endogenous relation between economic development and market capital- ization and, second, because of the incomplete theoretical development of this area. We therefore leave these issues to future research.

350 Randall K. Morck, David A. Stangeland, and Bernard Yeung
Table 11.9 The Cross-country Relation between Economic Growth and Capital Ownership Structure Controlling for Current per Capita Income, Capital Investment Rate, Level of Education, Enterprise R&D Investment, and Various Measures of Barriers to Entry
(3) (4)
Intercept
Log of per capita GDP, In( YIL)
Capital accumulation rate, IIK
Average total years of education, E
Extensive business regulations
Height of trade barriers
Height of FDI barriers
Enterprise R&D spending over GDP, R&D/ Y
Overall tax burden
Business-entrepreneur billionaire
Billionaire-heir wealth over GDP,
R2
wealth over GDP, El Y
HI Y
7.39 (.05)
-2.30 ( . O W 0.197 (.OO) 0.312 (.14)
-1.00 (.08)
-0.428 (-27) . . .
-0.242 (.59) 0.29 (.07)
-0.30 (.03) ,579
2.72 (58)
-2.28 ( .OO) 0.154 (.02) 0.503 ( .05)
-0.503 (.47)
-0.154 (.74) . . .
-0.039 (.69) 0.283 (.64) 0.389 ~ 0 3 )
~ 0 7 ) -0.28
,578
- 1.055 (.05) . . .
-0.255 (.56) 0.23 ~ 1 4 )
-0.27 (.W ,603
4.99 (.39)
-2.40 (.OO) 0.188 (.02) 0.444
-0.757 ~ 0 9 )
(.34)
-0.694 (.44)
-0.013 (.90) 0.144 (.81) 0.32 ( . l a
-0.263 (.07) ,587
Note: The sample consists of the countries listed in table 11.1 above minus the United States and the United Kingdom. When we include enterprise R&D spending (scaled by GDP, 1993 data from OECD’s 1996 Industrial Competitiveness Benchmarking Business Environments in the Global Economy), we lose five countries owing to missing data: Austria, Belgium, Taiwan, South Africa, and Singapore.
Table 11.9 shows that extensive regulation, trade barriers, FDI burriers, and high taxes are all correlated with slower economic growth, but only regulations and FDI barriers are significant. If we substitute extent of gov- ernment intervention for extent of regulation, the results are similar, but the intervention variable is uniformly less significant. Surprisingly, and (apparently) inconsistent with the endogenous-growth literature, spending on R&D does not have a significant relation with economic growth.
Billionaire-business-entrepreneur wealth is at best marginally signif- icant in a one-tailed test once the height of barriers to capital flow is included. This is consistent with billionaire entrepreneurs adding to eco- nomic growth by lobbying government for economic openness. It is im- portant to note that we cannot assign a direction of causality here: the

Inherited Wealth, Corporate Control, and Economic Growth 351
openness of an economy could be due to lobbying by entrepreneurs, or openness to world capital markets could allow entrepreneurs to flourish and become billionaires. In either case, it appears that the association of entrepreneur wealth with economic growth is intimately connected to cap- ital market openness and economic freedom in general.
In contrast, billionaire-heir wealth remains negatively correlated with economic growth after the barrier-to-entry variables listed are introduced. This is consistent with the linkage between heir wealth and slow economic growth operating through mechanisms other than barriers to entry and investment in innovation. It is evident from the results presented in table 1 1.9 that our primary observation of a negative correlation between bil- lionaire-heir wealth and economic growth mainly reflects some combina- tion of a direct negative relation due to heir control and an indirect linkage through capital market distortions. This does not rule out other links, most significantly, lobbying for barriers to capital flow.
Poorly performing, heir-controlled firms should be driven out of busi- ness in competitive economies. However, preferential access to capital and capital market entry barrier protection may provide heir-controlled firms with an offsetting advantage that allows them to survive. In short, wide- spread billionaire-heir control may lead to a locking in of the status quo and a permanently reduced rate of economic growth.
Again, a causal interpretation cannot be unambiguously based on cross- sectional regression results. A reverse causality interpretation of our table 1 1.2 and table 1 1.9 results is that high growth adds to entrepreneur wealth and diminishes heir wealth. If economic growth is typically lower in coun- tries with more entry barriers (Edwards 1998), our results in table 1 1.8 follow. However, this interpretation begs the question, Why should high growth augment entrepreneur wealth but lower heir wealth? Growth through capital accumulation might enrich entrepreneurs, but why should it impoverish heirs? Growth through Schumpeterian creative destruction clearly does both, but this answer still leads to the question of why this process operates more rapidly in some economies than in others, which is the focus of this study.
We have argued that widespread inherited corporate control leads to a locking in of the status quo and a consequently reduced rate of economic growth. We rely heavily on Canadian firm-level data to support this argu- ment, so a natural question arises as to its generalization. Are we describ- ing a uniquely Canadian disease? Clearly, the negative cross-country rela- tion between billionaire-heir wealth and economic growth may or may not reflect the same conditions elsewhere. More micro-level studies of other countries would be useful.
352 Randall K. Morck, David A. Stangeland, and Bernard Yeung
11.8 Liberalization: The Control and Treatment of the Canadian Disease?
We have argued that entry barriers and preferential access to capital allow heir control to survive and thus preserve uncompetitive firms. This implies that a sudden and unexpected regime shift that removes many of these advantages will affect heir-controlled firms more adversely than it will other firms. Moreover, if entrepreneurs have previously been held back by entry barriers and limited access to capital, entrepreneur-con- trolled firms should be affected more positively by these changes than should other firms. Therefore, in this section, we consider an event that suddenly and unexpectedly rendered Canada more open to foreign capital and less protected by entry barriers, the 1988 Canada-US. Free Trade Agreement (FTA). We conduct an event study using daily stock-price data and a comparison of accounting and ownership data before and after the FTA.
The FTA eliminated product market trade barriers over the ten years following ratification, according to a preset schedule. Chapter 16 of the FTA also provided for prospective national treatment of investors. This immediately barred future barriers to capital flow of any kind between the two countries, although certain discriminatory taxes and regulations were grandfathered. Chapter 16 unquestionably provoked the greatest outrage from the Canadian nationalist press.
There are several ways in which the FTA could conceivably have af- fected the relative standing of heir-controlled firms. First, heightened prod- uct market competition could have reduced the value of poorly managed firms. Second, a greater inflow of U.S. capital to Canadian entrepreneurs could reduce heir-controlled firms’ market power over the supply capital. It could also create more competition for Canadian corporate assets that are not shielded from takeovers. Third, U.S. firms active in Canada might raise capital there, creating more competition for Canadian savings and eroding entrenched players’ market power on that side of the capital mar- ket as well. Any or all of these would level the playing field between heirs and others.
The FTA is suitable for an event study because ratification was not ex- pected. Canada had reached the final stages of negotiation of free trade agreements with the United States several times over the previous century and had always balked at the last minute. To establish a mandate for free trade, the Conservative prime minister, Brian Mulroney, had called a snap general election. The protectionist Liberal candidate, John Turner, was far ahead in the polls. Indeed, the best that a few late pre-election polls were predicting for the Tories was a draw and a consequent hung parliament or minority government. Neither boded well for the FTA, which required a
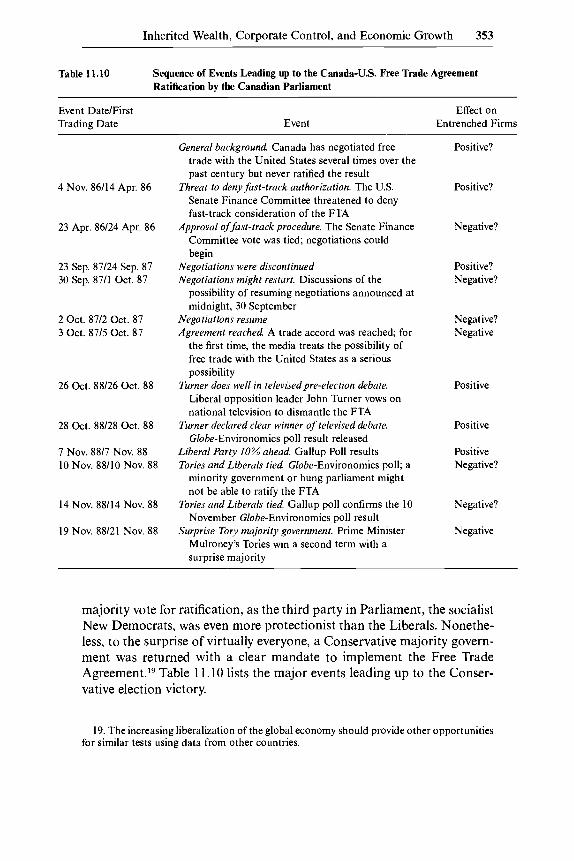
Inherited Wealth, Corporate Control, and Economic Growth 353
Table 11.10 Sequence of Events Leading up to the Canada-U.S. Free Trade Agreement Ratification by the Canadian Parliament
Event DatdFirst Trading Date Event
Effect on Entrenched Firms
4 Nov. 86/14 Apr. 86
23 Apr. 86/24 Apr. 86
23 Sep. 87/24 Sep. 87 30 Sep. 87/1 Oct. 87
2 Oct. 87/2 Oct. 87 3 Oct. 8715 Oct. 87
26 Oct. 88/26 Oct. 88
28 Oct. 88/28 Oct. 88
7 Nov. 88/7 Nov. 88 10 Nov. 88/10 Nov. 88
14 Nov. 88/14 Nov. 88
19 Nov. 88/21 Nov. 88
General background. Canada has negotiated free trade with the United States several times over the past century but never ratified the result
Senate Finance Committee threatened to deny fast-track consideration of the FTA
Approval of fast-track procedure. The Senate Finance Committee vote was tied; negotiations could begin
Threat to deny fast-track authorization. The U.S.
Negotiations were discontinued Negotiations might restart. Discussions of the
possibility of resuming negotiations announced at midnight, 30 September
Negotiations resume Agreement reached. A trade accord was reached; for
the first time, the media treats the possibility of free trade with the United States as a serious possibility
Turner does well in televised pre-election debate. Liberal opposition leader John Turner vows on national television to dismantle the FTA
Turner declared clear winner of televised debate. Globe-Environomics poll result released
Liberal Party 10% ahead. Gallup Poll results Tories and Liberals tied. Globe-Environomics poll; a
minority government or hung parliament might not be able to ratify the FTA
Tories and Liberals tied. Gallup poll confirms the 10 November Globe-Environomics poll result
Surprise Tory majority government. Prime Minister Mulroney’s Tories win a second term with a surprise majority
Positive?
Positive?
Negative?
Positive? Negative?
Negative? Negative
Positive
Positive
Positive Negative?
Negative?
Negative
majority vote for ratification, as the third party in Parliament, the socialist New Democrats, was even more protectionist than the Liberals. Nonethe- less, to the surprise of virtually everyone, a Conservative majority govern- ment was returned with a clear mandate to implement the Free Trade Agreement.19 Table 11.10 lists the major events leading up to the Conser- vative election victory.
19. The increasing liberalization of the global economy should provide other opportunities for similar tests using data from other countries.
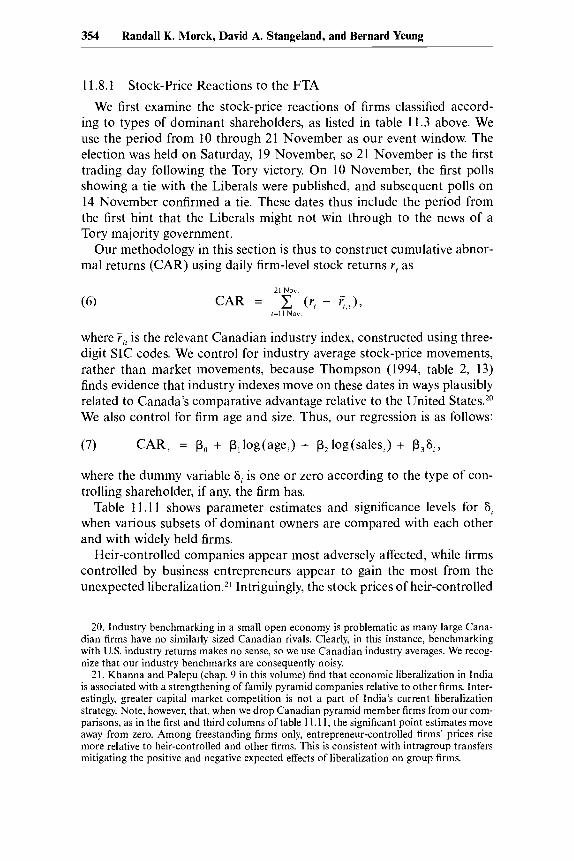
354 Randall K. Morck, David A. Stangeland, and Bernard Yeung
11.8.1
We first examine the stock-price reactions of firms classified accord- ing to types of dominant shareholders, as listed in table 11.3 above. We use the period from 10 through 21 November as our event window. The election was held on Saturday, 19 November, so 21 November is the first trading day following the Tory victory. On 10 November, the first polls showing a tie with the Liberals were published, and subsequent polls on 14 November confirmed a tie. These dates thus include the period from the first hint that the Liberals might not win through to the news of a Tory majority government.
Our methodology in this section is thus to construct cumulative abnor- mal returns (CAR) using daily firm-level stock returns Y, as
Stock-Price Reactions to the FTA
where Y,! is the relevant Canadian industry index, constructed using three- digit SIC codes. We control for industry average stock-price movements, rather than market movements, because Thompson (1994, table 2, 13) finds evidence that industry indexes move on these dates in ways plausibly related to Canada's comparative advantage relative to the United States.2o We also control for firm age and size. Thus, our regression is as follows:
(7) CAR, = Po + P,log(age,) + P,log(sales,) + P,Sl,
where the dummy variable Si is one or zero according to the type of con- trolling shareholder, if any, the firm has.
Table 11.11 shows parameter estimates and significance levels for tit when various subsets of dominant owners are compared with each other and with widely held firms.
Heir-controlled companies appear most adversely affected, while firms controlled by business entrepreneurs appear to gain the most from the unexpected liberali~ation.~' Intriguingly, the stock prices of heir-controlled
20. Industry benchmarking in a small open economy is problematic as many large Cana- dian firms have no similarly sized Canadian rivals. Clearly, in this instance, benchmarking with U.S. industry returns makes no sense, so we use Canadian industry averages. We recog- nize that our industry benchmarks are consequently noisy.
21. Khanna and Palepu (chap. 9 in this volume) find that economic liberalization in India is associated with a strengthening of family pyramid companies relative to other firms. Inter- estingly, greater capital market competition is not a part of India's current liberalization strategy. Note, however, that, when we drop Canadian pyramid member firms from our com- parisons, as in the first and third columns of table 1 I . 11, the significant point estimates move away from zero. Among freestanding firms only, entrepreneur-controlled firms' prices rise more relative to heir-controlled and other firms. This is consistent with intragroup transfers mitigating the positive and negative expected effects of liberalization on group firms.

Inherited Wealth, Corporate Control, and Economic Growth 355
Table 11.11 Cumulative Abnormal Returns of Large Canadian Firms on the News That the Canada-US. Free Trade Agreement Would Be Ratified by the Canadian Parliament
Mean Residual Differences Controlling for
Firm Age & Size’ Mean Differences Controlling Shareholders’ Categories Compared (1) (2) (3) (4)
Heirs minus business entrepreneurs
Heirs minus widely held
Heirs minus all other private-sector firms
Business entrepreneurs minus widely held
Business entrepreneurs minus all other private-sector firms
Includes firms in pyramids
Note: Categories are defined as in table 11.3 above. Subsamples are smaller because we do not have stock returns for all firms listed in that table. Numbers in parentheses are probability levels from 1-
tests. Numbers in brackets are sample sizes. Boldface type indicates significance in a one-tailed t-test at the 10 percent level. The cumulative abnormal return is for all trading days from 10 November, the date of the first poll questioning the Liberal lead, through to 21 November 1988, the first trading day after a surprise Conservative majority government was returned. Cumulative abnormal returns are returns minus the value-weighted returns of all other firms in the three-digit industry. Using equal weighting gives similar results. aThis panel contains coefficients andp-levels for 6, a dummy variable set to one if the firm is in subsample 1 and zero if it is in subsample 2 in the ordinary least squares regression CAR, = Po + P, log (age,) + Pz log (sales,) + P A .
firms and widely held firms move in statistically indistinguishable ways. In contrast, stocks of business-entrepreneur-controlled firms rise relative to those of widely held firms. These findings are consistent with the hypothe- ses that heir-controlled firms are less able to meet increased product mar- ket competition and/or are less able to adapt to a more competitive capi- tal market.
11.8.2 Changes in Capital Intensity
As mentioned above, chapter 16 of the FTA requires national treatment of investors from the United States. This encourages U.S. enterprises both to invest in Canada and to raise capital there, raising the general level of competition in Canadian capital markets. Heir-controlled firms should
356 Randall K. Morck, David A. Stangeland, and Bernard Yeung
therefore lower their capital intensity as whatever capital market power they formerly enjoyed is eroded.
We return to our statistical analyses of industry-adjusted labor-to-sales ratios in table 1 1.6 above, but now we consider the post-FTA period from 1992 through 1996. Table 11.12 also shows the changes in these ratios from the pre-FTA (1984-89) period to this post-FTA period for various categories of firms surviving through 1996. Each entry in the first and third panels of table 11.12 is a regression coefficient of an ownership dummy for controlling shareholder type in a regression of (U.S.-industry- adjusted) labor over sales on that dummy and controls for the logarithms of firm age and size.22 U.S. industry averages are the industry benchmark in panel A. U.S. firms the same size and age in the same industry serve in this capacity in panel C. In panels B and D, the dependent variables are the changes for each firm in the figures in panels A and C, respectively, from the 1980s.
A clear pattern emerges. Table 1 1.6 above shows that, in the 1980s, heir- controlled firms had lower labor intensity than did entrepreneur-con- trolled firms. Table 11.12 shows that, for heir-controlled firms that sur- vived, these differences remain in the 199Os, although they have become less significant. Table 1 1.6 also shows entrepreneur-controlled firms hav- ing insignificantly higher labor intensity than widely held firms, while heir- controlled firms’ labor intensity was significantly lower than that of widely held firms. After liberalization, this changes. Both heir-controlled and en- trepreneur-controlled firms that survived became significantly more labor intensive than widely held firms. The coefficients are also all significantly different from those in the 1980s. Panels B and D show that surviving heir- controlled and entrepreneur-controlled firms both increased their labor intensity significantly more than widely held firms did. If our assumption that a low labor-to-sales ratio means high capital intensity is valid, widely held firms began using significantly more capital per worker after liberal- ization. This is consistent with widely held firms’ access to capital im- proving.
11.8.3 Stronger Competition?
The FTA increased product market and capital market competition in Canada. This should have been most detrimental to the least-competitive Canadian firms and most advantageous to the best Canadian firms. Tables 11.13 and 11.14 repeat the analyses in tables 11.4 and 11.5 above and compare firm groups’ returns and growth for the period 1992-96 to see whether the gaps in performance between firms controlled by different types of shareholders have widened. Heir-controlled firms continue to
22. Panel A of table 11.12 is analogous to table 11.4 in construction, while panel C is analogous to table 11.5.

Table 11.12 Coefficients on Dummies for ControllingShareholder Category in Regressions of Labor-to-Capital and Labor-to-Sales Ratios Controlling for Industry, Firm Size, and Firm Age (1992-96 in panels A and C; differences from 1984-89 and 1992-% in panels B and D, panels A and B use measurements relative to US. industries; panels C and D use measurements relative to U.S. firms matched on industry, age, and size)
Dependent Variable
Controlling Shareholders’ Categories Compared
B. Change in Employees/Sales D. Change in EmployeeslSales A. EmployeeslSales Relative to US. Industry C. EmployeesISales Relative to US. Matched Firms
~ Relative to U.S. lndustry Relative to U.S. Matched Firms ~
~ 199-96 Minus 1992-96 Minus ~ 1992-96 Minus 1992-96 Minus 1992-96Mean 1992-96Median 1984-89 Mean 1984-89Median 199-96Mean 1992-96Median 1984-89Mean 1984-89Median
Heir minus business -2.40 -1.92 -2.63 -2.11 2.38 0.161 1.45 0.520 -3.50 -0.846 -3.51 -0.829 0.657 ,540 1.41 .971 entrepreneur ( 2 2 ) (.24) (.19) (.20) ( S 2 ) (.93) (S7) ( . E l ) (.16) (.41) (.17) (.42) (.72) (.65) (.44) (.45)
[361 [471 [361 [471 [361 [471 [361 [471 [I91 [29l [I91 [29l [19l [29l [I91 [29l Heir minus widely held 2.37 1.08 2.34 1.12 3.43 3.47 3.86 3.14 -0.37 -0.85 -0.35 -0.83 2.29 ,540 2.62 ,971
(.15) (.43) (.17) (.41) (.lo) (.06) ( . I I ) (.07) (.79) (.41) (30) (.42) (.05) (.65) (.06) (.45)
P I [601 [431 [601 [431 [ a 1 [431 [ a 1 P I 1 [29l P I 1 [29l 1211 I291 [211 Heir minusallother domestic 0.0521 0.287 -0.079 ,202 1.98 1.67 2.49 2.02 -1.45 -1.47 -1.43 -1.47 1.91 ,276 2.38 ,703
private-sector firms (.96) (.75) (.94) (32) (.l4) ( .IS) (-05) (.07) (27) (.18) (29) (.19) (23) (34) (.12) (S9)
Businessentrepreneur minus 4.66 3.31 4.82 3.46 3.41 3.76 3.13 2.69 2.42 1.62 2.46 1.63 0.765 ,863 0.312 ,738 [I241 11241 [I241 [I241 [I241 [I241 [I241 [I241 [57] [57] [57] [57] (571 (571 [57] [57]
widely held (.no) (.os) (.cq (.04) (.07) (.lo) ( . I I ) (.H) (.23) (.34) (.z3) (.35) (.59) (.47) (.Ez) ( ~ 4 )
[381 [451 [381 [451 [381 [451 [381 [451 [251 [291 [251 [291 [25l [291 1251 [291 Entrepreneurminus all other 1.85 1.85 1.95 1.95 1.20 1.20 0.756 0.756 2.03 2.03 2.03 2.03 0.714 ,714 0.571 .571
domestic private-sector firms ( . I ] ) (.11) (.09) (.09) (.43) (.43) (.60) (50) (.07) (.07) (.08) (.08) (.60) (.60) (.67) (.67) [I241 [I241 [I241 [I241 [I241 [I241 [I241 [I241 [57] [57] [57] [57] [57] (571 [57] [57]
Pyramids included No Yes No Yes No Yes No Yes No Yes No Yes No Yes No Yes
Nore: The numbers in panels A and C are coefficients on dummy variables 8, (one if the firm is in subsample I , zero if it is in subsample 2) in Ordinary least squares regressions of the form p, - p = p,, + p, log(sales,) + p, log(age,) + p,S, where the dependent variable is either employees over assets or employees over sales and is relative to the U.S. industry mean in panel A and to the analogous ratio for a U.S. firm the same size and age in the same industry in panel C. Numbers in panels B and D are simple diflerences. Estimates are across the relevant two subsamples. Numbers in parentheses are two-tailed 1-test probability levels. Numbers in brackets are sample sizes. Boldface type indicates significance at the 10 percent level in a one-tailed 1-test.

Table 11.13 Relation of Controlling-Shareholder Category to Performance of Large Canadian Firms, 1992-96 Annual Reports, Controlling for Firm Age and Size (industry benchmarks are 3digit US. industry averages)
Dependent Variable Controlling Shareholders' Operdting Income over Assets Operating Income over Sales Sales Growth Employees Growth Categones Compared 1992-96 Mean 1992-96 Median 1992-96 Mean 1992-96 Median 1992-96 Mean 1992-96 Medidn 1992-96 Mean 1992-96 Median
Heir minus business -34423 ,00126 -.GO472 .00069 -.0134 -.0125 -.0111 -3086 ,00133 ,0309 ,0311 ,0461 ,0251 ,0261 ,0401 ,0375 entrepreneur (34) (.95) (33) (-97) (.47) (.45) (S9) (.64) (.98) ( . 5 5 ) ( S O ) (.29) (.75) (.69) (.61) ( 5 8 )
[381 [@I [381 1491 1381 1491 1381 1491 [361 1461 1361 1461 I331 1431 [331 1431 Heir minus widely held - . l a -.I15 -.182 -.I14 -.0674 -.0578 -.0668 -.0547 -.0554 -.0174 -.0698 -.0359 -.00751 -.0142 ,0146 -.00233
(.19) (.24) (.19) ( .25) (.I61 (.lo) (.16) (.11) (.38) (.72) (.26) (4) (-92) (.79) (34) (.96)
[441 1601 [MI [ml 1441 1601 [441 [601 1441 (581 1441 I581 I371 1511 [371 I511 Heirminusallotherdomestic -.0805 -.I00 - 0810 -.lo1 -.OM3 -.OW5 -3626 -.ME4 -.00892 ,00899 -.00579 ,00613 ,00255 ,00165 ,0191 ,0182
private-sector firms (.31) (.15) (.31) (.14) (.16) (.M) (.19) (.06) (33) (30) ( 3 8 ) (.86) (.95) (.96) (.62) (.59) [I251 11251 [I251 [I251 11261 [I261 [I261 11261 [I181 [I181 (1181 [I181 [I051 [I051 [lo51 [IOS]
Business entrepreneur minus -.I87 -.I52 - .I85 -.I50 -.0473 -.0538 -.0494 -.0538 -.0364 -.0247 -.0620 -0542 ,00366 -.0181 ,0165 -.00755 widely held (.25) (.28) ( 2 5 ) (.29) (.38) (27) (.35) (26) (.63) (.72) (.41) (.43) (.95) (.74) (.70) (36)
(411 [A71 (411 [471 1411 [471 1411 [471 (391 1441 1391 1441 [331 (381 (331 (381 Businessentrepreneur minus -.OM5 -.0545 -.055 -.055 -.0311 -.0311 -.0323 -.0323 -.0129 -.0129 -.0378 -.0378 -.0182 -.a182 -.0117 -.0117
all other domestic private- (S3) (-53) (S3) (.53) (.54) (.54) (.54) (.%) (.78) (.78) (.40) (.40) (.69) (.69) (.79) (.79) sector firms [I251 (1251 11251 [I251 11261 11261 [I261 [I261 [I181 [I181 [I181 Ill81 [I051 [I051 [I051 [I051
Fyramids included No Yes No Yes No Yes No Yes No Yes No Yes No Yes No Yes
Note: The numbers shown are coefficients on dummy variables 6 , (one if the firm is in subsample I , zero if it is in subsample 2) in ordinary least squares regressions of the form p, - 7 = p,, + p, log(sales,) + p, log(age,) + p,S, estimated across the relevant two subsamples. Boldface type indicates significance at the 10 percent level in a one-tailed 1-test. Numbers in parentheses are two-tailed 1-test probability levels. Numbers in brackets are sample sizes.
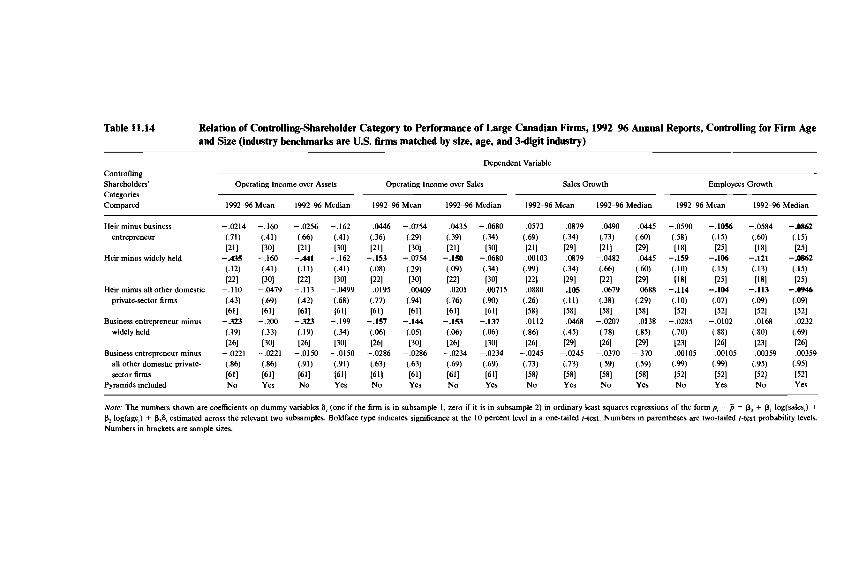
Table 11.14 Relation of ControllingShareholder Category to Performance of Large Canadian Fims, lWZ% Annual Reports, Controlling for Firm Age and Size (industry benchmarks are US. firms matched by size, age, and Wigit industry)
Controlling Shareholders' Categories Compared
Dependent Variable
Operating Income over Assets Operating Income over Sales Sales Growth Employees Growth
1992-96Mean 1992-96Median 1992-96Mean 1992-96Median 1992-96Mean 1992-96Median 1992-96Mean 1992-96Median
Heir minus business entrepreneur
Heir minus widely held
Heir minus all other domestic private-sector firms
Business entrepreneur minus widely held
Business entrepreneur minus all other domestic private- sector firms
Pyramids included
-.0680
(.34) 1301
1301
-.om0 (.34)
.00715 (.W 1611
-.I37 (.06) 1301
-.02?4 (.69) 1611 Yes
.0879
(.34) 1291
1291
,0879 (.34)
.lo5
(.II) 1581
(.45)
,0468
1291
1581
-.0245 (.73)
Yes
,0490 (.73) 1211
(.66) 1221
(.38)
- ,0207
-.0482
,0679
1581
(.78) 1261
(59) 1581
-.0370
No
-.0584
(.W 1181
-.I21 ( . I 3) 1181
-.I13
(.W
,0168 (.go)
,00359 (.95)
No
1521
1231
1521
Note: The numbers shown are coefficients on dummy variables 8, (one if the firm is in subsample I , zero if it is in subsample 2) in ordinary least squares regressions of the formp, - ji = p, + p, log(sales,) + p,log(age,) + p,S, estimated across the relevant two subsamples. Boldface type indicates significance at the 10 percent level in a one-tailed r-test. Numbers in parentheses are two-tailed t-test probability levels. Numbers in brackets are sample sizes.

360 Randall K. Morck, David A. Stangeland, and Bernard Yeung
perform worse than widely held firms and other firms in general, and the point estimate differences have widened. But the differences between heir- controlled and entrepreneur-controlled firms have narrowed, although entrepreneur-controlled firms continue to grow faster. Entrepreneur-con- trolled firms’ earnings continue to be lower than those of widely held firms, and widely held firms’ growth now matches that of entrepreneur-con- trolled firms.
In short, widely held firms appear to have benefited disproportionately as Canada became more integrated with U.S. product markets and capi- tal markets. In contrast, heir-controlled firms continue to report slower growth and lower earnings than other firms, and they may actually be falling further behind.
11.8.4 The Staying Power of Concentrated Wealth
The implementation of the FTA also lets us look at transition rates between different ownership structures as competition grows. To do this, we first compare the ownership structures of our sample of large Canadian firms in 1988, immediately prior to the FTA, to those in 1994, the last year for which we have complete data.23 This comparison is summarized in the transition matrix of table 11.15.
The fraction of firms that are either widely held or owned by a widely held parent increases from 27.24 percent (sixty-seven firms) in 1988 to 32.11 percent (seventy-nine firms) in 1996. Four of the eight firms that ceased to be heir controlled became widely held. Also, most firms whose founders left the scene become widely held. Of the twenty-seven firms clas- sified as owned by business entrepreneurs, four became widely held, two ended up with a financial institution as a controlling shareholder, one went bankrupt, one was acquired by a foreign parent, and in only one firm was “control” passed on to an heir. In both cases, a x2 goodness-of-fit test soundly rejects the hypothesis of random changes in ownership structure (p-level < 5 percent).24 The proportion of widely held firms also rose be- cause four of the five privatized state-owned enterprises in our sample of very large firms became widely held.25
23. Our 1994 ownership data are from the same sources as our 1988 data. 24. In the x2 tests, we treat categories i (cooperatives) and j (labor controlled) as one
category. We also collapse c (no controlling shareholder) andf(widely held Canadian parent) into a single category. Because heir-controlled firms cannot become “entrepreneur-con- trolled” firms, the number of categories into which heir-controlled firms can pass is one minus the number open to entrepreneur-controlled firms. The X2-statistic is calculated as the sum of squares of observed minus expected transitions over the number of expected transi- tions. The Xz-statistic is calculated as the sum of squares of observed minus expected transi- tions over the number of expected transitions. The x2(6)-statistic for the hypothesis that the transformations of heir-controlled firms follow a random pattern is 27.42, with a probability value less than 0.5 percent. The x2(7)-statistics for changes of entrepreneur-controlled firms is 17.99, with a probability value less than 2.5 percent.
25. We obtain qualitatively identical results when we include firms without accounting data in the transition matrix reported in table 11.15.
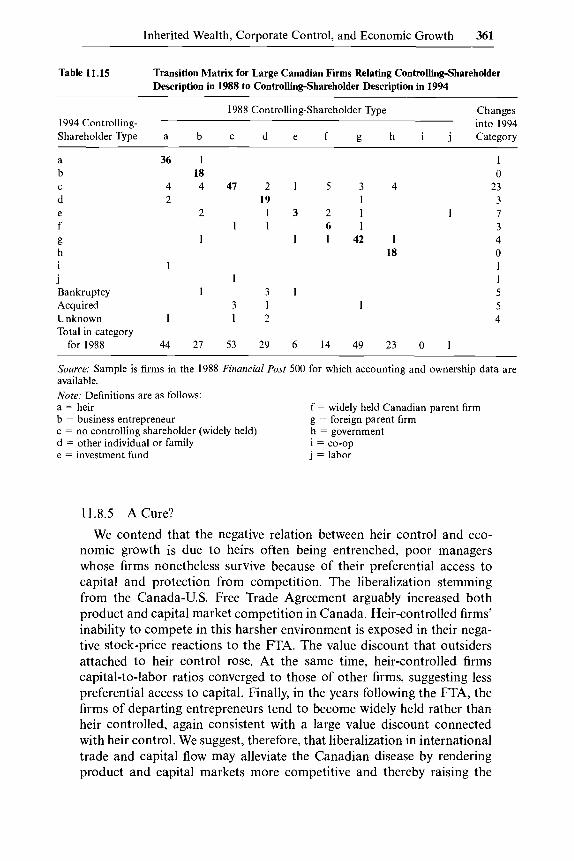
Inherited Wealth, Corporate Control, and Economic Growth 361
Table 11.15 Transition Matrix for Large Canadian Firms Relating Controlling-Shareholder Description in 1988 to Controlling-Shareholder Description in 1994
___ ~
1988 Controlling-Shareholder Type Changes 1994 Controlling- into 1994 Shareholder Type a b c d e f g h i j Category
a b
d e f g h i
Bankruptcy Acquired Unknown Total in category
for 1988
C
j
36 1 18
4 4 4 1 2 1 5 3 4 2 19 1
2 1 3 2 1 1 1 1 6 1
1 1 1 4 2 1 18
1 1
3 1 1 1 3 1
1 1 2
44 21 53 29 6 14 49 23 0 1
1 0
23 3 I 3 4 0 I 1 5 5 4
Source: Sample is firms in the 1988 Financial Post 500 for which accounting and ownership data are available. Nore: Definitions are as follows: a = heir b = business entrepreneur c = no controlling shareholder (widely held) d = other individual or family e = investment fund
f = widely held Canadian parent firm g = foreign parent firm h = government i = co-op j = labor
11.8.5 A Cure?
We contend that the negative relation between heir control and eco- nomic growth is due to heirs often being entrenched, poor managers whose firms nonetheless survive because of their preferential access to capital and protection from competition. The liberalization stemming from the Canada-U.S. Free Trade Agreement arguably increased both product and capital market competition in Canada. Heir-controlled firms’ inability to compete in this harsher environment is exposed in their nega- tive stock-price reactions to the FTA. The value discount that outsiders attached to heir control rose. At the same time, heir-controlled firms capital-to-labor ratios converged to those of other firms, suggesting less preferential access to capital. Finally, in the years following the FTA, the firms of departing entrepreneurs tend to become widely held rather than heir controlled, again consistent with a large value discount connected with heir control. We suggest, therefore, that liberalization in international trade and capital flow may alleviate the Canadian disease by rendering product and capital markets more competitive and thereby raising the
362 Randall K. Morck, David A. Stangeland, and Bernard Yeung
price that families must pay to maintain inherited corporate control. These findings can be interpreted as providing empirical support for the ideas set forth in Olson (1982) that trade liberalization has important beneficial effects related to dislodging entrenched special interest groups.
11.9 Conclusions
The central result of this paper is that the ownership structure of a coun- try’s capital matters. Economic growth depends, not just on the stock of physical capital, but also on who controls it. We find that entrenched fam- ily control of a nation’s capital is correlated with lower rates of economic growth while billionaire entrepreneurs’ control of capital is correlated with higher rates of economic growth.
We consider several explanations for this finding. First, old wealth may entrench poor management, and control pyramids may distort their in- centives. Second, a sharply skewed wealth distribution may create market power in capital markets, causing inefficiency. Third, entrenched billion- aires have a vested interest in preserving the value of old capital and thus in slowing creative destruction. Fourth, old money becomes entrenched through control of the political system and, most especially, by erecting barriers to capital mobility. In contrast, substantial self-made billionaires’ wealth is observed where such forces are edentulous and creative destruc- tion occurs.
Using micro-level data from Canada, we find evidence consistent with the first three explanations. Switching to cross-country data, we find sup- portive evidence for the third and fourth explanations. In an expanded regression analysis of cross-country differences in growth, we confirm that the positive relation between entrepreneur-controlled capital and eco- nomic growth is connected with lower entry barriers and openness. In contrast, the linkage between heir-controlled capital and lower economic growth is due, not just to higher inward foreign investment barriers, but also to entrenched heir control and capital market distortions arising from this.
We dub depressed growth associated with widespread corporate control by wealthy heirs the Canadian diseuse. It is characterized by one or more of the following symptoms: poor overall management quality, capital mar- kets and institutions that channel money to large, established family firms, a dearth of innovation that locks in the status quo, and political rent seek- ing that deters entry. The term Cunudiun diseuse is appropriate because our empirical evidence relies heavily on Canadian data. We suspect that this malady is widespread globally and that it is especially deleterious in many developing economies. More work is clearly needed before this sup- position can be confirmed.
We show that freer international trade and capital flow appear to level the playing field between heir-controlled, entrepreneur-controlled, and
Inherited Wealth, Corporate Control, and Economic Growth 363
widely held Canadian firms. If our conjecture that entrenched family con- trol is detrimental to an economy is correct, trade and capital flow liberal- ization may have important beneficial economic effects that are not cap- tured by standard models of international trade and international finance.
Data Appendix
International Data
Our country-level sample begins with all countries having 1997 GDP greater than U.S.$l billion. We drop postsocialist economies, such as China, the Czech Republic, Hungary, Poland, and Russia; economies sub- ject to economic sanctions, such as Cuba, Iran, and Iraq; the oil sheik- doms Bahrein and Brunei; the tax havens Liechtenstein and Luxembourg; Ethiopia, Kuwait, and Lebanon, which are undergoing postwar recon- struction; Sri Lanka and the Democratic Republic of the Congo, which are currently experiencing civil war; and Bangladesh, Egypt, El Salvador, Ghana, Jordan, Kenya, New Zealand, Nigeria, Saudi Arabia, Syria, Tan- zania, and the United Arab Emirates because of missing data. The final sample consists of Argentina, Australia, Austria, Belgium, Brazil, Canada, Chile, Colombia, Denmark, Ecuador, Finland, France, Germany, Greece, Hong Kong, Iceland, India, Indonesia, Ireland, Israel, Italy, Japan, Korea, Malaysia, Mexico, the Netherlands, Norway, Peru, the Philippines, Portu- gal, Singapore, South Africa, Spain, Sweden, Switzerland, Taiwan, Thai- land, Turkey, the United Kingdom, the United States, and Venezuela. We exclude the United States and the United Kingdom from our sample on the grounds that their corporate ownership structures are highly atypical, in that their large listed companies are predominantly directly held by small shareholders (La Porta, Lopez-de-Silanes, and Shleifer 1999).
Data on billionaire wealth is from Forbes magazine’s annual list of bil- lionaires for 1993. We use Forbes’ description of the billionaires to classify them as heirs, entrepreneur-founders, and heir-entrepreneurs (people who inherited huge fortunes but greatly increased them). We double-check in the 1994-97 issues of Forbes to verify the accuracy of our classification of each billionaire. (The I997 Forbes explicitly classifies billionaires as self- made or not.) Members of billionaire political dynasties (obtained from Forbes 1997) are classified as heirs. Dropping them does not change the results. Ambiguous classifications by Forbes are cross-checked with Who i Who. If they are still ambiguous, these billionaires are assigned to a fourth,
probably heir category. Including them and/or the heir-entrepreneurs in the heir category does not change the results.
Our GDP and population data are from the World Bank, with data for Taiwan obtained from the website of that country’s government. Our data

364 Randall K. Morck, David A. Stangeland, and Bernard Yeung
on investment rates and education (human capital) are from the World Bank Growth Data used by, for example, Barro and Lee (1996). The politi- cal economy variables are from Holmes, Johnson, and Kirkpatrick (1997).
Univariate statistics for these variables are shown in table 11A. 1.
Canadian Data
Our sample of large Canadian firms begins with the Financial Post 500, the largest 500 firms in 1988, ranked by sales as listed in the Financial Post magazine. Ownership and minimal financial data are available for 246 of these.
Ownership data are from the Finuncial Post Survey of Industrials and the Financial Post Survey of Energy and Mining Companies. These data are cross-checked against Statistics Canada’s Directory of Intercorporate Ownership for 1989. Inconsistencies are resolved by checking proxy state- ments. For each firm, the total number of shareholder votes is calculated assuming that all warrants, convertibles, and stock options have been exer- cised. The total number of votes controlled by the largest shareholder is calculated in a similar way. This is divided by the total number of votes to obtain the largest shareholder’s voting power. We define a firm as having a dominant shareholder if the largest single shareholder owns or controls
Table 11A.1 Univariate Statistics for Country-Level Data
Variable Mean Standard Deviation Minimum Maximum
Economy characteristics: Growth rate in GDP (‘YO) Per capita GDP (U.S.$ X 1,000) Capital investment rate (%) Average years of education
Economy capital ownership structure:a Business-entrepreneur billionaire
Billionaire-heir wealth over GDP Political economy variables (1 = low, 5
Level of government intervention Extent of regulations Trade barrier height FDI barrier height Index of overall tax burden
Private-sector R&D over GDP
wealth over GDP
= high):
Innovation rate variables:
4.11 13.5 22.3
6.82
I .47 I .96
2.38 2.72 2.64 2.21 3.96
0.406
2.50
6.20 2.18
10.7
3.35 3.23
0.990 0.759 1.11 0.570 0.920
0.517
-0.233 0.314
3.05 12.9
0.000 0.000
1.000 1.000 1.000 1 .ooo 1.500
0.000
9.03 38.1 36.7 10.4
19.3 15.8
5.00 4.00 5.00 3.00 5.00
1.88
Note: The sample is 39 countries, as listed in table 11.1, except for private-sector R&D over GDP, which is available for only 34 countries. Sample excludes the United Kingdom and the United States. ‘Billions in wealth over trillions of GDP.

Inherited Wealth, Corporate Control, and Economic Growth 365
more than 20 percent of total voting rights. Where more than one share- holder is listed as having voting control over a trust, we assign each an equal proportion of the votes. Firms with no dominant shareholder are classified as widely held. The name of the largest shareholder among those with stakes exceeding 20 percent is determined. Information from corpo- rate histories, proxies, the Blue Book of Canadian Business, and Who> Who allow us to determine the name of each firm’s founder. If the founder and the current major dominant shareholder are the same, we call the firm entrepreneur controlled. If the current dominant shareholder has the same last name as the founder, we define the firm as heir controlled.
Financial data are from the Toronto Globe and Mail’s InfoGlobe data- base and are available for 200 of our firms. We compare these Canadian firms with U.S. industries and with U.S. firms matched by industry, sales, and age (see details below). US. financial data are from the Standard and Poor’s Compustat database. We adjust fiscal year definitions of our Cana- dian firms to correspond to Compustat’s convention that annual reports dated before 15 June of year t are defined as year t - 1 data.
All Canadian dollar amounts are converted to U.S. dollars. Monthly exchange rates are noon averages from the Bank of Canada Review quar- terly issues. Using the average of the twelve monthly averages ending with the month of the fiscal year end, Canadian figures are converted to U.S. dollars. Numbers for Canadian companies that report in U.S. dollars are not adjusted.
Industry classifications are made using the Standard Industrial Classi- fication (SIC) codes system of Standard and Poor’s Compustat database. U.S. rivals are defined as all U.S. firms belonging to the same industry (defined by three-digit SIC codes) as the Canadian firm. For each set of U.S. rivals, we construct an industry profit rate by adding up the total operating income of the firms and dividing this by the total of their sales. Many of our Canadian firms are not included in Compustat. For these, an industry classification was found in Dun and Bradstreet’s Canadian Directory. Since the industry codes used by Dun and Bradstreet are not identical to those used by Compustat, a conversion table was worked out using firms listed in both. The first three industry codes (in declining im- portance by sales in that industry) from Dun and Bradstreet were used in deriving the conversion table. U.S. matched-pair firms are the U.S. firms in the same three-digit industry as the Canadian firm in question for which the sum of the absolute values of the percentage differences in sales and firm age is minimized.
Operating income is defined as earnings gross of depreciation, interest, and tax payments. This is scaled by either total assets or total sales. Sales growth is measured in U.S. dollars for Canadian and US. firms. To reduce distortions caused by extraordinary events or macroeconomic factors, we smooth our measure by taking the median of the industry-adjusted profit

366 Randall K. Morck, David A. Stangeland, and Bernard Yeung ~~~-
Table l lA.2 Univariate Statistics for Canadian Firm-Level Data
Variable Standard
Mean Deviation Minimum Maximum
Operating income over assets, 1984-89:
Mean of annual observations Median of annual observations
Operating income over sales, 198489:
Mean of annual observations Median of annual observations
Mean of annual observations Median of annual observations
Growth in number of employees,
Mean of annual observations Median of annual observations
Growth in sales, 198G39:
198489:
Date of first incorporation Total sales in billions of 1988 U.S.
"h of votes controlled by largest dollars
shareholder with 20% or more
.O 107
.00686
.o 122 ,0101
,093 I .0297
,142 ,0384
1945
1.111
46. I
,0728 ,0592
,0887 ,0898
.4 12
. I78
,716 ,282
33.3
2.167
29.8
-.170 -.179
-.I69 -.I98
-.316 -.4367
-.742 -.742
1670
,0399
0
0.616 0.180
0.445 0.501
4.85 1.40
8.40 2.35
1987
15.6
100
Source: Sample is 200 firms, as in table 11.4. All mean and median variables are deviations from US. industry averages by three-digit SIC.
rates between 1984 and 1989 for each Canadian firm. The exchange rates at the beginning and the end of this period are almost identical at about $1.20 Canadian per US. dollar, despite swings in intermediate years. Since the median is usually calculated from six observations (an even number), after ordering the observations we define their median as the halfway point between the third and the fourth observations. We use the logarithm of total 1989 sales to measure firm size and the logarithm of the number of years since the firm's first incorporation date to measure firm age. This date is obtained from the Blue Book of Cunadiun Business, Who? Who, fi- nancial reports, and corporate histories.
Missing from this list of variables is a measure of stock market valua- tion. Many of the Canadian firms that we study have one or more classes of equity that do not trade publicly. It is not possible reliably to estimate variables such as q-ratios for these firms. Excluding these firms would re- sult in a very unrepresentative picture of the Canadian economy. Also, valuing firms that are included in control pyramids can be problematic as shares in other firms constitute large fractions of their assets.
Univariate statistics for all our variables are given in table 11A.2.

Inherited Wealth, Corporate Control, and Economic Growth 367
References
Acs, Zoltan J., Randall Morck, J. Myles Shaver, and Bernard Yeung. 1997. The internationalization of small and medium-sized enterprises: A policy perspec- tive. Small Business Economics 9:2-7.
Adventures with capital. 1997. Economist, 25 January, 17-18. Auditor was wrong on family trusts. 1996. Toronto Globe and Mail (electronic ed.),
19 September. Austin, Richard E. 1996. Labour-sponsored venture funds. Canadian Shareowner
9, no. 4 (MarchlApril): 9. Barro, Robert, and Jong-Wha Lee. 1996. International measures of schooling
years and schooling quality. American Economic Review, Papers and Proceedings 86, no. 2:218-23.
Beason, Richard, and David E. Weinstein. 1996. Growth, economies of scale, and targeting in Japan (1955-1990). Review of Economics and Statistics 78, no. 2 (May): 286-95.
Best, Andrea, and Devashis Mitra. 1997. The venture capital industry in Canada. Journal of Small Business Management 35, no. 2 (April): 105-10.
Betz, Frederick. 1993. Strategic technology management. New York: McGraw-Hill. Birdsall, Nancy, David Ross, and Richard Sabot. 1995. Inequality and growth re-
considered: Lessons from East Asia. World Bank Economic Review 9, no. 3 (Sep- tember): 477-508.
Boards Cut Out of Family Trees. 1996. International Herald Tribune, 2 February, 13, 17.
Daniels, Ronald J., and Randall Morck, eds. 1995. Corporate decision making in Canada. Calgary: Industry CanadalUniversity of Calgary Press.
Daniels, Ronald J., Randall Morck, and David Stangeland. 1995. In high gear: A case study of the Hees-Edper corporate group. In Corporate decision making in Canada, ed. Ronald J. Daniels and Randall Morck. Calgary: Industry Canada/ University of Calgary Press.
De Cordoba, Jose. 1995. Heirs battle over empire in Ecuador. Wall Street Journal (electronic ed.), 20 December.
Demsetz, Harold, and Kenneth Lehn. 1985. The structure of corporate ownership: Causes and consequences. Journal of Political Economy 93, no. 6 (December): 1155-77.
Directory of inter-corporate ownershQ. Various issues. Ottawa: Statistics Canada. Edwards, Sebastian. 1998. Openness, productivity and growth: What do we really
know? Economic Journal 108 (March): 383-98. Feldstein, Martin. 1995. The effects of outbound foreign direct investment on the
domestic capital stock. In The eflects of taxation on multinational corporations, ed. Martin Feldstein, James R. Hines Jr., and R. Glenn Hubbard. Chicago: University of Chicago Press.
Finance and economics: Europe’s great experiment. 1998. Economist, 13 June, 67-68.
Fishlow, Albert. 1996. Inequality, poverty, and growth: Where do we stand? World Bank Research Observer: Annual Conference, suppl., 25-39.
Hagger, Euan. 1997. Will Europe get its high yield market? International Bond Investor, April, 21-32.
Heinzl, John. 1995. Bata CEO quits after only a year, in shakeup at top. Toronto Globe and Mail (electronic ed.), 7 October.
Holmes, Kim, Bryan Johnson, and Melanie Kirkpatrick. 1997. The I997 index of

368 Randall K. Morck, David A. Stangeland, and Bernard Yeung
economic freedom. New York: Wall Street Journal; Washington, D.C.: Heritage Foundation.
Hoshi, Takeo, Anil Kashyap, and David Scharfstein. 1990. The role of banks in reducing the costs of financial distress in Japan. Journal of Financial Econom- ics 27:67-88.
Jensen, Michael, and William Meckling. 1976. The theory of the firm: Managerial behavior, agency costs, and ownership structure. Journal of Financial Econom- ics 3:305-60.
Khanna, Tarun, and Krishna Palepu. 1999. Policy shocks, market intermediaries, and corporate strategy: The evolution of business groups in Chile and India. Journal of Economics and Management Strategy 8, no. 2:271-310.
Kim, E. Han, Myeong Kyun Kim, and Jay K. Yi. 1998. Economic value-added of non-financial firms listed on the Korea stock exchange. Seoul: Korea Stock Ex- change.
Kim, E. Han, and Vijay Singal. 1993. Mergers and market power: Evidence from the airline industry. American Economic Review 83, no. 3 (June): 549-69.
La Porta, Rafael, Florencio Lopez-de-Silanes, and Andrei Shleifer. 1999. Corpo- rate ownership around the world. Journal of Finance 54, no. 2:471-517.
La Porta, Rafael, Florencio Lopez-de-Silanes, Andrei Shleifer, and Robert Vishny. 1997. Legal determinants of external finance. Journal of Finance 52, no. 3:
. 1998. Law and finance. Journal of Political Economy 106, no. 6 (Decem- ber): 11 12-55.
Latour, Almar, and Greg Steinmetz. 1998. Investor AB chairman tries balancing family’s values with shareholder values. Wall Street Journal (electronic ed.), 18 May.
MacIntosh, Jefferey G. 1994. Legal and institutional barriers to financing innova- tive enterprises in Canada. Discussion Paper no. 94-10. Kingston: Queen’s Uni- versity School of Policy Studies.
Mankiw, N. Gregory. 1995. The growth of nations. Brookings Papers on Economic Activity, no. 1:275-310.
McConnell, John J., and Henri Servaes. 1990. Additional evidence on equity owner- ship and corporate value. Journal of Financial Economics 27, no. 2595-612.
McLaughlin, Gord. 1995a. In the name of the father and the son. Financial Post, 20 September, 14-15.
1 13 1-50.
. 1995b. What if he dies? Financial Post, 23 September, 14. Morck, Randall, Andrei Shleifer, and Robert Vishny. 1988. Management owner-
ship and corporate performance: An empirical analysis. Journal of Financial Economics 20 (JanuarylMarch): 293-3 16.
Murray, Gordon C. 1998. A policy response to regional disparities in the supply of risk capital to new technology-based firms in the European Union: The Euro- pean seed capital fund scheme. Regional Studies 32, no. 5 (July): 405-19.
Olson, Mancur. 1982. The rise and decline qfnations: Economic growth, stagflation, and .social rigidities. New Haven, Conn.: Yale University Press.
Shleifer, Andrei, and Robert Vishny. 1986. Large shareholders and corporate con- trol. Journal of Political Economy 95:461-88.
. 1989. Management entrenchment: The case of manager-specific invest- ments. Journal of Financial Economics 25, no. 1 (November): 123-39.
Strom, Stephanie. 1996. In Sweden, a shy dynasty steps out. New York Times (elec- tronic ed.), 12 May.
Stulz, Rene. 1988. On takeover resistance, managerial discretion, and shareholder wealth. Journal of Financial Economics 20, nos. 112 (JanuarylMarch): 25-54.
Thompson, Aileen J. 1994. Trade liberalization, comparative advantage, and scale

Inherited Wealth, Corporate Control, and Economic Growth 369
economies: Stock market evidence from Canada. Journal of International Eco- nomics 37: 1-27.
Wolfenzohn, Daniel. 1998. A theory of pyramidal ownership. University of Michi- gan, Department of Economics. Typescript.
Comment David M. Levy
I have essentially one comment on the vastly instructive paper by Morck, Stangeland, and Yeung (MSY): Why do they constrain their analysis, both positive and normative, to the mean of a distribution? Of course, this query is not directed specifically to MSY but to the literature of which they are such distinguished exemplars.
Why a Regression Mean?
The international data set used by MSY is of highly mixed quality. Or- dinary least squares (OLS) regression estimates-a multiple-dimension generalization of a sample mean-are highly sensitive to contamination of high-quality data by data of a lesser quality. To shelter their technique from the hard facts of data quality, MSY restrict their international regres- sions to forty-one countries. Perhaps techniques more robust to violations of ideal conditions than OLS might reveal information from an extended data set.
What concerns me is that, in a context in which MSY attempt to find the effect of politically connected billionaires, their technique-driven ex- clusion of some countries may hide some enormously interesting questions of political stability. It can be argued, in particular, that central planning was a device by which the politically connected exploited others-and thus central planning created political billionaires in terms of consump- tion if not measured income (Levy 1990). Thus, the fact of the breakdown of the planned economies-justifying their exclusion from the regres- sions-is precisely the kind of evidence of the effect of politically con- nected wealth for which MSY are looking.
For an example of political wealth and political instability, consider MSY’s table 1 1.1 “politician billionaire wealth” series. I find it most illu- minating that the maximum of the series occurs with Indonesia! Newspa- per accounts tell us that it was precisely the concern of the ruling family for its own well-being to the exclusion of other considerations that moti- vated the recent upheavals.
David M. Levy is associate professor of economics at George Mason University and a
Thanks are due to Andrew Farrant for error detection. research associate of the Center for the Study of Public Choice.

370 Randall K. Morck, David A. Stangeland, and Bernard Yeung
Why Mean Income?
The dependent variable in MSY’s cross-country regressions is per capita income. The justification for this is twofold: (a) the data are available, and (6) traditional economic utilitarianism uses mean income as a serviceable scalar metric of well-being. I think that there is really only one justifica- tion-economic utilitarianism tells us what data we ought to have col- lected.
The consequence of mean income as metric is that it makes no differ- ence to whom the income goes. It makes no difference on this metric whether income is widely shared or concentrated in a few politically con- nected families. The reaction of many economists to this issue has been to renounce scalar metrics of well-being in favor of vectors, for example, to argue for a trade-off between “efficiency” and “equity” to take distribu- tional issues into account.
Nonetheless, mean-based utilitarianism runs as deep as can be in mod- ern economics. Consider what we teach our students about the efficiency of competition and monopoly. A competitive industry is more efficient than a single-price monopoly because the welfare triangle loss means that there is less income to divide between producer and consumer. Thus, a perfectly discriminating firm is as efficient as a competitive industry pre- cisely because there is no welfare triangle loss (Robinson 1933). Distribu- tion of income bctween producers and consumers is irrelevant to welfare judgments. But, again, this is a simple property of means.
Before utilitarianism was even named, a group of thinkers who moved seamlessly between economics and philosophy-Adam Smith, William Paley, and T. R. Malthus-argued that the well-being of the majority ought to be the metric by which we judge societies.’ A utilitarianism recen- tered to consider median well-being has the enormous appeal of making explicit the link to political stability via the median-voter approach to democratic politics (Downs 1957).
As an illustration of how a median-based welfare evaluation might modify our results, consider how the evaluation of competition and mo- nopoly would change. Let there be N consumers but only K firm owners, where N/2 > K 2 1. Thus, the median member of society is a consumer, and, to find a social rank, we look only at the consumer’s surplus. The rank- ing is obvious: competition, single-price monopoly, perfect discrimina- tion. Thus, the social ranking of competition and single-price monopoly would remain unchanged, but the perfect discrimination case would move from a tie for first to dead last.
If MSY were to think about their model in terms of median income
1. Levy (1995) discusses Smith in this context; Hollander (1997, 830-31) discusses Mal- thus’s median-based utilitarianism. Paley’s majoritarianism is clear at Paley (1 785, 61-67).

Inherited Wealth, Corporate Control, and Economic Growth 371
instead of mean income, the link between political stability-and thus what countries have nice enough to data with which to work!-and the underlying norm would seem to me to be more natural.
Conclusion
Economists unsatisfied with the use of mean income as a scalar metric of social well-being sometimes propose adding considerations of “equity.” If equity concerns are something that the political process addresses with a democratic procedure, then such equity considerations could be more closely approximated by considering the well-being of the median member of society.
References
Downs, Anthony. 1957. An economic theory of democracy. New York: Harper &
Hollander, Samuel. 1997. The economics of Thomas Robert Malthus. Toronto: Uni-
Levy, David M. 1990. The bias in centrally planned prices. Public Choice 67:
. 1995. The partial spectator in the Wealth of Nations: A robust utilitarian-
Row.
versity of Toronto Press.
213-36.
ism. European Journal of the History of Economic Thought 21299-326. Paley, William. 1785. The principles of moral and political philosophy. London. Robinson, Joan. 1933. The economics of imperfect competition, London: Mac-
millan.

This Page Intentionally Left Blank