this text was adapted by the saylor foundation under a ...cfaresources.s3.amazonaws.com/ba...
TRANSCRIPT
Saylor URL: http://www.saylor.org/books Saylor.org 1
This text was adapted by The Saylor Foundation under a Creative
Commons Attribution-NonCommercial-ShareAlike 3.0 License without
attribution as requested by the work’s original creator or licensee.
Saylor URL: http://www.saylor.org/books Saylor.org 4
Chapter 1
What Is Managerial Accounting?
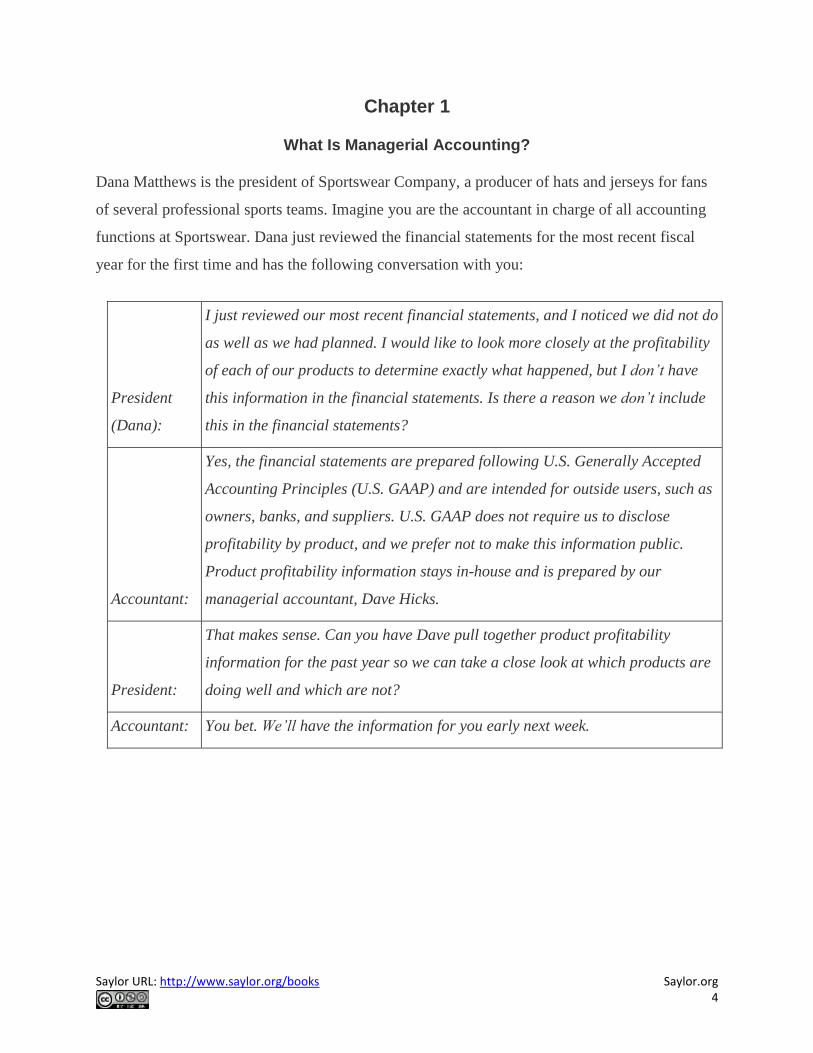
Dana Matthews is the president of Sportswear Company, a producer of hats and jerseys for fans
of several professional sports teams. Imagine you are the accountant in charge of all accounting
functions at Sportswear. Dana just reviewed the financial statements for the most recent fiscal
year for the first time and has the following conversation with you:
President
(Dana):
I just reviewed our most recent financial statements, and I noticed we did not do
as well as we had planned. I would like to look more closely at the profitability
of each of our products to determine exactly what happened, but I don’t have
this information in the financial statements. Is there a reason we don’t include
this in the financial statements?
Accountant:
Yes, the financial statements are prepared following U.S. Generally Accepted
Accounting Principles (U.S. GAAP) and are intended for outside users, such as
owners, banks, and suppliers. U.S. GAAP does not require us to disclose
profitability by product, and we prefer not to make this information public.
Product profitability information stays in-house and is prepared by our
managerial accountant, Dave Hicks.
President:
That makes sense. Can you have Dave pull together product profitability
information for the past year so we can take a close look at which products are
doing well and which are not?
Accountant: You bet. We’ll have the information for you early next week.

Saylor URL: http://www.saylor.org/books Saylor.org 5
1.1 Characteristics of Managerial Accounting
L E A R N I N G O B J E C T I V E
1. Compare characteristics of financial and managerial accounting.
Question: The issue facing the president at Sportswear is a common one. Companies prefer not
to disclose more information than is required by U.S. GAAP, but they would like to have more
detailed information for internal decision-making and performance-evaluation purposes. This is
why it is important to distinguish between financial and managerial accounting. What is the
difference between information prepared by financial accountants and information prepared by
managerial accountants?
Answer: Financial accounting focuses on providing historical financial information to external
users. External users are those outside the company, including owners (e.g., shareholders) and
creditors (e.g., banks or bondholders). Financial accountants reporting to external users are
required to followU.S. Generally Accepted Accounting Principles (U.S. GAAP), a set of
accounting rules that requires consistency in recording and reporting financial information. This
information typically summarizes overall company results and does not provide detailed
information.
Managerial accounting focuses on internal users—executives, product managers, sales managers,
and any other personnel within the organization who use accounting information to make
important decisions. Managerial accounting information need not conform with U.S. GAAP. In
fact, conformance with U.S. GAAP may be a deterrent to getting useful information for internal
decision-making purposes. For example, when establishing an inventory cost for one or more
units of product (each jersey or hat produced at Sportswear Company), U.S. GAAP requires that
production overhead costs, such as factory rent and factory utility costs, be included. However,
for internal decision-making purposes, it might make more sense to include nonproduction costs
that are directly linked to the product, such as sales commissions or administrative costs.
Saylor URL: http://www.saylor.org/books Saylor.org 6
Question: It’s clear that financial accounting focuses on reporting to outside users while
managerial accounting focuses on reporting to inside users. What specific characteristics would
we expect to see in managerial accounting information?
Answer: Managerial accounting often focuses on making future projections for segments of a
company. Suppose Sportswear Company is considering introducing a new line of coffee mugs
with team logos on each mug. Management would certainly need detailed financial projections
for sales, costs, and the resulting profits (or losses). Although historical financial accounting data
from other product lines would be useful, preparing projections for the new line of mugs would
be a managerial accounting function.
Another characteristic of managerial accounting data is its high level of detail. As noted in the
opening dialogue between the president and accountant at Sportswear Company, the financial
information in the annual report provides a general overview of the company’s financial results
but does not provide any detailed information about each product. Information, such as product
profitability, would come from the managerial accounting function.
Finally, managerial accounting information often takes the form of nonfinancial measures. For
example, Sportswear Company might measure the percentage of defective products produced or
the percentage of on-time deliveries to customers. This kind of nonfinancial information comes
from the managerial accounting function.
Table 1.1 "Comparison of Financial and Managerial Accounting" summarizes the characteristics
of both managerial and financial accounting.

Saylor URL: http://www.saylor.org/books Saylor.org 7
Table 1.1 Comparison of Financial and Managerial Accounting
Managerial Accounting Financial Accounting
Users Inside the organization Outside the organization
Accounting rules None
U.S. Generally Accepted Accounting Principles
(U.S. GAAP)
Time horizon Future projections (sometimes historical if in detail) Historical information
Level of detail
Often presents segments of an organization (e.g.,
products, divisions, departments)
Presents overall company information in
accordance with U.S. GAAP
Performance
measures Financial and nonfinancial Primarily financial
Follow-Up at Sportswear Company
Question: What did the president at Sportswear Company learn about product profitability from
the information provided by the managerial accountant?
Answer: The president at Sportswear, Dana Matthews, learned that the hats product line was
much more profitable than expected, accounting for 55 percent of the company’s profits even
though initial estimates were that the hat segment would account for 40 percent of company
profits. Conversely, the jerseys product line was much less profitable than expected, accounting
for 45 percent of the company’s profits.
There are many issues associated with determining product profitability, including how to
allocate costs that are not easily traced to each product and whether the product revenue and cost
information is accurate enough to make important managerial decisions. These important issues
will be addressed throughout the book.

Saylor URL: http://www.saylor.org/books Saylor.org 10
1.2 Planning and Control Functions Performed by Managers
L E A R N I N G O B J E C T I V E
1. Describe the planning and control functions performed by managers.
Question: Managers of most organizations continually plan for the future, and after the plan is
implemented, managers assess whether they achieved their goals. What are the two functions
that enable management to go through the process of continually planning and evaluating?
Answer: The two important functions that enable management to continually plan for the future
and assess implementation are called planning and control. Planning is the process of
establishing goals and communicating these goals to employees of the organization.
The controlfunction is the process of evaluating whether the organization’s plans were
implemented effectively.
Planning
Question: Continually planning for the future is an important quality of many successful
organizations, such as Southwest Airlines (discussed in Note 1.11 "Business in Action 1.1"). How
do organizations formalize their strategic plans?
Answer: Organizations formalize their plans by creating a budget, which is a series of reports
used to quantify an organization’s plans for the future. For example, Ernst & Young, an
international accounting firm, plans for the future by establishing a budget indicating the labor
hours required to perform specific services for each client. The process of creating a budget for
each client enables the firm to plan for future staffing needs and communicate these needs to
employees of the company. Rather than simply hoping it all works out in the end, Ernst &
Young projects the labor hours required in the future, hires accounting staff based on these
projections, and schedules the staff required for each client.
A budget can take a variety of forms. A budgeted income statement indicates a profit plan for the
future. A capital budget shows the long-term investments planned for the future. A cash flow

Saylor URL: http://www.saylor.org/books Saylor.org 11
budget outlines cash inflows and outflows for the future. We provide more information about
how budgets can be used for planning purposes in later chapters.
Business in Action 1.1
Plans for the Future
Review the annual report or 10K for just about any company, and you are likely to find information regarding
plans for the future. Here are some examples:
Southwest Airlines. A low-fare, short-haul carrier that targets business commuters as well as leisure travelers
states in its annual report, “We are focused on four big initiatives: the AirTran integration, the All-New Rapid
Rewards program, the addition of the Boeing 737–800 in 2012, and the replacement of our reservations system.”
Sears Holdings Corporation. A multiline retailer that offers a wide array of merchandise and related services
states in its 10K report, “We will continue to invest in our online properties. By integrating our vast store network
with our online properties, we believe that Sears Holdings will succeed in the rapidly evolving retail
environment.”
Nordstrom, Inc. A fashion specialty retailer indicates in its 10K report that its “strategic growth plan includes
opening new Nordstrom full-line and Nordstrom Rack stores, with 6 announced Nordstrom full-line and 18
announced Nordstrom Rack store openings, the majority of which will occur by 2012.”
As these companies go through the process of making decisions about the future, developing plans based on
their decisions, and controlling the implementation of their plans, managerial accounting information will play
a key role in all phases of the process.
Sources: Southwest Airlines, “Annual Report, 2010,”http://www.southwest.com; Sears Holdings
Corporation, “10K Report, 2010,” http://www.searsholdings.com; Nordstrom, Inc., “10K Report,
2010,” http://www.nordstrom.com.
Control
Question: Although planning for the future is important, plans are only effective if implemented
properly. How do organizations assess the implementation of their plans?
Answer: The control function evaluates whether an organization’s plans were implemented
effectively and often leads to recommendations for the future. Many organizations compare

Saylor URL: http://www.saylor.org/books Saylor.org 12
actual results with the initial plan (or budget) to evaluate performance of employees,
departments, or the entire organization.
For example, assume Ernst & Young creates a budget indicating the labor hours needed to
perform tax services for a particular client (this is theplanning function). After the work is
performed, actual labor hours used to complete the work are compared to budgeted labor hours.
This analysis is then used to evaluate whether employees were able to complete the work within
the budgeted time and often results in recommendations for the future. Recommendations might
include the need for adding more labor hours to the budget or obtaining better support documents
from the client.
Planning and controlling operations are critical functions within most organizations. In today’s
business environment, effective planning and control by managers can be the key to survival.
K E Y T A K E A W A Y
Managers continually plan and control operations within organizations. Planning involves establishing goals and
communicating these goals to employees of the organization. The control function assesses whether goals were
achieved and is often used to evaluate the performance of employees, departments, and the organization as a whole.
R E V I E W P R O B L E M 1 . 2
Assume you are preparing a personal budget of all income and expenses for next month.
1. Describe the planning and control functions of this process.
2. What benefits might be derived from performing the planning and control functions for a personal budget?
Solution to Review Problem 1.2
1. The planning function would involve establishing income and expense goals for next month. Possible sources
of income include wages, scholarships, or student loans. Expenses might include rent, textbooks, tuition, food,
entertainment, and transportation.
The control function occurs after the end of the month and involves comparing actual income and expenses
with budgeted income and expenses. This allows for the evaluation of whether income and expense goals
were achieved.
Saylor URL: http://www.saylor.org/books Saylor.org 28
1.6 Cost Terminology
LEARNING OBJECTIVE
1. Understand the terms used for costing purposes.
Question: Much of what we discuss in this book relates to companies that manufacture products,
such as Nike and Apple, and terminology is a key component of accounting for manufacturing
companies. The challenge is in classifying costs correctly for items such as production materials,
production labor, marketing department labor, rent for production facilities, and rent for the
administrative services facilities. These costs must be classified accurately so that they appear
correctly in company financial reports. The starting point for learning how to classify costs
correctly is in understanding two broad categories of costs. What are the two broad terms used
to categorize cost information in a manufacturing setting?
Answer: The two broad categories of costs are manufacturing costs andnonmanufacturing costs.
Each category is described in detail as follows.
Manufacturing Costs
All costs related to the production of goods are called manufacturing costs; they are also referred
to as product costs. A manufacturer purchases materials, employs workers who use the materials
to assemble the goods, provides a building where the materials are stored and goods are
assembled, and sells the goods. We classify the costs associated with these activities into three
categories: direct materials, direct labor, and manufacturing overhead.
To help clarify which costs are included in these three categories, let’s look at a furniture
company that specializes in building custom wood tables called Custom Furniture Company.
Each table is unique and built to customer specifications for use in homes (coffee tables and
dining room tables) and offices (boardroom and meeting room tables). The sales price of each
table varies significantly, from $1,000 to more than $30,000. Figure 1.4 "Direct Materials, Direct
Labor, and Manufacturing Overhead at Custom Furniture Company" shows examples of
production activities at Custom Furniture Company for each of the three categories (we continue

Saylor URL: http://www.saylor.org/books Saylor.org 29
using this company as an example in Chapter 2 "How Is Job Costing Used to Track Production
Costs?").
Direct Materials
Question: Raw materials used in the production process that are easily traced to the product are
called direct materials. What materials used in the production process at Custom Furniture
would be classified as direct materials?
Answer: The wood used to build tables and the hardware used to attach table legs would be
considered direct materials. Small, inexpensive items like glue, nails, and masking tape are
typically not included in direct materials because the cost of tracing these items to the product
outweighs the benefit of having accurate cost data. These minor types of materials, often
calledsupplies or indirect materials, are included in manufacturing overhead, which we define
later.
Direct Labor
Question: Workers who convert materials into a finished product and whose time is easily traced
to the product are called direct labor. Who represents direct labor at Custom Furniture?
Answer: Direct labor would include the workers who use the wood, hardware, glue, lacquer, and
other materials to build tables.
Manufacturing Overhead
Question: All costs associated with the production process other than direct material costs and
direct labor costs are called manufacturing overhead. Terms synonymous with manufacturing
overhead include factory overhead, factory burden, and overhead. What items are included in
manufacturing overhead?
Answer: Manufacturing overhead consists of the following:
Indirect material costs. The cost of materials necessary to manufacture a product that
are not easily traced to the product or not worth tracing to the product.
Saylor URL: http://www.saylor.org/books Saylor.org 30
Indirect labor costs. The cost of workers who are involved in the production process but
whose time cannot easily be traced to the product. For example, supervisors in the
production process who oversee several different products and are responsible for hiring
employees, scheduling employees, and ordering materials are considered indirect labor.
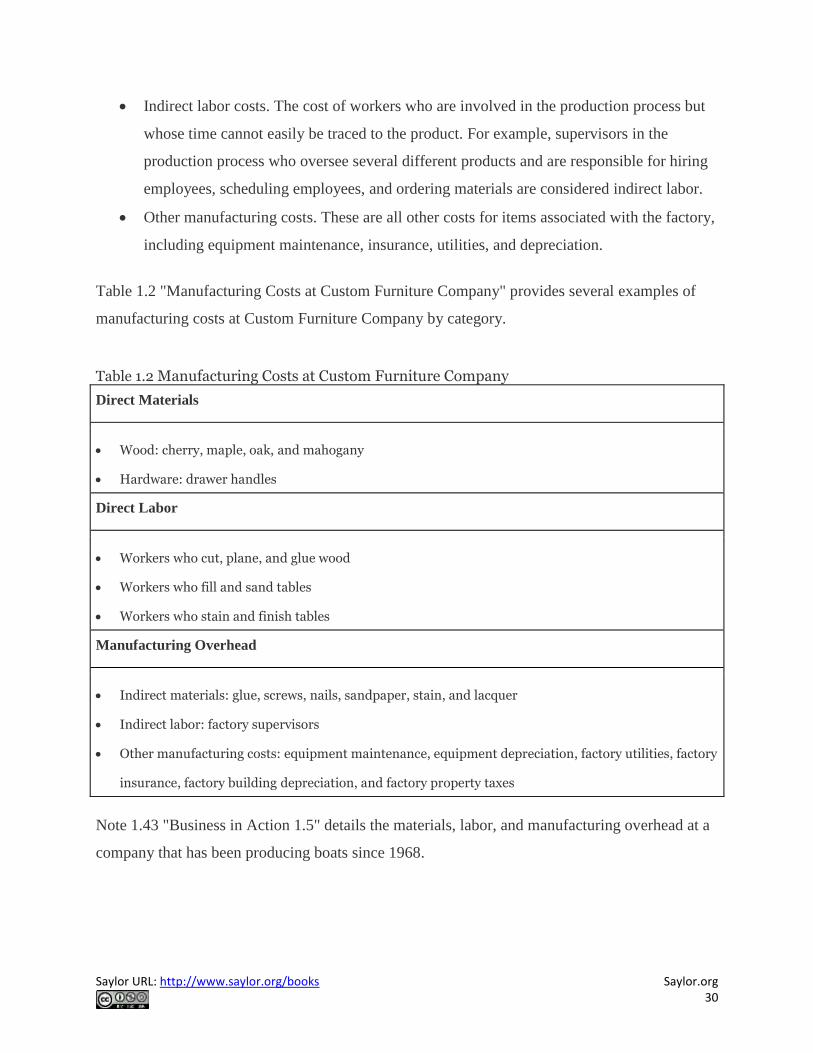
Other manufacturing costs. These are all other costs for items associated with the factory,
including equipment maintenance, insurance, utilities, and depreciation.
Table 1.2 "Manufacturing Costs at Custom Furniture Company" provides several examples of
manufacturing costs at Custom Furniture Company by category.
Table 1.2 Manufacturing Costs at Custom Furniture Company
Direct Materials
Wood: cherry, maple, oak, and mahogany
Hardware: drawer handles
Direct Labor
Workers who cut, plane, and glue wood
Workers who fill and sand tables
Workers who stain and finish tables
Manufacturing Overhead
Indirect materials: glue, screws, nails, sandpaper, stain, and lacquer
Indirect labor: factory supervisors
Other manufacturing costs: equipment maintenance, equipment depreciation, factory utilities, factory
insurance, factory building depreciation, and factory property taxes
Note 1.43 "Business in Action 1.5" details the materials, labor, and manufacturing overhead at a
company that has been producing boats since 1968.

Saylor URL: http://www.saylor.org/books Saylor.org 31
Business in Action 1.5
Photo courtesy of Brian Miller,http://www.flickr.com/photos/13233728@N00/5155012186/
Manufacturing Costs at MasterCraft
MasterCraft produces boats for water skiers and wake boarders. Each boat produced
incurs significant manufacturing costs. MasterCraftrecords these manufacturing costs as
inventory on the balance sheet until the boats are sold, at which time the costs are
transferred to cost of goods sold on the income statement.
Examples of direct materials for each boat include the hull, engine, transmission, carpet,
gauges, seats, windshield, and swim platform. Examples of indirect materials (part of
manufacturing overhead) include glue, paint, and screws. Direct labor includes the
production workers who assemble the boats and test them before they are shipped out.
Indirect labor (part of manufacturing overhead) includes the production supervisors who
oversee production for several different boats and product lines.

Saylor URL: http://www.saylor.org/books Saylor.org 32
Manufacturing overhead includes the indirect materials and indirect labor mentioned
previously. Other manufacturing overhead items are factory building rent, maintenance and
depreciation for production equipment, factory utilities, and quality control testing.
Source: MasterCraft, “Home Page,” http://www.mastercraft.com.
Nonmanufacturing Costs
Costs that are not related to the production of goods are callednonmanufacturing costs; they are
also referred to as period costs. These costs have two components—selling costs and general and
administrative costs—which are described next. Examples of nonmanufacturing costs appear
in Figure 1.5 "Examples of Nonmanufacturing Costs at Custom Furniture Company".
Selling Costs
Question: Costs incurred to obtain customer orders and provide customers with a finished
product are called selling costs. (They are also often called marketing costs or selling and
advertising costs.) What activities would be classified as selling costs at Custom Furniture?
Answer: Examples of selling costs include advertising, sales commissions, salaries for
marketing and advertising personnel, office space for marketing and advertising personnel,
finished goods storage costs, and shipping costs paid by the seller for products shipped to
customers.
General and Administrative Costs
Question: Costs related to the overall management of an organization are
calledgeneral and administrative costs. What activities would be classified as general and
administrative costs at Custom Furniture?
Answer: Examples include personnel and support staff in the following areas: accounting,
human resources, legal, executive, and information technology. Depreciation of office equipment
and buildings associated with these areas would also be included as general and administrative
costs. General and administrative costs are often simply called administrative costs.

Saylor URL: http://www.saylor.org/books Saylor.org 33
Figure 1.5 Examples of Nonmanufacturing Costs at Custom Furniture Company
Although selling costs and general and administrative costs are considered nonmanufacturing
costs, managers often want to assign some of these costs to products for decision-making
purposes. For example, sales commissions and shipping costs for a specific product could be
assigned to the product. This does not comply with U.S. GAAP because, under U.S. GAAP, only
product costs can be assigned to products. However, as we noted earlier, managerial accounting
information is tailored to meet the needs of the users and need not follow U.S. GAAP.
Distinguishing between manufacturing and nonmanufacturing costs is not always simple. For
example, if legal staff works on an issue associated with production personnel and if human
resources staff hires assembly line workers, are the costs involved manufacturing or
nonmanufacturing costs? It is up to each organization to determine how to handle such costs for
product costing purposes. The advantage of managerial accounting over financial accounting is
that costs can be organized in any manner that helps managers make decisions. However, in this
chapter, to avoid ambiguity, we follow the definitions provided by U.S. GAAP.
Saylor URL: http://www.saylor.org/books Saylor.org 34
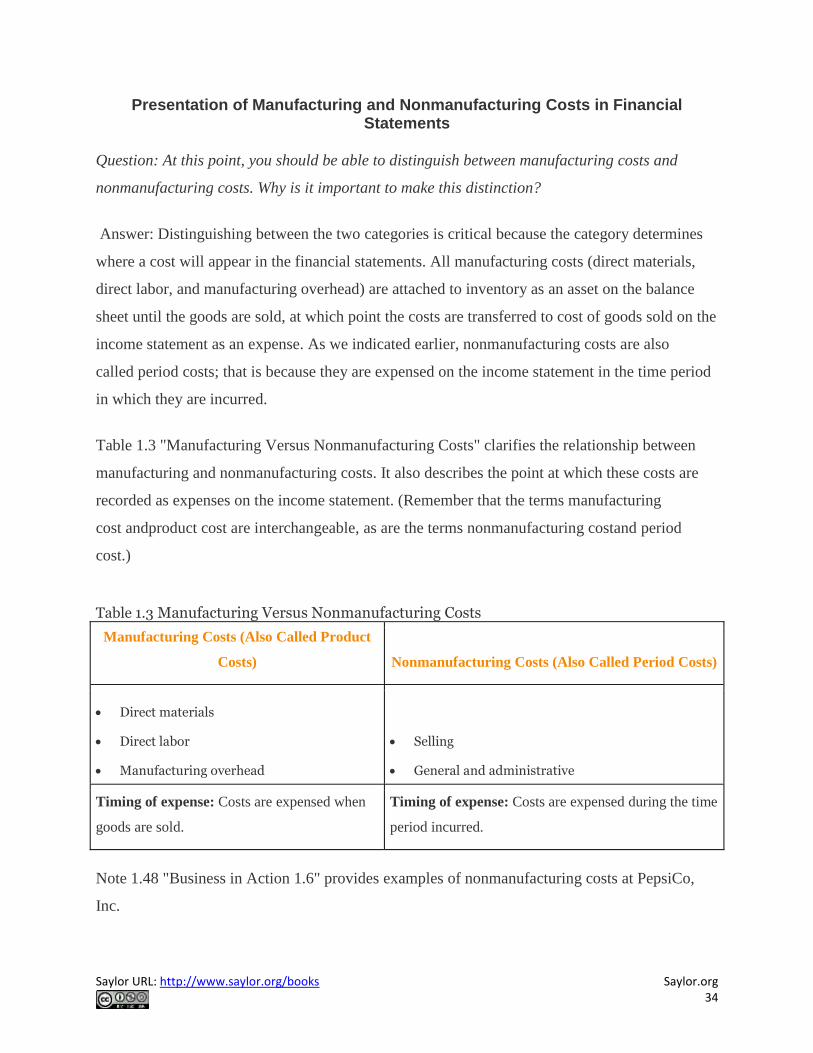
Presentation of Manufacturing and Nonmanufacturing Costs in Financial Statements
Question: At this point, you should be able to distinguish between manufacturing costs and
nonmanufacturing costs. Why is it important to make this distinction?
Answer: Distinguishing between the two categories is critical because the category determines
where a cost will appear in the financial statements. All manufacturing costs (direct materials,
direct labor, and manufacturing overhead) are attached to inventory as an asset on the balance
sheet until the goods are sold, at which point the costs are transferred to cost of goods sold on the
income statement as an expense. As we indicated earlier, nonmanufacturing costs are also
called period costs; that is because they are expensed on the income statement in the time period
in which they are incurred.
Table 1.3 "Manufacturing Versus Nonmanufacturing Costs" clarifies the relationship between
manufacturing and nonmanufacturing costs. It also describes the point at which these costs are
recorded as expenses on the income statement. (Remember that the terms manufacturing
cost andproduct cost are interchangeable, as are the terms nonmanufacturing costand period
cost.)
Table 1.3 Manufacturing Versus Nonmanufacturing Costs
Manufacturing Costs (Also Called Product
Costs) Nonmanufacturing Costs (Also Called Period Costs)
Direct materials
Direct labor
Manufacturing overhead
Selling
General and administrative
Timing of expense: Costs are expensed when
goods are sold.
Timing of expense: Costs are expensed during the time
period incurred.
Note 1.48 "Business in Action 1.6" provides examples of nonmanufacturing costs at PepsiCo,
Inc.
Saylor URL: http://www.saylor.org/books Saylor.org 35
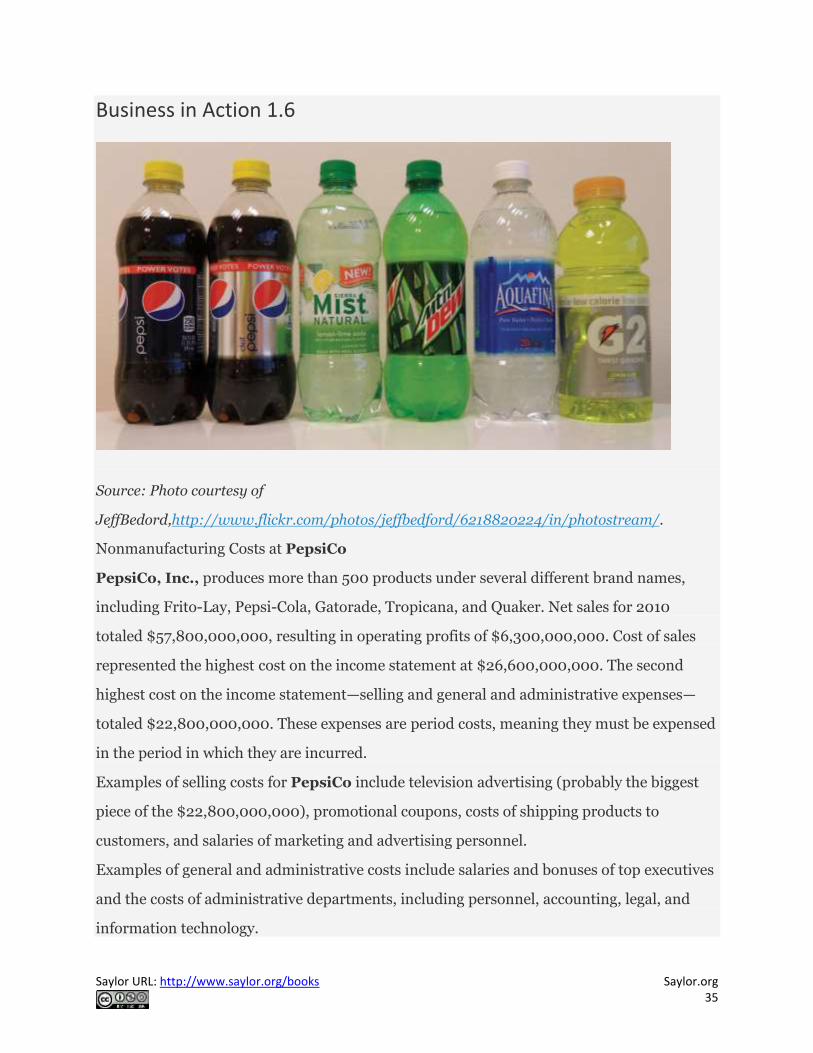
Business in Action 1.6
Source: Photo courtesy of
JeffBedord,http://www.flickr.com/photos/jeffbedford/6218820224/in/photostream/.
Nonmanufacturing Costs at PepsiCo
PepsiCo, Inc., produces more than 500 products under several different brand names,
including Frito-Lay, Pepsi-Cola, Gatorade, Tropicana, and Quaker. Net sales for 2010
totaled $57,800,000,000, resulting in operating profits of $6,300,000,000. Cost of sales
represented the highest cost on the income statement at $26,600,000,000. The second
highest cost on the income statement—selling and general and administrative expenses—
totaled $22,800,000,000. These expenses are period costs, meaning they must be expensed
in the period in which they are incurred.
Examples of selling costs for PepsiCo include television advertising (probably the biggest
piece of the $22,800,000,000), promotional coupons, costs of shipping products to
customers, and salaries of marketing and advertising personnel.
Examples of general and administrative costs include salaries and bonuses of top executives
and the costs of administrative departments, including personnel, accounting, legal, and
information technology.

Saylor URL: http://www.saylor.org/books Saylor.org 39
15. General and administrative
16. Manufacturing overhead
1.7 How Product Costs Flow through Accounts
LEARNING OBJECTIVE
1. Identify how costs flow through the three inventory accounts and cost of goods sold account.
Question: Custom Furniture Company’s direct materials include items such as wood and
hardware. Direct labor involves the employees who build the custom tables. Manufacturing
overhead includes items such as indirect materials (glue, screws, nails, sandpaper, and stain),
indirect labor (production supervisor), and other manufacturing costs, such as factory
equipment maintenance and factory utilities. What accounts are used to record the costs
associated with these items, and where do these accounts appear in the financial statements?
Answer: All the costs mentioned previously for Custom Furniture are product costs (also
called manufacturing costs). Product costs are recorded as an asset on the balance sheet until the
products are sold, at which point the costs are recorded as an expense on the income statement.
To record product costs as an asset, accountants use one of three inventory accounts: raw
materials inventory, work-in-process inventory, or finished goods inventory. The account they
use depends on the product’s level of completion. They use one expense account—cost of goods
sold—to record the product costs when the goods are sold.
Table 1.4 "Accounts Used to Record Product Costs" summarizes the accounts used to track
product costs. Figure 1.6 "Flow of Product Costs through Balance Sheet and Income Statement
Accounts" shows how product costs flow through the balance sheet and income statement.
Lastly, Note 1.57 "Business in Action 1.7" provides an example of how the accounts shown in
Table 1.4 and Figure 1.6 appear in financial statements. Take time to review these items
carefully. Your understanding of them will help clarify how product costs flow through the
accounts and where product costs appear in the financial statements. The following discussion
provides further clarification.
Saylor URL: http://www.saylor.org/books Saylor.org 40
Product Costs on the Balance Sheet
Question: What is the difference between raw materials inventory, work-in-process inventory,
and finished goods inventory?
Answer: Each of these accounts is used to record product costs depending on where the product
is in the production process, and each account is an asset account on the balance sheet.
Raw Materials
The raw materials inventory account records the cost of materials not yet put into production. For
Custom Furniture Company, this account includes items such as wood, brackets, screws, nails,
glue, lacquer, and sandpaper.
Work in Process
The work-in-process (WIP) inventory account records the costs of products that have not yet
been completed. Suppose Custom Furniture Company has eight tables that are still in production
at the end of the year. All manufacturing costs associated with these incomplete eight tables—
direct materials, direct labor, and manufacturing overhead—are included in the WIP inventory
account.
Once goods in WIP inventory are completed, they are transferred into finished goods inventory.
The cost of completed goods that are transferred out of WIP inventory into finished goods
inventory is called thecost of goods manufactured.
Finished Goods
The finished goods inventory account records the manufacturing costs of products that are
completed and ready to sell. Suppose Custom Furniture Company has five completed tables at
the end of the year (in addition to the eight partially completed tables in work-in-process
inventory). The manufacturing costs of these five tables—direct materials, direct labor, and
manufacturing overhead—are included in the finished goods inventory account until the tables
are sold. (For the purposes of this example, assume the tables are “sold” when delivered to the
customer.)

Saylor URL: http://www.saylor.org/books Saylor.org 41
Product Costs on the Income Statement
Question: The costs of materials not yet put into production are included in raw materials
inventory. The costs associated with products that are not yet complete are included in WIP
inventory. And the costs associated with products that are completed and ready to sell are
included in finished goods inventory.What happens to the product costs in finished goods
inventory when the products are sold?
Answer: When completed goods are sold, their costs are transferred out of finished goods
inventory into the cost of goods sold account. Cost of goods sold is an expense account on the
income statement that represents the product costs of all goods sold during the period.
For example, suppose Custom Furniture Company sells one table that cost $3,000 to produce
(i.e., direct materials, direct labor, and manufacturing overhead costs incurred to produce the
table total $3,000). The $3,000 cost is in finished goods inventory until the entry is made to
record the sale, at which time finished goods inventory is reduced by $3,000 (the table is no
longer in inventory) and cost of goods sold is increased by $3,000.
Table 1.4 Accounts Used to Record Product Costs
Account Name Description Financial Statement
Raw materials inventory Cost of unused production materials Balance sheet (asset)
Work-in-process inventory Cost of incomplete products Balance sheet (asset)
Finished goods inventory Cost of completed products not yet sold Balance sheet (asset)
Cost of goods sold Cost of products sold Income statement (expense)

Saylor URL: http://www.saylor.org/books Saylor.org 42
Figure 1.6 Flow of Product Costs through Balance Sheet and Income Statement Accounts
Business in Action 1.7
Saylor URL: http://www.saylor.org/books Saylor.org 43
Source: Photo courtesy of Matthew
Rutledge,http://www.flickr.com/photos/rutlo/4252743250//.
Presentation of Product Costs at Advanced Micro Devices
Advanced Micro Devices (AMD), a producer of microprocessors and flash memory
devices for personal and networked computers, has annual revenues of $6,500,000,000. A
summarized version of AMD’sbalance sheet appears as follows (all amounts are in
millions). Notice that three inventory accounts, totaling $632,000,000, support the total
inventory amount that appears in the asset section of the balance sheet. The raw materials
inventory account ($28,000,000) is used to record the cost of materials not yet put into
production. The work-in-process inventory account ($441,000,000) is used to record costs
associated with microprocessors and flash memory devices in the production process that
are not yet complete. The finished goods inventory account ($163,000,000) is used to
record the product costs associated with AMD’s products that are completed and ready to
sell.
When AMD sells finished goods, the cost of these goods is transferred out of finished goods
inventory into the cost of goods sold account, which this company calls cost of sales, as many
companies do. The operating portion of AMD’s income statement follows—again, all

Saylor URL: http://www.saylor.org/books Saylor.org 44
amounts are in millions. Notice that cost of sales appears below net sales and above all other
operating expenses.
Source: Advanced Micro Devices, “Advanced Micro Devices 2010 Annual
Report,” http://www.amd.com.
KEY TAKEAWAY
The raw materials inventory account is used to record the cost of materials not yet put into
production. The work-in-process inventory account is used to record the cost of products that
are in production but that are not yet complete. The finished goods inventory account is used
to record the costs of products that are complete and ready to sell. These three inventory
accounts are assets accounts that appear on the balance sheet. The costs of completed goods
that are sold are recorded in the cost of goods sold account. This account appears on the
income statement as an expense.
REVIEW PROBLEM 1.7
Match each of the following accounts with the appropriate description that follows.
_____ Raw materials inventory
_____ Work-in-process inventory
_____ Finished goods inventory
_____ Cost of goods sold

Saylor URL: http://www.saylor.org/books Saylor.org 128
Chapter 3
How Does an Organization Use Activity-Based Costing to Allocate Overhead Costs?
Cindy Hall is the owner and chief executive officer of SailRite Company. SailRite builds two
models of sailboats that are sold at hundreds of retail boat showrooms throughout the world. At
its inception several years ago, the company produced only the Basic model, which is 12 feet
long and designed for two sailors. Very few options are available for this model, and the
production process is relatively simple. Because many owners of the Basic model wanted to
move to a bigger, more sophisticated boat, SailRite developed the Deluxe model two years ago.
The Deluxe model is 14 feet long and designed for three sailors. Many additional features are
available for this model, and the production process is more complex than for the Basic model.
Last year, SailRite sold 5,000 units of the Basic and 1,000 units of the Deluxe.
Although sales of both models increased last year over the year before, company profits have
steadily declined. Cindy, the CEO, is concerned about this trend and discusses her concerns with
John Lester, the company’s accountant; Mary McCann, the vice president of marketing; and Bob
Schuler, the vice president of production.
Cindy (CEO):
Ever since we introduced the Deluxe model our profits have taken a beating. I need some input on what we
should do to get this turned around.
Mary (Marketing
Vice President):
I’m not sure you can blame our salespeople. We’ve asked them to push the Deluxe model because of the high
profit margins, and our sales force has really responded. Sales have steadily increased over the last couple of
years, and customers seem to love our sailboats.
Bob (Production
Vice President):
I don’t think the problem is with our products, and using our current costing system, we make $320 in profit for
each Basic model and $850 for each Deluxe model. We need to take a close look at how the cost of each boat is
determined. Overhead costs have increased significantly since we started producing the Deluxe boat—to about
45 percent of total production costs—and yet we use only one overhead rate based on direct labor hours to
allocate these costs. I don’t see how this can lead to an accurate cost, and I assume we set the price based on the
cost of each boat.
Cindy:
We certainly considered the cost in our pricing structure. Are you telling me the cost information I have isn’t
accurate?
John
(Accountant):
No, the cost information you have is fine for financial reporting, but not for pricing products. When we were
producing only the Basic model, overhead allocation wasn’t an issue. All overhead costs were simply assigned to
the one product. Now that we have two products, overhead is allocated based on direct labor hours as Bob

Saylor URL: http://www.saylor.org/books Saylor.org 129
stated. We are required to allocate overhead for financial reporting purposes, but I wouldn’t use this cost
information for internal pricing purposes.
Bob:
I can tell you that the production process for the Deluxe model is much more complicated than the one for the
Basic model, so I would expect to see significantly higher costs attached to the Deluxe boat.
John:
What I’m hearing is that we need better cost information. I think it’s time we move to a more sophisticated
costing system called activity-based costing. Give me time to do some research. Let’s meet next week.
This dialogue between the accountant and top management emphasizes the importance of having
accurate cost information for decision-making purposes. Very few costing systems provide
“perfect” product cost information. Overhead (indirect manufacturing costs) can be allocated in a
number of different ways and result in a number of different costs for the same product. The goal
is to find a system of allocation that best approximates the amount of overhead costs caused by
each product. Sophisticated costing systems are expensive, however. Organizations like SailRite
must continually ask the question: Will the benefits of having improved cost information
outweigh the costs of obtaining the information?
Several options are available to allocate overhead costs. Before we discuss these options, it is
important to understand why overhead costs are allocated at all.
3.1 Why Allocate Overhead Costs?
L E A R N I N G O B J E C T I V E
1. Understand why organizations allocate overhead costs to products.
Question: Recall that costs for direct labor and direct materials are easily traced to products.
When SailRite produces a sailboat, the direct materials include items such as fiberglass to build
the hull, mast, sails, and rope. Direct labor includes the employees building the boat. Accounting
for these costs is fairly simple. Indirect manufacturing costs (also called manufacturing
overhead or overhead) include electricity to run the factory, rent for the factory building, and
factory maintenance. These costs are not easily traced to products and pose a much more
complicated challenge for SailRite. Accounting for indirect manufacturing costs typically
requires allocating overhead using predetermined overhead rates. Why do managers insist on
allocating overhead costs to products?

Saylor URL: http://www.saylor.org/books Saylor.org 130
Answer: Three important reasons that managers allocate overhead costs to products are
described in the following:
Provide information for decision making. Setting prices for products is one example of a
decision that must be made by management. Prices are often established based on the cost of
products. It is not enough to simply include direct materials and direct labor. Overhead must be
considered as well.
Promote efficient use of resources. Several different activities are performed to produce a
product, such as purchasing raw materials, setting up production machinery, inspecting the final
product, and repairing defective products. All of these activities consume resources (consuming
resources is another way of stating that a cost is associated with each of these activities). If
products are charged for the use of these activities, managers will have an incentive to be
efficient in utilizing the activities.
Comply with U.S. Generally Accepted Accounting Principles (U.S. GAAP). U.S. GAAP
requires that all manufacturing costs—direct materials, direct labor, and overhead—be assigned
to products for inventory costing purposes. This requires the allocation of overhead costs to
products.
K E Y T A K E A W A Y
Overhead costs are allocated to products to provide information for internal decision making, to promote the efficient use of
resources, and to comply with U.S. Generally Accepted Accounting Principles.
R E V I E W P R O B L E M 3 . 1
For each scenario listed as follows, identify which of the three important reasons presented in this section best explains why
managers choose to allocate overhead costs to products.
a. Financial statements are prepared for the annual report that is provided to shareholders.
b. Management is considering the addition of a new product line.
c. The production manager decides to decrease the frequency of raw materials purchases to reduce the allocated portion of the
purchasing department’s costs.
d. Profits are calculated for each product so management can decide which products to promote.
e. Quality control inspections are reduced to cut down on the allocated portion of the quality control department’s costs.
Saylor URL: http://www.saylor.org/books Saylor.org 131
f. Financial statements are prepared for the company’s bondholders.
g. Management asks for cost information to assist in bidding for a contract.
Solutions to Review Problem 3.1
a. Comply with U.S. GAAP
b. Provide information for decision making
c. Promote efficient use of resources
d. Provide information for decision making
e. Promote efficient use of resources
f. Comply with U.S. GAAP
g. Provide information for decision making
3.2 Approaches to Allocating Overhead Costs
L E A R N I N G O B J E C T I V E
1. Compare and contrast allocating overhead costs using a plantwide rate, department rates, and activity-based costing.
Question: Managers at companies such as Hewlett-Packard often look for better ways to figure
out the cost of their products. When Hewlett-Packardproduces printers, the company has three
possible methods that can be used to allocate overhead costs to products—plantwide allocation,
department allocation, and activity-based allocation (called activity-based costing). How do
managers decide which allocation method to use?
Answer: The choice of an allocation method depends on how managers decide to group
overhead costs and the desired accuracy of product cost information. Groups of overhead costs
are called cost pools. For example,Hewlett Packard’s printer production division may choose to
collect all factory overhead costs in one cost pool and allocate those costs from the cost pool to
each product using one predetermined overhead rate. Or Hewlett Packard may choose to have
several cost pools (perhaps for each department, such as assembly, packaging, and quality
control) and allocate overhead costs from each department cost pool to products using a separate
predetermined overhead rate for each department. In general, the more cost pools used, the more
accurate the allocation process.
Saylor URL: http://www.saylor.org/books Saylor.org 132
Plantwide Allocation
Question: Let’s look at SailRite Company, which was presented at the beginning of the chapter.
The managers at SailRite like the idea of using the plantwide allocation method to allocate
overhead to the two sailboat models produced by the company. How would SailRite implement
the plantwide allocation method?
Answer: The plantwide allocation method uses one predetermined overhead rate to allocate
overhead costs. [1] One cost pool accounts for all overhead costs, and therefore one
predetermined overhead rate is used to apply overhead costs to products. You learned about this
approach in Chapter 2 "How Is Job Costing Used to Track Production Costs?" where one
predetermined rate—typically based on direct labor hours, direct labor costs, or machine hours—
was used to allocate overhead costs. (Remember, the focus here is on the allocation of overhead
costs. Direct materials and direct labor are easily traced to the product and therefore are not a
part of the overhead allocation process.)
Using SailRite Company as an example, assume annual overhead costs are estimated to be
$8,000,000 and direct labor hours are used for the plantwide allocation base. Management
estimates that a total of 250,000 direct labor hours are worked annually. These estimates are
based on the previous year’s overhead costs and direct labor hours and are adjusted for expected
increases in demand the coming year. The predetermined overhead rate is $32 per direct labor
hour (= $8,000,000 ÷ 250,000 direct labor hours). Thus, as shown in Figure 3.1 "Using One
Plantwide Rate to Allocate SailRite Company’s Overhead", products are charged $32 in
overhead costs for each direct labor hour worked.

Saylor URL: http://www.saylor.org/books Saylor.org 133
Figure 3.1 Using One Plantwide Rate to Allocate SailRite Company’s Overhead
Product Costs Using the Plantwide Allocation Approach at SailRite
Question: Assume SailRite uses one plantwide rate to allocate overhead based on direct labor
hours. What is SailRite’s product cost per unit and resulting profit using the plantwide approach
to allocate overhead?
Answer: The calculation of a product’s cost involves three components—direct materials, direct
labor, and manufacturing overhead. Assume direct materials cost $1,000 for one unit of the Basic
sailboat and $1,300 for the Deluxe. Direct labor costs are $600 for one unit of the Basic sailboat
and $750 for the Deluxe. This information, combined with the overhead cost per unit, gives us
what we need to determine the product cost per unit for each model.
Given the predetermined overhead rate of $32 per direct labor hour calculated in the previous
section, and assuming it takes 40 hours of direct labor to build one Basic sailboat and 50 hours to
build one Deluxe sailboat, we can calculate the manufacturing overhead cost per unit.
Manufacturing overhead cost per unit is $1,280 (= $32 × 40 direct labor hours) for the Basic boat

Saylor URL: http://www.saylor.org/books Saylor.org 134
and $1,600 (= $32 × 50 direct labor hours) for the Deluxe boat. Combine the manufacturing
overhead with direct materials and direct labor, as shown in Figure 3.2 "SailRite Company
Product Costs Using One Plantwide Rate Based on Direct Labor Hours", and we are able to
calculate the product cost per unit.
Figure 3.2 SailRite Company Product Costs Using One Plantwide Rate Based on Direct Labor Hours
*$1,280 = 40 direct labor hours per unit × $32 rate.
**$1,600 = 50 direct labor hours per unit × $32 rate.
The average sales price is $3,200 for the Basic model and $4,500 for the Deluxe. Using the
product cost information in Figure 3.2 "SailRite Company Product Costs Using One Plantwide Rate Based on Direct
Labor Hours", the profit per unit is $320 (= $3,200 price – $2,880 cost) for the Basic model and
$850 (= $4,500 price – $3,650 cost) for the Deluxe. Recall from the opening dialogue that
SailRite’s overall profit has declined ever since it introduced the Deluxe model even though the
data shows both products are profitable.
Question: The managers at SailRite like the idea of using the plantwide allocation approach, but
they are concerned that this approach will not provide accurate product cost information.
Although the plantwide allocation method is the simplest and least expensive approach, it also
tends to be the least accurate.In spite of this weakness, why do some organizations prefer to use
one plantwide overhead rate to allocate overhead to products?
Answer: Organizations that use a plantwide allocation approach typically have simple
operations with a few similar products. Management may not want more accurate product cost
information or may not have the resources to implement a more complex accounting system. As
Saylor URL: http://www.saylor.org/books Saylor.org 135
we move on to more complex costing systems, remember that these systems are more expensive
to implement. Thus the benefits of having improved cost information must outweigh the costs of
obtaining the information.
Department Allocation
Question: Assume the managers at SailRite Company prefer a more accurate approach to
allocating overhead costs to its two products. As a result, they are considering using the
department allocation approach. How would SailRite form cost pools for the department
allocation approach?
Answer: The department allocation approach is similar to the plantwide approach except that
cost pools are formed for each department rather than for the entire plant, and a separate
predetermined overhead rate is established for each department. Remember, total estimated
overhead costs will not change. Instead, they will be broken out into various department cost
pools. This approach allows for the use of different allocation bases for different departments
depending on what drives overhead costs for each department. For example, the Hull Fabrication
department at SailRite Company may find that overhead costs are driven more by the use of
machinery than by labor, and therefore decides to use machine hours as the allocation base. The
Assembly department may find that overhead costs are driven more by labor activity than by
machine use and therefore decides to use labor hours or labor costs as the allocation base.
Assume that SailRite is considering using the department approach rather than the plantwide
approach for allocating overhead. The cost pool in the Hull Fabrication department is estimated
to be $3,000,000 for the year, and the cost pool in the Assembly department is estimated at
$5,000,000. Note that total estimated overhead cost is still $8,000,000 (= $3,000,000 +
$5,000,000). Machine hours (estimated at 60,000 hours) will be used as the allocation base for
Hull Fabrication, and direct labor hours (estimated at 217,000 hours) will be used as the
allocation base for Assembly. Thus two rates are used to allocate overhead (rounded to the
nearest dollar) as follows:
1. Hull Fabrication department rate: $50 per machine hour (= $3,000,000 ÷ 60,000 hours)
2. Assembly department rate: $23 per direct labor hour (= $5,000,000 ÷ 217,000 hours)

Saylor URL: http://www.saylor.org/books Saylor.org 136
As shown in Figure 3.3 "Using Department Rates to Allocate SailRite Company’s
Overhead", products going through the Hull Fabrication department are charged $50 in
overhead costs for each machine hour used. Products going through the Assembly
department are charged $23 in overhead costs for each direct labor hour used.
Figure 3.3 Using Department Rates to Allocate SailRite Company’s Overhead
The department allocation approach allows cost pools to be formed for each department and
provides for flexibility in the selection of an allocation base. Although Figure 3.3 "Using
Department Rates to Allocate SailRite Company’s Overhead" shows just two rates, many
companies have more than two departments and therefore more than two rates. Organizations
that use this approach tend to have simple operations within each department but different
activities across departments. One department may use machinery, while another department
may use labor, as is the case with SailRite’s two departments. This approach typically provides
more accurate cost information than simply using one plantwide rate but still relies on the
assumption that overhead costs are driven by direct labor hours, direct labor costs, or machine
Saylor URL: http://www.saylor.org/books Saylor.org 137
hours. This assumption of a causal relationship is increasingly less realistic as production
processes become more complex.
The plantwide and department allocation methods are “traditional” approaches because both
typically use direct labor hours, direct labor costs, or machine hours as the allocation base, and
both were used prior to the creation of activity-based costing in the 1980s.
K E Y T A K E A W A Y
Regardless of the approach used to allocate overhead, a predetermined overhead rate is established for each cost pool. The
plantwide allocation approach uses one cost pool to collect and apply overhead costs and therefore uses one predetermined
overhead rate for the entire company. The department allocation approach uses several cost pools (one for each
department) and therefore uses several predetermined overhead rates.
R E V I E W P R O B L E M 3 . 2
Kline Company expects to incur $800,000 in overhead costs this coming year—$200,000 in the Cut and Polish department and
$600,000 in the Quality Control department. Total annual direct labor costs are expected to be $160,000. The Cut and Polish
department expects to use 25,000 machine hours, and the Quality Control department plans to utilize 50,000 hours of direct
labor time for the year.
Required:
1. Assume Kline Company allocates overhead costs with the plantwide approach, and direct labor cost is the allocation base.
Calculate the rate used by the company to allocate overhead costs.
2. Assume Kline Company allocates overhead costs with the department approach. Calculate the rate used by each department
to allocate overhead costs.
Solutions to Review Problem 3.2
1. The plantwide rate is calculated as follows:
Predetermined overhead rate=Estimated overhead costsEstimated activity in allocation base=$800,000$160,000=$5 per $1 in direct labor cost (or 500 perce
nt of direct labor cost)
2. The department rates are calculated using the same formula as the plantwide rate. However, overhead costs and
activity levels are estimated for each department rather than for the entire company, and two separate rates are
calculated:
Saylor URL: http://www.saylor.org/books Saylor.org 138
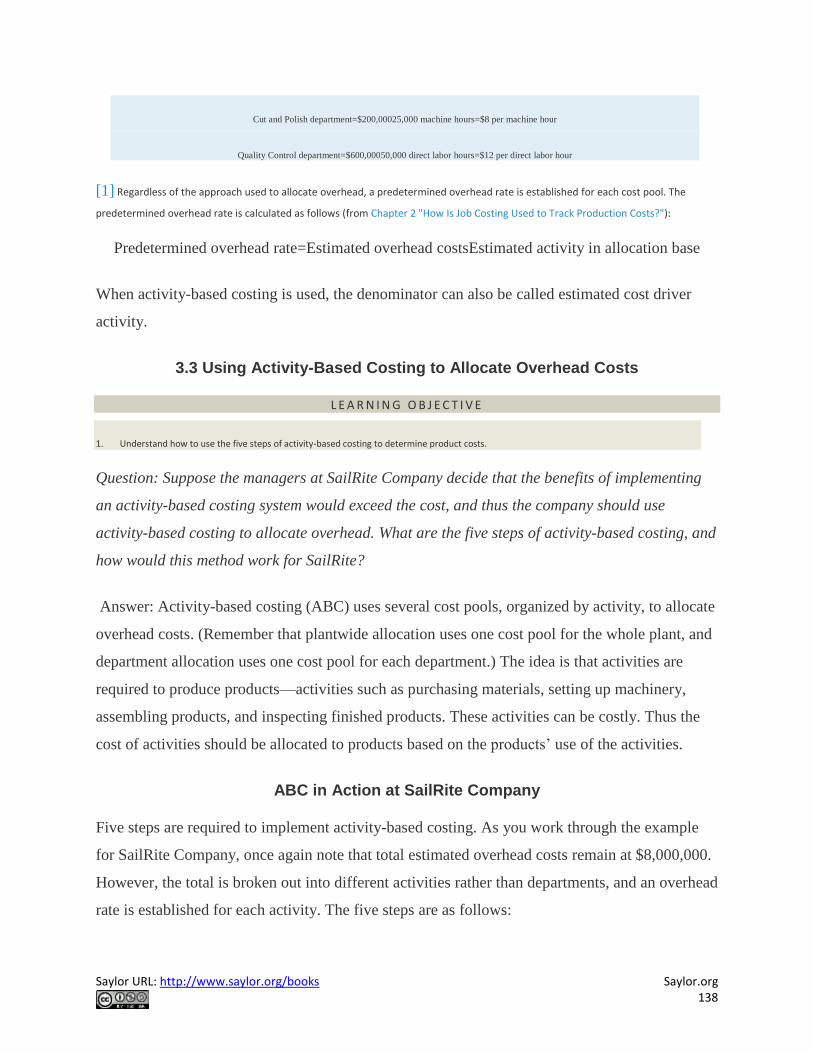
Cut and Polish department=$200,00025,000 machine hours=$8 per machine hour
Quality Control department=$600,00050,000 direct labor hours=$12 per direct labor hour
[1] Regardless of the approach used to allocate overhead, a predetermined overhead rate is established for each cost pool. The
predetermined overhead rate is calculated as follows (from Chapter 2 "How Is Job Costing Used to Track Production Costs?"):
Predetermined overhead rate=Estimated overhead costsEstimated activity in allocation base
When activity-based costing is used, the denominator can also be called estimated cost driver
activity.
3.3 Using Activity-Based Costing to Allocate Overhead Costs
L E A R N I N G O B J E C T I V E
1. Understand how to use the five steps of activity-based costing to determine product costs.
Question: Suppose the managers at SailRite Company decide that the benefits of implementing
an activity-based costing system would exceed the cost, and thus the company should use
activity-based costing to allocate overhead. What are the five steps of activity-based costing, and
how would this method work for SailRite?
Answer: Activity-based costing (ABC) uses several cost pools, organized by activity, to allocate
overhead costs. (Remember that plantwide allocation uses one cost pool for the whole plant, and
department allocation uses one cost pool for each department.) The idea is that activities are
required to produce products—activities such as purchasing materials, setting up machinery,
assembling products, and inspecting finished products. These activities can be costly. Thus the
cost of activities should be allocated to products based on the products’ use of the activities.
ABC in Action at SailRite Company
Five steps are required to implement activity-based costing. As you work through the example
for SailRite Company, once again note that total estimated overhead costs remain at $8,000,000.
However, the total is broken out into different activities rather than departments, and an overhead
rate is established for each activity. The five steps are as follows:

Saylor URL: http://www.saylor.org/books Saylor.org 139
Step 1. Identify costly activities required to complete products.
An activity is any process or procedure that consumes overhead resources. The goal is to
understand all the activities required to make the company’s products. This requires interviewing
and meeting with personnel throughout the organization. Companies that use activity-based
costing, such as Hewlett Packard and IBM, may identify hundreds of activities required to make
their products. The most challenging part of this step is narrowing down the activities to those
that have the biggest impact on overhead costs.
After meeting with personnel throughout the company, SailRite’s accountant identified the
following activities as having the biggest impact on overhead costs:
Purchasing materials
Setting up machines
Running machines
Assembling products
Inspecting finished products
Step 2. Assign overhead costs to the activities identified in step 1.
This step requires that overhead costs associated with each activity be assigned to the activity
(i.e., a cost pool is formed for each activity). For SailRite, the cost pool for the purchasing
materials activity will include costs for items such as salaries of purchasing personnel, rent for
purchasing department office space, and depreciation of purchasing office equipment.
The accountant at SailRite developed the following allocations after careful review of all
overhead costs (remember, these are overhead costs, not direct materials or direct labor costs):

Saylor URL: http://www.saylor.org/books Saylor.org 140
*We should note that this is not the direct labor cost. Instead, this represents overhead costs associated with assembling products,
such as supplies and the factory space being used for assembly.
At this point, we have identified the most important and costly activities required to make
products, and we have assigned overhead costs to each of these activities. The next step is to find
an allocation base that drives the cost of each activity.
Step 3. Identify the cost driver for each activity.
A cost driver is the action that causes (or “drives”) the costs associated with the activity.
Identifying cost drivers requires gathering information and interviewing key personnel in various
areas of the organization, such as purchasing, production, quality control, and accounting. After
careful scrutiny of the process required for each activity, SailRite established the following cost
drivers:
Activity Cost Driver Estimated Annual Cost Driver Activity
Purchasing materials Purchase requisitions 10,000 requisitions
Setting up machines Machine setups 2,000 setups
Running machines Machine hours 90,000 hours
Assembling products Direct labor hours 250,000 hours
Inspecting finished products Inspection hours 20,000 hours
Notice that this information includes an estimate of the level of activity for each cost driver,
which is needed to calculate a predetermined rate for each activity in step 4.
Step 4. Calculate a predetermined overhead rate for each activity.
Saylor.org
141
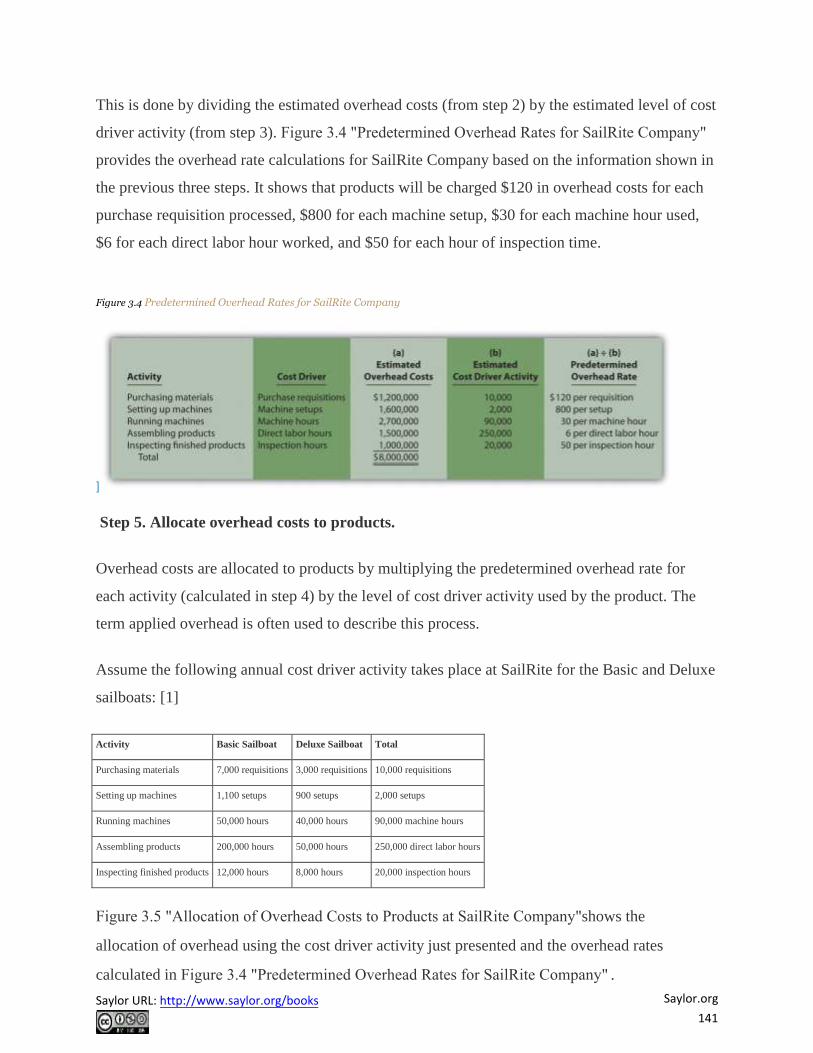
This is done by dividing the estimated overhead costs (from step 2) by the estimated level of cost
driver activity (from step 3). Figure 3.4 "Predetermined Overhead Rates for SailRite Company"
provides the overhead rate calculations for SailRite Company based on the information shown in
the previous three steps. It shows that products will be charged $120 in overhead costs for each
purchase requisition processed, $800 for each machine setup, $30 for each machine hour used,
$6 for each direct labor hour worked, and $50 for each hour of inspection time.
Figure 3.4 Predetermined Overhead Rates for SailRite Company
]
Step 5. Allocate overhead costs to products.
Overhead costs are allocated to products by multiplying the predetermined overhead rate for
each activity (calculated in step 4) by the level of cost driver activity used by the product. The
term applied overhead is often used to describe this process.
Assume the following annual cost driver activity takes place at SailRite for the Basic and Deluxe
sailboats: [1]
Activity Basic Sailboat Deluxe Sailboat Total
Purchasing materials 7,000 requisitions 3,000 requisitions 10,000 requisitions
Setting up machines 1,100 setups 900 setups 2,000 setups
Running machines 50,000 hours 40,000 hours 90,000 machine hours
Assembling products 200,000 hours 50,000 hours 250,000 direct labor hours
Inspecting finished products 12,000 hours 8,000 hours 20,000 inspection hours
Figure 3.5 "Allocation of Overhead Costs to Products at SailRite Company"shows the
allocation of overhead using the cost driver activity just presented and the overhead rates
calculated in Figure 3.4 "Predetermined Overhead Rates for SailRite Company" .
Saylor URL: http://www.saylor.org/books

Saylor URL: http://www.saylor.org/books Saylor.org 142
Notice that allocated overhead costs total $8,000,000. This is the same cost figure used for the
plantwide and department allocation methods we discussed earlier. Activity-based costing
simply provides a more refined way to allocate the same overhead costs to products.
Figure 3.5 Allocation of Overhead Costs to Products at SailRite Company
*Overhead allocated equals the predetermined overhead rate times the cost driver activity.
**Overhead cost per unit for the Basic model equals $5,020,000 (overhead allocated) ÷ 5,000 units produced, and for the Deluxe
model, it equals $2,980,000 ÷ 1,000 units produced.
The bottom of Figure 3.5 "Allocation of Overhead Costs to Products at SailRite Company"
shows the overhead cost per unit for each product assuming SailRite produces 5,000 units of the
Basic sailboat and 1,000 units of the Deluxe sailboat. This information is needed to calculate the
product cost for each unit of product, which we discuss next.
Product Costs Using the Activity-Based Costing Approach at SailRite
Question: As shown in Figure 3.5, SailRite knows the overhead cost per unit using activity-
based costing is $1,004 for the Basic model and $2,980 for the Deluxe.Now that SailRite has the
overhead cost per unit, how will the company find the total product cost per unit and resulting
profit?
Answer: Recall from our discussion earlier that the calculation of a product’s cost involves
three components—direct materials, direct labor, and manufacturing overhead. Assume direct
materials cost $1,000 for the Basic sailboat and $1,300 for the Deluxe. Direct labor costs are
$600 for the Basic sailboat and $750 for the Deluxe. This information, combined with the
overhead cost per unit calculated at the bottom of Figure 3.5, gives us what we need to
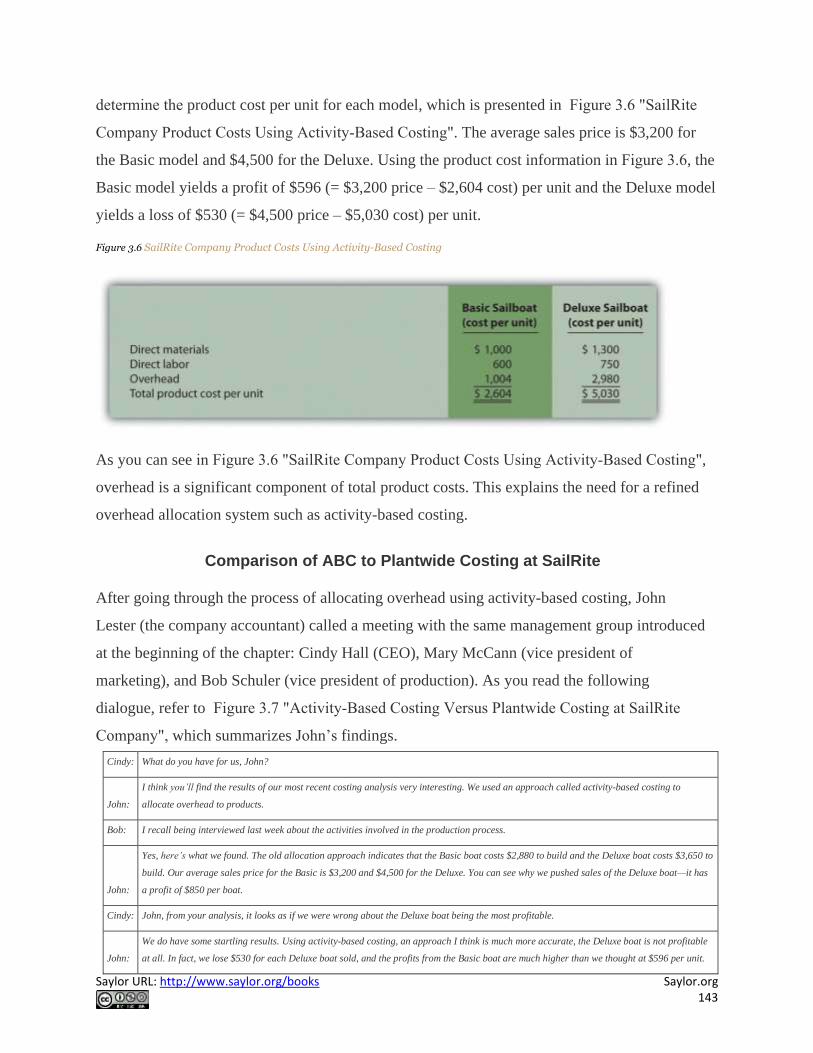
Saylor URL: http://www.saylor.org/books Saylor.org 143
determine the product cost per unit for each model, which is presented in Figure 3.6 "SailRite
Company Product Costs Using Activity-Based Costing". The average sales price is $3,200 for
the Basic model and $4,500 for the Deluxe. Using the product cost information in Figure 3.6, the
Basic model yields a profit of $596 (= $3,200 price – $2,604 cost) per unit and the Deluxe model
yields a loss of $530 (= $4,500 price – $5,030 cost) per unit.
Figure 3.6 SailRite Company Product Costs Using Activity-Based Costing
As you can see in Figure 3.6 "SailRite Company Product Costs Using Activity-Based Costing",
overhead is a significant component of total product costs. This explains the need for a refined
overhead allocation system such as activity-based costing.
Comparison of ABC to Plantwide Costing at SailRite
After going through the process of allocating overhead using activity-based costing, John
Lester (the company accountant) called a meeting with the same management group introduced
at the beginning of the chapter: Cindy Hall (CEO), Mary McCann (vice president of
marketing), and Bob Schuler (vice president of production). As you read the following
dialogue, refer to Figure 3.7 "Activity-Based Costing Versus Plantwide Costing at SailRite
Company", which summarizes John’s findings.
Cindy: What do you have for us, John?
John:
I think you’ll find the results of our most recent costing analysis very interesting. We used an approach called activity-based costing to
allocate overhead to products.
Bob: I recall being interviewed last week about the activities involved in the production process.
John:
Yes, here’s what we found. The old allocation approach indicates that the Basic boat costs $2,880 to build and the Deluxe boat costs $3,650 to
build. Our average sales price for the Basic is $3,200 and $4,500 for the Deluxe. You can see why we pushed sales of the Deluxe boat—it has
a profit of $850 per boat.
Cindy: John, from your analysis, it looks as if we were wrong about the Deluxe boat being the most profitable.
John:
We do have some startling results. Using activity-based costing, an approach I think is much more accurate, the Deluxe boat is not profitable
at all. In fact, we lose $530 for each Deluxe boat sold, and the profits from the Basic boat are much higher than we thought at $596 per unit.

Saylor URL: http://www.saylor.org/books Saylor.org 144
Cindy:
I see direct materials and direct labor are the same no matter which costing system we use. Why is there such a large variation in overhead
costs?
John:
Good question! When we used our old approach of one plantwide rate based on direct labor hours, the Deluxe process consumed 20 percent
of all direct labor hours worked—that is, 50,000 Deluxe hours divided by 250,000 total hours. Therefore the Deluxe model was allocated 20
percent of all overhead costs. Using activity-based costing, we identified five key activities and assigned overhead costs based on the use of
these activities. The Deluxe process consumed more than 20 percent of the resources provided for every activity. For example, running
machines is one of the most costly activities, and the Deluxe model used about 44 percent of the resources provided by this activity. This is
significantly higher than the 20 percent allocated using direct labor hours under the old approach.
Bob: This certainly makes sense! Each Deluxe boat takes a whole lot more machine hours to produce than the Basic boat.
Cindy:
Thanks for this analysis, John. Now we know why company profits have been declining even though sales have increased. Either the Deluxe
sales price must go up or costs must go down—or a combination of both!
Figure 3.7 Activity-Based Costing Versus Plantwide Costing at SailRite Company
*From Figure 3.2 "SailRite Company Product Costs Using One Plantwide Rate Based on Direct Labor Hours" .
**From Figure 3.5 "Allocation of Overhead Costs to Products at SailRite Company".

Saylor URL: http://www.saylor.org/books Saylor.org 145
Question: SailRite has more accurate product cost information using activity-based costing to
allocate overhead. Why is the overhead cost per unit so different using activity-based costing?
Answer: Figure 3.8 "Detailed Analysis of Overhead Allocations at SailRite Company" provides
a more thorough look at how the Deluxe product consumes a significant share of overhead
resources—much higher than the 20 percent that was being allocated based on direct
labor hours. Let’s look at Figure 3.8 in detail:
The ABC column represents overhead costs allocated using the activity-based costing
shown back in Figure 3.5 "Allocation of Overhead Costs to Products at SailRite
Company".
The DLH (direct labor hours) column represents overhead costs allocated using direct
labor hours as the allocation base where 80 percent was allocated to the Basic boat (=
200,000 hours ÷ 250,000 total hours) and 20 percent allocated to the Deluxe boat (=
50,000 hours ÷ 250,000 total hours).
The Diff. (difference) column shows the difference between one allocation method and
the other. Notice the shift in the allocation of overhead costs using activity-based costing.
A total of $1,380,000 in overhead costs shifts to the Deluxe sailboat, which amounts to
$1,380 per boat (= $1,380,000 ÷ 1,000 boats).
Figure 3.8 Detailed Analysis of Overhead Allocations at SailRite Company
*Amounts in this column come from Figure 3.5 "Allocation of Overhead Costs to Products at SailRite Company"..
Saylor URL: http://www.saylor.org/books Saylor.org 146
**Amounts in this column are calculated by multiplying 80 percent for the Basic boat (20 percent for the Deluxe) by the total
overhead cost for the activity. For example, the total overhead cost for purchasing materials is $1,200,000 (see Figure 3.4) and
$1,200,000 × 80 percent = $960,000. Using the plantwide approach (one plantwide rate based on direct labor hours), $960,000 is the
amount allocated to the Basic sailboat for this activity, and $240,000 is the amount allocated to the Deluxe boat.
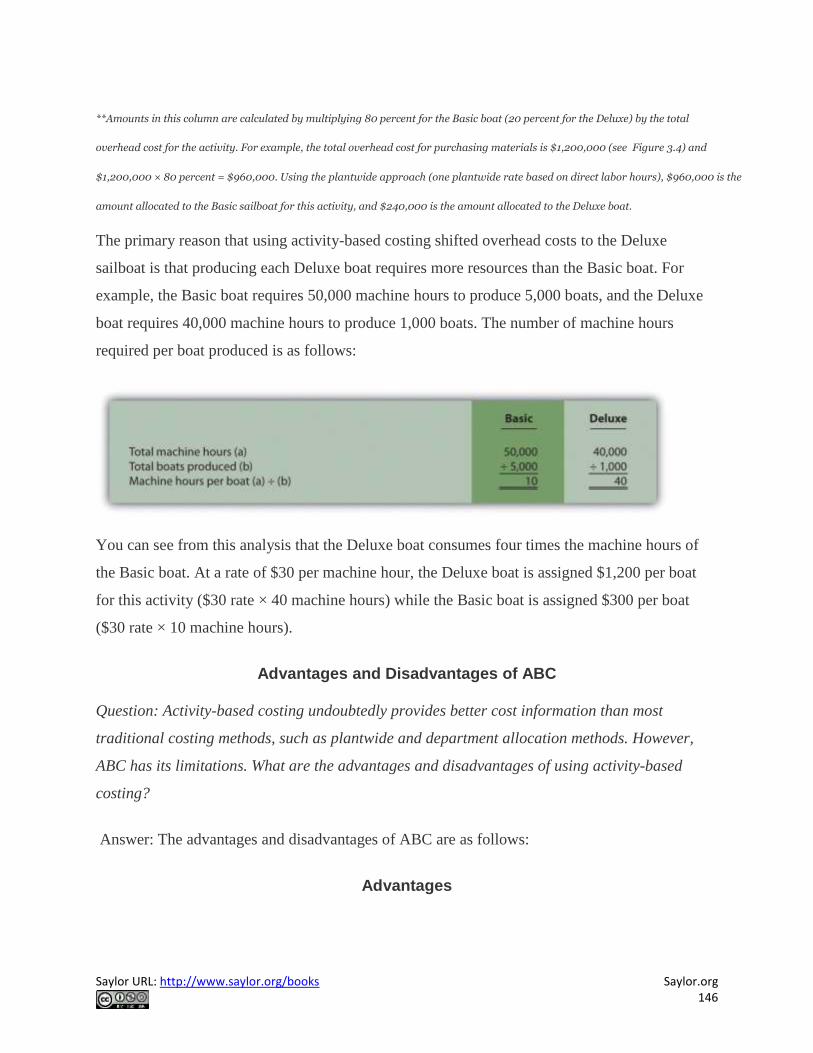
The primary reason that using activity-based costing shifted overhead costs to the Deluxe
sailboat is that producing each Deluxe boat requires more resources than the Basic boat. For
example, the Basic boat requires 50,000 machine hours to produce 5,000 boats, and the Deluxe
boat requires 40,000 machine hours to produce 1,000 boats. The number of machine hours
required per boat produced is as follows:
You can see from this analysis that the Deluxe boat consumes four times the machine hours of
the Basic boat. At a rate of $30 per machine hour, the Deluxe boat is assigned $1,200 per boat
for this activity ($30 rate × 40 machine hours) while the Basic boat is assigned $300 per boat
($30 rate × 10 machine hours).
Advantages and Disadvantages of ABC
Question: Activity-based costing undoubtedly provides better cost information than most
traditional costing methods, such as plantwide and department allocation methods. However,
ABC has its limitations. What are the advantages and disadvantages of using activity-based
costing?
Answer: The advantages and disadvantages of ABC are as follows:
Advantages
Saylor URL: http://www.saylor.org/books Saylor.org 147
More accurate cost information leads to better decisions. The cost information provided by ABC
is generally regarded as more accurate than the information provided by most traditional costing
methods. This allows management to make better decisions in areas such as product pricing,
product line changes (adding products or eliminating products), and product mix decisions (how
much of each product to produce and sell).
Increased knowledge of production activities leads to process improvements and reduced
costs. ABC requires identifying the activities involved in the production process (step 1) and
assigning costs to these activities (step 2). This provides management with a better view of the
detailed activities involved (purchasing materials, machine setups, inspections, and so forth) and
the cost of each activity. Managers are more likely to focus on improving efficiency in the most
costly activities, thereby reducing costs.
Disadvantages
ABC systems can be costly to implement. ABC systems require teamwork across the
organization and therefore require employees to take time out from their day-to-day activities to
assist in the ABC process (e.g., to identify costly activities). Assigning costs to activities takes
time, as does identifying and tracking cost drivers. And assigning costs to products requires a
significant amount of time in the accounting department. Imagine having 15 cost pools
(activities), each with a predetermined overhead rate used to assign overhead costs to the
company’s 80 products—not an unrealistic example for a large company. The accounting costs
incurred to maintain such a system can be prohibitively high.
Unitizing fixed costs can be misleading. Product costing involves allocating costs from activity
centers to products and calculating a product cost per unit. The problem with this approach is
that fixed costs are often a large part of the overhead costs being allocated (e.g., building and
machinery depreciation and supervisor salaries). Recall that fixed costs are costs that do not
change in total with changes in activity.
Looking back to the SailRite example using activity-based costing, the Deluxe sailboat cost
$5,030 per unit to produce based on production of 1,000 units (as shown in Figure 3.5
"Allocation of Overhead Costs to Products at SailRite Company"). If SailRite produces 2,000
units of the Deluxe boat, will the unit cost remain at $5,030? Probably not.

Saylor URL: http://www.saylor.org/books Saylor.org 148
A significant portion of overhead costs are fixed and will be spread out over more units, thereby
reducing the cost per unit. We address this issue at length in later chapters. The point here is that
managers must beware of using per unit cost information blindly for decision making,
particularly if a significant change in the level of production is anticipated.
The benefits may not outweigh the costs. Companies with one or two products that require very
little variation in production may not benefit from an ABC system. Suppose a company produces
one product. The overhead costs can be divided into as many cost pools as you like, but all
overhead costs will still be assigned to the one product. (We should mention, however, that
management would benefit from understanding the activities involved in the process and the
costs associated with each activity. It’s the allocation to the one product—steps 4 and 5 of
ABC—that would provide little useful information in this scenario.)
Companies that produce several different products may believe that the benefits of implementing
ABC will outweigh the costs. However, management must be willing to use the ABC
information to benefit the company. Companies like Chrysler Group LLC have been known to
try ABC, only to meet resistance from their managers. Until managers are willing to use the
ABC information to make improvements in the organization, there is no point in implementing
such a system.
Business in Action 3.1
Characteristics of Companies That Use Activity-Based Costing
A survey of 130 U.S. manufacturing companies yielded some interesting results. The companies that used activity-based costing
(ABC) had higher overhead costs as a percent of total product costs than companies that used traditional costing. Those using ABC
also had a higher level of automation. The complexity of production processes and products tended to be higher for those using ABC,
and ABC companies operated at capacity more frequently.
It is important to note that the differences between companies using ABC and companies using traditional costing systems in all
these areas—overhead costs, automation, complexity of production, and frequency of capacity—were relatively small. However, users
of ABC indicated their systems were more adequate than traditional systems in providing useful information for performance
evaluation and cost reduction.
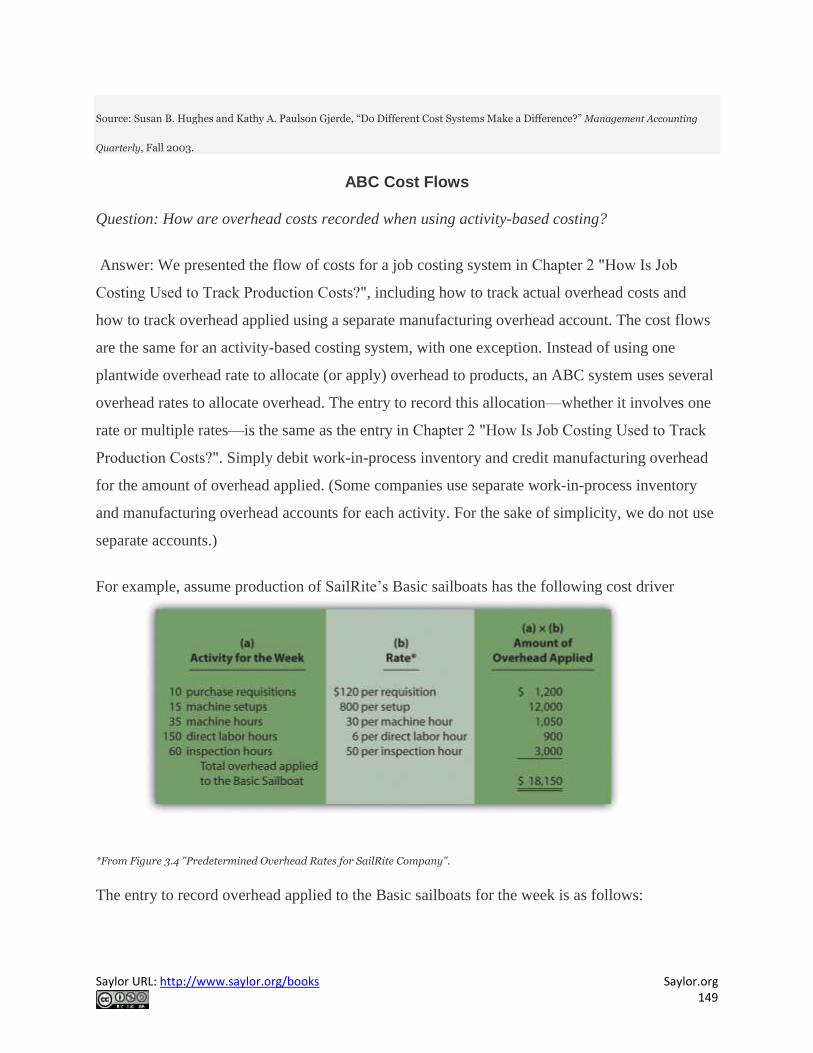
Saylor URL: http://www.saylor.org/books Saylor.org 149
Source: Susan B. Hughes and Kathy A. Paulson Gjerde, “Do Different Cost Systems Make a Difference?” Management Accounting
Quarterly, Fall 2003.
ABC Cost Flows
Question: How are overhead costs recorded when using activity-based costing?
Answer: We presented the flow of costs for a job costing system in Chapter 2 "How Is Job
Costing Used to Track Production Costs?", including how to track actual overhead costs and
how to track overhead applied using a separate manufacturing overhead account. The cost flows
are the same for an activity-based costing system, with one exception. Instead of using one
plantwide overhead rate to allocate (or apply) overhead to products, an ABC system uses several
overhead rates to allocate overhead. The entry to record this allocation—whether it involves one
rate or multiple rates—is the same as the entry in Chapter 2 "How Is Job Costing Used to Track
Production Costs?". Simply debit work-in-process inventory and credit manufacturing overhead
for the amount of overhead applied. (Some companies use separate work-in-process inventory
and manufacturing overhead accounts for each activity. For the sake of simplicity, we do not use
separate accounts.)
For example, assume production of SailRite’s Basic sailboats has the following cost driver
activity for one week of operations:
*From Figure 3.4 "Predetermined Overhead Rates for SailRite Company".
The entry to record overhead applied to the Basic sailboats for the week is as follows:

Saylor URL: http://www.saylor.org/books Saylor.org 150
Recall from Chapter 2 "How Is Job Costing Used to Track Production Costs?" that the
manufacturing overhead account is closed to cost of goods sold at the end of the period. If actual
overhead costs are higher than applied overhead, the
resulting underapplied overhead is closed with a debit to cost of goods sold and a credit to
manufacturing overhead. If actual overhead costs are lower than applied overhead, the resulting
overappliedoverhead is closed with a debit to manufacturing overhead and a credit to cost of goods
sold.
Recap of Three Allocation Methods
We have discussed three different methods of allocating overhead to products—plantwide
allocation, department allocation, and activity-based costing. Remember, total overhead costs
will not change in the short run, but the way total overhead costs are allocated to products will
change depending on the method used.
Figure 3.9 "The Three Methods of Overhead Allocation" presents the three allocation methods,
using SailRite as an example. Notice that the three pie charts in the illustration are of equal size,
representing the $8,000,000 total overhead costs incurred by SailRite.
Figure 3.9 The Three Methods of Overhead Allocation
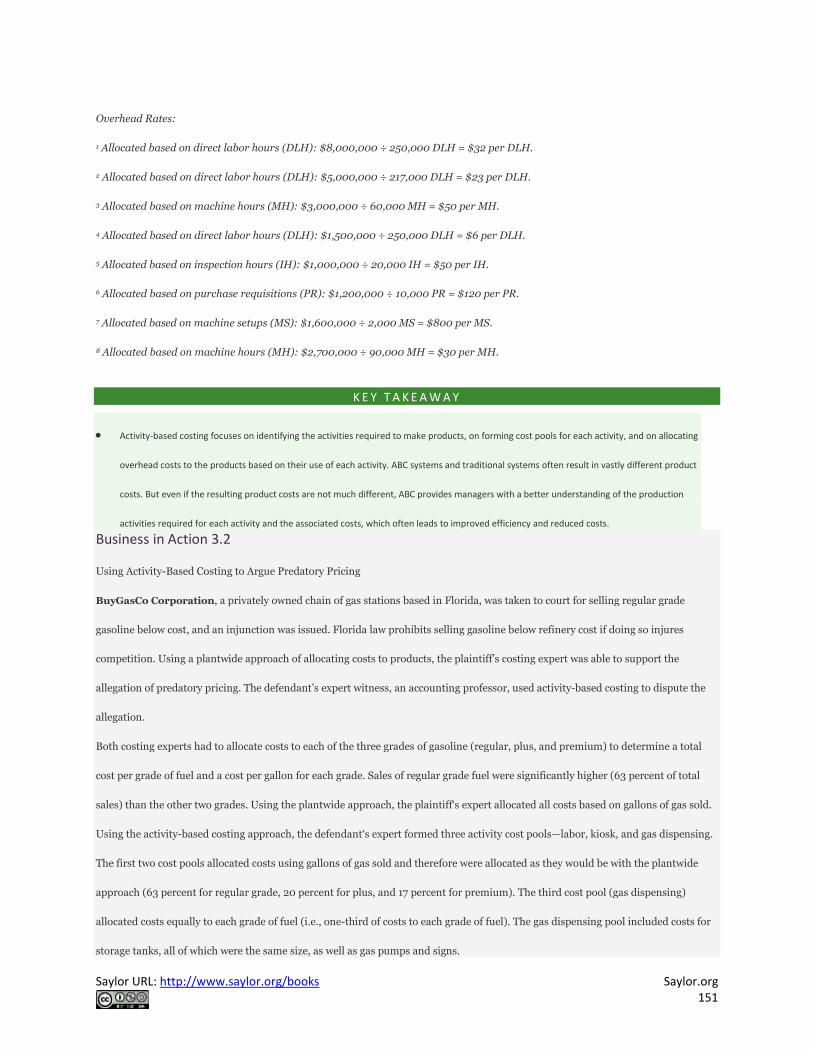
Saylor URL: http://www.saylor.org/books Saylor.org 151
Overhead Rates:
1 Allocated based on direct labor hours (DLH): $8,000,000 ÷ 250,000 DLH = $32 per DLH.
2 Allocated based on direct labor hours (DLH): $5,000,000 ÷ 217,000 DLH = $23 per DLH.
3 Allocated based on machine hours (MH): $3,000,000 ÷ 60,000 MH = $50 per MH.
4 Allocated based on direct labor hours (DLH): $1,500,000 ÷ 250,000 DLH = $6 per DLH.
5 Allocated based on inspection hours (IH): $1,000,000 ÷ 20,000 IH = $50 per IH.
6 Allocated based on purchase requisitions (PR): $1,200,000 ÷ 10,000 PR = $120 per PR.
7 Allocated based on machine setups (MS): $1,600,000 ÷ 2,000 MS = $800 per MS.
8 Allocated based on machine hours (MH): $2,700,000 ÷ 90,000 MH = $30 per MH.
K E Y T A K E A W A Y
Activity-based costing focuses on identifying the activities required to make products, on forming cost pools for each activity, and on allocating
overhead costs to the products based on their use of each activity. ABC systems and traditional systems often result in vastly different product
costs. But even if the resulting product costs are not much different, ABC provides managers with a better understanding of the production
activities required for each activity and the associated costs, which often leads to improved efficiency and reduced costs.
Business in Action 3.2
Using Activity-Based Costing to Argue Predatory Pricing
BuyGasCo Corporation, a privately owned chain of gas stations based in Florida, was taken to court for selling regular grade
gasoline below cost, and an injunction was issued. Florida law prohibits selling gasoline below refinery cost if doing so injures
competition. Using a plantwide approach of allocating costs to products, the plaintiff’s costing expert was able to support the
allegation of predatory pricing. The defendant’s expert witness, an accounting professor, used activity-based costing to dispute the
allegation.
Both costing experts had to allocate costs to each of the three grades of gasoline (regular, plus, and premium) to determine a total
cost per grade of fuel and a cost per gallon for each grade. Sales of regular grade fuel were significantly higher (63 percent of total
sales) than the other two grades. Using the plantwide approach, the plaintiff‘s expert allocated all costs based on gallons of gas sold.
Using the activity-based costing approach, the defendant‘s expert formed three activity cost pools—labor, kiosk, and gas dispensing.
The first two cost pools allocated costs using gallons of gas sold and therefore were allocated as they would be with the plantwide
approach (63 percent for regular grade, 20 percent for plus, and 17 percent for premium). The third cost pool (gas dispensing)
allocated costs equally to each grade of fuel (i.e., one-third of costs to each grade of fuel). The gas dispensing pool included costs for
storage tanks, all of which were the same size, as well as gas pumps and signs.

Saylor URL: http://www.saylor.org/books Saylor.org 247
Susan: I’ll meet with them tomorrow and should have some information for you within a few days.
5.1 Cost Behavior Patterns
L E A R N I N G O B J E C T I V E
1. Identify typical cost behavior patterns.
Question: To predict what will happen to profit in the future at Bikes Unlimited, we must
understand how costs behave with changes in the number of units sold (sales volume). Some
costs will not change at all with a change in sales volume (e.g., monthly rent for the production
facility). Some costs will change with a change in sales volume (e.g., materials for the mountain
bikes). What are the three cost behavior patterns that help organizations identify which costs will
change and which will remain the same with changes in sales volume?
Answer: The three basic cost behavior patterns are known as variable, fixed, and mixed. Each of
these cost patterns is described next.
Variable Costs
Question: We know that some costs vary with changes in activity. What do we call this type of
cost behavior?
Answer: This cost behavior pattern is called a variable cost. A variable costdescribes a cost
that varies in total with changes in volume of activity. The activity in this example is the number
of bikes produced and sold. However, the activity can take many different forms depending on
the organization. The two most common variable costs are direct materials and direct labor.
Other examples include indirect materials and energy costs.
Assume the cost of direct materials (wheels, seats, frames, and so forth) for each bike at Bikes
Unlimited is $40. If Bikes Unlimited produces one bike,total variable cost for direct materials
amounts to $40. If Bikes Unlimited doubles its production to two bikes, total variable cost for
direct materials also doubles to $80. Variable costs typically change in proportion to changes in
volume of activity. If volume of activity doubles, total variable costs also double, while the cost
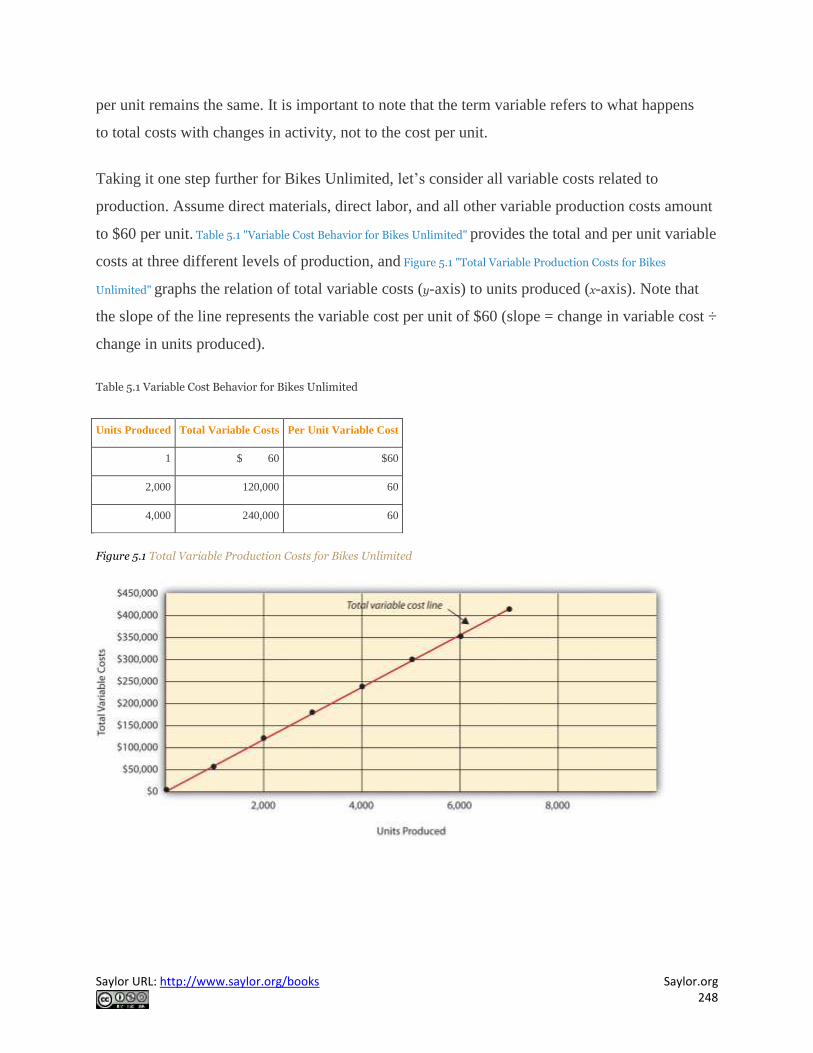
Saylor URL: http://www.saylor.org/books Saylor.org 248
per unit remains the same. It is important to note that the term variable refers to what happens
to total costs with changes in activity, not to the cost per unit.
Taking it one step further for Bikes Unlimited, let’s consider all variable costs related to
production. Assume direct materials, direct labor, and all other variable production costs amount
to $60 per unit. Table 5.1 "Variable Cost Behavior for Bikes Unlimited" provides the total and per unit variable
costs at three different levels of production, and Figure 5.1 "Total Variable Production Costs for Bikes
Unlimited" graphs the relation of total variable costs (y-axis) to units produced (x-axis). Note that
the slope of the line represents the variable cost per unit of $60 (slope = change in variable cost ÷
change in units produced).
Table 5.1 Variable Cost Behavior for Bikes Unlimited
Units Produced Total Variable Costs Per Unit Variable Cost
1 $ 60 $60
2,000 120,000 60
4,000 240,000 60
Figure 5.1 Total Variable Production Costs for Bikes Unlimited
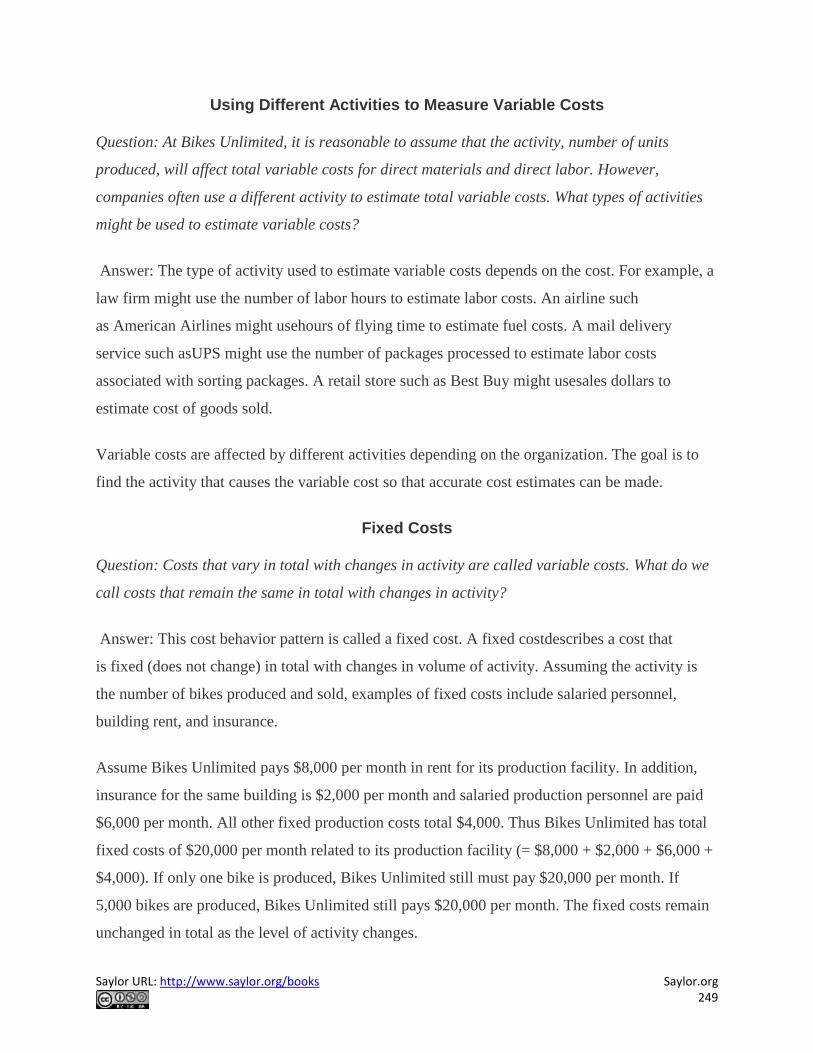
Saylor URL: http://www.saylor.org/books Saylor.org 249
Using Different Activities to Measure Variable Costs
Question: At Bikes Unlimited, it is reasonable to assume that the activity, number of units
produced, will affect total variable costs for direct materials and direct labor. However,
companies often use a different activity to estimate total variable costs. What types of activities
might be used to estimate variable costs?
Answer: The type of activity used to estimate variable costs depends on the cost. For example, a
law firm might use the number of labor hours to estimate labor costs. An airline such
as American Airlines might usehours of flying time to estimate fuel costs. A mail delivery
service such asUPS might use the number of packages processed to estimate labor costs
associated with sorting packages. A retail store such as Best Buy might usesales dollars to
estimate cost of goods sold.
Variable costs are affected by different activities depending on the organization. The goal is to
find the activity that causes the variable cost so that accurate cost estimates can be made.
Fixed Costs
Question: Costs that vary in total with changes in activity are called variable costs. What do we
call costs that remain the same in total with changes in activity?
Answer: This cost behavior pattern is called a fixed cost. A fixed costdescribes a cost that
is fixed (does not change) in total with changes in volume of activity. Assuming the activity is
the number of bikes produced and sold, examples of fixed costs include salaried personnel,
building rent, and insurance.
Assume Bikes Unlimited pays $8,000 per month in rent for its production facility. In addition,
insurance for the same building is $2,000 per month and salaried production personnel are paid
$6,000 per month. All other fixed production costs total $4,000. Thus Bikes Unlimited has total
fixed costs of $20,000 per month related to its production facility (= $8,000 + $2,000 + $6,000 +
$4,000). If only one bike is produced, Bikes Unlimited still must pay $20,000 per month. If
5,000 bikes are produced, Bikes Unlimited still pays $20,000 per month. The fixed costs remain
unchanged in total as the level of activity changes.

Saylor URL: http://www.saylor.org/books Saylor.org 250
Question: What happens to fixed costs on a per unit basis as production levels change?
Answer: If Bikes Unlimited only produces one bike, the fixed cost per unitwould amount to
$20,000 (= $20,000 total fixed costs ÷ 1 bike). If Bikes Unlimited produces two bikes, the fixed
cost per unit would be $10,000 (= $20,000 ÷ 2 bikes). As activity increases, the fixed costs are
spread out over more units, which results in a lower cost per unit.
Table 5.2 "Fixed Cost Behavior for Bikes Unlimited" provides the total and per unit fixed costs
at three different levels of production, and Figure 5.2 "Total Fixed Production Costs for Bikes
Unlimited" graphs the relation of total fixed costs (y-axis) to units produced (x-axis). Note that
regardless of the activity level, total fixed costs remain the same.
Table 5.2 Fixed Cost Behavior for Bikes Unlimited
Units Produced Total Fixed Costs Per Unit Fixed Cost
1 $20,000 $20,000
2,000 20,000 10
4,000 20,000 5
Figure 5.2 Total Fixed Production Costs for Bikes Unlimited
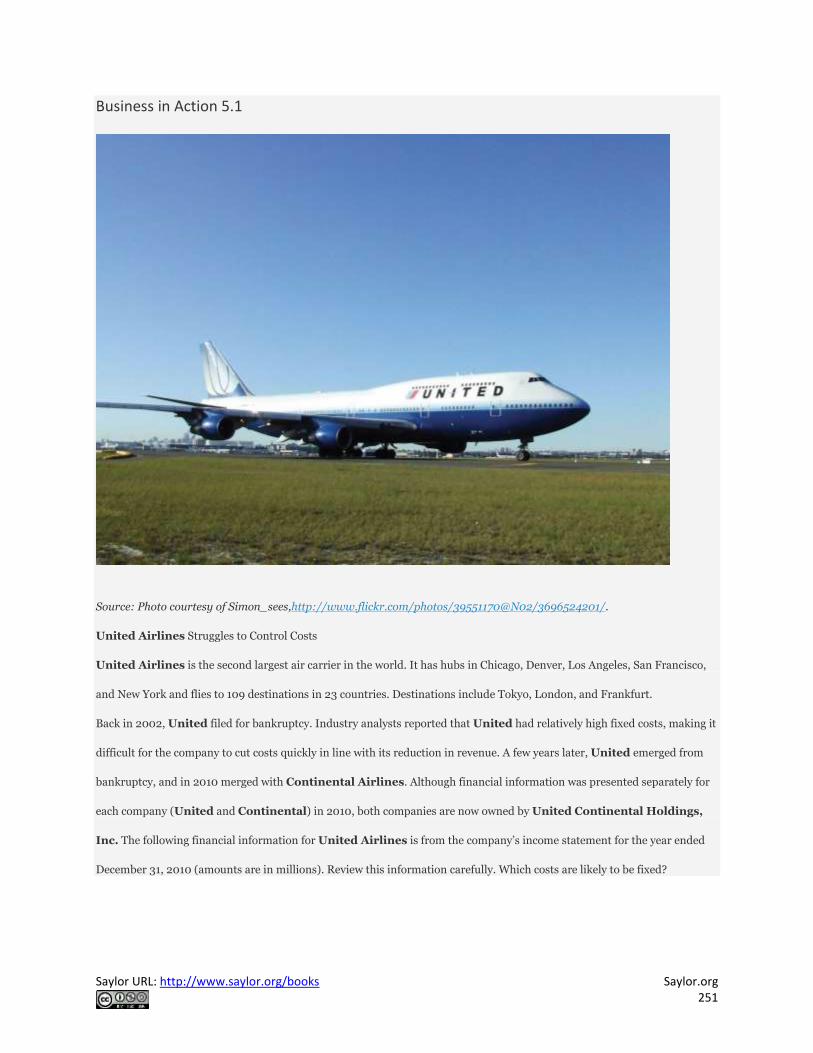
Saylor URL: http://www.saylor.org/books Saylor.org 251
Business in Action 5.1
Source: Photo courtesy of Simon_sees,http://www.flickr.com/photos/39551170@N02/3696524201/.
United Airlines Struggles to Control Costs
United Airlines is the second largest air carrier in the world. It has hubs in Chicago, Denver, Los Angeles, San Francisco,
and New York and flies to 109 destinations in 23 countries. Destinations include Tokyo, London, and Frankfurt.
Back in 2002, United filed for bankruptcy. Industry analysts reported that United had relatively high fixed costs, making it
difficult for the company to cut costs quickly in line with its reduction in revenue. A few years later, United emerged from
bankruptcy, and in 2010 merged with Continental Airlines. Although financial information was presented separately for
each company (United and Continental) in 2010, both companies are now owned by United Continental Holdings,
Inc. The following financial information for United Airlines is from the company’s income statement for the year ended
December 31, 2010 (amounts are in millions). Review this information carefully. Which costs are likely to be fixed?

Saylor URL: http://www.saylor.org/books Saylor.org 252
Although we cannot identify all fixed costs with certainty, several costs likely fall into this category: salaries (for union
employees, such as pilots, flight crews, and mechanics); aircraft fuel (assuming flights are not easily canceled); aircraft rent;
and depreciation. These costs total $11.1 billion, or 60 percent of total operating expenses (rounded). Fixed costs are clearly a
large component of total operating expenses, which makes it difficult for airline companies like United Airlines to make
short-term cuts in expenses when revenue declines.
Source: United Continental, Inc., form 10K for 2010.
Committed Versus Discretionary Fixed Costs
Question: Organizations often view fixed costs as either committed or discretionary. What is the
difference between these two types of fixed costs?
Answer: A committed fixed cost is a fixed cost that cannot easily be changed in the short run
without having a significant impact on the organization. For example, assume Bikes Unlimited
has a five-year lease on the company’s production facility, which costs $8,000 per month. This is
a committed fixed cost because the lease cannot easily be broken, and the company is committed
to using this facility for years to come. Other examples of committed fixed costs include salaried
employees with long-term contracts, depreciation on buildings, and insurance.

Saylor URL: http://www.saylor.org/books Saylor.org 253
A discretionary fixed cost is a fixed cost that can be changed in the short run without having a
significant impact on the organization. For example, assume Bikes Unlimited contributes
$10,000 each year toward charitable organizations. Management has the option of changing this
amount in the short run without causing a significant impact on the organization. Other examples
of discretionary fixed costs include advertising, research and development, and training
programs (although an argument can be made that reducing these expenditures could have a
significant impact on the company depending on the amount of the cuts).
In general, management looks to cut discretionary fixed costs when sales and profits are
declining, since cuts in this area tend not to have as significant an impact on the organization as
cutting committed fixed costs. Difficulties arise when struggling organizations go beyond cutting
discretionary fixed costs and begin looking at cutting committed fixed costs.
Mixed Costs
Question: We have now learned about two types of cost behavior patterns—variable costs and
fixed costs. However, there is a third type of cost that behaves differently in that both total and
per unit costs change with changes in activity. What do we call this type of cost?
Answer: This cost behavior pattern is called a mixed cost. The termmixed cost describes a cost
that has a mix of fixed and variable costs. For example, assume sales personnel at Bikes
Unlimited are paid a total of $10,000 in monthly salary plus a commission of $7 for every bike
sold. This is a mixed cost because it has a fixed component of $10,000 per month and a variable
component of $7 per unit.
Table 5.3 "Mixed Cost Behavior for Bikes Unlimited" provides the total and per unit fixed costs
at three different levels of production, and Figure 5.3 "Total Mixed Sales Compensation Costs
for Bikes Unlimited" graphs the relation of total mixed costs (y-axis) to units produced (x-axis).
The point at which the line intersects the y-axis represents the total fixed cost ($10,000), and the
slope of the line represents the variable cost per unit ($7).
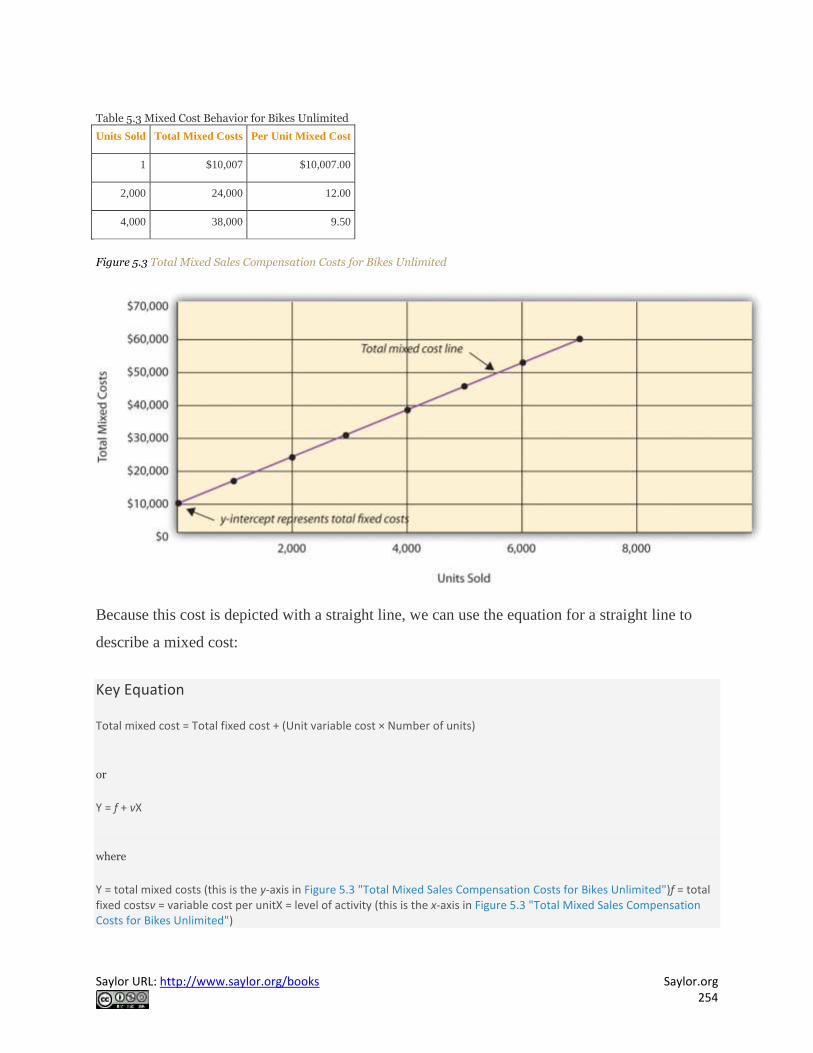
Saylor URL: http://www.saylor.org/books Saylor.org 254
Table 5.3 Mixed Cost Behavior for Bikes Unlimited
Units Sold Total Mixed Costs Per Unit Mixed Cost
1 $10,007 $10,007.00
2,000 24,000 12.00
4,000 38,000 9.50
Figure 5.3 Total Mixed Sales Compensation Costs for Bikes Unlimited
Because this cost is depicted with a straight line, we can use the equation for a straight line to
describe a mixed cost:
Key Equation
Total mixed cost = Total fixed cost + (Unit variable cost × Number of units)
or
Y = f + vX
where
Y = total mixed costs (this is the y-axis in Figure 5.3 "Total Mixed Sales Compensation Costs for Bikes Unlimited")f = total fixed costsv = variable cost per unitX = level of activity (this is the x-axis in Figure 5.3 "Total Mixed Sales Compensation Costs for Bikes Unlimited")

Saylor URL: http://www.saylor.org/books Saylor.org 255
For Bikes Unlimited, the mixed cost equation is Y = $10,000 + $7X. If Bikes Unlimited sells
4,000 bikes (X) in one month, the total mixed cost (Y) for sales personnel compensation would
be $38,000 [= $10,000 + ($7 × 4,000 units)].
Short Term Versus Long Term and the Relevant Range
We now introduce two important concepts that must be considered when estimating costs: short
term versus long term, and the relevant range.
Short Term Versus Long Term
Question: When identifying cost behavior patterns, we assume that management is using the cost
information to make short-term decisions. Why is this short-term decision making assumption so
important?
Answer: Variable, fixed, and mixed cost concepts are useful for short-term decision making and
therefore apply to a specific period of time. This short-term period will vary depending on the
company’s current production capacity and the time required to change capacity. In the long
term, all cost behavior patterns will likely change.
For example, suppose Bikes Unlimited’s production capacity is 8,000 units per month, and
management plans to expand capacity in two years by renting a new production facility and
hiring additional personnel. This is a long-term decision that will change the cost behavior
patterns identified earlier. Variable production costs will no longer be $60 per unit, fixed
production costs will no longer be $20,000 per month, and mixed sales compensation costs will
also change. All these costs will change because the estimates are accurate only in the short term.
The Relevant Range
Question: Another important concept we use when estimating costs is called the relevant
range. What is the relevant range and why is it so important when estimating costs?
Answer: The relevant range is the range of activity for which cost behavior patterns are likely to
be accurate. The variable, fixed, and mixed costs identified for Bikes Unlimited will only be
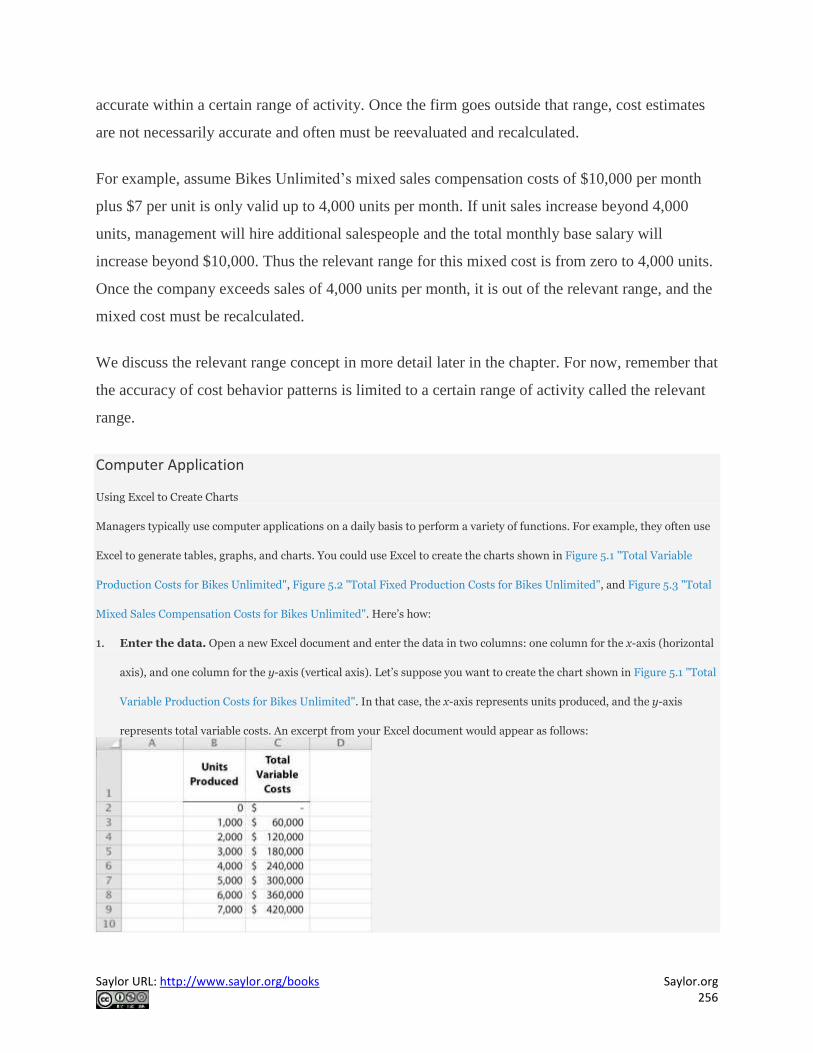
Saylor URL: http://www.saylor.org/books Saylor.org 256
accurate within a certain range of activity. Once the firm goes outside that range, cost estimates
are not necessarily accurate and often must be reevaluated and recalculated.
For example, assume Bikes Unlimited’s mixed sales compensation costs of $10,000 per month
plus $7 per unit is only valid up to 4,000 units per month. If unit sales increase beyond 4,000
units, management will hire additional salespeople and the total monthly base salary will
increase beyond $10,000. Thus the relevant range for this mixed cost is from zero to 4,000 units.
Once the company exceeds sales of 4,000 units per month, it is out of the relevant range, and the
mixed cost must be recalculated.
We discuss the relevant range concept in more detail later in the chapter. For now, remember that
the accuracy of cost behavior patterns is limited to a certain range of activity called the relevant
range.
Computer Application
Using Excel to Create Charts
Managers typically use computer applications on a daily basis to perform a variety of functions. For example, they often use
Excel to generate tables, graphs, and charts. You could use Excel to create the charts shown in Figure 5.1 "Total Variable
Production Costs for Bikes Unlimited", Figure 5.2 "Total Fixed Production Costs for Bikes Unlimited", and Figure 5.3 "Total
Mixed Sales Compensation Costs for Bikes Unlimited". Here’s how:
1. Enter the data. Open a new Excel document and enter the data in two columns: one column for the x-axis (horizontal
axis), and one column for the y-axis (vertical axis). Let’s suppose you want to create the chart shown in Figure 5.1 "Total
Variable Production Costs for Bikes Unlimited". In that case, the x-axis represents units produced, and the y-axis
represents total variable costs. An excerpt from your Excel document would appear as follows:
Saylor URL: http://www.saylor.org/books Saylor.org 257
2. Create the chart. After you have entered the data, highlight the appropriate data cells (including headings and labels)
and click onInsert, Chart, Scatter. Choose Scatter with Smooth Lines and Markers. The chart that results is linked to
your data points. If you change the data, the chart changes, too. (In earlier versions of Excel, the chart wizard walks you
through the steps necessary to create the chart.)
3. Format the chart. Now that you have created the chart, select it and use Chart Tools to format it with background
shading, text inserts, font size, chart size, and other more advanced features. If you want to display the chart within
some other document (e.g., a Word document), you can copy it (highlight the chart and selectEdit, Copy from the menu
bar) and paste it into the document (selectEdit, Paste or Paste Special).
The Excel document created by following these three steps would look like the one shown in Figure 5.1 "Total Variable
Production Costs for Bikes Unlimited".
How Cost Behavior Patterns Are Used
Question: How do managers use cost behavior patterns to make better decisions?
Answer: Accurately predicting what costs will be in the future can help managers answer
several important questions. For example, managers at Bikes Unlimited might ask the following:
We expect to see a 5 percent increase in unit sales next year. How will this affect
revenues and costs?
We are applying for a loan with a bank, and bank managers think our sales estimates are
high. What happens to our revenues and costs if we lower estimates by 20 percent?
What happens to revenues and costs if we add a racing bike to our product line?
How will costs behave in the future if we increase automation in the production process?
The only way to accurately predict costs is to understand how costs behave given changes in
activity. To make good decisions, managers must know how costs are structured (fixed, variable,
or mixed). The next section explains how to estimate fixed and variable costs, and how to
identify the fixed and variable components of mixed costs.
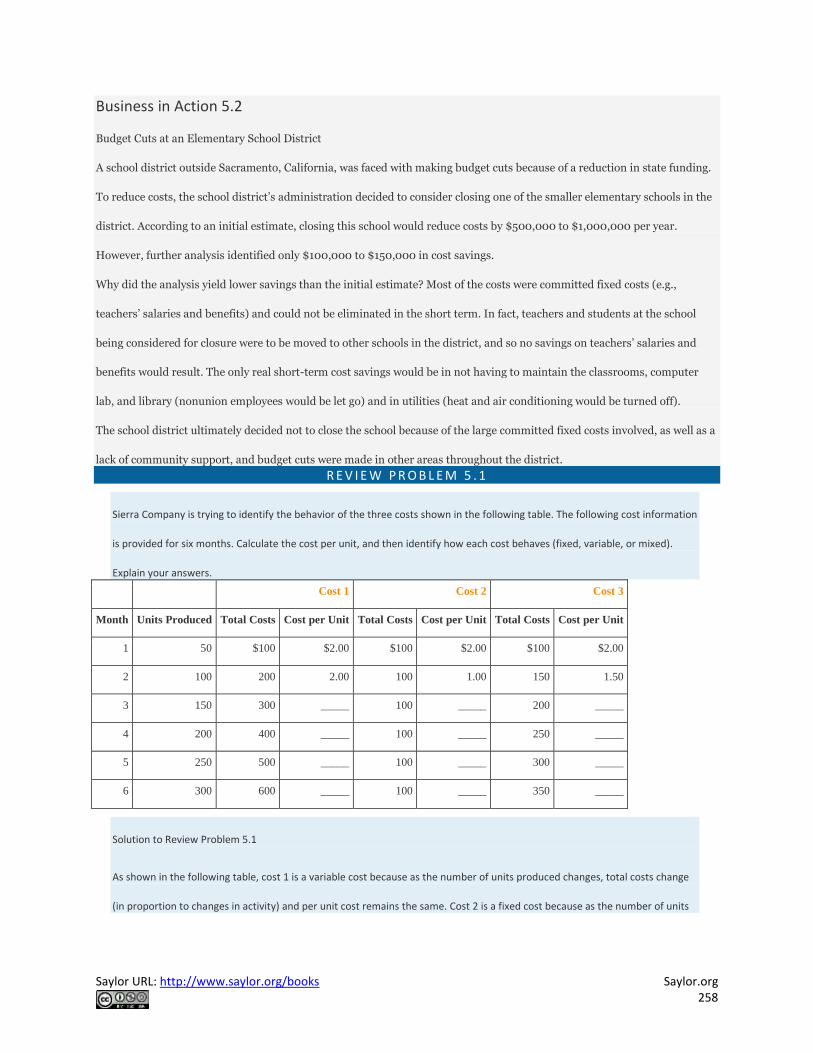
Saylor URL: http://www.saylor.org/books Saylor.org 258
Business in Action 5.2
Budget Cuts at an Elementary School District
A school district outside Sacramento, California, was faced with making budget cuts because of a reduction in state funding.
To reduce costs, the school district’s administration decided to consider closing one of the smaller elementary schools in the
district. According to an initial estimate, closing this school would reduce costs by $500,000 to $1,000,000 per year.
However, further analysis identified only $100,000 to $150,000 in cost savings.
Why did the analysis yield lower savings than the initial estimate? Most of the costs were committed fixed costs (e.g.,
teachers’ salaries and benefits) and could not be eliminated in the short term. In fact, teachers and students at the school
being considered for closure were to be moved to other schools in the district, and so no savings on teachers’ salaries and
benefits would result. The only real short-term cost savings would be in not having to maintain the classrooms, computer
lab, and library (nonunion employees would be let go) and in utilities (heat and air conditioning would be turned off).
The school district ultimately decided not to close the school because of the large committed fixed costs involved, as well as a
lack of community support, and budget cuts were made in other areas throughout the district.
R E V I E W P R O B L E M 5 . 1
Sierra Company is trying to identify the behavior of the three costs shown in the following table. The following cost information
is provided for six months. Calculate the cost per unit, and then identify how each cost behaves (fixed, variable, or mixed).
Explain your answers.
Cost 1 Cost 2 Cost 3
Month Units Produced Total Costs Cost per Unit Total Costs Cost per Unit Total Costs Cost per Unit
1 50 $100 $2.00 $100 $2.00 $100 $2.00
2 100 200 2.00 100 1.00 150 1.50
3 150 300 _____ 100 _____ 200 _____
4 200 400 _____ 100 _____ 250 _____
5 250 500 _____ 100 _____ 300 _____
6 300 600 _____ 100 _____ 350 _____
Solution to Review Problem 5.1
As shown in the following table, cost 1 is a variable cost because as the number of units produced changes, total costs change
(in proportion to changes in activity) and per unit cost remains the same. Cost 2 is a fixed cost because as the number of units
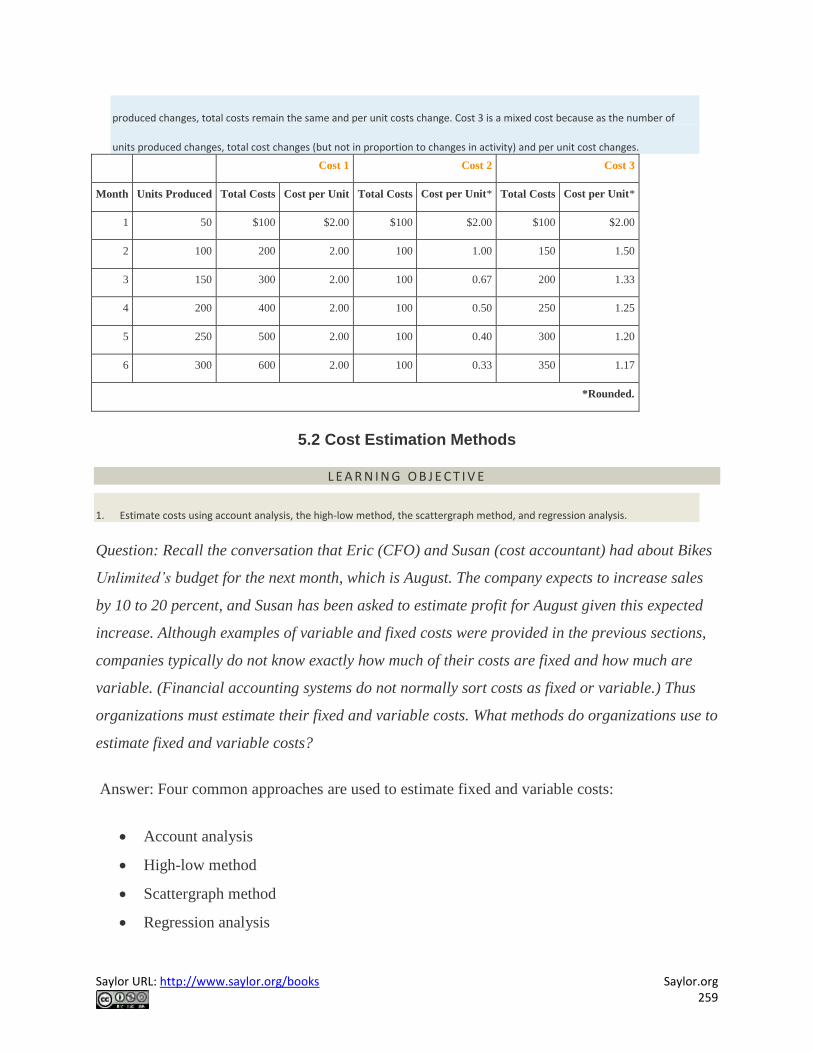
Saylor URL: http://www.saylor.org/books Saylor.org 259
produced changes, total costs remain the same and per unit costs change. Cost 3 is a mixed cost because as the number of
units produced changes, total cost changes (but not in proportion to changes in activity) and per unit cost changes.
Cost 1 Cost 2 Cost 3
Month Units Produced Total Costs Cost per Unit Total Costs Cost per Unit* Total Costs Cost per Unit*
1 50 $100 $2.00 $100 $2.00 $100 $2.00
2 100 200 2.00 100 1.00 150 1.50
3 150 300 2.00 100 0.67 200 1.33
4 200 400 2.00 100 0.50 250 1.25
5 250 500 2.00 100 0.40 300 1.20
6 300 600 2.00 100 0.33 350 1.17
*Rounded.
5.2 Cost Estimation Methods
L E A R N I N G O B J E C T I V E
1. Estimate costs using account analysis, the high-low method, the scattergraph method, and regression analysis.
Question: Recall the conversation that Eric (CFO) and Susan (cost accountant) had about Bikes
Unlimited’s budget for the next month, which is August. The company expects to increase sales
by 10 to 20 percent, and Susan has been asked to estimate profit for August given this expected
increase. Although examples of variable and fixed costs were provided in the previous sections,
companies typically do not know exactly how much of their costs are fixed and how much are
variable. (Financial accounting systems do not normally sort costs as fixed or variable.) Thus
organizations must estimate their fixed and variable costs. What methods do organizations use to
estimate fixed and variable costs?
Answer: Four common approaches are used to estimate fixed and variable costs:
Account analysis
High-low method
Scattergraph method
Regression analysis