tht vfm report 2014
DESCRIPTION
Since its inception in 2005, VfM has always been a cornerstone of financial and resource management at the Trust. The efficient and proper use of the Trust’s resources is fully integrated in the way the Trust is managed, and VfM is a key consideration in decision making across the organisation.TRANSCRIPT

Delivering Customer Value VALUE FOR
MONEY REPORT
2013-2014

2
Creating the right balance
between economy, efficiency and effectiveness
Value for Money

3
Contents
Creating the right balance
between economy, efficiency and effectiveness
Introduction 4
Section 1 5
Section 2 - VfM Strategy 7
Section 3 - Return on Assets 11
Section 4 - Financial Control & Performance Management 24
Section 5 - Achievement and Reinvestment of Efficiency Savings 28
Section 6 - Customer Scrutiny 37
Section 7 - Understanding Costs and Outcomes 44
Section 8 - Overall Self-Assessment 55
Section 9 - Appendix 1 57

4
Since its inception in 2005, VfM has always been a cornerstone of financial and resource management at the Trust. The efficient and proper use of the Trust’s resources is fully integrated in the way the Trust is managed, and VfM is a key consideration in decision making across the organisation. Whilst it is recognised that there is always scope for further improvement, the Trust has a strong track record in the delivery of VfM initiatives and VfM is well-embedded in the strategic and operational thinking of the Trust’s Board, Management and staff.
This has become known as Social Value for Money, and incorporates both financial and non-financial resource utilisation and benefits realisation. This Self-Assessment provides information on how the Trust ensures it delivers value and makes appropriate decisions around investment of resources. The Trust’s key strengths and areas for improvement are analysed across the following areas:
• VfM strategy
• Return on assets
• Financial control and performance management
• Achievement and reinvestment of efficiency savings
• Customer scrutiny
• Understanding our costs and outcomes
• Overall self-assessment
This Self-Assessment also sets out the Trust’s performance against the requirements of the HCA Value for Money Standard (Appendix 1).
1 Introduction

5
Since 2005 the Trust has been, and continues to be, committed to achieving continuous improvement in service delivery to customers, utilising resources efficiently and effectively to gain the maximum value from its service provision, and generating capacity to deliver new affordable housing to the residents of Trafford into the future.
At the Trust, VfM is about delivering customer value, identifying the “sweet spot” of cost, quality and customer satisfaction (or aspiration) levels in setting service standards. In all areas of activity, the Trust strives to obtain the maximum benefit from the resources available, achieving the right balance between economy, efficiency and effectiveness, but also ensuring equity. As well as measuring financial value, the Trust seeks to recognise the social value it creates, in order to assess the achievement of ‘Social Value for Money’.
At the January 2013 Staff Conference, the concept of ‘Social Value for Money was launched to all staff through an interactive presentation entitled ‘Adding Value’. Building upon the previous strength of VfM within the Trust’s culture, this sought to introduce all staff to the concept of social value, and the social impact of activities across the Trust:
IT’s OUR IMPACT ON...
IT’s OUR WIDER IMPACT ON...
...EVERYTHING WE DO.
The Trust’s Approach to VfM
What is Social Value?
1.1
1.2
sOCIAL VALUE FOR
MONEY
VALUE FOR MONEY
sOCIAL VALUE
INDIVIDUALS
FAMILIES
COMMUNITIESQuality of
Living
Access to Services
Housing
Health
Wealth
Empowerment Wellbeing
Training & Employment
SCHOOLHEALTH
FIRE
POLICE
LOCALGOVERNMENT
CENTRALGOVERNMENT
LOCALBUSINESSES
Shaping the Future
Support Local Economy
Reduce ASB/Crime
Partnership working
Improve Health
6
What is Social Value?1.2In order to bring to implement Social Value for Money across the Trust, a VfM Project was approved with the following objectives to be delivered by March 2015:
• Undertake a VfM & Efficiency Review; identify deliverable, sustainable efficiency savings of at least £100k per annum
• Create a VfM register and monitor plans to ensure targets are delivered
• Develop a new approach to VfM that engages staff, Board Members and customers, and embeds VfM throughout the business
• Develop and obtain Board approval of a VfM Strategy that can be used as a business tool to support the embedding of VfM throughout the business
• Ensure the performance framework includes benchmarking information and analysis that can assist management and staff to identify opportunities for VfM initiatives
• Ensure VfM is considered as part of the budget setting, business planning, project management and business development processes
• Support Audit, Risk & Compliance (ARC) Committee and Board in their oversight of VfM, ensuring they have the appropriate information on the cost and quality of services to make informed decisions
• Develop staff engagement mechanisms to support a culture of Continuous Improvement
• Consider linkages to Impact Assessment/SROI methodology
• Develop a revised Procurement Strategy to obtain maximum value from supply chain management
To date the Trust has undertaken significant work to embed Social Value for Money, in particular focussing on developing a methodology to understand the Social Return on Investment of activities (Section 3.7); gaining a better understanding of the relationship between cost and quality of service delivery, and using this to inform decision making (Section 7) and linking efficiency savings achieved to reinvestment decisions (Section 5).
The project is ongoing and progressing well, with the following deliverables achieved to date:
• Board-approved VfM Strategy which defines the Trust’s approach to VfM
• VfM & Efficiency Review undertaken by KPMG, identifying c.£500k potential opportunities for efficiency savings
• Resultant Action Plan formulated to deliver c.£400k efficiency savings
• Formation of a VfM Project Group, comprising members from all areas of the business, to drive VfM across the Trust
• Robust benchmarking framework in place, with third-party assurance from HouseMark as to the appropriateness of the Trust’s cost allocation methodology
• Establishment of a methodology for the measurement of Social Return on Investment, in partnership with the New Economics Foundation (NEF)
Key deliverables for 2014/15 include:
• Production of 2013/14 VfM Self-Assessment
• Formation of a VfM Delivery Group from across the business, to ensure VfM is embedded and to monitor the implementation of approved initiatives
• Development of a VfM Benchmarking Framework to monitor and compare the cost and quality of services, including consideration of the most appropriate methods of benchmarking different services
• Development of an Efficiency and VfM Initiative Implementation Monitoring Framework
• Implementation of a regular VfM reporting cycle to Audit, Risk & compliance Committee (ARCC)
• Training and engagement of staff, Board members and customers
• Embedding VfM in the existing Customer Involvement Structures
• Project to review Procurement Strategy and Policies across the organisation

7
2VFM Strategy
The Trust’s approach to VfM is outlined in the VfM Strategy, which was approved by Board in September 2012 and is reviewed bi-annually. The VfM Strategy underpins the Trust’s Business Plans for the forthcoming three years, with the Plan for each area of the business stating how it will deliver VfM, and is inherent in the annual budget setting process.
The VfM Strategy defines the principles underpinning the achievement of VfM as being:
• Economy: spending less - the price paid for what goes into providing a service. Delivering services at optimum cost, through minimising the cost of resources.
• Efficiency: spending well – a measure of productivity and performance, how much is obtained in relation to what is put in.
• Effectiveness: spending wisely – the impact that is achieved, how far the intended outcomes are achieved.
• Equity: spending fairly – ensuring benefits are distributed fairly, that customers do not receive differing services for reasons other than need.
Central to the Trust’s VfM Strategy is the Strategic Vision for the achievement of customer value, which is defined as “to deliver our Promise to customers, invest in our neighbourhoods and support our communities, maximising Customer Value”. The Strategy sets out five strategic aims to support delivery of this vision:
The Strategy is represented as a central Vision, with five strategic aims circling the Vision. The strategic aim of promoting a Value Creation Culture encircles the other four strategic aims, to reflect that to have a truly embedded approach to VfM, there needs to be an appropriate understanding by management.
sTRATEGIC AIMs
• To promote and embed a Value Creation culture in everything we do – to deliver Customer Value
• To ensure strong financial management, budgeting and control
• To understand our costs and performance and how they relate to others
• To maximise opportunities for value creation
• To have meaningful monitoring and reporting
To deliver the Customer Promise,
invest in our neighbourhoods and support our
communities, maximising Customer Value
Pro
mot
ing
a v
alue cre
ation culture in everything we do
to deliver Customer Value Meaninful m
onit
orin
g
& re
portin
g
Maxim
ising opportunities
for value creation
budg
eting
& control
Stro
ng �
nanc
ial m
anagementperformance & how
they
Understanding our costs &
compare to others

8
2 VFM Strategy
As part of the work to define the Trust’s VfM Strategy, an externally facilitated workshop was held with the Senior Management Team to better understand the Trust’s approach to VfM and identify priorities for improvement. The table below shows the results of the VfM Maturity Self-Assessment and subsequent actions taken to address areas identified as relatively weak:
Aspect Self-Assessment and comments Action taken
Culture and leadership (with regard to VfM)
Weak
• VfM is not branded
• Managers have a detailed understanding of the cost/performance of services in their area
• Do all staff truly understand what VfM means
• VfM and Social VfM relaunched to all staff at conference in January 2013
• Ideas Unlimited (staff suggestion scheme) has own brand and is actively promoted throughout the business
• Timetable in place to roll out VfM training to all staff during 2014/15
Strategy Weak
• Trust makes year on year efficiency savings
• Current VfM Strategy is now out of date
• Updated Strategy approved by Board in September 2012
• VfM reporting cycle in place, with regular reporting to ARCC
Understanding costs & performance drivers
Good
• Good understanding of costs/performance
• Could improve understanding of performance drivers and how these impact on cost
• Updated Strategy approved by Board in September 2012
• VfM reporting cycle in place, with regular reporting to ARCC
Effective challenge & scrutiny
Good - Excellent
• Robust budget and performance monitoring by both management and Board
Understanding social returns – measuring of outcomes
Weak
• Assessing the social impact of services and investment decisions and evaluating the outcomes for customers is difficult
• Framework for measuring SROI developed in partnership with NEF
• SROI assessments undertaken for specific activities; further SROI assessments in pipeline for 2014/15
Prioritisation, decision making & opportunity cost
Good - Excellent
• Robust budget setting and monitoring processes
• Customer Promise sets out what services and standards customers should expect; budgets set to deliver Promise
Comparators & benchmarking
Good
• Wide range of financial and non-financial KPIs, including benchmark data
• Learning from peers is inconsistent; do we investigate/seek to understand where others perform better?
Reporting and self-assessment
Weak
• Robust financial and performance reporting
• Lack of clarity on how VfM is reported and monitored
• VfM reporting cycle in place, with regular reporting to ARCC
• VfM Self-Assessment presented to Board in August each year

9
2VFM Strategy
The Strategy also incorporates an Action Plan setting out what has been done and what will be done to meet the objectives set out in the Strategy:
Key Action Progress
AIm 1: To promote and embed a Value Creation culture in everything we do - to deliver Customer Value
To consider implementation of a Staff Suggestion Scheme to encourage staff to identify and implement service improvement or cost saving ideas – possible a 3 month short term scheme
Staff suggestion scheme, ‘Ideas Unlimited’ has been introduced as an ongoing, long-term scheme. To date 35 suggestions have been received, of which 11 have been taken forward for scoping
To consider implementation of a Customer Suggestion Scheme to encourage customers to make VfM suggestion
The VfM Project Team is currently considering how to increase customer involvement in driving VfM as part of Phase 2 of the project
To review ways of launching the Customer Value concept and staff suggestion scheme, possibly using the Staff Conference
Ideas Unlimited and the concept of Social Value for Money launched at the Staff Conference in January 2013
To run a pilot project to assess whether employee Service & Process Improvement Groups could assist in service improvement
The Business Intelligence Team has been expanded to include a Service Improvement function, which works in collaboration with the business to review services and processes with a view to improving efficiency and effectiveness
AIm 2: To ensure strong financial management, budgeting and control
To review the current supplier payment systems and assess whether a new software solution should be implemented
An electronic invoice processing system, eBis, has been implemented. The system is fully integrated with the Open Accounts finance system and allows invoices to be scanned and distributed electronically, with escalation, approval and payment controlled through electronic workflow processes and controls
To review the current supplier approval process and develop an approved supplier list and contract database
• Enhanced controls have been implemented around the setup of new suppliers, to include credit checking, management sign off and validation of payment details
• Business Case currently being drafted to undertake a fundamental review of procurement practices across the Trust. This will include a review and consolidation of the supplier list
To review the budget setting process to assess whether it can be developed to ensure alignment with the Aims of this Strategy
The 2014/15 budget was formulated alongside the operational Business Plans, which have considered VfM (see Section 5.4)
10
2 VFM Strategy
Key Action Progress
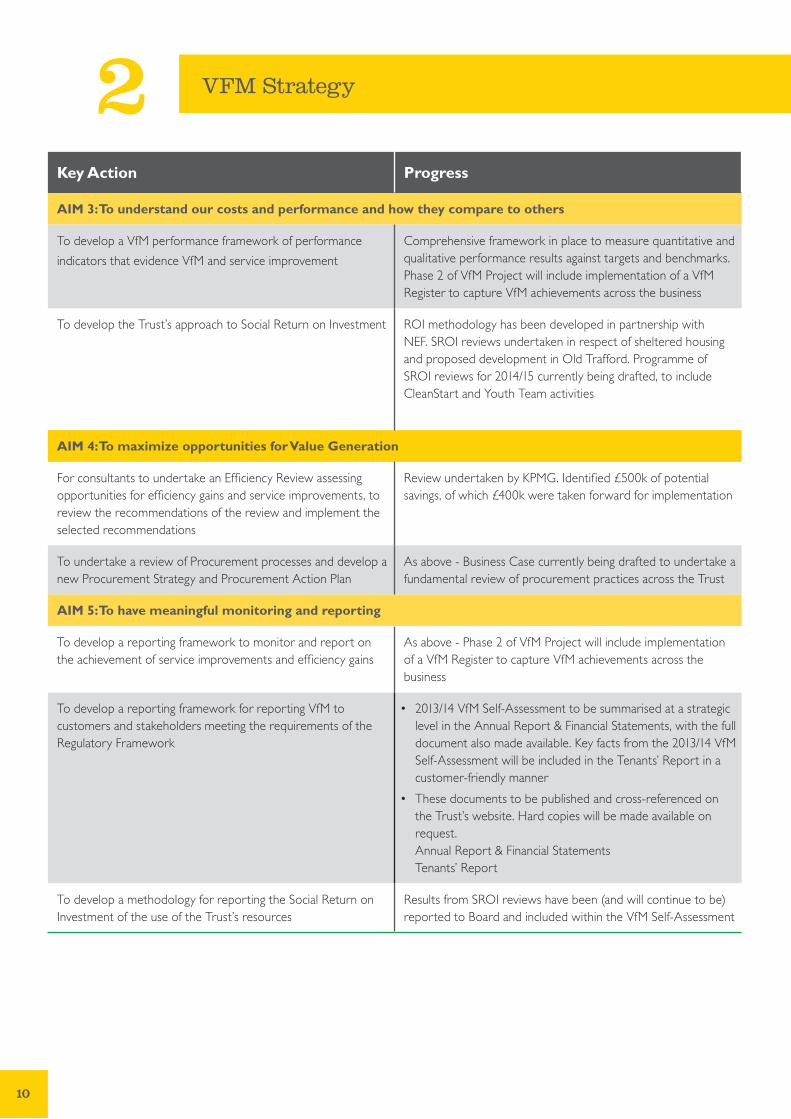
AIm 3: To understand our costs and performance and how they compare to others
To develop a VfM performance framework of performance
indicators that evidence VfM and service improvement Comprehensive framework in place to measure quantitative and qualitative performance results against targets and benchmarks. Phase 2 of VfM Project will include implementation of a VfM Register to capture VfM achievements across the business
To develop the Trust’s approach to Social Return on Investment ROI methodology has been developed in partnership with NEF. SROI reviews undertaken in respect of sheltered housing and proposed development in Old Trafford. Programme of SROI reviews for 2014/15 currently being drafted, to include CleanStart and Youth Team activities
AIm 4: To maximize opportunities for Value Generation
For consultants to undertake an Efficiency Review assessing opportunities for efficiency gains and service improvements, to review the recommendations of the review and implement the selected recommendations
Review undertaken by KPMG. Identified £500k of potential savings, of which £400k were taken forward for implementation
To undertake a review of Procurement processes and develop a new Procurement Strategy and Procurement Action Plan
As above - Business Case currently being drafted to undertake a fundamental review of procurement practices across the Trust
AIm 5: To have meaningful monitoring and reporting
To develop a reporting framework to monitor and report on the achievement of service improvements and efficiency gains
As above - Phase 2 of VfM Project will include implementation of a VfM Register to capture VfM achievements across the business
To develop a reporting framework for reporting VfM to customers and stakeholders meeting the requirements of the Regulatory Framework
• 2013/14 VfM Self-Assessment to be summarised at a strategic level in the Annual Report & Financial Statements, with the full document also made available. Key facts from the 2013/14 VfM Self-Assessment will be included in the Tenants’ Report in a customer-friendly manner
• These documents to be published and cross-referenced on the Trust’s website. Hard copies will be made available on request. Annual Report & Financial Statements Tenants’ Report
To develop a methodology for reporting the Social Return on Investment of the use of the Trust’s resources
Results from SROI reviews have been (and will continue to be) reported to Board and included within the VfM Self-Assessment

11
3Return on Assets
Historically, the approach to VfM relating to the Trust’s physical assets has focussed on four elements:
• maximising the value of assets held to increase the financial capacity of the Trust
• maximising rental income generation from the Trust’s portfolio
• the cost and quality of improvements to existing homes and
• obtaining best value in the development of new homes
The Trust recognises that there is a need to ‘get smarter’ in its management of the asset portfolio, to ensure it achieves maximum value from assets
employed. During 2014/15, projects will be undertaken to better understand how value is driven from asset utilisation, enabling Board and Management to understand:
• the financial return of individual assets
• the social value of assets and activities
As well as physical (property) assets, the Trust recognises that one of its key assets is its workforce. The Trust is an organisation run based on its values, with staff satisfaction and motivation recognised as vital to achieve increased productivity, improved service delivery and maximise efficiency. Section 3.8 sets out how the Trust assesses the value generated through the workforce.
The Trust invests a significant amount of resource each year into maintaining and improving the quality of its existing asset base. Since transfer, the Trust has invested over £170m in its homes – c.120m in the first five years to bring homes to DHS, and c.£12m each year thereafter to further improve and maintain the quality of the housing it provides. This investment was funded through a combination of loans secured on the Trust’s assets and reserves.
The Trust’s investment in its assets is reflected in the current and future projected stock valuation. Each year Savills, the Trust’s valuers, undertake a valuation of the Trust’s existing housing assets using the EUV-SH valuation basis. As the graph above demonstrates, the Trust has seen growth in its asset value (and therefore potential funding capacity) from £55m in its first year to £208m at 2013/14. Based on the current funding covenant of 110% asset cover, this valuation would enable further borrowing of c.£44m. Further growth is expected to take the Trust’s asset value to c.£250m within the next five years, and the Trust will be undertaking a project during 2014/15 to assess how
to maximise its debt capacity in terms of its funding arrangements and the delivery of new investment.
What is Social Value?3.1INVEsTMENT IN AssETs
Vs VALUATION
Valuation (EUV-SH) at 31st March
Cumulative Investment
12
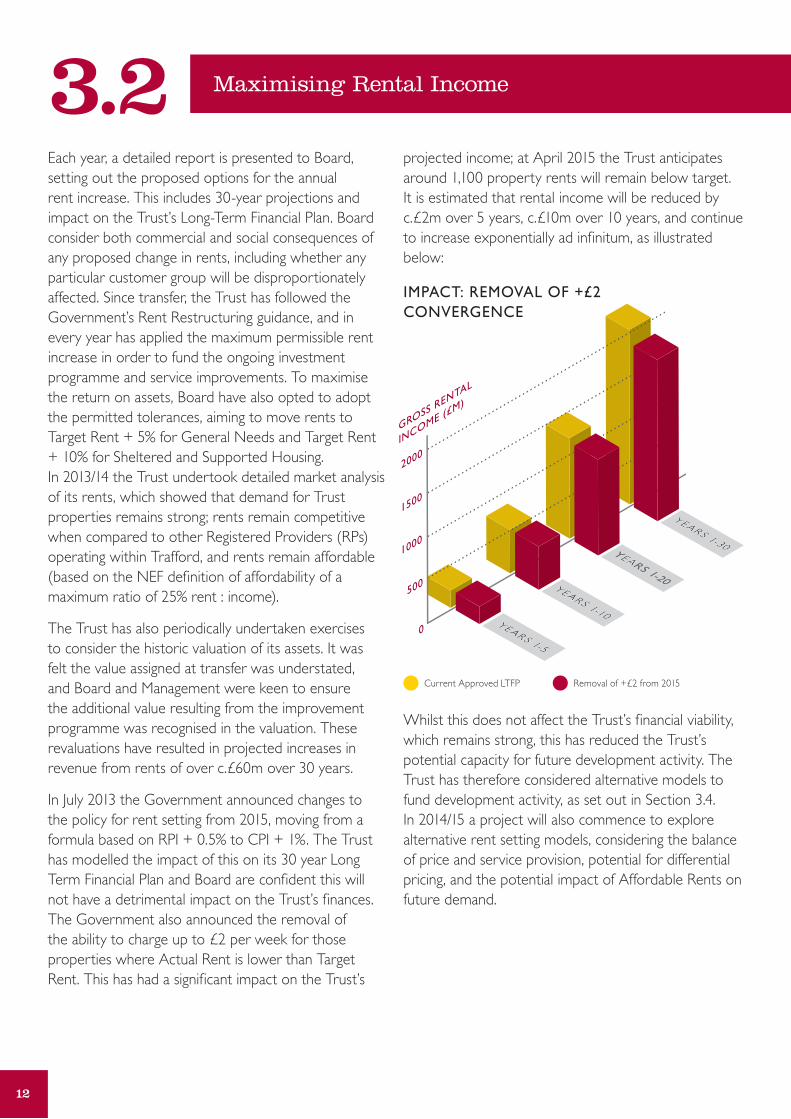
Maximising Rental Income3.2Each year, a detailed report is presented to Board, setting out the proposed options for the annual rent increase. This includes 30-year projections and impact on the Trust’s Long-Term Financial Plan. Board consider both commercial and social consequences of any proposed change in rents, including whether any particular customer group will be disproportionately affected. Since transfer, the Trust has followed the Government’s Rent Restructuring guidance, and in every year has applied the maximum permissible rent increase in order to fund the ongoing investment programme and service improvements. To maximise the return on assets, Board have also opted to adopt the permitted tolerances, aiming to move rents to Target Rent + 5% for General Needs and Target Rent + 10% for Sheltered and Supported Housing. In 2013/14 the Trust undertook detailed market analysis of its rents, which showed that demand for Trust properties remains strong; rents remain competitive when compared to other Registered Providers (RPs) operating within Trafford, and rents remain affordable (based on the NEF definition of affordability of a maximum ratio of 25% rent : income).
The Trust has also periodically undertaken exercises to consider the historic valuation of its assets. It was felt the value assigned at transfer was understated, and Board and Management were keen to ensure the additional value resulting from the improvement programme was recognised in the valuation. These revaluations have resulted in projected increases in revenue from rents of over c.£60m over 30 years.
In July 2013 the Government announced changes to the policy for rent setting from 2015, moving from a formula based on RPI + 0.5% to CPI + 1%. The Trust has modelled the impact of this on its 30 year Long Term Financial Plan and Board are confident this will not have a detrimental impact on the Trust’s finances. The Government also announced the removal of the ability to charge up to £2 per week for those properties where Actual Rent is lower than Target Rent. This has had a significant impact on the Trust’s
projected income; at April 2015 the Trust anticipates around 1,100 property rents will remain below target. It is estimated that rental income will be reduced by c.£2m over 5 years, c.£10m over 10 years, and continue to increase exponentially ad infinitum, as illustrated below:
Whilst this does not affect the Trust’s financial viability, which remains strong, this has reduced the Trust’s potential capacity for future development activity. The Trust has therefore considered alternative models to fund development activity, as set out in Section 3.4. In 2014/15 a project will also commence to explore alternative rent setting models, considering the balance of price and service provision, potential for differential pricing, and the potential impact of Affordable Rents on future demand.
IMPACT: REMOVAL OF +£2 CONVERGENCE
Current Approved LTFP Removal of +£2 from 2015
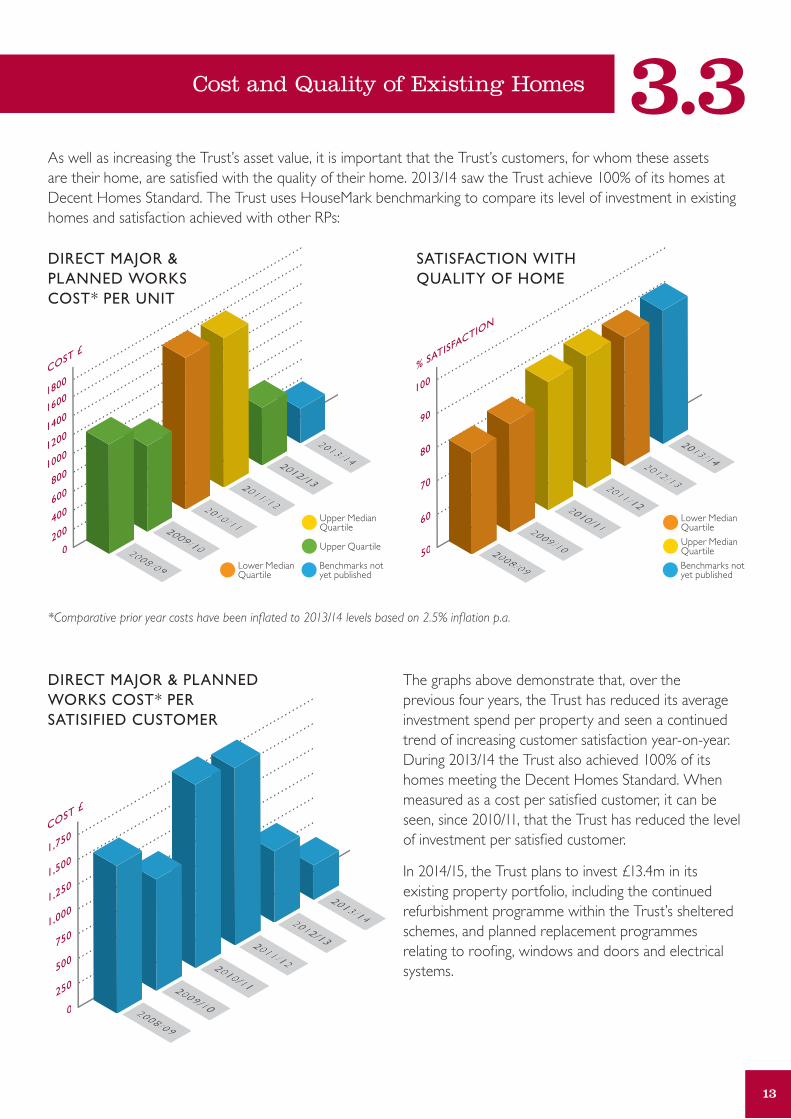
As well as increasing the Trust’s asset value, it is important that the Trust’s customers, for whom these assets are their home, are satisfied with the quality of their home. 2013/14 saw the Trust achieve 100% of its homes at Decent Homes Standard. The Trust uses HouseMark benchmarking to compare its level of investment in existing homes and satisfaction achieved with other RPs:
*Comparative prior year costs have been inflated to 2013/14 levels based on 2.5% inflation p.a.
The graphs above demonstrate that, over the previous four years, the Trust has reduced its average investment spend per property and seen a continued trend of increasing customer satisfaction year-on-year. During 2013/14 the Trust also achieved 100% of its homes meeting the Decent Homes Standard. When measured as a cost per satisfied customer, it can be seen, since 2010/11, that the Trust has reduced the level of investment per satisfied customer.
In 2014/15, the Trust plans to invest £13.4m in its existing property portfolio, including the continued refurbishment programme within the Trust’s sheltered schemes, and planned replacement programmes relating to roofing, windows and doors and electrical systems.
13
3.3Cost and Quality of Existing Homes
Upper Median Quartile
Upper Median Quartile
Lower Median Quartile
Lower Median Quartile
Upper Quartile
Benchmarks not yet published
Benchmarks not yet published
DIRECT MAJOR & PLANNED WORKs COsT* PER UNIT
sATIsFACTION WITH QUALITY OF HOME
DIRECT MAJOR & PLANNED WORKs COsT* PER sATIsIFIED CUsTOMER

14
Cost and Quality of Existing Homes3.3As well as assessing VfM in terms of customer satisfaction achieved, the Trust also utilises HouseMark data to compare its costs with those of similar RPs (ie North West LSVTs with 5,000 – 13,000 homes). Using the latest available benchmarking data (2012/13), the graph below illustrates that the Trust performs well in relation to its peers:
During 2013/14 the Trust, in partnership with Savills, undertook a Stock Condition Survey in relation to all existing housing assets. The Trust undertakes a Stock Condition Survey every five years, which informs the Asset Management Strategy and determines the level and nature of investment in existing homes over a thirty year period. This, in turn, informs both the Trust’s Long Term Financial Plan and the detailed Investment Programme and Budget for the next five years.
In undertaking the survey, the Trust considered the current condition of assets and prioritised investment works using traffic light scoring matrix as follows:
Urgent investment in the coming year. Risks of legislative breach, such as Health & Safety, Decent Homes Standard, Section 11 of the Landlord & Tenant Act, and/or risk to fabric or structure of building.
Important investment in-year, could defer 1-2 years without material risk to building fabric/component.
Timely and advisable investment in-year, could defer up to 5 years without material risk.
Desirable enhancement investment but purely discretionary.
Management considered the findings of the survey against the above matrix and, through challenge of the investment ‘pattern’, was able to realise £6.0m of additional capacity across years 1-12 of the Long Term Financial Plan. This capacity will be directed towards new home development, and equates to approximately 40 new homes.
COMPARATIVE DIRECT MAJOR & PLANNED WORKs COsT PER UNIT 2012/13
Upper Median Quartile
Lower Median Quartile
Upper Quartile
Lower Quartile

15
3.4Development Activity
Since 2008, when the Trust entered into a contract with the Homes & Communities Agency as part of the 2008-11 National Affordable Housing Programme, the Trust has developed 276 new homes within Trafford. 2013/14 marked a significant ‘turning point’ whereby total new homes built exceeded total Trust homes sold under Right To Buy (RTB), as illustrated below:
Receipts from property sales are used to fund the development of new homes, and approximately two RTB sales generates sufficient funds to build one new home. To 2013/14, the Trust had spent £36m on new development, funded through a combination of RTB sales proceeds, grant funding and borrowing. In order to support development activity, the Trust has twice increased its borrowing facility with Barclays, from £90m to £110m in 2009, and a further £35m in 2011 to take total facility to £145m.
The Trust undertakes detailed scheme appraisals for all potential development opportunities using set parameters approved by Board, and assesses the impact of each potential development scheme on the Long Term Financial Plan (including detailed sensitivity analysis and risk assessment). The Board considers development proposals based on financial projections and social value delivered through schemes, such as community regeneration and addressing significant under-provision in an area. The development portfolio is designed to provide a balance between financial return, long-term sustainable housing provision and social value delivered through schemes, such as community regeneration and addressing significant under-provision in an area.
CUMULATIVE NUMbER OF HOMEs bUILT AND sOLD
05/06 10/11
06/07 11/12
07/08 12/13
08/09 13/14
09/10

16
Development Activity3.4The Trust rigorously controls spending before and during each development project to ensure best value is being obtained from investment. The Trust has significantly outperformed initial projections in relation to development activity to date, with all programmes being delivered within 5% of original scheme projections, and returns from all Shared Ownership developments exceeding expectations, both in terms of sales receipts and speed of sale. The graphs below illustrate actual outturn of individual schemes compared to original scheme projections approved by Board:
As well as financial outperformance, the Trust has delivered significant social and environmental value through its development programme to date. Initiatives undertaken during 2013/14 include:
• employment of apprentices by development partners
• utilisation of local supply chain
• use of local labour on development projects (12% at Fiona Gardens, 40% at Lowther Gardens and 38% at Highfield Road)
• delivery of and involvement in community regeneration projects
• contracting with the Trust’s Social Enterprise, CleanStart, to undertake cleaning and clearance services
The benefits delivered through these initiatives include:
• provision of employment and training to 13 young people through the apprenticeship schemes
• provision of wider local employment opportunities through use of local labour on development projects
• supporting the local economy through supply chain and procurement practices
• supporting local community regeneration, including:
• provision of labour and materials to support a project to refurbish a centre in Old Trafford that supports refugees and asylum seekers
• upgrading of local school, nursery and community centre facilities
• creation of community spaces, such as community gardens
• contribution of £1,000 to assist in the upgrade of a local Scout hut
COMPLETED DEVELOPMENTs bUDGET V ACTUAL COsTs
Actual
Budget

17
3.4Development Activity
• supporting the Trust’s Social Enterprise to provide employment opportunities to ex-offenders (41 supported to date, 49% into permanent employment, 12% reoffending rate well below national average)
The Trust has ambitions to continue to develop new homes and to achieve growth, both in development activity and the wider business. The Trust has developed an ambitious Business Plan for its development activity, which defines two clear priorities for the Developer Business:
• to develop Affordable Housing to grow the asset base of the Trust
• to generate profits to be reinvested into the Trust
The Business Plan is predicated on four main Value Propositions; development of Affordable and Specialist Housing (charitable), and development for Open Market Sale and Private Rental (non-charitable). The Operating Model for the Developer Business is summarised in the Plan as follows:
The Developer Plan was approved by Board in March 2014, following a high degree of debate and challenge as to the most appropriate balance of activities. Board considered the proposed portfolio over the next three years, and gave consideration as to the most appropriate balance between tenures, geography and property type. The final approved Plan was felt by Board to provide the most appropriate balance in delivering the Developer’s two priorities.
This three-year Plan signifies a step-change in the level of development activity undertaken, and sets out the Trust’s most ambitious development plan to date. Detailed market analysis has been undertaken, utilising both in-house and third party expertise, in order to gain an understanding of current and future demand to inform development plans. The Plan will see:
• expansion of development activity into non-charitable activities, such as development for outright sale and private rental
• formation of a subsidiary company to undertake non-charitable development activity
• the development of an additional 583 homes over three years, of which c.36% will be Affordable Housing
• the generation of c.£10m profit through open market sales activity, to be invested in charitable development and non-development activities
• delivery of social and environmental value through triple-bottom-line targets, including reducing carbon through a managed build process and use of sustainable buildings, and delivery of social value through responsible supply chain management.
Consideration and management of financial and non-financial risk is included within the Business Plan, including robust scenario modelling to understand the impact of changes in grant, sales and other key variables on the overall viability of the Developer business. As development activity accelerates, the Trust will ensure rigorous controls around development spend, cashflows, social deliverables and product quality continue to operate effectively.
D E V E L O P E R
TR
AF
FO
RD
HO
US
ING
TR
US
T
OpenMarket
Sale
AffordableHousing
SpecialistHousing
PrivateRental
THT - Capital Investment
THT - Financial Return
Developer - Investment to Generate Capacity
Developer - Investment to Build More Affordable Homes
18
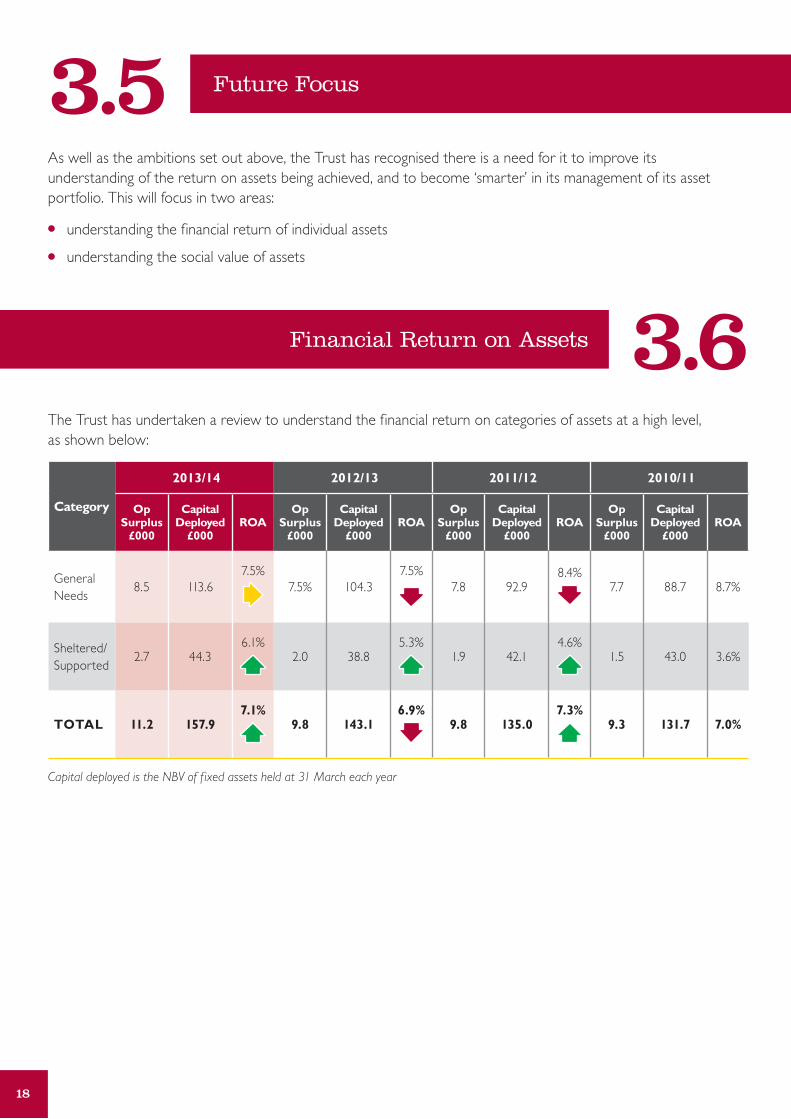
Future Focus3.5As well as the ambitions set out above, the Trust has recognised there is a need for it to improve its understanding of the return on assets being achieved, and to become ‘smarter’ in its management of its asset portfolio. This will focus in two areas:
• understanding the financial return of individual assets
• understanding the social value of assets
The Trust has undertaken a review to understand the financial return on categories of assets at a high level, as shown below:
Category
2013/14 2012/13 2011/12 2010/11
Op Surplus
£000
Capital Deployed
£000ROA
Op Surplus
£000
Capital Deployed
£000ROA
Op Surplus
£000
Capital Deployed
£000ROA
Op Surplus
£000
Capital Deployed
£000ROA
General Needs
8.5 113.67.5%
7.5% 104.37.5%
7.8 92.98.4%
7.7 88.7 8.7%
Sheltered/Supported
2.7 44.36.1%
2.0 38.85.3%
1.9 42.14.6%
1.5 43.0 3.6%
TOTAL 11.2 157.97.1%
9.8 143.16.9%
9.8 135.07.3%
9.3 131.7 7.0%
Capital deployed is the NBV of f ixed assets held at 31 March each year
Financial Return on Assets 3.6STRETFORD
MANCHESTER
CHESHIRE
SALFORDOVERALL:
SALE
BOWDON
BUCKLOW
UMSTON
ALTRINCHAM
HALE
TRAFFORD
13
17
1
15
18
7
153
2
4
516
920
Negative NPV: -£1m or worse
Positive NPV: >£1m
Negative NPV: up to -£1m
Marignal: Positive NPV <£250k
Positive NPV: £250k - £1m
9 3 9
19
1114
8
1210
21
19
3.6Financial Return on Assets
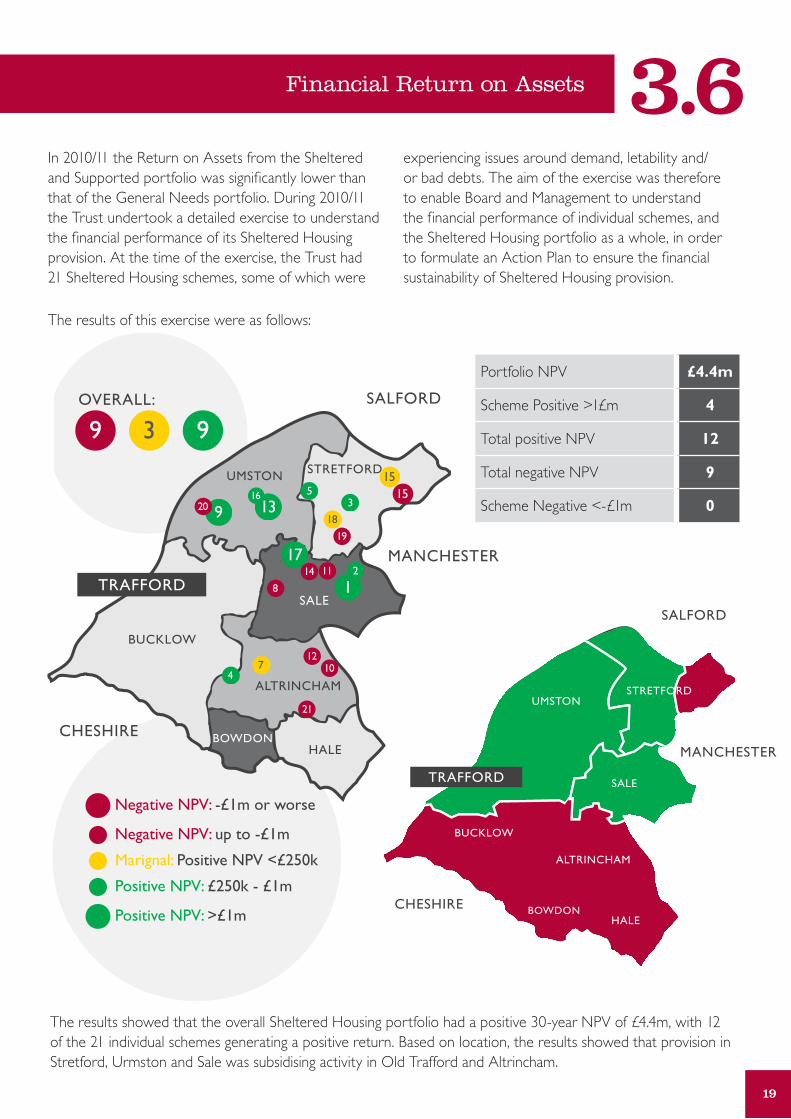
In 2010/11 the Return on Assets from the Sheltered and Supported portfolio was significantly lower than that of the General Needs portfolio. During 2010/11 the Trust undertook a detailed exercise to understand the financial performance of its Sheltered Housing provision. At the time of the exercise, the Trust had 21 Sheltered Housing schemes, some of which were
experiencing issues around demand, letability and/or bad debts. The aim of the exercise was therefore to enable Board and Management to understand the financial performance of individual schemes, and the Sheltered Housing portfolio as a whole, in order to formulate an Action Plan to ensure the financial sustainability of Sheltered Housing provision.
The results of this exercise were as follows:
The results showed that the overall Sheltered Housing portfolio had a positive 30-year NPV of £4.4m, with 12 of the 21 individual schemes generating a positive return. Based on location, the results showed that provision in Stretford, Urmston and Sale was subsidising activity in Old Trafford and Altrincham.
STRETFORD
MANCHESTER
CHESHIRE
SALFORDOVERALL:
SALE
BOWDON
BUCKLOW
UMSTON
ALTRINCHAM
HALE
TRAFFORD
13
17
1
15
18
7
153
2
4
516
920
Negative NPV: -£1m or worse
Positive NPV: >£1m
Negative NPV: up to -£1m
Marignal: Positive NPV <£250k
Positive NPV: £250k - £1m
9 3 9
19
1114
8
1210
21
Portfolio NPV £4.4m
Scheme Positive >1£m 4
Total positive NPV 12
Total negative NPV 9
Scheme Negative <-£1m 0
TRAFFORD
STRETFORD
MANCHESTER
CHESHIRE
SALFORD
SALE
BOWDON
BUCKLOW
UMSTON
ALTRINCHAM
HALE

20
Financial Return on Assets3.6Analysis of the results identified two key drivers for low return on investment:
• in Old Trafford there were issues relating to demand and bad debts
• in Altrincham there were high demand schemes, but all were smaller than 30 units
It was identified that, if voids and bad debts across all schemes were reduced to 1% and 0.5% respectively, the overall NPV of Sheltered Provision would increase to £9.5m. A target for reducing voids and bad debts was agreed, and Scheme Managers were given more control over lettings and rent collection within their scheme. This has had a positive impact and reduced overall voids and bad debts from 7.3% to 3.3% across the sheltered portfolio:
As a result of the analysis, and considering potential alternative use, the Board took the decision to close two underperforming schemes and redevelop in order to provide a better return to the business and improved services for customers:
• Palace Court: 19-unit scheme demolished, site redeveloped to provide a 72-unit, state of the art Extra Care scheme
• Waterside Court: 29-unit scheme with significant demand issues currently under refurbishment to provide 23 high-quality apartments for Affordable Rent
A project has been approved for 2014/15 to procure a solution that will enable the Trust to analyse the return on investment for every scheme and property, including a review of every void to inform the decision as to whether to invest/relet or dispose. Board have provided a clear steer that decisions should not be based solely on financial return, but should also consider social value and potential alternative asset use. The objectives identified in the Project Initiation Document are:
• procure a system that can hold granular data on stock and life cycle of components with a costed timeframe for replacement /maintenance – information used to make long term business investment and divestment judgements
• support and inform the strategic business plans for Landlord and Developer, demonstrating VfM
• property performance information to be shared and visible across business
• develop a process to ensure every property void is assessed prior to reletting
• train staff and embed the operation of the system to ensure benefits are maximised
• implement a trial to ‘road-test’ the system and resolve any issues, prior to using live data to produce an estate management plan
Whilst decisions will consider both financial and non-financial aspects, this information will provide increased knowledge of the Trust’s asset portfolio; support the Asset Management Strategy to enable more informed decisions around investment/divestment; provide the ability to model alternative asset management strategies, and enable comparison to peer organisations to better understand investment performance.
IMPACT OF TARGETED ACTION ON VOIDs & ARREARs
Average Voids March 2014
Average Voids before Intervention

Through applying established metrics to these results (New Economy Working Papers: Understanding the Wider Value of Public Policy Interventions (2012) & Fujiwara, p.36, Socialising on most days of the week), the project team was then able to assign a financial value to the social value created. The results showed that, for every £1 invested in Sheltered Housing, Social Value of £1.50 is created from the Trust perspective, and £3.20 from the tenant perspective. In particular, customers reported a significantly enhanced sense of safety, increased confidence and increased access to learning opportunities as a result of living in sheltered housing. When applied across the Trust’s sheltered portfolio, this equates to c.£6.7m of social value generation per year.
21
3.7Social Return on Assets
As well as considering financial return on assets, the Value for Money Strategy also recognises the importance of social value generation. During 2013/14 the Trust has begun work to understand the social value of a range of activities, including the social value generated through its Sheltered Housing provision.
In partnership with NEF, the Trust undertook a Social Return on Investment project to consider the social value created through providing Sheltered Housing to older and vulnerable people. Through surveying 154 Sheltered Housing residents, the project team identified those factors most valued by these customers, and the differential impact of living in Sheltered Housing:
DIFFERENTIAL IMPACT OF LIVING IN A THT sHELTERED sCHEME
Living at THT
Before THT

22
Social Return on Assets3.7Staff are currently being developed to be able to undertake SROI assessments in-house, and are considering which activities should be subject to SROI review. SROI impact assessments scheduled for 2014/15 include:
• shrewsbury street: a predictive SROI assessment of the proposed £16m development project at Shrewsbury Street, Old Trafford, which includes an 80-unit Extra Care scheme; community centre, and high-quality health facilities. This will provide Board with information to make an informed decision as to whether the scale of social value delivered is sufficient to justify the significant financial investment required. The SROI assessment will be undertaken in partnership with BDO and NEF to provide external validation of the outcomes.
• Cleanstart: an assessment to evidence the social value created through the employment of prolific priority offenders.
• Youth Team: evidencing the social value of engaging with younger Trafford residents through sport, enterprise, and raising community awareness and involvement.
• Community Panels: development of a simple SROI model that can be used by Community Panels to better understand the social value deliverables from grants awarded to community groups. This will increase the value created through grant provision, and enable the Panels to measure predicted vs actual outcomes.
• Landlord: it is anticipated that the Trust will undertake an all-encompassing SROI project around the Landlord business. This will include consideration of a number of services, such as money support, managing anti-social behaviour, repairs and maintenance, property and environmental regeneration, and neighbourhood management.
23
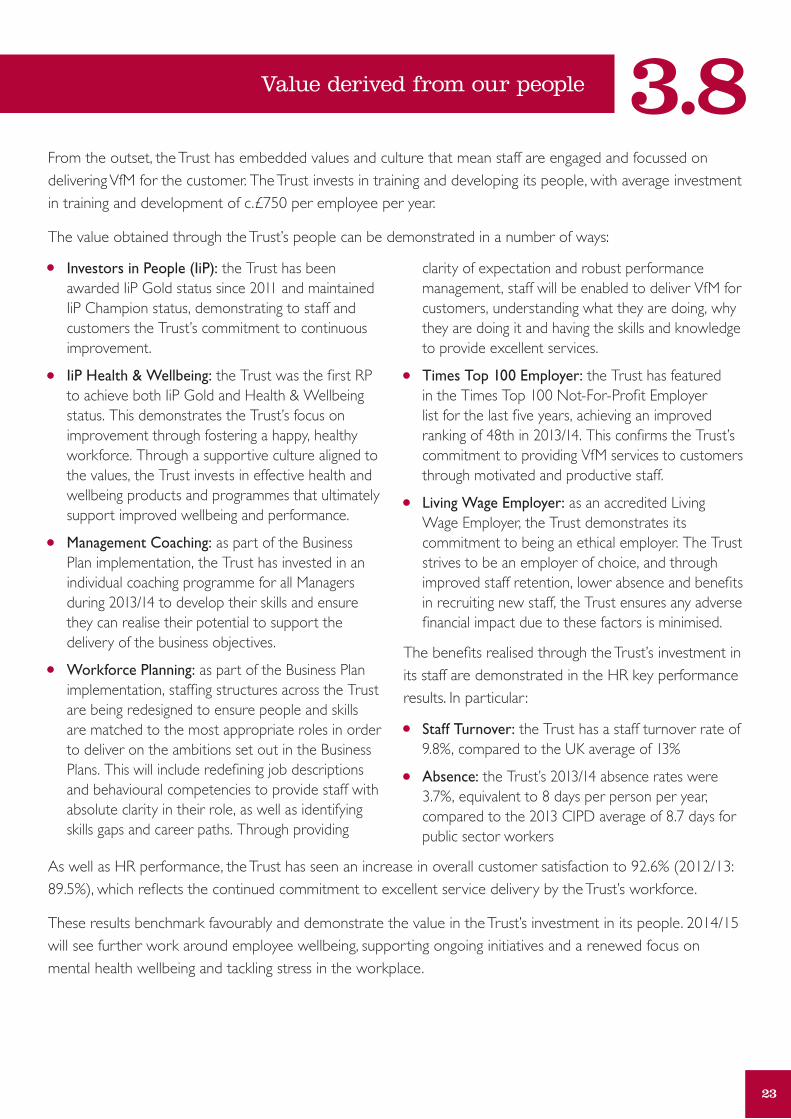
3.8Value derived from our people
From the outset, the Trust has embedded values and culture that mean staff are engaged and focussed on delivering VfM for the customer. The Trust invests in training and developing its people, with average investment in training and development of c.£750 per employee per year.
The value obtained through the Trust’s people can be demonstrated in a number of ways:
• Investors in People (IiP): the Trust has been awarded IiP Gold status since 2011 and maintained IiP Champion status, demonstrating to staff and customers the Trust’s commitment to continuous improvement.
• IiP Health & Wellbeing: the Trust was the first RP to achieve both IiP Gold and Health & Wellbeing status. This demonstrates the Trust’s focus on improvement through fostering a happy, healthy workforce. Through a supportive culture aligned to the values, the Trust invests in effective health and wellbeing products and programmes that ultimately support improved wellbeing and performance.
• Management Coaching: as part of the Business Plan implementation, the Trust has invested in an individual coaching programme for all Managers during 2013/14 to develop their skills and ensure they can realise their potential to support the delivery of the business objectives.
• Workforce Planning: as part of the Business Plan implementation, staffing structures across the Trust are being redesigned to ensure people and skills are matched to the most appropriate roles in order to deliver on the ambitions set out in the Business Plans. This will include redefining job descriptions and behavioural competencies to provide staff with absolute clarity in their role, as well as identifying skills gaps and career paths. Through providing
clarity of expectation and robust performance management, staff will be enabled to deliver VfM for customers, understanding what they are doing, why they are doing it and having the skills and knowledge to provide excellent services.
• Times Top 100 Employer: the Trust has featured in the Times Top 100 Not-For-Profit Employer list for the last five years, achieving an improved ranking of 48th in 2013/14. This confirms the Trust’s commitment to providing VfM services to customers through motivated and productive staff.
• Living Wage Employer: as an accredited Living Wage Employer, the Trust demonstrates its commitment to being an ethical employer. The Trust strives to be an employer of choice, and through improved staff retention, lower absence and benefits in recruiting new staff, the Trust ensures any adverse financial impact due to these factors is minimised.
The benefits realised through the Trust’s investment in its staff are demonstrated in the HR key performance results. In particular :
• staff Turnover: the Trust has a staff turnover rate of 9.8%, compared to the UK average of 13%
• Absence: the Trust’s 2013/14 absence rates were 3.7%, equivalent to 8 days per person per year, compared to the 2013 CIPD average of 8.7 days for public sector workers
As well as HR performance, the Trust has seen an increase in overall customer satisfaction to 92.6% (2012/13: 89.5%), which reflects the continued commitment to excellent service delivery by the Trust’s workforce.
These results benchmark favourably and demonstrate the value in the Trust’s investment in its people. 2014/15 will see further work around employee wellbeing, supporting ongoing initiatives and a renewed focus on mental health wellbeing and tackling stress in the workplace.

24
Financial Control & Performance Management4
The Trust has a history of strong financial performance and viability, and in 2013/14 the HCA confirmed that the Trust had retained the highest Regulatory rating for financial viability, V1.
Each year, the Trust’s capital and revenue Budgets are set using a zero-based, bottom-up approach. Budgetary Management is delegated to Operational Managers across the organisation, with close support, analysis and scrutiny provided by a team of Management Accountants. The Trust uses Collaborative Planning, a specialist budgetary management software package, to enable Budget Holders to have access to real-
time financial information and to undertake monthly reforecasting of the full-year outturn. As part of the Business Plan review process, each year the Board considers detailed information relating to the Trust’s proposed Budget and Long-Term Financial Plan, and approve the annual Budget together with clearly defined performance outcomes for each business area.
In 2013/14, as in most years, the Trust outperformed both its Operating Surplus and Net Surplus Budgets, as shown in the graph below:
Operating Budget
Net Budget
Operating Outturn
Net Outturn
PERFORMANCE AGAINsT ANNUAL bUDGETs
Financial Performance and Reporting 4.1

25
4.1Financial Performance and Reporting
This is a result of the robust Budget Management Framework in place, and efficiencies delivered in 2013/14 are set out at Section 5.
The Trust utilises the Open Finance system to ensure incomes and costs are accurately allocated to defined Budgets, and can be easily extracted and analysed. Performance is reported to Board on a quarterly basis, and includes financial performance against capital and revenue budgets, key financial performance ratios
and compliance with financial covenants. Inclusion of financial and non-financial metrics and commentary within the Performance Framework, together with an at-a-glance traffic light system, enables Board to focus on those issues which are of strategic importance to the Trust.
At 31 March 2014, performance against KPI Targets was as follows:
KPI Actual Target KPI Actual Target
% tenants profiled 100.0% 100.0% % tenants satisfied with repairs & maintenance
87.8% 90.0%
Operating margin 50.6% 46.4% % closed anti-social behaviour cases resolved
100.0% 96.0%
% rent loss to voids 0.8% 0.8% % Landlord promises achieved 90.0% 100.0%
% rent collected 99.95% 100.0% % Developer promises achieved
92.0% 100.0%
Average property relet days 16.7 24.0 % tenants satisfied with overall service
91.3% 90.0%
New homes started 68 36 % tenants satisfied with neighbourhood
89.1% 87.5%
New homes completed 135 103 % tenants feeling views listened to & acted upon
65.2% 81.0%
New homes net spend against approved budgets
£8.2m £11.4m % Board & Committee meeting attendance
89.9% 85.0%
Homes meeting Decent Homes Standard
100.0% 100.0% % complaints resolved before Independent Review
98.6% 98.0%
% properties with up-to-date gas service
100.0% 100.0% Forecast loan position £115m £130.2m
% calls resolved at first point of contact
78.7% 78.5% Projected loan covenant deficit
£6.3m £19.3m
% repairs appointments made and kept
94.6% 99.0% Actual amount to covenant breach
£13m £1.2m
% responsive repairs completed on time
99.5% 99.3%

26
Financial Performance and Reporting4.1As well as understanding the reasons for under-performance, Board and Management also investigate over-performance to ensure this is not an indicator of over-investment in a particular area.
Key performance highlights of 2013/14 were:
• Gas safety: through process re-engineering, and competitive retendering of the Gas Safety Contract, the Trust has achieved 100% properties having a gas safety certificate for two consecutive quarters. Whilst performance has been consistently above 99.5% for the past two years, this is the first time the Trust has successfully achieved its 100% target.
• Rent Collection: despite falling short of the 100% target by just £20k, Board and Management are generally pleased with the rent collection rate of 99.95%, given the impact of Welfare Reforms on social housing providers.
• New Homes: during the year the Trust secured additional grant funding from the HCA and successfully delivered an additional 32 homes when compared to original programme.
• Financial Outturn: through robust cashflow and budgetary management, and an ongoing focus on VfM, the Trust outperformed the 2013/14 budget and associated targets linked to Operating Margin and loan covenant compliance.
Areas identified for improvement activity include:
• Customer Involvement: a project will be undertaken during 2014/15 to gain better insight into how customers want to engage with the Trust, and to put in place a wider range of mechanisms to enable customers to share their views and get involved in the co-design of some services.
• Promises: whilst performance against Promises is strong and demonstrates significant in-year improvement, there is further work required to achieve 100% delivery. A key element of the Promise delivery is learning from reasons for Promise failure, and structures are in place to embed this learning and avoid repeat failure.
• Repairs Appointments: throughout the year this target was consistently outperformed, until the implementation of the new Housing Management system in January 2014. This led to a decline in performance whilst new processes bedded-in. Management are confident this is a ‘blip’ and will maintain a watching brief to ensure previous standards are delivered going forward.
27
4.2Pensions
During 2013/14, the Trust reviewed its Pensions Strategy, and Board took the decision to close the Defined Benefits (DB) Pension Schemes to new members as from January 2014. The aim of this decision was to limit future pension liabilities, including continually increasing employer contributions (currently GMPF: 18%, SHPS: 13.7%).
Prior to closing the scheme to new entrants, Board took the decision that the DB schemes should be promoted to existing staff. Prior to this exercise 237 staff were DB Scheme members; following the campaign, this increased to 330. Whilst this has created additional annual costs of c.£800k, it was felt that this was the most appropriate course of action to ensure all staff were given the opportunity to secure their future pension, and was in line with the Values of the Trust (i.e. to be open, honest and fair to staff).
A new Defined Contribution (DC) Scheme was introduced in January 2014, with employer contributions of 8.3%. In February 2014, in line with Government guidance, the Trust introduced pension auto-enrolment for all existing and new staff. The impact of the change in pension provision has been modelled through the Trust’s Long-Term Financial Plan and the Board are confident this provides best value and secures the long-term sustainability of the Trust’s pension arrangements.
TREAsURY MANAGEMENT
The Trust adopts a robust approach to Treasury Management, monitoring cashflows on a daily basis and planning cash requirements to inform loan management and maintain cash and borrowing at the lowest appropriate level. Variable borrowing rates have been renewed monthly to ensure the Trust has taken full advantage of the current low bank base rates..
The Trust has opted to submit monthly VAT returns to HMRC. Due to the level of investment works undertaken, returns typically result in a reimbursement of VAT expenditure to the Trust. By opting to submit monthly returns, the Trust ensures these monies are received as early as possible.
28
Achievement and Reinvestment of Efficiency Savings5
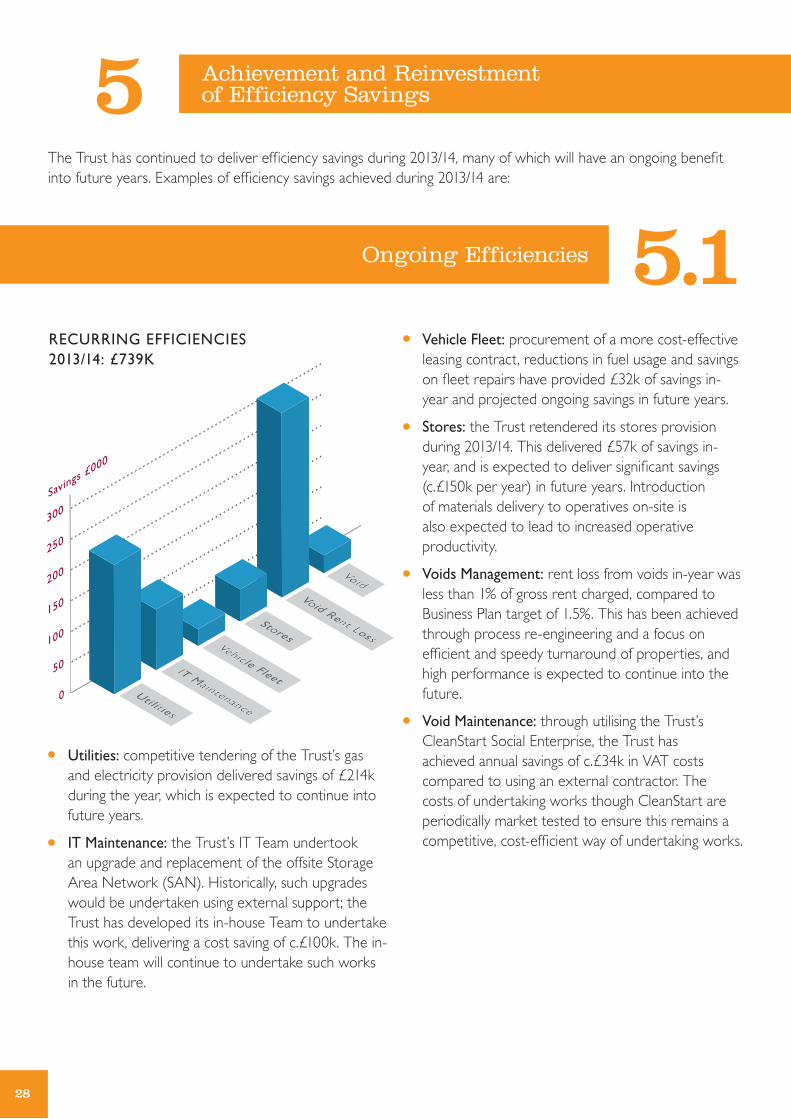
The Trust has continued to deliver efficiency savings during 2013/14, many of which will have an ongoing benefit into future years. Examples of efficiency savings achieved during 2013/14 are:
Ongoing Efficiencies 5.1
• Utilities: competitive tendering of the Trust’s gas and electricity provision delivered savings of £214k during the year, which is expected to continue into future years.
• IT Maintenance: the Trust’s IT Team undertook an upgrade and replacement of the offsite Storage Area Network (SAN). Historically, such upgrades would be undertaken using external support; the Trust has developed its in-house Team to undertake this work, delivering a cost saving of c.£100k. The in-house team will continue to undertake such works in the future.
• Vehicle Fleet: procurement of a more cost-effective leasing contract, reductions in fuel usage and savings on fleet repairs have provided £32k of savings in-year and projected ongoing savings in future years.
• stores: the Trust retendered its stores provision during 2013/14. This delivered £57k of savings in-year, and is expected to deliver significant savings (c.£150k per year) in future years. Introduction of materials delivery to operatives on-site is also expected to lead to increased operative productivity.
• Voids Management: rent loss from voids in-year was less than 1% of gross rent charged, compared to Business Plan target of 1.5%. This has been achieved through process re-engineering and a focus on efficient and speedy turnaround of properties, and high performance is expected to continue into the future.
• Void Maintenance: through utilising the Trust’s CleanStart Social Enterprise, the Trust has achieved annual savings of c.£34k in VAT costs compared to using an external contractor. The costs of undertaking works though CleanStart are periodically market tested to ensure this remains a competitive, cost-efficient way of undertaking works.
RECURRING EFFICIENCIEs 2013/14: £739K

29
5.2One-Off Efficiencies
• Welfare Reform: due to effective management of the impact of Welfare Reform, the Trust was able to release £163k of contingency budget during 2013/14. The bad debt provision was also £200k lower than anticipated. Whilst it is not envisaged that this will be required in future, Management continue to closely monitor performance in this area, particularly as Universal Credit begins to be introduced in Trafford.
• Rent from Development: proactive conversion of existing properties to an Affordable Rent, together with completing and letting new build properties ahead of schedule, generated an additional £219k of rental income during 2013/14.
• Asset Management: through ongoing review of the Trust’s proposed 2013/14 Improvement Programme, Management identified c.£1.5m of planned works which were not deemed necessary in-year. These were deferred, thereby saving interest on the funds required to undertake the works and enabling the capital to be utilised in the development of additional new homes.
• Development Programme: the Trust has consistently delivered its development programmes in line with time, cost and quality targets. During 2013/14, the Trust achieved £1.8m of savings; £1.1m due to timing of development activity and £0.7m of true cost savings. Securing of additional grant at project commencement has saved c.£39k in interest costs. The Trust has also exceeded property sales targets for 2013/14, achieving £149k in additional sales income on shared ownership homes.
ONE-OFF EFFICIENCEs 2013/14: £4.1M
30
Reinvestment of efficiency savings
Efficiency savings are predominantly utilised to support the Trust’s development objectives and aspirations. Savings delivered are reflected in the Trust’s Long Term Financial Plan, which is then used as a basis to define capacity for future development of new homes. Other examples of where efficiency savings have been utilised are:
• Housing Management system: the Trust has undertaken a major project in-year to replace its housing management, CRM, repairs booking and scheduling systems with one, integrated IT solution. This project has required up-front investment of c.£1.2m, including the back-filling of staff seconded to the project team and capital purchase of the new software package. The new system includes functionality to enable mobile working and more efficient service delivery, improving service provision to customers.
• Customer service Charge Reduction: where efficiency savings relate to services recharged to customers, such as the retendering of gas and electricity contracts, savings are passed on in full to customers through reductions in future years’ service charges.
• Money support Team: previous years’ efficiency savings have been used to fund additional investment in the Money Support Team in response to Welfare Reforms. The Trust has invested in additional resource to provide support to customers, such as financial planning, household budgeting and debt advice, as well as in additional staff to collect rents from customers. Rent collection for 2013/14 was 99.95%, which is evidence of the value achieved from the additional investment in this area.
5.3
31
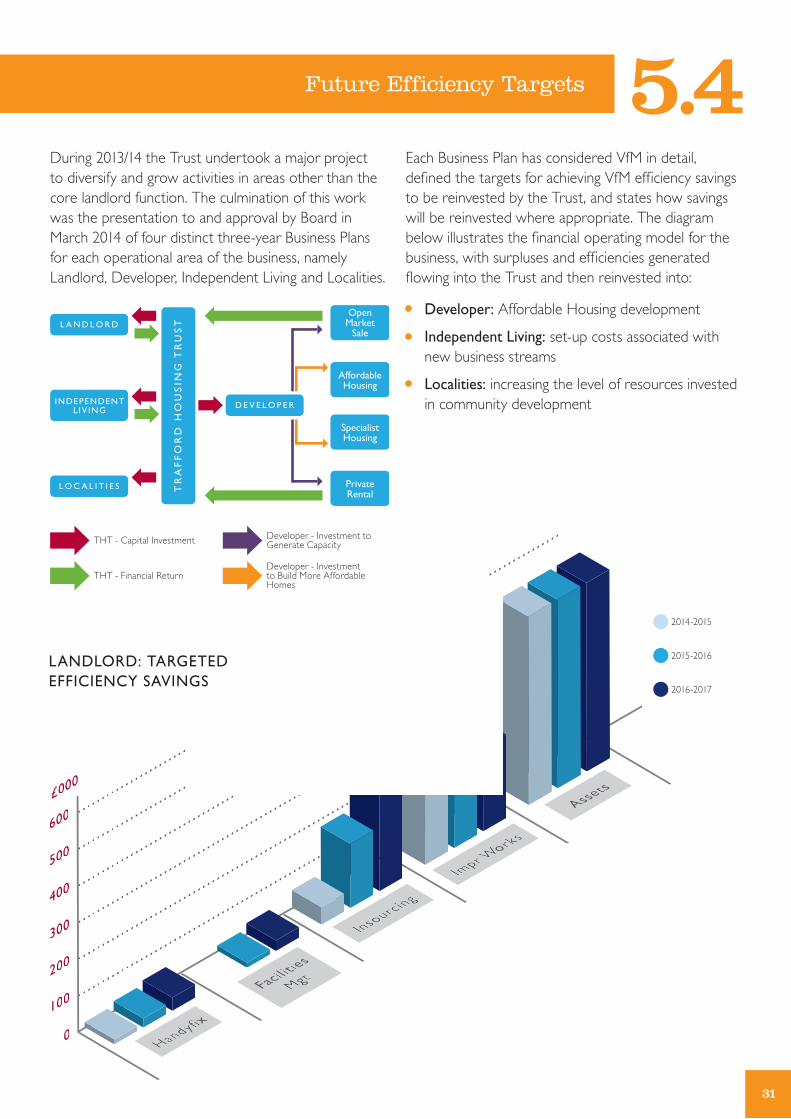
5.4Future Efficiency Targets
During 2013/14 the Trust undertook a major project to diversify and grow activities in areas other than the core landlord function. The culmination of this work was the presentation to and approval by Board in March 2014 of four distinct three-year Business Plans for each operational area of the business, namely Landlord, Developer, Independent Living and Localities.
Each Business Plan has considered VfM in detail, defined the targets for achieving VfM efficiency savings to be reinvested by the Trust, and states how savings will be reinvested where appropriate. The diagram below illustrates the financial operating model for the business, with surpluses and efficiencies generated flowing into the Trust and then reinvested into:
• Developer: Affordable Housing development
• Independent Living: set-up costs associated with new business streams
• Localities: increasing the level of resources invested in community development
LANDLORD: TARGETED EFFICIENCY sAVINGs
2014-2015
2015-2016
2016-2017
D E V E L O P E R
L A N D L O R D
TR
AF
FO
RD
HO
US
ING
TR
US
T
OpenMarket
Sale
AffordableHousing
SpecialistHousing
PrivateRental
L O C A L I T I E S
INDEPENDENTLIV ING
THT - Capital Investment
THT - Financial Return
Developer - Investment to Generate Capacity
Developer - Investment to Build More Affordable Homes

32
Future Efficiency Targets
• Increasing turnover from the Handyfix Service by £85k over 3 years
• Developing a Facilities Management offer to third parties, generating £11k revenue in 2015/16, increasing to £34k in 2016/17
• Achieve savings of £513k by April 2017 from insourcing elements of the property refurbishment programme, including gas servicing, M&E installations and communal works
• Deliver 2% (c.£240k) savings per year on the improvement works programme cost through improving procurement methods
• Generating £520k per year through planned asset rationalisation
• The Landlord business is intended to be self-sustaining, and generate a financial return to the Trust for reinvestment.
b) DEVELOPER
The Developer Business Plan is based on two overarching objectives:
• creating financial capacity
• investment in new homes development
The first objective sees the Trust moving into new areas of activity relating to development for Open Market Sale and Private Rental. The Developer Plan sets out an ambitious programme to deliver 221 homes for outright sale over three years, generating a net return of £9.7m. The average yield from this activity is 32%, which benchmarks favourably against private sector developers.
The second objective sees the reinvestment of monies generated through a non-charitable development subsidiary into the provision of affordable housing within Trafford. The Trust is currently setting up subsidiary companies relating to non-charitable development activity to ensure this is undertaken in the most tax efficient way possible. This will ensure the maximum financial benefit to the Trust to reinvest in delivering its charitable objectives.
5.4
DEVELOPER - ExIsTING PROGRAMME (NET INVEsTMENT £16.0M)
Affordable Housing Proceeds (S/O)
Open Market Sales Proceeds
Affordable Housing Grant Income
Affordable Housing Reinvestment
Open Market Sales Investment
A) LANDLORD
As the current largest operational business area, VfM within the Landlord Business Plan focusses primarily on improving the efficiency of existing services to deliver better quality outcomes for customers and financial benefits for the Trust. Specific targets within the Landlord Plan are:

33
5.4Future Efficiency Targets
Including the previously approved programme, the Plan sets out a programme to deliver 282 new Affordable Rented and Shared Ownership homes over three years, in addition to the 80 unit Extra Care Scheme planned in Old Trafford, as well as securing land for future development.
Through considering the most appropriate mix of development schemes across the various types, the Developer Business aims to deliver 583 new homes. Through the new operating model for the Developer business, the Trust is able to build a further 319 homes (in addition to the previously approved programme of 264 homes) for an additional net contribution of just £1.1m.
Affordable Housing Proceeds (S/O)
Open Market Sales Proceeds
Affordable Housing Grant Income
Affordable Housing Reinvestment
DEVELOPER - NEW PROGRAMME (NET INVEsTMENT £1.1M)
Open Market Sales Investment

34
C) INDEPENDENT LIVING
Increasing demand for better quality social care services, combined with the Trust’s market position, have led Board and Management to the decision to invest in provision of services to elderly and vulnerable customers. The Trust currently provides high-quality services to its customers through its Sheltered Housing and Trust Call services, and it was felt the Trust was in an excellent position to build upon these services and expand its offer into a market with ever-increasing demand.
The Independent Living Business Plan sets out the Trust’s ambitions to expand into the following areas:
• care business, providing domiciliary care in customers’ homes
• personalised support services, such as cleaning, shopping, ironing, etc
• a membership service, providing access to social activities and handyperson services
• a meals service, including communal meals clubs and individual service
The objective of the Independent Living business is to become financially self-sustaining within three years (with each business element self-sustaining within four years) and to create social value by improving wellbeing. The Business Plan sets out the initial investment required to set up and establish the new service areas which, as illustrated above, is funded through reinvestment of the surpluses generated from existing services. Detailed financial modelling has been undertaken to understand the costs, income drivers, charging mechanisms and customer numbers to achieve this objective.
Future Efficiency Targets5.4
INDEPENDENT LIVING - NET CONTRIbUTION bY bUsINEss sTREAM (ExIsTING sERVICEs)
Trust Call
Sheltered (Inc OT)

35
5.4Future Efficiency Targets
INDEPENDENT LIVING - NET CONTRIbUTION bY bUsINEss sTREAM (NEW sERVICEs)
Care
Personal Service
Membership
Meals

36
Future Efficiency Targets
D) LOCALITIEs
The Localities business exists to provide investment, capacity, expertise and networks into local communities, acting as a broker to bring together ‘communities of need’ and ‘communities of investment’. The five priority areas for Localities are identified as:
• creation of employment opportunity
• supporting the third sector
• targeted support for young people particularly at risk due to socio-economic challenges
• creation of sustainable community spaces
• develop Community Panels to be best practice community funding organisations
The Localities business represents a significant proportion of the Trust’s financial surpluses being reinvested into communities. In 2014/15 the Localities revenue expenditure budget is £1.0m, equivalent to 13% of the previous year’s net surplus.
The Localities Team also support the Trust’s four Community Panels. Each year, the Trust provides the Panels with a Budget which the Panels then distribute to their local community in the form of grants to local community groups. To date, the Trust has provided £6.3m funding to the Community Panels, and the 2014/15 Budget includes £771k of Community Panel funds. Work is ongoing to establish a Social Return on Investment toolkit for use by the Panels to better understand the value created through grant funding, and to support in investment decisions.
E) CORPORATE sERVICEs – OVERARCHING PRIORITIEs
As well as the targets defined within the operational Business Plans, other overarching VfM priorities for the forthcoming year include:
• monitoring and realisation of ongoing efficiency savings from the Open Housing implementation, which is expected to deliver savings of c.£100k in annual software maintenance and licensing costs
• review of the Trust’s Procurement Strategy, particularly in relation to direct procurement outside the established frameworks used for major works and development contract procurement, to embed a joined-up, efficient approach to procurement across the Trust
• ongoing delivery of the Value for Money Strategic Action Plan, including delivery of VfM training across the business, implementing mechanisms to capture VfM achievements, establishment and promotion of the staff suggestion scheme for VfM opportunities, ‘Ideas Unlimited’, and improving mechanisms for Board and customer involvement in VfM
• completion of a workforce planning review, to be undertaken in partnership with Hay Group, to redesign the Trust’s staffing structures to ensure these are aligned to the agreed Business Plans and enable the businesses to achieve their strategic objectives
• developing the Trust’s approach to understanding the Social Value it creates, including undertaking SROI and other assessments of a range of activities to understand the social value they deliver, and developing an SROI toolkit to be used by the Community Panels to assist in making decisions about how best to allocate funding to community initiatives
• developing the Trust’s approach to measuring and monitoring environmental impact, enabling each business area to understand its impact in term of financial, social and environmental value
5.4
37
6Customer Scrutiny
The Trust recognises that involving customers in service development and decision making is vital to the development of a true VfM and co-regulation culture. The Trust has in place a number of mechanisms to engage with customers, however it is recognised that this is an area where further work is required in order to engage with a wider, more diverse range of customers and to develop more meaningful relationships, moving from an approach based on consultation to one centred around coproduction and co-creation.
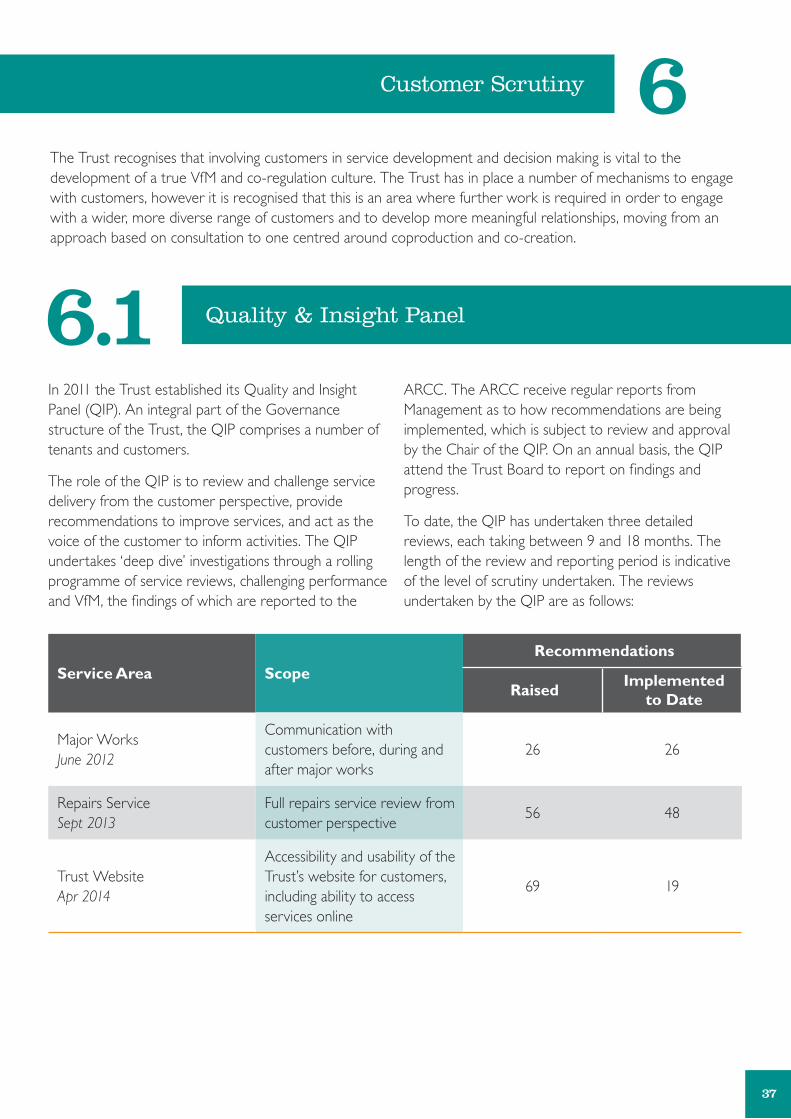
In 2011 the Trust established its Quality and Insight Panel (QIP). An integral part of the Governance structure of the Trust, the QIP comprises a number of tenants and customers.
The role of the QIP is to review and challenge service delivery from the customer perspective, provide recommendations to improve services, and act as the voice of the customer to inform activities. The QIP undertakes ‘deep dive’ investigations through a rolling programme of service reviews, challenging performance and VfM, the findings of which are reported to the
ARCC. The ARCC receive regular reports from Management as to how recommendations are being implemented, which is subject to review and approval by the Chair of the QIP. On an annual basis, the QIP attend the Trust Board to report on findings and progress.
To date, the QIP has undertaken three detailed reviews, each taking between 9 and 18 months. The length of the review and reporting period is indicative of the level of scrutiny undertaken. The reviews undertaken by the QIP are as follows:
Service Area ScopeRecommendations
RaisedImplemented
to Date
Major Works June 2012
Communication with customers before, during and after major works
26 26
Repairs Service Sept 2013
Full repairs service review from customer perspective
56 48
Trust Website Apr 2014
Accessibility and usability of the Trust’s website for customers, including ability to access services online
69 19
Quality & Insight Panel6.1
38
Quality & Insight Panel
The recommendations raised by the QIP have enabled Management to deliver real service improvement to customers, and work will continue to ensure all recommendations are implemented. Future QIP
reviews are planned in relation to the lettings process, management of anti-social behaviour, sheltered housing provision and voids management.
Case Study: improving accessibility of the website for customers with visual impairment or for whom English is not their first language
The most recent QIP review related to the accessibility of the Trust’s website. During this review, it was identified that documents on the website were uploaded in a variety of formats which presented difficulties for some customers.
With the exception of job application forms, the majority of documents available on the website are now provided in PDF format. The Trust has also purchased the BrowseAloud Plus tool, which is available through the website. PDF documents are compatible with this tool, which enables customers to opt to have the website content read aloud. The tool also enables customers to translate and read content in several languages other than English.
Trust Neighbourhood Partners carry out regular inspections of all communal areas and estates for which the Trust is responsible, to identify issues such as graffiti, litter, illegal parking, abandoned properties, etc. Inspections are scheduled over twelve months and advertised to customers and residents through the Trust website, social media (Facebook/Twitter), local offices and the Trust’s customer magazine, Pulse.
Neighbourhood staff have a small ‘patch purse’ of £1k which can be used to address minor issues quickly and effectively. This initiative was introduced following feedback that issue resolution was not always timely. For a relatively small amount of money, the introduction of the patch purse has enabled staff to respond quickly and effectively to customer issues, improving the actual and perceived quality of service provision.
Case Study: improving neighbourhoods and relationships
Inspections have helped both in the improvement of neighbourhoods and in developing relationships between Neighbourhood Partners (NPs) and local residents. There are a number of examples where NPs have worked with residents to improve their gardens and bring them back to an acceptable standard. There are also examples of collaborative working with other agencies; combatting fly-tipping with Trafford Council and reducing youth crime and nuisance with GM Police – all as a result of issues being flagged by residents accompanying the NPs during inspections.
6.1
Estate Inspections 6.2

39
6.2Estate Inspections
Customers are invited to accompany staff on estate inspections, and to provide views and/or report issues, as well as suggest sites for future inspection. Customers are actively encouraged to provide feedback on caretaking and grounds maintenance services in areas where these are provided, in order to ensure the service standards set out through the promises are being met. Where appropriate, a member of the Youth Team will also attend estate inspections to listen to the views and concerns of young people and their ideas for improvement.
Customers who attend estate inspections receive direct written feedback. General feedback on
inspections is also published via the Trust’s website and Pulse magazine, including “You Said, We Did”, and displayed in communal areas where appropriate.
In a number of areas, the Trust works with Block Champions and Estate Champions. These Champions are tenants of the Trust who conduct regular, more frequent inspections, and report any issues identified to the Trust. This has been a successful initiative, enabling tenants to take ownership of issues in their area, highlighting these in a timely manner and enabling the Trust to deal with these promptly and prevent escalation into more costly issues.
Case Study: improving safety for customers
Recently, a Block Champion reported a light over garages that had been out of service for a number of months. He grew concerned that, as winter approached, there was a risk to residents going to the garages in the dark. He raised the issue with the Trust, and as a result the site was attended by the Repairs Team and the light repaired within a week of initial report. If not for the Block Champion, it is unlikely this issue would have been identified by the Trust, as Neighbourhood Inspections are generally conducted during working (daylight) hours.

40
Service Development
The Trust is developing a range of groups and forums to enable customers to get involved in shaping service delivery and improving VfM:
A) CUsTOMER ACTION GROUPs (CAGs)
Customer Action Groups meet periodically to discuss specific issues as and when they arise. For example, a CAG was formed recently to participate in the Trust’s review of its Allocations Policy. The Group contributed views as to who properties are allocated to and why;
raised issues around Welfare Reform and emphasised the need to encourage downsizing; and suggested the introduction of an incentive scheme to encourage downsizing where appropriate, in order to reduce void turnaround time and increase rental income.
Case Study: voids mystery shopper exercise
An exercise was undertaken in relation to the voids function, whereby a group of mystery shoppers were engaged to provide a view of the voids service from the customer perspective, and identify opportunities to improve the customer experience.
A number of opportunities were identified to improve the efficiency and effectiveness of the process. Changes which have been implemented as a result of this include:
• Recycling of furniture left in void properties through the Trust’s Social Enterprise
• Recycling of locks on void properties at another Trust property, thereby reducing overall costs
• Improve the decorating standard (without increasing the cost) in certain types of properties to make them more appealing
• Improvements to the Trust’s Void Standards booklet to include more pictorial information and be more customer-friendly
6.3
41
6.3Service Development
b) COPRODUCTION FOCUs GROUPs
Coproduction groups are formed to help shape services, and comprise of customers who have recently experienced the service under review. Groups of local residents are also formed to help shape new
development projects in their local area, including contributing to the design of buildings and provision of local services.
Case Study: improving the efficiency of the Fixed Term Tenancy process
A recent Focus Group was formed as part of the Fixed Term Tenancy process review. Customers disagreed with the Trust’s view on the frequency of visits required during the first twelve months of a tenancy, and suggested this should be reduced. It is anticipated that reducing the number of visits by one per new tenancy, the Trust would create an additional 1,000 hours of Neighbourhood staff capacity.
C) WE COME TO YOU INITIATIVEs
The Customer Involvement Team is actively developing new ways to involve customers and hear their opinions. The Trust aims to gain quality insight to identify business growth opportunities and improve customer
satisfaction and VfM. A series of small-scale events have been organised to meet customers in their neighbourhood at times that suit them.
Case Study: a new way to engage with customers
The Customer Involvement Team has held two ‘we come to you’ initiatives in recent months – ‘Clue for a Brew’ in Urmston and ‘Chips 4 a Chat’ in Sale Moor. Both initiatives were informal and held out in the neighbourhoods, with customers offered vouchers for local food and drink establishments in return for sharing their views of the Trust. Further initiatives are planned in Stretford (‘Talk on the Walk’) and Old Trafford (‘Truth in a Booth’). The initiatives were well attended and provided useful insight and information, including:
• Residents in Sale Moor were particularly interested in getting involved in developing children and young people’s services. Details have been passed to the Localities Team, who will work with these residents to develop local services.
• Customers provided insight in relation to the Channel Shift project to move more services to digital provision. In particular, the survey highlighted customers’ concerns around data security (eg if paying rent electronically) and the cost of accessing digital provision (particularly broadband and laptop costs). This insight will be used to help shape the project delivery plan.
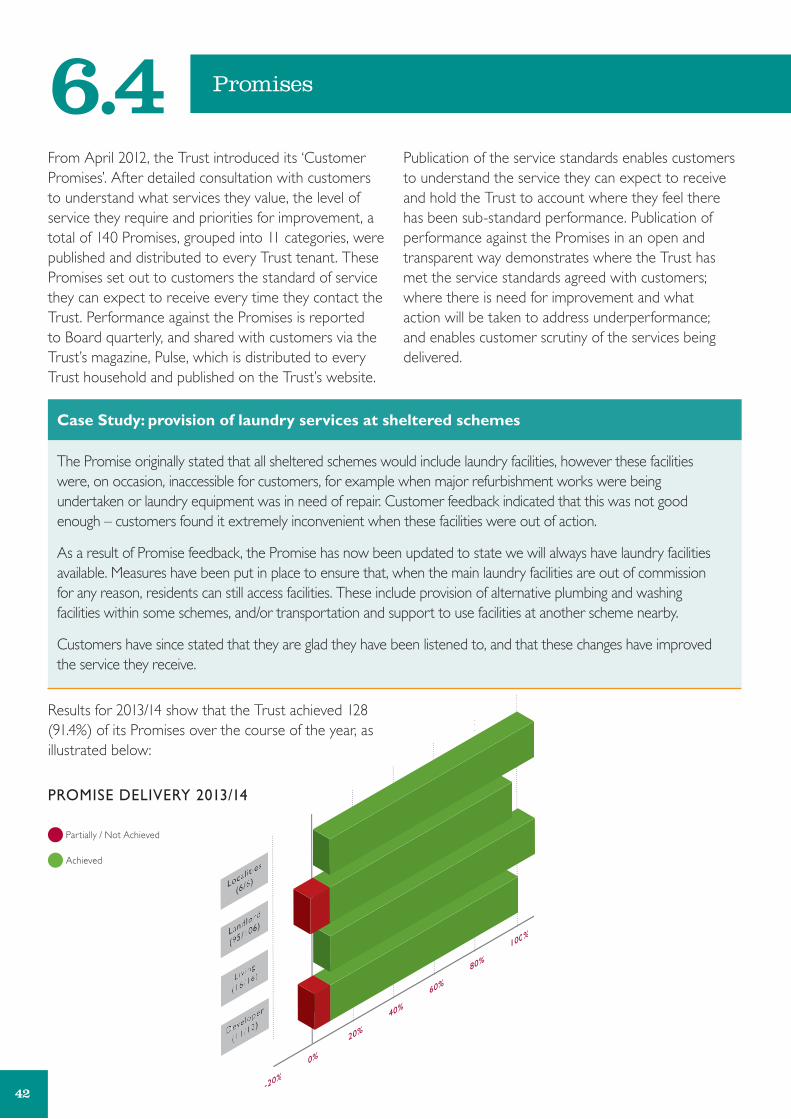
42
Promises
From April 2012, the Trust introduced its ‘Customer Promises’. After detailed consultation with customers to understand what services they value, the level of service they require and priorities for improvement, a total of 140 Promises, grouped into 11 categories, were published and distributed to every Trust tenant. These Promises set out to customers the standard of service they can expect to receive every time they contact the Trust. Performance against the Promises is reported to Board quarterly, and shared with customers via the Trust’s magazine, Pulse, which is distributed to every Trust household and published on the Trust’s website.
Publication of the service standards enables customers to understand the service they can expect to receive and hold the Trust to account where they feel there has been sub-standard performance. Publication of performance against the Promises in an open and transparent way demonstrates where the Trust has met the service standards agreed with customers; where there is need for improvement and what action will be taken to address underperformance; and enables customer scrutiny of the services being delivered.
Case Study: provision of laundry services at sheltered schemes
The Promise originally stated that all sheltered schemes would include laundry facilities, however these facilities were, on occasion, inaccessible for customers, for example when major refurbishment works were being undertaken or laundry equipment was in need of repair. Customer feedback indicated that this was not good enough – customers found it extremely inconvenient when these facilities were out of action.
As a result of Promise feedback, the Promise has now been updated to state we will always have laundry facilities available. Measures have been put in place to ensure that, when the main laundry facilities are out of commission for any reason, residents can still access facilities. These include provision of alternative plumbing and washing facilities within some schemes, and/or transportation and support to use facilities at another scheme nearby.
Customers have since stated that they are glad they have been listened to, and that these changes have improved the service they receive.
Results for 2013/14 show that the Trust achieved 128 (91.4%) of its Promises over the course of the year, as illustrated below:
6.4
PROMIsE DELIVERY 2013/14
Partially / Not Achieved
Achieved

43
6.5Reporting to Customers
The Trust shares performance information with customers via the Customer KPI website. This site was developed in partnership with the Review Crew, a customer group set up to review communications with customers to ensure they are understandable, jargon-free and fit for purpose. The Review Crew worked with Management to define the key service areas customers want to know about; define the appropriate measures to be reported to customers; design and test the website from the user perspective, and support in the final development and launch of the site.
The website is designed to be user-friendly, easy to understand and minimise the number of steps required to access information. Customers are also able to
provide comments and suggestions for improvement via this website. The website can be found at: www.traffordhousingtrust.co.uk/kpi-animation
Each year the Trust produces its Annual Tenant Report. This document includes information relating to performance in relation to service delivery against the Promises, and information on the Trust’s finances and VfM. This report is presented in an accessible, customer-friendly format (such as an infographic or video) and issued to every tenant of the Trust. In addition, the full version documents are made available both via the Trust’s website and in all Trust offices.

44
Benchmarking Services7Understanding Costs and oUtComes
The Trust is a member of HouseMark Benchmarking Club, and utilises HouseMark to benchmark its services against those of similar housing providers (Northern LSVTs with 5,000-13,000 units). The Trust does not seek to be the lowest cost/highest quality provider in all areas; rather it utilises HouseMark to understand how its services compare to those of others, learn from best practice across the sector, and adopt the
most appropriate strategy for each service based on knowledge of customer requirements and the quality of service Board feel is appropriate. The Trust seeks to achieve continuous improvement in the level of customer satisfaction and cost effectiveness of services year-on-year.
The Trust measures and benchmarks costs and/or satisfaction in the following areas:
A) REPAIRs AND VOIDs
Trust customers have consistently identified repairs as a service that is highly valued. The Trust uses HouseMark benchmarking to compare its level of investment in repairs service provision and satisfaction achieved:
*Comparative prior year costs have been inflated to 2013/14 levels based on 2.5% inflation p.a.
Each year, Board considers the proposed repairs delivery Promise to customers and the resources required to deliver, and forms a view as to whether the budget allocation and delivery targets are appropriate.
The graphs above demonstrate that, over the previous five years, the Trust has reduced its average spend per property and in 2011/12 and 2012/13 fell within the HouseMark Upper Quartile for spend.
DIRECT REPAIRs COsT* PER UNIT
sATIsFACTION WITH REPAIRs
Upper Median Quartile
Lower Quartile
Lower Median Quartile
Upper Median Quartile
Lower Quartile
Lower Median Quartile
Upper Quartile
Benchmarks not yet published
Upper Quartile
Benchmarks not yet published

45
7Benchmarking Services
The Trust has also seen a continued trend of increasing customer satisfaction year-on-year. When measured as a cost per satisfied customer, it can be seen that the Trust has reduced the level of investment per satisfied customer.
*Comparative prior year costs have been inflated to 2013/14 levels based on 2.5% inflation p.a.
The Trust has also successfully reduced Void Turnaround Days over the previous five years, through targeted process reengineering and a focus on efficiency. On average, the Trust currently takes 16.7 days to relet a property, which equates to Upper Quartile performance (based on 2012/13 benchmarks).
DIRECT REPAIRs COsT* PER sATIsFIED CUsTOMER
VOID TURNAROUND (DAYs)
Upper Median Quartile
Lower Quartile
Lower Median Quartile
Upper Quartile
Benchmarks not yet published

7
46
Benchmarking Services
Upper Median Quartile
Lower Median Quartile
Upper Quartile
Lower Quartile
COMPARATIVE REPAIRs COsT PER UNIT 2012/13
Upper Median Quartile
Lower Quartile
Lower Median Quartile
Upper Quartile
Benchmarks not yet published
DIRECT RENT COLLECTION COsT* PER UNIT
b) RENTs & WELFARE REFORM
Strong rent collection is vital to the Trust’s financial viability. Following Government announcements regarding Welfare Reform, the introduction of Universal Credit, and the general economic downturn, the Trust undertook detailed analysis of the potential impact to the Trust’s revenue streams, and Board took a decision to become a ‘high cost, high performing service’; investing additional resources in financial support for customers to protect income streams and maintain high levels of collection. The Trust has used HouseMark to understand ongoing performance and comparison to other providers’ response to these issues.
As well as assessing VfM in terms of customer satisfaction achieved, the Trust also utilises HouseMark data to compare its costs with those of similar RPs (ie North West LSVTs with 5,000 – 13,000 homes). Using the latest available benchmarking data (2012/13), the graph below illustrates that the Trust performs well in relation to its peers:

7
47
Benchmarking Services
Upper Median Quartile
Lower Median Quartile
Upper Quartile
Lower Quartile
COMPARATIVE RENT COLLECTION As A % RENT DEbIT 2012/13
*Comparative prior year costs have been inflated to 2013/14 levels based on 2.5% inflation p.a.
The graphs shown demonstrate that the Trust’s strategy has been successful; although costs remain high and are currently Lower Quartile when compared to similar organisation, performance in terms of collection is the second highest within the peer group. When cost and performance are combined (see below), the Trust’s results compare favourably.
It remains the view of Board and Management that investment in customer support, as well as some increase in collections staff, is the appropriate strategy for the Trust. The Trust will therefore continue to adopt this strategy, and closely monitor collection performance during 2014/15 when the first phases of Universal Credit are to be introduced in Trafford.
Upper Median Quartile
Upper Median Quartile
Lower Median Quartile
Lower Median Quartile
Upper Quartile
Upper Quartile
Lower Quartile
Lower Quartile
COMPARATIVE COMbINED RENT COLLECTION COsT AND PERFORMANCE (bENCHMARK QUARTILEs) 2012/13
Cost
Collection
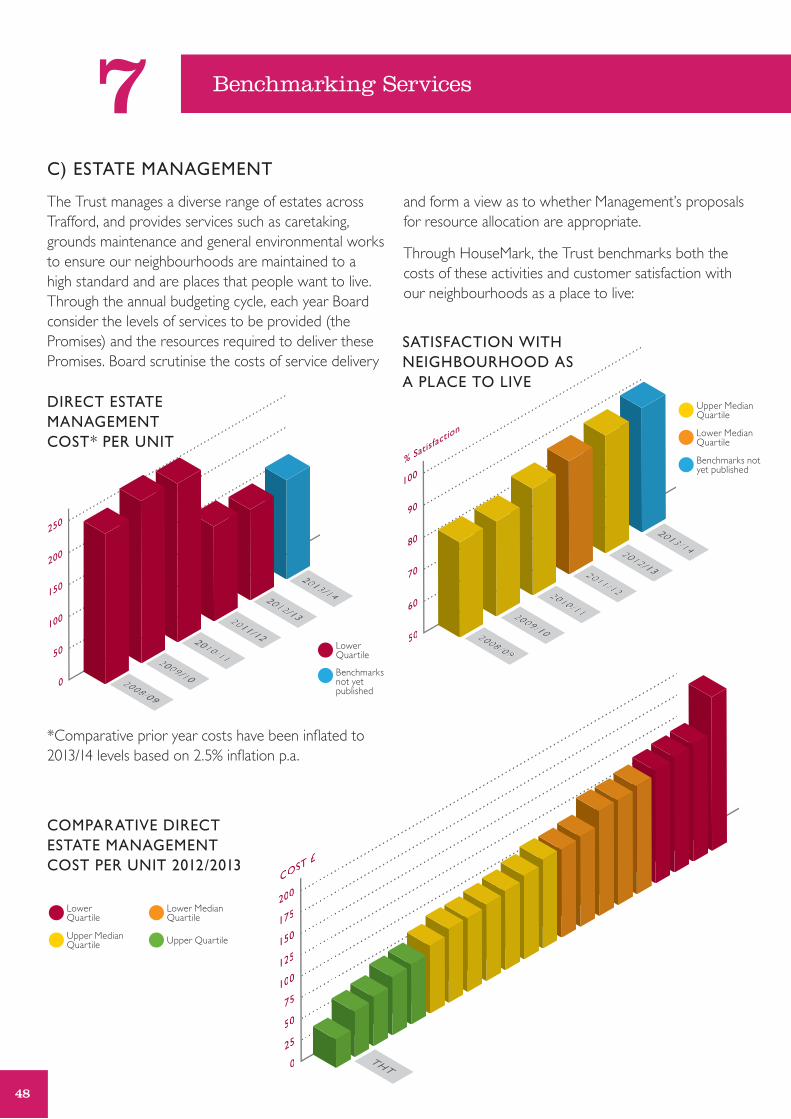
7
48
Benchmarking Services
C) EsTATE MANAGEMENT
The Trust manages a diverse range of estates across Trafford, and provides services such as caretaking, grounds maintenance and general environmental works to ensure our neighbourhoods are maintained to a high standard and are places that people want to live. Through the annual budgeting cycle, each year Board consider the levels of services to be provided (the Promises) and the resources required to deliver these Promises. Board scrutinise the costs of service delivery
and form a view as to whether Management’s proposals for resource allocation are appropriate.
Through HouseMark, the Trust benchmarks both the costs of these activities and customer satisfaction with our neighbourhoods as a place to live:
*Comparative prior year costs have been inflated to 2013/14 levels based on 2.5% inflation p.a.
COMPARATIVE DIRECT EsTATE MANAGEMENT COsT PER UNIT 2012/2013
DIRECT EsTATE MANAGEMENT COsT* PER UNIT
sATIsFACTION WITH NEIGHbOURHOOD As A PLACE TO LIVE
Lower Quartile
Benchmarks not yet published
Upper Median Quartile
Lower Quartile
Lower Median Quartile
Upper Quartile
Upper Median Quartile
Lower Median Quartile
Benchmarks not yet published

7
49
Benchmarking Services
DIRECT EsTATEs MANAGEMENT COsT* PER sATIsFIED CUsTOMER
The Trust has seen some reductions in the level of spend on estates management, whilst maintaining consistent improvements in customer satisfaction levels. Whilst this is pleasing, Management are also aware that costs are relatively high when compared to other organisations. Work is ongoing through the Landlord business to understand these differences and consider how further efficiencies can be achieved, including revisiting staffing structures and looking at the most efficient delivery model, e.g. insource/outsource.
When considering cost per satisfied customer, again this has significantly reduced over the last five years, and will reduce further as efficiencies are identified.
D) REsIDENT INVOLVEMENT
The graphs below show that, whilst costs in this area have reduced significantly and benchmark favourably, satisfaction with customers feeling their views are taken into account remains below target. Board have given a clear direction that customer involvement is of significant importance to the Trust, and is seen as a key priority for improvement during 2014/15.
Lower Quartile
Upper Quartile
Benchmarks not yet published
DIRECT REsIDENT INVOLVEMENT COsT* PER UNIT
Upper Median Quartile
Lower Quartile
Lower Median Quartile
Benchmarks not yet published
sATIsFACTION THAT VIEWs ARE TAKEN INTO ACCOUNT

7
50
Benchmarking Services
COMPARATIVE DIRECT REsIDENT INVOLVEMENT COsT PER UNIT 2012/13
Upper Median Quartile
Lower Median Quartile
Upper Quartile
Lower Quartile
The results shown do not indicate that there is a direct correlation between reducing costs and reducing satisfaction; indeed the two years where costs were highest (2008/09 and 2009/10) were also the same years with the lowest satisfaction results. This suggests the solution to increasing satisfaction is not just additional investment. Further analysis of survey results shows that, although satisfaction in this area is below target, dissatisfaction is also reasonably low. The key issue in this area appears to be customer apathy, with many customers responding as ‘neither satisfied nor dissatisfied’, as illustrated left:
Work is ongoing to identify the root cause of this – are customers disengaged, or do they want to engage but are unable to do so? Projects have been approved to focus on gaining better insight into our customers, understanding how customers want to engage with the Trust, and providing alternative channels of engagement.
DIRECT REsIDENT INVOLVEMENT COsT* PER sATIsFIED CUsTOMER

7
51
Benchmarking Services
PROFILE OF REsPONsEs: sATIsFACTION THAT VIEWs ARE TAKEN INTO ACCOUNT
Dissatisfied
Neither
Very Dissatisfied
Satisfied
Very Satisfied
E) RENTs & sERVICE CHARGEs
The Trust sets its rents in accordance with the Government Rent Regime, and as such does not benchmark its rent levels with other providers. The Trust also charges service charges for some discretionary service provision, such as caretaking, grounds maintenance and communal utilities. The Trust operates a variable service charge regime, and as such seeks only to recover the direct costs of service provision, plus a contribution towards management and overheads costs, in line with best practice. Service costs are benchmarked separately.
Since the introduction of the Affordable Housing Programme (AHP) in 2011, the Trust has also started to relet properties at an Affordable Rent, as required by the AHP Contract with the HCA. Affordable Rents are set at a maximum of 80% of Market Rent, and the Trust has opted to cap all conversions of existing properties to Affordable Rents at the Local Housing Allowance level. This was a decision taken by Board after careful consideration of the optimum balance between revenue generation and customer affordability.
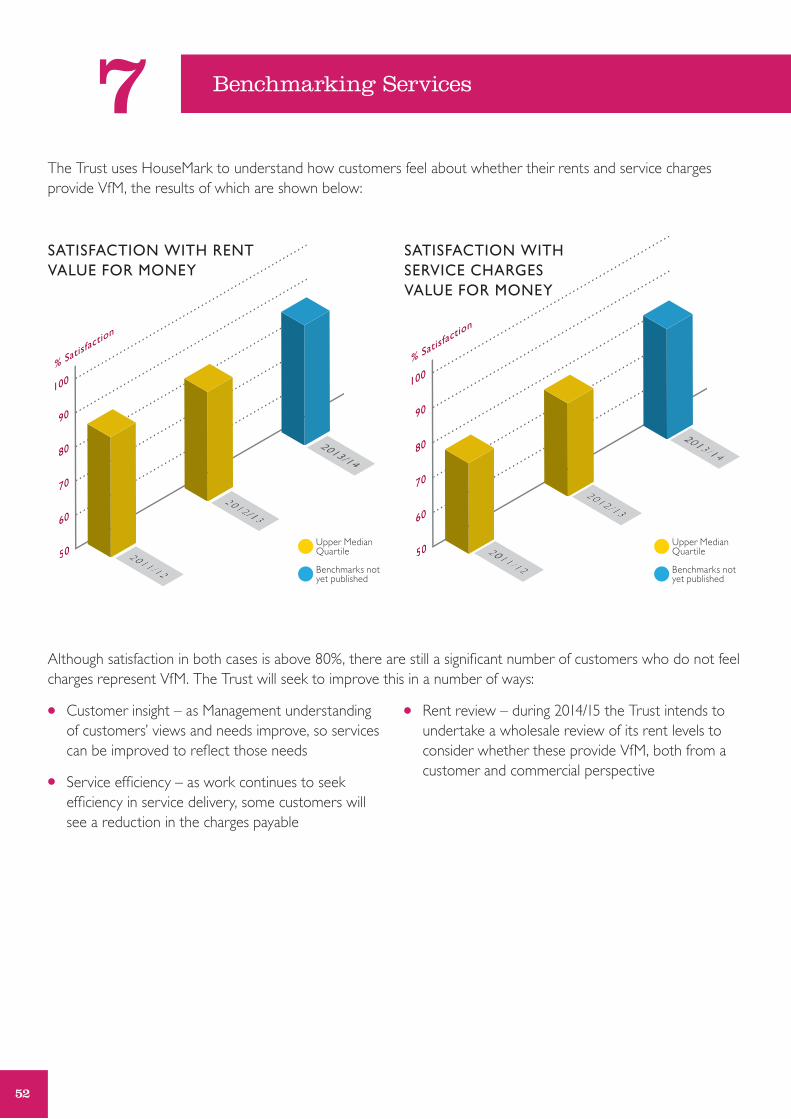
7
52
Benchmarking Services
sATIsFACTION WITH RENT VALUE FOR MONEY
sATIsFACTION WITH sERVICE CHARGEs VALUE FOR MONEY
Although satisfaction in both cases is above 80%, there are still a significant number of customers who do not feel charges represent VfM. The Trust will seek to improve this in a number of ways:
• Customer insight – as Management understanding of customers’ views and needs improve, so services can be improved to reflect those needs
• Service efficiency – as work continues to seek efficiency in service delivery, some customers will see a reduction in the charges payable
• Rent review – during 2014/15 the Trust intends to undertake a wholesale review of its rent levels to consider whether these provide VfM, both from a customer and commercial perspective
Upper Median Quartile
Benchmarks not yet published
Upper Median Quartile
Benchmarks not yet published
The Trust uses HouseMark to understand how customers feel about whether their rents and service charges provide VfM, the results of which are shown below:

7
53
Benchmarking Services
OVERHEAD COsT* PER UNIT
OVERHEAD COsT* PER EMPLOYEE 2012/13
Upper Median Quartile
Lower Median Quartile
Lower Quartile
Upper Median Quartile
Lower Median Quartile
Upper Quartile
Lower Quartile
COMPARATIVE OVERHEAD COsT As A % TOTAL REVENUE sPEND 2012/13
F) OVERHEADs
As well as understanding the costs of direct service provision, the Trust also utilises HouseMark benchmarking to compare its overheads costs:
Lower Quartile
Benchmarks not yet published

7
54
Benchmarking Services
When compared to other organisations, the Trust’s overhead costs appear high. In particular, IT costs per employee fall within the Lower Quartile, due to high costs associated with maintaining and supporting a number of legacy systems. Whilst IT costs are expected to remain high in the short-term, as systems are implemented to support the diversification of the business, further work will be undertaken to ensure these costs are appropriate. In particular, the Trust has commissioned a review of its IT Infrastructure to ensure this is both robust and appropriate in terms of VfM.
HouseMark provides qualitative information for customer-facing services, including comparison of satisfaction and performance outcomes. However there is no qualitative information available relating to the provision of back-office services. During 2013/14, the Corporate Services Directorate undertook an internal satisfaction survey in order to understand the quality of service provision from the customer perspective. The survey considered three elements of performance:
• The quality of service provision
• The quality of customer experience
• Opportunities for improvement
Overall, customer responses were positive and identified a number of opportunities to further improve services. The feedback from the survey will be key in informing the Corporate Services Business Plan, which is due to be presented to the Board in September 2014, and will include targets around cost efficiency and service quality. The survey included a Net Promoter Score (NPS) for each area of Corporate Services, the results of which were as follows:
IT Department NPS Results
Finance Department NPS Results
Business Intelligence Department NPS Results
Service Desk 88.9%
Management Accounts
80.0%
Performance Improvement
66.7%
Applications 75.0%
Income & Payments 50.0%
Project Management0.0%
Infrastructure30.0%
Capital & Treasury-16.7% Analysis, Insight &
Compliance62.5%
The Corporate Services Business Plan will include a fundamental review of all service provision to ensure it is meeting business needs, and will particularly focus on those areas highlighted as having a low NPS. This will include increasing awareness across the business of what these functions provide, as IT Infrastructure and Capital & Treasury in particular tend to be inward-looking and have little interaction with the wider business.
G) CONCLUsION
Overall, it is the view of Management that the Trust benchmarks well against other similar RPs, and provides an appropriate balance between cost and quality of service provision. Continuous improvement and targeted activity to increase service efficiency remain an integral part of the Trust’s culture.

55
8Overall Self-Assessment
In completing this self-assessment, achievements to date and current and future plans and objectives have been clearly documented, and demonstrate that the Trust’s approach to VfM is well-defined and will enable achievement of continuous improvement in this area. There is a strong culture of VfM across the Trust, which is embedded within the ambitious plans for growth and diversification into four distinct operating business streams, namely:
• Landlord: a continuation of the current Social Landlord activities, with challenging targets around service improvement, cost reduction and income generation
• Developer: expansion into non-charitable development activities to generate additional funds into the Trust, as well as the development of Affordable Housing
• Independent Living: increasing our activities within the care and support markets to include domiciliary care, increased ExtraCare provision, and additional support services such as meals, shopping, etc.
• Localities: delivery of community-based initiatives and acting as a broker between potential investors and community organisations
This, together with challenging efficiency targets, will generate additional financial capacity and increase the provision of affordable housing within Trafford.
This diversification brings new areas of risk, particularly relating to Care & Support and Development, which will require close review and management over the coming year. There are robust risk frameworks in place to ensure both strategic and operational risks within each business area are managed appropriately. Welfare Reform, the economic recovery and impending (limited) implementation of Universal Credit within Trafford remain key risks for the Trust.
Board and Management are of the view that the Trust:
• Has a robust approach to decision-making that considers VfM in the allocation and use of resources, with clear links to the delivery of Trust objectives (sections 1, 2 and 5)
• Has a broad understanding of the return on its assets, with further work planned in this area to improve understanding and inform decisions at a more granular level (section 3)
• Has a robust performance and scrutiny framework that drives VfM and continuous improvement (sections 4 and 6)
• Has a clear understanding of the costs and outcomes of services delivered, and makes decisions regarding the most appropriate balance of cost and quality (section 7)
Consequently, it is the view of the Board and Management that the Trust complies with the current HCA VfM Standard – see Appendix 1.

56
Overall Self-Assessment8It is recognised that, whilst the Trust has a strong VfM framework in place, there are opportunities for further improvement. Key projects and initiatives for 2014/15 include:
• Implementation of the Business Plans for the four operational businesses, development of the balanced scorecard performance measurement framework and delivery of the Year 1 financial targets, including efficiency savings of £827k relating to Year 1 of the Landlord Business Plan (Section 5)
• Developing mechanisms to measure social and environmental impact to better understand the Trust’s triple bottom line performance
• Implementation of mechanisms to capture and measure VfM achievements to enable more joined-up recognition of capacity creation and reinvestment
• Business-wide review of procurement policies and practices to ensure align with the Trust’s financial, social and environmental aspirations, and to ensure maximum value is derived from the supply chain
• Workforce planning review to ensure staff structures are appropriate and enable efficient service delivery, and that accountability and responsibility is clearly defined throughout the organisation
• Development of mechanisms to strengthen customer involvement in driving VfM to truly embed co-regulation in this area
The Trust has engaged HQN as a critical friend and involved customers in reviewing the supporting information to ensure this self-assessment is fit for purpose and demonstrates appropriately action being undertaken by the Trust to deliver VfM.

57
1Appendix
VALUE FOR MONEY sTANDARD
1. Required outcomes
1.1 Registered Providers shall articulate and deliver a comprehensive and strategic approach to achieving VfM in meeting their organisation’s objectives. Their Boards must maintain a robust assessment of the performance of all their assets and resources (including for example financial, social and environmental returns). This will take into account the interests of and commitments to stakeholders, and be available to them in a way that is transparent and accessible. This means managing their resources economically, efficiently and effectively to provide quality services and homes, and planning for and delivering on-going improvements in VfM.
2. specific expectations
2.1 Registered Providers shall:
• Have a robust approach to making decisions on the use of resources to deliver the Provider’s objectives, including an understanding of the trade-offs and opportunity costs of its decisions
• Understand the return on its assets, have a strategy for optimising the future returns on assets – including rigorous appraisal of all potential options for improving VfM including the potential benefits of alternative delivery models – measured against the organisation’s purpose and objectives
• Have performance management and scrutiny functions which are effective at driving and delivering improved VfM performance
• Understanding the costs and outcomes of delivering specific services and which underlying factors influence these costs and how they do so
2.2 Registered Providers’ Boards shall demonstrate to stakeholders how they are meeting this standard. As part of that process, on an annual basis, they will publish a robust self-assessment which sets out in a way that is transparent and accessible to stakeholders how they are achieving VfM in delivering their purpose and objectives.
The assessment shall:
• Enable stakeholders to understand the return on assets measured against the organisation’s objectives
• Set out the absolute and comparative costs of delivering specific services
• Evidence the VfM gains that have been and will be made and how these have been and will be realised over time

C21/0714/104378
Registered in England No: 04831118 • Charity Registration No: 1106967
Trafford Housing Trust Head OfficeTrafford Housing Trust, Sale Point,126 -150 Washway Road, Sale M33 6AG
Customer Hub Number:
0300 777 7777www.traffordhousingtrust.co.uk
traffordhousingtrust
@talktrafford