thyssenkrupp · 2019-03-08 · thyssenkrupp chartso nthe1 stq uarter2 008– 2009,f ebruary1 3,...
TRANSCRIPT
ThyssenKrupp
Charts�on�the�1st�Quarter�2008�– 2009,�February�13,�2009 0
ThyssenKrupp
Charts�on�the�1st�Quarter�2008�– 2009,�February�13,�2009 1
Agenda
� Group�Financials
� Segment�Performance
� Group�Measures�and�Outlook
� Appendix
ThyssenKrupp
Charts�on�the�1st�Quarter�2008�– 2009,�February�13,�2009 2
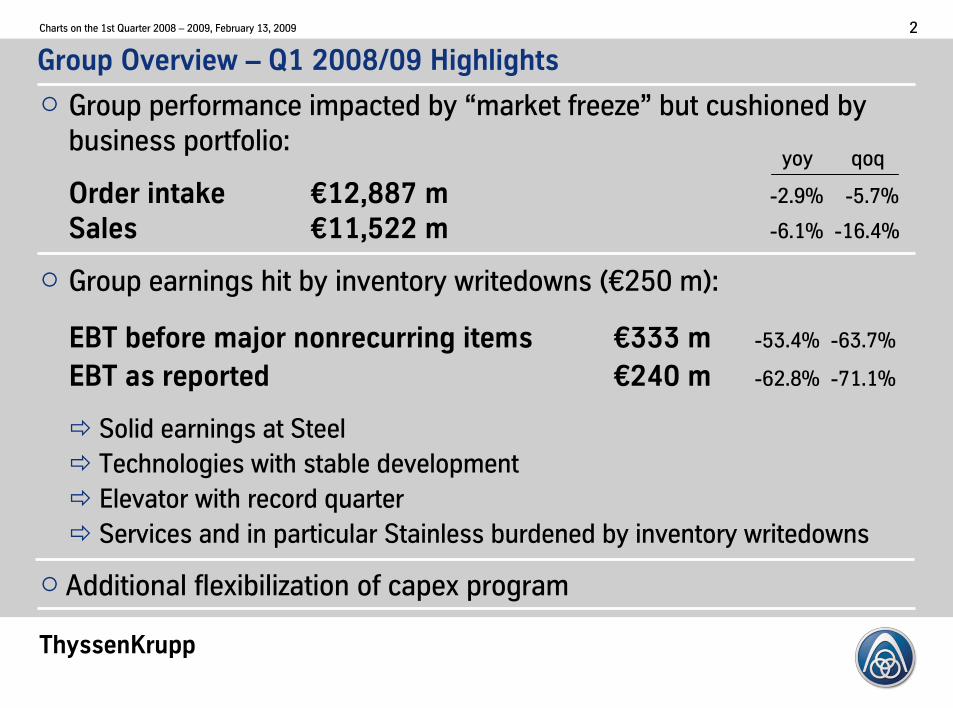
� Group�performance�impacted�by�“market�freeze” but�cushioned�by�
business�portfolio:
Order�intake €12,887�m -2.9%����-5.7%
Sales €11,522�m -6.1%��-16.4%
� Group�earnings�hit�by�inventory�writedowns 5€250�m7:
EBT�before�major�nonrecurring�items €333�m� -53.4%��-63.7%
EBT�as�reported�� €240�m -62.8%��-71.1%
� Solid�earnings�at�Steel
� Technologies�with�stable�development���������������������������
� Elevator�with�record�quarter�����������������������������������
� Services�and�in�particular�Stainless�burdened�by�inventory�writedowns
� Additional�flexibilization of�capex program
Group�Overview�– Q1�2008/09�Highlights
yoy qoq
ThyssenKrupp
Charts�on�the�1st�Quarter�2008�– 2009,�February�13,�2009 3
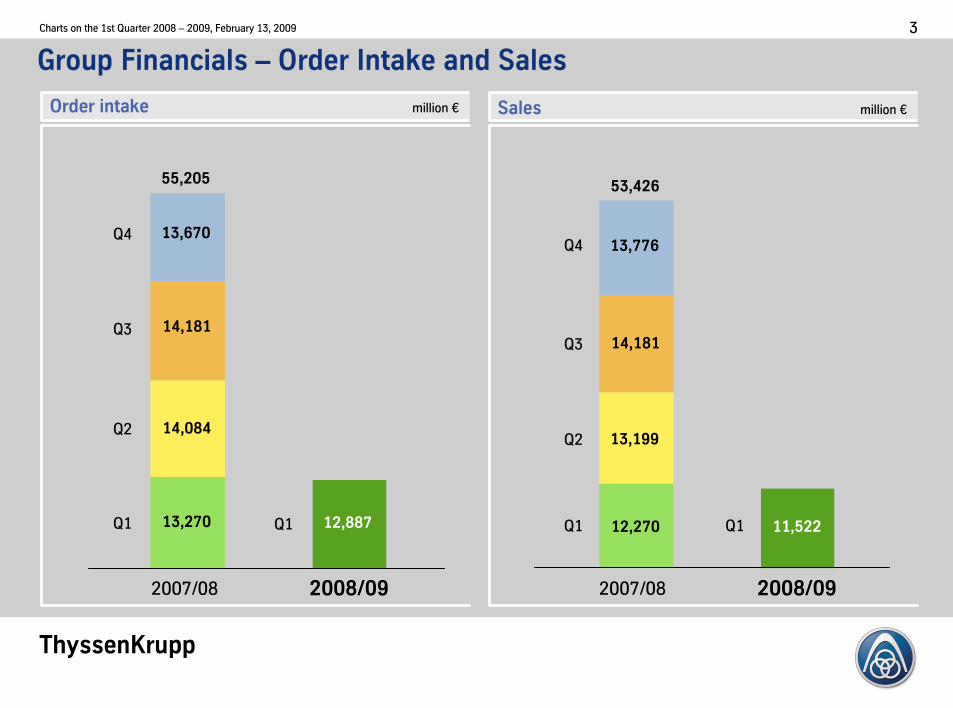
Group�Financials�– Order�Intake�and�Sales�
2007/08 2008/09
Q1
Q2
Q3
Q4
Order�intake million�€
2007/08 2008/09
Sales million�€
Q1
Q2
Q3
Q4
55,20553,426
13,670
14,181
14,084
13,270
13,776
14,181
12,270
13,199
2008/092007/08 2008/092007/08
Q1 12,887 Q1 11,522
ThyssenKrupp
Charts�on�the�1st�Quarter�2008�– 2009,�February�13,�2009 4
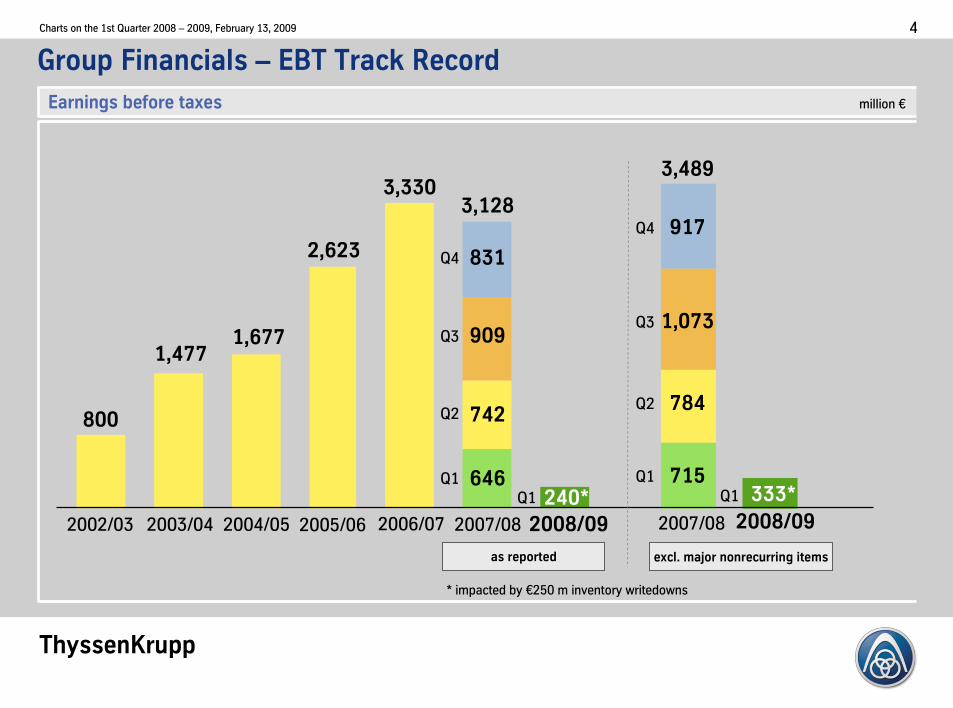
Group�Financials�– EBT�Track�Record
Earnings�before�taxes million�€
800
1,477
2004/052002/03 2003/04 2005/06
1,677
2,623
2006/07
3,330
2007/08
646
3,489
715
2008/09
excl.�major�nonrecurring�itemsas�reported
784742
3,128
9091,073
831
917
2007/08
Q1
Q2
Q3
Q4
Q1
Q2
Q3
Q4
2008/09
Q1 240* Q1 333*
*�impacted by €250�m�inventory writedowns
ThyssenKrupp
Charts�on�the�1st�Quarter�2008�– 2009,�February�13,�2009 5
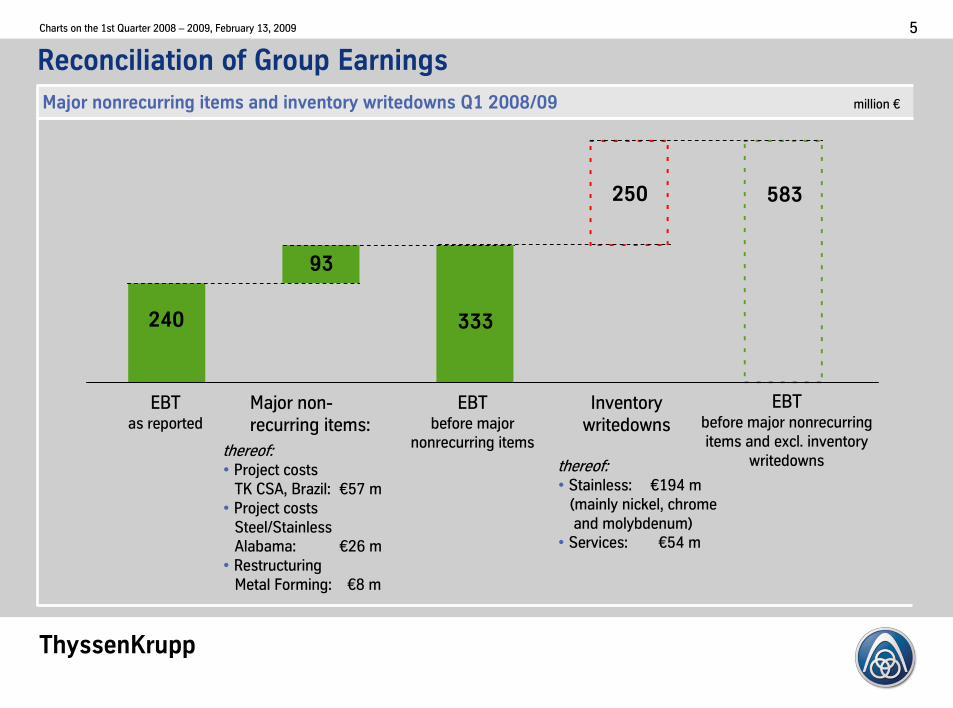
Reconciliation�of�Group�Earnings
Major�nonrecurring�items�and�inventory�writedowns Q1�2008/09�������������� million�€
EBTas�reported
Major�non-
recurring items:
EBTbefore major
nonrecurring items
Inventory
writedowns
EBTbefore major nonrecurring
items and�excl.�inventory
writedowns
240
thereof:�• Project�costs
TK�CSA,�Brazil: €57�m
• Project�costs
Steel/Stainless
Alabama:� €26�m
• Restructuring
Metal�Forming: €8�m
93
333
250 583
thereof:• Stainless: €194�m
5mainly nickel,�chrome
and�molybdenum7
• Services:� €54�m
ThyssenKrupp
Charts�on�the�1st�Quarter�2008�– 2009,�February�13,�2009 6
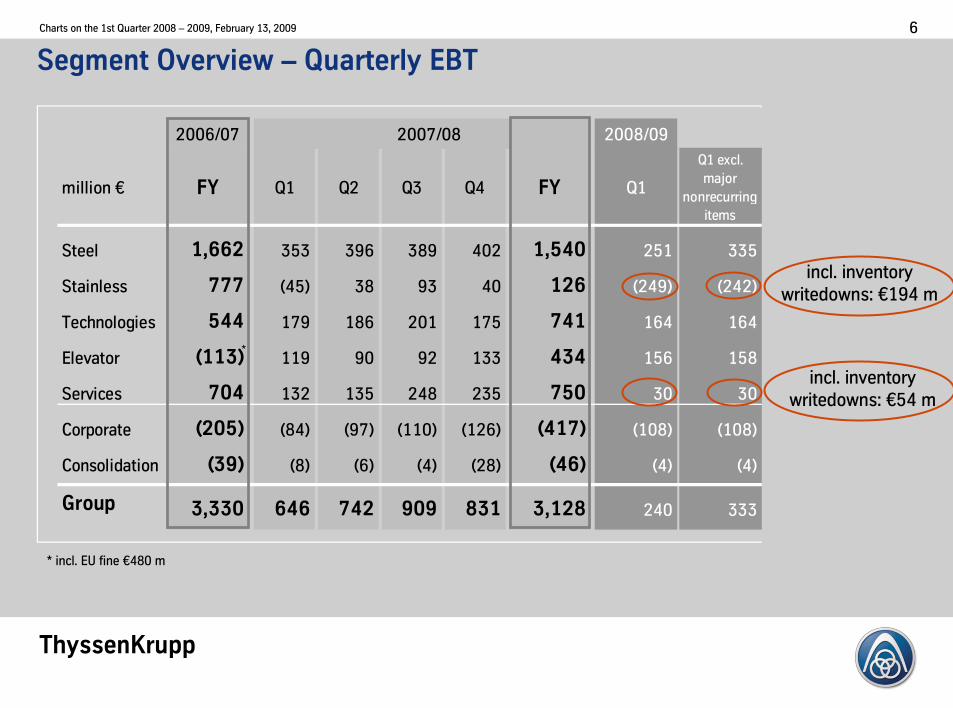
2006/07 2008/09
million�€ FY Q1 Q2 Q3 Q4 FY Q1
Q1�excl.�
major�
nonrecurring�
items
Steel 1,662 353 396 389 402 1,540 251 335
Stainless 777 5457 38 93 40 126 52497 52427
Technologies 544 179 186 201 175 741 164 164
Elevator 9113: 119 90 92 133 434 156 158
Services 704 132 135 248 235 750 30 30
Corporate 9205: 5847 5977 51107 51267 9417: 51087 51087
Consolidation 939: 587 567 547 5287 946: 547 547
Group 3,330 646 742 909 831 3,128 240 333
��������������������������������2007/08
Segment�Overview�– Quarterly�EBT
*�incl.�EU�fine�€480�m
*
incl.�inventory
writedowns:�€194�m
incl.�inventory
writedowns:�€54�m
ThyssenKrupp
Charts�on�the�1st�Quarter�2008�– 2009,�February�13,�2009 7
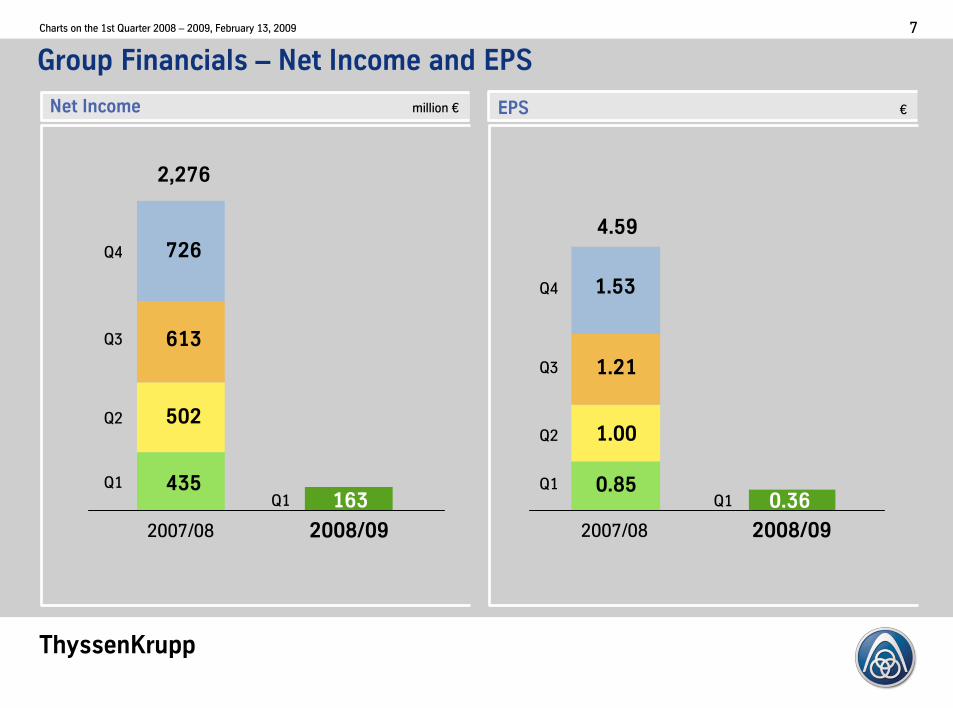
Group�Financials�– Net�Income�and�EPS
435
502
2,276
613
726
Q1
Q2
Q3
Q4
Net�Income million�€ EPS €
2008/092007/08
163Q1
2008/092007/08
0.85
1.00
4.59
1.21
1.53
Q1
Q2
Q3
Q4
0.36Q1
ThyssenKrupp
Charts�on�the�1st�Quarter�2008�– 2009,�February�13,�2009 8
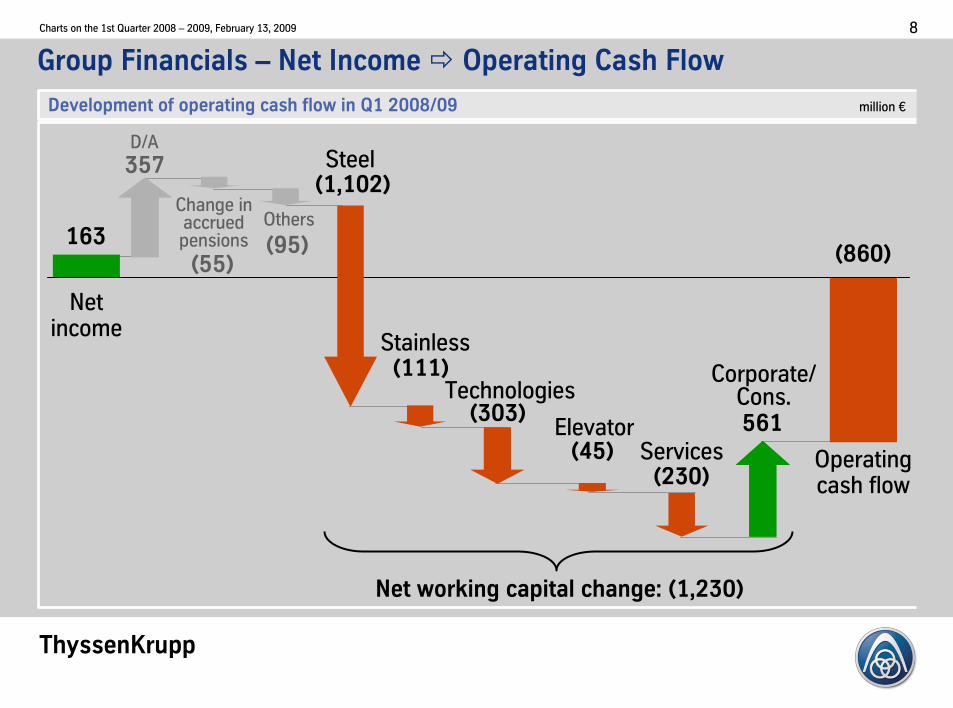
Group�Financials�– Net�Income�� Operating�Cash�Flow
ElevatorDevelopment�of�operating�cash�flow�in�Q1�2008/09 million�€
Operatingcash�flow
357
9230:
D/A
Netincome
Others
Stainless
Steel
TechnologiesCorporate/Cons.
ServicesElevator
Net�working�capital�change:�91,230:
9303:
163955:
995:
91,102:
9111:
945:561
9860:
Change�inaccruedpensions
ThyssenKrupp
Charts�on�the�1st�Quarter�2008�– 2009,�February�13,�2009 9
Elevator
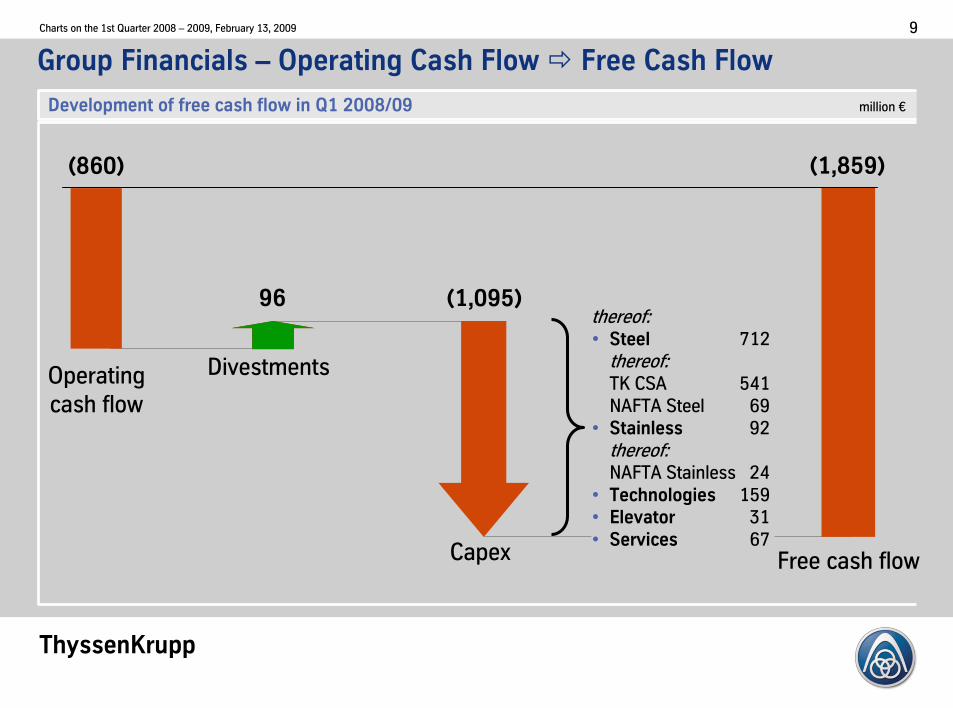
Group�Financials�– Operating�Cash�Flow�� Free�Cash�Flow
Development�of�free�cash�flow�in�Q1�2008/09� million�€
Divestments
Capex
Operating
cash�flow
Free�cash�flow
91,095:
91,859:
96
9860:
thereof:• Steel 712
thereof:TK�CSA 541
NAFTA�Steel 69
• Stainless 92
thereof:NAFTA�Stainless 24
• Technologies 159
• Elevator 31
• Services 67
ThyssenKrupp
Charts�on�the�1st�Quarter�2008�– 2009,�February�13,�2009 10
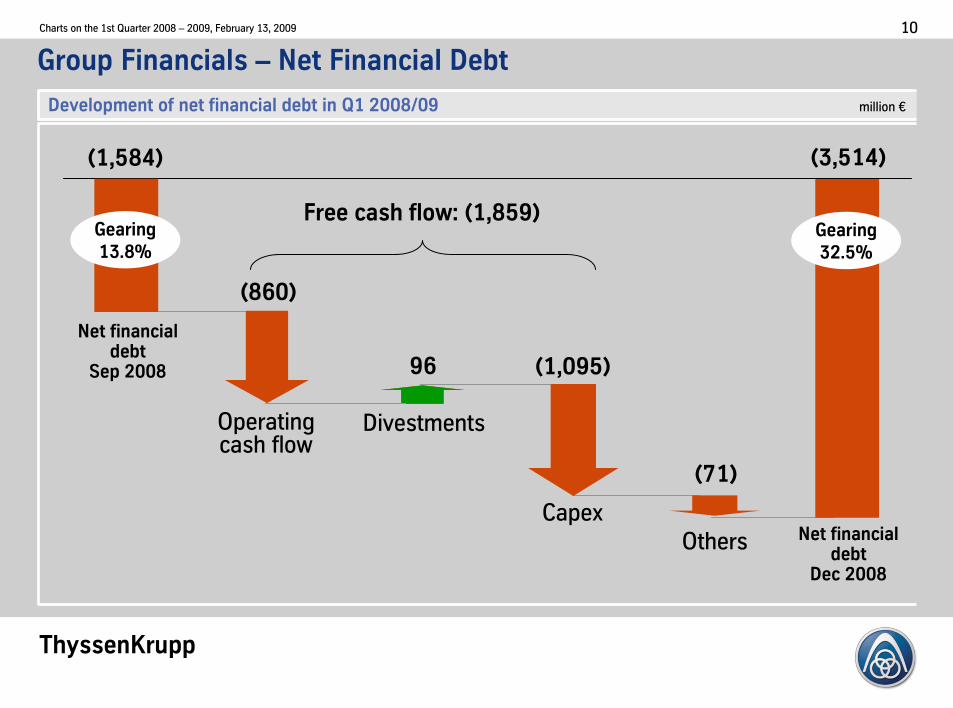
Group�Financials�– Net�Financial�Debt
Development�of�net�financial�debt in�Q1�2008/09 million�€
Free�cash�flow:�91,859:
Divestments
Net�financialdebt
Sep�2008
Net�financialdebt
Dec�2008
�3,514�
96
Gearing
32.5%
Capex
�1,095�
Operatingcash�flow
�860�
Others
�71�
�1,584�
Gearing
13.8%
ThyssenKrupp
Charts�on�the�1st�Quarter�2008�– 2009,�February�13,�2009 11
Agenda
� Group�Financials
� Segment�Performance
� Group�Measures�and�Outlook
� Appendix
ThyssenKrupp
Charts�on�the�1st�Quarter�2008�– 2009,�February�13,�2009 12
5667
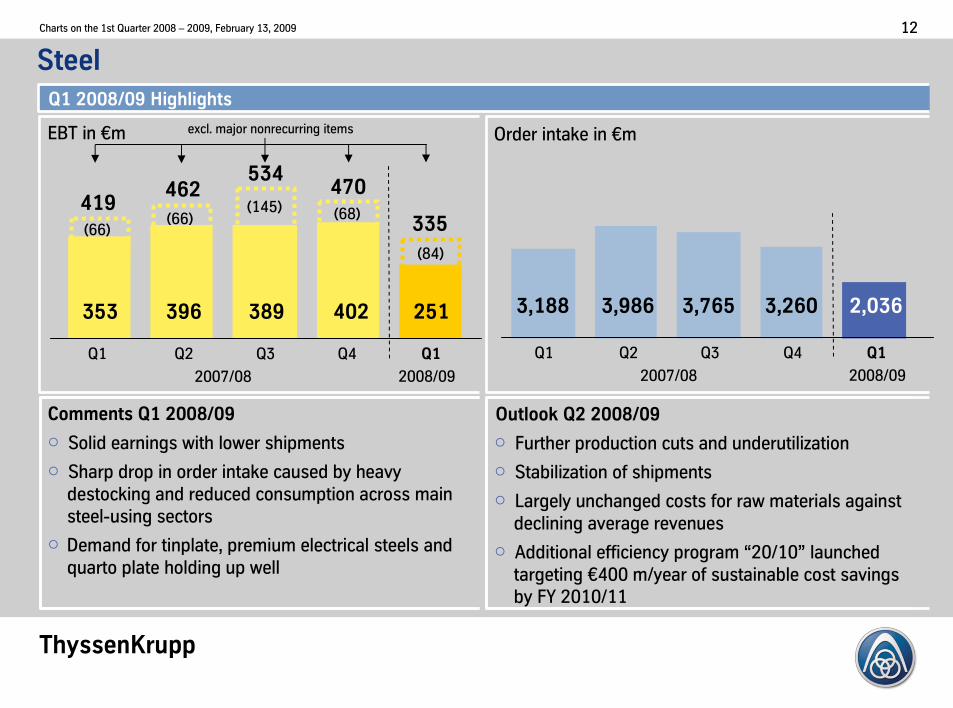
Steel�
Q1�2008/09�Highlights
Comments�Q1�2008/09 Outlook�Q2�2008/09
� Solid�earnings�with�lower�shipments
� Sharp�drop�in�order�intake�caused�by�heavy�
destocking and�reduced�consumption�across�main��
steel-using�sectors
� Demand�for�tinplate,�premium�electrical�steels�and�
quarto�plate�holding�up�well
� Further�production�cuts�and�underutilization�
� Stabilization�of�shipments
� Largely�unchanged�costs�for�raw�materials�against�
declining�average�revenues
� Additional�efficiency�program�“20/10” launched�
targeting�€400�m/year�of�sustainable�cost�savings�
by�FY�2010/11�
EBT�in�€m
Q1 Q2 Q3� Q4 Q1
2007/08 2008/09
5667
353 396 389 402 251
51457 5687
5847
419462
534470
335
Q1 Q2 Q3� Q4 Q1
2007/08 2008/09
Order�intake�in�€m
3,188 3,986 3,765 3,260 2,036
excl.�major�nonrecurring�items
ThyssenKrupp
Charts�on�the�1st�Quarter�2008�– 2009,�February�13,�2009 13
251
604
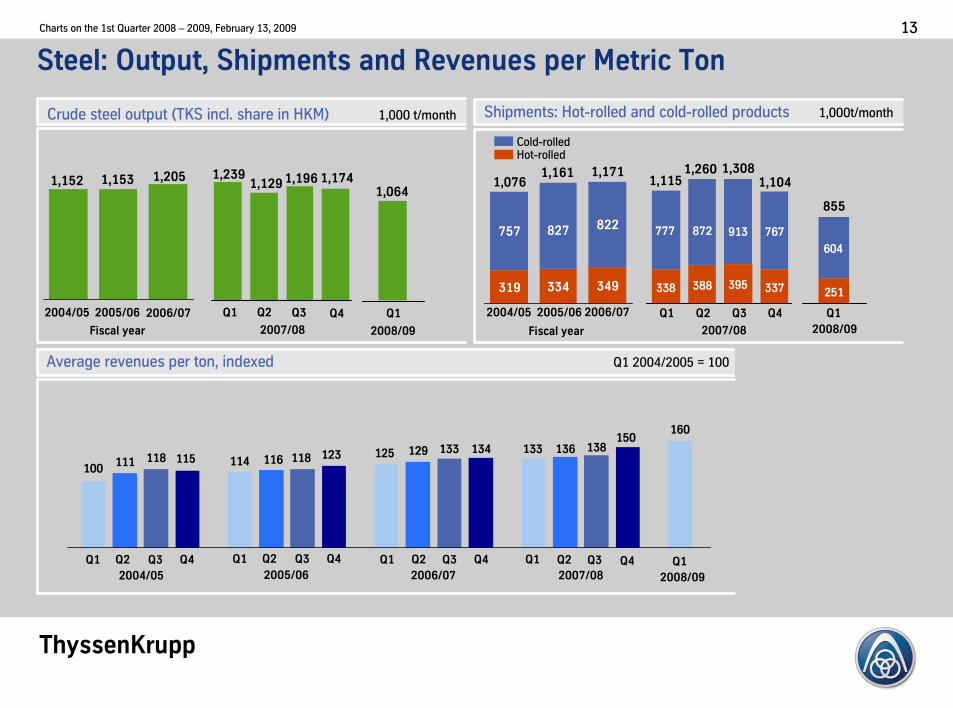
Steel:�Output,�Shipments�and�Revenues�per�Metric�Ton
1,152
Fiscal�year
2004/05 2005/06
Crude�steel�output�5TKS�incl.�share�in�HKM7 1,000�t/month
1,153
Q1
2007/08
1,239
319 334
757
349
822827
Fiscal�year
2004/05 2005/06
Shipments:�Hot-rolled�and�cold-rolled�products 1,000t/month
Cold-rolledHot-rolled
1,0761,161 1,171
338 388 337395
767872 913777
Q1
2007/08
1,115
160
133114
125
100116
136129111
133118118
138150
123115134
Average�revenues�per�ton,�indexed Q1�2004/2005�=�100
2007/08
Q1
2005/06
Q2 Q3 Q4Q1
2004/05
Q2 Q3 Q4 Q1
2006/07
Q2 Q3 Q4 Q1
1,129
Q2
1,260
Q2
Q2
Q3
1,196
Q3
1,308
Q3
1,174
Q4
1,104
Q4
Q4
2006/07
1,205
Q1
2008/09
1,064
2006/07 Q1
855
2008/09
2008/09
Q1
ThyssenKrupp
Charts�on�the�1st�Quarter�2008�– 2009,�February�13,�2009 14
60
100
140
180
220
260
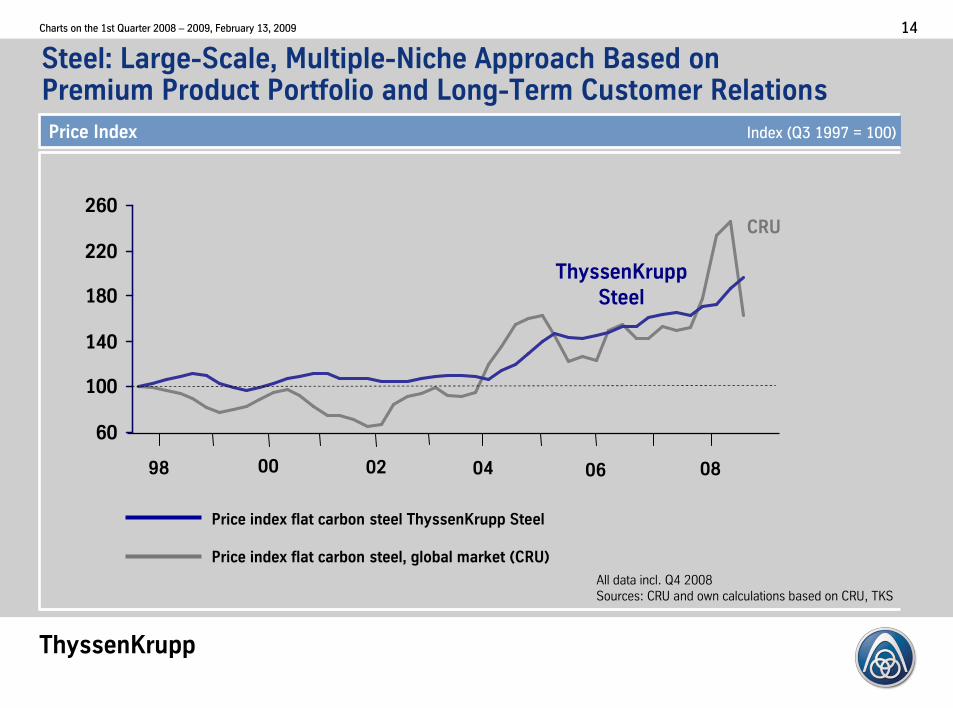
Steel:�Large-Scale,�Multiple-Niche�Approach�Based�onPremium�Product�Portfolio�and�Long-Term�Customer�Relations
Price�Index Index�5Q3�1997�=�1007
All�data�incl.�Q4�2008
Sources:�CRU�and�own�calculations�based�on�CRU,�TKS
Price�index flat carbon steel ThyssenKrupp�Steel�
Price�index flat carbon steel,�global�market 9CRU:
CRU
ThyssenKrupp
Steel
98 00 02 04 06 08
ThyssenKrupp
Charts�on�the�1st�Quarter�2008�– 2009,�February�13,�2009 15
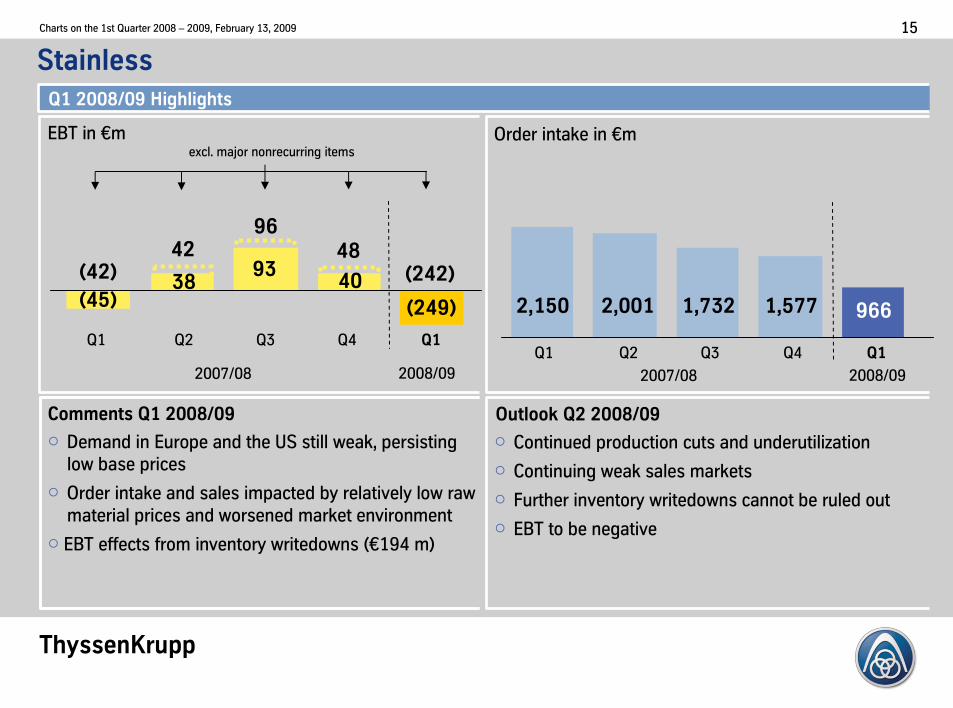
Stainless
Comments�Q1�2008/09 Outlook�Q2�2008/09
� Demand�in�Europe�and�the�US�still�weak,�persisting�
low�base�prices
� Order�intake�and�sales�impacted�by�relatively�low�raw�
material�prices�and�worsened�market�environment
� EBT�effects�from�inventory�writedowns 5€194�m7
� Continued�production�cuts�and�underutilization�
� Continuing�weak�sales�markets
� Further�inventory�writedowns cannot�be�ruled�out
� EBT�to�be�negative
Q1�2008/09�Highlights
EBT�in�€m
Q1 Q2 Q3� Q4 Q1
2007/08 2008/09
945:38
9340
9249:
942:42
9648
9242:
Q1 Q2 Q3� Q4 Q1
2007/08 2008/09
Order�intake�in�€m
2,150 2,001 1,732 1,577 966
excl.�major�nonrecurring�items
ThyssenKrupp
Charts�on�the�1st�Quarter�2008�– 2009,�February�13,�2009 16
137 141 134
20
3437
24
158
98
123
161
82100
171
8294
123
177
9892
134118
161
122
89
105
20
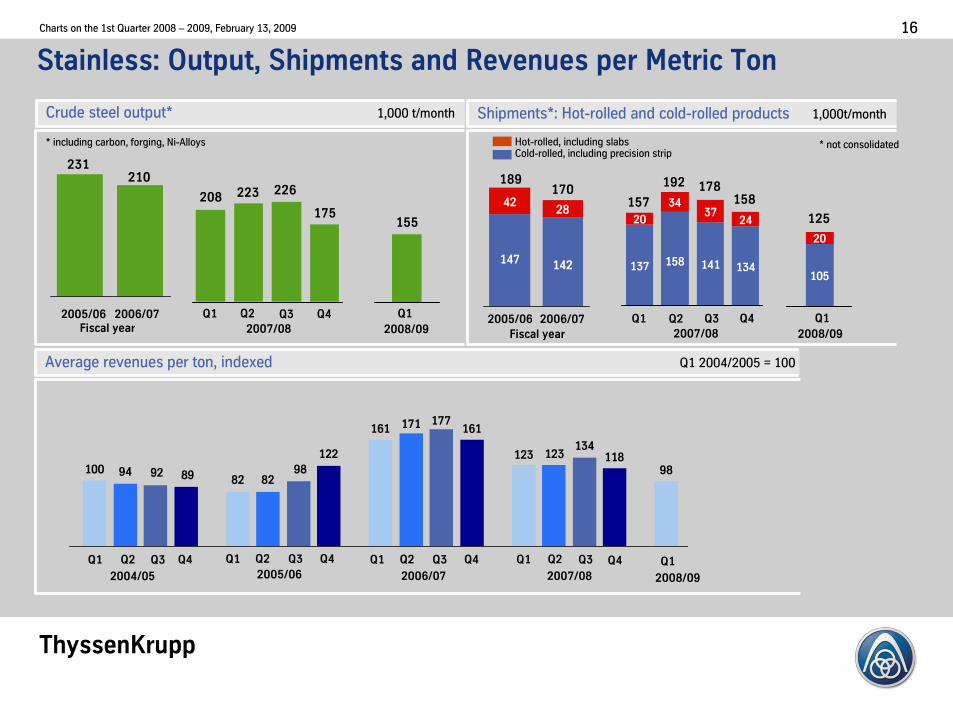
Stainless:�Output,�Shipments�and�Revenues�per�Metric�Ton
Crude�steel�output* 1,000�t/month
Q1
Fiscal�year2005/06
2007/08
231
Q2
*�including�carbon,�forging,�Ni-Alloys
Q3 Q4 Q1
2008/09
208 4228
142147
Q1
Fiscal�year
2005/06
2007/08
2006/07
Shipments*:�Hot-rolled�and�cold-rolled�products 1,000t/month
Q2
Hot-rolled,�including�slabsCold-rolled,�including�precision�strip
189170
Q3 Q1
2008/09
Q4
157
Average�revenues�per�ton,�indexed Q1�2004/2005�=�100
2007/08
Q1
2005/06
Q2 Q3 Q4Q1
2004/05
Q2 Q3 Q4 Q1
2006/07
Q2 Q3 Q4 Q1
223192
Q2
226 178
Q3
175158
Q4
210
2006/07
155
2008/09
Q1
125
*�not�consolidated
ThyssenKrupp
Charts�on�the�1st�Quarter�2008�– 2009,�February�13,�2009 17
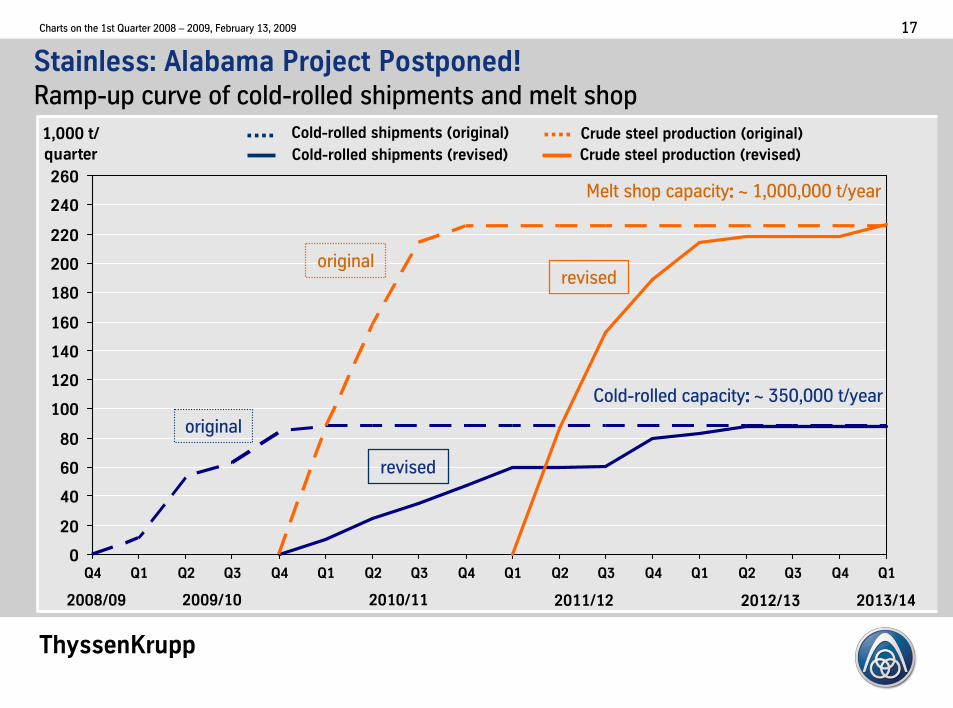
0
20
40
60
80
100
120
140
160
180
200
220
240
260
Q4 Q1 Q2 Q3 Q4 Q1 Q2 Q3 Q4 Q1 Q2 Q3 Q4 Q1 Q2 Q3 Q4 Q1
1,000�t/
quarter
Stainless:�Alabama�Project Postponed!Ramp-up curve of�cold-rolled shipments and�melt shop
2008/09 2009/10 2010/11 2011/12 2012/13
Cold-rolled�capacity:�:�:�:�~ 350,000�t/year
2013/14
Crude steel production �original�
Crude steel production �revised�
Cold-rolled shipments �original�
Cold-rolled shipments �revised�
Melt�shop�capacity:�:�:�:�~ 1,000,000�t/year
original
revised
originalrevised
ThyssenKrupp
Charts�on�the�1st�Quarter�2008�– 2009,�February�13,�2009 18
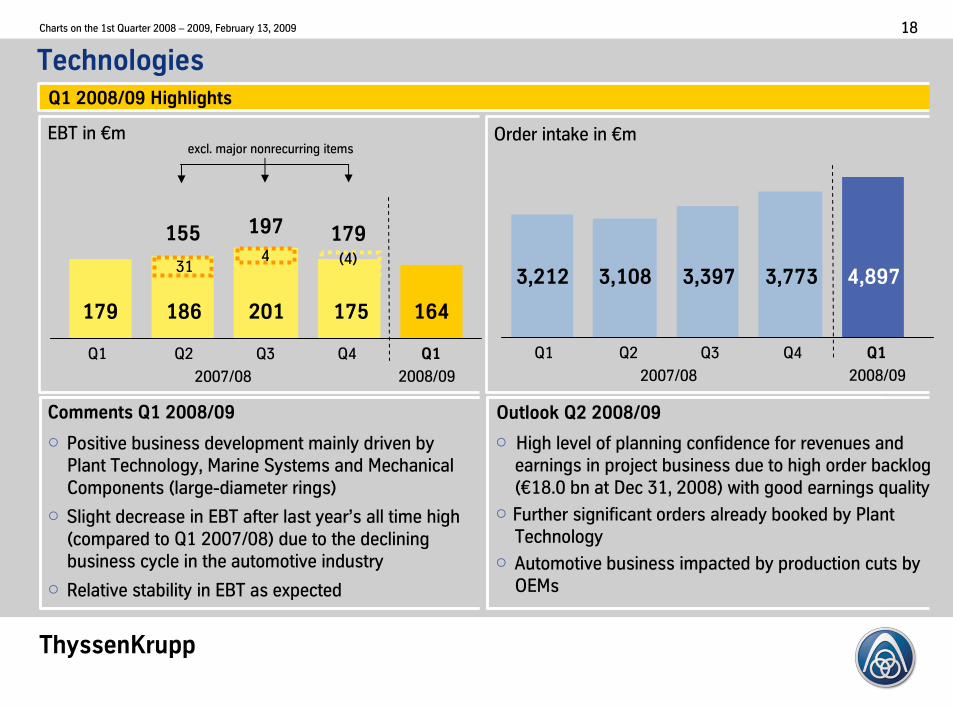
TechnologiesQ1�2008/09�Highlights
Comments�Q1�2008/09 Outlook�Q2�2008/09
� Positive�business�development�mainly�driven�by�
Plant�Technology,�Marine�Systems�and�Mechanical�
Components�5large-diameter�rings7
� Slight�decrease�in�EBT�after�last�year’s�all�time�high�
5compared�to�Q1�2007/087�due�to�the�declining�
business�cycle�in�the�automotive�industry
� Relative�stability�in�EBT�as�expected
� High�level�of�planning�confidence�for�revenues�and�
earnings�in�project�business�due�to�high�order�backlog�
5€18.0�bn at�Dec�31,�20087�with�good�earnings�quality
� Further�significant�orders�already�booked�by�Plant�
Technology
� Automotive�business�impacted�by�production�cuts�by�
OEMs
EBT�in�€m
Q1 Q2 Q3� Q4 Q1
2007/08 2008/09
179 186 201 175 164
31
155 197 179
excl.�major�nonrecurring�items
4 547
Q1 Q2 Q3� Q4 Q1
2007/08 2008/09
Order�intake�in�€m
3,212 3,108 3,397 3,773 4,897
ThyssenKrupp
Charts�on�the�1st�Quarter�2008�– 2009,�February�13,�2009 19
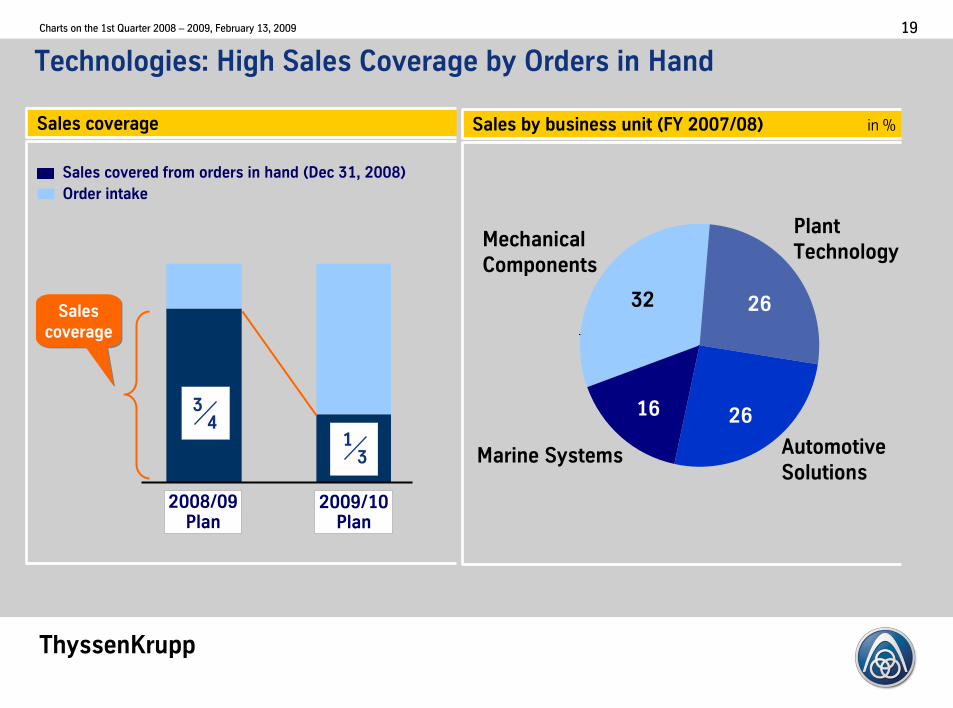
Technologies:�High�Sales�Coverage�by�Orders�in�Hand
Plant�
Technology
Sales�by�business�unit�9FY�2007/08:� in�%
Marine�Systems
16
Automotive�
Solutions
26
26
Mechanical
Components
32
Sales!cover!from!orders!in!hand!�September!30,!2008�
Order!intake
Sales!covered!from!orders!in!hand!�Dec!31,!2008�
2008/09Plan
2009/10Plan
Sales
coverage
Sales
coverage
Sales�coverage
34
13
ThyssenKrupp
Charts�on�the�1st�Quarter�2008�– 2009,�February�13,�2009 20
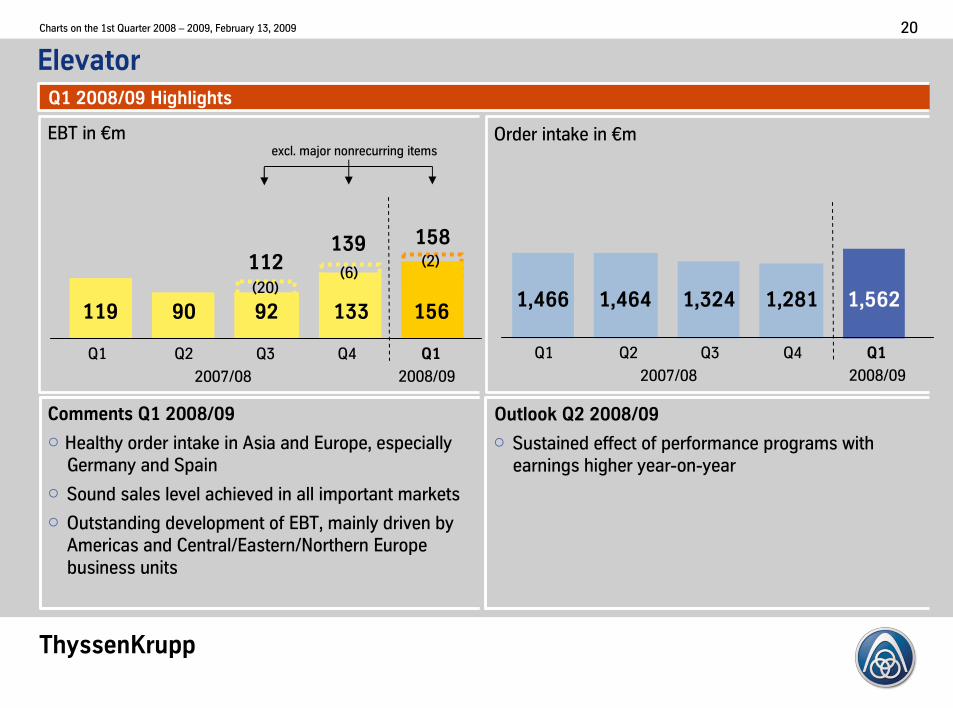
Elevator�Q1�2008/09�Highlights
Comments�Q1�2008/09 Outlook�Q2�2008/09
� Sustained�effect�of�performance�programs�with�
earnings�higher�year-on-year
EBT�in�€m
Q1 Q2 Q3� Q4 Q1
2007/08 2008/09
119 90 92 133 156
112139
excl.�major�nonrecurring�items
5207567
Q1 Q2 Q3� Q4 Q1
2007/08 2008/09
Order�intake�in�€m
1,466 1,464 1,324 1,281 1,562
527
158
� Healthy�order�intake�in�Asia�and�Europe,�especially�
Germany�and�Spain
� Sound�sales�level�achieved�in�all�important�markets
� Outstanding�development�of�EBT,�mainly�driven�by�
Americas�and�Central/Eastern/Northern�Europe�
business�units
ThyssenKrupp
Charts�on�the�1st�Quarter�2008�– 2009,�February�13,�2009 21
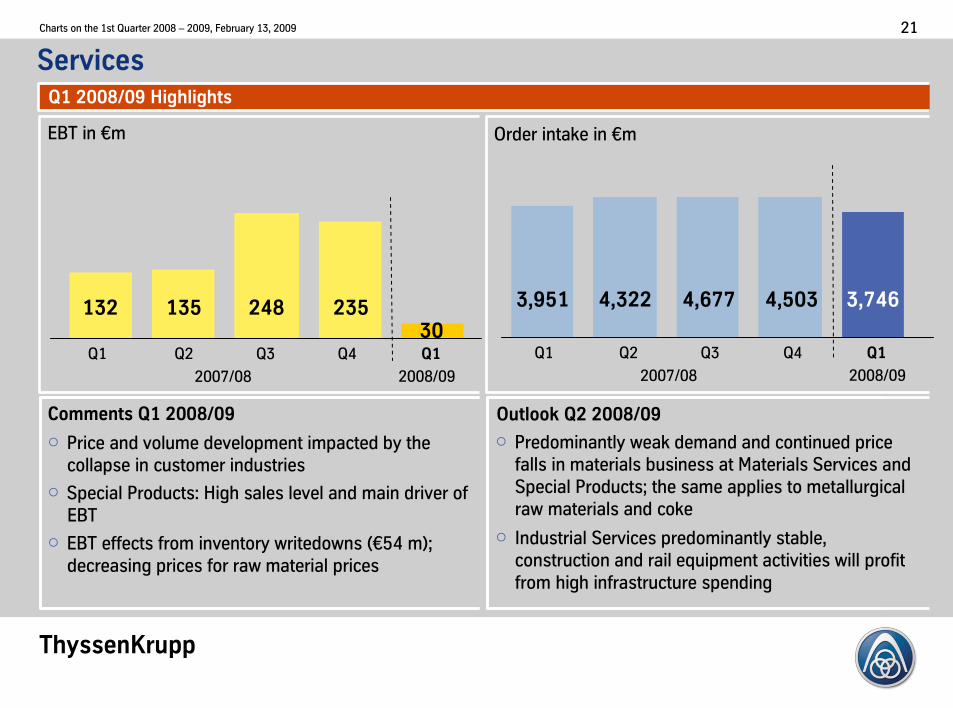
ServicesQ1�2008/09�Highlights
Comments�Q1�2008/09 Outlook�Q2�2008/09
� Predominantly�weak�demand�and�continued�price�
falls�in�materials�business�at�Materials�Services�and�
Special�Products;�the�same�applies�to�metallurgical�
raw�materials�and�coke�
� Industrial�Services�predominantly�stable,�
construction�and�rail�equipment�activities�will�profit�
from�high�infrastructure�spending
EBT�in�€m
Q1 Q2 Q3� Q4 Q1
2007/08 2008/09
132 135 248 23530
Q1 Q2 Q3� Q4 Q1
2007/08 2008/09
Order�intake�in�€m
3,951 4,322 4,677 4,503 3,746
� Price�and�volume�development�impacted�by�the�
collapse�in�customer�industries
� Special�Products:�High�sales�level�and�main�driver�of�
EBT
� EBT�effects�from�inventory�writedowns 5€54�m7;�
decreasing�prices�for�raw�material�prices
ThyssenKrupp
Charts�on�the�1st�Quarter�2008�– 2009,�February�13,�2009 22
Agenda
� Group�Financials
� Segment�Performance
� Group�Measures�and�Outlook
� Appendix
ThyssenKrupp
Charts�on�the�1st�Quarter�2008�– 2009,�February�13,�2009 23
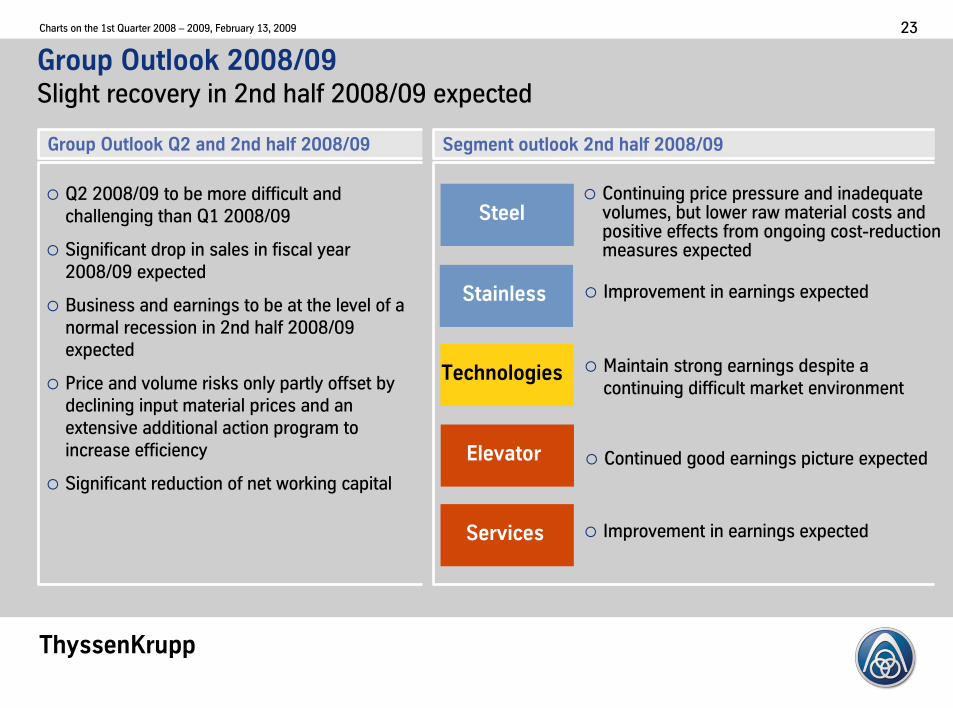
Segment�outlook�2nd�half�2008/09
Group�Outlook�2008/09Slight�recovery�in�2nd�half�2008/09�expected
Group�Outlook�Q2�and�2nd�half�2008/09
Technologies
Stainless
Steel
Elevator
Services
� Q2�2008/09�to�be�more�difficult�and�
challenging�than�Q1�2008/09
� Significant�drop�in�sales�in�fiscal�year�
2008/09�expected
� Business�and�earnings�to�be�at�the�level�of�a�
normal�recession�in�2nd�half�2008/09�
expected
� Price�and�volume�risks�only�partly�offset�by�
declining�input�material�prices�and�an�
extensive�additional�action�program�to�
increase�efficiency
� Significant�reduction�of�net�working�capital
� Continuing�price�pressure�and�inadequate�volumes,�but�lower�raw�material�costs�and�positive�effects�from�ongoing�cost-reduction�measures�expected�
� Improvement�in�earnings�expected
� Improvement�in�earnings�expected
� Maintain�strong�earnings�despite�a�
continuing�difficult�market�environment
� Continued�good�earnings�picture�expected
ThyssenKrupp
Charts�on�the�1st�Quarter�2008�– 2009,�February�13,�2009 24
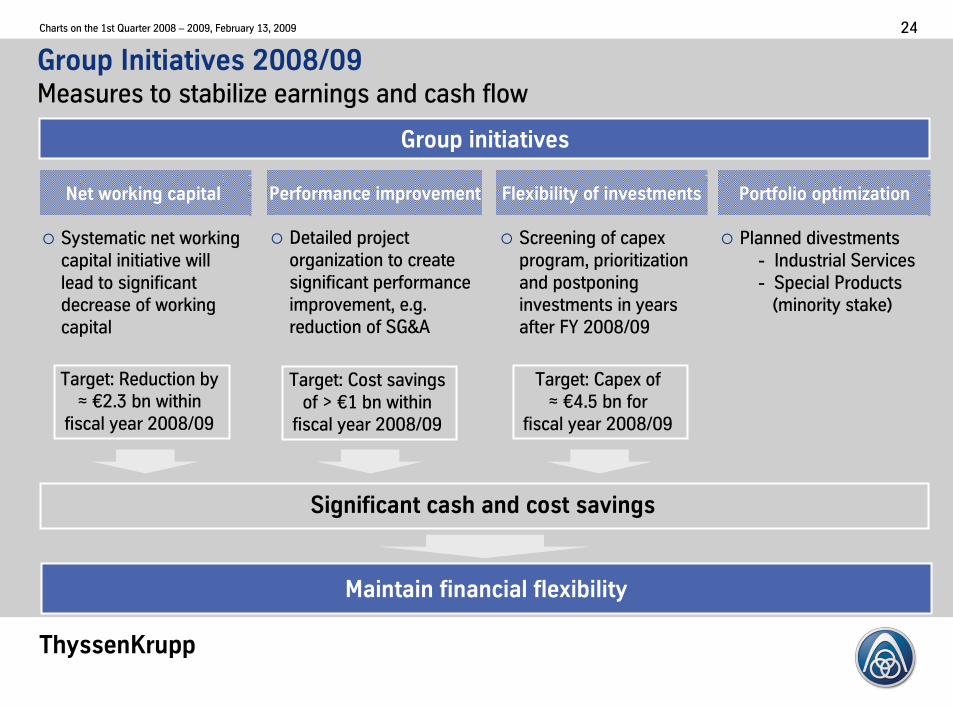
Group�Initiatives�2008/09�Measures�to�stabilize�earnings�and�cash�flow
Group�initiatives
Net�working capital Flexibility of�investmentsPerformance�improvement Portfolio�optimization
� Systematic�net�working�
capital�initiative�will�
lead�to�significant�����
decrease�of�working�����
capital�
� Screening�of�capex
program,�prioritization�
and�postponing�
investments�in�years��
after�FY�2008/09
� Detailed�project�
organization�to�create�
significant�performance�
improvement,�e.g.�
reduction�of�SG&A
� Planned�divestments
- Industrial�Services
- Special�Products�
5minority�stake7
Significant�cash�and�cost�savings
Maintain financial flexibility
Target:�Reduction�by���������������������������
≈ €2.3�bn within������
fiscal�year�2008/09
Target:�Cost�savings�
of�>�€1�bn within�����������
fiscal�year�2008/09
Target:�Capex of������������������
≈ €4.5�bn for��������������
fiscal�year�2008/09
ThyssenKrupp
Charts�on�the�1st�Quarter�2008�– 2009,�February�13,�2009 25
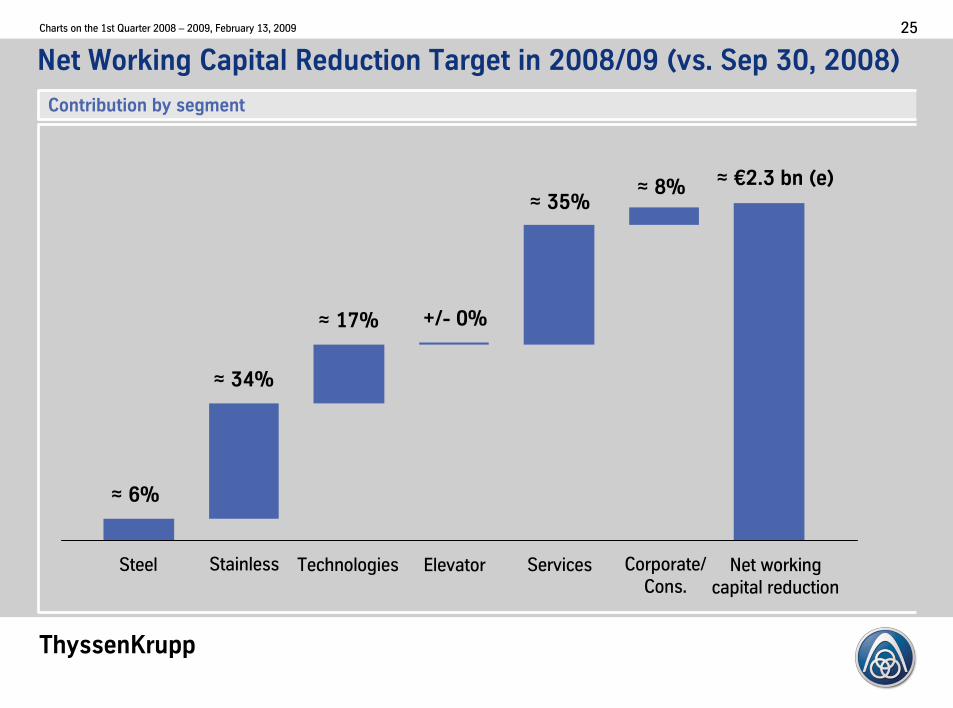
Net�Working�Capital�Reduction�Target�in�2008/09�9vs.�Sep�30,�2008:
Contribution�by�segment
Steel Stainless Technologies Services Corporate/
Cons.Net�working
capital reduction
≈ 6%
≈ 34%
≈ 17%
≈ 35%≈ 8% ≈ €2.3�bn 9e:
Elevator
+/- 0%
ThyssenKrupp
Charts�on�the�1st�Quarter�2008�– 2009,�February�13,�2009 26
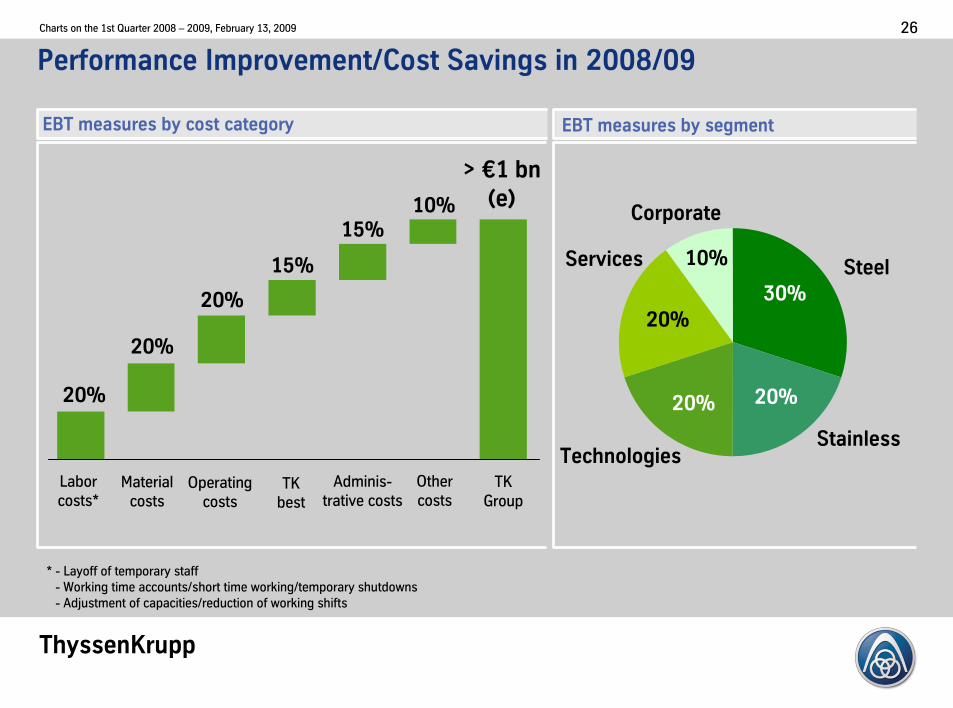
Performance�Improvement/Cost�Savings�in�2008/09
EBT�measures�by�cost�category
Labor�
costs*Material�
costsOperating�
costsTK�
best
Adminis-
trative costs
Other�
costsTK�
Group
>�€1�bn
9e:
20%
20%
20%
15%
15%10%
EBT�measures�by�segment
Steel
30%
Stainless
20%
Technologies
20%
Services
20%
Corporate
10%
* - Layoff of�temporary staff
- Working�time�accounts/short�time�working/temporary�shutdowns
- Adjustment�of�capacities/reduction�of�working�shifts
ThyssenKrupp
Charts�on�the�1st�Quarter�2008�– 2009,�February�13,�2009 27
Investment�Grade�Rating�with�Every�Rating�Agency�is�Key
� Financial�flexibility�
� Cash
� Available�credit�lines
� Treasury�stock
� Authorized�capital
� Continuous�revision�of�current�business�portfolio�remains�
top�priority�for�management
ThyssenKrupp
Charts�on�the�1st�Quarter�2008�– 2009,�February�13,�2009 28
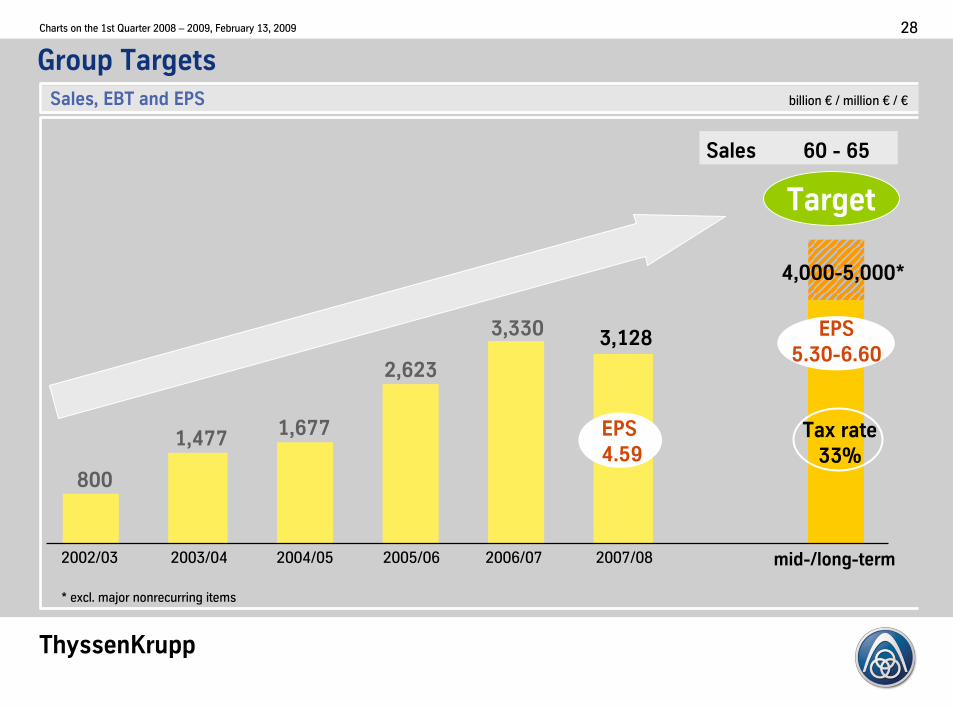
800
2003/04
2,623
2002/03 2004/05
1,477
Target
4,000-5,000*
mid-/long-term
Group�Targets
3,330
2005/06
Sales� 60�- 65
Sales,�EBT�and�EPS billion�€ /�million�€ /�€
EPS
5.30-6.60
Tax�rate�
33%
2006/07
*�excl.�major�nonrecurring�items
EPS
4.59
3,128
1,677
2007/08
ThyssenKrupp
Charts�on�the�1st�Quarter�2008�– 2009,�February�13,�2009 29
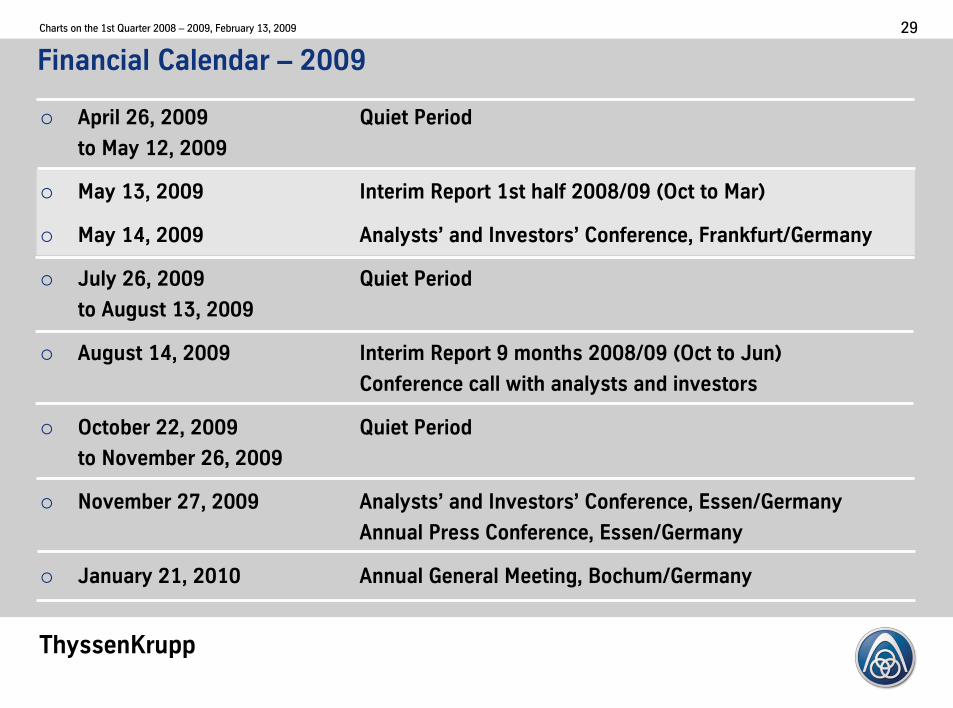
Financial�Calendar�– 2009
� April�26,�2009������������������ Quiet�Period����������������������������������������������������
to�May�12,�2009
� May�13,�2009 Interim�Report�1st�half�2008/09�9Oct�to�Mar:
� May�14,�2009 Analysts’ and�Investors’ Conference,�Frankfurt/Germany
� July�26,�2009 Quiet�Period�
to�August�13,�2009
� August�14,�2009 Interim�Report�9�months�2008/09�9Oct�to�Jun:
Conference�call�with�analysts�and�investors
� October�22,�2009 Quiet�Period�
to�November�26,�2009
� November�27,�2009 Analysts’ and�Investors’ Conference,�Essen/Germany
Annual�Press�Conference,�Essen/Germany
� January�21,�2010 Annual�General�Meeting,�Bochum/Germany
ThyssenKrupp
Charts�on�the�1st�Quarter�2008�– 2009,�February�13,�2009 30
How�to�Contact�ThyssenKrupp�AG�Investor�Relations
Institutional�Investors�and Analysts:
� Phone:�+49�211�824-36464�
� Fax:�+49�211�824-36467
� E-mail:�[email protected]
� Internet:�www.thyssenkrupp.com
To�be�added�to�the�
IR�mailing�list,�send�us�a�
brief�e-mail�with�your�
details!
ThyssenKrupp
Charts�on�the�1st�Quarter�2008�– 2009,�February�13,�2009 31
Agenda
� Group�Financials
� Segment�Performance
� Group�Measures�and�Outlook
� Appendix
ThyssenKrupp
Charts�on�the�1st�Quarter�2008�– 2009,�February�13,�2009 32
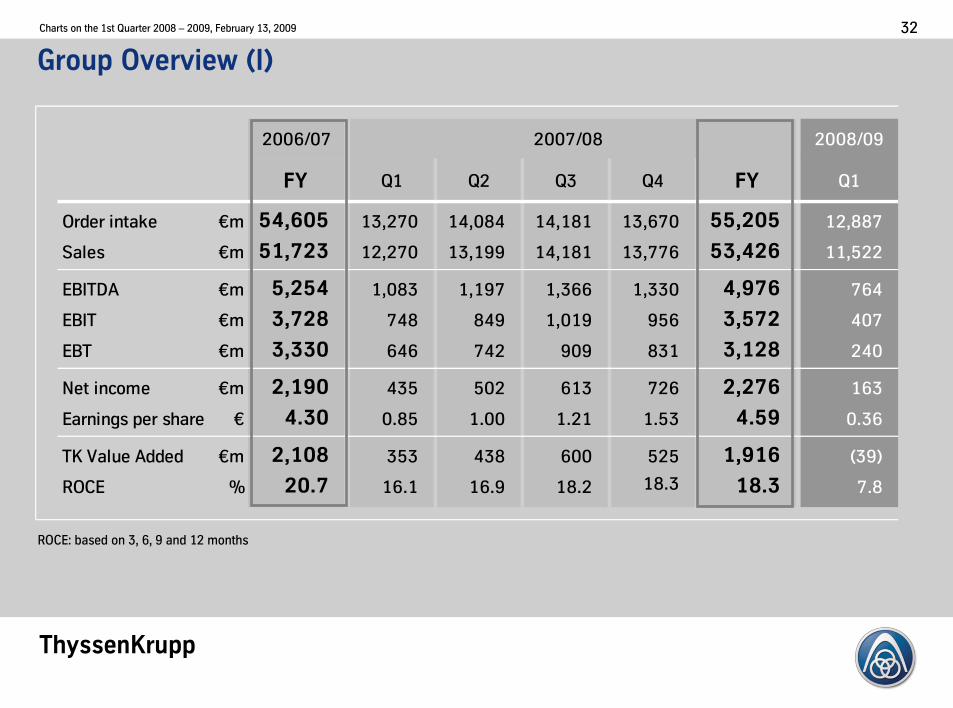
Group�Overview�9I:
2006/07 2008/09
FY Q1 Q2 Q3 Q4 FY Q1
Order�intake €m 54,605 13,270 14,084 14,181 13,670 55,205 12,887
Sales €m 51,723 12,270 13,199 14,181 13,776 53,426 11,522
EBITDA €m 5,254 1,083 1,197 1,366 1,330 4,976 764
EBIT� €m 3,728 748 849 1,019 956 3,572 407
EBT €m 3,330 646 742 909 831 3,128 240
Net�income €m 2,190 435 502 613 726 2,276 163
Earnings�per�share € 4.30 0.85 1.00 1.21 1.53 4.59 0.36
TK�Value�Added €m 2,108 353 438 600 525 1,916 5397
ROCE % 20.7 16.1 16.9 18.2 18.3 18.3 7.8
��������������������������������������2007/08
ROCE:�based�on�3,�6,�9�and�12�months
ThyssenKrupp
Charts�on�the�1st�Quarter�2008�– 2009,�February�13,�2009 33
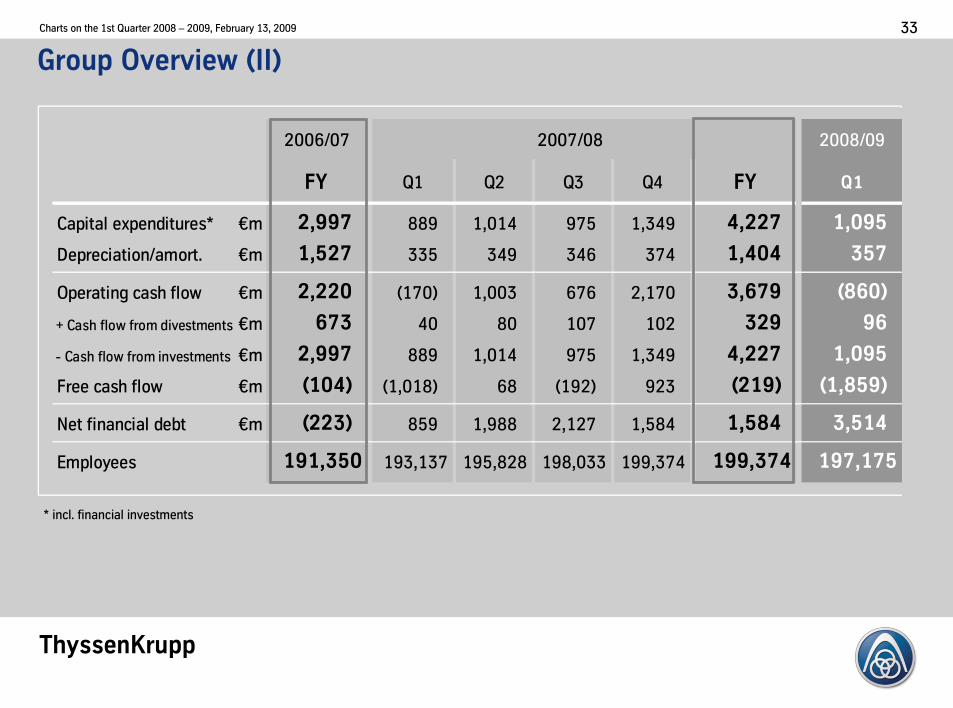
Group�Overview�9II:
2006/07 2008/09
FY Q1 Q2 Q3 Q4 FY Q1
Capital�expenditures* €m 2,997 889 1,014 975 1,349 4,227 1,095
Depreciation/amort. €m 1,527 335 349 346 374 1,404 357
Operating�cash�flow €m 2,220 51707 1,003 676 2,170 3,679 9860:
+�Cash�flow�from�divestments €m 673 40 80 107 102 329 96
-�Cash�flow�from�investments €m 2,997 889 1,014 975 1,349 4,227 1,095
Free�cash�flow €m 9104: 51,0187 68 51927 923 9219: 91,859:
Net�financial�debt €m 9223: 859 1,988 2,127 1,584 1,584 3,514
Employees� 191,350 193,137 195,828 198,033 199,374 199,374 197,175
������������������������������������2007/08
*�incl.�financial�investments
ThyssenKrupp
Charts�on�the�1st�Quarter�2008�– 2009,�February�13,�2009 34
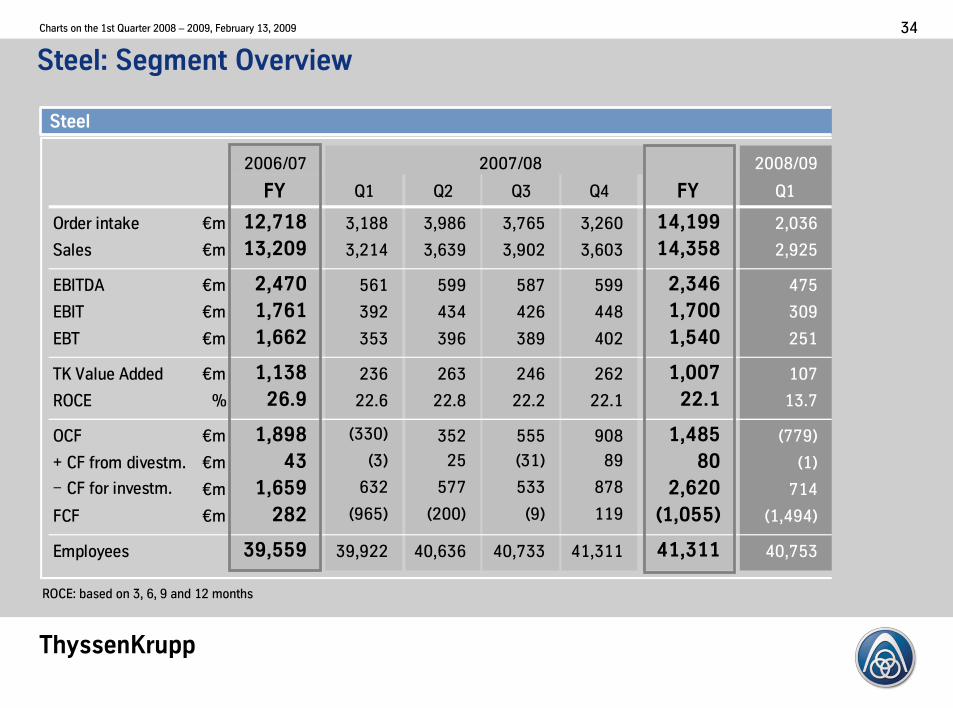
Steel:�Segment�Overview
2006/07 �����������������������������������2007/08 2008/09
FY Q1 Q2 Q3 Q4 FY Q1
Order�intake €m 12,718 3,188 3,986 3,765 3,260 14,199 2,036
Sales €m 13,209 3,214 3,639 3,902 3,603 14,358 2,925
EBITDA €m 2,470 561 599 587 599 2,346 475
EBIT� €m 1,761 392 434 426 448 1,700 309
EBT €m 1,662 353 396 389 402 1,540 251
TK�Value�Added €m 1,138 236 263 246 262 1,007 107
ROCE % 26.9 22.6 22.8 22.2 22.1 22.1 13.7
OCF €m 1,898 53307 352 555 908 1,485 57797
+�CF�from�divestm. €m 43 537 25 5317 89 80 517
−�CF�for�investm. €m 1,659 632 577 533 878 2,620 714
FCF €m 282 59657 52007 597 119 91,055: 51,4947
39,559 39,922 40,636 40,733 41,311 41,311 40,753Employees��
Steel
ROCE:�based�on�3,�6,�9�and�12�months
ThyssenKrupp
Charts�on�the�1st�Quarter�2008�– 2009,�February�13,�2009 35
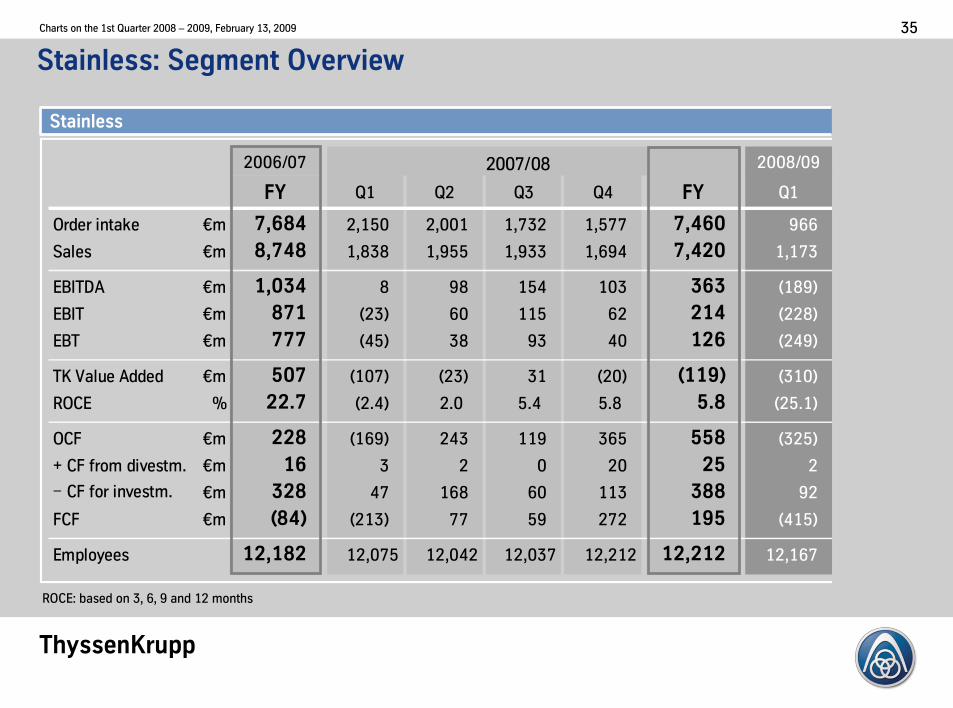
Stainless:�Segment�Overview
2006/07 ������������������������������������2007/08 2008/09
FY Q1 Q2 Q3 Q4 FY Q1
Order�intake €m 7,684 2,150 2,001 1,732 1,577 7,460 966
Sales €m 8,748 1,838 1,955 1,933 1,694 7,420 1,173
EBITDA €m 1,034 8 98 154 103 363 51897
EBIT� €m 871 5237 60 115 62 214 52287
EBT €m 777 5457 38 93 40 126 52497
TK�Value�Added €m 507 51077 5237 31 5207 9119: 53107
ROCE % 22.7 52.47 2.0 5.4 5.8 5.8 525.17
OCF €m 228 51697 243 119 365 558 53257
+�CF�from�divestm. €m 16 3 2 0 20 25 2
−�CF�for�investm. €m 328 47 168 60 113 388 92
FCF €m 984: 52137 77 59 272 195 54157
12,182 12,075 12,042 12,037 12,212 12,212 12,167Employees��
Stainless
ROCE:�based�on�3,�6,�9�and�12�months
ThyssenKrupp
Charts�on�the�1st�Quarter�2008�– 2009,�February�13,�2009 36
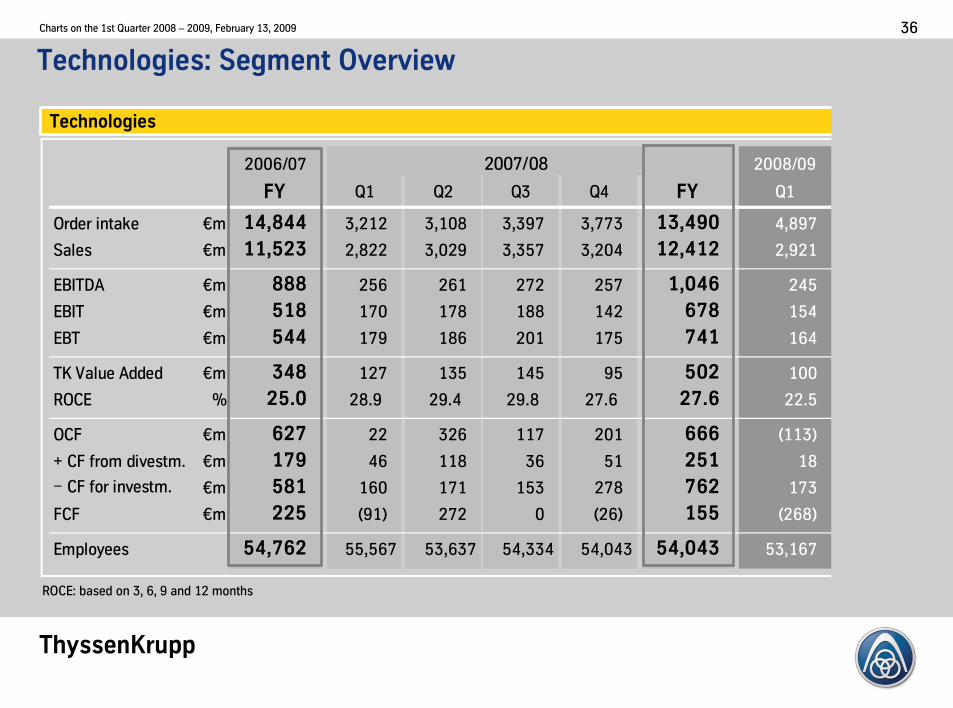
Technologies:�Segment�Overview
2006/07 ������������������������������������2007/08 2008/09
FY Q1 Q2 Q3 Q4 FY Q1
Order�intake €m 14,844 3,212 3,108 3,397 3,773 13,490 4,897
Sales €m 11,523 2,822 3,029 3,357 3,204 12,412 2,921
EBITDA €m 888 256 261 272 257 1,046 245
EBIT� €m 518 170 178 188 142 678 154
EBT €m 544 179 186 201 175 741 164
TK�Value�Added €m 348 127 135 145 95 502 100
ROCE % 25.0 28.9 29.4 29.8 27.6 27.6 22.5
OCF €m 627 22 326 117 201 666 51137
+�CF�from�divestm. €m 179 46 118 36 51 251 18
−�CF�for�investm. €m 581 160 171 153 278 762 173
FCF €m 225 5917 272 0 5267 155 52687
54,762 55,567 53,637 54,334 54,043 54,043 53,167Employees��
Technologies
ROCE:�based�on�3,�6,�9�and�12�months
ThyssenKrupp
Charts�on�the�1st�Quarter�2008�– 2009,�February�13,�2009 37
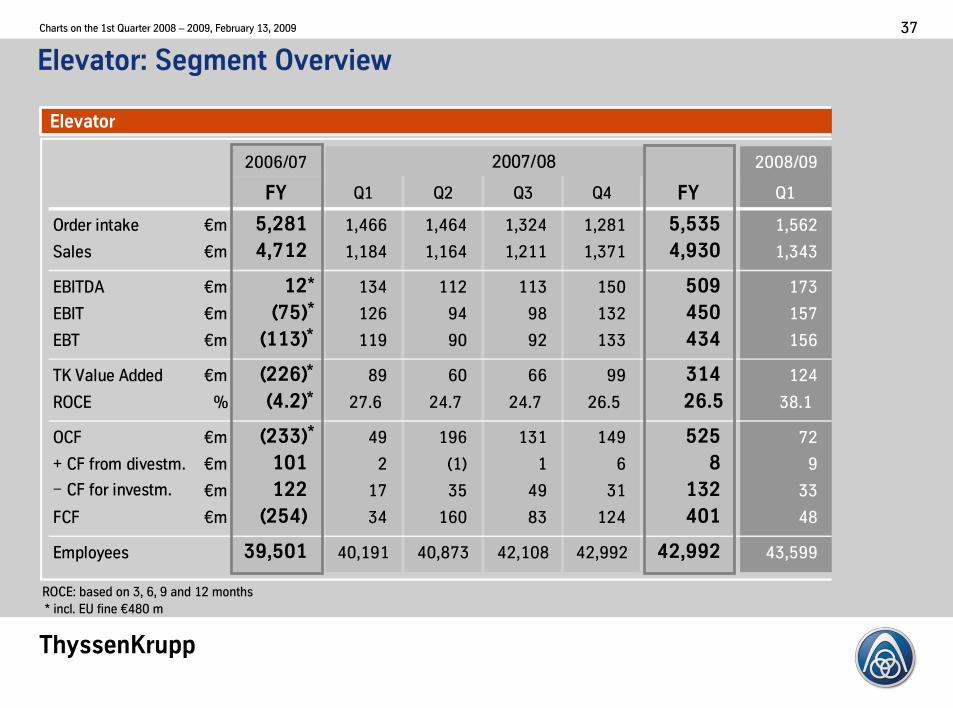
2006/07 ��������������������������������������2007/08 2008/09
FY Q1 Q2 Q3 Q4 FY Q1
Order�intake €m 5,281 1,466 1,464 1,324 1,281 5,535 1,562
Sales €m 4,712 1,184 1,164 1,211 1,371 4,930 1,343
EBITDA €m 12 134 112 113 150 509 173
EBIT� €m 975: 126 94 98 132 450 157
EBT €m 9113: 119 90 92 133 434 156
TK�Value�Added €m 9226: 89 60 66 99 314 124
ROCE % 94.2: 27.6 24.7 24.7 26.5 26.5 38.1
OCF €m 9233: 49 196 131 149 525 72
+�CF�from�divestm. €m 101 2 517 1 6 8 9
−�CF�for�investm. €m 122 17 35 49 31 132 33
FCF €m 9254: 34 160 83 124 401 48
39,501 40,191 40,873 42,108 42,992 42,992 43,599Employees��
Elevator:�Segment�Overview
*�incl.�EU�fine�€480�m
Elevator
ROCE:�based�on�3,�6,�9�and�12�months
*
*
*
*
*
*
ThyssenKrupp
Charts�on�the�1st�Quarter�2008�– 2009,�February�13,�2009 38
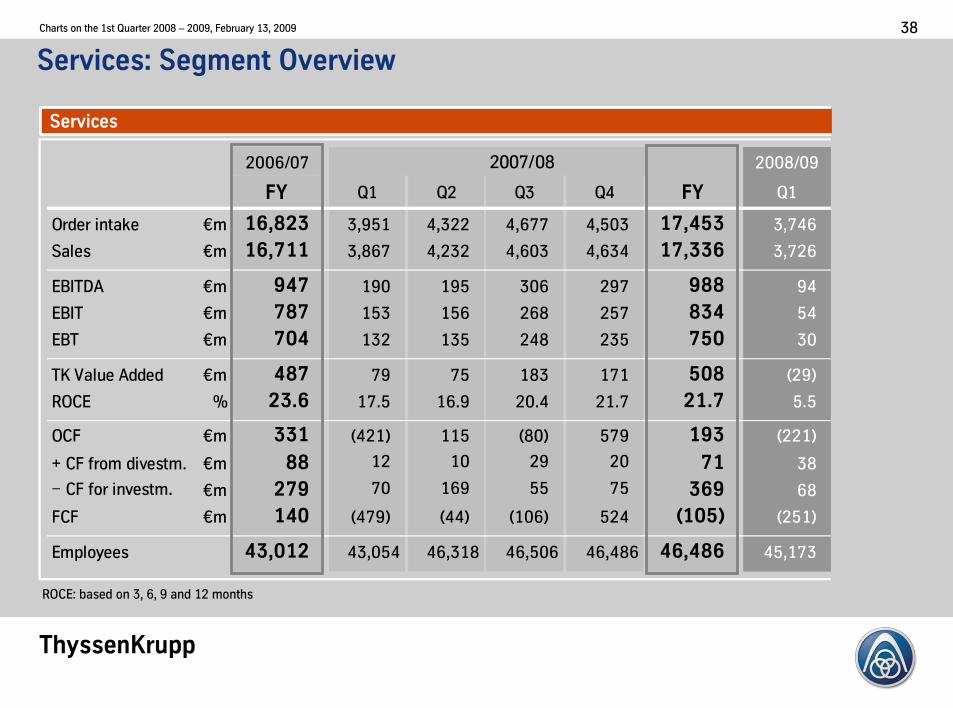
Services:�Segment�Overview
2006/07 ������������������������������������2007/08 2008/09
FY Q1 Q2 Q3 Q4 FY Q1
Order�intake €m 16,823 3,951 4,322 4,677 4,503 17,453 3,746
Sales €m 16,711 3,867 4,232 4,603 4,634 17,336 3,726
EBITDA €m 947 190 195 306 297 988 94
EBIT� €m 787 153 156 268 257 834 54
EBT €m 704 132 135 248 235 750 30
TK�Value�Added €m 487 79 75 183 171 508 5297
ROCE % 23.6 17.5 16.9 20.4 21.7 21.7 5.5
OCF €m 331 54217 115 5807 579 193 52217
+�CF�from�divestm. €m 88 12 10 29 20 71 38
−�CF�for�investm. €m 279 70 169 55 75 369 68
FCF €m 140 54797 5447 51067 524 9105: 52517
43,012 43,054 46,318 46,506 46,486 46,486 45,173Employees��
Services
ROCE:�based�on�3,�6,�9�and�12�months
ThyssenKrupp
Charts�on�the�1st�Quarter�2008�– 2009,�February�13,�2009 39
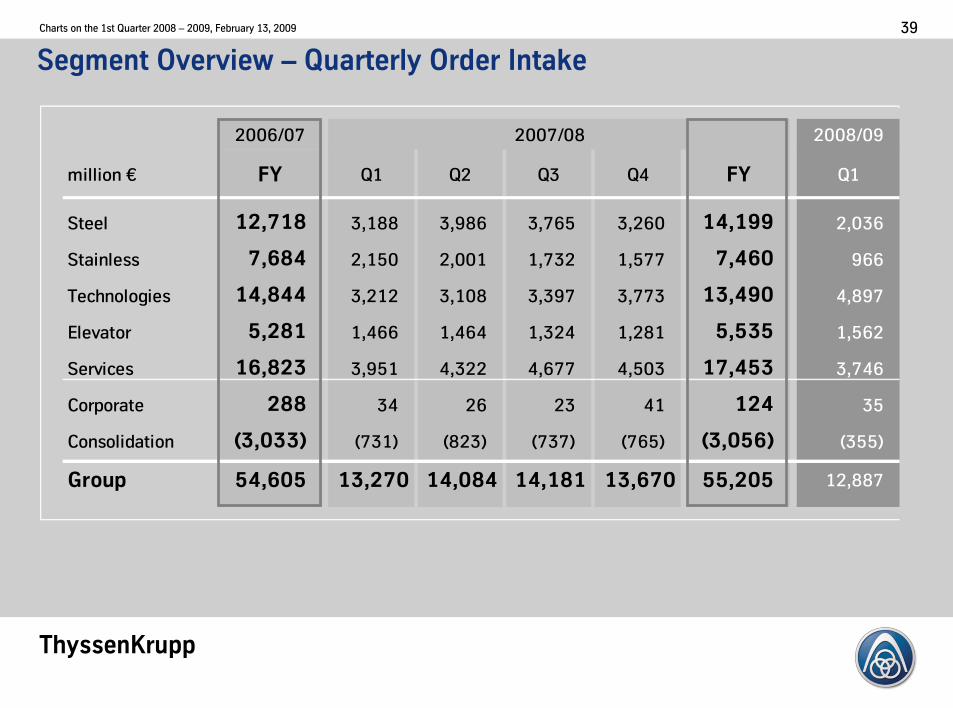
Segment�Overview�– Quarterly�Order�Intake
2006/07 2008/09
million�€ FY Q1 Q2 Q3 Q4 FY Q1
Steel 12,718 3,188 3,986 3,765 3,260 14,199 2,036
Stainless 7,684 2,150 2,001 1,732 1,577 7,460 966
Technologies 14,844 3,212 3,108 3,397 3,773 13,490 4,897
Elevator 5,281 1,466 1,464 1,324 1,281 5,535 1,562
Services 16,823 3,951 4,322 4,677 4,503 17,453 3,746
Corporate 288 34 26 23 41 124 35
Consolidation 93,033: 57317 58237 57377 57657 93,056: 53557
Group 54,605 13,270 14,084 14,181 13,670 55,205 12,887
��������������������������������������2007/08
ThyssenKrupp
Charts�on�the�1st�Quarter�2008�– 2009,�February�13,�2009 40
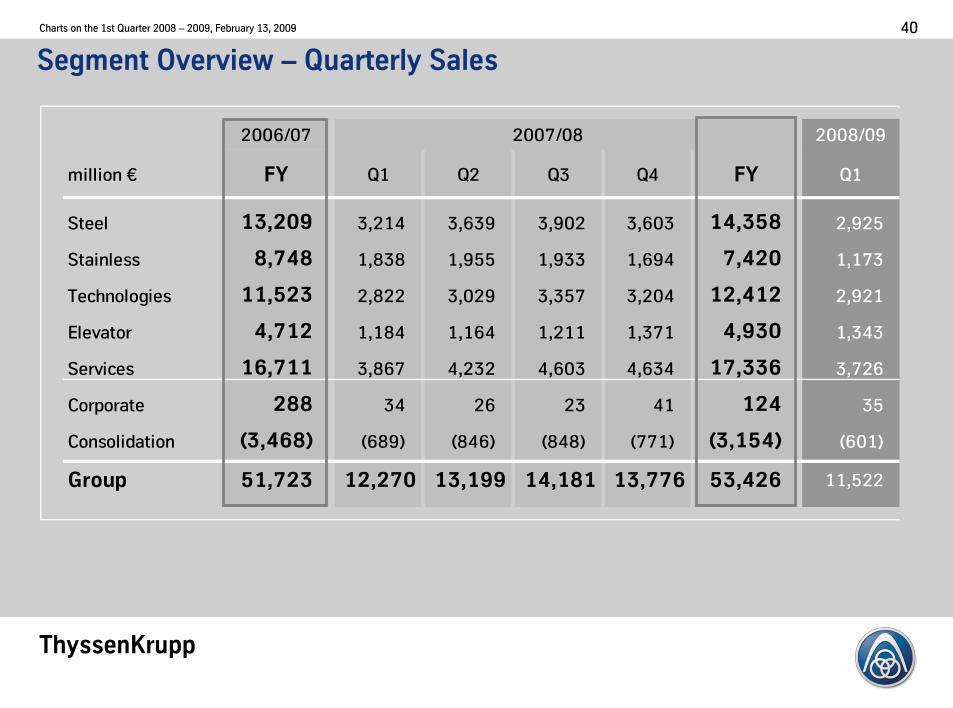
Segment�Overview�– Quarterly�Sales
2006/07 2008/09
million�€ FY Q1 Q2 Q3 Q4 FY Q1
Steel 13,209 3,214 3,639 3,902 3,603 14,358 2,925
Stainless 8,748 1,838 1,955 1,933 1,694 7,420 1,173
Technologies 11,523 2,822 3,029 3,357 3,204 12,412 2,921
Elevator 4,712 1,184 1,164 1,211 1,371 4,930 1,343
Services 16,711 3,867 4,232 4,603 4,634 17,336 3,726
Corporate 288 34 26 23 41 124 35
Consolidation 93,468: 56897 58467 58487 57717 93,154: 56017
Group 51,723 12,270 13,199 14,181 13,776 53,426 11,522
������������������������������������2007/08
ThyssenKrupp
Charts�on�the�1st�Quarter�2008�– 2009,�February�13,�2009 41
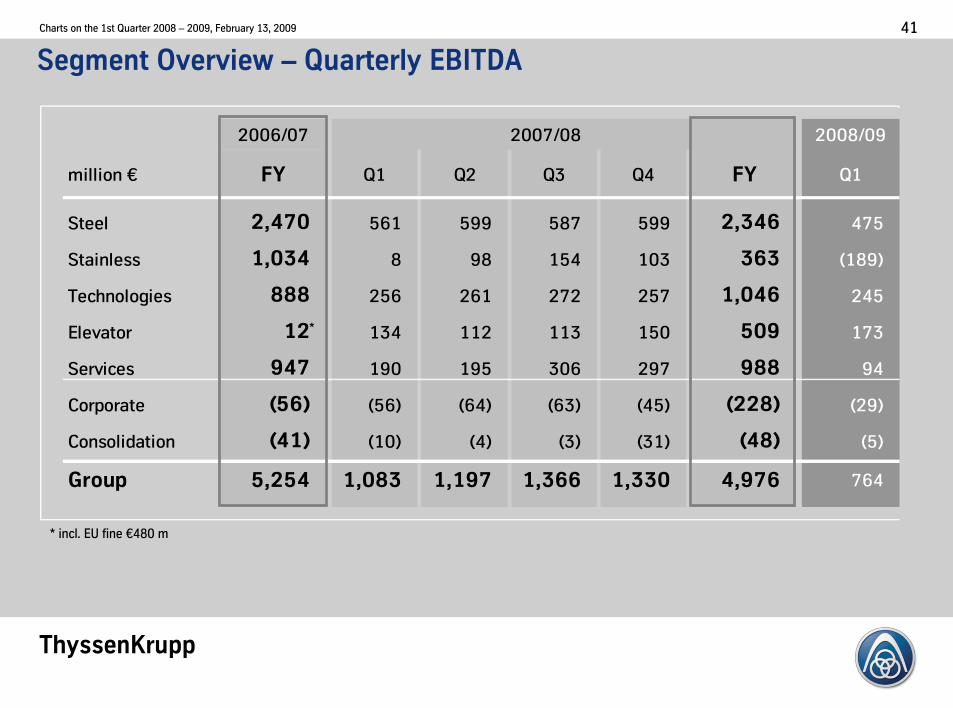
Segment�Overview�– Quarterly�EBITDA
2006/07 2008/09
million�€ FY Q1 Q2 Q3 Q4 FY Q1
Steel 2,470 561 599 587 599 2,346 475
Stainless 1,034 8 98 154 103 363 51897
Technologies 888 256 261 272 257 1,046 245
Elevator 12 134 112 113 150 509 173
Services 947 190 195 306 297 988 94
Corporate 956: 5567 5647 5637 5457 9228: 5297
Consolidation 941: 5107 547 537 5317 948: 557
Group 5,254 1,083 1,197 1,366 1,330 4,976 764
������������������������������������2007/08
*�incl.�EU�fine�€480�m
*
ThyssenKrupp
Charts�on�the�1st�Quarter�2008�– 2009,�February�13,�2009 42
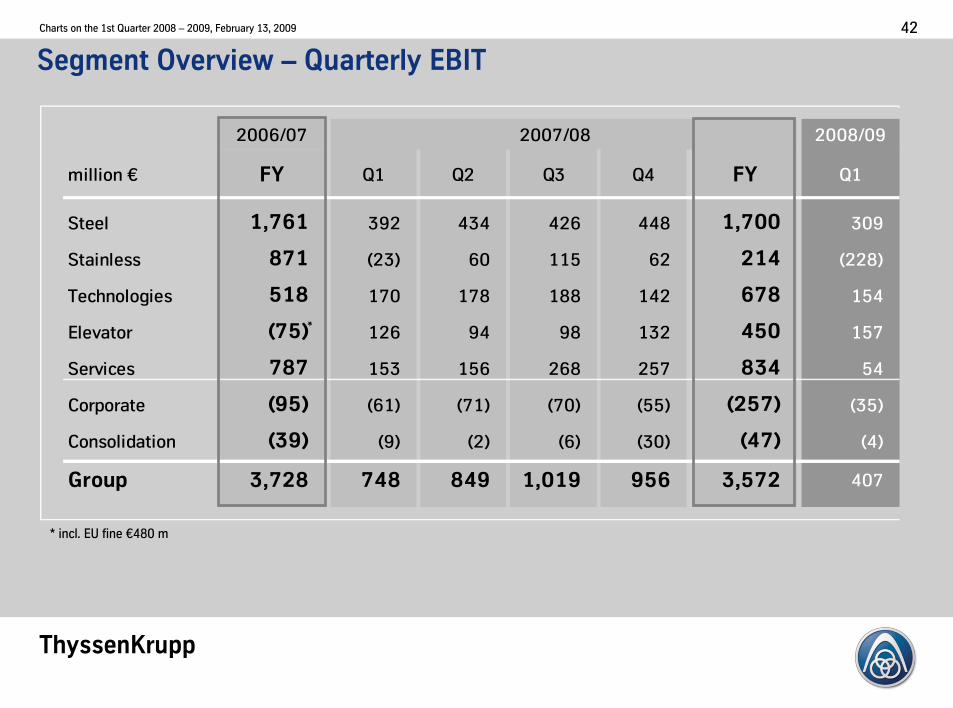
Segment�Overview�– Quarterly�EBIT
2006/07 2008/09
million�€ FY Q1 Q2 Q3 Q4 FY Q1
Steel 1,761 392 434 426 448 1,700 309
Stainless 871 5237 60 115 62 214 52287
Technologies 518 170 178 188 142 678 154
Elevator 975: 126 94 98 132 450 157
Services 787 153 156 268 257 834 54
Corporate 995: 5617 5717 5707 5557 9257: 5357
Consolidation 939: 597 527 567 5307 947: 547
Group 3,728 748 849 1,019 956 3,572 407
��������������������������������������2007/08
*�incl.�EU�fine�€480�m
*

ThyssenKrupp
Charts�on�the�1st�Quarter�2008�– 2009,�February�13,�2009 43
Segment�Overview�– Quarterly�EBT
2006/07 2008/09
million�€ FY Q1 Q2 Q3 Q4 FY Q1
Steel 1,662 353 396 389 402 1,540 251
Stainless 777 5457 38 93 40 126 52497
Technologies 544 179 186 201 175 741 164
Elevator 9113: 119 90 92 133 434 156
Services 704 132 135 248 235 750 30
Corporate 9205: 5847 5977 51107 51267 9417: 51087
Consolidation 939: 587 567 547 5287 946: 547
Group 3,330 646 742 909 831 3,128 240
��������������������������������������2007/08
*�incl.�EU�fine�€480�m
*
ThyssenKrupp
Charts�on�the�1st�Quarter�2008�– 2009,�February�13,�2009 44
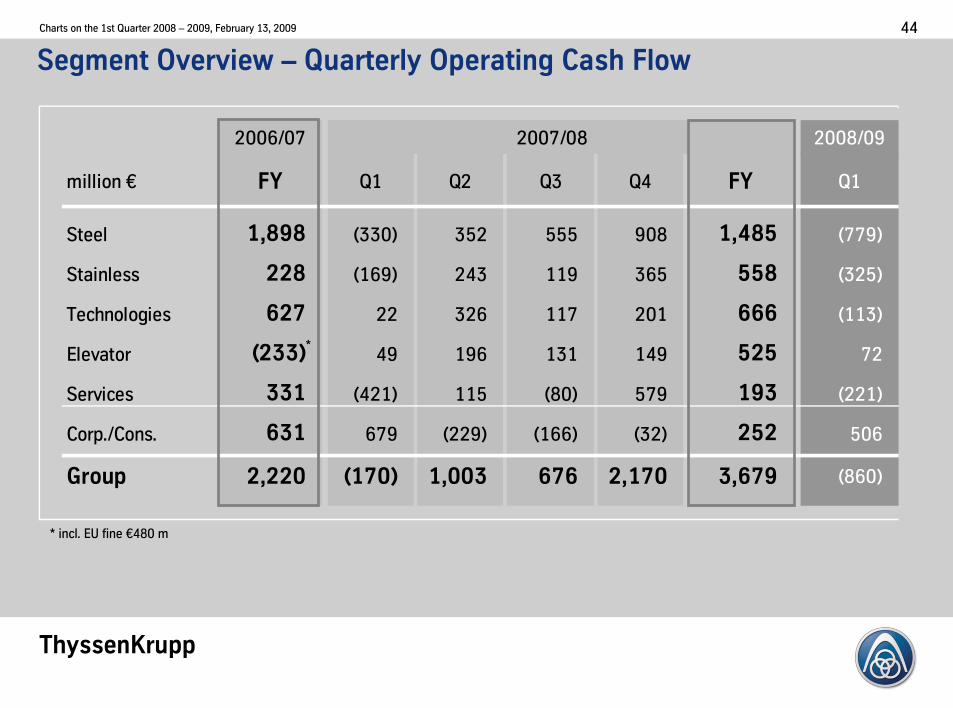
Segment�Overview�– Quarterly�Operating�Cash�Flow
2006/07 2008/09
million�€ FY Q1 Q2 Q3 Q4 FY Q1
Steel 1,898 53307 352 555 908 1,485 57797
Stainless 228 51697 243 119 365 558 53257
Technologies 627 22 326 117 201 666 51137
Elevator 9233: 49 196 131 149 525 72
Services 331 54217 115 5807 579 193 52217
Corp./Cons. 631 679 52297 51667 5327 252 506
Group 2,220 9170: 1,003 676 2,170 3,679 58607
��������������������������������������2007/08
*�incl.�EU�fine�€480�m
*
ThyssenKrupp
Charts�on�the�1st�Quarter�2008�– 2009,�February�13,�2009 45
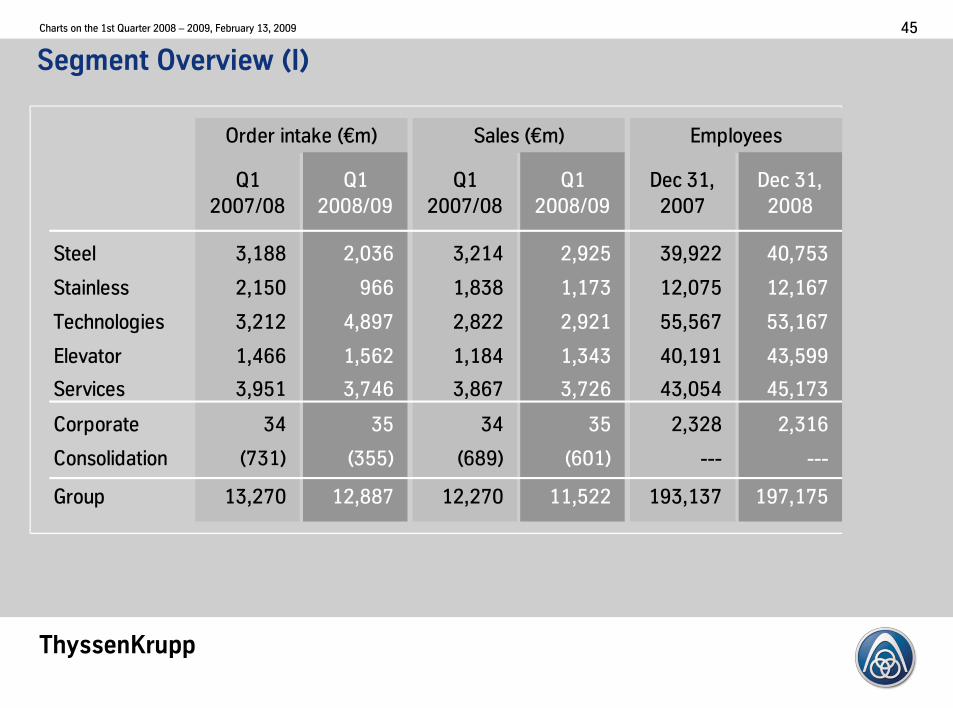
Segment�Overview�9I:
Q1�
2007/08
Q1�
2008/09
Q1�
2007/08
Q1�
2008/09
Dec�31,�
2007
Dec�31,�
2008
Steel 3,188 2,036 3,214 2,925 39,922 40,753
Stainless 2,150 966 1,838 1,173 12,075 12,167
Technologies 3,212 4,897 2,822 2,921 55,567 53,167
Elevator 1,466 1,562 1,184 1,343 40,191 43,599
Services 3,951 3,746 3,867 3,726 43,054 45,173
Corporate 34 35 34 35 2,328 2,316
Consolidation 57317 53557 56897 56017 --- ---
Group 13,270 12,887 12,270 11,522 193,137 197,175
Order�intake�5€m7 Sales�5€m7 Employees
ThyssenKrupp
Charts�on�the�1st�Quarter�2008�– 2009,�February�13,�2009 46
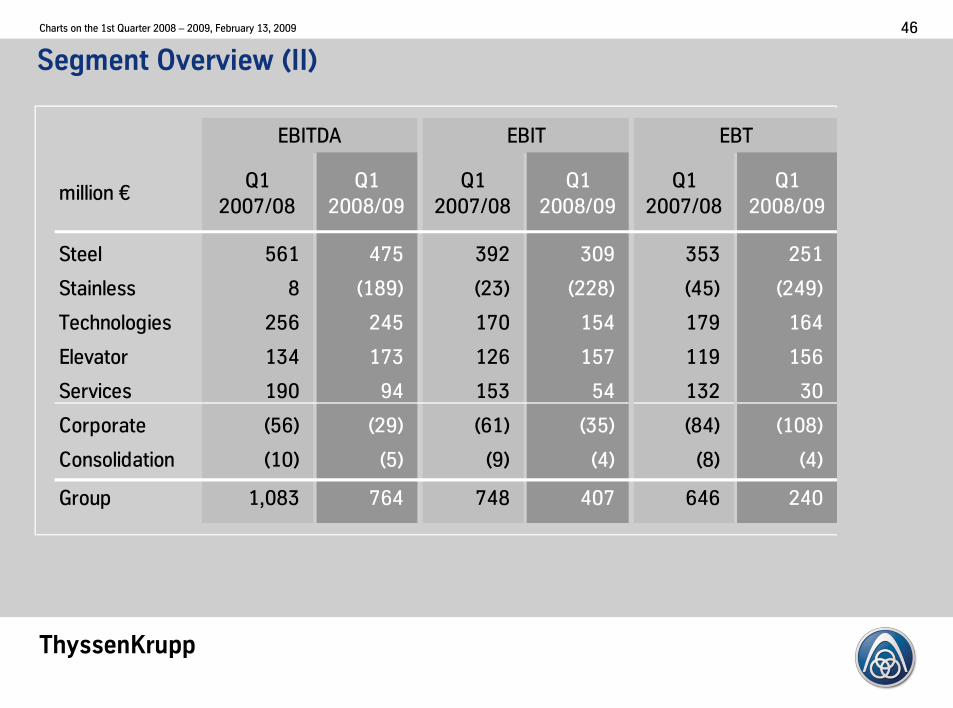
Segment�Overview�9II:
million�€Q1�
2007/08
Q1�
2008/09
Q1�
2007/08
Q1�
2008/09
Q1�
2007/08
Q1�
2008/09
Steel 561 475 392 309 353 251
Stainless 8 51897 5237 52287 5457 52497
Technologies 256 245 170 154 179 164
Elevator 134 173 126 157 119 156
Services 190 94 153 54 132 30
Corporate 5567 5297 5617 5357 5847 51087
Consolidation 5107 557 597 547 587 547
Group 1,083 764 748 407 646 240
EBITDA EBIT EBT
ThyssenKrupp
Charts�on�the�1st�Quarter�2008�– 2009,�February�13,�2009 47
Disclaimer�ThyssenKrupp�AG
“The�information�set�forth�and�included�in�this�presentation�is�not�provided�in�connection�with�an�offer�or�solicitation�for�the�purchase�
or�sale�of�a�security�and�is�intended�for�informational�purposes only.
This�presentation�contains�forward-looking�statements�that�are�subject�to�risks�and�uncertainties.� Statements�contained�herein�that�
are�not�statements�of�historical�fact�may�be�deemed�to�be�forward-looking�information.��When�we�use�words�such�as�“plan,” “believe,”
“expect,” “anticipate,” “intend,” “estimate,” “may” or�similar�expressions,�we�are�making�forward-looking�statements.��You�should�not�
rely�on�forward-looking�statements�because�they�are�subject�to�a�number�of�assumptions�concerning�future�events,�and�are�subject�to�
a�number�of�uncertainties�and�other�factors,�many�of�which�are�outside�of�our�control,�that�could�cause�actual�results�to�differ
materially�from�those�indicated.��These�factors�include,�but�are not�limited�to,�the�following:
5i7�market�risks:�principally�economic�price�and�volume�developments,�
5ii7�dependence�on�performance�of�major�customers�and�industries,�
5iii7�our�level�of�debt,�management�of�interest�rate�risk�and�hedging�against�commodity�price�risks;
5iv7�costs�associated�with,�and�regulation�relating�to,�our�pension�liabilities�and�healthcare�measures,�
5v7�environmental�protection�and�remediation�of�real�estate�and�associated�with�rising�standards�for�real�estate�environmental�
protection,�
5vi7�volatility�of�steel�prices�and�dependence�on�the�automotive industry,�
5vii7�availability�of�raw�materials;�
5viii7�inflation,�interest�rate�levels�and�fluctuations�in�exchange�rates;�
5ix7�general�economic,�political�and�business�conditions�and�existing�and�future�governmental�regulation;�and��
5x7�the�effects�of�competition.��
Please�note�that�we�disclaim�any�intention�or�obligation�to�update�or�revise�any�forward-looking�statements�whether�as�a�result�of�new�
information,�future�events�or�otherwise.”