tiger brochure 06-12-2010 - ministry of environment, · pdf file · 2013-06-0726...
TRANSCRIPT
Ministry of Environment and ForestsGOVERNMENT OF INDIA
INDIA TIGER ESTIMATE 2010
MARCH 2011
Nati
onal Tiger Conservation Authority
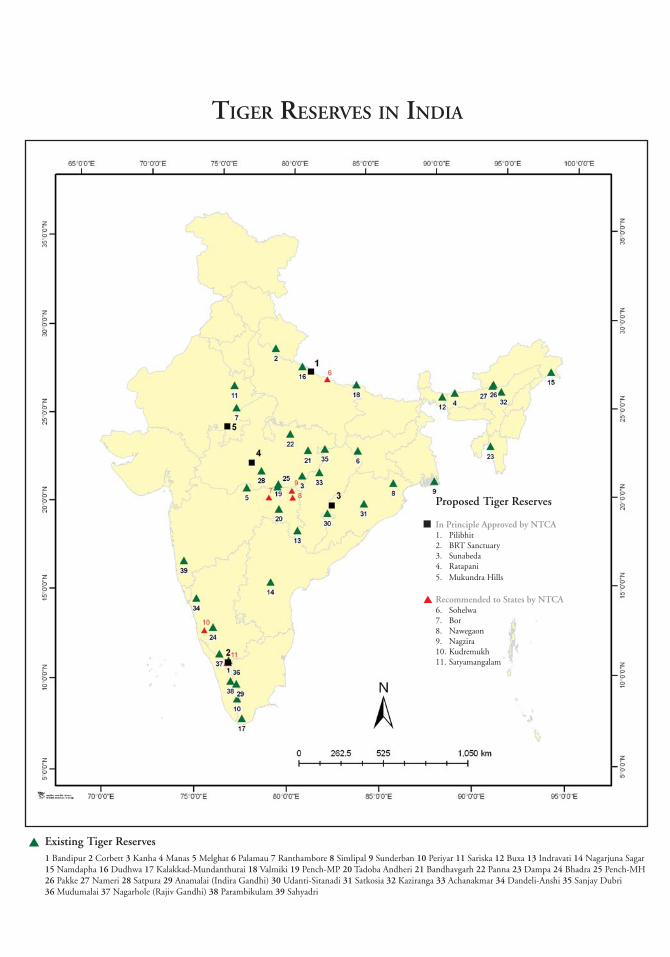
TIGER RESERVES IN INDIA
Proposed Tiger Reserves
In Principle Approved by NTCA1. Pilibhit2. BRT Sanctuary3. Sunabeda4. Ratapani5. Mukundra Hills
Recommended to States by NTCA6. Sohelwa7. Bor8. Nawegaon9. Nagzira10. Kudremukh11. Satyamangalam
Existing Tiger Reserves1 Bandipur 2 Corbett 3 Kanha 4 Manas 5 Melghat 6 Palamau 7 Ranthambore 8 Simlipal 9 Sunderban 10 Periyar 11 Sariska 12 Buxa 13 Indravati 14 Nagarjuna Sagar15 Namdapha 16 Dudhwa 17 Kalakkad-Mundanthurai 18 Valmiki 19 Pench-MP 20 Tadoba Andheri 21 Bandhavgarh 22 Panna 23 Dampa 24 Bhadra 25 Pench-MH26 Pakke 27 Nameri 28 Satpura 29 Anamalai (Indira Gandhi) 30 Udanti-Sitanadi 31 Satkosia 32 Kaziranga 33 Achanakmar 34 Dandeli-Anshi 35 Sanjay Dubri36 Mudumalai 37 Nagarhole (Rajiv Gandhi) 38 Parambikulam 39 Sahyadri
CONTENTS
FOREWORD
I. WHY SHOULD WE SAVE THE TIGER? - 3
II. 2010 ASSESSMENT METHODOLOGY - 4
III. SALIENT FEATURES OF 2010 ASSESSMENT - 5
IV. TIGER POPULATION ESTIMATES - 6
V. INNOVATIONS IN 2010 NATIONAL TIGER ASSESSMENT - 7
VI. NEW FINDINGS OF 2010 NATIONAL TIGER ASSESSMENT - 8
VII. A FINAL WORD - 9

FOREWORD
Conserving the tiger is our national imperative. By doing so, we save not only a magnifi cent species and our national animal, but we also end up protecting and regenerating our forest ecosystems and its tremendous wealth of biodiversity.
Monitoring tiger populations is a crucial component of evaluating the effi cacy of our tiger conservation efforts, launched under the personal leadership of Shrimati Indira Gandhi in April 1973. I am pleased therefore to introduce to you this booklet containing the results of the All India Tiger Estimation exercise for the year 2010. The National Tiger Conservation Authority and independent technical experts and institutions have evaluated the population status of tigers in all the tiger reserve states using robust scientifi c techniques. This booklet is a summary and concise presentation in an easy-to-understand and visually appealing format.
The entire survey and research work that has gone into the 2010 estimation will soon be put into the public domain.
Jairam RameshMinister of State (Independent Charge)Environment & ForestsGovernment of India
28th March, 2011
2
3
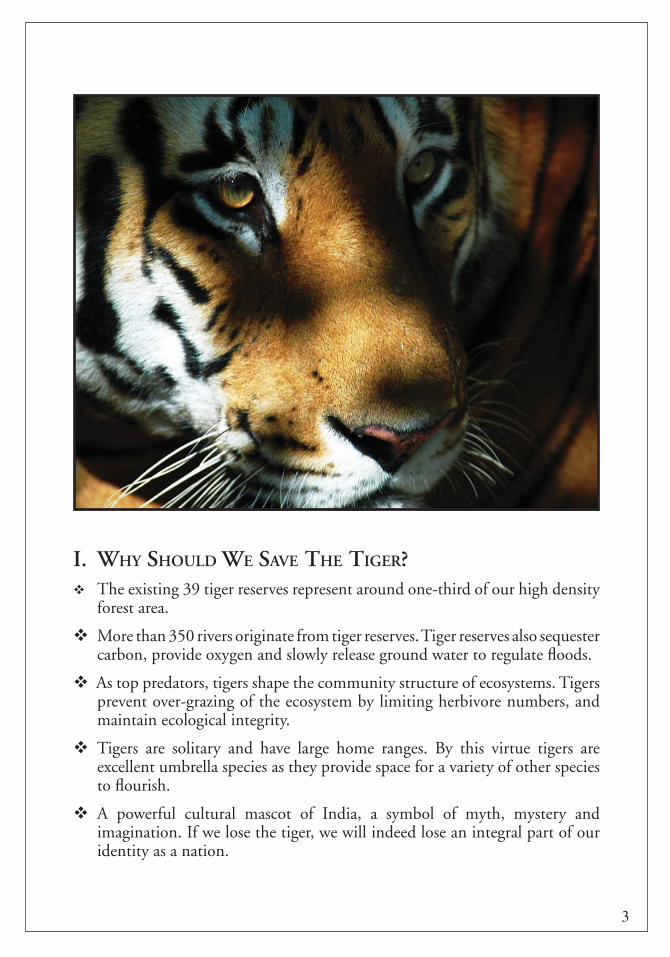
I. WHY SHOULD WE SAVE THE TIGER?� The existing 39 tiger reserves represent around one-third of our high density
forest area.
� More than 350 rivers originate from tiger reserves. Tiger reserves also sequester carbon, provide oxygen and slowly release ground water to regulate fl oods.
� As top predators, tigers shape the community structure of ecosystems. Tigers prevent over-grazing of the ecosystem by limiting herbivore numbers, and maintain ecological integrity.
� Tigers are solitary and have large home ranges. By this virtue tigers are excellent umbrella species as they provide space for a variety of other species to fl ourish.
� A powerful cultural mascot of India, a symbol of myth, mystery and imagination. If we lose the tiger, we will indeed lose an integral part of our identity as a nation.
4
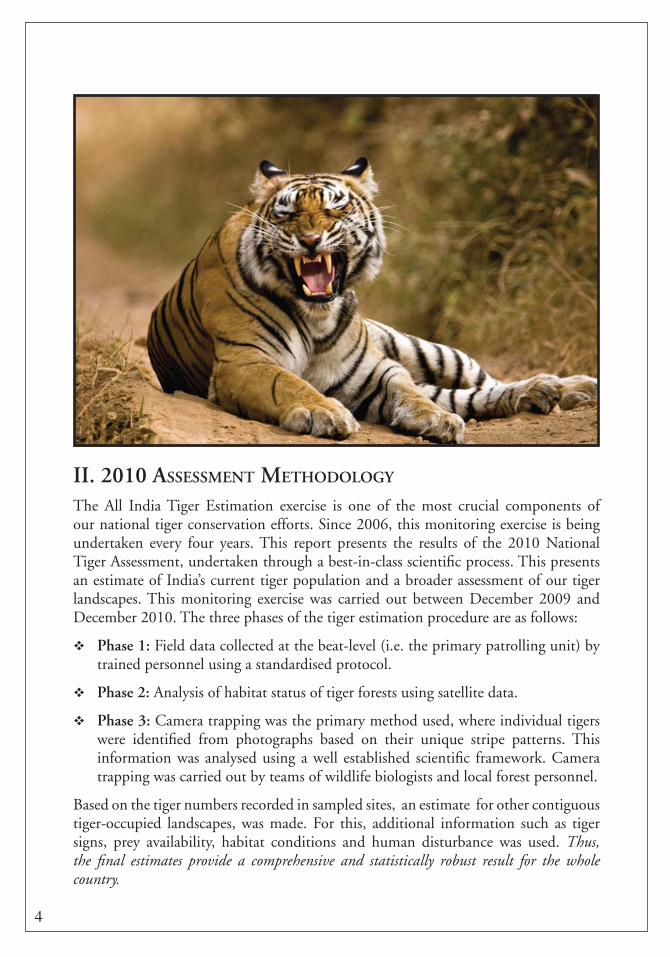
II. 2010 ASSESSMENT METHODOLOGY
The All India Tiger Estimation exercise is one of the most crucial components of our national tiger conservation efforts. Since 2006, this monitoring exercise is being undertaken every four years. This report presents the results of the 2010 National Tiger Assessment, undertaken through a best-in-class scientifi c process. This presents an estimate of India’s current tiger population and a broader assessment of our tiger landscapes. This monitoring exercise was carried out between December 2009 and December 2010. The three phases of the tiger estimation procedure are as follows:
� Phase 1: Field data collected at the beat-level (i.e. the primary patrolling unit) by trained personnel using a standardised protocol.
� Phase 2: Analysis of habitat status of tiger forests using satellite data.
� Phase 3: Camera trapping was the primary method used, where individual tigers were identifi ed from photographs based on their unique stripe patterns. This information was analysed using a well established scientifi c framework. Camera trapping was carried out by teams of wildlife biologists and local forest personnel.
Based on the tiger numbers recorded in sampled sites, an estimate for other contiguous tiger-occupied landscapes, was made. For this, additional information such as tiger signs, prey availability, habitat conditions and human disturbance was used. Thus, the fi nal estimates provide a comprehensive and statistically robust result for the whole country.
5
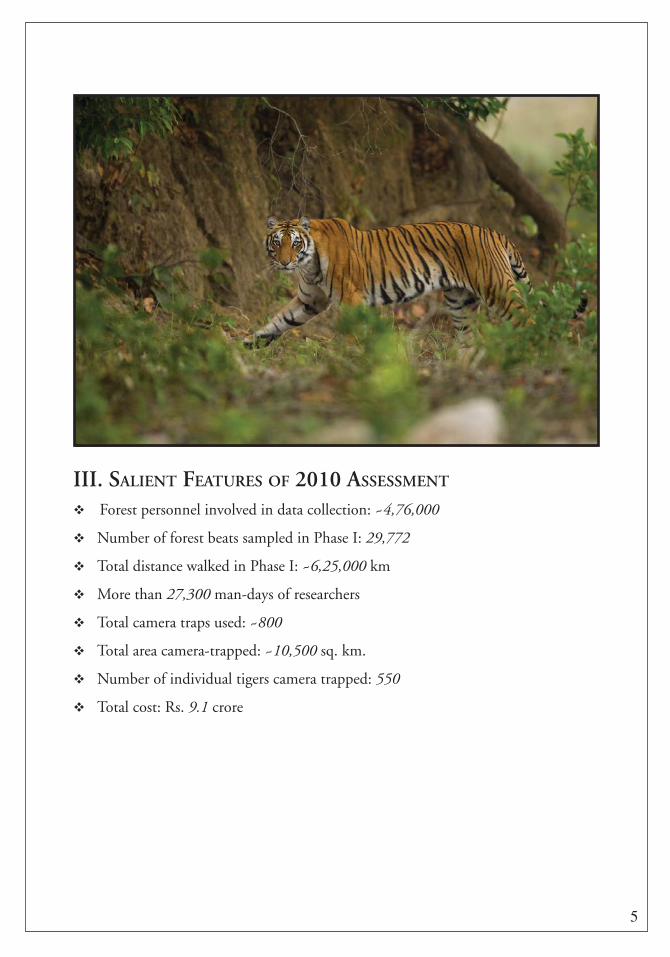
III. SALIENT FEATURES OF 2010 ASSESSMENT
� Forest personnel involved in data collection: ~4,76,000
� Number of forest beats sampled in Phase I: 29,772
� Total distance walked in Phase I: ~6,25,000 km
� More than 27,300 man-days of researchers
� Total camera traps used: ~800
� Total area camera-trapped: ~10,500 sq. km.
� Number of individual tigers camera trapped: 550
� Total cost: Rs. 9.1 crore
6
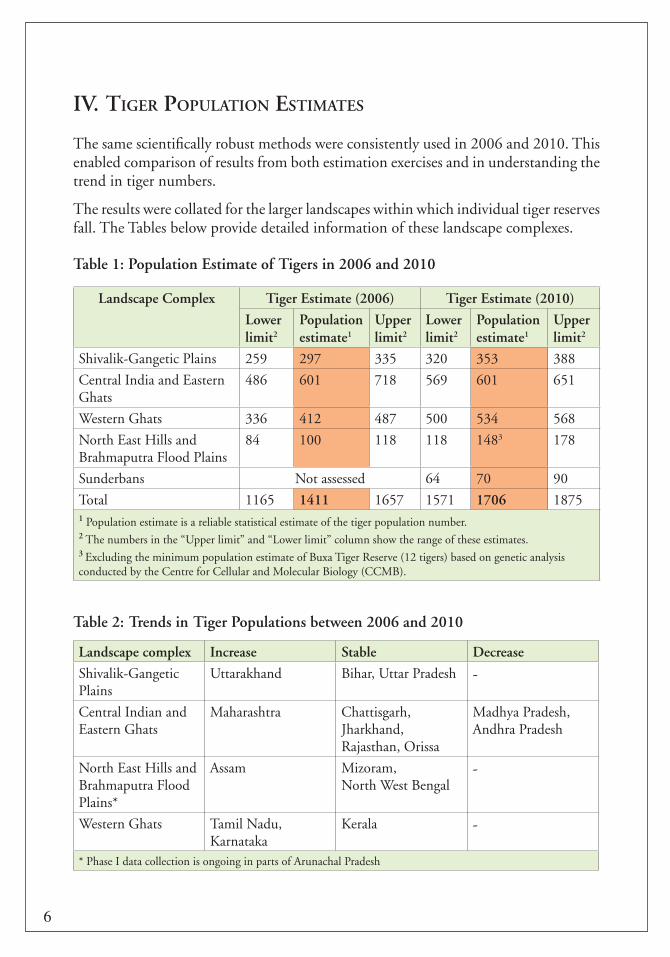
IV. TIGER POPULATION ESTIMATES
The same scientifi cally robust methods were consistently used in 2006 and 2010. This enabled comparison of results from both estimation exercises and in understanding the trend in tiger numbers.
The results were collated for the larger landscapes within which individual tiger reserves fall. The Tables below provide detailed information of these landscape complexes.
Table 1: Population Estimate of Tigers in 2006 and 2010
Landscape Complex Tiger Estimate (2006) Tiger Estimate (2010)
Lower limit2
Population estimate1
Upper limit2
Lower limit2
Population estimate1
Upper limit2
Shivalik-Gangetic Plains 259 297 335 320 353 388
Central India and Eastern Ghats
486 601 718 569 601 651
Western Ghats 336 412 487 500 534 568
North East Hills and Brahmaputra Flood Plains
84 100 118 118 1483 178
Sunderbans Not assessed 64 70 90
Total 1165 1411 1657 1571 1706 18751 Population estimate is a reliable statistical estimate of the tiger population number.2 The numbers in the “Upper limit” and “Lower limit” column show the range of these estimates. 3 Excluding the minimum population estimate of Buxa Tiger Reserve (12 tigers) based on genetic analysis conducted by the Centre for Cellular and Molecular Biology (CCMB).
Table 2: Trends in Tiger Populations between 2006 and 2010
Landscape complex Increase Stable Decrease
Shivalik-Gangetic Plains
Uttarakhand Bihar, Uttar Pradesh -
Central Indian and Eastern Ghats
Maharashtra Chattisgarh, Jharkhand, Rajasthan, Orissa
Madhya Pradesh, Andhra Pradesh
North East Hills and Brahmaputra Flood Plains*
Assam Mizoram, North West Bengal
-
Western Ghats Tamil Nadu, Karnataka
Kerala -
* Phase I data collection is ongoing in parts of Arunachal Pradesh

7
V. INNOVATIONS IN 2010 NATIONAL TIGER ASSESSMENT
The 2010 National Tiger Assessment has several innovations over previous assessments. These include:
� Partnerships with civil society organizations such as Wildlife Trust of India, Aaranyak, and World Wildlife Fund for Nature-India. Additional technical expertise from Centre for Cellular and Molecular Biology (CCMB).
� Local communities involved in data collection and analysis.
� Genetic analysis to estimate tiger populations from faecal samples.
� Along with tigers, co-predators, prey, and habitat quality assessed.
� Pioneering attempt to estimate tiger populations in Sunderbans Tiger Reserve (West Bengal) using satellite telemetry and sign surveys.
� First estimation of tiger population in Sahyadri Tiger Reserve (Maharashtra).
8
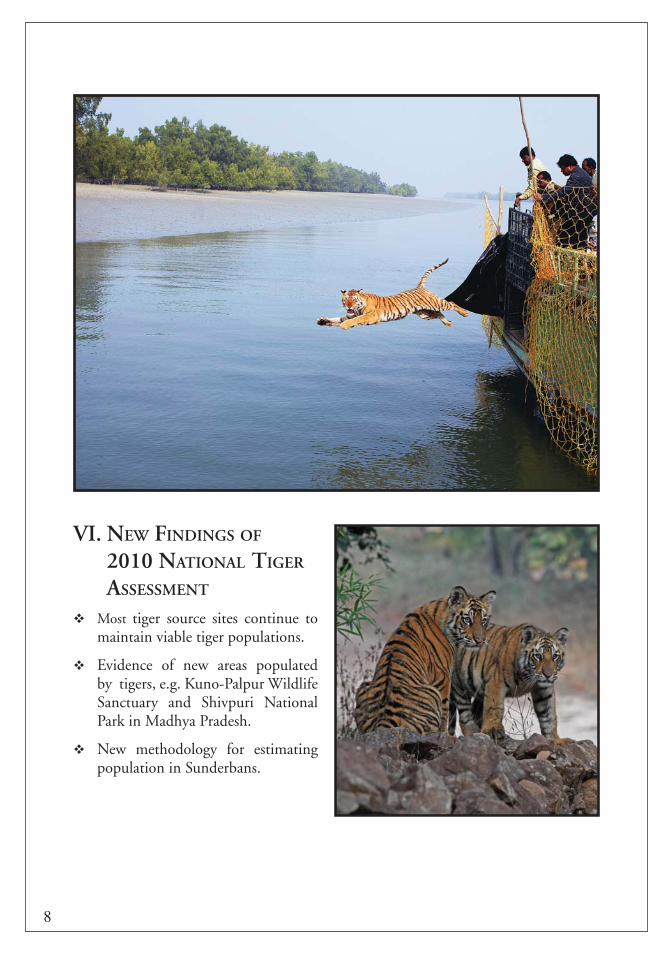
VI. NEW FINDINGS OF 2010 NATIONAL TIGER ASSESSMENT
� Most tiger source sites continue to maintain viable tiger populations.
� Evidence of new areas populated by tigers, e.g. Kuno-Palpur Wildlife Sanctuary and Shivpuri National Park in Madhya Pradesh.
� New methodology for estimating population in Sunderbans.
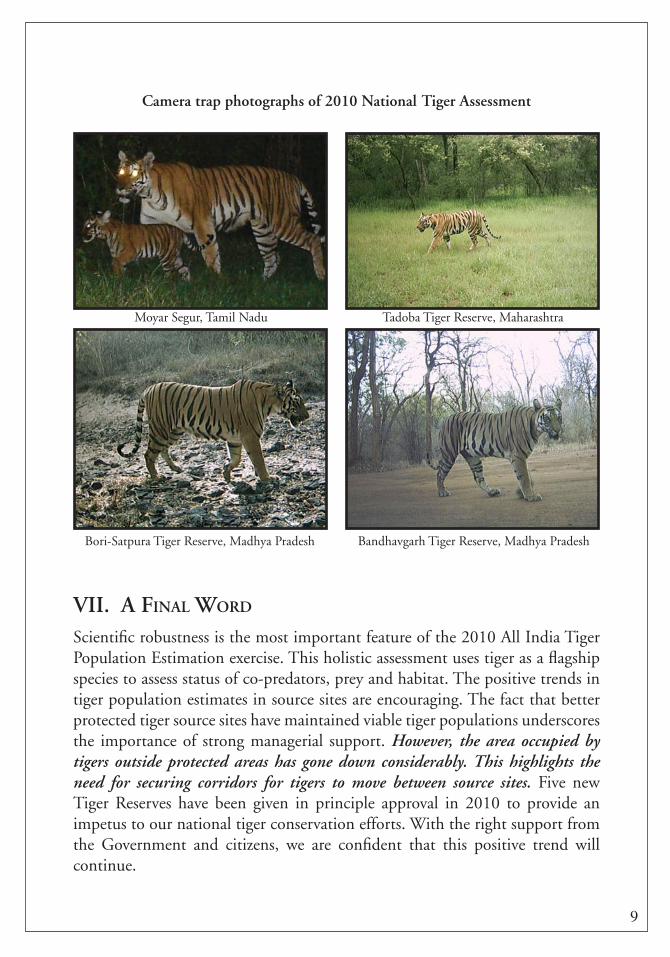
VII. A FINAL WORD
Scientifi c robustness is the most important feature of the 2010 All India Tiger Population Estimation exercise. This holistic assessment uses tiger as a fl agship species to assess status of co-predators, prey and habitat. The positive trends in tiger population estimates in source sites are encouraging. The fact that better protected tiger source sites have maintained viable tiger populations underscores the importance of strong managerial support. However, the area occupied by tigers outside protected areas has gone down considerably. This highlights the need for securing corridors for tigers to move between source sites. Five new Tiger Reserves have been given in principle approval in 2010 to provide an impetus to our national tiger conservation efforts. With the right support from the Government and citizens, we are confi dent that this positive trend will continue.
9
Bandhavgarh Tiger Reserve, Madhya PradeshBori-Satpura Tiger Reserve, Madhya Pradesh
Moyar Segur, Tamil Nadu Tadoba Tiger Reserve, Maharashtra
Camera trap photographs of 2010 National Tiger Assessment
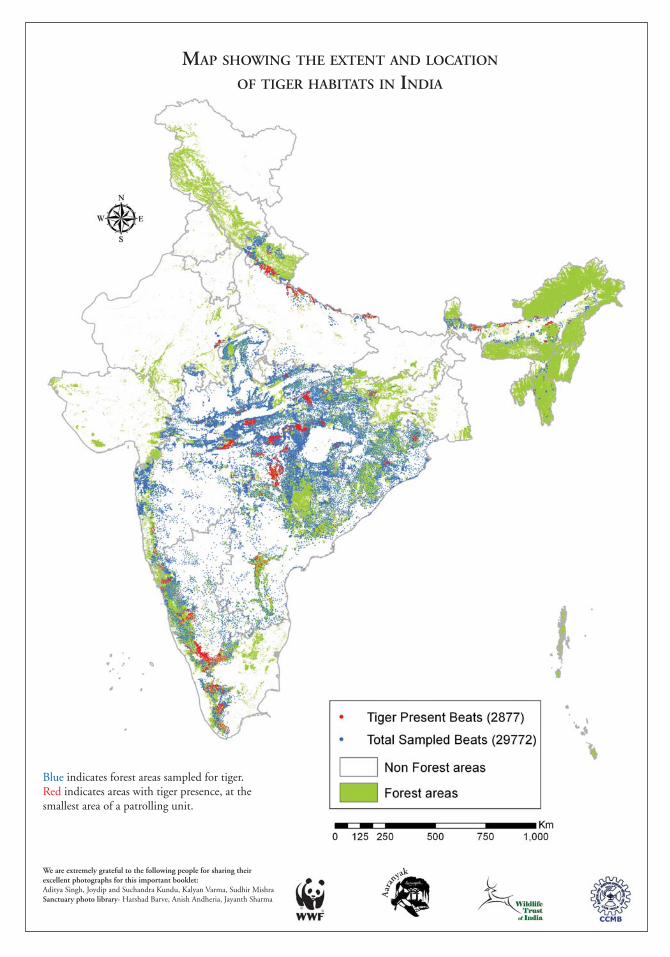
MAP SHOWING THE EXTENT AND LOCATION
OF TIGER HABITATS IN INDIA
Blue indicates forest areas sampled for tiger. Red indicates areas with tiger presence, at the smallest area of a patrolling unit.
Aar
anyakWe are extremely grateful to the following people for sharing their
excellent photographs for this important booklet:Aditya Singh, Joydip and Suchandra Kundu, Kalyan Varma, Sudhir Mishra Sanctuary photo library- Harshad Barve, Anish Andheria, Jayanth Sharma