tim 3'q16 results
TRANSCRIPT

1
Flavio Cattaneo – Piergiorgio Peluso
TELECOM ITALIA GROUP
3Q’16 Results
Rome – November 7, 2016
3Q’16 Update

2
Safe Harbour
Telecom Italia Group Results - 3Q’16
This presentation contains statements that constitute forward looking statements within the meaning of the Private Securities Litigation Reform Act of 1995. These statements appear in a number of places in this presentation and include statements regarding the intent, belief or current expectations of estimates regarding future growth in the different business lines and the global business, financial results and other aspects of the activities and situation relating to the Telecom Italia Group. Such forward looking statements are not guarantees of future performance and involve risks and uncertainties, and actual results may differ materially from those projected or implied in the forward looking statements as a result of various factors. Consequently, Telecom Italia makes no representation, whether expressed or implied, as to the conformity of the actual results with those projected in the forward looking statements. Forward-looking information is based on certain key assumptions which we believe to be reasonable as of the date hereof, but forward looking information by its nature involves risks and uncertainties, which are outside our control, and could significantly affect expected results. Analysts and investors are cautioned not to place undue reliance on those forward looking statements, which speak only as of the date of this presentation. Telecom Italia undertakes no obligation to release publicly the results of any revisions to these forward looking statements which may be made to reflect events and circumstances after the date of this presentation, including, without limitation, changes in Telecom Italia business or acquisition strategy or planned capital expenditures or to reflect the occurrence of unanticipated events. Analysts and investors should consult the Company's Annual Report on Form 20-F as well as periodic filings made on Form 6-K, which are on file with the United States Securities and Exchange Commission which may identify factors that affect the forward looking statements included herein. The financial and operating data, with the exception of some data, have been extracted or derived from the Condensed Consolidated Financial Statements as of and for the nine months ended 30 September 2016 which have been prepared in accordance with International Financial Reporting Standards issued by the International Accounting Standards Board and endorsed by the European Union (designated as IFRS). Such interim financial statements are unaudited. The accounting policies adopted in the preparation of the Condensed Consolidated Financial Statements as of and for the nine months ended 30 September 2016 have been applied on a basis consistent with those adopted in the Annual Consolidated Financial Statements at 31 December 2015, to which reference should be made, except for the new standards and interpretations adopted by the Telecom Italia Group starting from 1 January 2016 which had no effects on the Condensed Consolidated Financial Statements as of and for the nine months ended 30 September 2016. Within the Brazil Business Unit, TIM Brasil's Management recently identified that incorrect accounting entries were made in prior years in connection with the recognition of service revenue from the sale of prepaid traffic. Such incorrect accounting entries, resulted in the early recognition of revenues and consequently the underestimation of deferred revenue liabilities for prepaid traffic not yet consumed. The incorrect accounting entries did not have any impact either in terms of net financial position nor on cash and cash equivalents. In light of the above, the comparative financial information as of 31 December 2015 and for the three-month and nine-month periods ended 30 September 2015 have been revised, segment information included. Furthermore, such revision did not have any material impact on the consolidated income statement of the three-month and nine-month periods ended 30 September 2015. Segment information is consistent with the prior periods under comparison with the exception of the Media Business Unit that, starting from 1 January 2016, as a result of the change in the operational mission of Persidera, is included in the Domestic Business Unit. Furthermore, the Sofora - Telecom Argentina group, which was disposed of on 8 March 2016, is classified as Discontinued operations.
Flavio Cattaneo – Piergiorgio Peluso

3 Telecom Italia Group Results - 3Q’16
Group Progress Overview - Flavio Cattaneo
3Q’16 Results – Piergiorgio Peluso
Take-Aways – Flavio Cattaneo
Back-up
Flavio Cattaneo – Piergiorgio Peluso
Agenda
4
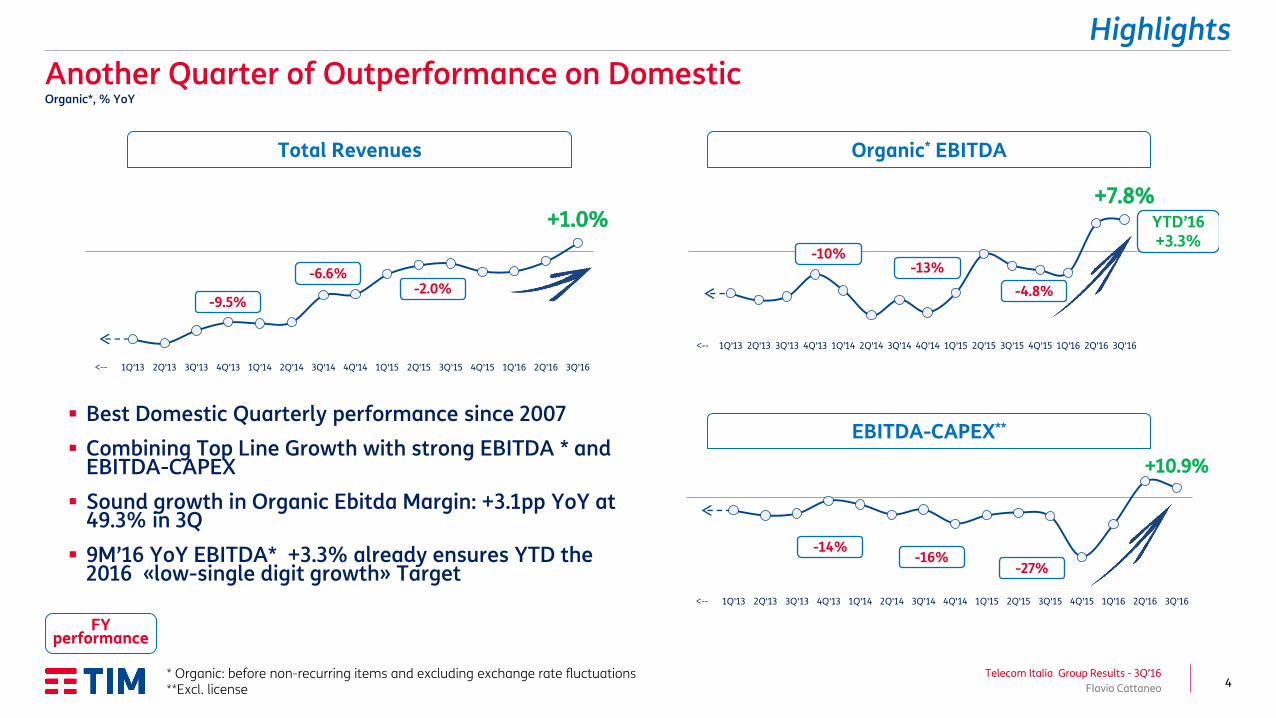
+7.8%
<-- 1Q'13 2Q'13 3Q'13 4Q'13 1Q'14 2Q'14 3Q'14 4Q'14 1Q'15 2Q'15 3Q'15 4Q'15 1Q'16 2Q'16 3Q'16
YTD’16 +3.3%
+1.0%
<-- 1Q'13 2Q'13 3Q'13 4Q'13 1Q'14 2Q'14 3Q'14 4Q'14 1Q'15 2Q'15 3Q'15 4Q'15 1Q'16 2Q'16 3Q'16
* Organic: before non-recurring items and excluding exchange rate fluctuations **Excl. license
Another Quarter of Outperformance on Domestic Organic*, % YoY
Flavio Cattaneo
Telecom Italia Group Results - 3Q’16
FY performance
Organic* EBITDA
EBITDA-CAPEX**
Total Revenues
-9.5%
-6.6% -2.0%
-10% -13%
-4.8%
+10.9%
<-- 1Q'13 2Q'13 3Q'13 4Q'13 1Q'14 2Q'14 3Q'14 4Q'14 1Q'15 2Q'15 3Q'15 4Q'15 1Q'16 2Q'16 3Q'16
-14% -16%
-27%
Best Domestic Quarterly performance since 2007
Combining Top Line Growth with strong EBITDA * and EBITDA-CAPEX
Sound growth in Organic Ebitda Margin: +3.1pp YoY at 49.3% in 3Q
9M’16 YoY EBITDA* +3.3% already ensures YTD the 2016 «low-single digit growth» Target
Highlights

5
Group Shifting Gear, with also Brazil in Recovery mode Organic*, % YoY
Flavio Cattaneo
Telecom Italia Group Results - 3Q’16
Organic* EBITDA Total Revenues
-5.6%
-4.3%
-1.2%
1Q'15 2Q'15 3Q'15 4Q'15 1Q'16 2Q'16 3Q'16
-7.5%
+4.0%
+6.6%
1Q'15 2Q'15 3Q'15 4Q'15 1Q'16 2Q'16 3Q'16
FY’15 -4.6%
YTD’16 -3.7%
FY’15 -4.5%
YTD’16 +1.2%
TIM
Gro
up
-15.3% -12.4%
-5.2%
1Q'15 2Q'15 3Q'15 4Q'15 1Q'16 2Q'16 3Q'16
-15.0%
-6.7%
+0.5%
1Q'15 2Q'15 3Q'15 4Q'15 1Q'16 2Q'16 3Q'16
FY’15 -12.1% FY’15
-2.3%
Bra
zil
Highlights
* Organic: before non-recurring items and excluding exchange rate fluctuations **Excl. license

6
Further Performance supported by:
Growing LTE penetration and densification
Quality and Caring Push on Innovation: TIM
Turbo Giga and more to come…
Working on our Customer Base
Service revenue growth confirmed at +1.1% YoY
New offers gain momentum
More upselling on CB
3Q’16 What’s next
Fixed
Mobile
Moving into attack-mode Consumer: Successful
September campaign leads to double-digit growth in new fixed lines
Business: Performance step-up in just one quarter (gross adds +30% YoY, net losses at historical low)
A growing Fiber beat enables more convergent sales
Upgrading 80k HH per week to FttC and 20k HH per week to FttH
Voice-only upgrades to BB Fiber Try-and-Buy Further reduction in line
losses
KPIs
ARPU upwards to 12.8€ vs 12.5€ in 3Q’15
LTE penetration increased to 51%*
Good MNP Balance at -44k (vs -70k in 2Q’16)
Best-in-class Churn at 23.5% confirmed
Record-low line losses at -100k BB Net Adds +37K BB ARPU up to € 22.4 (vs 3Q’15
20.7€) > 1.1 million NGN customers New HD TV campaign delivers
top-of-the-charts results +100k TIM Smart gross adds in
September
* On Mobile BB Customer Base Flavio Cattaneo
Telecom Italia Group Results - 3Q’16
Building-up further upside for 4Q’16
Domestic

7
FttH/B up to 1Gbps
FttC up to 200 Mbps
LTE up to 150 Mbps*
~1 million HH
Country Coverage Target increased to
~60% 14 million HH passed Sellable in 1,600 cities
785k HH (+257k QoQ) of which 98k by August 15th with Flash Fiber
30 cities (+16 QoQ)
13.6 million passed (>1 million QoQ) Sellable in 1,510 cities (+260 QoQ) 56% YE 2016 Country Coverage
Target already met in October
* Shared Flavio Cattaneo
Telecom Italia Group Results - 3Q’16
Technology Current coverage YE’16 Target
TIM Ultra BroadBand Roll-Out has never been Faster
YE ‘16 Target of 95% (+1.3 pp vs. 2Q’16) population coverage already reached in August
6,530 cities reached (>+240 QoQ)
Increased to > 96% in > 6,600 cities
Domestic

8
Turnaround has just started
Telecom Italia Group Results - 3Q’16
Piergiorgio Peluso
+479
3Q'15 4Q'15 1Q'16 2Q'16 3Q'16
+3.6pp QoQ
Evolving our Market Positioning MSR: Nose-Up
Opex Reduction in progress
-7.1% -8.5%
-9.2%
-6.7%
-3.1%
3Q'15 4Q'15 1Q'16 2Q'16 3Q'16
Volume Driven
Process Driven
Market Driven
Labour & Other
Organic* Opex (R$ bln) -7.8%
Focus on transformation
+0.4% YoY net of MTR
Inflation ~8.5%**
Postpaid % on CB 22.5% +3.5%
3Q'15 3Q'16
* Organic, i.e. excluding non recurring items ** Inflation: last 12 month figure as of September 2016, last available data.
19.0%
New approach on handsets
Quality / Churn swap in progress
TIM Brasil
Mobile Service Revenues (YoY%)
2.6 2.8
Postpaid quarterly net adds (thousand lines)
Consistent Recovery on Revenues and KPIs, with ARPU up 12% YoY at R$ 18.4in 3Q’16 (from R$ 16.4 in 3Q’15)
TIM Improving Customer Mix while taking part to a more rational pricing environment
Organic* EBITDA back to positive in 3Q, reaching a 33.1% margin (up ~2pp both YoY and QoQ)
TIM at the forefront in LTE Urban Coverage (66%) with an efficient Capital Allocation
Strong Performance in Cash Generation (9M Organic* EBITDA-Capex +30% YoY)

9
Agenda
Telecom Italia Group Results - 3Q’16
Group Progress Overview – Flavio Cattaneo
3Q’16 Results – Piergiorgio Peluso
Take-Aways – Flavio Cattaneo
Back-up
Flavio Cattaneo – Piergiorgio Peluso

10
1,679 1,811
3Q'15 3Q'16 Reported 9M’16 +10.4% YoY
3,539 3,526
213 263
3Q'15 3Q'16
Total Reported Revenues Total Domestic Revenues Breakdown
Domestic Service Revenues Breakdown
Equipment
Service
Total 3,752 3,789 +1.0%
-0.4%
+23.9%
Organic* +7.8%
Reported +7.9%
Non-recurring items 56 53
Organic 9M’16 +3.3% YoY
Domestic EBITDA: Organic* and Reported
* Organic: before non-recurring items and excluding exchange rate fluctuations Piergiorgio Peluso
Telecom Italia Group Results - 3Q’16
1,732 1,867
2,592 2,499
1,170 1,183
(223) (157)
3Q'15 3Q'16
2,645 2,643
1,303 1,300
(196) (154)
3Q'15 3Q'16
3,752 3,789 +1.0%
3,539 3,526 -0.4%
-0.1%
-0.2%
+21.4%
-3.6%
+1.1%
+29.5%
Mobile
Fixed
Other&Elim
Mobile
Fixed
Other&Elim
Total
Total
Domestic 3Q’16 Revenues and EBITDA 000, €mln, % YoY
BB Services +10.2% YoY ICT Services +3.0% YoY
o/w Cloud +14.3% YoY

11
Mobile Service Revenue Trend
Mobile and Fixed Dashboard
Fixed Line Losses
Fixed BB Net Adds Mobile Broadband Users
Piergiorgio Peluso
Telecom Italia Group Results - 3Q’16
September ‘16 Gross
Fixed Adds: +22% YoY
3Q‘16 Fiber Net Adds
+34% YoY
Business
Consumer
Total -196 -204
-173 -165
-140 -134
-100
-68
-32
1Q'15 2Q'15 3Q'15 4Q'15 1Q'16 2Q'16 3Q'16
BB Traditional
Fiber
Total +26 +5 +47 +43 +35
-50 -58 -56 -56
-91 -82
-45
+59 +84
+61 +103
+134 +118 +80
1Q'15 2Q'15 3Q'15 4Q'15 1Q'16 2Q'16 3Q'16
+10 +37
+2.6pp YoY
-4.2%
-2.5%
-1.5%
+0.1% +0.6% +0.7% +1.1%
1Q'15 2Q'15 3Q'15 4Q'15 1Q'16 2Q'16 3Q'16
o/w 4G
10,480 10,754
11,217 11,513 11,648 11,775
12,082
17% 25%
31% 38%
43% 49% 51%
1Q'15 2Q'15 3Q'15 4Q'15 1Q'16 2Q'16 3Q'16
000, €mln, % YoY
Domestic

12
Opex Efficiencies continue to Accrue
1Q’16 vs 1Q’15
-1 mln Flat YoY
-155 mln -7.3%
2Q’16 vs 2Q’15
ΔYoY by destination
Volume Driven
Process Driven
Labour Cost
Market Driven
+37
-19
-43
+24
+5.3%
-5.5%
-5.8%
+9.8%
+28
-42
-110
-30
+3.5%
-13.0%
-15.0%
-11.2%
ΔYoY by destination
Telecom Italia Group Results - 3Q’16
699 736 781 809 804 781
242 266 268 238 272 240 346 327 330 287 317 285
734 691 736 626 626 615
1Q'15 1Q'16 2Q'15 2Q'16 3Q'15 3Q'16
-23
-32
-11
-32
-1
-15
-16
-2.9%
-10.1%
-1.8%
-11.7%
flat
ΔYoY by destination
Volume Driven
Process Driven
Labour Cost
Market Driven
o/w Commercial Levers **
o/w Billing & Bad Debt
o/w Expo Sponsorship
-98 mln -4.9%
3Q’16 vs 3Q’15
2,021 2,020 2,115 1,960 2,020 1,922
Piergiorgio Peluso
44.4% 43.1% 43.5% 47.0% 46.2% 49.3%
Volume Driven
Process Driven
Labour Cost
Market Driven
*Organic: before non-recurring items and excluding exchange rate fluctuations ** Commercial levers include Sales, Caring & Advertising
Organic*
Domestic
Labour Cost
Market Driven
Process Driven & other
Volume Driven
Ebitda Margin

13
27,278
(1,908)
(688) +992
+117 +227 +171
+545 26,735
Net DebtYE2015
OpFCF M&A Cash FinancialExpenses &
Financial Accruals
Cash Taxes
Dividends IAS 17Lease-back
Other Impacts
Net Debt9M'16
Net Debt: 3Q Step-down supported by Financial Discipline
-543 vs YE’15
Disposal Argentina (665) Disposal Tower Brazil (28)
Telecom Italia Group Results - 3Q’16
27.5 26.7
1H'16 3Q'16
3Q’16 Debt Reduction
-0.8
€bln
Piergiorgio Peluso
OpFCF 9M’16vs’15
€bln
1,551 1,908 (838) (863)
(3,233) (3,107)
5,622 5,878
1H'15 1H'16
Ebitda
Capex
DWC
OpFCF
+256
+126
-25
+357
9M’15 9M’16
€mln, % YoY
TIM Group
D Reported Net FCF 3Q’16 vs 3Q’15:
+591 mln€

14 Telecom Italia Group Results - 3Q’16
Group Progress Overview - Flavio Cattaneo
3Q’16 Results - Piergiorgio Peluso
Take-Aways - Flavio Cattaneo
Back-up
Flavio Cattaneo – Piergiorgio Peluso
Agenda

15
Guidance Update
Flavio Cattaneo
Telecom Italia Group Results - 3Q’16 * Spectrum not included
NGAN coverage upgraded from 56% to ~60% YE’16 and from 75% to ~ 80% YE’17, with no increase of CAPEX targets*
LTE Coverage upgraded from 95% to >96% YE’16 and from 96% to 98% YE’17 YE’18 NGN Customers target increased 10%, from 5mln to 5.5mln
Lines losses reducing towards parity in current Plan scenario
Increase in Efficiency Plan to be announced in February
Capital Intensity is projected to drop below 20% in the medium term, in line with coverage
targets fulfillment
Operational and Financial Discipline fully supports <2.7x Net Debt/Ebitda target in 2018, without the need of any Disposal*
Outlook
Ita
ly
TIM
Gro
up

16
Agenda
Telecom Italia Group Results - 3Q’16
Group Progress Overview – Flavio Cattaneo
3Q’16 Results – Piergiorgio Peluso
Take-Aways – Flavio Cattaneo
Back-up
Flavio Cattaneo – Piergiorgio Peluso

17
3Q’16 - TI Group Results Overview
* Organic: before non-recurring items
Revenues: € 83.9 mln
EBITDA*: € 41.7 mln
Tenancy Ratio: 1.70x
Ebitda Growth: +15% YoY Inwit
Revenues: € 1.1 bln
EBITDA*: € 0.4 bln
4G: 746 Cities with 66% of urban population covered
3G: 2,084 Cities with 83% of urban population covered Brazil
Revenues: € 3.8 bln
EBITDA*: € 1.9 bln
NGN: 13.6 mln Households in 1,509 Cities
4G: 95% of Population in 6,600 Cities
Domestic
Revenues: € 4.8 bln
EBITDA*: € 2.2 bln
Capex: € 1.1 bln
Net Debt: € 26.7 bln Group
Telecom Italia Group Results - 3Q’16
Flavio Cattaneo – Piergiorgio Peluso

18
Organic*, €mln, % YoY
46.2% 49.3%
42.4% 45.7%
3Q'15 3Q'16
4,582 4,522
318 321
3Q'15 3Q'16
31.2% 33.1%
2Q'15 2Q'16
1,035 1,006
96 58
2Q'15 2Q'16
3,539 3,526
213 263
Group 3Q’16: Organic Revenues and EBITDA
Group Revenues Revenue Breakdown
Equipment
Service
4,900 4,843
-1.3%
+0.9%
-1.2% Total
Do
me
stic
B
razi
l
Total
Equipment
Service
Total
Equipment
Service
1,131 1,064
-2.4%
-36.9%
-5.2%
-0.4%
+23.9%
+1.0% 3,752 3,789
+6.6%
Do
me
stic
B
razi
l
351 351 +0.5%
+7.8% 1,732 1,867
EBITDA Margin
EBITDA Margin
* Before non-recurring items and excluding exchange rate fluctuations
Group EBITDA EBITDA Breakdown
Telecom Italia Group Results - 3Q’16
2,077 2,214
EBITDA Margin
3Q’15 3Q’16
3Q’15 3Q’16
Flavio Cattaneo – Piergiorgio Peluso

19
€mln, % YoY
YE'15 9M'16
2,297 2,398
827 709
1H'15 1H'16
Group 9M’16: Capex and Net Debt
Group Organic* Capex Capex Highlights
Adjusted Net Debt Net Debt Highlights
Total** 3,130 3,107 -0.7%
* Before non-recurring items and excluding exchange rate fluctuations ** Other activities & eliminations included
Brazil
Domestic +4.4%
-14.3%
27,278 26,735 -543
YE’14 9M’15
26,651 26,804 +153
The 9M16 Net Cash Flow at the Group level was 543 million euro due to the strong OFCF generation ( 1.908 mln euro) fully generated in the Domestic Business (1.937 mln euro)
Telecom Italia Group Results - 3Q’16
9M’15 9M’16
Flavio Cattaneo – Piergiorgio Peluso
Group Capex reduction due to different dynamics:
Efficiencies also from lower procurement costs despite higher Investments on Innovative Services in Brazil
More investment in Italy mainly driven by UBB Network roll-out & Transformational Projects

20
2,592 2,499
53 144
3Q'15 3Q'16
1,170 1,183
133 117
3Q'15 3Q'16
Mobile and Fixed Performance
Domestic Mobile Revenues
Customer Base and ARPU Dynamics
Domestic Fixed Revenues
Domestic BB Service Revenues
Handsets
Service
Total 1,303 1,300 -0.2%
+1.1%
-12.0%
Total Customer Base 30,023 29,549
% Calling
-474
+0.6pp 85.9% 86.5%
ARPU +2.4%
Piergiorgio Peluso
Telecom Italia Group Results - 3Q’16
12.5
12.8
3Q'15 3Q'16 3Q'15 3Q'16
€20.7
€22.4
+10.2%
BB ARPU €/month
427 471
+8.1%
Equipment & Other
Service
Total 2,645 2,643 -0.1%
-3.6%
+169%
000, €mln, % YoY
Including passive
infrastructure deals with
OLOs

21
+21.1% 18.0% +17.5%
+14.5% +11.6% +10.1% +8.2%
-5.1%
+2.6% +6.3%
+5.9%
+4.7%
+1.3%
-2.8%
1Q'15 2Q'15 3Q'15 4Q'15 1Q'16 2Q'16 3Q'16
8,677 8,091 7,782 7,117 6,690 6,029 5,929
1,803 2,663 3,434 4,396 4,958 5,745 6,153
1Q'15 2Q'15 3Q'15 4Q'15 1Q'16 2Q'16 3Q'16
11.3 11.9
12.5 12.8 11.6 12.1
Domestic Mobile Details
Mobile Service Revenues Trend Mobile BB Service Revenues Trend
ARPU & Churn Rate
DCB
DARPU/Mix
Total +16.0% +20.7% +23.8% +20.5% +16.3%
DUsers
DARPU/Mix
1Q’15 1Q’16 2Q’15 2Q’16 3Q’15 3Q’16 4Q’15 4Q’16
+1.5% YoY
ARPU reported €/month
Annualized Churn Rate (%)
1Q’15 1Q’16 2Q’15 2Q’16 3Q’15 3Q’16 4Q’15 4Q’16
Total 10,480 10,754 11,217 11,513 11,648
4G Users
Internet Users
+11.4%
25.6 22.0 23.2 22.8 22.4 21.2
11,775 +2.5%
YoY
Telecom Italia Group Results - 3Q’16
-0.8% -0.4% +0.2% +0.3%
+0.3%
+0.9% +1.9%
-3.4%
-2.0% -1.7%
-0.2%
+0.3%
-0.2% -0.8%
1Q'15 2Q'15 3Q'15 4Q'15 1Q'16 2Q'16 3Q'16
Total -4.2% -2.5% -1.5% +0.6% +0.1% +0.7% +5.4%
12,082
4G 51% of MBB
+2.4% YoY
12.8
23.5
Flavio Cattaneo – Piergiorgio Peluso
000, €mln, % YoY
Mobile BB Customer Base
+1.1%
22
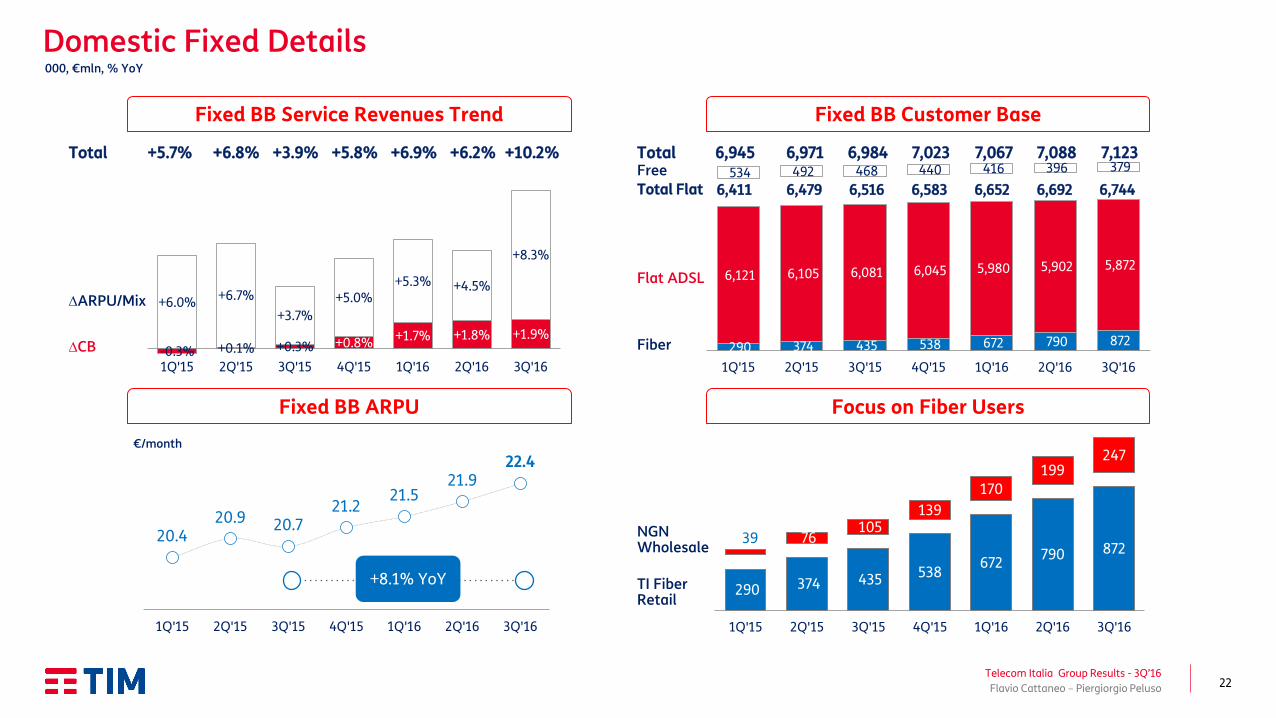
-0.3% +0.1% +0.3% +0.8% +1.7% +1.8% +1.9%
+6.0% +6.7%
+3.7%
+5.0% +5.3% +4.5%
+8.3%
1Q'15 2Q'15 3Q'15 4Q'15 1Q'16 2Q'16 3Q'16
Domestic Fixed Details
Fixed BB Service Revenues Trend
000, €mln, % YoY
Fixed BB Customer Base
Fixed BB ARPU Focus on Fiber Users
Total +5.7% +6.8% +3.9% +5.8% +6.9%
DCB
DARPU/Mix
Total
Flat ADSL
Fiber
Total Flat
€/month
+8.1% YoY TI Fiber Retail
NGN Wholesale
Free +6.2%
Telecom Italia Group Results - 3Q’16
+10.2%
20.4 20.9 20.7
21.2 21.5
21.9 22.4
1Q'15 2Q'15 3Q'15 4Q'15 1Q'16 2Q'16 3Q'16
290 374 435 538 672
790 872 39 76
105 139
170
199 247
1Q'15 2Q'15 3Q'15 4Q'15 1Q'16 2Q'16 3Q'16
6,945 6,971 6,984 7,023 7,067
6,411 6,479 6,516 6,583 6,652
7,088
6,692
290 374 435 538 672 790 872
6,121 6,105 6,081 6,045 5,980 5,902 5,872
534 492 468 440 416 396 379
1Q'15 2Q'15 3Q'15 4Q'15 1Q'16 2Q'16 3Q'16
6,744
7,123
Flavio Cattaneo – Piergiorgio Peluso

23
1,168 1,122
3Q'15 3Q'16
3Q'15 3Q'16
3,782 3,690
333 210
3Q'15 3Q'16
Revenues
Organic EBITDA*
Focus on Mobile Service Revenues YoY
Capex
4,115 3,900
Mobile Service Revenues (YoY%) confirm their rebound
1,285 1,292 31.2% 33.1% +1.9pp
+0.5%
EBITDA Margin
% on revenues
28.4% 28.8% +0.4pp
-2.4%
-36.9%
-5.2%
-3.9%
Equipment
Service
Total
Telecom Italia Group Results - 3Q’16 * Before non-recurring items
-15.0% -6.7%
+0.5%
1Q'16 2Q'16 3Q'16
-7.1% -8.5% -9.2%
-6.7%
-3.1%
3Q'15 4Q'15 1Q'16 2Q'16 3Q'16
EBITDA performance improving and better margins backed by:
Higher data services penetration Well executed efficiency plan Lighter impacts from MTR and
handset business
Flavio Cattaneo – Piergiorgio Peluso
R$mln, % YoY
TIM Brasil: 3Q’16 Results

24
Maturities and Liquidity Margin
Bonds Undrawn portions of committed
C&CE
Covered until 2020
€mln
(1) € 30.951 mln is the nominal amount of outstanding medium-long term debt. By adding Mandatory Convertible Bond (€ 1.300 mln), IAS adjustments (€ 1.237 mln) and current financial liabilities (€ 803 mln), the gross debt figure of € 34.291 mln is reached.
(2) Committed Bank lines are undrawn
Drawn bank facility(2)
Loans (of which long-term rent, financial and operating lease payable € 2,407 mln)
Liquidity Margin
Telecom Italia Group Results - 3Q’16
1,312
1,418
2,043
800
695
2,418
8,913 7,000
2,044
1,781
2,500
1,267 564
13,882
22,038
5,767
12,767
227
3,356
3,199
4,543 2,067
1,259
16,300 30,951(1)
Liquidity margin Within 2016 FY 2017 FY 2018 FY 2019 FY 2020 FY 2021 Beyond 2021 Total M/L TermDebt
Flavio Cattaneo – Piergiorgio Peluso

25
OpFCF Generation in 9M’16
2,058 1,937
(170) (660)
(2,297) (2,398)
4,525 4,995
1H'15 1H'16
Ebitda
Capex
€mln, Reported, % YoY
Ebitda
Capex
DWC
OpFCF
9M Group OpFCF
1,551 1,908
(838) (863)
(3,233) (3,107)
5,622 5,878
1H'15 1H'16
Domestic
Brazil
+256
+126
-25
+357
DWC
OpFCF
+470
-101
-490
-121
Ebitda
Capex
DWC
OpFCF (484) (1)
(662) (192)
(930)
(709)
1,108
900
1H'15 1H'16
-208
+221
+470
+483
Reported +4.6% YoY
Organic* +1.2% YoY
Reported +10.4% YoY
Organic* +3.3% YoY
Reported -18.8% YoY
Organic* -7.2% YoY
• Mainly due to settlements cash out
* Organic: before non-recurring items and excluding exchange rate fluctuations
Telecom Italia Group Results - 3Q’16
9M’15 9M’16
9M’15 9M’16
9M’15 9M’16
Piergiorgio Peluso

26
Average m/l term maturity: 7.75 years (bond only 8.15 years)
Fixed rate portion on gross debt approximately 70.8%
Around 36% of outstanding bonds (nominal amount)
denominated in USD and GBP and is fully hedged
Cost of debt: ~5.1 %
Banks & EIB
Op. leases and long rent
Bonds
Maturities and Risk Management
N.B. The figures are net of the adjustment due to the fair value measurement of derivatives and related financial liabilities/assets, as follows: - the impact on Gross Financial Debt is equal to 2.338 €/mln (of which 370 €/mln on bonds) - the impact on Financial Assets is equal to 1.662 €/mln. Therefore, the Net Financial Indebtedness is adjusted by 676 €/mln. N.B. The difference between total financial assets (€ 7.556 mln) and C&CE and marketable securities (€ 5.767 mln) is equal to € 1.789 mln and refers to positive MTM derivatives (accrued interests and exchange rate) for € 1.440 mln, financial receivables for lease for € 177 mln, deposits beyond 3 months for € 100 mln and other credits for € 72 mln.
3.2% Other
68.5%
2.8%
7.8%
20.9%
Well Diversified and Hedged Debt
Telecom Italia Group Results - 3Q’16
23,591
961
2,624
7,115
68.8%
2.8%
7.7%
20.7%
Flavio Cattaneo – Piergiorgio Peluso
€mln
Gross debt 34,291
Financial Assets (7,556) of which C&CE and marketable securities (5,767)
- C & CE (4,275)
- Marketable securities (1,492)
- Government Securities (746)
- Other (746)
Net financial position 26,735

27
Domestic Fiber and LTE Coverage Trend
Fiber Coverage*
Today 4G Coverage
* Household passed Telecom Italia Group Results - 3Q’16
Flavio Cattaneo – Piergiorgio Peluso
32% 37%
40% 42% 45%
51% 55%
1Q'15 2Q'15 3Q'15 4Q'15 1Q'16 2Q'16 3Q'16
81% 83% 86% 88%
92% 94% 95%
1Q'15 2Q'15 3Q'15 4Q'15 1Q'16 2Q'16 3Q'16
+15pp YoY
+9pp YoY
Coverage ~84% 56%
Population 98% 95%
today 2018
today 2018

28
6,602 6,156 5,902 6,041
(446) +41 (38) (93) (164) +139
9M'15 reported
non recurringitems
9M'15net of non
recurring items
Volume Driven Market Driven Process Driven &Other
Labour Costs
9M'16net of non
recurring items
non recurringitems
9M'16 reported
Driven by Compensation Recalibration and Solidarity
Including Real Estate
and G&A
Focus on Domestic Opex €mln, % YoY
Organic -254 mln€, -4.1% YoY
Net of Volume Driven: -295 mln€, -7.6% YoY
Reported -561 mln€, -8.5% YoY
Telecom Italia Group Results - 3Q’16
Flavio Cattaneo – Piergiorgio Peluso
Mainly charges and provisions for employee
reduction plan

29
1,320 1,212
977 1,186
9M'15 9M'16
9M’16 Domestic: Focus on Investments
Total Domestic Capex Innovative Capex Breakdown
€mln
Total 2,297 +101 2,398
Innovative
Traditional*
-108 +9 net of
2015 license
+209 (+21%)
Innovative on total
49% +6pp YoY
* Including 117 €mln for 2G license renewal in 2015
Domestic Capex Highlights Traditional Capex Breakdown
Telecom Italia Group Results - 3Q’16
838
1,186
120 107
121
Network IT RealEstate
Comm. &Others
Total
721
1,212
281 13
197
Network IT RealEstate
Comm. &Others
Total
83% of Traditional Capex
81% of Innovative Capex
Flavio Cattaneo – Piergiorgio Peluso
Innovative Investments (+209 €mln YoY) driven by a faster pace in LTE, NGN and Cloud Services
81% of Innovative Capex and 83% of Traditional Capex are Network and IT, indicating strong focus on Infrastructure

30
222 394 372 382 384 410
338
384 458 415 407 413 117
1Q'15 1Q'16 2Q'15 2Q'15 3Q'15 3Q'16
1Q’16 vs 1Q’15
License
Traditional
+102 mln -33 mln
2Q’16 vs 2Q’15
Domestic Capex Breakdown
% Innovative* % Innovative
Telecom Italia Group Results - 3Q’16
% Innovative
+32 mln
3Q’16 vs 3Q’15
676 778 830 797 791 823
Innovative
40% 51%
1Q'15 1Q'16
45%
48%
2Q'15 2Q'16
45%
50%
3Q'15 3Q'16
* Excluding license from traditional investments Flavio Cattaneo – Piergiorgio Peluso

31
Domestic - Cash Cost Efficiency Dashboard
Original ‘16-’18 Efficiency Target
Additional Efficiency ‘16-’18 Target
New Efficiency ‘16-’18 Target Run rate @2018
Process Driven Costs
Market Driven Costs
Labour Costs
Total Opex
0.2 bln€
0.1 bln€
0.1 bln€
0.4 bln€
Total Cash Cost Efficiency
0.2 bln€
0.6 bln€
+0.4 bln€
+0.6 bln€
+1.0 bln€
0.8 bln€
0.8 bln€
1.6 bln€
NGN Optimization
Real Estate & Other
Total Capex
Other Costs
Traditional
-
0.2 bln€
-
-
+0.12 bln€
+0.13 bln€
+0.1 bln€
+0.05 bln €
+0.3 bln€
+0.15 bln€
+0.15 bln€
0.32 bln€
0.23 bln€
0.2 bln€
0.05 bln€
0.5 bln€
0.15 bln€
0.15 bln€
Telecom Italia Group Results - 3Q’16
Flavio Cattaneo – Piergiorgio Peluso

32
TIM Brasil - Cash Cost Efficiency Dashboard*
* Including 2018-2015 inflation & other structural changes ** After R$1.7bn 2018 run rate Efficiency Actions (Volume-Driven excluded) to offset Inflation & other structural changes
New Plan
CAPEX R$ 0.5bln
TOTAL R$ -0.1bln
R$ 0.9bln
R$ 1.5bln
Run rate 2018 vs 2015
Δ NEW vs OLD
OPEX R$ -0.6bln R$ 0.6bln** R$ +1.2bln
R$ +0.4bln
R$ +1.6bln
Old Plan
Telecom Italia Group Results - 3Q’16
Flavio Cattaneo – Piergiorgio Peluso

33
For further questions please contact the IR Team
IR Webpage TIM Twitter Account TIM Slideshare Account
www.telecomitalia.com/investors
+39 02 8595 4131
https://twitter.com/timnewsroom http://www.slideshare.net/telecomitaliacorporate
Phone E-mail
Contact details for all IR representatives:
www.telecomitalia.com/ircontacts
Investor Relations Contact Details
Telecom Italia Group Results - 3Q’16
Flavio Cattaneo – Piergiorgio Peluso