time and motion studies for demining: snapshots of operations · why do a time and motion study? 2...
TRANSCRIPT

Geneva International Centre for Humanitarian Demining7bis, avenue de la PaixP.O. Box 1300CH - 1211 Geneva 1SwitzerlandTel. (41 22) 906 16 60, Fax (41 22) 906 16 90www.gichd.ch
Time and Motion Studies for Demining:Snapshots of Operations
i
Time and MotionStudies for Demining:
Snapshots of Operations

ii
The Geneva International Centre for Humanitarian Demining (GICHD) supports theefforts of the international community in reducing the impact of mines and unexplodedordnance (UXO). The Centre provides operational assistance, is active in researchand supports the implementation of the Anti-Personnel Mine Ban Convention.
Geneva International Centre for Humanitarian Demining7bis, avenue de la Paix
P.O. Box 1300CH-1211 Geneva 1
SwitzerlandTel. (41 22) 906 16 60Fax (41 22) 906 16 90
Time and Motion Studies for Demining: Snapshots of Operations, GICHD, Geneva,November 2005.This project was managed and written by Ian McLean and Rebecca J. Sargisson,GICHD ([email protected]).
ISBN 2-88487-038-5
© Geneva International Centre for Humanitarian Demining
The views expressed in this publication are those of the Geneva International Centrefor Humanitarian Demining. The designations employed and the presentation of thematerial in this publication do not imply the expression of any opinion whatsoever onthe part of the Geneva International Centre for Humanitarian Demining concerningthe legal status of any country, territory or area, or of its authorities or armed groups, orconcerning the delimitation of its frontiers or boundaries.

iii
Contents
1. Introduction 1Why do a Time and Motion study? 2
2. Anatomy of a Time and Motion study 3A breakdown of the steps in a Time and Motion study 4Simple background rules 5Useful equipment 6
3. Methodology 7Sampling: the principle 8Using samples to construct a measurement 11Analysis 17Reporting 19
4. Example Time and Motion studies 21Example 1: What do the raw data look like
in a snapshot of a demining programme? 21Example 2: What is the time taken by dogs to search a line? 22Example 3: How much area is cleared by manual deminers
using three different drills? 24Example 4: How much time do manual deminers spend
changing tools when using three different demining drills? 25Example 5: Exploring the data using variance 26
5. Conclusion 29
Bibliography 21
Annexes1. Types of scientific measurement 332. Interpreting statistical analyses 35

iv
Acknowledgements
The Geneva International Centre for Humanitarian Demining (GICHD) would like tothank Norwegian People’s Aid and the Cambodian Mine Action Centre for supportingstudies that contributed to this report. Tony Fish ran the study on manual demining.The GICHD would also like to thank the Governments of Norway and Sweden forfunding the study.
Photo credits: Ian McLean.

1
Introduction
One way or another, anybody involved in the management of deminingprogrammes will do cost-benefit analyses. In most cases, the aim is to optimiseuse of resources, where “optimisation” in terms of resource use generallyalso means “minimisation” in terms of cost. The trick is to do cost-minimisationwithout compromising essential requirements, such as productivity, safety,and quality. Unfortunately, these objectives are somewhat incompatible, andachieving them can feel like a juggling act where all the balls must be kept inthe air all of the time.
Time and Motion (T&M) studies offer a mechanism for doing quantitativeanalyses of operational demining programmes. The primary objective of anyT&M study is to develop a snapshot of the programme being studied withina defined time frame. Using that snapshot, the details of operationalprocedures can be explored; for example, in order to assess how resourcesare being used, to make comparisons among different operational situationsor teams, or to test new procedures.
The concept of using T&M studies to explore a programme is not new,and in reality most managers use some kind of T&M approach when theymake decisions about alternative options. The aim of this guide is to explainthe principles and procedures behind T&M studies in order to make themmore user-friendly and systematic.
The sorts of questions normally asked using a T&M approach include:Which are the most time-consuming elements of a specific deminingprocedure?Why does one team work faster than another?Why does productivity vary in different operational conditions?Will a suggested procedural adjustment improve productivity?Will a suggested safety adjustment affect productivity?Why does this supervisor appear more efficient than that one?And so on.
In practice, only the imagination of the questioner limits the extent towhich T&M studies can contribute to improving productivity.
1

2
Time and Motion Studies for Demining: Snapshots of Operations
The above are specific examples. Stated more generally, T&M studies areused to improve understanding of the complex behavioural systemsrepresented by a demining programme.
Why do a Time and Motion study?
Perhaps the simplest way to answer this question, is with another question:Why be subjective when it is easy to be objective?
It is normal to make some kind of assessment before a new procedure isintroduced, or a new idea is trialled. The assessment is likely to be comparative,in that the observer has considerable experience with the procedure beingreplaced and can therefore mentally compare the new procedure with theold. Some simple measurements might even be made, such as area clearedafter 2 hours work using the old and new systems. However, the assessmentstend to be subjective, being based on limited observations of people at workor using the new tool.
T&M studies do all of the above, and much more. Through using simplesampling procedures to gather data, they provide an objective or quantitativeanalysis of the system under study. In addition, they allow the observer toexplore fine details of procedures, e.g. when fine-tuning an idea. Surprisingthings may be discovered that cannot be seen using subjective or qualitativeanalyses.
For example, say a new procedure reduces the time required for markingfrom 10 per cent to 5 per cent. This apparently small difference is unlikely tobe detectable using a subjective analysis. But the new procedure has reducedthe time required for marking by half (= a 50 per cent time saving). A T&Mstudy will measure that difference, allowing the manager to make precisecalculations of time savings and productivity benefits. A time saving of 5 percent translates into one additional metre for every 20 metres cleared by amanual deminer. Calculated across 20 deminers, that represents a considerableamount of extra land, obtained at no cost. An example where reducedrequirements for marking produced a measured time saving of even morethan 50 per cent is given in Figure 8, below.
T&M studies are a tool. Any decision to adopt a new tool requires learning,practice, and preferably a reference manual. This document is that manual. Itoutlines a methodology, gives examples, and explains how to gather andwork with the data that are the building blocks of a T&M study. It is not ablueprint for any particular study — every study is different and willnecessarily involve local decisions and local constraints. But the principlesand procedures are essentially the same for any T&M study, and they aredescribed in detail here.

3
Anatomy of aTime and Motion study
Most T&M studies involve a comparison, such as between two teams orbetween two operational scenarios. However, even the simplest study inwhich just one operational concept is explored can provide valuableinformation, for example, in relation to productivity. The key to an effectiveT&M study is to ensure the following:
the question to be asked by the study is clearly defined;the right data are gathered;appropriate sampling is done;the analysis addresses the question being asked;reporting requirements are part of the planning.
These points can be structured as a series of steps, shown in Figure 1.
Figure 1. The steps to a successful T & M study
2

4
Time and Motion Studies for Demining: Snapshots of Operations
Although they are not difficult to undertake, T&M studies require carefulplanning and some knowledge of data sampling and analytical procedures.The required time commitment means that the studies are unlikely to beundertaken by senior management staff (who are routinely under timepressure). Fortunately, they are easily supervised by management staff andthe study itself can be undertaken by any competent person with goodobservation and computer skills, and an ability to understand the notion ofsampling.
Planning may include either or both a written proposal and a workshop.Both is best. Management staff will normally be involved in the planning andan assigned data-gathering person or persons will do the data gathering andthe analysis. If possible, a pilot study should be undertaken to check theprocedures, identify elements of the study that were missed during planning,and make adjustments to suit the local context (e.g. if an important behaviouralaction was missed from the list of items to be recorded).
A breakdown of the steps in a Time and Motion study
Planning (1 day, up to several weeks ahead)Frame the question.Identify resource requirements.Design the data-gathering approach.Make decisions about appropriate sample sizes.Identify assumptions and constraints.Choose (and train) the person(s) to do the study.Decide whether statistical analysis will be needed and where theexpertise will come from.Budget the necessary time (including for analysis and reporting).Workshop with management and other relevant staff.
Pilot study (1 hour to 1 day)Test procedures.Gather a small amount of test data.Analyse test data.Revise procedures.Revise question.Revise list of actions to be sampled.Revise assumptions and constraints.If multiple observers, test their agreement on definitions andprocedures.Workshop pilot results.

5
Main study (1 day to 1 week)Gather data.Enter data into computer immediately (daily).Write down methodology (at least in note form).Keep diary of daily activities.
Data analysis (1 day to 1 week)Qualitative description — write a description of what was done.Graphing (quantitative description) — explore the data in differentways.Statistical analysis (if needed) — quantitative support for theconclusions.
ReportThe report has a standard structure: Introduction, Method, Results,Discussion, Conclusions and Recommendations.The Introduction can be extracted from a well-written project proposal.A description of the Method was outlined in the proposal, and a moredetailed version was prepared during the implementation phase.Analysis will be more efficient if the analyst has a good understandingof an appropriate computer package, such as MSExcel®.A seminar or workshop may be given presenting the Results,Conclusions, and Recommendations. The seminar integrates involvedparties into the process and gives them ownership of therecommendations.
Simple background rules
Applying the following rules will help to streamline the process and ensurethat the project proceeds efficiently.
Workshop the project plan with interested and/or affected partiesbefore the study is undertaken.Budget similar amounts of time for each of:
data gathering,data entry and analysis, andreport preparation.
[Warning! Do not underestimate or undervalue any of these time requirements]It is best to do data entry on the same day as the data are gathered,even if it is necessary to compromise on time spent data-gathering inorder to create the needed time. Delaying data entry leads to errors,first because details have been forgotten, and second because recordingerrors are less likely to be noticed if computer entry is delayed.
Anatomy of a Time and Motion study
6
Time and Motion Studies for Demining: Snapshots of Operations
Useful equipment
Portable chair.Binoculars.Two stopwatches.Countdown timer (giving automatic time intervals for sampling).Portable computer.Notebook and pen.Pre-printed data sheets (usually designed during the planning and pilotstudy).Clipboard.Weather and insect protection (shade, sunscreen, umbrella).
Ensure that the data gathering person can work in conditions that are ascomfortable as possible, and is able to view the action in as much detail aspossible!
7
3 Methodology
On the surface, T&M studies appear to be simple descriptions of definedactivities (or behaviours), which will be sampled as defined actions. So whynot simply write down everything that is going on? If one does that, then itshould be possible to define the question or figure out the best analysis later,because a full record of information will be available.
Better still, just video everything and analyse the video later.To put it bluntly, the above is impossible. Why?
Behaviour can change very quickly — more quickly than can be recorded.Writing something down requires the observer to direct attention awayfrom the subject, and some behaviour is missed.Even speaking the behaviour (e.g. into a tape recorder) is too slow;some behaviour will be missed because actions occur faster than theycan be spoken.Several behaviours of interest can occur at the same time; should all bewritten down or spoken, or just some?An observer has a broader field of vision than a video camera, and cansee more detail.The camera itself is a distraction, as operating it draws the attention ofthe observer away from the action.It is very difficult to maintain a continuous time base for the data.Analysing videos (or spoken recordings) is time-consuming. At theminimum, the total length of time required to collect the data is doubled(once to film and once to analyse), but in reality setting up, finding,replaying, etc., mean that the required time is likely to be tripled. Videocan be essential for obtaining fine details of specific behaviours, butcameras should not be used to replace an observer who takes datadirectly from the subject(s).
More than anything else, T&M studies are therefore about sampling. Itmay be impossible to record everything, but it is certainly possible to sample
8
Time and Motion Studies for Demining: Snapshots of Operations
everything. Designing a sampling programme that will provide the neededsnapshot is the most creative part of T&M planning. That creativity requiresa good understanding of the notions of sampling as a principle, and samplingas a procedure.
Sampling: the principle
A snapshot records a moment in time. In a T&M study, that moment is aweek rather than a second, but the same notion applies. The aim of the studyis to build a picture of some situation. If the aim is to compare two situations,then two pictures must be built.
A picture is built using measurements of the behaviours (or activities, calledactions) that occur during the study period. Measurements are obtainedthrough sampling.
Measurements are not all of the same type. The question: “Is your personalProtective Equipment (PPE) comfortable?” (answer: yes or no) does not give thesame type of measurement as a measurement of height, which is quantitativeand has units. The types of measurements recorded during scientific samplingare described in Annex 1.
A sample is a single representation of something much larger. For example:A vial of blood is a sample of all the blood in a person’s body.The action of a person at a single moment in time is a sample of therange of actions that person performs.A single measure of the length of a person’s coffee break is a sample ofthe length of all coffee breaks taken by that person.
Sometimes, a single sample is enough to provide a useful measurement ofthe larger thing being studied. For example, one vial of blood is enough toprovide a measurement of a person’s iron level, which would be about thesame, no matter how many samples were taken on a given day.
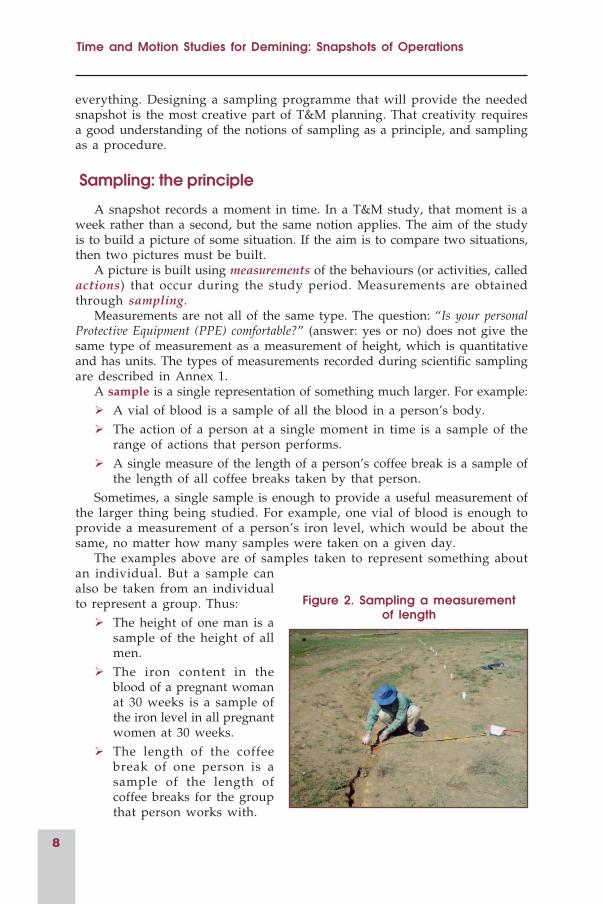
The examples above are of samples taken to represent something aboutan individual. But a sample canalso be taken from an individualto represent a group. Thus:
The height of one man is asample of the height of allmen.The iron content in theblood of a pregnant womanat 30 weeks is a sample ofthe iron level in all pregnantwomen at 30 weeks.The length of the coffeebreak of one person is asample of the length ofcoffee breaks for the groupthat person works with.
Figure 2. Sampling a measurementof length

9
Methodology
In the above examples, the sample and the measurement are essentiallythe same thing. Sample the height of a man and what you get is a measurementof height. Take a measurement of length and you have a sample (Figure 2).
Here are three key points that will be developed further below
That sample of height taken above is representative, but it is notenough if you need an estimate of the typical height of all men (orput another way, of the height of an average man). For that, themeasurements for many men are needed, presumably obtained bytaking samples from a reasonable number of men.
Sample and measurement might not be the same thing. In the bloodexample above, an additional step was required between sampleand measurement. A blood sample is just that — a sample. It is nota measurement, and further processing will be required before ameasurement is obtained. Thus, having obtained the blood samplefrom a pregnant woman, a lab must then use some procedure tomeasure iron content. When taking behavioural samples, it is typicalthat an additional processing step is required between taking thesample and obtaining a measurement.
When designing a study, it is normal to want to compare betweentwo (or more) groups. Those groups could be two teams of deminers.But they could equally be the same team working at different times(often in a “before” and “after” design). E.g. if the measurementrequired was the change in productivity after introducing a new tool,two samples would be needed, one before and one after the toolwas given to the team.
If the question of interest is: “Do manual deminers use their PPE correctly?”,try checking one deminer. The answer (yes or no) is a sample; essentially asnapshot of the use of PPE by that deminer.
But this single sample is not very useful because:1. like the measurement of the height of one man, it is not representative
of average use of PPE by all deminers; and2. it is not a measurement.The quality of information obtained in this example can be improved in
two ways, both of which involve taking multiple samples:by taking a series of samples of the behaviour of the same deminer at
different times; orby taking one sample from each of many different deminers at the
same time (or in as short a time as possible).The first option gives a clearer snapshot for the single deminer. The series
of yes and no samples can be used to calculate a percentage of time that thedeminer wears PPE correctly. E.g. with 7 “yes” and 3 “no” samples, it is easyto calculate that this deminer wears PPE correctly 70 per cent of the time.Here, 10 samples were used to make one measurement.
But if the aim is to look at what deminers do as a group, the second optionis better. When many samples are taken from one deminer, the data will give

10
Time and Motion Studies for Demining: Snapshots of Operations
a detailed assessment of use of PPE by that person, but the sample size willstill be one (one deminer). That deminer may be normal, but s/he cannot beaverage, because an average must be calculated across a group. When youwant to know about the average behaviour of a group, samples must betaken from the group.
In this example, the question above was actually phrased rather badly.Here is a more useful way to ask it:
“What percentage of deminers wear their PPE correctly?”The percentage was already calculated for one deminer, using 10 samples
(70 per cent).Instead of concentrating on one deminer, why not make the same
calculation by taking one sample from all 10 deminers in the team. Say, 7were wearing PPE correctly and 3 were not. Just as for the single deminer,the obtained 70 per cent is still one measurement. But now it represents thewearing of PPE by the entire team.
An essential difference between a sample and a measurement is thatwhen the data are analysed, it is measurements that are used,
not samples. Except, of course, where the sampleand measurement are the same thing.
Figure 3. Sampling the weather

11
Methodology
Using samples to construct a measurement
Obtaining measurements: sampling froma distribution of actions
The process of sampling involves taking a sample in a systematic wayfrom the available distribution of actions in time, with the aim of representingthe behaviour of each subject under study. Two typical actions of manualdeminers are shown in Figures 4 and 5.
What does it mean to say that actions have a distribution?Although an action is likely to be recorded as a code (e.g. Ma = Marking),
that code is easily transcribed into a number. For convenience and simplicity,the examples below use lists of numbers rather than codes, but codes couldhave been used. Thus the first list could have been something like:
Ma, Ex, CT, Ma, Ma, …(where Ma=1=Marking, Ex=5=Excavation, CT=4=Change Tool)….and so on.
The following list of numbers gives an example of a sequence of actions byone subject (note that these are actions, not samples):
1, 5, 4, 1, 1, 2, 1, 1, 4, 3, 1, 5, 3, 2, 3, 1, 2, 1, 3, 2, 1, 1, 1, 4, 1, 3, 3, 1
Each number is an action, and there is no expectation that each action fillsthe same length of time. For example, Rest (5) usually fills a great deal oftime even though it occurs just twice in the sequence. Whereas Drink (4)occurs 3 times but fills much less time than Rest.
The number “1” is common in the list, and its distribution is random. Ittherefore occurs frequently and unpredictably. If it is a relatively lengthyaction (like Rest), then its representation in the final proportion of total timeshould be more than the 50 per cent implied here. If it is a relatively shortaction (like Drink), then its representation in the final measurement shouldbe less than the 50 per cent implied here.
Figure 4. Manual deminer workingwith metal detector (code e.g. MD)
Figure 5. Manual deminerprodding (code e.g. Pr)

12
Time and Motion Studies for Demining: Snapshots of Operations
The following list contains exactly the same numbers, but in a differentsequence:
1, 5, 1, 4, 1, 2, 1, 4, 1, 3, 1, 5, 1, 3, 1, 2, 1, 3, 1, 2, 1, 3, 2, 1, 4, 3, 1, 3
Here, the number “1” is non-randomly distributed. It occurs frequentlyand predictably.
It takes only a moment of inspection to see the difference in the distributionpatterns. And immediately, a question emerges — would it be interesting tostudy the sequence of actions in a distribution?
Yes, it might be — that will depend on the question being asked. But if thesequence of actions is not part of the research question of interest, then thesampling procedure need only be designed to capture sufficient samples ofeach action in the distribution to create a useful measurement.
The distribution of actions is controlled by the subject, not by theresearcher. A distribution is a necessary consequence of the use of differentactions by the subject through time. If the subject doing the actions is checkedregularly, say once per minute, then that check will hit a regularly definedmoment in the distribution. Here, the data gatherer records whichever actionis being used at the moment that the subject was scanned in order to produceone overall measurement of proportion of time spent doing each action (e.g.the subject spent 60 per cent of time doing “1”). It makes no difference to thescan-sampling procedure what the distribution of actions is (random or non-random), or that some actions fill more time than others.
Obtaining measurements: deciding what to sampleIn the planning and pilot stages of the study, a list of actions to be sampled
will be compiled. The process of defining actions for sampling is controlledby the researcher, and is normally done on a fairly fine scale — in moredetail than will eventually be needed in the analysis. It is impossible to recordeverything, so sampling categories need to be defined. The best way to do sois in relation to the question.
Actions may also be broken into smaller categories, called subsidiaryactions. For example, excavation is a common action of deminers. But whileexcavating, the deminer could use a prodder, a trowel, a mattock, a spade, ora rake. Analysis of the subsidiary components of excavating might well beessential to addressing the main questions of the study.
Thus, the observer records Ex/p (Excavation/prodder) rather than justEx (Excavation).
A subject can do even more than two actions at the same time. When thesubject is doing Ex/p, are they standing? Sitting? Kneeling? Lying? Do youneed to know? Go back to the question — it will help when deciding if it isimportant to record posture.
The requirement to break behaviour up into categories applies to anythingbeing sampled. The subject could be a machine, a dog, a handler, a team, asupervisor or a deminer.
No matter how much planning was done, it is possible for a new action toappear at some point during the study. You can choose to begin sampling it

13
Methodology
from the point in time when it first appears because it has not been availableto sample so far, so has not been missed. It is better not to define a newaction for sampling part way through the study. If that action was previouslyeither not being sampled, or more likely, was being sampled as part of abroader action, then introducing it part-way through will compromise thedata both for the new action and the other action of which it was previouslya part. Identifying such actions is one reason for the pilot study.
Other useful rules:Sample on a finer scale than you think you will need in the analysis.You can always combine the data during analysis, but you cannot breakit up into smaller components. In other words, subsidiary actions, suchas prodding, can always be lumped into major actions, like excavation.If only excavation is recorded, you cannot later look specifically atprodding.Use a logical coding system for naming each action (e.g. a 2-letter code).Work with about 10 major action categories, and no more than 15.Aim to get about 10 times the number of samples as major actioncategories (e.g. with 10 action categories, aim for about 100 samples;with 15 action categories aim for about 150 samples).If some categories have subsidiary actions, apply the same rule of 10 asabove (use up to about 10 subsidiary categories).Record no more than 2 actions at one moment (i.e. one action and onesubsidiary action). Trying to record more often leads to confusion anderrors. Thus recording Ex/p, or Pr/St is ok, but recording Ex/Pr/St(Excavating/Prodding/Standing) is not a good idea.
Obtaining measurements: sampling proceduresActions come in every conceivable form (quick, lengthy, complex, simple,
common, rare, etc). Thus no single procedure is suited to sampling all ofthem. In practice, an observer will often use several different samplingprocedures at the same time, and may even switch between techniques duringthe sampling period. As always, it all depends on the question.
A second consideration is the time required to do the sampling. Ingeneral terms it takes an observer about 10 seconds to take and record asample, and that imposes a limit on the number of samples that can betaken per minute.
What sampling procedures are available?
Time takenRecord start and end time of an action to obtain the time spent doingthat action.Normally used for long actions.If the action is very short, the between-action interval might bemeasured.

14
Time and Motion Studies for Demining: Snapshots of Operations
Delivers total time spent on an action, and the data are easily convertedto proportions or rates.
Example: How frequently does a manual deminer drink water whileworking?
Wait for the deminer to drink, start a stopwatch, and wait for the nextdrink. The time, a sample of the inter-drink interval, is a measurement ofdrinking frequency (e.g. 13 minutes) and can easily be converted to a rate (=4.2 drinks/hour). While the stopwatch is running, the sampler continues withother sampling procedures while keeping an eye on the subject for whominter-drink interval is being measured.
Scan samplingDelivers frequencies of each action, or proportion of time spent doingeach action.
For the above question about drinking, check the deminer for an instanton a regular time cycle, say every minute, and record whether s/he is drinking.At the end of 2 hours there have been 120 checks (= 120 samples). Drinking isa quick action and some drinking events will be missed. But that does notmatter. If the deminer is drinking regularly, then drinking will be the actionon a few of the checks. Using those 120 samples, the analyst calculates onemeasurement which took 2 hours to obtain:
the deminer was drinking on (e.g.) 3 out of 120 checks (2.8 per cent).This measurement can be restated as: the deminer spent 2.8 per cent of
time drinking.This is not the same measurement as the 13-minute inter-drink interval
obtained above, because the measurement is a percentage of time drinking,and is not a frequency or rate of drinking.
The main benefit is that the observer had lots of time left over to gatherother data because one deminer was not continuously watched.
There is lots of sampling time available, so why not scan the entire teamregularly, say every minute, and record the name of any drinking demineron each scan. In other words, why not address the question using all 10deminers at the same time. As above with sampling from one deminer, theproblem is that the action “take a drink” is quick, and some drinking eventswill be missed. But that does not matter because the objective is to measurethe proportion of time drinking, not the total number of drinks taken. Drinkingby the deminers has now been sampled on a short time cycle. Percentage oftime spent drinking can be calculated for each of the 10 deminers rather thanjust one at no cost in observer time. The observer has obtained 10measurements (one for each subject) and there is still time left over to recordother information.
During the scan above, each deminer was checked to see whether or nots/he was drinking. So why not record whatever they were doing — anyaction, not just drinking? Choose (e.g.) 6 general activities of deminers. Recordwhich of these 6 actions each deminer is engaged in on each scan. Oncesampling is finished, the percentage of time spent doing each of 6 actions canbe calculated for each deminer. The data now give a lot more detail about the

15
Methodology
activities of deminers (including drinking, if that was one of the recordedactions). If a 1-minute scan time and 2-hour sampling time were used, thenthe total N is still 10 deminers from which 120 samples were taken (=1,200samples in total). Six measurements were obtained for each deminer (aproportion of time for each action), giving a total of 60 measurements.1
CountIn a defined time period, how many times did an action occur.
Normally used for quick actions and rare actions.Easily converted to rates.
Qualitative descriptionDescribe in words how an action is performed.
Normally used to describe complex actions and rare actions.
Sequence recordNormally used to describe the behavioural sequence in a complex action.
A final commentTime taken and scan sampling are the most frequently used procedures
when building a snapshot. Scan sampling is by far the best method to providea broad picture of the overall proportions of time spent in each action inorder to build a snapshot of behaviour. However, scan sampling gives littleinformation on rare or quick actions (e.g. it might miss them completely),some of which may be important in relation to the research question. Forthese, any of the other procedures might be used.
An exampleA broad descriptive question is being addressed:
“How do deminers use their time while working?”The observer has chosen to use scan sampling of 10 subjects (5 pairs of
manual deminers) throughout an 8-hour working day, on a 2-minute scancycle. Twelve actions have been defined for sampling, two of which havesubsidiary actions. Subjects are working 1 hour on (working) and 1 hour off(resting). Activities during rest time are not interesting and are not sampled,so the observer will sample from 5 deminers on each scan, leaving some timeavailable in each 2-minute cycle to watch for rare or complex activities.
At the end of the day, up to 120 (4 hours worked x 30 scans/hour) scansamples have been obtained for each of the 10 subjects (1,200 samples) andthe proportions of time each subject spent doing the 12 different actions canbe calculated. The rule of obtaining at least 10 times the number of samplesas actions was satisfied.
1. There is one limitation — it will take a little longer for the observer to record the actionof 10 people on every scan (rather than simply recording the name of the occasionaldrinking deminer). An observer who is familiar with the scanning process and hasdeveloped an efficient recording system will normally need about 10 seconds to locate,identify, and record the activity of one deminer. Thus, a scanning cycle of about 2 minuteswill be required for 10 people.

16
Time and Motion Studies for Demining: Snapshots of Operations
Fifteen indications were recorded (count — easily obtained because theobserver could hear the metal detectors). The observer used a corner of thesampling sheet to make a mark each time an indication was heard.
One mine was discovered (count of a rare event), and the observer missed3 scans during the 6 minutes that the mine was being uncovered and marked,preferring to record all details of that process (qualitative description).However, the SOP requires all deminers to stand down during uncoveringof a mine, so their actions during those 3 missed scans were known (Resting,Rs), and therefore were not lost from the data. Productivity loss due tostanding down can be calculated directly from the time taken to deal withthe mine (6 minutes lost by 4 deminers), and there is no need to enter standingdown as a separate activity from Resting in the computer file, although thatdecision is up to the observer.
Management suspects that the deminers are chatting a lot during handover,and requested precise records on how long it was taking. Handover of thelane between pairs of deminers was a predictable event because it occurredon the hour. Each time there was handover, one pair of deminers was chosenand the handover timed precisely using a stopwatch (time taken). At the endof the day, the time taken for 7 handovers had been recorded precisely for 4pairs with accuracy to within 2 seconds.
The supervisor circulated regularly and occasionally talked to a deminer.It has been suggested that this supervisor talks to deminers for much longerthan other supervisors (wasting time?), and the observer was asked to measurehow long these conversations take (time taken). Talking to Supervisor (TS)is also one of the 12 actions being sampled, so the study will return twoseparate measures on this activity (proportion of time talking to supervisor;average length of a conversation with supervisor). The observer recordedthe length of conversations opportunistically: if the supervisor was seenapproaching a deminer, a stopwatch was started (time taken), and theobserver checked the talking pair regularly while continuing to record scansamples. The obtained 17 samples of time spent talking were accurate to within10 seconds. Many conversations were missed (the scan sampling returned TSon 122 scan samples across all the deminers), but that does not matter as thetiming records were opportunistic and are a random sample of thoseconversations.
In this example, the observer used 4 of the 5 listed sampling procedures,and at times was using 2 procedures at the same time (e.g. scan sampling,and stopwatch running during a conversation — time taken). Depending onhow the description of the exposure and marking of the mine was writtendown, it might also be possible to look at the sequence record for that rareevent.
The scan samples do not provide a sequence record. Using scan sampling,only one of the many actions performed by a subject is recorded each 2-minute sampling cycle. A sequence record can only be taken during intensiveobservation of one subject.
Let’s be realistic. This is intensive work. The observer will be exhaustedat the end of the day, and might need to schedule a 5-10 minute break everyhour. Perhaps a small amount of data will be lost during the break, but as

17
Methodology
long as the missed data are not biased in some way (e.g. the handover on thehour is always missed); no problem! After all, you are sampling — you arenot attempting the impossible of recording everything that deminers do.
After sampling is finished for the dayThe observer is not yet finished for the day. Now, the data must be entered
into the computer.There were 240 scan-sampling events, each with a sample from 5 deminers.
That is 240 lines of data, requiring 2 hours of data entry. Separate files willcontain the 17 samples of time spent talking, and 7 samples of time takenduring handover. The qualitative description of exposing the mine must betransferred from the field notes into the log book or diary (which might beanother computer file). The diary itself needs to be updated with a generaldescription of the day’s activities. With backing up data files, the observerhas about 3 hours more work to do, and it must all be done today.
Don’t want to do it today? Any delay raises the chances of errors. Rightnow, the day’s sampling is fresh in your mind. You can still remember detailsthat might be confused in your notes, or where your writing is difficult toread, or where rain smudged the writing. Wait even one day and all thosedetails will be gone — replaced by the details of tomorrow’s sampling.
The question?In practice, it is likely that the question involves making a comparison, for
example between manual deminers working behind a flail and with no flail.Thus, tomorrow, the same data will be gathered from a team working in aminefield that was previously cleared with a flail (or alternatively a differentobserver could have sampled at that other minefield on the same day). Perhapsthe research design required that the same team be used under both conditions(flail, no flail), in which case the sampling must be done on different days.
Or perhaps tomorrow a different metal detector will be used by the sameteam. Or tomorrow this team will receive training on a different procedure,and then on Day 3 you will conduct the same study on them using the newprocedure (a before/after study). Or … and so on. You designed theexperiment, so you will know what to do.
Analysis
Having obtained the data, many different analyses will be possible. Hereare the likely steps:
Where necessary, convert the data from a sample to a measurement.The number of times each action was recorded can be counted for eachdeminer, which allows the proportion or percentage of time spent doingeach of the 12 sampled actions to be calculated (as a proportion of thetotal number of samples taken). In the example above, 12 actions weresampled, so 12 measurements will be produced for each deminer. Therewere two subsidiary actions, for which the proportion might also becalculated.

18
Time and Motion Studies for Demining: Snapshots of Operations
No conversion is needed for the 17 time taken measures of supervisor-deminer conversations, or the 7 time taken measures of handover,although you may want to calculate the average time spent talking byeach deminer with the supervisor.Return to the question. What are the most useful comparisons? Whatare the most useful summaries? You might do all possible analyses inthe interests of completeness, but there is no need to do so.Check the data. Any values that are obviously out of line with theothers may include a mistake. Twelve actions mean 12 codes. If thereare 13 codes then there is an entry error. The 12 proportions calculatedfor each deminer should add up to 100 per cent. Typical mistakes includea misplaced decimal point, entering the wrong code for one subject, ordata entered using different units (e.g. 15 of the 17 time taken measureswere entered as seconds, and 2 were entered as minutes). In practice,the opportunity for error is large, even with careful data entry. Assumethere are errors, and find ways to search for them.Explore the data. For example, plot preliminary graphs. Such graphsare unlikely to be the final figures used in the report, but they allowvisual inspection of the data so that you can see the trends and checkfor errors.Statistical analysis
The technical meanings of “significant”, “variance”, and “P<0.05”are described in Annex 2.Statistical analysis includes summarising the data (such as calculatingmeans), plotting graphs, making visual inspection of trends, andstatistical testing.In the example above, 10 deminers were observed. Thus the samplesize (N) for most analyses will be 10. The variability amongst those10 deminers is one of the most valuable features of the data, andshould not be ignored.Analysis may or may not include use of statistical testing in orderto make comparisons among groups. Whether or not such testingoccurs is likely to depend primarily on the skills of the analyst (whomay not be the observer). In some sets of data, the patterns areobvious and statistical analysis is unnecessary. Statistical testing isall about making comparisons between groups, and it may be thatno such comparisons are planned. Statistical testing is the formalversion of what you have already done (summarise data, plotgraphs, inspect trends).The central point is that by following the principles outlined in thisguide, you have gathered data that support statistical testing,potentially making the results of the study much more convincing.Statistical testing can be used to find trends that are not obviousfrom visual inspection, or to show that apparent differences are notreal. Do not be afraid to consult someone with better statisticalskills than yours. Statisticians love playing with other people’s data!One other point. Politicians might use statistics in misleading ways

19
Methodology
to misrepresent trends or patterns, but statisticians do not. Astatistician will tell you what your results show and what they donot show. No more and no less.
New ideas often emerge as a result of the above process. The studywill both give answers and raise new questions, some of which areinteresting and some are not. It is not possible to measure everything,and having measured certain things in relation to the question, youdiscover something new and interesting that you now wish you hadmeasured. This process is the source of the complaint often heard fromnon-researchers, that “research never gives answers, it only ever leads tomore research”. But that complaint misses the point. Answers wereobtained for the central question of the study. But answers certainlywere not obtained for all possible questions that might have been raised,some of which were only recognised because the study was done.Complaints often heard in the reporting-back workshop are:
“that is not the question that I would have asked…”, or“why did you not ask this other question…”.
Avoiding such comments is what the original planning and workshoppingwas all about! On the other hand, you may genuinely have identified a newand interesting question, and some follow-up work is therefore justifiable.
Reporting
The reporting requirements will depend on the client who has requestedthe study, and the extent to which others want access to your results, or towhich your results have generality.
In principle, any study of this sort should be properly written up, and thereport made widely available. It is only by sharing information that thedemining community will improve the quality and quantity of its product. Ifthe report is available, then they can look at it and decide if it is useful tothem.
The standard structure of a report can be found in the Box on page 20.

20
Time and Motion Studies for Demining: Snapshots of Operations
A standard report will have the following sections
IntroductionThis section explains the context of the study and gives a clearstatement of the question being addressed.Most of this is already written in the original proposal document.The terms of reference might be laid out here.
MethodsHow did you do the study?
ResultsWhat did you find? Describe the results in words, with reference totables or figures. Do not say “the result can be seen in the figure”,which is the same as saying “go figure it out for yourself”.In general, the results section should not include discussion orinterpretation comments.
DiscussionInterpret the results in relation to the question.The discussion is not an opportunity to write for multiple pages aboutanything that seems interesting. It should be kept focused and short.
ConclusionThe key points that arise from the study, usually in dot-point form.
For a larger study, a Summary will normally be provided, usually atthe beginning of the report. An Executive Summary will give key pointsin a half to one page. Busy managers love well-written executivesummaries!
A Recommendations section may be included, normally also at thebeginning of the report.

21
The following examples are taken from real studies done on deminingprogrammes. The full studies can be found in the cited GICHD reports.
Example 1: What do the raw data look like in a snapshotof a demining programme?
Table 1 shows a small portion of the data that were recorded for Standarddrill in the study described in Questions 3 and 4 below. The numbers 1-10 areten 1-minute scan samples. A-H are individual deminers. The 2-3 letter codesare sampled actions; e.g. MD = using Metal Detector, MKG = Marking.
Table 1. Data taken during scan sampling of Standard demining drill,for 8 deminers (A-H)
A B C D E F G H
1 MEC CV MD TS CV TS CV MKG
2 MD CV MD+ TS CV MD CV CV
3 MKG MD MD+ MEV MD+ MEC MEC CV
4 MKG ISP CT CV MKG MKG MKG MD
5 MKG ISX MD+ MD MKG MKG MKG RV
6 MEC CT ISP MD MKG TS CV CV
7 MD ISX ISX MKG TS CV CT CV
8 MD ISD MD CV CV MD+ MKG CT
9 MKG MKG ISD MKG MD+ MD+ TS CV
10 CV MKG MD TS CT PW CV CV
In order to convert these codes to measurements, the count of each codeneeds to be obtained (the computer can do that), and then a proportion will
Example Timeand Motion studies
4

22
Time and Motion Studies for Demining: Snapshots of Operations
be calculated for each code representing the proportion of time spent doingeach action. Percentages of time spent doing each action in Table 1 arecalculated in Table 2.
Note that in this study, 22 actions were sampled, but some lumping ofdata was done across actions, resulting in 15 activities for which proportionof time was calculated. Only some of those activities appear in this subset ofthe data.
Table 2. Calculated proportions (as %) of time spentdoing each of 15 activities during Standard drill for the 8 deminers (A-H)
in Table 1*
Activity A B C D E F G H
TS 0 0 0 30 10 20 10 0
VEG 10 20 0 30 30 10 40 70
MCL 20 0 0 0 0 10 10 0
CT 0 10 10 0 10 0 10 10
MD 30 10 30 20 0 10 0 10
MD+ 0 0 30 0 20 20 0 0
WAT 0 0 0 0 0 10 0 0
ISP 0 10 10 0 0 0 0 0
ISX 0 20 10 0 0 0 0 0
ISD 0 10 10 0 0 0 0 0
PPE 0 0 0 0 0 0 0 0
QA 0 0 0 0 0 0 0 0
MKG 40 20 0 20 30 20 30 10
DP 0 0 0 0 0 0 0 0
RST 0 0 0 0 0 0 0 0
* The many zeros are because of the small data set in Table 1.
Example 2: What is the time taken by dogs to searcha line1?
Most demining dogs are trained to search a line, either on short-lead orlong-lead. In this example, the amount of time taken on the line was measuredusing a stopwatch (“time taken”).
Sampling required records of the start and stop time for dogs at thebeginning and end of a search on a line. For each dog, a variable number ofsamples was obtained and a sample and a measurement are the same thing.Thus, for each dog an average search time could be calculated.
1. This study is reported in GICHD (2005a).

23
Clearly, there is considerable variability among dogs in terms of the timetaken to search a line. However, most dogs used between 15 and 35 seconds.“Dog 21” is a person working with a metal detector, and it is reasonable toconclude that dogs are generally faster than such a person, even without anystatistical analysis. Dog 18 used a different search technique, explaining whyit was slow.
Figure 5 shows the average time taken across all measures for each dog.Thus the figure could have been drawn with the standard error of the meanon each bar.
Figure 5. Time taken to search a line by mine-detection dogs
Do these data need statistical analysis?Without more information, there is probably no point in doing statistical
analysis, because it is not clear from the data alone why it would be interestingto know that there was statistical (or significant) variability among the dogs.However, if a statistical analysis was done, Dogs 18 and 21 would be removedfrom the data before the analysis because they are clearly different. Anyanalysis would then be done on the original raw data from which the meanswere calculated, and not directly on the means shown in the figure.
For statistical analysis, the question would be:“Is there significant variation in time taken to search a line by the dogs?”Note that this is a different question from the broader research question
laid out above. The analysis would be a 1-way analysis of variance.Having reviewed these data, the researcher might now ask why some
dogs are faster than other dogs (Qa). Searching faster might not be a goodthing, as there is a possibility that fast-searching dogs miss mines (Qb). Thesetwo follow-up studies would involve measuring the details of the searchprocedure used by each dog (to address Qa), and setting up tests wheredogs search for mines (to address Qb).
If a second set of data were available which measured dogs’ search timeon a line using a different technique, then a statistical comparison of the twotechniques would almost certainly be desirable and interesting.
Example Time and Motion studies

24
Time and Motion Studies for Demining: Snapshots of Operations
Example 3: How much area is cleared by manualdeminers using three different drills2?
This study involved a comparison of three different demining drills, aStandard drill and two experimental drills (termed Hybrid and Crab). Hybridand Crab drills both involved working a lane, as for Standard drill, but thelane was placed alongside a safe area, allowing the deminer to step out of theworking lane and walk around an indication.
The study was conducted because it was believed that the experimentaldrills would lead to improved efficiency, indicated by increased amount ofland cleared and reduced time spent on activities that slowed the deminerdown.
A total of 16 deminers each worked all three drills for 150 minutes ofworking time in lanes 1 metre wide. The total amount of land cleared wascalculated once the 150 minutes weas completed. Thus here, a sample and ameasurement are the same thing, and one measurement was made for eachdeminer.
Figure 6 shows the average area cleared by all 16 deminers (with the varianceindicated as standard error of the mean). It appears that on average, themost land was cleared using Crab drill, and least land was cleared usingStandard drill.
However, the standard error bars are reasonably large, and it may bethat the differences seen here are not statistically different. In this example, astatistical analysis is essential before any conclusion can be drawn aboutwhether Crab is the fastest drill.
Figure 6. Area of land cleared of mines using three drills.N=16 deminers working for 150 min, and all 16 deminers worked
each drill. Bars are mean + standard error.
2. This study is reported in GICHD (2005b).

25
The statistical analysis showed that Crab was significantly (= statistically)faster than Standard, but Hybrid was not significantly different from eitherof the other two.
More comments about this Figure can be found in Annex 2, where thetechnical concept of statistical significance is explained in more detail.
Example 4: How much time do manual deminers spendchanging tools when using three different demining drills?
This question was addressed as part of the same study described inQuestion 3. But here, it is the behaviour of the deminers that was measured.Thus an extra step is required to convert sampled actions to a measurementof time spent doing each action.
While the deminers worked, a scan sampling procedure was used on a1-minute cycle to record actions of the deminers being observed. Fourdeminers could be observed from one location, and 150 minutes representedhalf a day of work. Thus it took 2 days to complete the data gathering for all16 deminers working each drill, and 6 days in total to record the data for allthree drills.
“Change Tool” involved any switching of tools, such as from metal detectorto prodder, or prodder to trowel. Tools needed to be put down in a safeplace, and retrieving tools sometimes required walking back to the beginningof the lane.
A measurement of time spent Changing Tool was obtained by countingthe number of times CT was recorded in the scan samples (for one deminerdoing one drill) and converting to a proportion (%) by dividing through bythe total of 150 samples obtained.
It appears from Figure 7 that deminers spent about twice as much timeChanging Tools in Standard drill than in the other two drills. However,Hybrid drill may involve even less time spent Changing Tool than Crab drill.The very small standard error bars suggest statistical differences among allthree drills.
The statistical analysis confirmed that all three drills were statisticallydifferent from one another. It is appropriate to conclude that Crab drill is themost efficient in terms of time spent Changing Tool, with time-saving ratiosof about 1.5:1 for Hybrid:Crab, and about 2.5:1 for Standard:Crab.
A demining manager might not be convinced about the difference between8 per cent and 3.5 per cent, and might not understand or accept resultspresented with great fanfare as a “statistically significant difference”. Butthey should be convinced by the ratios in the above paragraph!
Example Time and Motion studies

26
Time and Motion Studies for Demining: Snapshots of Operations
Figure 7. Time spent changing tools as a proportion(as %) of total time worked by 16 deminers, in relation to different
drills.Bars are mean + standard error.
Example 5. Exploring the data using variance3
All of the above examples show counts or means with variances. But it ispossible to go beyond these simple statistical measures to explore the datafurther. In Annex 2, the notion of statistical assessment is described in termsof exploring the relationship between mean and variance.
In the above examples, it was the absolute values of the means (= theheight of the bars) that resulted in the apparent differences in the Figures.The reader can also look at the length of the standard error bars to check thevariance around the mean.
But the relationship between mean and variance can be explored moredirectly, and without the distraction of absolute differences between themeans. This is achieved by calculating (and plotting) the mean:variance ratio.Here are some examples to help with visualising the relationship:
A mean of 4 with a variance of 8 gives a mean:variance ratio of 0.5.A mean of 100 with a variance of 200 gives a mean:variance ratio of 0.5.
In these two examples, the absolute difference between the means (8 versus100) has been eliminated by conversion to the ratio.
A mean of 4 with a variance of 2 gives a mean:variance ratio of 2.A mean of 100 with a variance of 50 gives a mean:variance ratio of 2.
The higher value for these ratios (2) compared to the examples above (0.5)indicates greater consistency in the second two sets of data.
And so on.
3. This study is reported in GICHD (2005a).

27
It is easy to see that the relationship is now entirely relative — absolutevalues have been removed from the result. Now it is possible to explore therelative differences without being distracted by absolute differences betweenthe means.
An example is in Figure 8, which shows the consistency of time spentsearching a line by two different types of dog (short-lead and long-lead).Most of the red bars are higher than most of the blue bars, indicating thatshort-lead dogs (red) are more consistent in their line-search behaviour thanlong-lead dogs.
One long-lead dog (Xgo) was very inconsistent. This male dog was refusingto search some of the time because he was distracted by two females in heat,resulting in the low consistency score. At the time of the study, the deminingagency was already aware of the problem and its cause, but had they notbeen so aware, this graph would have helped them to recognise a problemwith one of their dogs. Knowing there is a problem is the first step towardsfinding a solution.
Figure 8. Mean/variance ratio (calculated as mean/standarddeviation for each search period) for line-search times for dogs.
Height of bar provides a relative index of consistency in search behaviour,with higher bars indicating greater consistency. Long-lead dogs = blue,
Short-lead dogs = red.
Example Time and Motion studies

28
Time and Motion Studies for Demining: Snapshots of Operations

29
There are two levels of value arising from snapshots of deminingoperations.
First, any demining organisation can explore its own operational system,test new ideas, and provide objective assessments of ideas suggestedto improve productivity.Second, the broader community can use a written report of the snapshotto review its own operational systems without having to redo the entirestudy from scratch.
These potential benefits have been underestimated and even ignored bythe demining community, where it is routine for organisations to operate inisolation. More relevant is that much testing is done, but is rarely reported.If the test fails, then it assumed that nobody else will be interested. If the testsucceeds, the skills and time for writing a proper report are often not available.
The reality is that a community of exchange can only benefit all parties.Tests that produced a negative result can be just as valuable as successfultests. Unfortunately, there is a tendency to treat a negative result as a failedtest. But if the test was properly conducted, it did not fail, and it will beinteresting to others.
New ideas are sometimes implemented without proper testing. Worse, isthe possibility that new ideas are not implemented at all because no mechanismis in place for considering them properly.
Time-and-motion studies provide that mechanism. It takes time to do agood T&M study, but the number of people involved is small. The benefits interms of improved efficiency as a result of conducting a convincing analysisare likely to outweigh the costs of the study very quickly.
The GICHD welcomes and encourages requests for advice and support inconducting such studies.
ConcConcConcConcConclusionlusionlusionlusionlusion5

30
Time and Motion Studies for Demining: Snapshots of Operations

31
GICHD (2005a)Mine Detection Dogs: operations, GICHD, Geneva.
GICHD (2005b)A study of manual mine clearance, GICHD, Geneva.
BibliographyBibliographyBibliographyBibliographyBibliography

32
Time and Motion Studies for Demining: Snapshots of Operations

33
There are four general levels of measurement:
1. Nominal: the data consist of names, or labels, and have no order. Forexample, we might want to measure hair colour. You can categorisethe colour of human hair (blond, brown, black, red). A single sampleof hair colour tells you very little, except the hair colour of that oneperson. Many samples are required in order to calculate the proportionof people in a specific population with blond hair, for example. Thequestion “Do you use PPE correctly?” is an example of a nominal level ofmeasurement, because the data fall into the categories “yes” or “no”,and many samples are required to create a measurement. Obtainingmany samples where the data are nominal provides a ratio level ofmeasurement (see below).
2. Ordinal: the data have order, but no information on the intervalbetween measurements is available. For example, in a horse race, thewinner is ranked 1, the second horse, 2, and so on. These numbersgive the order in which the horses finished, but they provide noinformation about, e.g., the time intervals between horses. Ordinaldata would not be used for calculations such as averages. “In a horserace with 10 horses, the average finishing place was 5”, is clearly a meaninglessstatement.
3. Interval: these data have order and equal intervals betweenmeasurements on a scale. However, interval data do not have a truezero. An example of interval data is temperature in Celsius. The zeroin Celsius measurements is arbitrary. It does not mean that there is notemperature, for instance, in the same way that a measurement of 0 cmmeans there is no length. Interval data can be averaged, and subject tomost statistical calculations, but they cannot be expressed as ratios.For example, it is not correct to say that 40ºC is twice as hot as 20ºC.
4. Ratio: this highest level of measurement is the best for statistical use.Measurements have meaningful intervals between them, and have a
Annex 1.
Types of scientific measurement

34
Time and Motion Studies for Demining: Snapshots of Operations
true zero, which means that fractions or ratios can be calculated fromratio data. Examples of ratio level data are: weight, height, length,time (measured in minutes or seconds, not as in time-of-day). A truezero means literally that there is none of the thing present.

35
Reports of statistical results use a technical language that is not generallyfamiliar to those reading reports about demining. Thus a short introductionis provided here.
Statistical tests normally compare two or more groups of data. One groupof data constitutes a set of measurements of a variable (e.g. proportion oftime spent using a metal detector), usually obtained as one measurement persubject. The number of subjects therefore constitutes the sample size (N). Thetest itself involves applying a mathematical formula to the sets ofmeasurements in order to calculate a test statistic — a number whichrepresents the variability found within and between the sets of measurements.
In simple terms, if the test statistic is small, that normally means either orboth of:
the variability within each set of measurements is large, andthe difference between the means is small.
Most people understand a mean (or average), but have more difficultyunderstanding the concept of variability (or variance) around the mean. Table1 gives a simple example using data from a study of manual demining inSudan (the same study as for Questions 2 and 3 above). Two sets ofmeasurements are listed, each giving the proportion of time one deminer(the subject) spent using the metal detector in two drills. Here, the varianceis presented as the standard deviation of the data around the mean. Butvariance can also be calculated in other ways, and is often presented as thestandard error (as in Figures 6 and 7 in the Examples section of the Guide). Forthe purposes of this Annex, the difference between these concepts does notmatter.
The means are only slightly different between the two sets ofmeasurements, but the variances are quite different. The reason is easily seenby reviewing the data. In drill 1 (low variance), the measurements rangefrom 8.7 to 17.3. In drill 2 (high variance) the measurements range from 6.0to 26.7. Just from looking at these data, it is easy to predict that the two setsof measurements will not be statistically different from each other, but thatprediction is not made using the rather similar means — it is made by lookingat the ranges and variances of the sets of measurements.
Annex 2.
Interpreting statistical analyses

36
Time and Motion Studies for Demining: Snapshots of Operations
When reviewing a set of measurements visually, the range is useful. Butstatistical tests do not normally use the range in the data. In simple terms,what they estimate is the relationship between the means and the variances.For example, it is quite possible for two means with the values 12.9 and 15.8to be statistically different — all that is required is that the variances be small(much smaller than in this example). In that case, the ranges of the data wouldalso be much narrower or, put another way, the data would be clusteredmore closely around the mean.
There is no need to understand the mathematics underlying statisticaltests in order to understand the results of a test. The calculations have beensubject to a long history of development and testing and are standardised inmany computer software packages.
The meaning of “significant”It is essential to understand the concept of a difference that is “significant”.
This term has a specific technical meaning, and the notion of a statisticallysignificant difference is central to any statistical conclusion.
In essence, increasing differences between the means, and decreasingvariances around each mean, together imply an increasing likelihood thatthe two sets of measurements are significantly different from each other instatistical terms.
In Table 1, the means of the two sets of measurements were slightlydifferent, but were they different enough to allow a conclusion that thedifference was in some sense real? Statistical testing provides an objectivemechanism for addressing that question.
The hypothesis being tested here is that drills 1 and 2 are somehowresulting in a different use of metal detectors. In other words, there issomething fundamental to drills 1 and 2 that leads to a real (or statisticallysignificant) difference in the way metal detectors are used.
Table 1. Two sets of data for seven subjectswith means and variances (calculated
as standard deviation)
Subject Use MD, Use MD,drill 1 drill 2
A 15.3 21.3
B 17.3 20.7
C 12.7 6.0
D 13.3 10.0
E 8.7 10.0
F 10.0 26.7
G 15.3 21.3
Mean 12.9 15.8
Variance (s.d.) 3.2 8.2
37
Statistical testing uses a standard rule: if P<0.05, then the conclusion shouldbe drawn that there is a statistically significant difference. P is estimatedusing the result of the statistical calculation (the test statistic).
P stands for “Probability”, and the shorthand P<0.05 can be written out inwords as:
the probability of the measured difference being due to chanceis less than 1 in 20 (5%, or 0.05).
A probability of less than 1 in 20 is regarded as unlikely enough to supporta conclusion that something other than chance factors are at work. Thedifference between the sets of measurements is real, i.e. is an effect of thedifferent conditions. The notion of “less than one chance in 20” is a standardrule in statistical analysis, and is seen regularly in scientific presentations.
These days, the computer normally reports an exact probability and thatprobability is then reported as part of the Result, along with the test statistic.Thus a standard statistical report (in this example for a t-test) will be phrasedas:
X was significantly bigger than Y (t = 10.9, P=0.004, Table Z).
An enormous amount of useful information is bound up in this simplesentence. But in essence, it simply says that the difference between X and Ycan be attributed to something other than chance, and it also gives the directionof difference: X is bigger. It is appropriate therefore to appeal to the differentconditions under which X and Y were measured as the likely source (or cause)of that difference. A summary of the data used to make the test can be foundin Table Z. Table Z might alternatively have been a graph.
A t-test is the simplest form of an analysis of variance, because only twosets of measurements are compared (as in Table 1). If more than two sets ofmeasurements are available (i.e. more than two conditions are beingcompared), then a more general test is required: the standard test is analysisof variance (ANOVA). In the Sudan trials, three conditions were compared,so an ANOVA was used to test the data. ANOVA returns an “F” statistic,which is reported along with the result:
There was significant variation among the three conditions,with X being largest and Y smallest (F=7.2, P=0.008).
A P value of 0.008 is lower than the P<0.05 rule, so the appropriateconclusion is that differences among the sets of measurements are due tosomething other than chance, hence the use of the word “significant” in thesentence.
Where three or more conditions are being compared, the analyst maywant to know which pairs of conditions are significantly different from eachother. Say the F test gives a significant result and the means are A:2.4, B:5.8and C:6.3. Just by looking at these means, it seems reasonable to expect thatA and C are significantly different, with B intermediate. B might besignificantly different from A but it is unlikely to be significantly differentfrom C. This is the situation that arose in Figure 6 (Example 3, above). Thestatistical procedure used to assess these pairwise comparisons is called “post-hoc analysis”. In Figure 6, it turned out that A:C was a significant difference,but A:B and B:C were not significantly different.
Annexes

38
Time and Motion Studies for Demining: Snapshots of Operations

Geneva International Centre for Humanitarian Demining7bis, avenue de la PaixP.O. Box 1300CH - 1211 Geneva 1SwitzerlandTel. (41 22) 906 16 60, Fax (41 22) 906 16 90www.gichd.ch
Time and Motion Studies for Demining:Snapshots of Operations