time-frequency mapping of the qrs complex in normal subjects and in postmyocardial infarction...
TRANSCRIPT

Journal of Electrocardiology Vol. 27 No. 1 1994
Time-frequency Mapping of the QRS Complex in Normal Subjects and in Postmyocardial Infarction Patients
Peter Novak , MD,* Zh ix ing Li, P h D , t Vera Novak , MD, PhD,* a n d
Robe r t Hata la , MD, PhD*
Abstract: The effect of myocardial infarction upon the frequency content of the QRS complex was analyzed. Three bipolar signal-averaged surface electrograms, recorded during the early (10-15 days) and late (6 months) chronic phases of myocardial infarction, were analyzed in 61 patients and 11 healthy subjects. All patients were free of ventricular arrhythmia during 6 months of follow-up examinations. Time-frequency analysis of the QRS complex was based on the modified Wigner distribution, which is well suited to examine nonstationary character of data. Standard t ime-domain analysis for the presence of late poten- tials was used for comparison. High-frequency (>-90 Hz) components, separable from the dominant low-frequency components (<90 Hz), were found in all groups. They were present throughout the QRS complex and were peaking in its middle portion. The high-frequency components were found significantly higher in postinfarction patients in both early ( P < .007) and late chronic stage myocardial infarction (P < .05) compared to healthy subjects. Patients who tested positive for late potentials (24%) also had elevated high-frequency compo- nents; however, a comparable increase was also observed in late potential nega- tive patients. Furthermore, the high-frequency component increase occurred in all patients earlier in the QRS than in its terminal 40 ms, where late potentials are traditionally evaluated. It is concluded that high-frequency components are an integral part of the QRS complex under physiologic conditions and persist in variable amount throughout its duration. The high-frequency components are increased in patients after myocardial infarction not associated with ventricular arrhythmia, and their elevation is not limited to the terminal QRS complex. Key words: electrocardiography, myocardial infarction, ventricular activation, time-frequency mapping, Wigner distribution, late ventricular potentials.
Early studies have shown that an altered depolari- zation after myocardial infarction can be manifested
From the *Research Center, H~pital du Sacr~-Coeur de Montreal and Department of Medicine, Universit~ de Montreal, and "]-Institut de G~nie Biomedical, Ecole Polytechnique, Universit~ de Montreal, Montreal, Canada.
Reprint requests: Dr. Peter Novak, the Lady Davis Institute for Medical Research, The Sir M. B. Davis-Jewish General Hospital, McGill University, 3755 Chemin de la C6te-Ste-Catherine, Mon- treal, Quebec, H3T 1E2 Canada.
as an increased number of notches and slurs within the QRS complex. 1-5 In contrast, spectral analysis revealed reduction of high-frequency energy in pa- tients after myocardial infarction. 6-s Standard time- domain analysis is based on the concept of late ven- tricular potentials defined as high-frequency (usually above 25 Hz) low-amplitude potentials at the termi- nal 40 ms of the QRS complex. 9 Late potentials are present in 21% to 44% of patients recovering from an acute myocardial infarction, and this finding is
49

50 Journal of Electrocardiology Vol. 27 No. 1 January 1994
associated with a high risk of sustained ventricular tachycardia. 10, ~ ~ However, since time- domain analy- sis is limited to the terminal QRS complex, late po- tentials may not be detected if the abnormal myocar- dial region is activated earlier during the QRS complex, l°,~x Furthermore, patients with bundle branch blocks are generally excluded from this anal- ysis or modified criteria must be used. 13
Spectral analysis was also used to search for unique frequency features that characterize late ven- tricular potentials 14 and for the analysis of the entire cardiac cycle. 15 However, results of spectral analysis are difficult to reproduce16-1 ~ since the basic require- ment for the signal stationarity is not fulfilled. More advanced techniques, such as spectrotemporal map- ping 2°,21 and, in particular, turbulence analysis, 22 re- duced some undesirable properties of spectral analy- sis. These dynamic techniques were found to be more sensitive than time-domain analysis for the detection of patients prone to the ventricular arrhythmias fol- lowing myocardial infarction.
In this study we have applied time-frequency map- ping based on the modified Wigner distribution 23 for analysis of the QRS complex. Time-frequency map- ping is more suitable for analysis of signals with time- varying spectrum than conventional methods be- cause both time and frequency characteristics of the signal are simultaneously available and conse- quently, the assumption of the signal stationarity is not required. This makes it possible to trace high- frequency components with substantially higher time resolution than the standard Fourier transform or autoregressive models.
We used time-frequency mapping to determine the frequency content of the QRS complex in healthy subjects and in patients with acute and remote myo- cardial infarction. Thus, the aim of this study was to test the hypothesis that abnormal ventricular activa- tion due to uncomplicated myocardial infarction (ie, free of ventricular arrhythmias in the first 6 months) differs in its frequency content from physiologic ven- tricular activation.
Materials and Methods
Concept of Time-frequency Mapping
The ventricular activity can be expressed in a two- dimensional plane where one axis is time and the second is frequency. The summed projection in the time axis is the QRS complex (more precisely, the square of the QRS complex), while the summed pro-
jection in the frequency axis is its spectrum. In other words, a square of the QRS complex at a chosen time instant is equal to the sum of all frequency compo- nents at that time. In mathematical language:
f P(t,f)df = Is(t)[ 2,
f P(t,f)dt = S(f),
where S(f) denotes a spectrum of the signal s(t) and P(t,f) stands for a time-frequency distribution (t = time, f = frequency).
The duality between time and frequency is a basic concept of time-frequency mapping. The advantage of this approach is that it enables more detailed anal- ysis of high-frequency components of the QRS com- plex than standard Fourier methods. In addition, it eliminates the assumption of signal stationarity.
Since only the time projection (eg, the QRS com- plex) is known, the problem is to reconstruct the time-frequency plane from the QRS complex. In 1932 Wigner 24 described a function (Wigner distri- bution) that turned out to be a good candidate for reconstruction of the time-frequency plane from time functions.
However, undesirable properties of the basic defi- nition of the Wigner distribution limited its applica- tions to only simple monocomponent signals. If two or more frequencies are concurrently present in the signal, the Wigner distribution generates spurious peaks called cross-terms. This spurious interference occurs between the signal frequencies. 25 For exam- ple, if there will be frequency components at 5 and 15 Hz, respectively, there will be a spurious peak at 10 Hz. An increasing interest in Wigner analysis follows the report of Martin and Flandrin 26 who showed the effective way of cross-terms suppression. The cross-terms feature cosine amplitude depen- dency, thus they can be reduced by a variety of smoothing methods.
In addition to smoothing, the time-frequency esti- mation can be improved by transforming the electro- cardiographic signal into its analytic form prior to computation of the Wigner distribution. This trans- formation does not affect the frequency content of the electrodardiographic signal, it only removes the redundant negative frequencies. Consequently, the interference between the negative and positive fre- quencies is eliminated. It also increases frequency resolution by a factor of two and reduces error at the DC (0 Hz) level.
Time-frequency mapping comprises the above- mentioned modification of the Wigner distribution, such as analytic transform and smoothing of the Wig-

Frequency Content of the QRS Complex • Novak et al. 51
ner distribution. 23 We experimentally found that a Gaussian function is superior for frequency smooth- ing and the rectangular function for time smoothing. Smoothing decreases both time and frequency reso- lution proportionally to the degree of smoothing. De-
gree of time smoothing is controlled by parameter M, while frequency smoothing is controlled by pa- rameter alpha (Appendix, equation 1).
The relationship between the classical Fourier spectrum and Wigner distribution can be demon-
Fig. 1. Comparisons between the modified Wigner distribu- tion and the Fourier spectrum. The signal with decreasing fre- quency (a) was reversed re- sulting in the signal (b). The signal (c) is the summat ion of signals a and b. The time-fre- quency mapping (d) of the sig- nal c was performed with the following parameters: N = 128, M = 9, q(k) = Gaussian window with alpha = 2.5, h(k) = 1. For the Fourier anal- ysis (e), the 128-point data window was multiplied by the Hanning window and the square of the 128-point fast Fourier transform was taken. The data w indow was then shifted one sample ahead until the spectra from all remaining segments were obtained. Spu- rious peaks at 28 and 50 Hz at a time interval of 8 0 - i 5 0 ms dominate in the Fourier analy- sis (e). There is also an error at the DC level (at 0 Hz). The real frequencies are suppressed and smeared out. Poor est imation of the Fourier spectrum is due to time variat ion of the signal frequency within the data win- dow. The t ime-frequency mapping follows the signal structure well, and the two main frequencies dominate over the Wigner plane (d).
a - -
b ii
0 30 80 90 1 20 1 50 180 210 240
Time (ms)
dIl.
"~ ~ J ~ l l l ~ / ~ : - ~ l l l l l l l l t l l l l l l ~ . , ~ - ~ H I 7~F~d!J~JJJJ/J
~ l l l l l ~ ..,; .~
~p

52 Journal of Electrocardiology Vol. 27 No. 1 January 1994
strated on the time-frequency plane. When the fre- quency components do not change during the ana- lyzing time interval (eg, the signal is stationary), then the Fourier spectrum is equal to the sum of the fre- quency components along the frequency axis (over that time). In this case, the Wigner and Fourier ap- proaches are compatible. Noncompatibility between Wigner distribution and Fourier transform arises in the nonstationary condition. For such signals, the Fourier spectrum is corrupted with substantial por- tions of unpredictable spurious peaks. In Figure 1 the signal with known theoretical spectrum is presented. Two components with increasing/decreasing fre- quencies were mixed together. Thus, at each time instant, there are only two frequencies. Looking at Figure 1, the fast Fourier transform generates a sub- stantial portion of peaks without physical meaning since these peaks do not have counterparts in the signal. They result from breaking the assumption on the signal stationarity. On the other hand, the modi- fied Wigner distribution is much closer to the theo- retical spectrum and real frequencies dominate on the time-frequency plane.
Standard time-domain analysis is defined on a vec- tor summation. For direct comparability with time- frequency mapping, we defined a "vectorized" Wig- ner distribution (Appendix, equation 2) that, similar to vector summation, depends on the contribution of all electrocardiographic leads (X, Y, and Z).
Patients
The study comprises three groups of subjects: 11 healthy subjects with a normal electrocardiogram, no history of cardiovascular disease, and free of any medication; 31 patients with recent myocardial in- farction ( i0 -15 days); and 30 patients with remote myocardial infarction (5-6 months). Left ventricular function was assessed with radionuclide or contrast ventriculography in postmyocardial infarction pa- tients. The myocardial infarction was localized by the standard 12-lead electrocardiogram and/or ventricu- lography. All patients were free of ventricular tachy- cardia up to 6 months following the acute myocardial infarction and did not receive antiarrhythmic medi- cation. Clinical characteristics of the groups are sum- marized in Table 1.
Data Analysis
Three electrocardiographic surface orthogonal bi- polar X, Y, and Z leads were recorded with a PC- based acquisition system (Predictor, Corazonix, OK)
Table 1. C h a r a c t e r i s t i c s o f P a t i e n t s
Group 1 Group 2 Group 3 (Healthy) (Recent MI) (Remote MI)
Number 11 31 30 Sex (M/F) 6/5 24/9 22/8 Age (years) 39 -4- 5.3 61 -+ 2.3 54 __ 2.4 Heart rate (beats/ 75 _+ 7.6 68 + 2.2 63 _+ 2.3
min) MI specification
Anterior - - 11 7 Inferior - - 13 17 Non Q wave - - 9 6
Left ventricular - - 44.6 _+ 2.4 45.6 _+ 2.5 ejection fraction (%)
QRS durat ion 95 -+ 3.2 114.5 _+ 3.7 109.4 _+ 3.8 (ms)
Conduct ion - - 6 6 abnormal i ty
MI = myocardial infarction.
and sampled at 2,000 Hz over a bandwidth of 0.05-1,000 Hz. The X, Y, and Z leads were averaged after passage through a template recognition pro- gram generated from a 3-second display of normal sinus rhythm. All subsequent QRS complexes were tested against the template with a cross-correlating technique. 14 The beats with a correlation coefficient ->.99 were averaged until the final level of noise was below 0.3 ~V. The median number of averaged beats was 215 (range, 82-875 beats).
Numerical computing was performed with 64 bits precision, except for the trigonometric terms, which are computed with 80 bits accuracy. Entirely written in C + + language, the time-frequency mapping sys- tem runs on an IBM-PC compatible computer (pro- cessor 386 or higher).
The DC level, as well as the low-frequency trend (< 10 Hz), were removed by a fourth-order polynom- ial. The detrended signal was converted into its ana- lytic form by the Hilbert transform. 27 The analytic signal was evaluated by the modified Wigner distri- bution with the following parameters: N = 256, q(k) = Gaussian, window 2s with alpha = 2.9, h(p) = 1, M = 12. Thus, the spectral estimator was computed for every 0.5-ms time instant with a frequency reso- lution of 3.9 Hz. The computational details can be found in our previous paper. 23 Then the vectorized Wigner distribution was computed according to equation 2 in the Appendix.
Low-frequency components were identified as local maxima of the Wigner distribution in the band <90 Hz, while high-frequency components were identified as local maxima in the band ->90 Hz. The level of spectral noise was computed by averaging the frequency content over the band 500-999 Hz. High-frequency components were quantified by the high-frequency index defined by peak power of high-

uV 40.00
20.00
0,00 0
A
58
6O 120
152
180 240 300 ms
Frequency Content of the QRS Complex • Novak et al. 53
2 0 5 0 1 O 0 1 5 0 2 0 0
B F r e q u e n c y ( H z )
O
. . . a m , - •
Fig. 2. Time-domain plots (A) and the smoothed Wigner distribution (B,C) of the signal-averaged electrocardiogram of a healthy 47-year-old subject. For the time-domain plots, the signal in the last 40 ms of the QRS complex is highlighted. Note absence of late potentials in the time-domain plots (QRS duration = 94 ms, RMS = 18.29 p,V, LAS40 = 37.5 ms). For the Wigner distribution, low-frequency components dominate in the 2 0 - 6 0 Hz band. High-frequency components are present in the 8 0 - 1 6 0 Hz band throughout the QRS complex. RMS = root-mean-square voltage of the signal in the last 40 ms; LAS40 = duration of the low-amplitude signal -<40 p,V.

54 Journal of Electrocardiology Vol. 27 No. 1 January 1994
uV
40.00 I
20.00
0 .00 '
60 120 180 240 300 A ~s
A
0 5 0 1 O 0 1 5 0 2 0 0 B F r e q u e n c y ( H z )
O
• ? . . ~ ~ . , c ~ ' ~ "~
Fig. 3. Time-domain plots (A) and the smoothed Wigner distribution (B,C) of the signal-averaged electrocardiogram from a 44-year-old patient 2 weeks after inferior myocardial infarction. Time-domain analysis for the presence of late potentials was negative (QRS duration -- 98.5 ms, RMS = 78.73 /~V, LAS40 -- 23.5 ms): The smoothed Wigner distribution reveals clearly discernible high-frequency components in the 125-180 Hz band. (B) The heavy line designates the peaks of high- frequency components. Abbreviations as in Figure 2.
25000
20000
~ 15000
10000
I
5OOO
0
C o n t r o l R e c e n t MI R e m o t e MI n=11 n=31 n=30
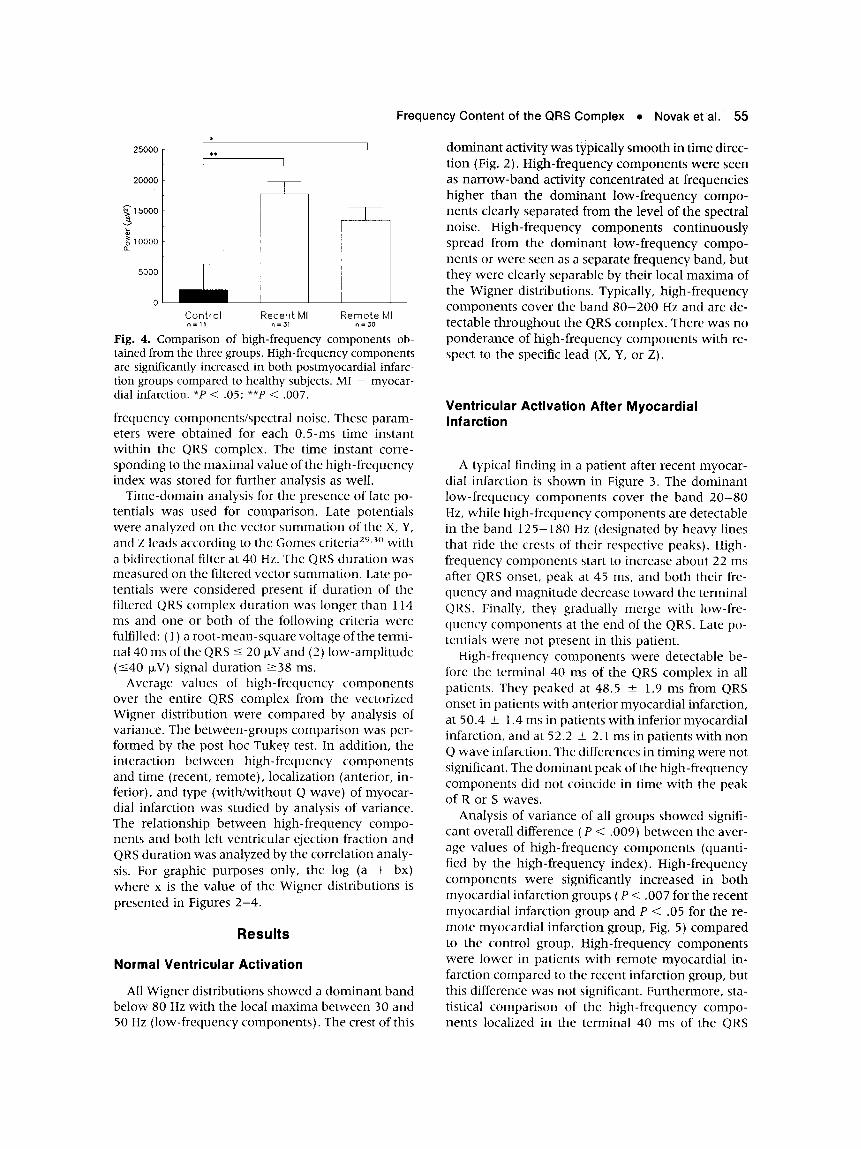
Fig. 4. Comparison of high-frequency components ob- tained from the three groups. High-frequency components are significantly increased in both postmyocardiat infarc- tion groups compared to healthy subjects. MI - myocar- dial infarction. *P < .05; **P < .007.
frequency components/spectral noise. These param- eters were obtained for each 0.5-ms time instant within the QRS complex. The time instant corre- sponding to the maximal value of the high-frequency index was stored for further analysis as well.
Time-domain analysis for the presence of late po- tentials was used for comparison. Late potentials were analyzed on the vector summat ion of the X, Y, and Z leads according to the Gomes criteria 2'~.3° with a bidirectional filter at 40 Hz. The QRS duration was measured on the filtered vector summation. Late po- tentials were considered present if duration of the filtered QRS complex duration was longer than 114 ms and one or both of the following criteria were fulfilled: ( 1 ) a root -mean-square voltage of the termi- nal 40 ms of the QRS < 20 ~V and (2) low-ampli tude (-<40 ~V) signal duration ->38 ms.
Average values of high-frequency components over the entire QRS complex from the vectorized Wigner distribution were compared by analysis of variance. The between-groups comparison was per- formed by the post hoc Tukey test. In addition, the interaction between high-frequency components and time (recent, remote), localization (anterior, in- ferior), and type (with/without Q wave) of myocar- dial infarction was studied by analysis of variance. The relationship between high-frequency compo- nents and both left ventricular ejection fraction and QRS duration was analyzed by the correlation analy- sis. For graphic purposes only, the log (a + bx) where x is the value of the Wigner distributions is presented in Figures 2 -4 .
Results
Normal Ventricular Activation
All Wigner distributions showed a dominant band below 80 Hz with the local max ima between 30 and 50 Hz (low-frequency components) . The crest of this
Frequency Content of the QRS Complex • Novak et al.' 55
dominan t activity was typically smooth in t ime direc- tion (Fig. 2). High-frequency components were seen as na r row-band activity concentrated at frequencies higher than the dominant low-frequency compo- nents clearly separated f rom the level of the spectral noise. High-frequency components continuously spread f rom the dominant low-frequency compo- nents or were seen as a separate frequency band, but they were clearly separable by their local max ima of the Wigner distributions. Typically, high-frequency components cover the band 8 0 - 2 0 0 Hz and are de- tectable throughout the QRS complex. There was no ponderance of high-frequency components with re- spect to the specific lead (X, Y, or Z).
Ventricular Activation After Myocardial Infarction
A typical finding in a patient after recent myocar- dial infarction is shown in Figure 3. The dominant low-frequency components cover the band 2 0 - 8 0 Hz, while high-frequency components are detectable in the band 125-180 Hz (designated by heavy lines that ride the crests of their respective peaks). High- frequency components start to increase about 22 ms after QRS onset, peak at 45 ms, and both their fre- quency and magni tude decrease toward the terminal QRS. Finally, they gradually merge with low-fre- quency components at the end of the QRS. Late po- tentials were not present in this patient.
High-frequency components were detectable be- fore the terminal 40 ms of the QRS complex in all patients. They peaked at 48.5 _+ 1.9 ms from QRS onset in patients with anterior myocardial infarction, at 50.4 +_ 1.4 ms in patients with inferior myocardial infarction, and at 52.2 +_ 2.1 ms in patients with non Q wave infarction. The differences in timing were not significant. The dominant peak of the high-frequency components did not coincide in t ime with the peak of R or S waves.
Analysis of variance of all groups showed signifi- cant overall difference (P < .009) be tween the aver- age values of high-frequency components (quanti- fied by the high-frequency index). High-frequency components were significantly increased in both myocardial infarction groups ( P < .007 for the recent myocardial infarction group and P < .05 for the re- mote myocardial infarction group, Fig. 5) compared to the control group. High-frequency components were lower in patients with remote myocardial in- farction compared to the recent infarction group, but this difference was not significant. Furthermore, sta- tistical compar ison of the high-frequency compo- nents localized in the terminal 40 ms of the QRS

56 Journal of Electrocardiology Vol. 27 No. 1 January 1994
uV 40.00
20.00
0.00 0
A
vl
186
-,,,-I m . ==i
A ==i
60 120 180 240 300
ms
- g
0
C
0 5 0 1 O 0 1 5 0 2 0 0 B F r e q u e n c y ( H z )
Fig. 5. Time-domain plots (A) and the smoothed Wigner distribution (B,C) of the signal-averaged electrocardiogram from a 49-year-old patient 2 weeks after anterior myocardial infarction. Time-domain plots reveal late potentials at the terminal QRS (QRS duration = 121 ms, RMS = 17.83 p~V, LAS40 = 44 ms). For the smoothed Wigner distribution, high-frequency components are increased at the second half of the QRS complex. (B) The heavy line designates the peaks of high-frequency components. (C) A time instant corresponding to the terminal 40 ms of the QRS complex is designated by a heavy line on the back-forward oblique projection. Only part of the high-frequency components manifest as late potentials. Remarkable increasing of high-frequency components, however, is seen 62 ms before the QRS offset. Abbreviations as in Figure 2.

Frequency Content of the QRS Complex • Novaket al. 57
complex did not show any significant difference be- tween the three study groups (P < .05).
Interactions between other factors were not signifi- cant. High-frequency components were independent of both QRS duration (r = .23) and left ventricular ejection fraction ( r = - . 0 2 ) . Late potentials, accord- ing to the above-described t ime-domain criteria, were identified in 16 myocardial infarction patients (9 patients with recent infarction and 7 with remote infarction). These patients had an increase of high- frequency components at the terminal QRS complex, but the high-frequency components peaked before the terminal 40 ms. Furthermore, none of our pa- tients had high-frequency components localized ex- clusively at the terminal 40 ms of the QRS. An exam- ple of a patient with late potentials detected by time- domain analysis and increased high-frequency com- ponents in the terminal QRS is shown in Figure 4. Here, low-frequency components are concentrated in the 10-80 Hz range. Further increase of frequency content above 80 Hz is observed in the second half of the QRS. High-frequency components spread from the dominant low-frequency components and are discernible from 68 ms of the QRS and later. These high-frequency components cover the 8 0 - 2 0 0 Hz band with local maxima at 105 Hz.
Discussion
Applications of Fourier analysis were expected to improve the detection of abnormal activation pat- terns. However, the implicit assumption of the signal stationarity is in contrast with real situations and this discrepancy could explain the controversial reports that use Fourier-based analysis. An elegant way to reduce the requirement on the signal stationarity is to compute the successive spectra over shorter seg- ments (spectrotemporal mapping) using the fast Fourier transform algorithm 2° or autoregressive model, xl These techniques showed that high-fre- quency components of the terminal QRS complex could be present in both patients with and without ventricular tachycardia. Kelen et al. 22 further ex- tended the concept of spectrotemporal mapping to- wards the whole QRS complex. They also improved the spectral estimation by computing the Fourier spectrum of differences between successive samples ("turbulence analysis"), thus further reducing a re- quirement on the stationarity. Turbulence analysis achieved higher accuracy than late-potential analysis (94% vs 73%) for the prediction of patients with in- ducible sustained monomorphic ventricular tachy- cardia.
These methods, however, do not solve the main
limitation of Fourier-based analysis (eg, the assump- tion of the signal stationarity). The Fourier transform generates spurious peaks even for very short seg- ments if the frequency content within this data seg- ment changes. Furthermore, the resulting frequency resolution for such short segments is very low.
The purpose of this study was to overcome these limitations by means of a more adequate signal pro- cessing method. It focuses on the t ime-frequency characteristics of ventricular activation in normal subjects and in postmyocardial infarction patients without ventricular arrhythmia. It uses a novel signal processing approach, already successfully applied for the analysis of heart rate, blood pressure, and respira- tory rhythms 23 in delineation of the respiratory drive upon the cardiovascular system 31 and in the detec- tion of patients prone to the neurally mediated syn- cope. 3x Our method is based on the modified Wigner distribution and we suggest for it, in accordance with its original description, 23 the term time-frequency mapping. This should at the same time stress the dif- ferences between our method and Fourier analysis. The main implications of our study are: (1) high- frequency components of the QRS complex can be reliably detected and traced in time by means of time- frequency mapping; (2) high-frequency components are present throughout normal ventricular activa- tion; (3) these components are increased in patients after myocardial infarction not associated with ven- tricular arrhythmia, and the elevation of high-fre- quency components is not limited to the terminal QRS complex; and (4) the results of t ime-frequency mapping are not influenced by QRS duration, and thus patients with conduction defects do not have to be a priori excluded.
Considering the possibility that high-frequency components are due to spurious interference, it is well known that the interference occurs between sig- nal frequencies. Therefore, this mechanism would suggest the presence of spurious peaks in the range of 60 to 80 Hz (eg, between high- and low-frequency components) , but it cannot explain the presence of high-frequency components.
High-frequency components are lead-dependent, but their spatial distribution on the body surface (X, Y, or Z leads) did not correlate with the site of the infarction (anterior vs inferior). Whether this is due to a certain overlap of regions viewed by each lead and, thus, might be eliminable by more specific sur- face mapping lead arrays remains to be established.
Late potentials were present in 24% of the patients with myocardial infarction; these patients did not have malignant ventricular arrhythmias and/or sud- den death during a 6-month follow-up period. No late potentials were detected in the control group.

58 Journal of Electrocardiology Vol. 27 No. 1 January 1994
However, even in patients with late potentials, a sub- stantial portion of the high-frequency components was detectable before the terminal 40 ms of the QRS complex (ie, the QRS complex portion where, by definition, late potentials are detected). Thus, time- frequency mapping indicates that late potentials are only "the tip of the iceberg" of high-frequency com- ponents, but substantial portions of high-frequency components could be localized before the terminal 40 ms of the QRS complex.
The source(s) of the high-frequency components detected on the body surface both in healthy and myocardial infarction patients remains to be clarified. They might originate from the intramyocardial cell- to-cell conduction during the tangential activation wave spread mainly in subepicardial myocardial lay- ers. The anisotropy of this conductive medium, fur- ther increased in infarcted muscle, might be a crucial factor in generating high-frequency signals. Bolick et al. 33 have shown that all myocardial infarctions comprise different amounts of patchy zones and that their border zones are characterized by a mixture of healthy fibers and interdigitizing connective tissue, that is, the highly anisotropic structures generally be- lieved to be the arrhythmogenic substrate. 3a If this substrate functions as a "generator" of high frequen- cies during its activation, then, accordingly, these fre- quencies should be detectable during the QRS com- plex in all myocardial infarction patients. This concept does not contradict our findings of detectable high-frequency components during the QRS com- plex in normal subjects. As pointed out in the classic papers of Spach et al., 35,36 even normal myocardium shows a certain degree of both morphologic and functional anistropy and, thus, could be the source of high-frequency components. Our results, suggesting discernible high-frequency components during QRS in normal subjects and their increase in myocardial infarction patients, could represent the frequency counterpart of the above-mentioned findings. Fur- thermore, they are fully compatible with the original morphologic studies of the QRS complex, suggesting a variable proportion of high-frequency components ("notches and slurs") increasing in postmyocardial infarction patients. ~-5 Interestingly enough, to our knowledge none of the previously published studies have demonstrated the expected elevation of high- frequency components in patients with myocardial infarction not associated with ventricular ar- rhythmias.
Study Limitation
Obviously, this pilot study comprises only a limited number of patients, and much larger groups have to
be analyzed to get well-defined normality criteria. The increased high-frequency components possibly reflect the extent of the myocardial damage following an infarction. Therefore, a reliable detection of ab- normal high-frequency components is highly desir- able and might have important clinical impact. The proposed method seems to be a further step in the search for an ideal tool. This concept remains to be studied further in myocardial infarction patients with malignant arrhythmias, who must be compared to their arrhythmia-free counterparts.
Acknowledgments
The authors thank Ilias Iakovidis, PhD, for methodo- logic suggestions, and Mrs. Nicole Poitras for techni- cal assistance.
References
1. Langner PH, Geselowitz DB, Mansure FT: High-fre- quency components in the electrocardiograms of nor- mal subjects and of patients with coronary artery dis- ease. Am Heart J 62:746, 1961
2. Boyle B, Carson P, Hamer J: High frequency electro- cardiography in ischemic heart disease. Br Heart J 28: 539, 1966
3. Reynolds EW, Muller BD, Anderson G J, Muller BT: High-frequency components in the electrocardiogram: a comparative study of normals and patients with myocardial disease. Circulation 35:195, 1967
4. Flowers NC, Horan LG, Thomas JR, Tolleson W J: The anatomic basis for high-frequency components in the electrocardiogram. Circulation 39:531, 1969
5. Flowers NC, Horan LG: Diagnostic import of QRS notching in high-frequency electrocardiograms of liv- ing subjects with heart diseases. Circulation 44:605, 1971
6. Goldberger AL, Bhargava V, Froelicher Vet al: Effect of myocardial infarction on the peak amplitude of high frequency QRS potentials. J Electrocardiol 13:367, 1980
7. Goldberger AL, Bhargava V, Froelicher V, Covell J: Effect of myocardial infarction in high-frequency QRS potentials. Circulation 64:34, 1981
8. Bhargava V, Goldberger A: Myocardial infarction di- minishes both low and high frequency QRS potentials: power spectrum analysis of lead II. J Electrocardiol 14:57, 1981
9. Simson MB: Use of signals in the terminal QRS com- plex to identify patients with ventricular tachycardia after myocardial infarction. Circulation 64:235, 1981
10. Breithardt G, Borggrefe M: Pathophysiological mecha- nisms and clinical significance of ventricular late po- tentials. Eur Heart J 7:364, 1986

Frequency Content of the QRS Complex • Novak et al. 59
11. Gomes JA, Winters SL, Stewart D et al: A new nonin- vasive index to predict sustained ventricular tachycar- dia and sudden death in the first year after myocardial infarction: based on signal-averaged electrocardi- ogram, radionuclide ejection fraction and Holter mon- itoring. J Am Coil Cardiol 10:349, 1987
12. Kienzle MG, Falcone RA, Simson MB: Alterations in the initial portion of the signal-averaged QRS complex in acute myocardial infarction with ventricular tachy- cardia. Am J Cardiol 6I:99, 1988
13. Fontaine JM, Rao R, Henkin R et al: Study of the influence of left bundle branch block on the signal- averaged electrocardiogram: a qualitative and quanti- tative analysis. Am Heart J 121:494, 1991
14. Cain ME, Ambos HD, Witkowski FX, Sobel BE: Fast- Fourier transform analysis of signal-averaged electro- cardiograms for identification of patients prone to sus- tained ventricular tachycardia. Circulation 69:71i, 1984
15. Cain ME, Ambos D, Markham Je t al: Diagnostic im- plications of spectral and temporal analysis of the en- tire cardiac cycle in patients with ventricular tachycar- dia. Circulation 83:1637, 1991
16. Kelen G, Henkin R, Fontaine JM, E1-Sherif N: Effects of analyzed signal duration and phase on the results of fast Fourier transform analysis of the surface electro- cardiogram in subjects with and without late poten- tials. Am J Cardiol 60:1282, 1987
17. Worley SJ, Mark DB, Smith WM et al: Comparison of time domain and frequency domain variables from the signal-averaged electrocardiogram: a multivariate analysis. J Am Coll Cardiol 11 : 1041, 1988
18. Machac J, Weiss A, Winters SL et al: A comparative study of frequency domain and time domain analysis of signal-averaged electrocardiograms in patients with ventricular tachycardia. J Am Coll Cardiol 11:284, 1988
19. Malik M, Kulakowski P, Poloniecki Je t al: Frequency versus time domain analysis of signal-averaged elec- trocardiogram. I. Reproducibility of the results. J Am Coil Cardiol 20:127, 1992
20. Haberl R, Jilge G, Steinbeck G: Spectral mapping of the electrocardiogram with Fourier transform or iden- tification of patients with sustained ventricular tachy- cardia and coronary artery disease. Eur Heart J 10: 316, 1989
21. Haberl R, Schels H, Steingigler Pe t al: Top-resolution frequency analysis of electrocardiogram with adaptive frequency determination: Identification of late poten- tials in patients with coronary artery disease. Circula- tion 82:1183, 1990
22. Kelen G J, Henkin R, Starr A et al: Spectral turbulence analysis of the signal-averaged electrocardiogram and its predictive accuracy for inducible sustained mono- morphic ventricular tachycardia. Am J Cardiol 67: 965, 1991
23. Novak P, Novak V: Time-frequency mapping of the heart rate, blood pressure and respiratory signals. Med Biol Eng Comput 31:103, 1993
24. Wigner EP: On the quantum correction for thermody- namic equilibrium. Physiol Rev 40:749, 1932
25. Claasen TACM, Mecklenbrauker WFG: The Wigner
distribution: a tool for time frequency signal analysis. Phi!ips J Res 35:217, 276, 372, 1980
26. Martin W, Flandrin P: Wigner-Ville spectral analysis of nonstationary processes. IEEE ASSP 33:1461, 1985
27. Oppenheim AV, Schafer RW: Digital signal process- ing. Prentice-Hall, Englewood Cliffs, N J, 1975
28. Harris F J: On the use of windows for harmonic analy- sis with the discrete Fourier transform. Proc IEEE 66: 51, 1978
29. Gomes JA, Winters SL, Martinson M e t al: The prog- nostic significance of quantitative signal-averaged variables relative to clinical variables, sites of myocar- dial infarction, ejection fraction and ventricular pre- mature beats: a prospective study. J Am Coll Cardiol 13:377, 1989
30. Breithardt G, Cain ME, E1-Sherif N e t al: Standards for analysis of ventricular late potentials using high- resolution or signal-averaged electrocardiography: a statement by a task force committee of the European Society of Cardiology, the American Heart Associa- tion, and the American College of Cardiology. J Am Coll Cardiol 17:999, 1991
31. Novak V, Novak P, deChamplain Je t al: Influence of respiration on heart rate and blood pressure fluctua- tions. J Appl Physiol 74:617, 1993
32. Lepicovska V, Novak P, Nadeau R. Time-frequency dynamics in neurally mediated syncope. Clin Auton Res 2:317, 1992
33. Bolick DR, Hackel DB, Reimer KA, Ideker RE: Quanti- tative analysis of myocardial infarct structure in pa- tients with ventricular tachycardia. Circulation 74: 1266, 1986
24. Simson MB, Untereker WJ, Spielman SR et al: Rela- tion between late potentials of the body surface and directly recorded fragmented electrograms in patients with ventricular tachycardia. Am J Cardiol 51:105, 1983
35. Spach MS, Miller WT, Geselowitz DB et al: The dis- continuous nature of propagation in normal canine cardiac muscle: evidence for recurrent discontinuities of intracellular resistance that affect the membrane current. Circ Res 48:39, 1981
36. Spach MS, Kootsey M J: The nature of electrical propa- gation in cardiac muscle. Am J Physiol 244:H3, 1983
Appendix
Signal Processing Background
Time- f requency m a p p i n g 23 based o n the Wigne r
d is t r ibut ion 24 gives a s i m u l t a n e o u s t ime- f requency represen ta t ion of the signal.
The cross Wigne r d i s t r ibu t ion of two analyt ic sig- nals, f and g, modif ied by t ime a nd f requency smoo t h i ng is g iven by:

60 Journal of Electrocardiology Vol. 27 No. 1 January 1994
= ]q(k)2[ WDfg (n,m) N k=o
[%' (1) × h(p) f(n + p + k) g
L p = M + 1
] - - 2 i ~ k m
*(n + p - k ) | e ~ , J
where n denotes the discrete time and m the fre- quency. The function q(k) of the length N applies for frequency smoothing, while h(p) of the length 2M-1 applies for time smoothing. The auto Wigner distribution is computed with f = g. If the Wigner distribution is computed from real signals, then the frequency resolution reduces to a factor of two.
The Wigner distribution is compatible with the t ime-domain signal and this allows definition of the vectorized WDxyz as follows:
(2) WDxyz (m,n) =
x/WD~ (m,n) + WD 2 (m,n) + WD2z (m,n),
where WDx(m,n), WDf(m,n) , and WDz(m,n) desig- nate the Wigner distribution obtained from the X,Y, and Z leads, respectively. If V stands for the vector summation (V = ~v/(X 2 + y2 + Z 2), it can be shown that WDxyz(m,n) and WDv(m,n) are mathematically equivalent, for example, by using the relation 6 in Martin and Flandrin. 26 The Wigner distribution can also be directly computed from the vector summation V. It is preferable to compute the WDxyz according to equation 2, al though this requires even more com- puter power. The Wigner distribution is computed on the data with removed DC level and low-frequency trend. Practically, these operations on the vector summation are numerically less stable than those on separate leads. The WDxyz enables direct comparison to the results of t ime-domain analysis of the vector summation XYZ.